
Nonlinear Numerical Assessment of Exterior Beam-Column Connections with Low-Strength Concrete


1
Department of Structural Engineering, Mansoura University, Mansoura 35516, Egypt
2
Department of Public Works Engineering, Mansoura University, Mansoura 35516, Egypt
3
Department of Civil and Environmental Engineering, Incheon National University, Incheon 22012, Korea
4
Department of Civil Engineering, Misr Higher Institute for Engineering and Technology, Mansoura 35516, Egypt
*
Author to whom correspondence should be addressed.
Buildings 2021, 11(11), 562; https://doi.org/10.3390/buildings11110562
Submission received: 1 November 2021
/
Revised: 9 November 2021
/
Accepted: 17 November 2021
/
Published: 21 November 2021
(This article belongs to the Section Building Energy, Physics, Environment, and Systems)
Abstract
:The ductility and capacity of reinforced concrete beam-column connections depend mainly on the concrete’s strength and the provided reinforcements. This study investigates numerically the role of low-strength concrete in beam-column joints utilizing ABAQUS software. In this simulation, a newly developed stress-inelastic strain relationship for both confined and unconfined low-strength concrete is used. This study recommended a specific value of the concrete dilation angle for both substandard and standard joints. Also, stirrups’ yield strength value was found to play an insignificant role in improving the shear resistance of such joints with low-strength. In addition, the joint shear strength prediction using empirical models that implicitly consider the stirrups contribution in improving joint resistance was found to be better than the prediction of other models that explicitly consider the stirrups’ presence. The numerical results also showed that the use of a diagonal steel haunch as a joint retrofitting technique significantly increases the joint shear capacity and changes its brittle shear failure into a ductile beam flexural failure.
1. Introduction
Many catastrophic collapses of reinforced concrete (RC) buildings have been recorded in different corners of the world (as reported by Adam et al.) [1]. These collapses are attributed to one or more of these reasons: earthquakes, wind, construction with low-strength materials, design error, overloading, and terroristic attack. Figure 1 presents the beam-column connection failure and slab-column connection failure in some buildings due to different actions. These triggering factors have a direct effect on the building ground columns and consequently can destroy one or more of them. If a column in the ground floor collapses, different scenarios can take place; extra damage may be limited and controlled and the building partial collapse is the case as presented in Figure 2a. On the other side, the damage can spread till the total collapse is reached as in Figure 2b. This can be attributed to building robustness, as this plays an important role and controls which collapse scenario will take place [2].
The RC frame is an effective and commonly used system in RC buildings for resisting both vertical and horizontal load effects. Beam-column joints are important chains in transferring and resisting different buildings’ loads. The shear stresses developed inside the joints for equilibrium are found to be the main governing aspect, as illustrated in Figure 3a. In the literature, different models based on empirical or analytical assumptions were established to predict the shear resistance of beam-column joints [4,5,6,7]. In unreinforced joint, the main shear resisting mechanism is the concrete diagonal strut, as shown in Figure 3b,c which illustrate the additional resistance that can be added by the truss mechanism to the joint shear capacity. Most of the recorded collapses in different structures were a result of the poor quality of the used concrete. Concrete joints with such improper properties can accelerate the whole building collapse process, especially if bad construction practices are present [1].
Nonlinear finite element solvers existing in different softwares are used for modeling RC joints. ANSYS and ABAQUS packages were used effectively for simulating RC joints with different configurations. Orton et al. [8] and Basem et al. [9] recommended the relevant detailing of different joints and affirmed the ultimate importance of the joints in determining the RC frame resistance to different loading scenarios. Shin and LaFave [10] proved the inrigidity of the joint location and attributed the overall frame behavior to its local deformations. In the same way, Kai et al. [11] and Yap et al. [12] studied the outcomes of using ACI 318-14 [13] recommended reinforcement detailing for both interior and exterior joints. They recorded an increase of 50 and 9.7% in their ultimate resistance, respectively. With ABAQUS, Peng and Wang [14] and Danesh et al. [15] evaluated joints under the action of monotonic horizontal loading, and some discrepancies were found at earlier loading stages due to the differences between the test boundary conditions and the numerical assumptions.
Different key parameters govern joint resistance. Concrete compressive strength () is the main governing parameter in determining the unreinforced joint shear resistance as the developed diagonal compressive strut is carried alone by the concrete [7]. AJI [16] and ACI 318-14 [13] codes considered the influence of concrete strength by proposing relations linking the joint shear resistance to) with different exponent. Many researchers [4,5,6] stated that the unreinforced joints shear strength is directly related to the () up to a specific upper limit. Also, they observed that joints with smaller () strengths require less confinement and developed their maximum resistance at smaller strains compared to those with higher concrete compressive strengths. There have been many studies on joints reinforcement effects and relatively little attention has been paid to the joints with low-concrete strength. Unreinforced joints with lower-strength concrete are more sensitive and fragile to different extreme loading conditions. Many researchers made some modifications to both analytical and empirical equations for predicting the resistance of joints with high-strength concrete. To the authors’ knowledge, there are no similar modifications when dealing with joints with low-strength concrete.
To achieve a safe and robust joint’s design, the strong column weak principle should be satisfied by implementing international codes [13,16] and general provisions. In exterior beam-column joints, due to the beams’ discontinuity, the beam bars should be anchored properly and the tensile force at the column face must be developed by bond providing a sufficient embedded length inside the joint. The anchorage capacity of the bar is a function of several parameters including the geometry of the bend, the size of concrete cover over the anchored bar, the restraint or confinement offered by column reinforcement, longitudinal bars and ties, and the quality of the concrete. Catastrophic building damage can take place at exterior joints if insufficient anchorage is provided as noticed in Figure 2a. The failure starts when plastic hinges were formed at the joint’s location without reaching the full capacity of the connected beams and columns elements. Many efforts were focused on unreinforced joints for moving these plastic hinges away from the joints’ location by using FRP, prestressed metal strips, or diagonal steel haunches [17]. The first two strengthening alternatives, FRP or prestressed metal strips, have a greater effect on the lateral beams, floor slab, and its ceiling than the diagonal haunches. Also, Khan et al. [17] observed some debonding problems in the case of retrofitting joints with FRP.
This numerical study aims to assess the behavior of exterior beam-column connections with low-strength concrete. The numerical simulation results are verified and validated utilizing the experimental findings of Cumhur et al. [18] as a reference case study. A suitable concrete material model available in ABAQUS software was used in this work to utilize its flexibility to define newly developed relationships for predicting the mechanical properties of such weak concretes similar to those used in selected reference joints. Additionally, some key parameters of the used concrete material model which have some uncertainties in their relevant values for the considered reference joints were examined. Then the accuracy of the numerical model results was assessed compared to some analytical/empirical models [4,5,6,7]. This study ends with the assessment of the usage of the diagonal steel haunch as a strengthening option for deficient beam-column joints.
2. Details of Reference Joints
The numerical models of three exterior beam to column connections were validated compared to the experimental study carried out by Cumhur et al. [18]. The three exterior joints (named J1, J2, and J4) are the J1 as a standard joint, the J2 a sub-standard joint with the lack of joint stirrups, and the J4 is a sub-standard joint with no joint stirrups or beam bars proper anchorage. The chosen exterior joints represent joints constructed with low-strength concrete (9 MPa). The reference study [18] also contains another joint, J3, but this joint is not considered in the current study as it had an old reinforcement anchorage which is not used anymore. Figure 4 shows the details and dimensions of considered specimens. For all joints, the beam has a 150 mm width and 200 mm thickness, with a total length of 900 mm from the face of the square column which has a cross-section of 150 mm × 150 mm. The column’s total height is 1200 mm. Both the beam and the column were reinforced with 4 bars of diameter 14 mm connected by transverse stirrups of 8 mm and repeated each 100 mm. The used concrete for both the beam and the column had the same strength as in the joint panel. In all joints, the column top end was prevented from horizontal movement and was subjected to axial compression stress equal to one-tenth of its maximum capacity. The column’s bottom end was prevented from both vertical and horizontal movements. The beam end was subjected to a displacement control loading till reaching its maximum vertical downward displacement as illustrated in Figure 5.
The yield, ultimate strength, and yield strain for the longitudinal reinforcing bars were 276 MPa, 420 MPa, and 0.0013, respectively, and for the transverse stirrups were 445 MPa, 625 MPa, and 0.0021.
The joint J1 satisfied all the requirements of the ACI 318-14 code [13] in terms of the joint transverse stirrups (amount and spacing), the longitudinal bars reinforcement ratio, and their end anchorage. There were no transverse stirrups in the other two joints. The beam longitudinal bars in joint J2 ended with an anchorage of 90° hooks and in J4 ended without any kind of anchorage as shown in Figure 4. Also, this numerical study was extended to assess the retrofitting with a diagonal steel haunch for joints J2 and J4 and compare the benefits of this option to the reference experimental records using FRP in terms of the joint’s ultimate strength and displacement capacities. The proposed numerical models for the considered reference joints are demonstrated in the next section.
3. Proposed Numerical Models
For both the concrete and steel parts, the used material models and element types are demonstrated in this section. A relevant stress-strain relationship for low-strength concrete is illustrated. The boundary conditions and the loading regime at both the column’s top face and beam free end are presented.
3.1. Concrete Material Model
Concrete is a nonhomogeneous material with preloading cracks and behaves differently in compression than in tension. Here, the concrete damage plasticity model (CDP) was assigned to represent concrete. This material model was suggested by Lubliner et al. [19] and is built on plasticity with yield criteria and smeared cracking assumptions.
Three dimensional solid elements (C3D8R) with eigiht nodes, having three transitional degrees of freedom at each node, were used to simlate the concrete part. To simulate the real condition of the reference selected joints, the concrete material’s primary parameters: concrete elastic modulus, Poisson’s ratio, and concrete compressive strength were taken typical to [18], as 13 × 103 MPa, 0.2, and 9 MPa, respectively. The values for the CDP key parameters were taken as the recommended default by [20], except for the value of the concrete inelastic strain and the first cracking strain .
The concrete compressive stress and inelastic strain relationship are presented in Figure 6a and the uniaxial stress-strain relation of concrete in compression is defined in the CDP model in form of an inelastic strain as follows:
where is the corresponding compressive stress and is the initial elastic modulus and takes a value based on Equation (3) by Sohaib et al. [21].
This equation is based on nonlinear regression analysis of wide experimental results of concretes with strengths between 5 to 15 MPa. The previous code’s [13,16] equations for estimating the value of initial elastic modulus underestimate it, as these equations were based on results of normal strength concretes. As a result of that, the corresponding concrete elastic compressive strain was decreased than the normal range of concretes and consequently, the concrete peak strain in compression is taken as less than the one for normal strength concrete. In contrary to the previous numerical studies [14,15] and by implementing Equation (3), the numerical models’ initial stiffness overestimation problems have been overcome.
By considering the recommended characteristics in [21] for estimating the first cracking strain of low-strength concretes, the tensile strength and the initial modulus of concrete were taken as 1.86 MPa and 17.039 MPa, respectively. The concrete tensile brittle behavior is represented according to the curve plotted in Figure 6b. The first cracking strain is , which corresponding to the maximum concrete tensile strength 1.86 MPa. The relevant definition of this strain enables the precise detection of the first concrete cracking at critical locations.
Other material parameters including dilation angle, shape factor, biaxial stress ratio, eccentricity, and viscosity parameter are considered and summarized in Table 1. These parameters had some uncertainties in their relevant values for the considered reference joints and the effect of the possible variations is examined. For the dilation angle, many trials covered a range from 30° to 45° to best represent the recorded experimental findings. Also, the sensitivity analyses for using different values for concrete mesh element size were carried out, and their accuracy was evaluated using the grid convergence index (GCI) technique. Concrete element sizes starting from 30 to 50 mm were considered with a step of 5 mm as illustrated in Figure 7a.
3.2. Reinforcing Steel Material Model
Elastic-plastic material with bilinear behavior was used to simulate both longitudinal and transverse reinforcement with elastic modulus and Poisson’s ratio of 2 × 10⁵ MPa and 0.3 respectively as in [18]. A truss element (T3D2) with two nodes was used to represent the reinforcing bars. To simulate the concrete-reinforcing steel interaction, the embedded bar option with perfect bond assumption was used as presented in Figure 7b.
3.3. Boundary Condition and Loading
In the proposed numerical model, the movement of the nodes of the column top face was prevented in both the X and Z direction. On the other side, the movement of the nodes of the column bottom face was prevented in all three directions, as shown in Figure 5. The loading regime consisted of two phases. In the first phase, the column top face was subjected to axial compression stress equal to 10% of its axial maximum carrying capacity, and in the second phase, the beam free end was subjected to the action of a controlled vertical displacement till reaching the model maximum capacity.
4. Results and Discussion
The effects of two key parameters on the joint ultimate load capacity are considered. These parameters are the dilation angle and the concrete element meshes size. In the following, different joints responses are presented in terms of the beam end vertical displacement versus the joint load capacity on the horizontal and vertical axes, respectively.
4.1. Standard Joint
The reference experimental observations and the corresponding numerical results of this study are shown and discussed. To investigate the mesh size impact of the concrete elements on the joint ultimate capacity, different numerical models with element sizes of 35, 40, 45, and 50 mm were developed, and their results are illustrated in Figure 8. Figure 8 presents the results of this study compared to the reference findings in terms of load versus beam vertical displacement. The specimen crack pattern started with a flexural crack at the beam top fibers near the column face at 0.5% drift, corresponding to a vertical displacement of 3.2 mm as illustrated in Figure 9. Figure 9 presents the numerical results of the model with an element size of 40 mm and the experimental records. This experimental observation is relatively close to the first numerical cracking load of 4.73 kN, which appeared at 2.9 mm vertical displacement. At a beam vertical displacement of 38 mm, the first main diagonal shear crack is formed in the joint panel due to the high principal tensile stresses inside the joint. At 7% drift, the specimen reached its maximum capacity with many diagonal cracks in the joint panel. Based on both the experimental and numerical findings, the specimen’s first crack was due to flexure in the beam, and the joint shear resistance determined the specimen’s maximum capacity as presented in Figure 10. In this figure, the numerical damage map is very close to the experimental damage photograph. Figure 8 shows that the maximum capacity of different numerical models was independent of the concrete element size. The numerical model with 40 mm element size recorded acceptable agreement compared to the experimental results with a reasonable execution run time. For that, this size is used in the other simulations for non-seismic joints. Both the numerical and the experimental ultimate capacities 13.3 and 12.97 kN were found to be closer to the analytical beam section capacity (which was 13 kN). The accuracy of the numerical simulations was assessed with the GCI method [22] and the error-index was found closer to the unity as reported in Table 2, which gives a good indication about the simulation results accuracy and shows their independence on the concrete element size.
Typical behavior for models with different dilation angles are observed till reaching the yielding point. The impact of dilation angle on the joint ultimate capacity was found to be significant after the yielding point (as presented in Figure 11), and an increase in the joint ultimate load with higher dilation angles was noticed. Also, the value of 40° gives the closest response to the experimental findings in terms of the joint ultimate resistance and the failure shape as presented in Figure 10. The effect of CPD’s material parameters including dilation angle, shape factor, biaxial stress ratio, eccentricity, and viscosity parameter were investigated and the variation of the dilation angle had a significant role in determining the joint’s strength; other parameters had minor effects.
4.2. Sub-Standard Joints
Figure 12 presents the response of the two sub-standard joints J2 and J4. The joints’ numerical ultimate load capacity is 10.5 and 5.22 kN, respectively. A reduction of 28% from the standard joint capacity took place in the case of joint J2 and the reduction is magnified to reach 60.5% for joint J4. As the concrete dilation angle represents the material volume change accompanied with the resulting shear deformation, its value should be in the range from zero to the material friction angle [20] depending on the material equivalent tensile strength to its compressive one. The equivalent tensile strength of the standard joint is higher than the one of deficient joints. In this study, to find the proper dilation angle for each joint, many trials were carried out. It was observed that high values represent well ductile joints and small ones can reproduce well the behavior of deficient joints as they have a small tensile resistance. The best value for the dilation angle that represents numerically the behavior of J2 and J4 are 30° and 10°, respectively, which are less than the previously recommended value in case of standard joint J1.
The joint J1 ultimate carrying capacity is the highest one among the considered three reference joints, this is attributed to the presence of joint stirrups (ties). These ties increased the joint shear resistance and carried the tensile stresses as plotted in Figure 13. These stirrups enabled the beam longitudinal bars to reach their yield limit. Due to the absence of these ties in joints J2 and J4, rapid and concentrated damage was observed in the joint panel zone, as illustrated in Figure 14. This damage hindered the beam longitudinal bars to reach their yield limit. Inside the joint panel zone, the principale maximum tensile stress level observed in Figure 14 for joint J2 was greater than that reached in Figure 10 for joint J1.
Table 3 summarizes the reference experimental records and the current study numerical findings for the three considered joints in terms of the joint ultimate load and displacement capacity. It is obvious that there is good agreement between the experimental and numerical findings for the first two joints J1and J2. However, a difference of 34% in predicting the displacement was found, corresponding to the joint J4 ultimate load. Based on that, the proposed numerical models can be used for further simulations with more focus on more accurate bar bond-slip representation, especially when modeling joints with improper anchorage condition. It was noticed that the beam longitudinal bars slippage had a more negative impact on joint performance than the absence of joint transverse reinforcement. To increase the reliability in the current study’s numerical outcomes, a comparison to other empirical/analytical equations was made. In this reference joints, the brittle shear failure is the predominant mode. Based on the the general forces equilibrium at the joint location [4], the joint shear capacity for joints J1, J2, and J4 can be determined using Equation (4) and was found to be 57.2, 42.5, and 36.6 kN, respectively.
where L is the beam clear length, is the beam section lever arm, and is the column total length.
For joints J2 and J1 with proper anchorage condition, the shear capacity increased from 42.5 to 57.2 kN due to the presence of joint ties, and these predictions agreed well with the results when applying the Vollum’s model [4] which were 47.4 and 59.3 kN according to Equation (5):
where is a strength reduction factor, is the beam height, is the column height, and is the joint width.
In addition to that, by using Bakir and Boduroglu model [5] for joints J2 and J1, the joint shear strength was found equal to 47.7 and 56.1 kN, respectively, according to Equation (6):
where is the anchorage condition factor and is the beam reinforcement ratio. To some extent, the previous two empirical models [4,5] succeeded in predicting the shear strength of both unreinforced and reinforced joints J2 and J1. These models do not assume that the joint’s stirrups have reached their yield strength and take their contribution in reinforced joint implicitly.
On the other side, some models [6,7] consider the stirrups contribution explicitly in a separate term and assume the stress inside the joint’s stirrups equal to the yield strength. For instance, Hegger et al. [6] model is found not relevant for reinforced joints with low-strength as its prediction for joints J2 and J1 was 43.6 and 103 kN, respectively, according to Equation (7):
In which is the transverse reinforcement in the joint, and is stirrups yield strength.
Analytically, by applying the Hwang et al. [7] model, which was shown in Figure 3, the shear capacity of J2 and J1 was found equal to 42.66 and 68.3 kN, respectively.
As a conclusion, the joint shear strength prediction by the first two models [4,5] was found to be the closest to the experimental and the numerical findings, as these two models implicitly considered the stirrups contribution in enhancing the joint shear resistance. On the other side, the last two models [6,7] predicted well the unreinforced joint shear resistance as models [4,5] and failed in estimating the shear strength of the reinforced joint. This is likely due to their overestimation of the stirrups’ actual stress in the joint panel zone.
4.3. Retrofitted Joints
In this study, the retrofitting with a diagonal steel haunch similar to the one used by Giovacchino [23] was considered to recover and enhance the sub-standard joints resistance. Figure 15 presents the general layout and dimensions of the diagonal steel haunches mounted on joint J2 and J4. This diagonal steel part has an elastic modulus of 2 × 10⁵ MPa and a thickness of 10 mm. For the joint J2, the benefit of using this diagonal haunch was obvious in Figure 16a, the retrofitted joint’s strength was increased by relocating the dameged area from the joint panel zone to the beam section at the haunch end with different levels based on the haunch length as in Figure 16b. This enhancement is attributed to the contribution of the bottom plate of the top haunch with the beam main top bars as a tension reinforcement. The force in the beam main top bars is transferred through the joint and the equilibrium between the forces in both horizontal and vertical plates of the top haunch is through the haunch web and not through the concrete joint. The retrofit option with a dimension of 200 mm achieved an improvement of about 77% in the joint ultimate capacity. The enhancement ratio caused by the smallest haunch was found to be higher than the recorded ratio in the reference study by Cumhur et al. [18] with the FRP retrofit technique. In the case of joint J4, as the joint lacks to proper anchorage and transverse stirrups, the previously mentioned enhancement for J2 cannot be reached. The ultimate capacity is increased by 32 and 43.6% with haunches of dimension of 200 and 250 mm respectively as presented in Figure 17a. The use of a diagonal steel haunch with a minimum dimension equal to the thickness of the retrofitted beam is more practical to be applied in building structures, as it has less of an impact on the building slab and its ceiling. The damage pattern of the retrofitted joint J2 is shown in Figure 16b and the joint panel zone is intact without any cracks with all haunches and the beam cross-section capacity governs the beam-column joint behavior with a beam ductile failure at the haunch end. For joint J4, the small haunch of dimension 200 mm is not sufficient to prevent all joint’s cracks as in Figure 17b. On the other side, a larger haunch of dimension 250 mm was able to protect the joint panel zone and move all critical cracks to the haunch end as in Figure 17c. The separation problems were not noticed in any retroffited joint with the steel haunch as clear in Figure 16 and Figure 17.
5. Conclusions
Beam-column joints have a significant role in shaping RC frame building resistance to different loading conditions. The numerical strength assessment of such joints with low-strength concrete, improper bar anchorage, and no transverse stirrups is highly required. In this study, nonlinear numerical models with ABAQUS for three reference joints were introduced by proposing proper values for the input parameters of the CPD model to best represent joints with low-strength concrete. The approximation in simulating the concrete- reinforcing steel interaction was not suitable for joints with insufficient anchorage conditions. On the other side, the benefits of retrofitting substandard joints with diagonal steel haunches were assessed. Based on the numerical and empirical models’ findings, the following conclusions were drawn:
- The material model of CDP in ABAQUS showed effectiveness in representing concrete response in numerical simulation of the considered reference joints, as the simulation results were found to be closer to the experimental observed joint capacities.
- Within the ABAQUS manual recommended range for the concrete material dilation angle, these numerical simulations recommended a value of 40° for standard joints and 30° and 10° for substandard joints with shear or shear and anchorage deficiencies, respectively.
- Empirical models that explicitly consider the stirrups’ contribution overestimated the shear strength, and models with implicit assumption estimated the strength accurately.
- The applicability of numerical, empirical, and analytical models for joints using low-strength concrete is demonstrated even with some discrepancies in the case of joints with anchorage problems.
- Without any separation problems and conflict with the building floors or beams, diagonal steel haunch usage can relocate the formed plastic hinge outside the joint panel and enable both the column and beam to reach their flexural ultimate capacity, albiet with no increase in the joint displacement capacity.
Even though this work succeeded in reaching its planned objectives to some extent, the solution solver convergence in the case of joints with anchorage problems must still be maintained. For each particular problem, an analytical formula for calculating the relevant dilation angle is still required.
Author Contributions
Conceptualization, B.S.A. and W.E.E.-D.; methodology, B.S.A.; software, W.E.E.-D.; validation, B.S.A., M.R.K. and W.E.E.-D.; formal analysis, B.S.A.; investigation, B.S.A.; resources, B.S.A.; data curation, B.S.A. and W.E.E.-D.; writing—original draft preparation, B.S.A.; writing—review and editing, B.S.A., M.R.K. and W.E.E.-D.; visualization, B.S.A. and W.E.E.-D.; supervision, B.S.A.; project administration, B.S.A.; funding acquisition, M.R.K. All authors have read and agreed to the published version of the manuscript.
Funding
This work was supported by Basic Science Research Program through the National Research Foundation of Korea (NRF) funded by the Ministry of Science, ICT & Future Planning (2019R1I1A1A01062202).
Acknowledgments
The authors would like to thank Cumhur Cosgun and all his work team at Marshall University in USA for providing us with full details concerning the considered reference joints.
Conflicts of Interest
The authors declare no conflict of interest.
References
- Adam, J.M.; Parisi, F.; Sagaseta, J.; Lu, X. Research and practice on progressive collapse and robustness of building structures in the 21st century. Eng. Struct. 2018, 173, 122–149. [Google Scholar] [CrossRef]
- El-Demerdash, W.; El-Metwally, S.; El-Zoughiby, M. Survival of reinforced concrete flat plate system against column loss. Electron. J. Struct. Eng. 2020, 20, 33–34. [Google Scholar]
- Basem, A. A review on building progressive collapse, survey and discussion. Case Stud. Constr. Mater. 2019, 11, e00264. [Google Scholar] [CrossRef]
- Vollum, R. Design and analysis of exterior beam column connections. Ph.D. Thesis, Imperial College of Science Technology and Medicine-University of London, London, UK, 1998. [Google Scholar]
- Bakir, P.; Boduroğlu, H. A new design equation for predicting the joint shear strength of monotonically loaded exterior beam-column joints. Eng. Struct. 2002, 24, 1105–1117. [Google Scholar] [CrossRef]
- Hegger, J.; Sherif, A.; Roeser, W. Nonseismic design of beam-column joints. ACI Struct. J. 2003, 100, 654–664. [Google Scholar]
- Hwang, S.; Lee, H. Analytical model for predicting shear strengths of exterior reinforced concrete beam-column joints for seismic resistance. ACI Struct. J. 1999, 96, 846–858. [Google Scholar]
- Orton, S.; Jirsa, J.; Bayrak, O. Carbon fiber-reinforced polymer for continuity in existing reinforced concrete buildings vulnerable to collapse. ACI Struct. J. 2009, 106, 608–616. [Google Scholar]
- Basem, A.; Bachir, B.; John, V. Reinforced concrete beam-column inverted knee joint behavior after ground corner column loss-numerical analysis. Lat. Am. J. Solids Struct. 2018, 15, e122. [Google Scholar] [CrossRef]
- Shin, M.; LaFave, J. Modeling of cyclic joint shear deformation contributions in RC beam-column connections to overall frame behavior. Struct. Eng. Mech. J. 2004, 18, 645–669. [Google Scholar] [CrossRef]
- Qian, K.; Li, B.; Ma, J.X. Load carrying mechanism to resist progressive collapse of RC buildings. J. Struct. Eng. 2015, 141, 04014107. [Google Scholar] [CrossRef]
- Yap, S.; Li, B. Experimental investigation of RC exterior beam-column sub-assemblages for progressive collapse. ACI Struct. J. 2011, 108, 542–552. [Google Scholar]
- ACI committee 318. Building Code Requirements for Structural Concrete and Commentary ACI 318,14; ACI committee 318: Farmington Hills, MI, USA, 2014. [Google Scholar]
- Peng, Z.; Wang, Z. ABAQUS FEM analysis on knee joints in reinforced concrete frames. J. Chongqing Jiaotong Univ. Nat. Sci. 2010, 29, 677–790. [Google Scholar]
- Danesh, F.; Esmaeeli, E.; Alam, M. Shear strengthening of 3D RC beam-column connection using GFRP: FEM Study. Asian J. Appl. Sci. 2008, 1, 217–227. [Google Scholar] [CrossRef] [Green Version]
- Architectural Institute of Japan. Guidelines for RC structures; Architectural Institute of Japan: Tokyo, Japan, 2004. [Google Scholar]
- Khan, U.; Al-Osta, M.; Ibrahim, A. Modeling shear behavior of reinforced concrete beams strengthened with externally bonded CFRP sheets. Struct. Eng. Mech.J. 2017, 1, 125–142. [Google Scholar] [CrossRef]
- Cumhur, C.; Ahmet, M.; Atakan, M.; Turgay, C.; Guven, K. Experimental behavior and failure of beam-column joints with plain bars, low-strength concrete and different anchorage details. Eng. Fail. Anal. 2020, 109, 104247. [Google Scholar] [CrossRef]
- Lubliner, J.; Oliver, J.; Oller, S.; Onate, E. A plastic damage model for concrete. Int. J. Solids Struct. 1989, 25, 299–326. [Google Scholar] [CrossRef]
- Simulia. ABAQUS Analysis user’s manual 6.17-EF; Dassault Systems Simulia Corp: Providence, RI, USA, 2017. [Google Scholar]
- Sohaib, A.; Kypros, P.; Qaiser, K.; Kyriacos, N. Stress-strain model for low-strength concrete in uni-axial compression. Arab. J. Sci. Eng. 2015, 40, 313–328. [Google Scholar]
- Roache, P.J. Verification and Validation in Computational Science and Engineering; Hermosa: Albuquerque, NM, USA, 1998. [Google Scholar]
- Giovacchino, G. Seismic assessment of RC exterior beam column joints and retrofit with haunches using post-installed anchors. Ph.D. Thesis, Stuttgart University, Stuttgart, Germany, 2012. [Google Scholar]
Figure 1.
Failure of RC buildings due to different extreme loading [3]. (a) Beam-column conncetion failure. (b) Slab-column connection failure.
Figure 1.
Failure of RC buildings due to different extreme loading [3]. (a) Beam-column conncetion failure. (b) Slab-column connection failure.
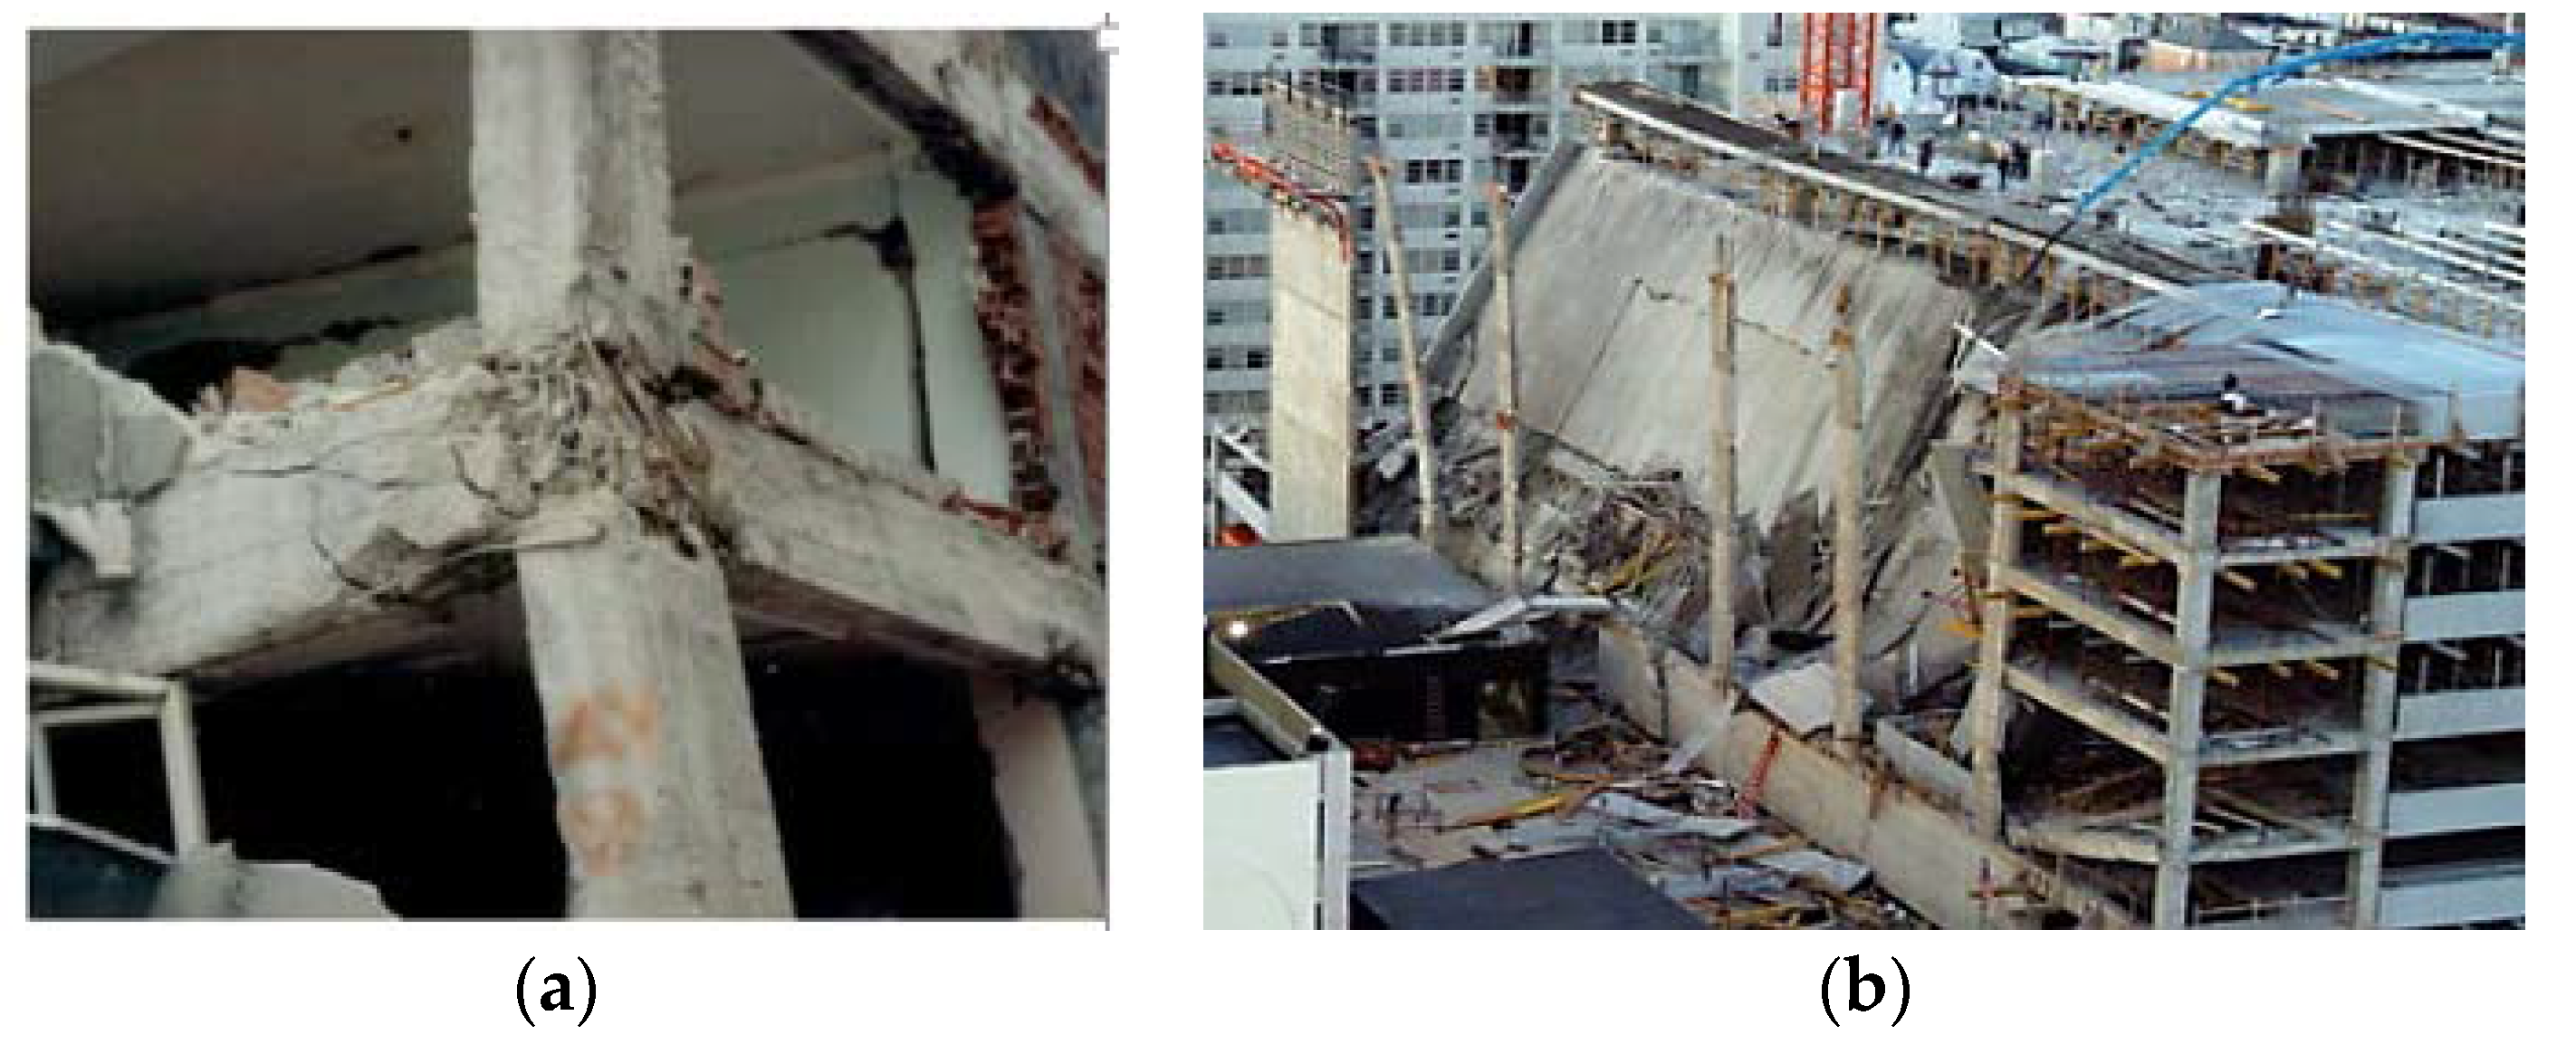
Figure 2.
Partial and total panel collapse of RC buildings [3]. (a) Building panel partial collapse. (b) Building panels total collapse.
Figure 2.
Partial and total panel collapse of RC buildings [3]. (a) Building panel partial collapse. (b) Building panels total collapse.
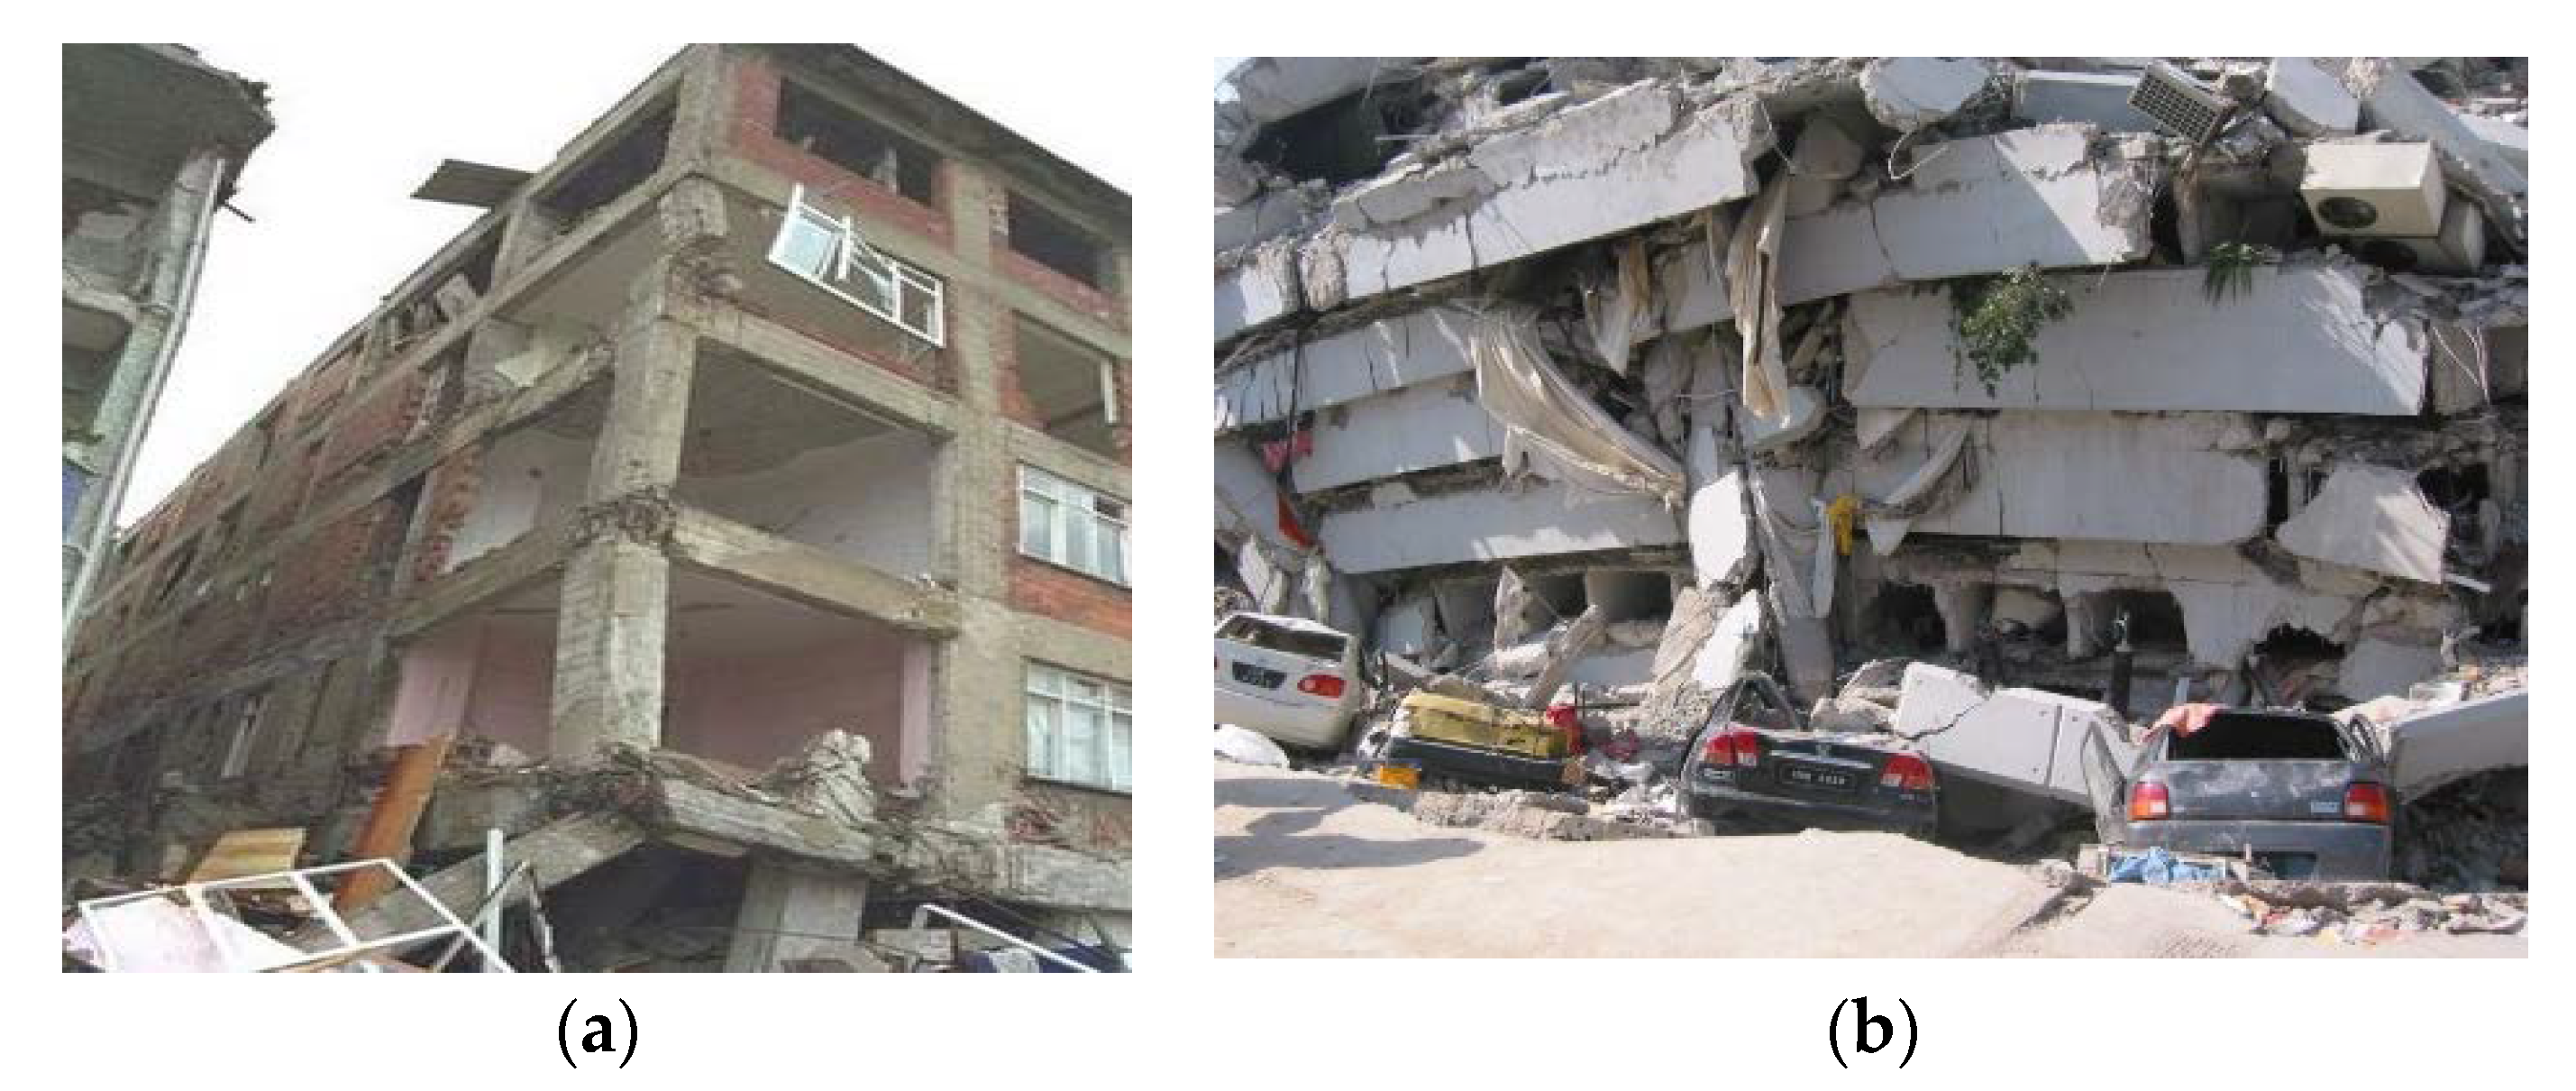
Figure 3.
Exterior joint shear stress and different resisting mechanisms. (a) Joint boundary actions. (b) Concrete diagonal strut. (c) Reinforced joint equilibrium. In which, Vjh, Vcol, and Vb are the shear forces in the joint, column, and beam respectively.
Figure 3.
Exterior joint shear stress and different resisting mechanisms. (a) Joint boundary actions. (b) Concrete diagonal strut. (c) Reinforced joint equilibrium. In which, Vjh, Vcol, and Vb are the shear forces in the joint, column, and beam respectively.

Figure 4.
Specimen’s dimension and details. (a) Joint J1 details. (b) Joint J2 details. (c) Joint J4 details.
Figure 4.
Specimen’s dimension and details. (a) Joint J1 details. (b) Joint J2 details. (c) Joint J4 details.

Figure 5.
Tested joints boundary conditions and loadings.

Figure 6.
The uniaxial compressive and tensile stress-inelastic strain relationship for concrete according to the CDP constitutive model. (a) Concrete in compression. (b) Concrete in tension.
Figure 6.
The uniaxial compressive and tensile stress-inelastic strain relationship for concrete according to the CDP constitutive model. (a) Concrete in compression. (b) Concrete in tension.
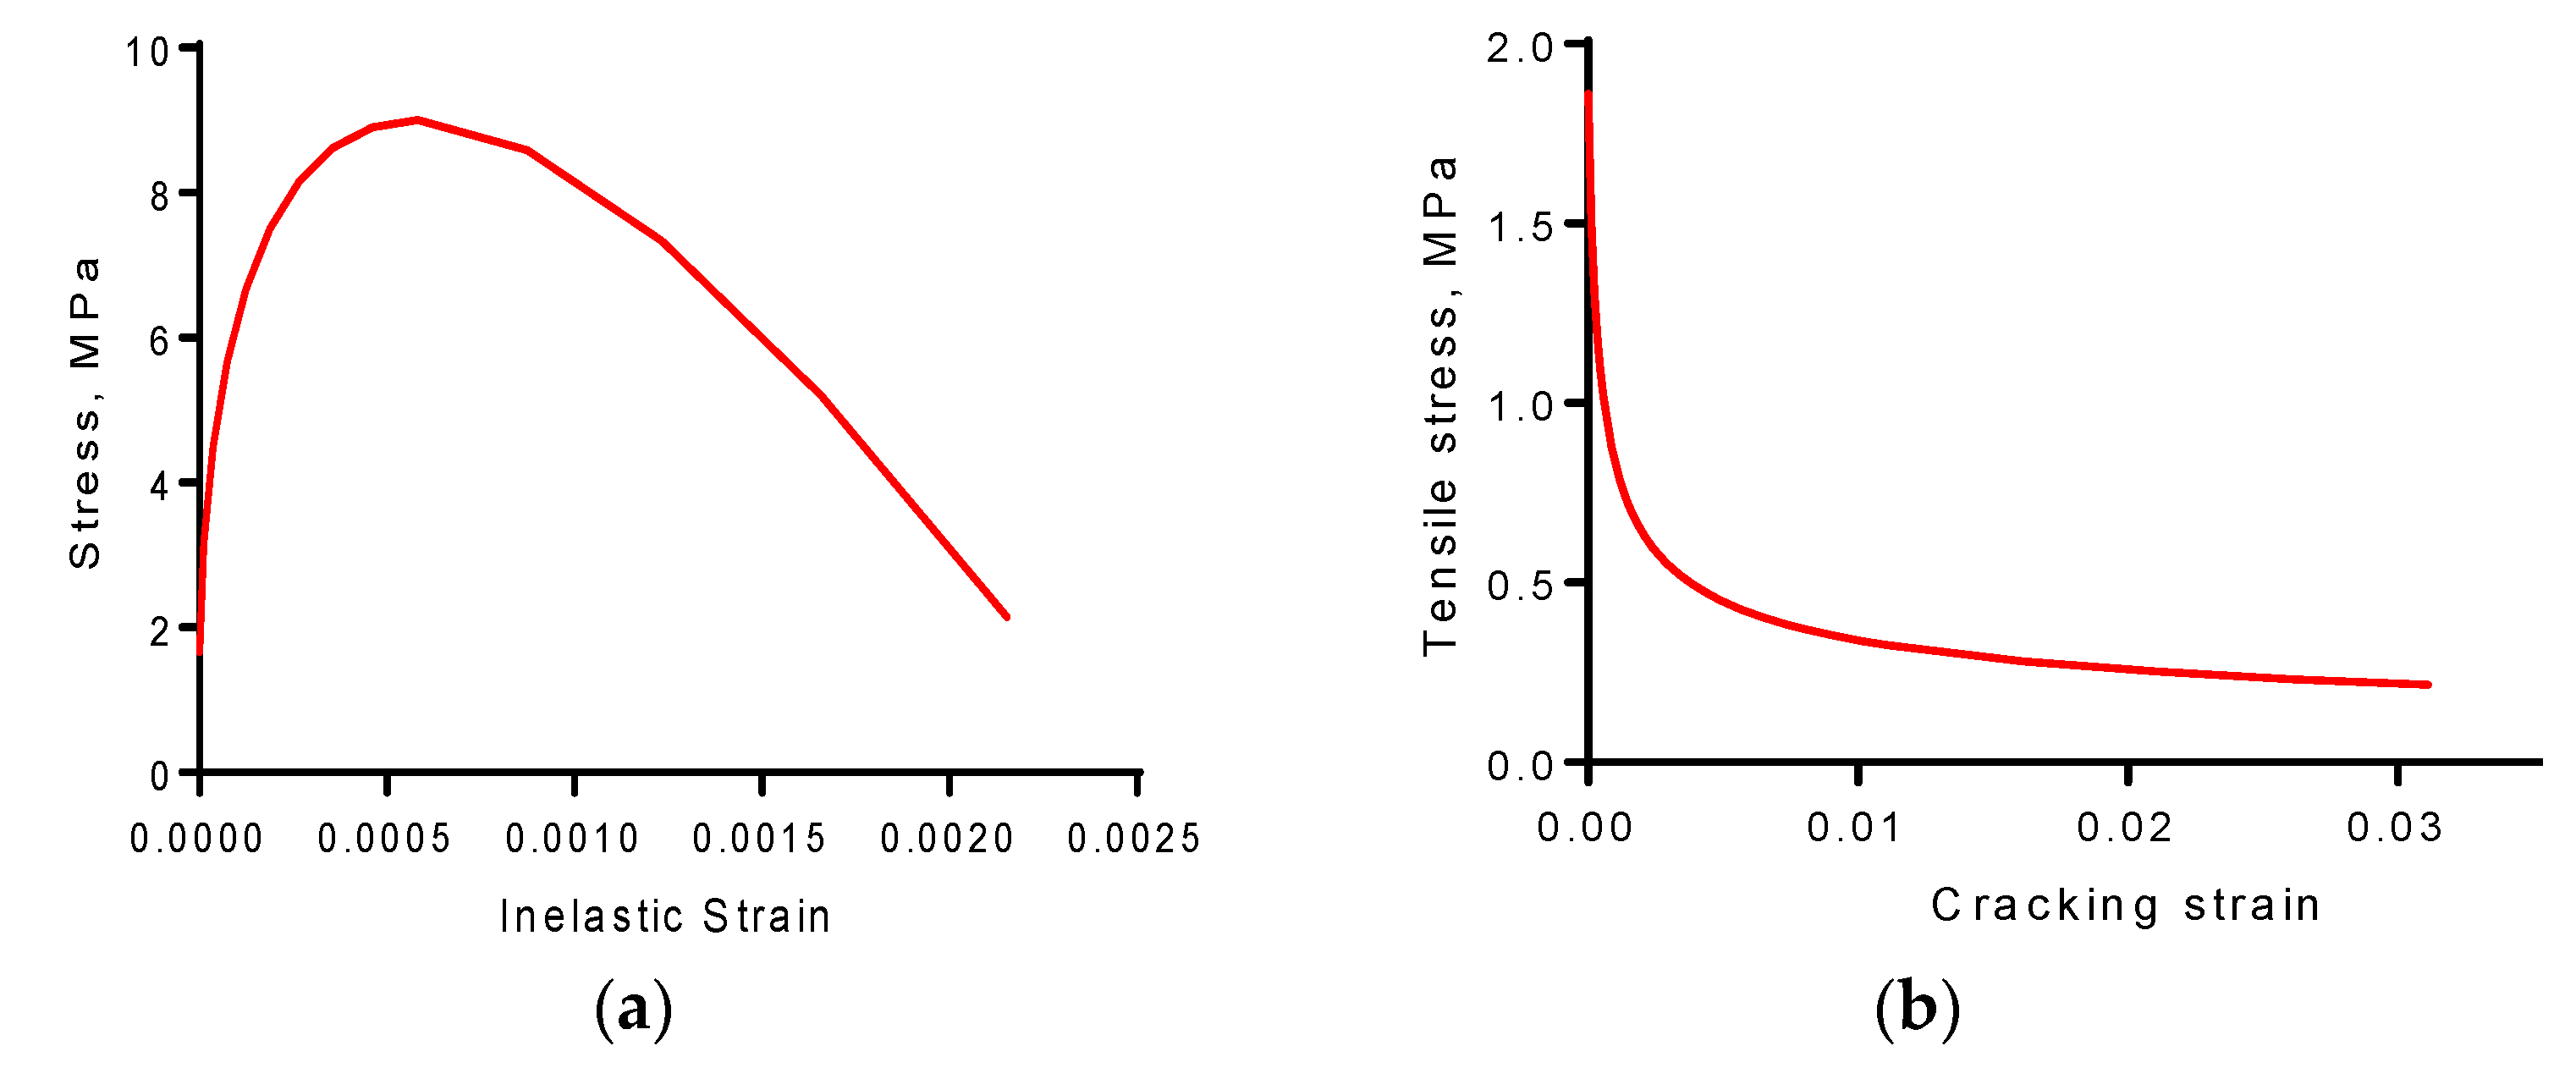
Figure 7.
Concrete solid and steel truss elements. (a) Concrete solid elements. (b) Reinforcing bars truss elements.
Figure 7.
Concrete solid and steel truss elements. (a) Concrete solid elements. (b) Reinforcing bars truss elements.

Figure 8.
Load-displacement response for joint J1 according to different mesh sizes.

Figure 9.
Load-displacement curves of experiment and numerical analysis.
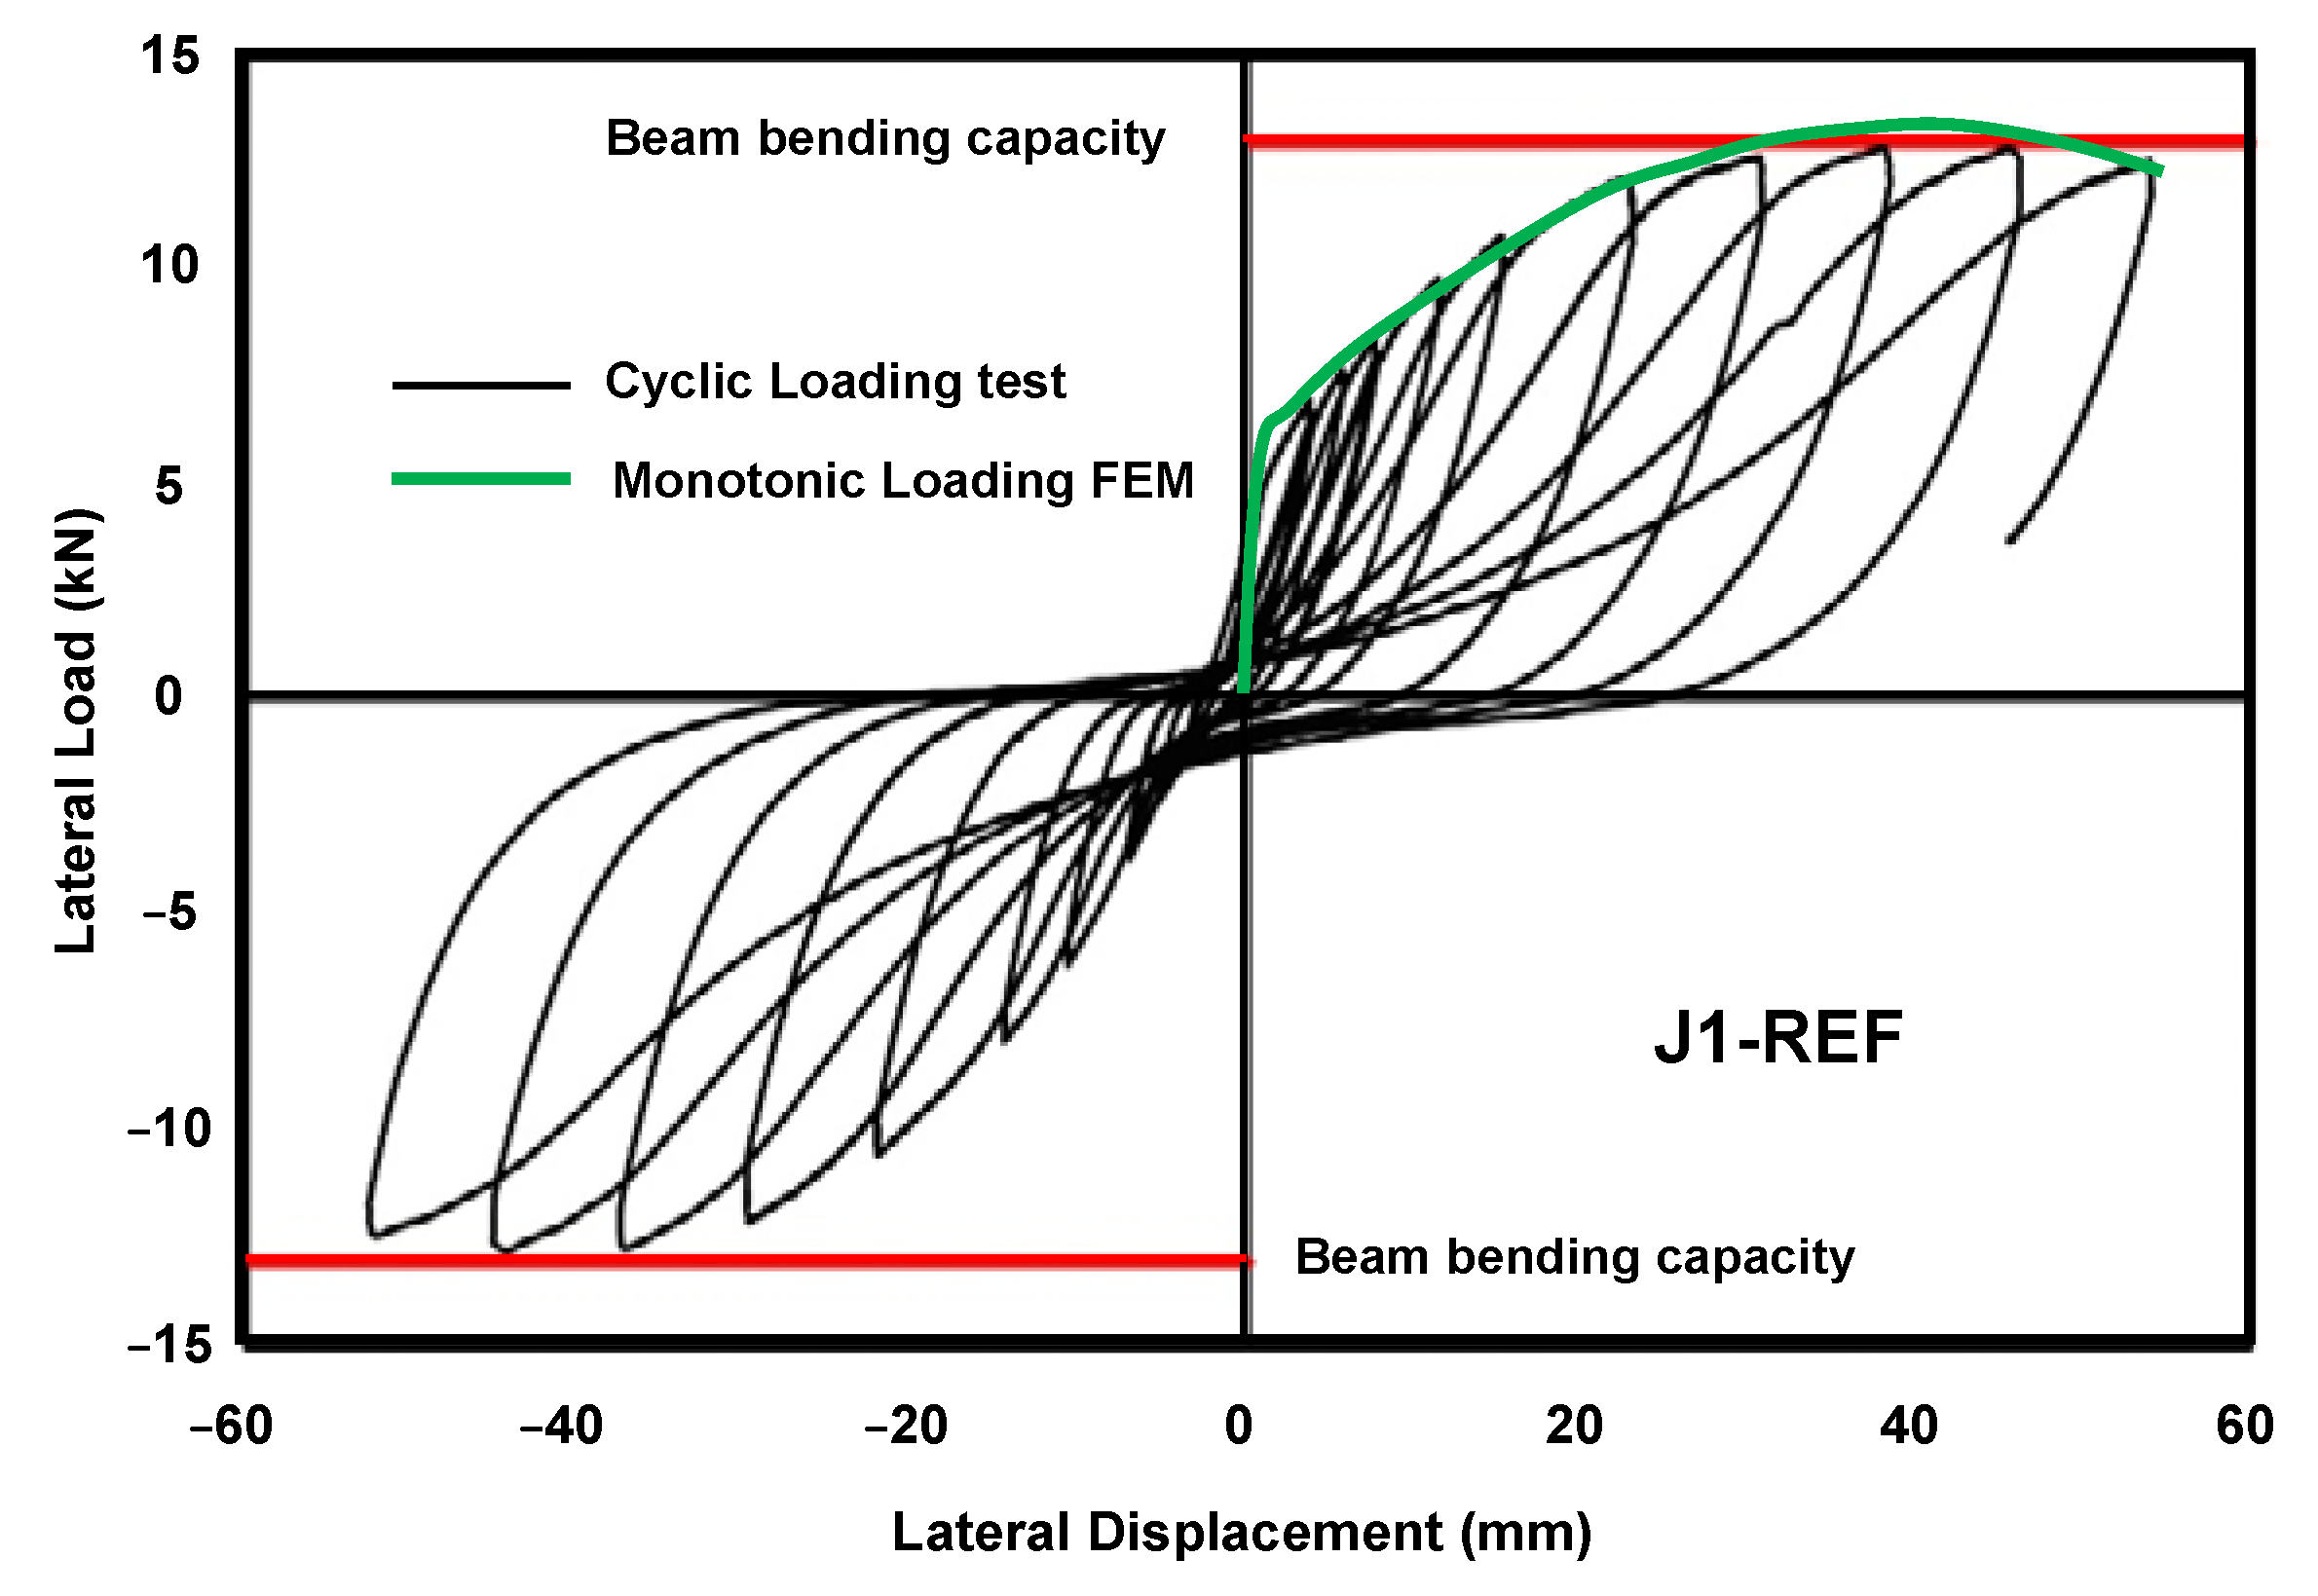
Figure 10.
Damage plot for the Joint J1 in combination with the experimental observation.

Figure 11.
Joint J1 load-displacement response based on dilation angle variation.
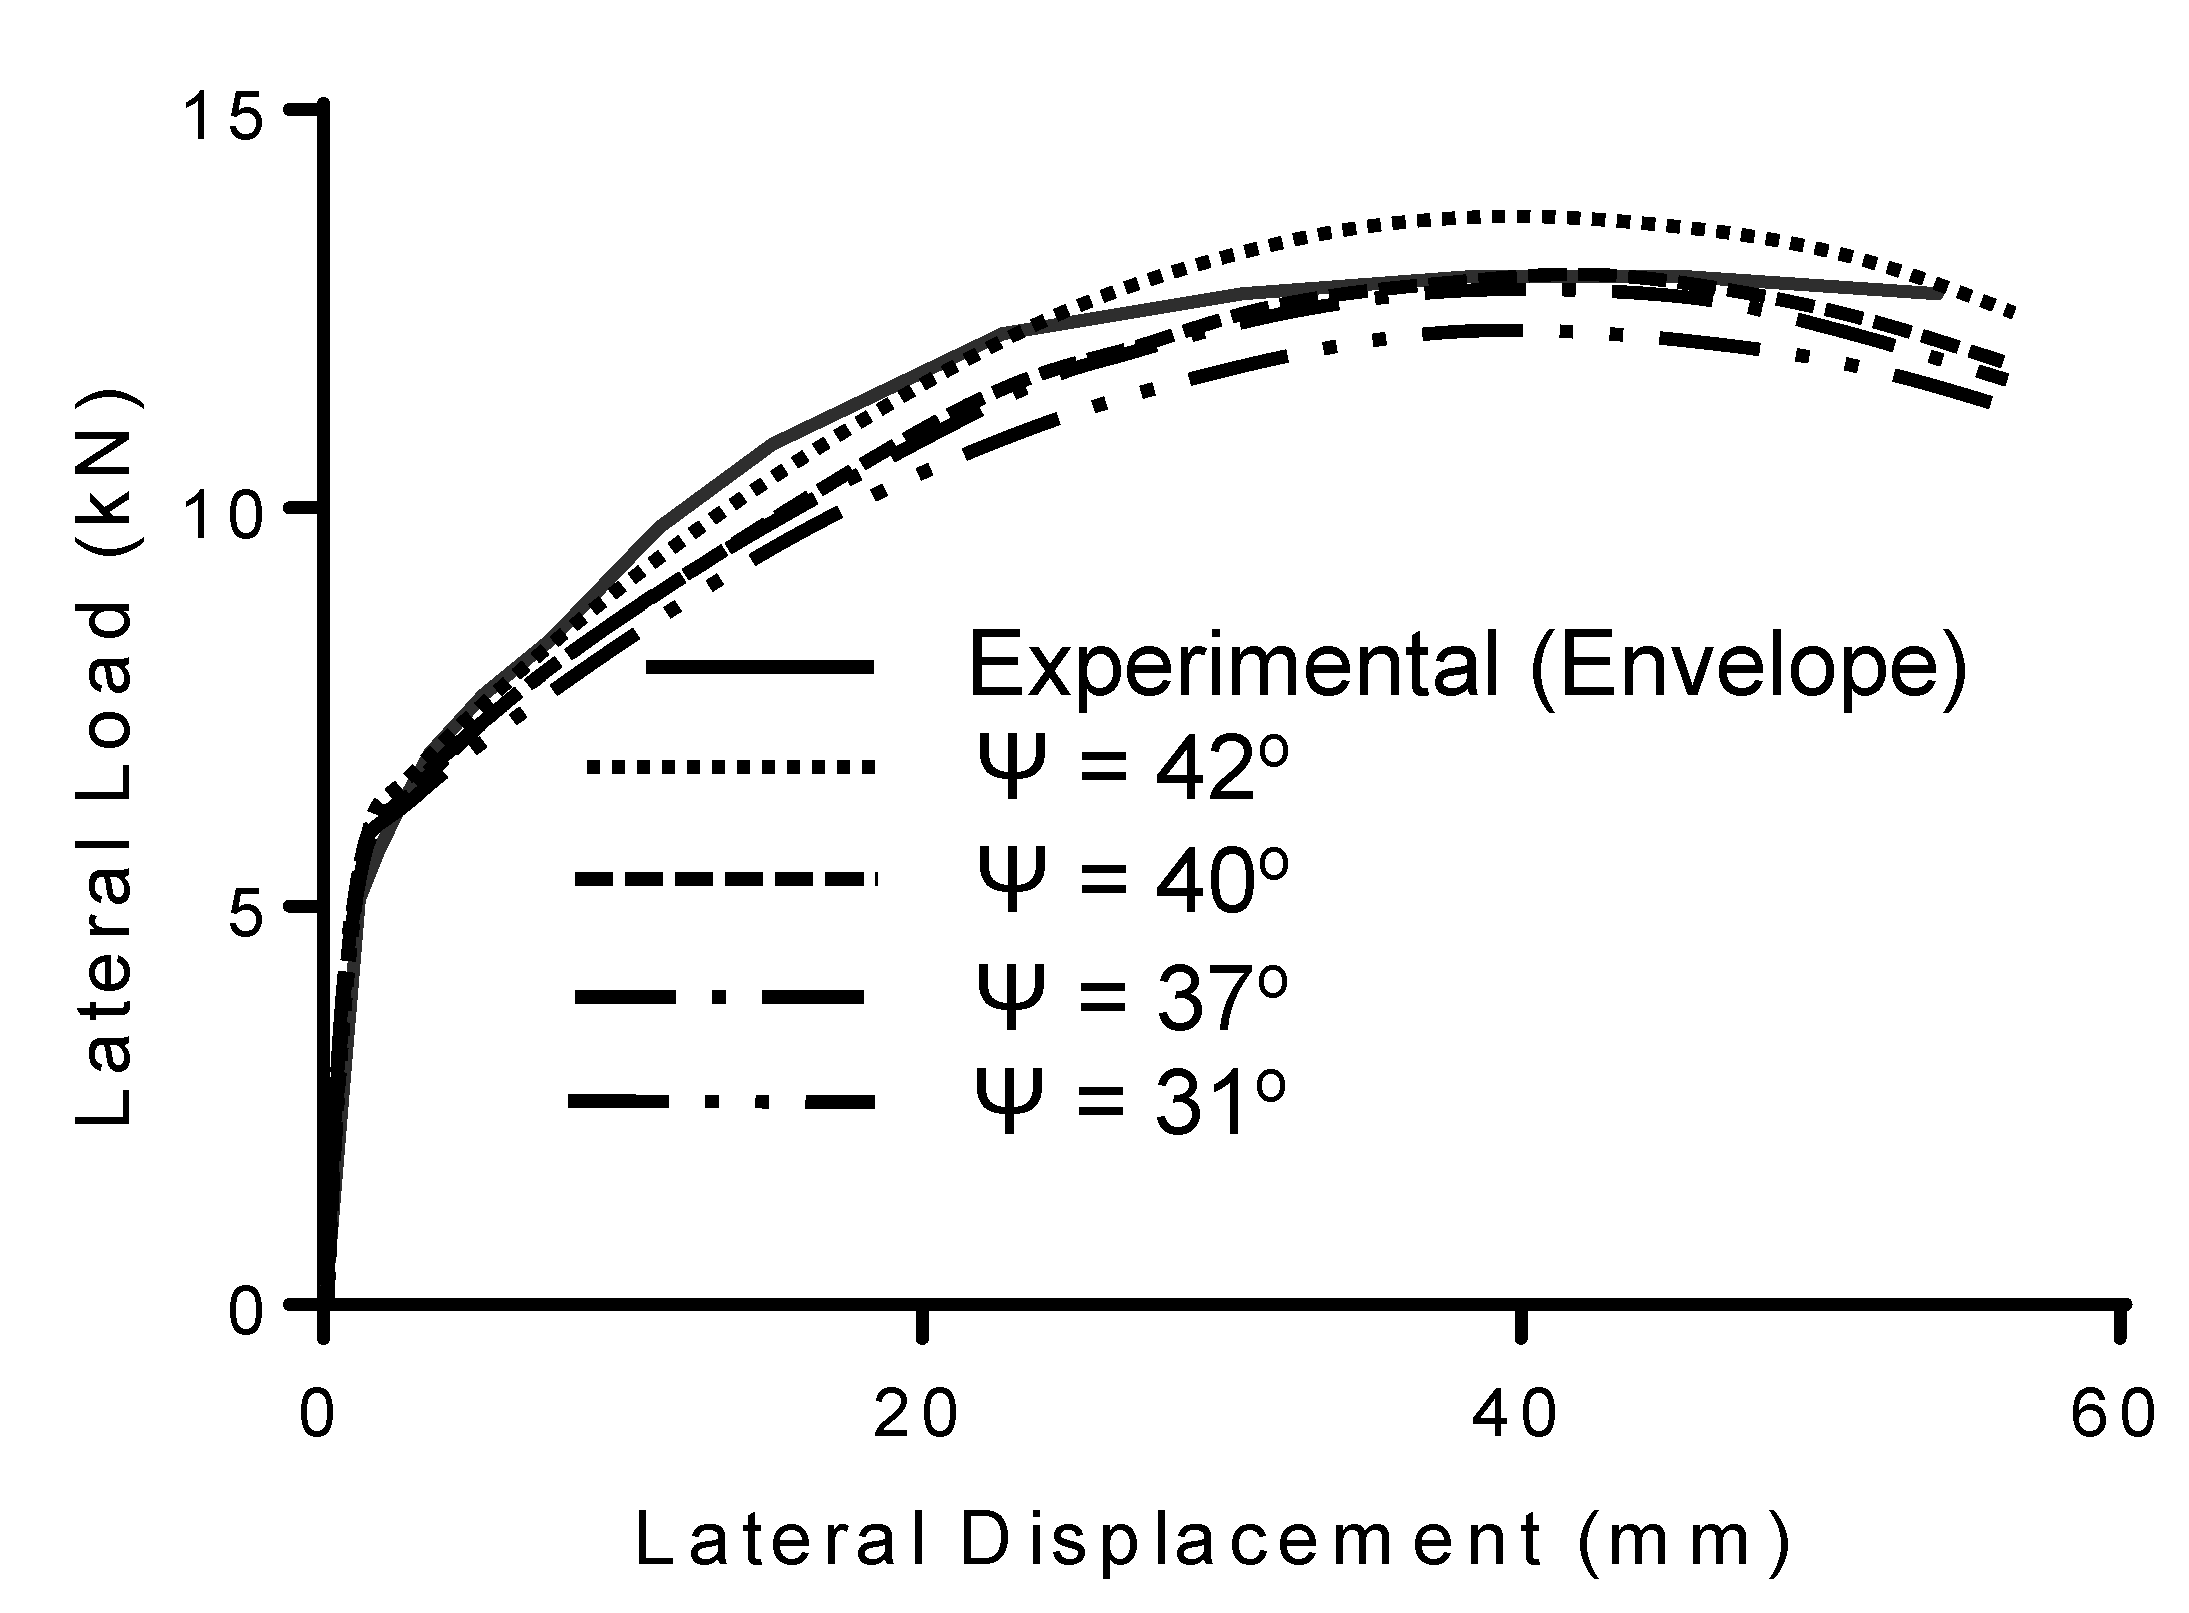
Figure 12.
Load-displacement curves for sub-standard joints. (a) Joint J2 (b) Joint J4.

Figure 13.
Stresses in transverse stirrups (ties) of joint J1.
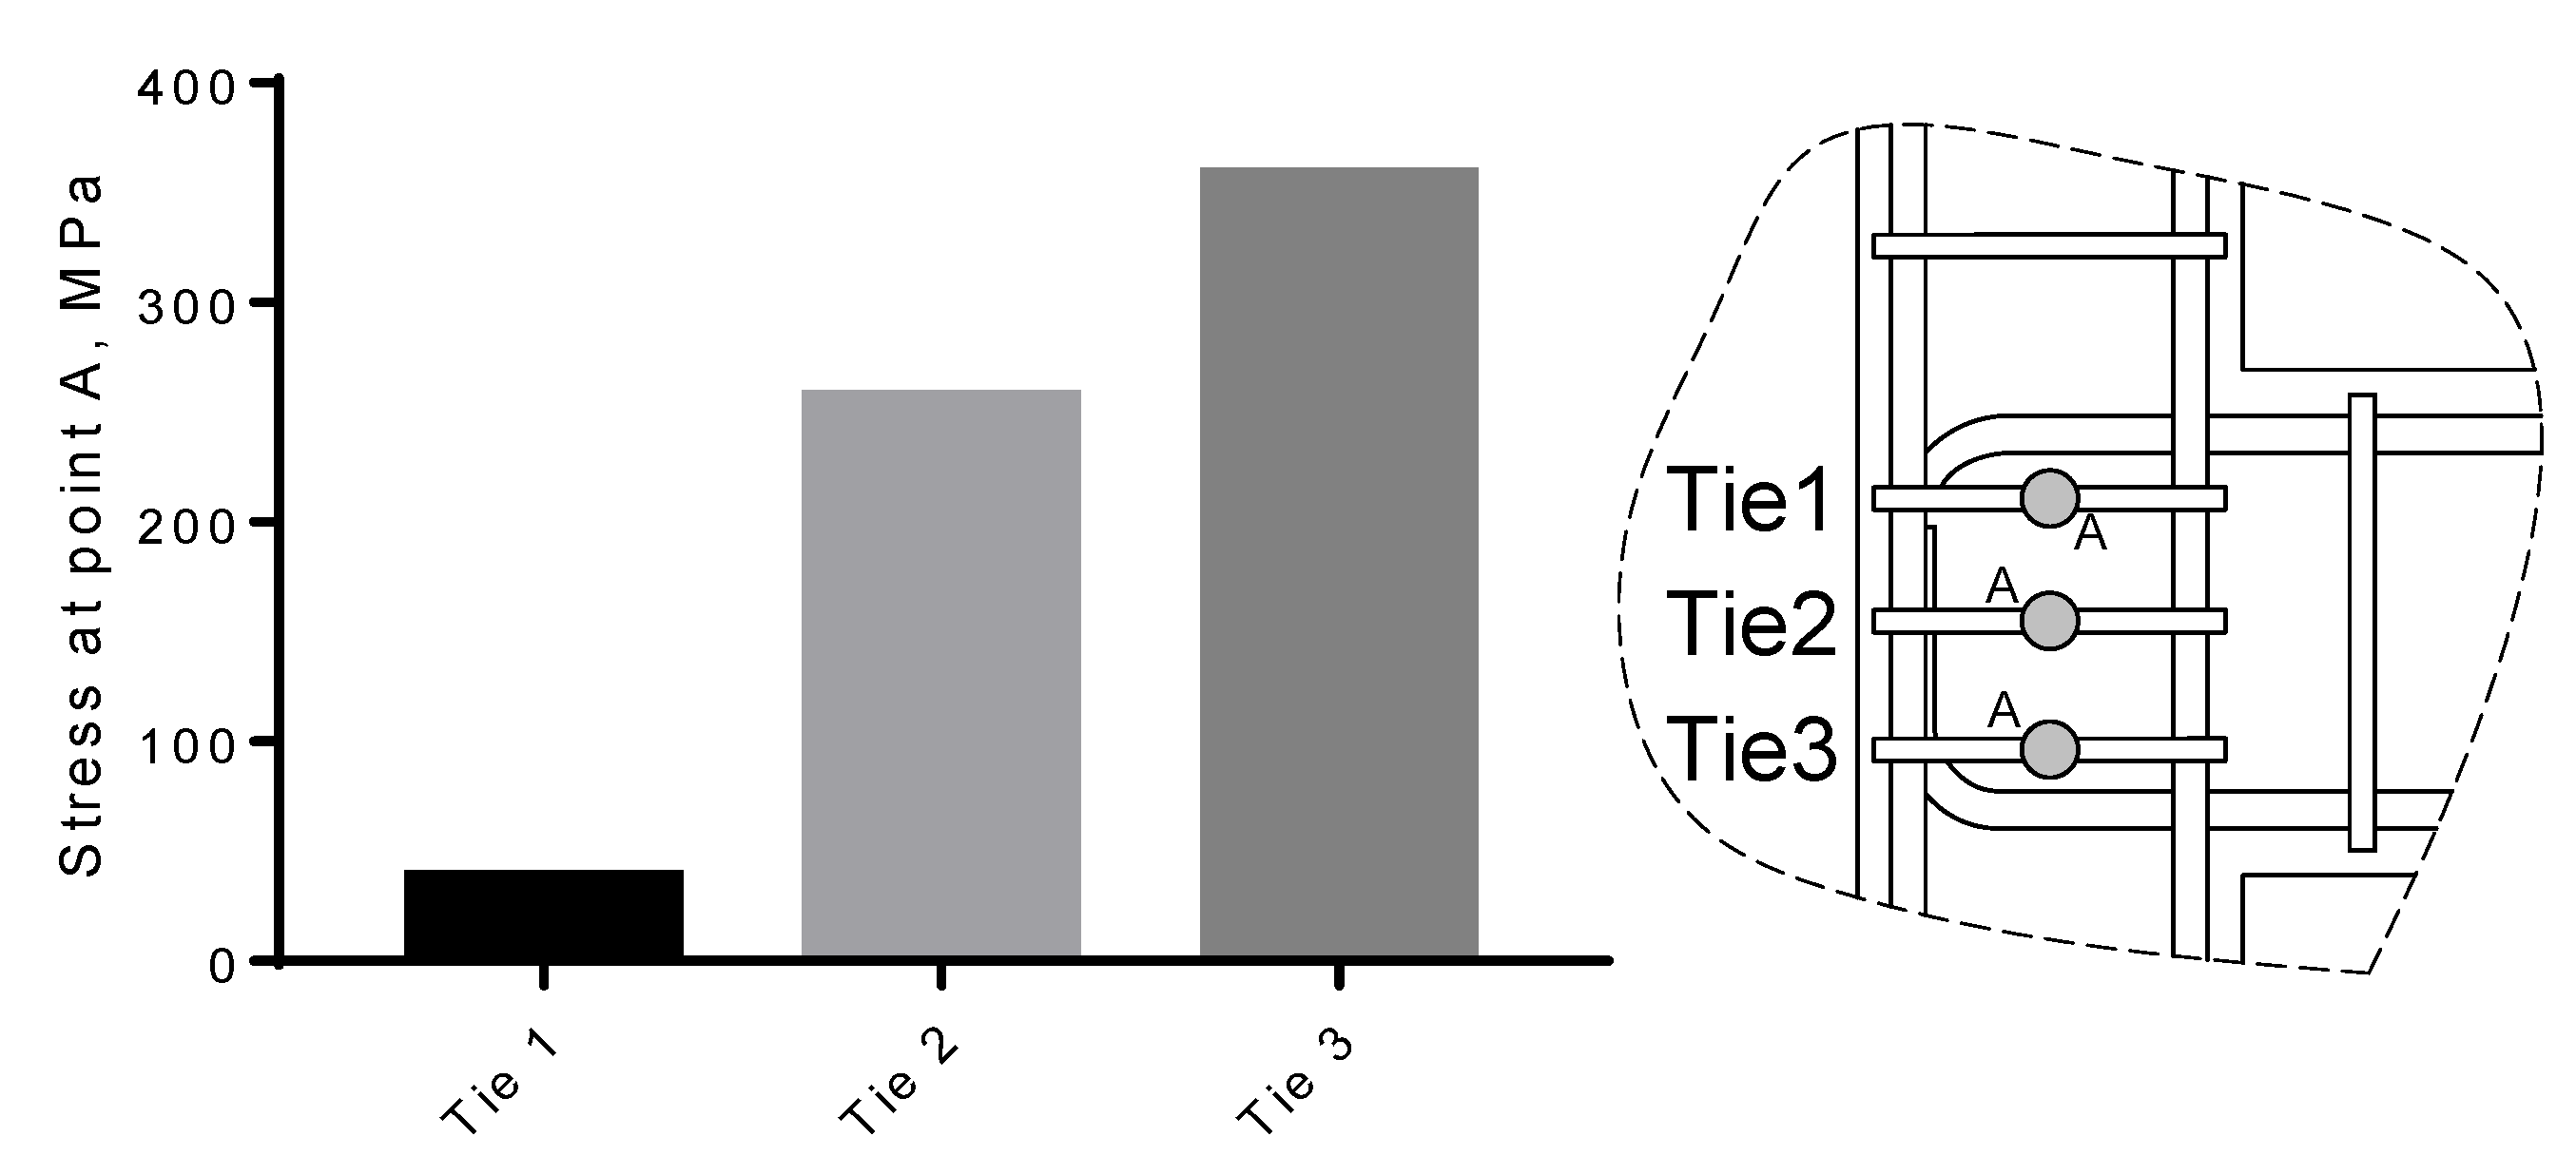
Figure 14.
Damage plot of sub-standard joint in combination with the experimental observations.

Figure 15.
General layout and dimensions of the considered steel haunches. (a) Diagonal steel haunch a × a × 150 mm for J2. (b) Diagonal steel haunch a × a × 150 mm for J4.
Figure 15.
General layout and dimensions of the considered steel haunches. (a) Diagonal steel haunch a × a × 150 mm for J2. (b) Diagonal steel haunch a × a × 150 mm for J4.
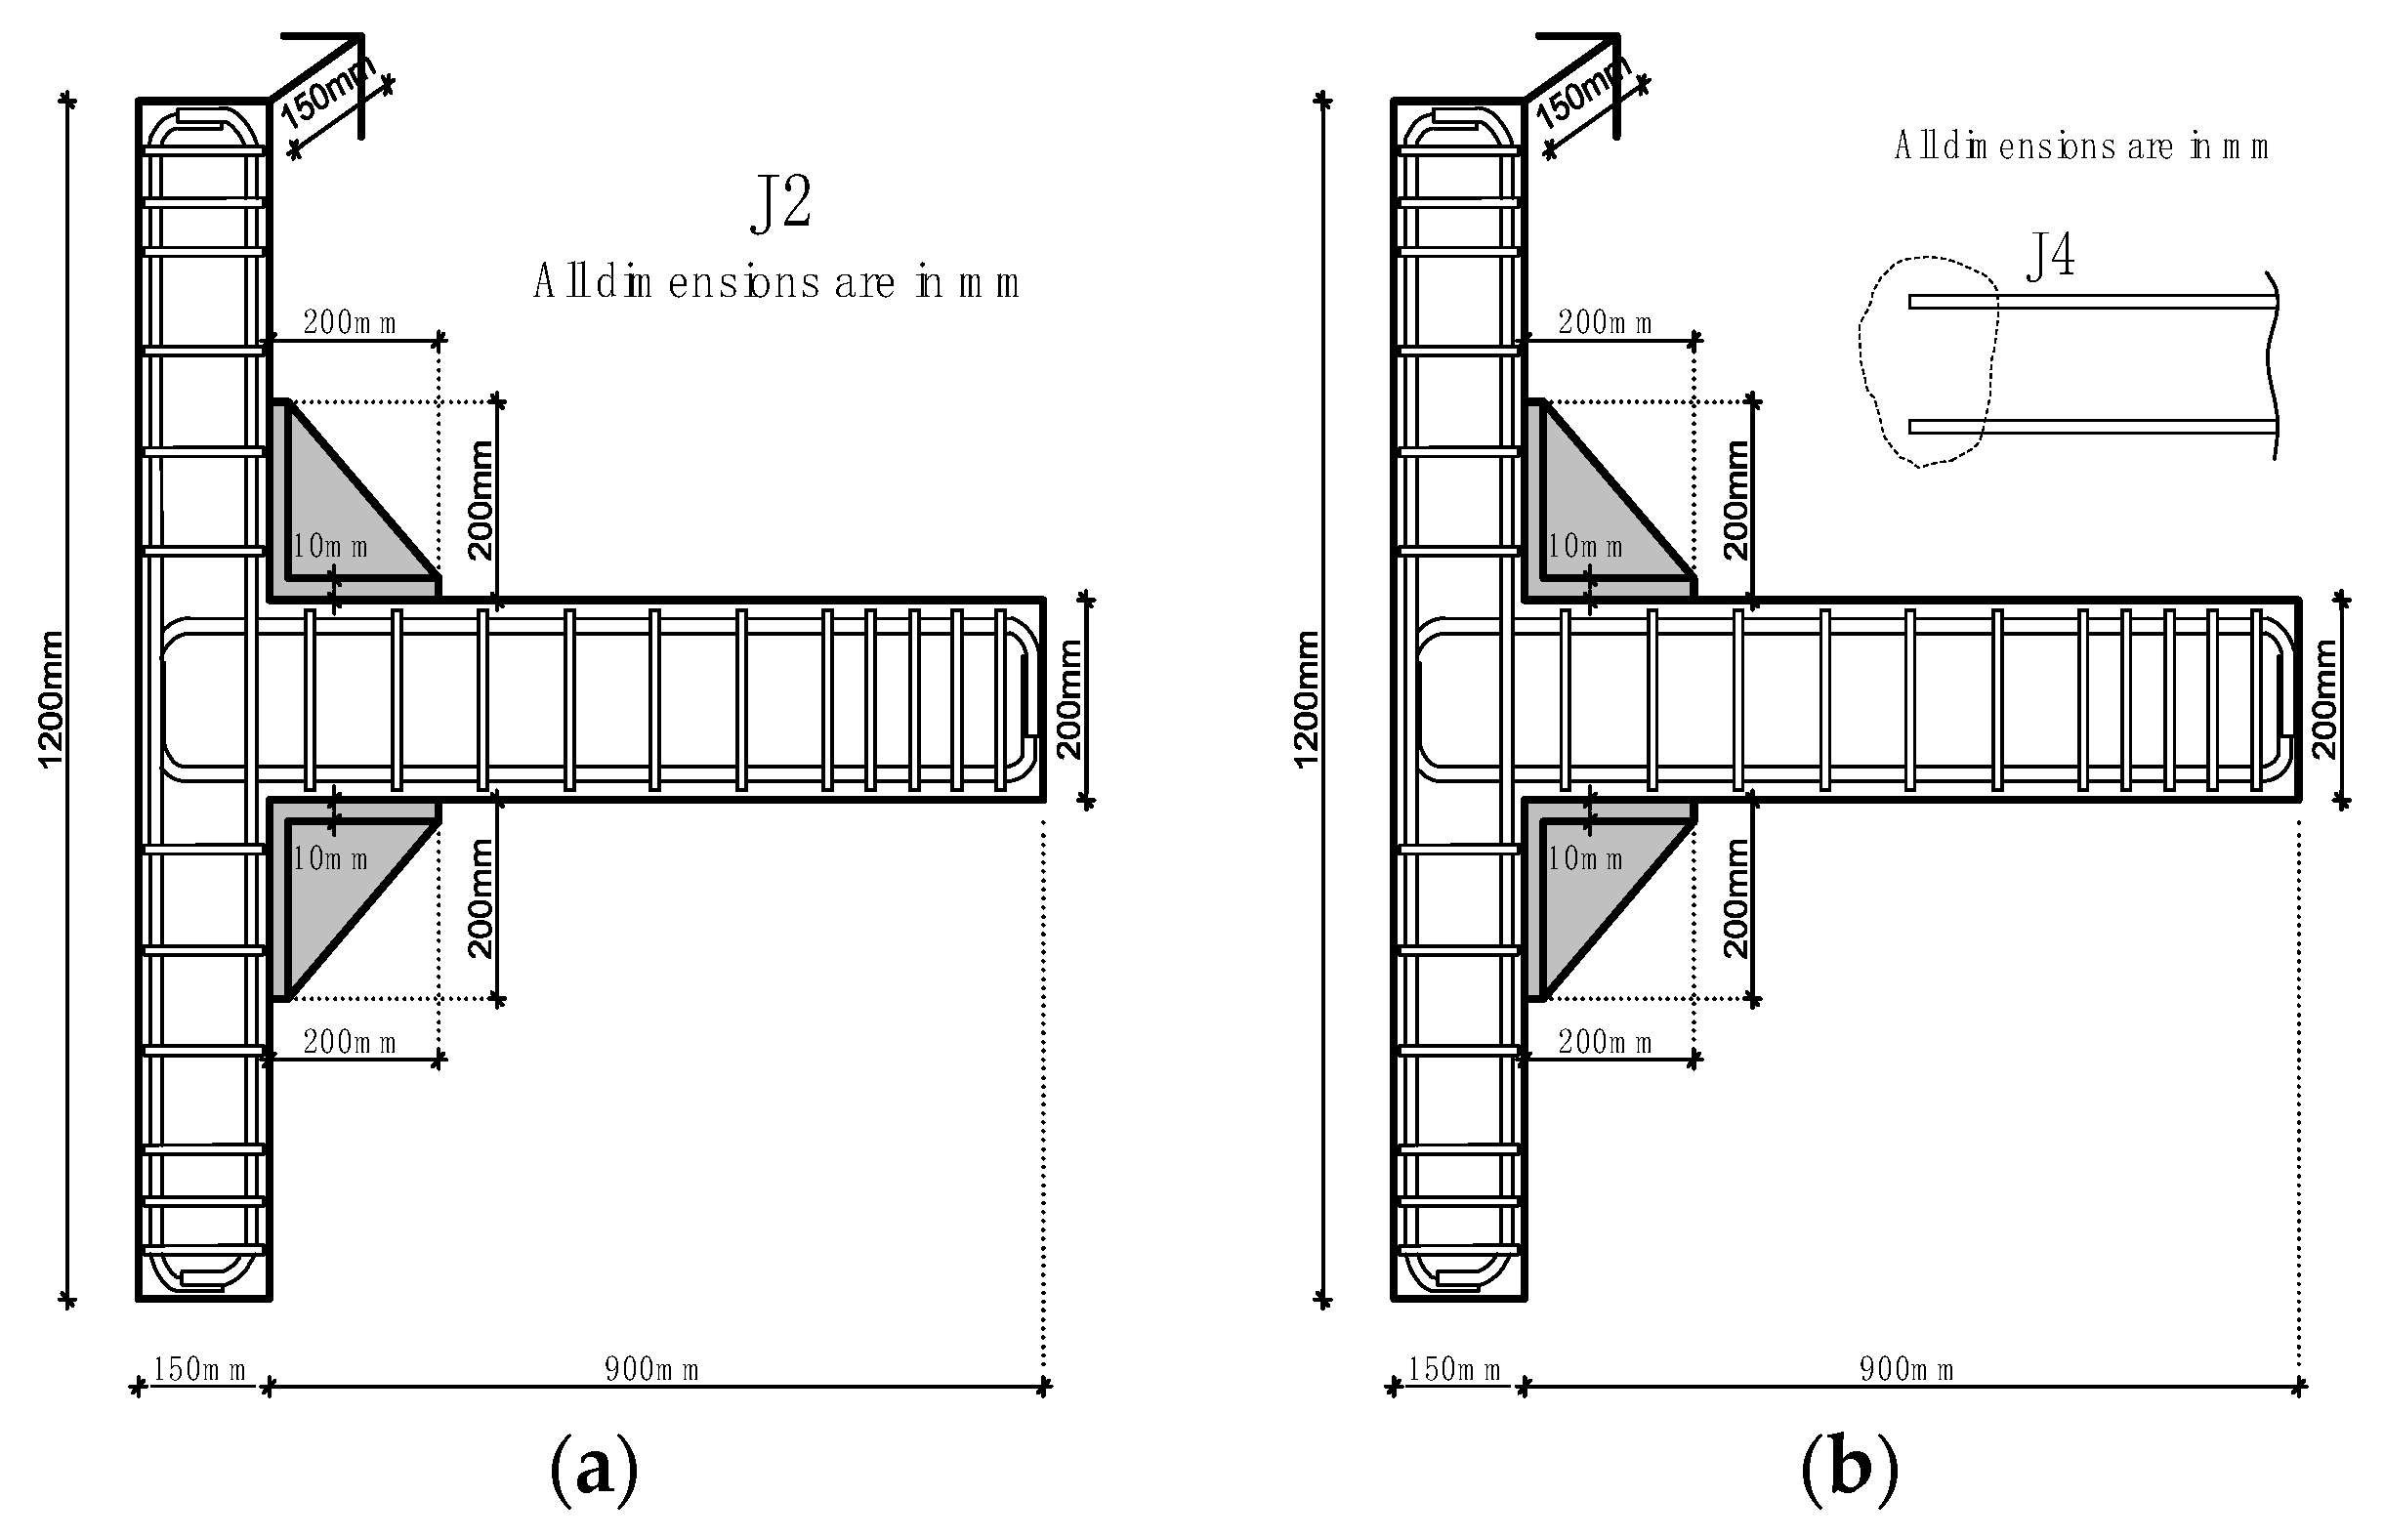
Figure 16.
Ultimate resistance and damage of retrofitted joint J2. (a) Joint resistance based on haunch dimension. (b) Damage of retrofitted joint.
Figure 16.
Ultimate resistance and damage of retrofitted joint J2. (a) Joint resistance based on haunch dimension. (b) Damage of retrofitted joint.
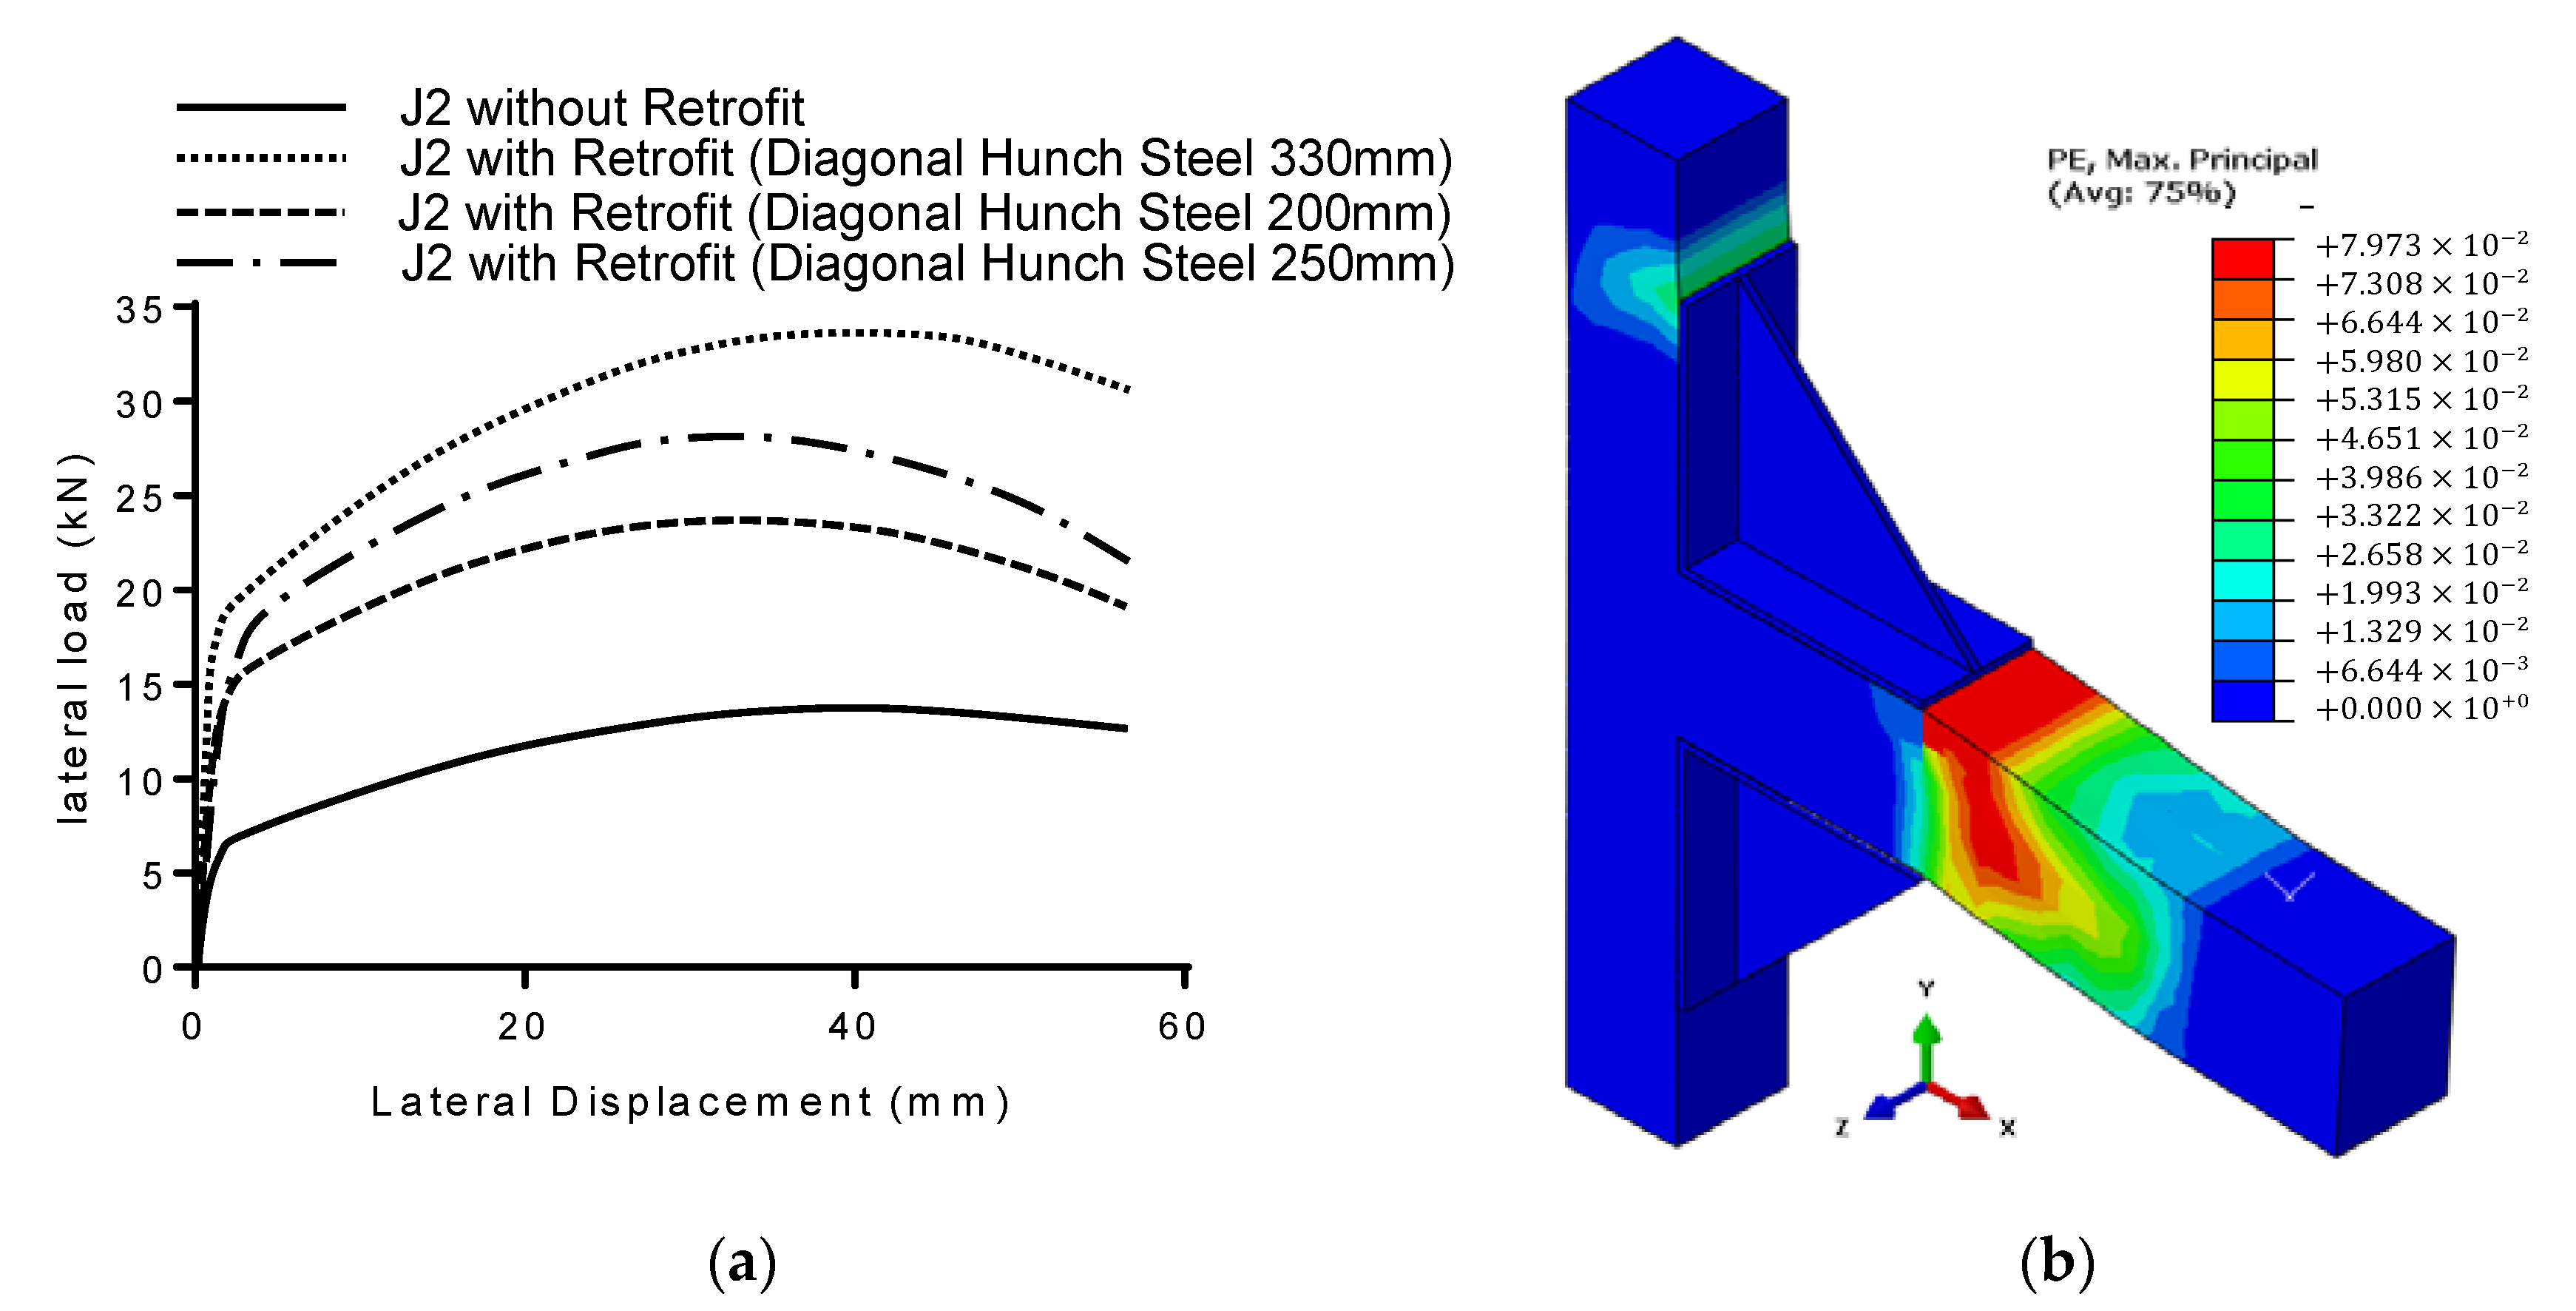
Figure 17.
Ultimate resistance and damage of retrofitted joint J4.(a) Joint J4 with haunch. (b) Damage with 200 mm haunch. (c) Damage with 250 mm haunch.
Figure 17.
Ultimate resistance and damage of retrofitted joint J4.(a) Joint J4 with haunch. (b) Damage with 200 mm haunch. (c) Damage with 250 mm haunch.


Table 1.
CPD model key parameters.
| CPD Parameter | Symbol | Recommended Value |
|---|---|---|
| Dilation angle | Ψ | 30°–45° |
| Shape factor | Kc | 0.667–1 |
| Biaxial stress ratio | 1–1.16 | |
| Eccentricity | 0.1 | |
| Viscosity parameter | 0.0001–0.008 |
Table 2.
Error estimation with GCI.
| Set No. | Element Size (mm) | Model Capacity (kN) | Convergence Order P | GCI12% | GCI23% | GCI23/r p GCI12 |
|---|---|---|---|---|---|---|
| 1st set | 35, 40, 45 | 13.2, 13.3, 13.8 | 12.28 | 0.002366 | 0.0142 | 1.041 |
| 2nd set | 40, 45, 50 | 13.3, 13.8, 13.6 | 7.779 | 0.01166 | 0.03 | 1.03 |
Table 3.
Summary of experimental and numerical findings.
| Results | Joint J1 | Joint J2 | Joint J4 | |||
|---|---|---|---|---|---|---|
| Ultimate Load (kN) | Displacement (mm) | Ultimate Load (kN) | Displacement (mm) | Ultimate Load (kN) | Displacement (mm) | |
| Numerical findings | 13.3 | 56.27 | 9.5 | 56.27 | 5.22 | 9.6 |
| Experimental records | 12.97 | 57.6 | 8.77 | 57.6 | 5.06 | 14.6 |
| Numerical/Experimental | 1.02 | 0.97 | 1.08 | 0.97 | 1.03 | 0.66 |
Publisher’s Note: MDPI stays neutral with regard to jurisdictional claims in published maps and institutional affiliations. |
© 2021 by the authors. Licensee MDPI, Basel, Switzerland. This article is an open access article distributed under the terms and conditions of the Creative Commons Attribution (CC BY) license (https://creativecommons.org/licenses/by/4.0/).
Share and Cite
MDPI and ACS Style
Abdelwahed, B.S.; Kaloop, M.R.; El-Demerdash, W.E. Nonlinear Numerical Assessment of Exterior Beam-Column Connections with Low-Strength Concrete. Buildings 2021, 11, 562. https://doi.org/10.3390/buildings11110562
AMA Style
Abdelwahed BS, Kaloop MR, El-Demerdash WE. Nonlinear Numerical Assessment of Exterior Beam-Column Connections with Low-Strength Concrete. Buildings. 2021; 11(11):562. https://doi.org/10.3390/buildings11110562
Chicago/Turabian StyleAbdelwahed, Basem S., Mosbeh R. Kaloop, and Waleed E. El-Demerdash. 2021. "Nonlinear Numerical Assessment of Exterior Beam-Column Connections with Low-Strength Concrete" Buildings 11, no. 11: 562. https://doi.org/10.3390/buildings11110562
Note that from the first issue of 2016, this journal uses article numbers instead of page numbers. See further details here.