Comparison of Downdraught and Up Draft Passive Air Conduction Systems (PACS) in a Winery Building


1
Energia Design Building Technology Research Group, Szentágothai Research Centre, H-7624 Pécs, Hungary
2
Breuer Marcel Doctoral School, Faculty of Engineering and Information Technology, University of Pécs, H-7624 Pécs, Hungary
3
Department of Mechanical Engineering, Institute of Smart Technology and Engineering, Faculty of Engineering and Information Technology, University of Pécs, H-7624 Pécs, Hungary
4
Department of Building Structures and Energy Design, Institute of Architecture, Faculty of Engineering and Information Technology, University of Pécs, H-7624 Pécs, Hungary
*
Author to whom correspondence should be addressed.
Buildings 2021, 11(6), 259; https://doi.org/10.3390/buildings11060259
Submission received: 12 May 2021
/
Revised: 9 June 2021
/
Accepted: 11 June 2021
/
Published: 17 June 2021
(This article belongs to the Section Building Energy, Physics, Environment, and Systems)
Abstract
:A huge portion of energy consumption in buildings comes from heating, ventilation, and air conditioning. Numerous previous works assessed the potential of natural ventilation compared to mechanical ventilation and proved their justification on the field. Nevertheless, it is a major difficulty to collect enough information from the literature to make decisions between different natural ventilation solutions with a given situation and boundary conditions. The current study tests the passive air conduction system (PACS) variations in the design phase of a medium-sized new winery’s cellar and production hall in Villány, Hungary. A computational fluid dynamics simulation based comparative analysis enabled to determine the differences in updraft (UD) and downdraught (DD) PACS, whereby the latter was found to be more efficient. While the DD PACS performed an air change range of 1.02 h−1 to 5.98 h−1, the UD PACS delivered −0.25 h−1 to 12.82 h−1 air change rate. The ventilation performance of the DD version possessed lower amplitudes, but the distribution was more balanced under different wind incident angles, thus this version was chosen for construction. It could be concluded that the DD PACS provides a more general applicability for natural ventilation in moderate climates and in small to medium scale industry hall domains with one in- and one outlet.
1. Introduction
One of the biggest challenges of the 21st century is to avoid the irreversible rate of global warming, and to restrain the harmful tendencies which are responsible for it. The objective of the Paris Agreement [1] was signed by 195 countries to keep the increase of global average temperature rise below 2 K above pre-industrial levels. In accordance with this goal, the European Union created a Road Map [2] to reduce the greenhouse gas (GHG) emissions by 80% until 2050, compared to the 1990s. However, the global energy consumption raised by over 50% in the last decades, despite the similar ambitions of the previous climate assignments. In addition, the future scenarios show no differences either: in 1998 Schmalansee et al. [3] forecasted in their prognostication at least 200% increase in CO2-emissions between 1990 and 2050. In 2012, Akashi et al. [4] still estimated over 50% increase in the GHG-emissions during the same period.
The built environment is responsible for 20–40% of the global energy consumption [5,6], where the heating, ventilation, and air conditioning (HVAC) system has a share of over 60% [7,8]. Moreover, due to global warming, the cooling energy demand will further expand. Hence, the natural ventilation (NV) techniques should have a more significant role to reduce the buildings’ energy intensity. Beside the energy saving potentials, the Passive Air Conduction Systems (PACS) have advantages to achieve the acceptable indoor air quality (IAQ), contrary to mechanical systems (MV), which are often responsible for the sick building syndrome’s development in many modern buildings [9].
It can be observed from the tendencies, that solely the political alignments and the legal regulations are not sufficient to achieve a sustainable future; therefore, it is needed to pursue and to introduce groundbreaking new technologies, which could even over fulfil the current environmental legislations.
NV options serve obvious solutions in agricultural buildings, since they possess frequently huge single space interiors, where robust design principles work efficiently, and the ‘occupants’—animals and plants—are usually more sensitive to MV. Coelho et al. [10] investigated green houses’ ventilation in Madrid, where different opening configurations were compared. Based on their results, the bigger the opening areas were, the lesser temperature differences developed between indoors and outdoors, which is desirable, because green houses are usually overheated during summer periods. However, this behavior needs to be taken into account, where the internal temperature should be lower than the external. Numerous studies were conducted with huge scale buildings with animals. Tomasello et al. [11] created a validated computational fluid dynamics (CFD) model for future studies of NV optimization. Nosek et al. [12] investigated the impact of atmospheric boundary layer (ABL) in a cattle barn with wind tunnel simulation. Based on their result, the geometries and sizes of openings had the highest impact on the efficiency of natural ventilation, and the heat sources of the cows and other machines were negligible. Rong et al. [13] observed a similar case of a dairy cow building with CFD simulations, concluding that even 60% differences can occur in the air change (ACH), depending on the wind incident angles to the façade openings. They also recognized that the modeling of plant canopy can reduce the air velocities through the opening more than 29%.
There are only a few examples of NV in industrial buildings, though they have similar geometries to agricultural buildings. A thermal buoyancy driven ventilation was assessed by Tanasic et al. [14] in a cardboard mill hall. Fresh air entered the building through the façade and left on top of the roof. Based on their proposal with heat recovery systems, approximately 1140 t CO2 emission could be saved yearly. Kistelegdi and Baranyai [15] appraised the performance of a PACS in a plastics industry hall during the design phase, where they compared four different tower geometries from 12 wind direction in wind tunnel model tests. The best version achieved 210,000 m3/h volume flow rate, which equals 82 h−1 air change rate. Mazzarón and Canas studied in more papers [16,17,18] the thermal behavior of traditional wine cellars with wind chimneys. Typically, the temperature was stable in the underground cellars in summer and winter periods, and the chimneys were suitable to extract the stale air without changing drastically the internal relative humidity or temperature and altering negatively the maturation of wine. These studies provide promising results to design a PACS with wind towers in modern wineries as well.
Bahadori [19] firstly paid scholar attention to the vernacular wind catchers in Iran. These so-called “baud-geers” caught the wind on their top openings and drove it down to the interior, thus securing the fresh air supply and the cooling of the overheated internal structures. Saadatian et al. [20] studied thoroughly the transition of traditional wind towers in the Middle East into modern examples. They concluded that not enough scientific results are available to specify modern wind towers and PACS and their exact geometrical parameters. Hughes et al. [21] investigated the specifications of modern wind towers and after a deep literature review they came to the conclusion that it is hard to compare the different techniques, because usually they are assessed only in relation to MV, without comparing them to each other as well. According to Khan et al. [22] the PACS equipped with wind towers can achieve 300 l/s volume flow rate. If these NV system setups correspond to the required ACH values by the local or e.g., ASHRAE regulations, the PACS can maintain an acceptable IAQ-level. Omrani et al. [23] reviewed the available technologies for aerodynamic studies, whereas CFD simulations turned out as the most cost and time effective option. This fast developing tool is able to provide reliable results, and an adequately detailed model could be also used for comfort level assessments [24].
Wind towers can be divided into two major groups, according to the movement direction of the ventilation air current: updraft (UD) and downdraught (DD) systems. Most of the UD towers’ mechanisms are also based on the thermal buoyancy effects. Takayama et al. [25] presented a museum complex, which was designed from a former factory, where the thermal buoyancy in the old chimney induced the ventilation. This PACS could achieve 3 K cooler temperature than the external summer air temperature of 29 °C. The stack effect can be found in the wind induced UD towers as well, but the wind towers can perform approximately 76% stronger air volume flow rate and therefore the buoyancy is usually more like an emergency option for calm [26]. The UD movement is forced in many cases with help of a ‘Venturi-shaped’ plate on top of the towers. The compressed external wind currents under this ‘Venturi’ objects induce a depression zone, which can extract the air from the tower. Lim et al. [27] optimized the NV of a domestic house in Malaysia with CFD simulations. During their research, they achieved a 14,000 m3/h volume flow rate in a two-story building with approximately 130 m2 floor area. A 20 × 20 × 50 m ‘Venturi’-shaped roof structure was investigated by van Hoff et al. [28] in CFD and wind tunnel tests, whereas they integrated deflector wings into the depression zone. They could not improve ventilation performances, because the deflectors created too high resistance, and the wind was not able to create force under the ‘Venturi’-shaped roof but bypassed it.
On the other side, the operation principle of DD towers is quite simple: the openings are arranged on top of the wind towers or roofs and they face towards to the approaching wind, and the caught fresh air is forced down to the interior. Badran’s [29] research was based on the ancient Jordanian wind catcher. According to his results, above 4 m height there are no significant improvements in the performance of the towers in domestic buildings, compared to the traditional 9 to 15 m towers. Sadeghi et al. [30] ventilated an average medium-density apartment building with DD towers, which could provide in the warmer periods (external temperatures > 23 °C) by 1725 more comfort hours than window openings. Saif et al. [31] improved the IAQ in classrooms with modified wind catchers and have met the ASHRAE requirements under Kuwait’s climate conditions.
The vernacular wind towers frequently combined the two ventilation methods [32,33] with dividing walls in the towers, so on the windward side an over pressure zone forced the fresh air down in and on the leeward side an under pressure zone extracted the stale air out. However, Mohamadabadi et al. [34] showed in their study the flaw of this construction: a short circuit is generated below the tower, so the fresh air almost immediately leaves the interior behind the inlet, without mixing with the interior air.
Currently, the most developed regulations are created by the American Society of Heating, Refrigerating, and Air-Conditioning Engineers (ASHRAE). The ASHRAE 62.1 and 62.2 [35] considers the topic of mechanical and natural ventilation and IAQ. It provides appropriate sizing values for the design of MV systems as well as simple NV systems (e.g., one- or two-sided window ventilation, etc.). However, there exists no calculation or modelling guidance for unconventional complex PACSs. Only simplified, approximated equations, rule of thumb table-data, as well as general calculation and simulation description is provided. A similar legislation created by the European Union, the EN 15251 [36], quantifies the minimum requirements of acceptable ventilation in non-residential buildings. Hungary has its own laws to regulate ventilation designs in buildings as well—the TNM 7/2006 V.24 [37], however it does not contemplate NV. Its new modification will force dwellers to use MV in buildings as well. The EN 15251 legislation was considered in this study because its validity and general applicability in the EU.
The literature review outlines well the need for spreading NV in both agricultural and industrial buildings. A good founding is provided by vernacular tower structures, but in the last decades, the investigations were more focused on the justification of the PACS against MV systems. Currently, their relevance is meanwhile proven, and their application is inevitable because of the global warming and its negative effects. This research became necessary because in the design phase of a new industrial building, it was impossible to collect satisfactory information from the literature to properly create not just a working, but also a specified and precisely scaled NV system in given boundary conditions. It became clear that there is a deficiency in studies concentrating on comparison of different PACS, which could be helpful for architects and engineers to choose the appropriate PACS with optimal parameters for the particular building application. To fill this gap in this paper, a UD and a DD PACS were proposed and juxtaposed in a modern prototype winery.
2. Materials and Methods
2.1. Building and Site
The design of a new winery was started in 2017 in Villány, Hungary (Figure 1). The site is located in the border of the temperate and Mediterranean climate zone; according to the Köppen-Geiger climate classification it is considered as a Cfb—temperate oceanic climate [38]. There was no possibility to perform in situ measurements during the design phase; therefore, the typical weather data was produced by the Meteonorm® database from a five-year average. Because there is no physical weather station in the town, interpolated data was required. The distance weighted interpolation is calculated from the six nearest weather stations with similar latitude and altitude and satellite data by the software itself [39].
Based on the adaptive comfort model calculations of de Dear and Brager [40], an outdoor temperature interval was defined as the first criteria for suitable NV hours during the year from the Meteonorm. The second criteria was the wind speed, because too high air velocity can cause draft effects for occupants, therefore the upper limit was set to 8 m/s. This value is originated from the maintenance experiences of the authors in a very similar PACS in an industrial building, in Hungary [41]. Based on these parameters, 3639 h were found during an average year, being acceptable for NV. Chen and al. [42] found in their simulations 3294 NV compatible operation hours in Düsseldorf, which location possesses the same Köppen-Geiger climate classification and similar altitude than in the site in current study.
The industry section is represented by a traditional cellar and a modern production hall in the building—both subterranean spaces. The ventilation in these two rooms should be solved by PACS. Two different solutions were considered exploiting the wind as resource: a DD and a UD PACS.
On the one side, the PACS of the basement halls should ensure as hygienic IAQ as possible, reflecting today’s modern, high-tech winery requirements. On the other side, the PACS should control the relative humidity and the air temperature in certain wine production technologically preferred internals for as long as possible throughout the year.
In both cases, a UD directed wind tower provides for exhaust airing, under a pyramided roof, which helps to transfer the horizontal winds over the flat roof to the tower opening. The fundamental difference between the two systems is the driving force for the air movement in the interior. In case of the UD PACS, the tower is equipped with a previously described ‘Venturi-plate’ and the formulated depression zone under it is the main wind driven operator. The fresh air is originated from two underground industrial gates on the opposite site of the building (Figure 2a). The updraft tower structure can be found in the DD PACS version also, but the fresh air is delivered by a separated modern wind catcher (Figure 2b). On top of the DD wind catcher a special chimney crown is designed, which operates similar to the traditional ‘baud-geers’. The over pressured zone on the opening of the tower is introducing and forcing down the fresh air to the interior.
Since the modeling of the surrounding (e.g., vegetation, buildings) can significantly affect the aerodynamic circumstances [13,43] two sites were considered, one with two direct neighbors and the other with more neighbor buildings but in further distance, respectively. Here, the scientific opportunity was occurred to investigate the effects of the different neighborhoods on the PACS of the winery under the same weather conditions. The territory is an agricultural area on the boundaries of Villány, where the dwellers usually cultivate grapes, so the vegetation is mainly formulated by linearly organized vineyards, with an average of 2 m heights (Figure 3).
Figure 4 displays the wind speed frequency sorted by the wind incidence angle. The yearly average wind velocity is 2.73 m/s at 10 m height, and it is increased above 5 m/s in less than approximately 15% of the year. The figure shows that the northern and western directions are more frequent (around 60% of the total year). However, leaving out the remaining incident angles from the PACS investigations, approximately 1500 NV compatible operation hours would be lost. In order to provide an effective NV in as much operation hours yearly as possible, an omnidirectional design of PACS was crucial.
In the case of the UD PACS, the symmetrical geometry of the ‘Venturi’-object and the pyramid top opening provides for omnidirectional behavior (Figure 5a). In the DD PACS case, the wind catcher’s chimney crown is equipped with deflectors in line with its diagonals, dividing the cross-section of the tower into four equal segments (Figure 5b). During ventilation, only the actual wind facing segment will be opened, and a building management system (BMS) is required to respond to the changing wind scenarios.
Two adjacent underground rooms were designated for NV operation. The smaller is a one story-high classic cellar with 100 m2 floor area and 331 m3 air volume, where the wine maturing procedure takes place in oak barrels. This traditional winemaking process needs stable relative humidity and temperature; hence the NV will be used under strictly regulated conditions in order to avoid vacillating IAQ and unwanted evaporation or damage of the wine. Airflow control is ensured in the cellar by moving louvres in the lower part of the ventilation tower. There will be no constant working activities, but the room will be opened for guided visitors, because the facility serves as a combined boutique hotel as well. The larger neighbor space is a two-story production hall with irregular cross section, 167 m2 floor area and 906 m3 air volume. There will be constant work through the year and it is also open for the visitors. According to this occupancy behavior, there could be over 30 people at once in this room. According to the EN 15251 [36] regulation, 3.5 L/s/person is the minimal air change rate for an acceptable comfort level in a non-domestic building (the regulation does not concern about industrial buildings, but the occupancy density could be equivalent with e.g., classrooms). In this case, at least 798.84 m3/h volume flow rate (VFR) is necessary, which means 0.882 h−1 ACH in the production hall. The wine processing takes place in closed steel tanks, hence only the human need was considered. The PACS’s role is more significant here, since here the relative humidity and temperature control range is wider than in the cellar, meaning that the production hall can be more frequently naturally ventilated during the year. Therefore, the production hall’s results were crucial to the final decision. The two towers are situated at the opposite end of the hall, and between the two spaces. To prevent stale air mixing or backflow, the UD and the bottom of the DD tower were divided according to the proportion of the volumes of the cellar and the production hall (Figure 6).
In summary, four main sub-models were created: two PACS model versions (UD and DD) were calculated in two different environments. All off the models were ‘blown’ by the wind with eight different incident angles for a detailed understanding of the created systems. In total 32 CFD simulation cases were solved and evaluated.
2.2. Simulations and Model Set Up
The comparison of the two PACS was brought off in a CFD simulation framework. Based on cost and time efficiency, CFD is one of the most widely used tools available for aerodynamic purposes. That is proved by Huang [44], whose scrutiny shows that 70% of the reviewed papers used CFD solvers. His investigation was not limited to NV cases, but according to the results, it can be stated that RNG k-Ω and k-ε models performed best of all cases. Numerous other studies have concluded similar insights [45,46,47]. Coupled indoor-outdoor simulation scenarios were created for the complex understanding of not only the PACS performance but its environmental situation, as its importance was stated by Mohamed et al. [48]. Leaning on the literature and on the authors’ experiences [41], the k-Ω model was chosen to perform the simulations of the described problem. As solver code, the ANSYS® Fluent 17.2 application was used. Simulations reached a steady state after 2000 iterations, thereafter the calculation was modified into transient solutions, whereas 200 additional time step was calculated until it finally converged (1 time step equals 1 s and contains 10 iterations).
The flow volume was discretized by applying a finite volume method (FVM), whereby in the nodes of created cells the solver software computes the physical parameters. Accuracy of the results depends on the well-chosen dimensions of the resulted mesh of FVM. Two steps assure the quality of the generated grid. Firstly, the authors previously worked on a CFD model validation including in situ measurements of an existing building, whereas the gained experiences served as basis for the constructed mesh’s discretization in the current investigation [41]. Table 1 describes the structure of the grid, created with ANSYS® Mesher. The differences between the two cases are coming from the geometrical discrepancies, and it is clear that the current study concerns a smaller domain. The representative cell size decrease rate ranged between 1.5 and 2.5, as the whole domain and the major dimensions as well.
The second pillar of grid’s quality is to define the error range of the created mesh. To prove the validity of the results, the guidelines that were specified by Celik et al. [49] were followed. Their work is based on the Richardson extrapolation, which is widely accepted to evaluate the errors of the discretization. The grid independency test was carried out with three different resolutions, including 2.034, 4.397, and 9.504 million cells, respectively (Figure 7). The fine-grid convergence index was 0.45% and 1.24% for the fine and medium grid. Since the latter discretization has also acceptably low error range, the medium grid was chosen for the simulation to save calculation time. The detailed calculations of the errors are described in the Appendix A.
The 2.73 m/s average wind velocity, taken from the Meteonorm database, pertains to a height of 10 m. Since the air velocity depends on the distance from the ground, the change of velocity can be described with a wind profile, which was generated as a user defined function (UDF) in Ansys® Fluent, based on the works of Balogh et al. [50,51]. The vertical alteration of the wind velocity was not only modified by a general terrain topology on the inlet boundary, but the local terrain differences and their roughness constants were also taken into account.
3. Results
3.1. Scenario Site A—Lower Density, Closer Neighbors
Since no exclusive prevailing wind direction could be identified, and the building’s geometry is asymmetrical, the two PACS versions were simulated under eight wind directions: four parallel and orthogonal to the main axis of the building, and four with 45° rotations, respectively. Firstly, the PACS was investigated on the lower density site with closer neighbors (Site A).
The internal volume flow rate (VFR) is taken as the measuring value of a PACS’s ventilation performance, demonstrating the various ACH-values in wind direction dependency (Figure 8). In both cases (UD and DD), the cellar provides higher ACH, due to the simpler and smaller cross-section and smaller volume.
When the wind hits directly the underground gates without any object in the way (NW), the highest ACH 5.34 h−1 (hall) and 12.82 h−1 (cellar) develop. Unexpectedly, the same effect occurred from the opposite SE direction, 3.18 h−1 (hall) and 7.29 h−1 (cellar), because a separation zone is formed at the leeward side of the building, generating a back flow towards to the gates (Figure 9).
Figure 10 shows the formulated air patterns in and around the winery with UD PACS. In case of the 45° incident wind angles, the UD PACS deliver an approximated performance between the two amplitudes—between 1.09 h−1 and 2.96 h−1 (hall) and 2.49 h−1 and 8.17 h−1 (cellar). However, the UD system works at highest efficiency only in incident wind angle parallel to the connecting axis of the UD tower and the inlet openings, while at the two orthogonal direction (SW and NE) it performed poorly: −0.25 h−1 and 0.52 h−1 (hall) and 1.36 h−1 and 0.77 h−1 (cellar), respectively. Negative value means that the flow direction in the wind tower turned backward (SW direction), showing very low ventilation efficiency. The main reason for that is the disadvantageous low-pressure zone at the NW end of the building, created by the wind current that bypasses the underground inlet gates, and creates a suction over it, similar to the ‘Venturi’ plate’s effect, but with opposite force (Figure 10b). The more the incident angle of the wind decreases to the longitudinal axis of the building, the more this disadvantageous under pressure zone is weakened and the ventilation efficiency increases (Figure 8). Since the technology hall possesses a 2.74 times larger indoor volume, the achieved ACH rates are approximately 52% lower than in the cellar.
Figure 11 demonstrates the air pattern characteristics in and around the winery with DD PACS. This version obtained between 1.04 h−1 to 3.45 h−1 ACH (hall) and 1.02 h−1 to 5.98 h−1 (cellar) ACH performances, respectively, with more evenly distributed values, meaning that this system is more independent from the wind directions. Although the highest value is only 64% of the highest result in UD circumstances, there are no extreme ACH minimums. In contrast to the UD, every direction can achieve the required 0.882 h−1, in which ACH was determined by the EN 15251 legislation.
3.2. Scenario Site B—Higher Density, Further Neighbors
During the second experiment, the PACS was investigated with further and more neighbors. All other boundary conditions remained identical to the case in Scenario Site A. Figure 12 displays the air change rates of the two PACS system with the new conditions. The previously obtained ventilation character (Scenario Site A) is recognizable in these cases as well. The UD version is still very effective in the two parallel wind directions (NE and SW) with 4.11 h−1 and 3.73 h−1 (hall), and 6.72 h−1 and 4.98 h−1 (cellar), respectively. While the two orthogonal directions (SE and NW) create a mixed suction effect, where 1.54 h−1 and 0.08 h−1 (hall) and 3.41 h−1 and 2.56 h−1 (cellar) is obtained, respectively. In SW and NE directions, the missing proximate neighbors had a ventilation amplifier consequence in the previous case (Site A), while in SE and NW directions this has the opposite effect.
DD version is still a more reliable wind direction independent system with consistent values, and can maintain a good IAQ with fresh air in this industrial facility. The developed ACH is between 1.27 h−1 and 5.06 h−1 (hall) 2.75 h−1 and 6.99 h−1 (cellar), which is slightly better performance, than that in the former scenario (Site A), and it suggests that few, but very close, objects can influence the NV performance more poorly than a dense built environment in greater distance. The obtained results in the DD are in compliance to ACH requirement of EN 15251 code as well.
4. Discussion
Previous works validate the acceptability of the NV options comparing with MV. While most available literature report about wind tower investigations in hot and arid climates [19,29,31], particular studies could prove that these NV solutions work in the moderate climate as well and they are able to achieve required ACH levels, as is stated in numerous research [21,22,27,41,52] supporting the spread of PACS.
The UD PACS system performs as a wind direction dependent system, because of the high amplitudes in the ACH. Therefore, it acts more like a uni- or bidirectional solution. It is recommended as a perfect solution for (micro)climate circumstances where prevailing wind directions rule for instance. In contrast, the wind independent DD wind catcher opening can ensure the design of an omnidirectional and efficient PACS. Due to the advantageous, wind exposed installation on the rooftop the inlet structure is able to deflect fresh air into the interior in all incident wind directions (Figure 5). The separation of the UD outlet and the DD inlet delivers great advantage compared to combined in- and outlet PACS, as the latter version can cause ventilation shortcut issues between in- and outlet [34]. The UD system provided an approximately 52% difference in the ACH performance between cellar and hall, this ACH difference shrinks to 26% in the case of DD. This means that the DD system ventilation works more independently from the size of the indoor ventilated space volume. The presented comparison of UD and DD systems is a gap filling contribution in current literature about natural ventilation systems.
In the case of dense neighborhood in greater distance (Site B), both UD and DD PACS perform stronger than in Site A (lower neighborhood density in closer distance) in the cellar and hall spaces, showing that proximity of neighbor buildings and objects—even in weaker density—can influence the ventilation rates. These results correlate with previous works [13,43,53], examining and proving significant effects of neighbor objects on the NV performance.
Limitations
The CFD models were created to evaluate and compare the ventilation performance of two PACS and gain general insights about their behavior compared to each other. Due to the fact that the facility’s spaces are non-constantly occupied, model discretization was not optimized for indoor air quality estimation. Therefore, the internal fresh air distribution may be not satisfactory in all scenarios. Because of the same reasons, temperature and humidity were also not considered, although it is stated that for wine making these two factors are not negligible, especially in the traditional cellar. These IAQ performances will be incorporated in the next CFD investigation steps, complemented by time dependent temperature and humidity based opening control studies using thermal simulations. The main concept of this particular study was to satisfy the requirement for as high as possible volume flow rate, hence the highest day and night ventilation efficacy. In case of short, temporary time intervals, during which high ACH is not desired (e.g., harvest season or IAQ controlled time periods), it is possible to reduce the performance with adjustable dampeners.
5. Conclusions
Though in scientific studies multiple valid building NV solutions results were obtained about their effective accomplishments, most of the recent studies usually juxtapose NV with MV systems. In contrast, this paper compared the performance of two different integrated PACS in one building: a UD and a DD system. Subtracted from the results of the two series of simulation under different locations, the following consequences can be concluded:
It has been revealed that in regions without a prevailing wind microclimate, the DD PACS method works as the more reliable option, because it performs a more balanced ventilation efficiency independently from the wind direction. The UD version is even more effective than the DD but only in wind direction dependent situations when the approaching wind comes parallel to the connecting axis of the outlet (tower) and the inlet (underground industrial gates).
The main mechanic behind the difference between the two PACS is the wind direction independency of the inlets, whereas the inlet of the DD system profits from its wind exposure to the incident currents. While the downdraught air direction based passive air conduction system’s ventilation is empowered by both divided and wind direction related opening-controlled inlet tower as well as the buoyancy and wind suction driven outlet ‘Venturi’-tower, the UD PACS’ ventilation mechanism is only maintained by the outlet ‘Venturi’-tower in most of the wind direction cases. High ACH rate is only achieved in UD PACS, when the approaching wind have direct access to the inlet, meaning that the ventilation is driven by the overpressure at the inlet and the under pressure at the outlet. This is the case as well when the wind direction is opposite to the previously case and parallel to the inlet–outlet connection axis, and hence the ventilation is driven by the under pressure at the outlet and the suction effect at the inlet.
Based on the above-mentioned information, the DD PACS can perform reliable air change rates independently from the incident wind angle, hence it can be named as an omnidirectional method. Consequently, a UD PACS can be named as a bidirectional method.
Fewer but closer neighborhood, including blunt objects, have stronger negative effect on a PACS ventilation efficiency behavior than a denser but farther built environment.
This research’s goal was to provide a guide for engineers, who are aware of this fact, and want to design a specified PACS optimized to the location’s boundaries.
6. Outlook
Due to the lack of PACS variation assessments in literature, it can be stated that not only the different NV systems need more evaluation, but also the optimization of a chosen method is also difficult, because of the lack of appropriate quantity and quality of results. Therefore, in future studies it would be rewarding to investigate different aspects of individual PACS with a parametric method to obtain the optimum version(s) of all feasible designs. Possible parameters are, for instance, geometrical variations of the inlets and outlets, the ‘Venturi’-objects or the inlet chimney crowns—e.g., height, cross-section, shape, number, arrangement, and the relative positions to each other, etc., such as in the work of Nejat et al. [54] about the effect of wing wall parameters on a wind catcher. In the next step of this series of investigation, the wind tower and wind catcher geometries will be tested through a comprehensive parametric method (Figure 13). Sakiyama et al. [55] presented a similar approach for NV evaluation with CFD.
Since a PACS should not only produce as much fresh air as possible but needs to ensure other comfort aspects also, further factors such as humidity and temperature should be considered in future studies as well (see Limitations section). Another interesting investigation scenario would be to combine the used PACS with an evaporative cooling system, representing a financially and technically sustainable solution, as is stated in Soltani et al.’s work [56]. Ghoulem et al. [57] worked on greenhouses, including a downdraught evaporative system, achieving up to 13.3 °C cooling effect in a hot and dry climate. By substantiating the obtained and concluded knowledge, a new guideline should be written from the experiences for architects and NV designers in the future.
Author Contributions
Conceptualization, Á.L.K., I.E.H. and I.K.; methodology, Á.L.K. and I.K.; software, Á.L.K., I.E.H. and I.K.; validation, Á.L.K. and I.K.; formal analysis, Á.L.K. and I.K.; investigation, Á.L.K., I.E.H. and I.K.; resources, Á.L.K. and I.K.; data curation, Á.L.K. and I.K.; writing—original draft preparation, Á.L.K.; writing—review and editing, Á.L.K., I.E.H. and I.K.; visualization, Á.L.K.; supervision, I.E.H. and I.K.; project administration, I.K.; funding acquisition, I.K. All authors have read and agreed to the published version of the manuscript.
Funding
The research was supported by the ÚNKP-20-3-II-PTE-682 new National Excellence Program of the Ministry for Innovation and Technology from the source of the national research, development and innovation fund and by the Thematic Excellence Program 2020—National Excellence Sub-program of the Ministry for Innovation and Technology in Hungary.
Conflicts of Interest
The authors declare no conflict of interest.
Appendix A
The fine grid convergence-index was calculated by the guidelines of Celik et al. [49]. In their work they presented a step by step method for evaluation of the reliability of CFD simulations’ finite grid. The following steps and calculations were proceeded.
Step 1
Step 2
The refinement factor is described by the following, and the value should be at least 1.3 based on experiments.
Step 3
Apparent order p is calculated as follows:
where because and is identical, as it is clarified by Celik. And where
Step 4
Extrapolated value was calculated:
Step 5
Following error estimates were calculated with the apparent order p
approximate relative error
extrapolated relative error
fine-grid convergence index
Table A1 presents the results obtained during the estimation of the uncertainty of the generated grids.

Table A1.
Results from the reliability calculations of the generated grids.
| Variable | Grid 3 (Coarse) | Grid 2 (Medium) | Grid 1 (Fine) | |
|---|---|---|---|---|
| N—number of elements | 2,033,824 | 4,396,469 | 9,503,743 | |
| V—volume of the mesh [m3] | 3,196,074 | 3,196,074 | 3,196,074 | |
| —volume flow rate [m3/h] (total) | 3.29 | 3.23 | 3.21 | |
| h—representative cell size [m] | 1.163 | 0.899 | 0.685 | |
| Grid 3 Related to Grid 2 | Grid 2 Related to Grid 1 | |||
| r—refinement factor | 1.293 | |||
| p—apparent order | 3.980 | |||
| —extrapolated value | 3.198 | |||
| —approximate relative error | 1.76% | 0.64% | ||
| eext—extrapolated relative error | 1.00% | 0.36% | ||
| —fine-grid convergence index | 1.24% | 0.45% | ||
References
- United Nations Framwork Convention on Climate Change: Report of the Conference of the Parties on its Twenty-First Session, held in Paris from 30 November to 13 December 2015. Available online: http://unfcc.int/resource/docs/cop21/eng/10.pdf (accessed on 16 June 2021).
- European Comission. A Roadmap for Moving to a Competitive Low Carbon Economy in 2050. Available online: http://eur-lex.europa.eu/LexUriServ/LexUriServ.do?uri=COM:2011:0112:FIN:EN:PDF (accessed on 16 June 2021).
- Schmalensee, R.; Stoker, T.M.; Judson, R.A. World carbon dioxide emissions: 1950–2050. Rev. Econ. Stat. 1998, 80, 15–27. [Google Scholar] [CrossRef]
- Akashi, O.; Hijioka, Y.; Masui, T.; Hanaoka, T.; Kainuma, M. GHG emission scenarios in Asia and the world: The key technologies for significant reduction. Energy Econ. 2012, 34, S346–S358. [Google Scholar] [CrossRef]
- Pérez-Lombard, L.; Ortiz, J.; Pout, C. A review on buildings energy consumption information. Energy Build. 2008, 40, 394–398. [Google Scholar] [CrossRef]
- Hamdy, M.; Hasan, A.; Siren, K. Applying a multi-objective optimization approach for Design of low-emission cost-effective dwellings. Build. Environ. 2011, 46, 109–123. [Google Scholar] [CrossRef]
- Aflaki, A.; Mahyuddin, N.; Mahmoud, Z.A.-C.; Baharum, M.R. A review on natural ventilation applications through building façade components and ventilation openings in tropical climates. Energy Build. 2015, 101, 153–162. [Google Scholar] [CrossRef]
- Chenari, B.; Dias Carrilho, J.; Gameiro Da Silva, M. Towards sustainable, energy-efficient and healthy ventilation strategies in buildings: A review. Renew. Sustain. Energy Rev. 2016, 59, 1426–1447. [Google Scholar] [CrossRef]
- U.S. Environmental Protection Agency. The EPA Cost of Illness Handbook; U.S. Environmental Protection Agency: Washington, DC, USA, 2007. Available online: http://nepis.epa.gov/Exe/ZyPURL.cgi?Dockey=901A0E00.txt (accessed on 16 June 2021).
- Coelho, M.; Baptista, F.; Fitas Da Cruz, V. Comparison of four natural ventilation systems in a Mediterranean greenhouse. Acta Hortic. 2006, 719, 157–164. [Google Scholar] [CrossRef] [Green Version]
- Tomasello, N.; Valenti, F.; Cascone, G.; Porto, S.M.C. Development of a CFD model to simulate natural ventilation in a semi-open free-stall barn for dairy cows. Buildings 2019, 9, 183. [Google Scholar] [CrossRef] [Green Version]
- Nosek, Š.; Kluková, Z.; Jakubcová, M.; Yi, Q.; Janke, D.; Demeyer, P.; Jaňour, Z. The impact of atmospheric boundary layer, opening configuration and presence of animals on the ventilation of a cattle barn. J. Wind Eng. Ind. Aerodyn. 2020, 201. [Google Scholar] [CrossRef]
- Rong, L.; Liu, D.; Pedersen, E.F.; Zhang, G. The effect of wind speed and direction and surrounding maize on hybrid ventilation in a dairy cow building in Denmark. Energy Build. 2014, 86, 25–34. [Google Scholar] [CrossRef]
- Tanasić, N.; Jankes, G.; Skistad, H. Cfd analysis and airflow measurements to approach large industrial halls energy efficiency: A case study of a cardboard mill hall. Energy Build. 2011, 43, 1200–1206. [Google Scholar] [CrossRef]
- Kistelegdi, I.; Baranyai, B. Windkanaluntersuchungen zwecks Quantifizierung und Validierung der Wirkung von Windinduktion und thermischen Auftriebskräften auf die natürliche Lüftung eines industriellen Innovationszentrums. Bauphysik 2012, 34, 229–237. [Google Scholar] [CrossRef]
- Cañas, I.; Mazarrón, F.R. The effect of traditional wind vents called zarceras on the hygrothermal behaviour of underground wine cellars in Spain. Build. Environ. 2009, 44, 1818–1826. [Google Scholar] [CrossRef]
- Mazarrón, F.R.; Porras-Amores, C.; Cid-Falceto, J.; Cañas, I. Natural ventilation in underground wine cellars. In Proceedings of the International Conference on Agricultura Engineering, Valencia, Spain, 8–12 July 2012; pp. 1–5. [Google Scholar]
- Mazarrón, F.R.; Porras-Amores, C.; Cañas-Guerrero, I. Annual evolution of the natural ventilation in an underground construction: Influence of the access tunnel and the ventilation chimney. Tunn. Undergr. Space Technol. 2015, 49, 188–198. [Google Scholar] [CrossRef]
- Bahadori, M.N. Passive Cooling Systems in Iranian Architecture. Sci. Am. 1978, 238, 144–154. [Google Scholar] [CrossRef]
- Saadatian, O.; Haw, L.C.; Sopian, K.; Sulaiman, M.Y. Review of windcatcher technologies. Renew. Sustain. Energy Rev. 2012, 16, 1477–1495. [Google Scholar] [CrossRef]
- Hughes, B.R.; Calautit, J.K.; Ghani, S.A. The development of commercial wind towers for natural ventilation: A review. Appl. Energy 2012, 92, 606–627. [Google Scholar] [CrossRef]
- Khan, N.; Su, Y.; Riffat, S.B. A review on wind driven ventilation techniques. Energy Build. 2008, 40, 1586–1604. [Google Scholar] [CrossRef]
- Omrani, S.; Garcia-Hansen, V.; Capra, B.; Drogemuller, R. Natural ventilation in multi-storey buildings: Design process and review of evaluation tools. Build. Environ. 2017, 116, 182–194. [Google Scholar] [CrossRef] [Green Version]
- Jomehzadeh, F.; Nejat, P.; Kaiser, J.; Badruddin, M.; Yusof, M.; Ahmad, S.; Richard, B.; Noor, M.; Muhammad, W. A review on windcatcher for passive cooling and natural ventilation in buildings, Part 1: Indoor air quality and thermal comfort assessment. Renew. Sustain. Energy Rev. 2017, 70, 736–756. [Google Scholar] [CrossRef]
- Takayama, A.; Asano, K.; Shuchi, S.; Hasegawa, K. Study on reusing abandoned chimneys as solar chimneys to induce breeze in residential areas. In Proceedings of the PLEA2009—26th Conference on Passive and Low Energy Architecture, Quebec City, QC, Canada, 22–24 June 2009. [Google Scholar]
- Hughes, B.R.; Mak, C.M. A study of wind and buoyancy driven flows through commercial wind towers. Energy Build. 2011, 43, 1784–1791. [Google Scholar] [CrossRef]
- Lim, C.H.; Omidreza, S.; Sopian, K.; Yusof Sulaiman, M.; Mat, S.; Salleh, E.; Ng, K.C. Design configurations analysis of wind-induced natural ventilation tower in hot humid climate using computational fluid dynamics. Int. J. Low-Carbon Technol. 2015, 10, 332–346. [Google Scholar] [CrossRef] [Green Version]
- van Hooff, T.; Blocken, B.; Aanen, L.; Bronsema, B. A venturi-shaped roof for wind-induced natural ventilation of buildings: Wind tunnel and CFD evaluation of different design configurations. Build. Environ. 2011, 46, 1797–1807. [Google Scholar] [CrossRef] [Green Version]
- Badran, A.A. Performance of cool towers under various climates in Jordan. Energy Build. 2003, 35, 1031–1035. [Google Scholar] [CrossRef]
- Sadeghi, M.; De Dear, R.; Samali, B.; Wood, G. Optimization of Wind Tower Cooling Performance: A Wind Tunnel Study of Indoor Air Movement and Thermal Comfort. Procedia Eng. 2016, 180, 611–620. [Google Scholar] [CrossRef]
- Saif, J.; Wright, A.; Khattak, S.; Elfadli, K. Keeping cool in the desert: Using wind catchers for improved thermal comfort and indoor air quality at half the energy. Buildings 2021, 11, 100. [Google Scholar] [CrossRef]
- Bahadori, M.N.; Pakzad, A.R. Performance evaluation of new designs of wind towers. In Proceedings of the American Society of Mechanical Engineers, Fluids Engineering Division, Montreal, QC, Canada, 4–18 July 2002; Volume 257, pp. 1015–1022. [Google Scholar]
- Hedayat, Z.; Belmans, B.; Ayatollahi, M.H.; Wouters, I.; Descamps, F. Performance assessment of ancient wind catchers—An experimental and analytical study. Energy Procedia 2015, 78, 2578–2583. [Google Scholar] [CrossRef] [Green Version]
- Mohamadabadi, H.D.; Dehghan, A.A.; Ghanbaran, A.H.; Movahedi, A.; Mohamadabadi, A.D. Numerical and experimental performance analysis of a four-sided wind tower adjoining parlor and courtyard at different wind incident angles. Energy Build. 2018, 172, 525–536. [Google Scholar] [CrossRef]
- American Society of Heating Refrigerating and Air-conditioning Engineers. ASHRAE Standard 62.1-2019—Ventilation for Acceptable Indoor Air Quality; ASHRAE Bookstore: Atlanta, GA, USA, 2019. [Google Scholar]
- European Committee for Standardizatoin. EN 15251:2007—Indoor Environmental Input Parameters for Design and Assessment of Energy Performance of Buildings Addressing Indoor Air Quality, Thermal Environment, Lighting and Acoustics. Available online: http://standards.iteh.ai/catalog/standards/cen/p92485123-bf64-40e3-9387-9724a642eae8/en-15251-2007 (accessed on 16 June 2021).
- Hungarian Ministry for Innovation and Technology. 7/2006. (V.24.) TNM rendelet–Az Épületek Energetikai Jellemzőinek Meghatározásáról. Available online: http://net.jogtar.hu/jogszabaly?docid=a0600007.tnm (accessed on 16 June 2021).
- Beck, H.E.; Zimmermann, N.E.; McVicar, T.R.; Vergopolan, N.; Berg, A.; Wood, E.F. Present and future köppen-geiger climate classification maps at 1-km resolution. Sci. Data 2018, 5, 180214. [Google Scholar] [CrossRef] [Green Version]
- Remund, J. Accuracy of Meteonorm.–User Manual-2015. Available online: www.meteonorm.com/assets/publications/Accuracy_of_Meteonorm_7.pdf (accessed on 16 June 2021).
- de Dear, R.J.; Brager, G.S. Developing an adaptive model of thermal comfort and preference. ASHRAE Trans. 1998, 104, 1–18. [Google Scholar] [CrossRef] [Green Version]
- Katona, Á.L.; Xuan, H.; Elhadad, S.; Kistelegdi, I.; Háber, I.E. High-Resolution CFD and In-Situ Monitoring Based Validation of an Industrial Passive Air Conduction System (PACS). Energies 2020, 13, 3157. [Google Scholar] [CrossRef]
- Chen, Y.; Tong, Z.; Malkawi, A. Investigating natural ventilation potentials across the globe: Regional and climatic variations. Build. Environ. 2017, 122, 386–396. [Google Scholar] [CrossRef]
- Hosseinzadeh, A.; Keshmiri, A. Computational simulation of wind microclimate in complex urban models and mitigation using trees. Buildings 2021, 11, 112. [Google Scholar] [CrossRef]
- Huang, H.; Ooka, R.; Chen, H.; Kato, S. Optimum design for smoke-control system in buildings considering robustness using CFD and Genetic Algorithms. Build. Environ. 2009, 44, 2218–2227. [Google Scholar] [CrossRef]
- Kuznik, F.; Rusaouën, G.; Brau, J. Experimental and numerical study of a full scale ventilated enclosure: Comparison of four two equations closure turbulence models. Build. Environ. 2007, 42, 1043–1053. [Google Scholar] [CrossRef]
- Rohdin, P.; Moshfegh, B. Numerical predictions of indoor climate in large industrial premises. A comparison between different k-ε models supported by field measurements. Build. Environ. 2007, 42, 3872–3882. [Google Scholar] [CrossRef]
- Zhao, L.; Wang, X.; Zhang, Y.; Riskowski, G.L. Analysis of airflow in a full-scale room with non-isothermal jet ventilation using PTV techniques. ASHRAE Trans. 2007, 113, 414–425. [Google Scholar]
- Mohamed, M.F.; King, S.; Behnia, M.; Prasad, D. Coupled outdoor and indoor airflow prediction for buildings using Computational Fluid Dynamics (CFD). Buildings 2013, 3, 399–421. [Google Scholar] [CrossRef] [Green Version]
- Celik, I.B.; Ghia, U.; Roache, P.J.; Freitas, C.J.; Coleman, H.; Raad, P.E. Procedure for estimation and reporting of uncertainty due to discretization in CFD applications. J. Fluids Eng. Trans. ASME 2008, 130. [Google Scholar] [CrossRef] [Green Version]
- Balogh, M.; Parente, A.; Benocci, C. RANS simulation of ABL flow over complex terrains applying an Enhanced k-ε model and wall function formulation: Implementation and comparison for fluent and OpenFOAM. J. Wind Eng. Ind. Aerodyn. 2012, 104–106, 360–368. [Google Scholar] [CrossRef]
- Balogh, M.; Parente, A. Realistic boundary conditions for the simulation of atmospheric boundary layer flows using an improved k-ε model. J. Wind Eng. Ind. Aerodyn. 2015, 144, 183–190. [Google Scholar] [CrossRef]
- Cheng, J.; Qi, D.; Katal, A.; Wang, L.; Stathopoulos, T. Evaluating wind-driven natural ventilation potential for early building design. J. Wind Eng. Ind. Aerodyn. 2018, 182, 160–169. [Google Scholar] [CrossRef]
- Javanroodi, K.; Mahdavinejad, M.; Nik, V.M. Impacts of urban morphology on reducing cooling load and increasing ventilation potential in hot-arid climate. Appl. Energy 2018, 231, 714–746. [Google Scholar] [CrossRef]
- Nejat, P.; Jomehzadeh, F.; Hussen, H.M.; Calautit, J.K.; Abd Majid, M.Z. Application of wind as a renewable energy source for passive cooling through windcatchers integrated with wing walls. Energies 2018, 11, 2536. [Google Scholar] [CrossRef] [Green Version]
- Sakiyama, N.R.M.; Frick, J.; Bejat, T.; Garrecht, H. Using CFD to Evaluate Natural Ventilation through a 3D Parametric Modeling Approach. Energies 2021, 14, 2197. [Google Scholar] [CrossRef]
- Soltani, M.; Dehghani-Sanij, A.; Sayadnia, A.; Kashkooli, F.M.; Gharali, K.; Mahbaz, S.; Dusseault, M.B. Investigation of airflow patterns in a new design of wind tower with awetted surface. Energies 2018, 11, 1100. [Google Scholar] [CrossRef] [Green Version]
- Ghoulem, M.; El Moueddeb, K.; Nehdi, E.; Zhong, F.; Calautit, J. Design of a passive downdraught evaporative cooling windcatcher (PDEC-WC) system for greenhouses in hot climates. Energies 2020, 13, 2934. [Google Scholar] [CrossRef]
Figure 1.
(a) Design visualization rendering and (b) the final building under construction.
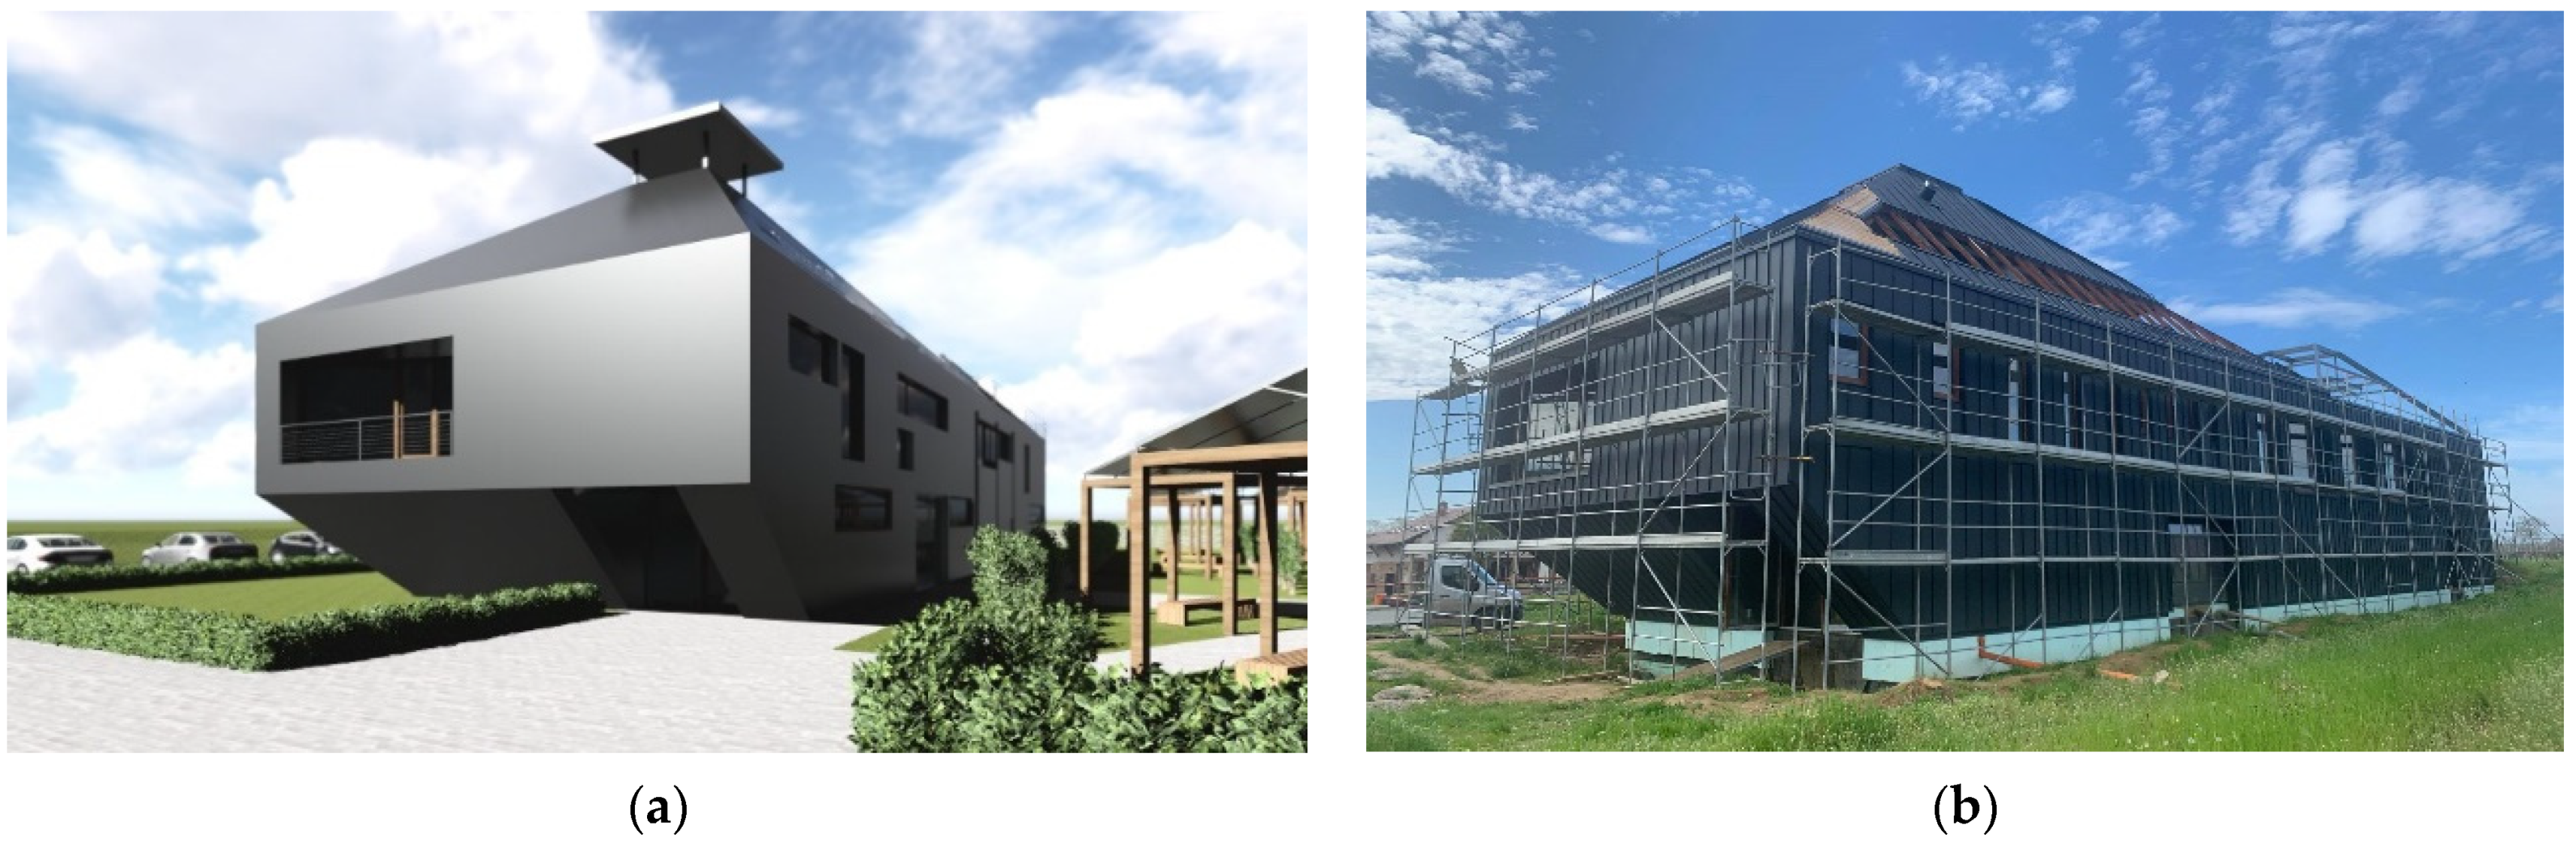
Figure 2.
The two investigated PACS method: (a) updraft (UD) and (b) down drought (DD).
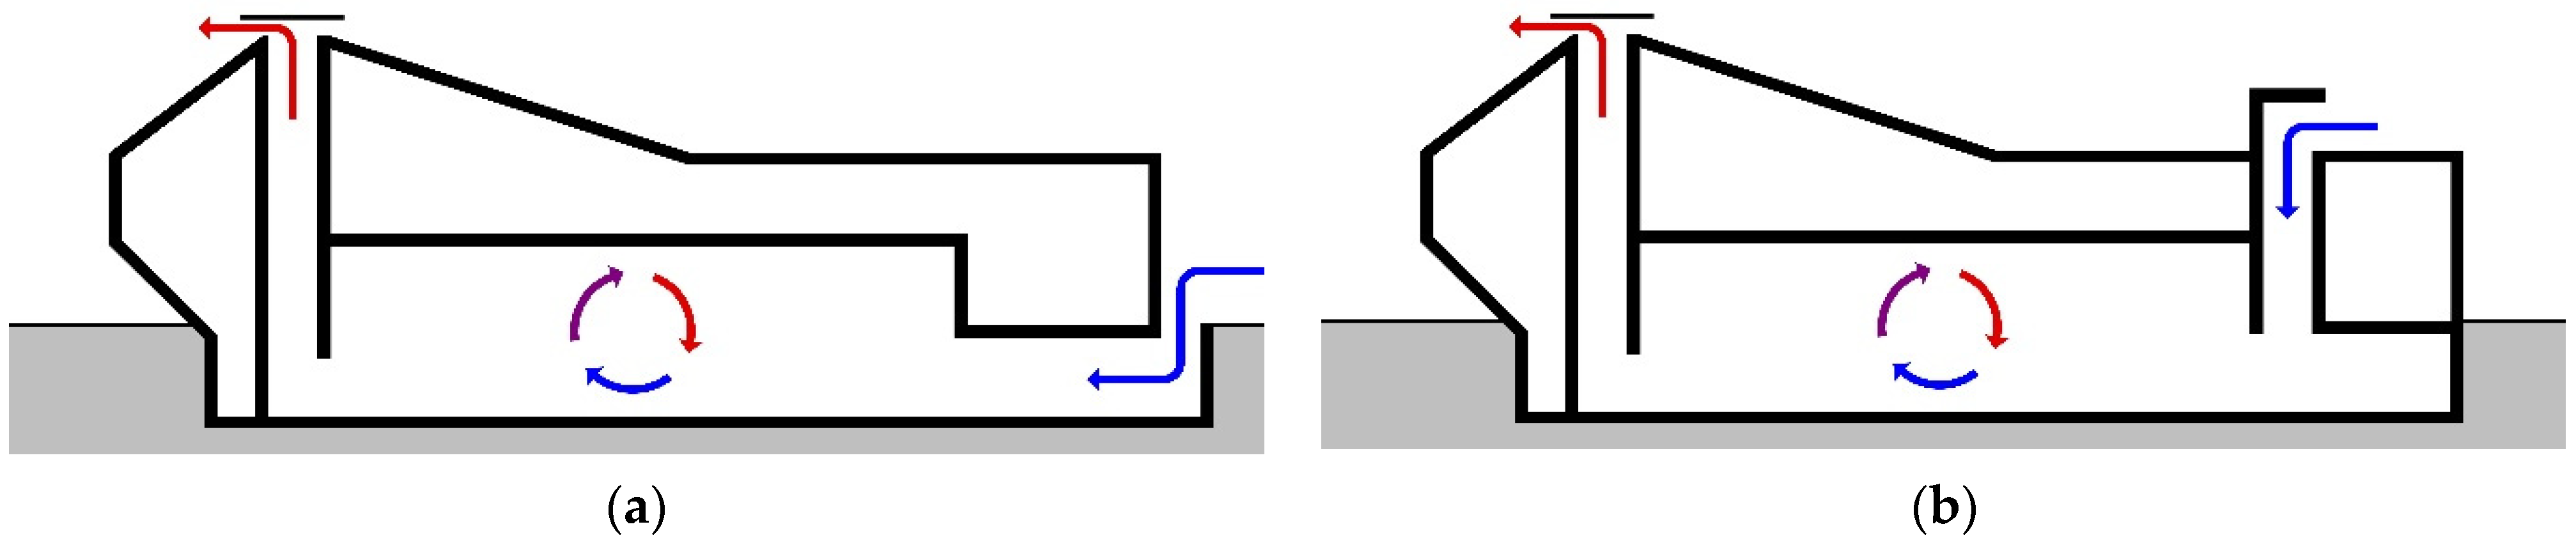
Figure 3.
Construction sites with the new winery building (dark gray); neighbor buildings (light grey), vineyards (hatch). The X marks the pyramid with the UD tower in two different locations: (a) Site A—lower density with closer neighbors; (b) Site B—higher density with further neighbors.
Figure 3.
Construction sites with the new winery building (dark gray); neighbor buildings (light grey), vineyards (hatch). The X marks the pyramid with the UD tower in two different locations: (a) Site A—lower density with closer neighbors; (b) Site B—higher density with further neighbors.

Figure 4.
Wind velocity frequency (%) sorted by incidence angle.

Figure 5.
(a) ‘Venturi’ plate structure (red) as deflector of the outlet tower (green) with lifting (closing) mechanism; (b) Omnidirectional chimney crown geometry (red) on top of the inlet tower (green) with diaphragm deflectors on diagonals (blue).
Figure 5.
(a) ‘Venturi’ plate structure (red) as deflector of the outlet tower (green) with lifting (closing) mechanism; (b) Omnidirectional chimney crown geometry (red) on top of the inlet tower (green) with diaphragm deflectors on diagonals (blue).
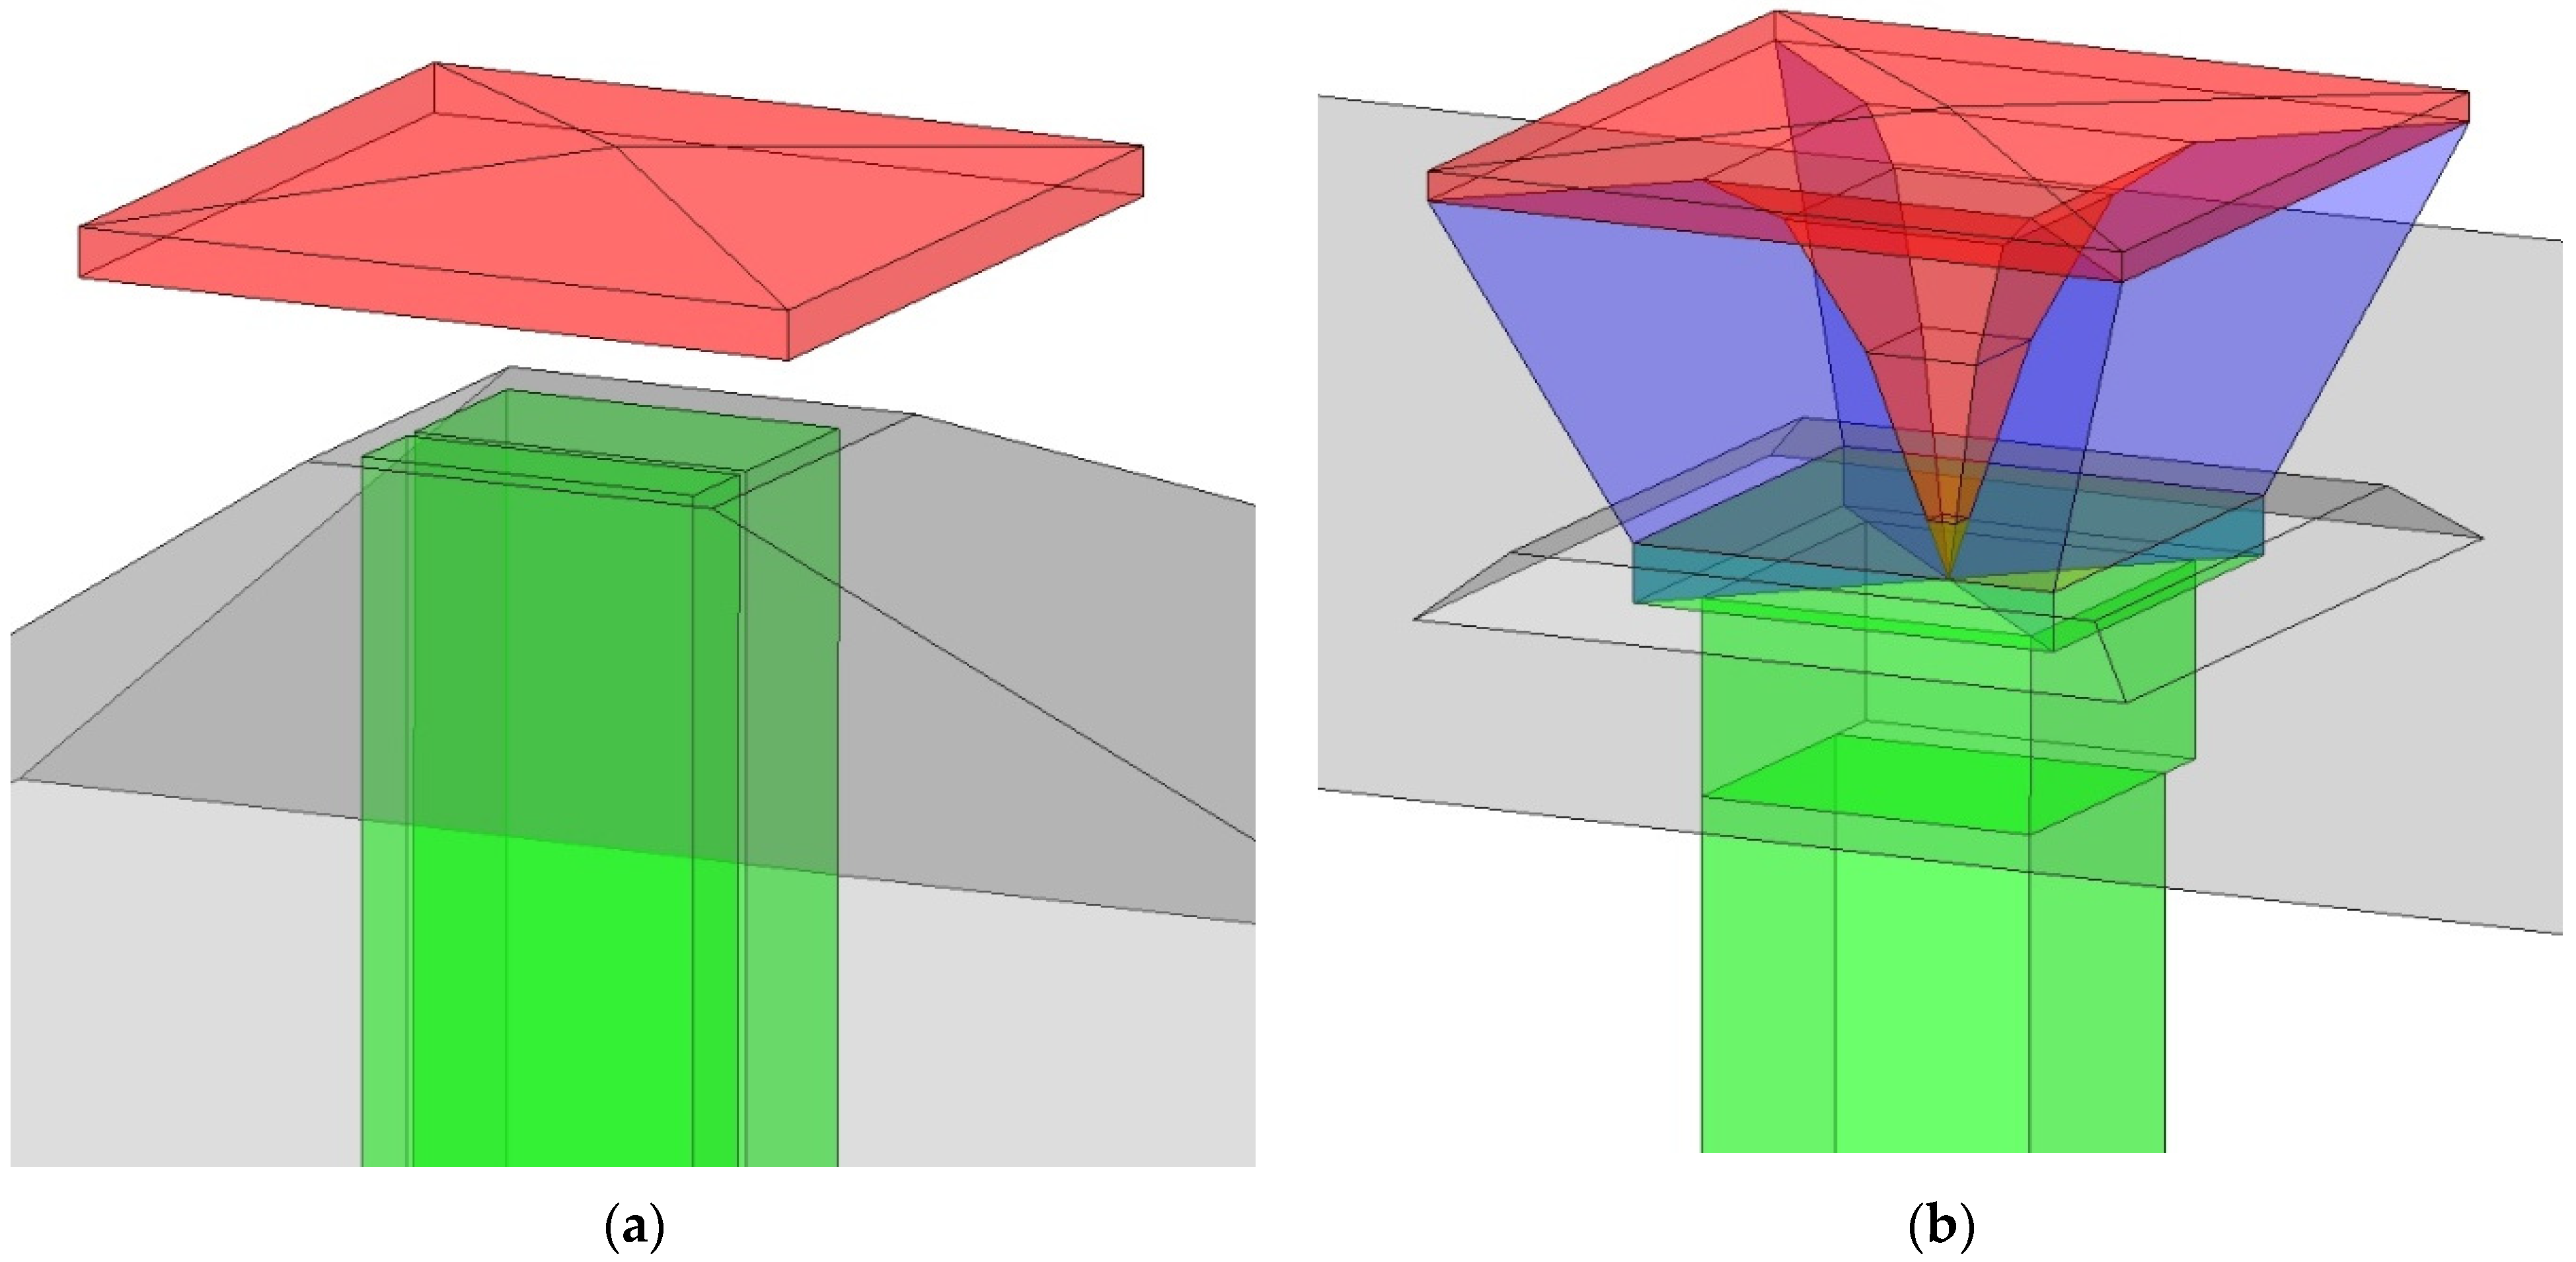
Figure 6.
(a) Floor plan, red shows the DD inlet tower, existing only in the DD PACS version; blue shows the ground zone inlet, existing only in UD PACS; (b) Section of the natural ventilated spaces.
Figure 6.
(a) Floor plan, red shows the DD inlet tower, existing only in the DD PACS version; blue shows the ground zone inlet, existing only in UD PACS; (b) Section of the natural ventilated spaces.
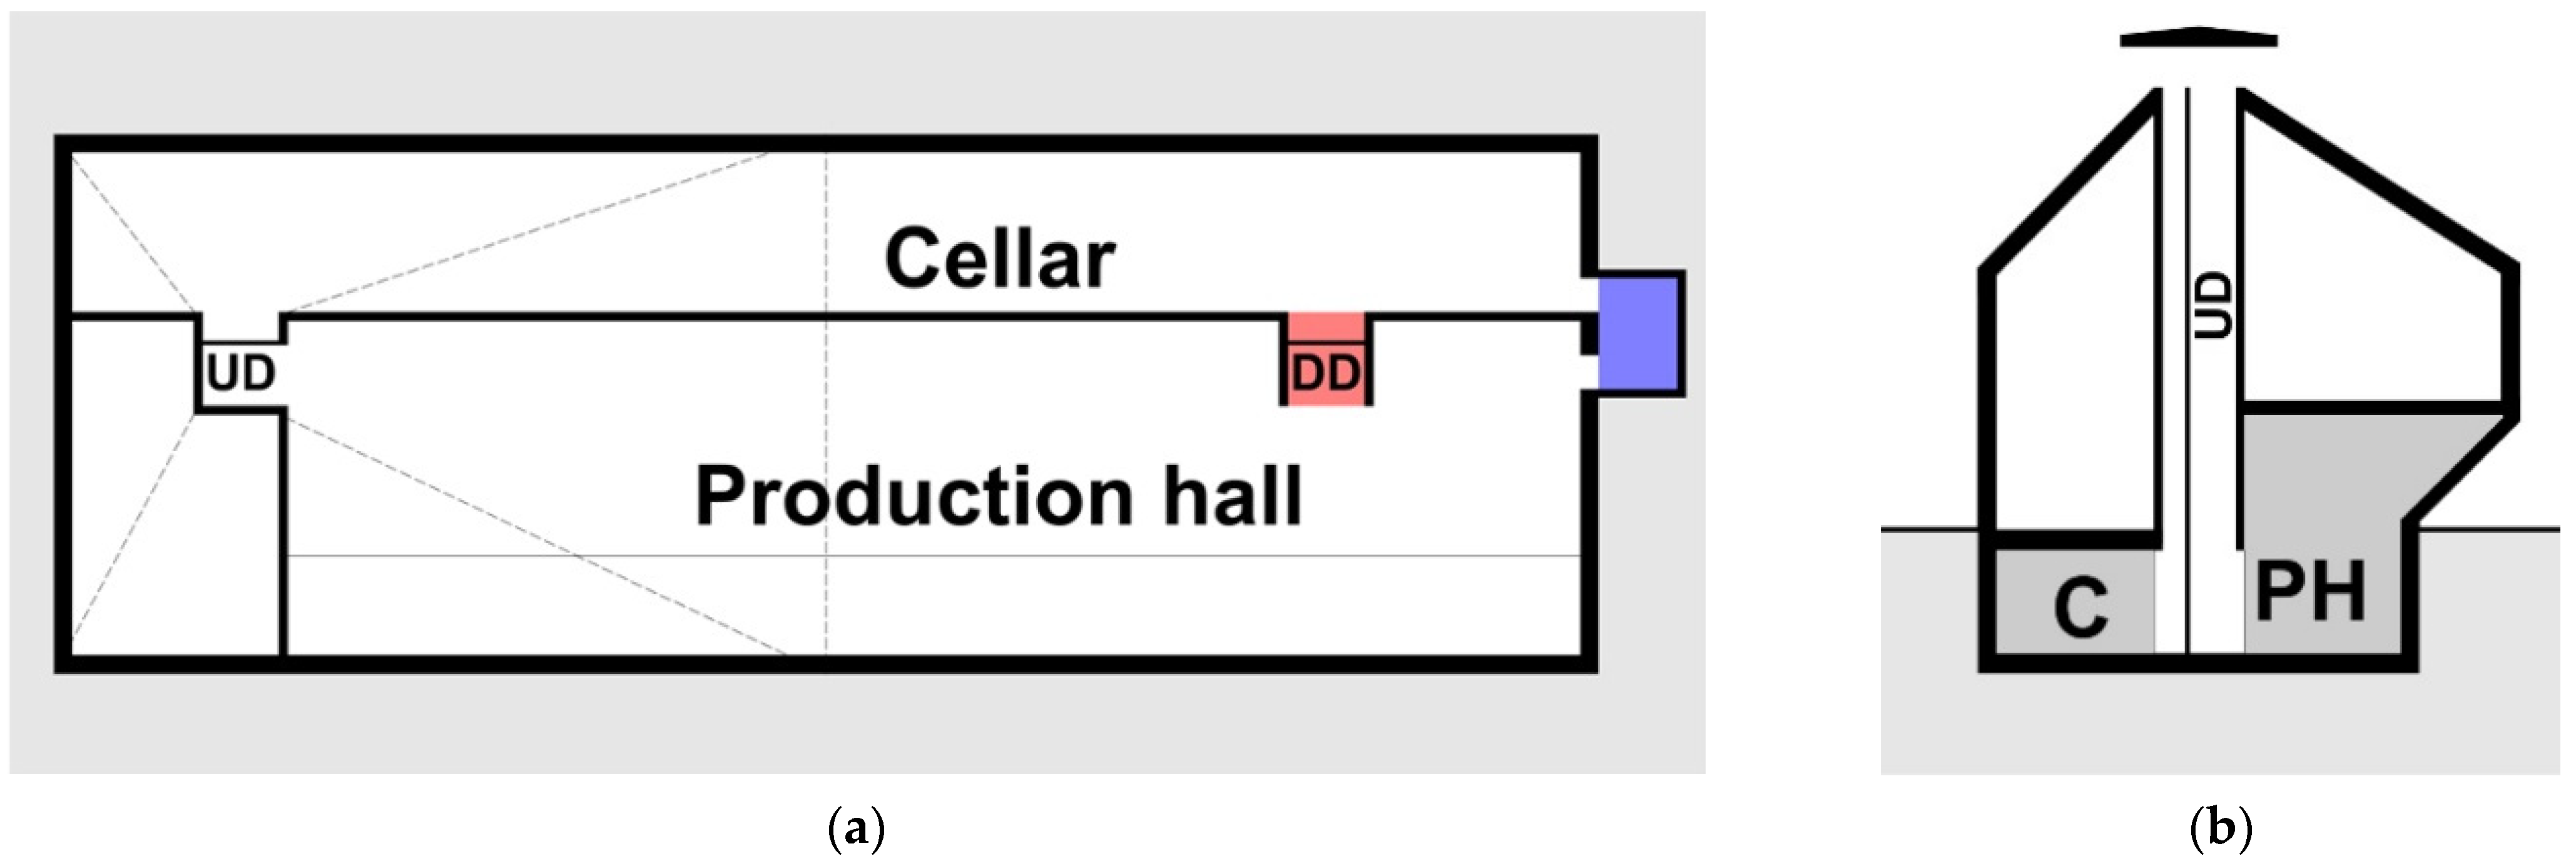
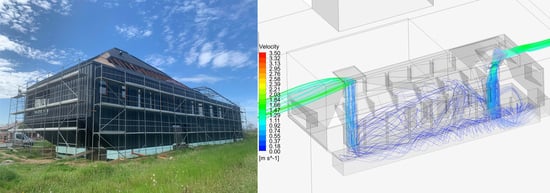
Figure 7.
(a) Visualization of the highest grid resolution with 9.3 million cells and (b) grid refinement results of the three different grid resolutions, concerning ACH [m3/s].
Figure 7.
(a) Visualization of the highest grid resolution with 9.3 million cells and (b) grid refinement results of the three different grid resolutions, concerning ACH [m3/s].

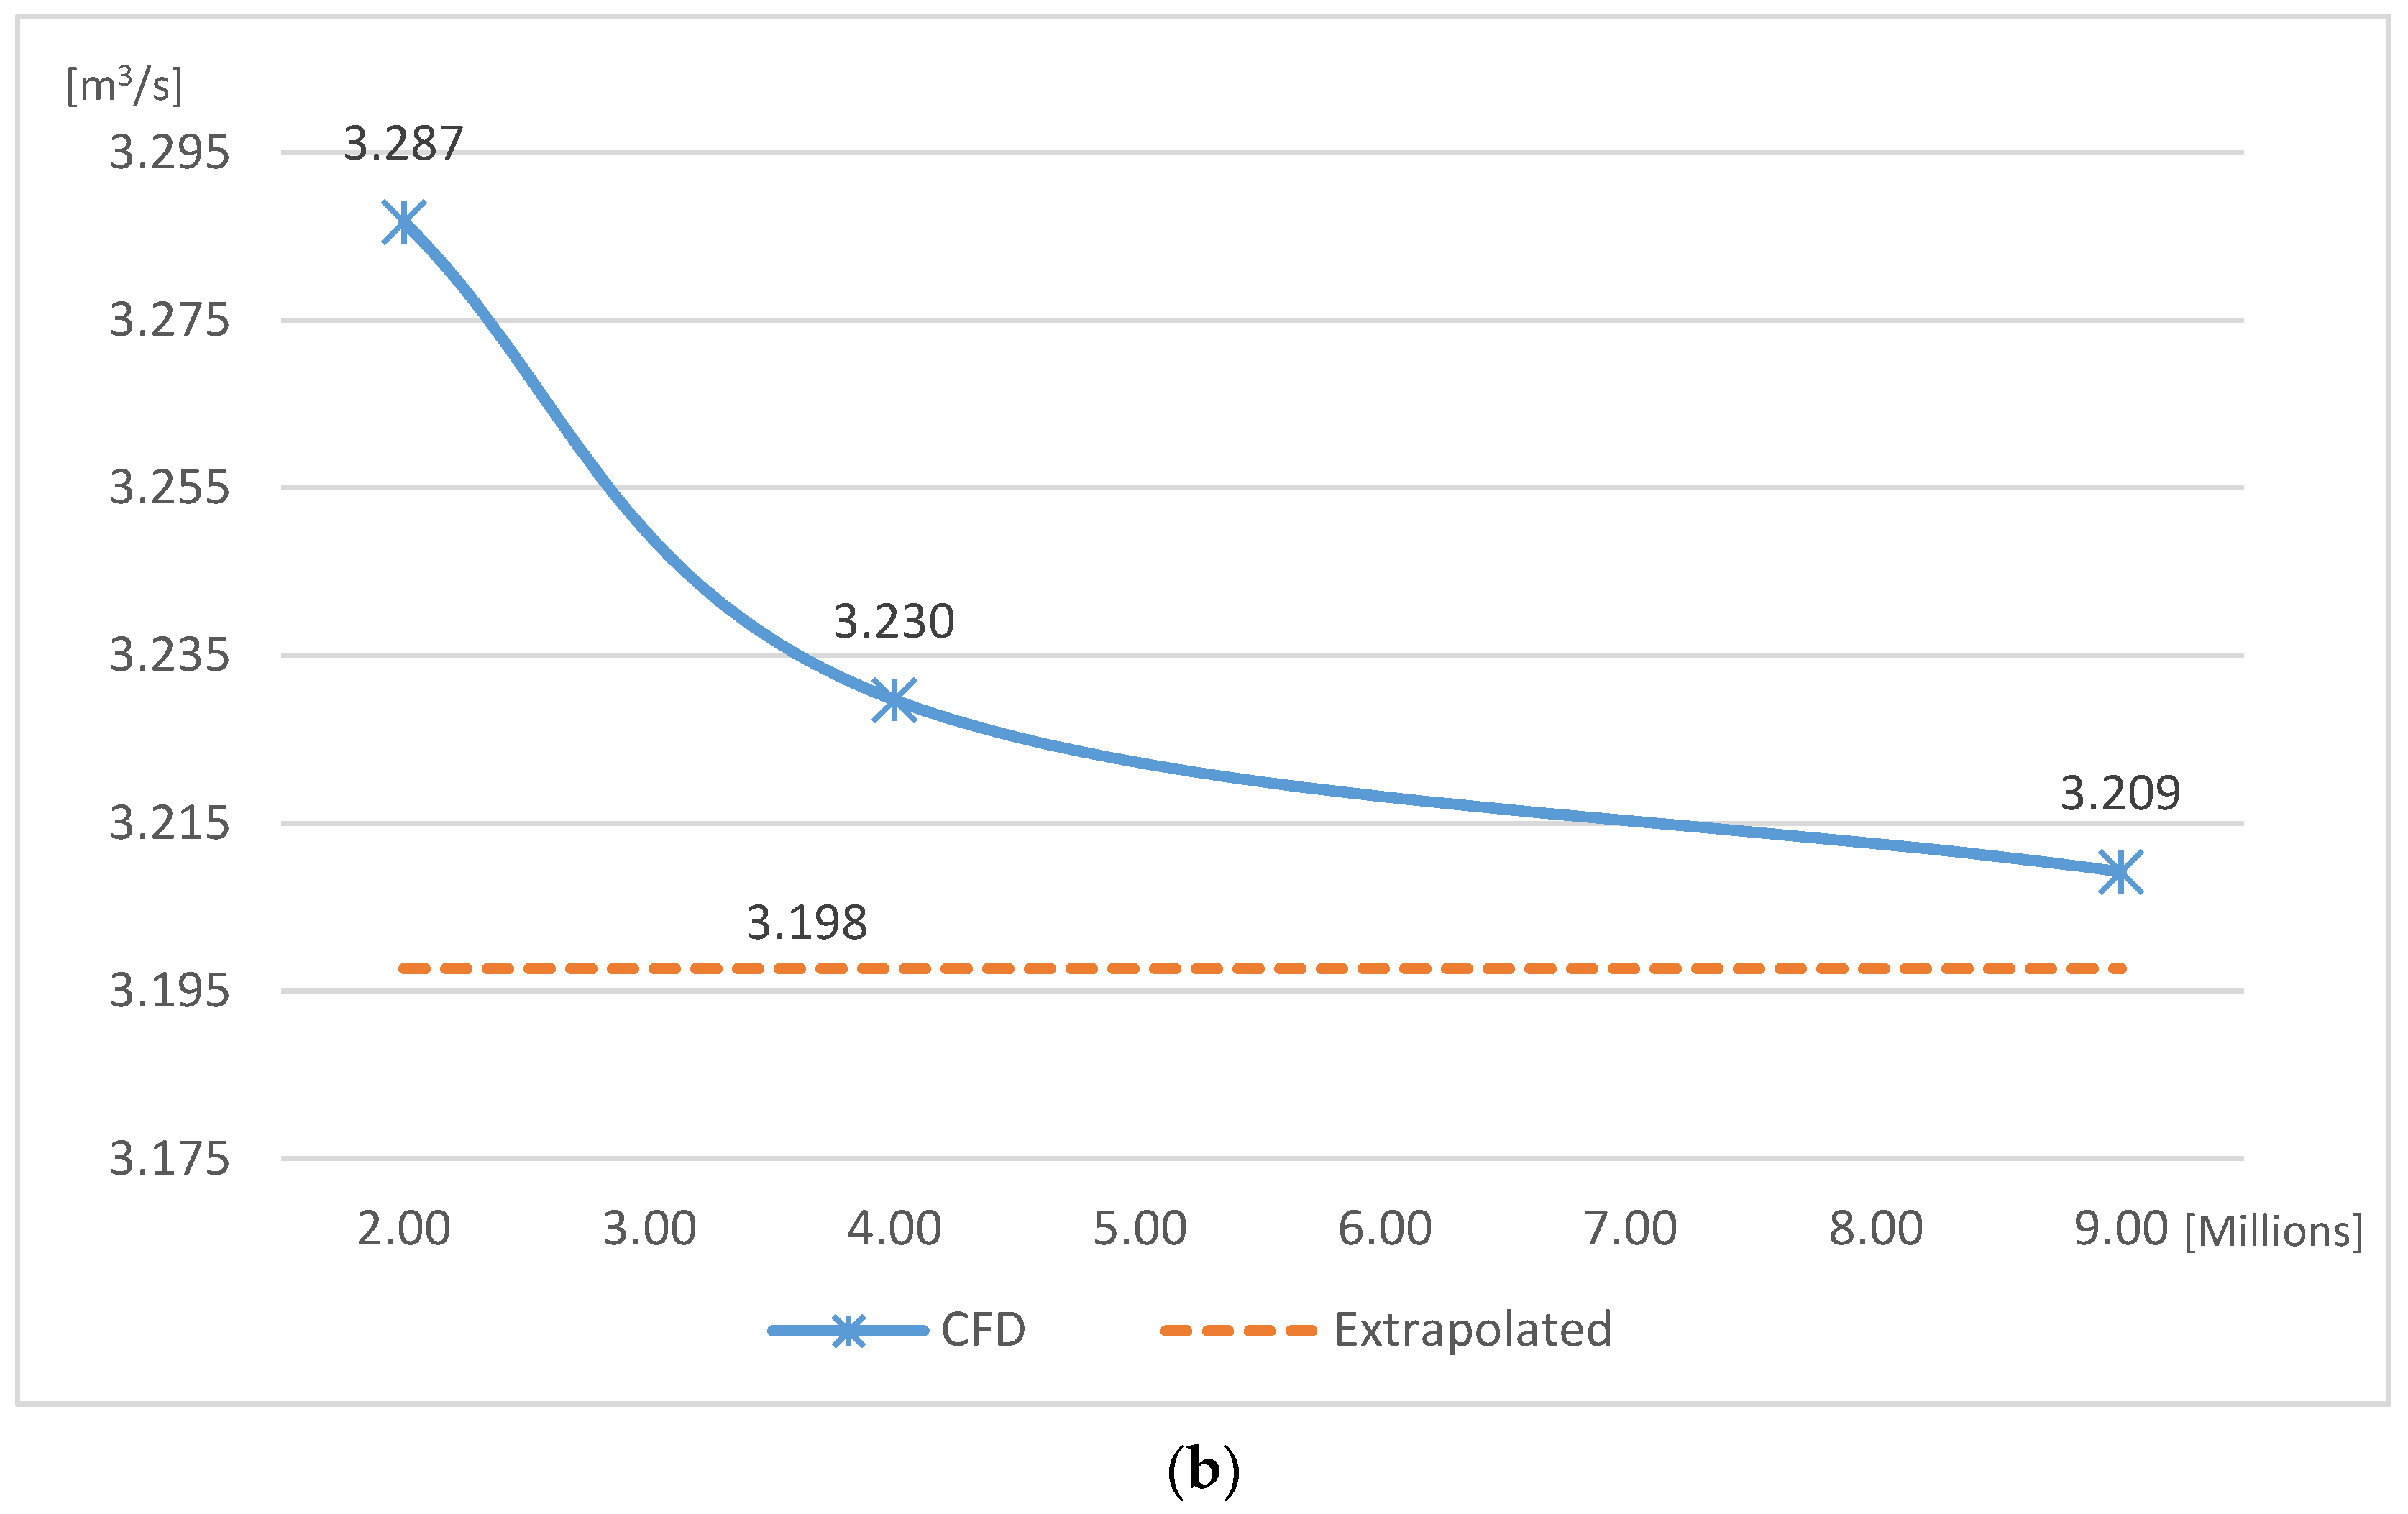
Figure 8.
Results of air change per hour [h−1] (a) in the cellar and (b) in the production hall where grey shows the mentioned area in the sematic figure of the building—Site A with less but closer neighbors.
Figure 8.
Results of air change per hour [h−1] (a) in the cellar and (b) in the production hall where grey shows the mentioned area in the sematic figure of the building—Site A with less but closer neighbors.
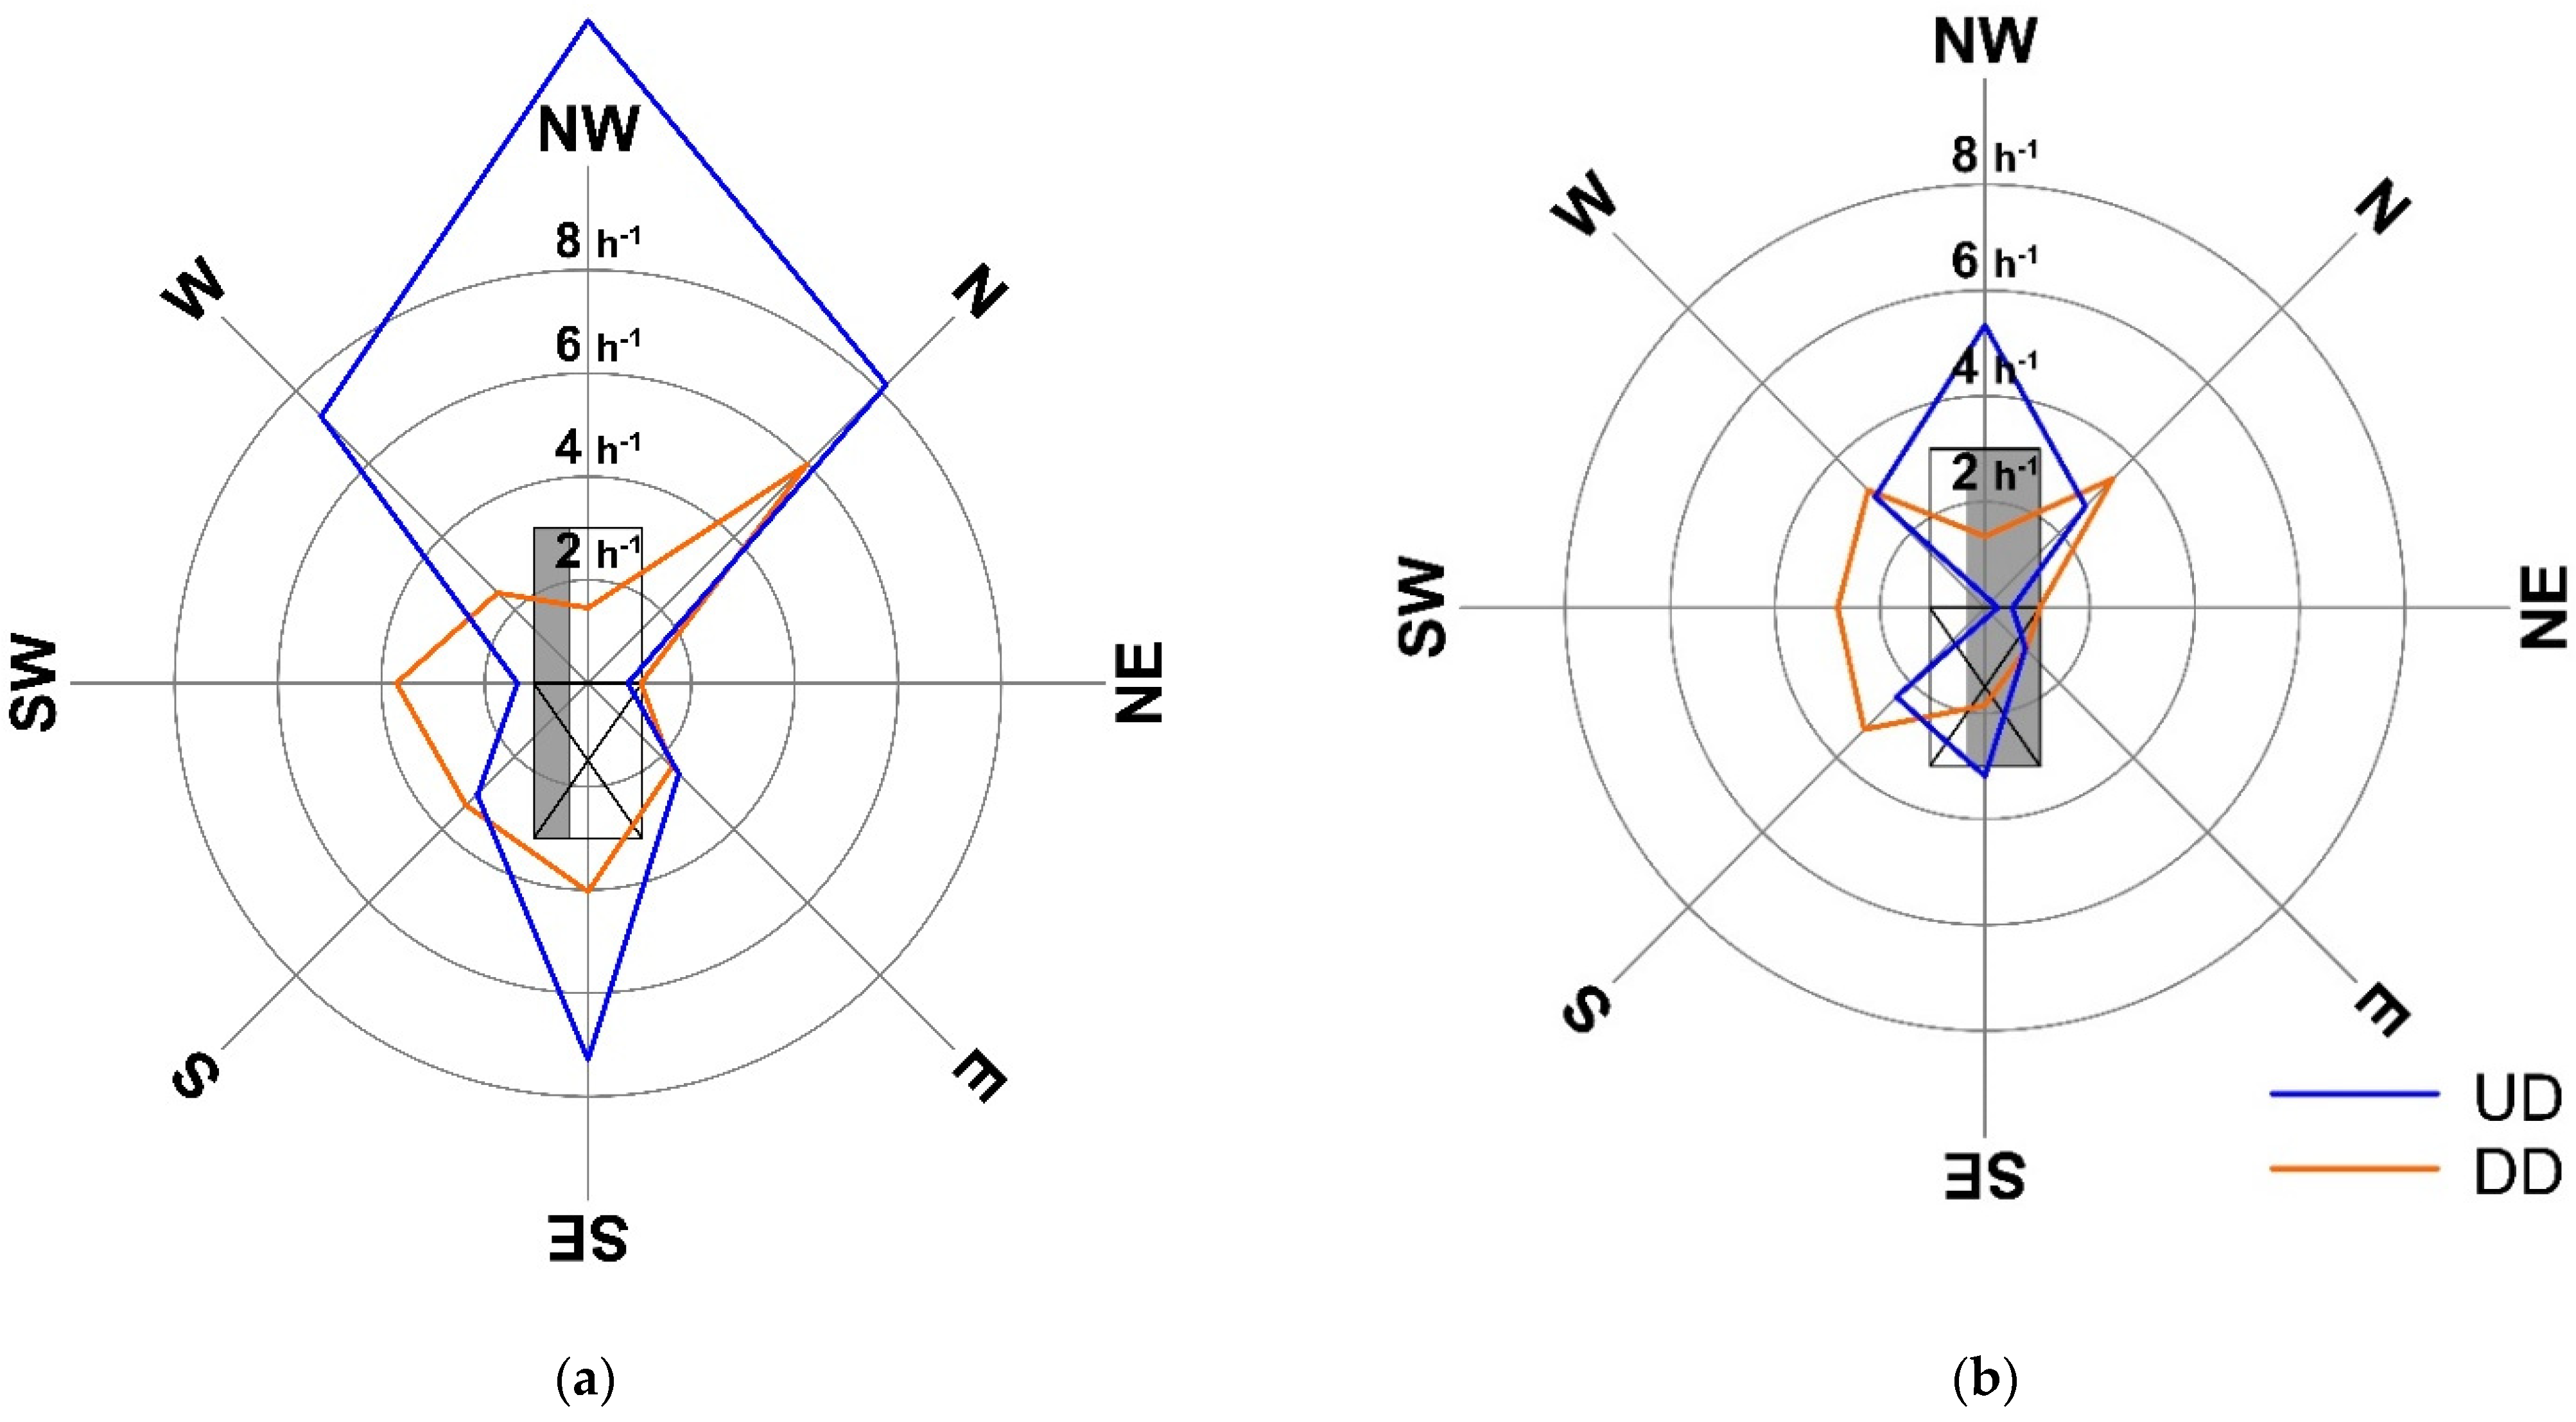
Figure 9.
Backflow occurrence behind the building in case of approaching wind direction from SE in the UD PACS (colors and vectors by air velocity [m/s]).
Figure 9.
Backflow occurrence behind the building in case of approaching wind direction from SE in the UD PACS (colors and vectors by air velocity [m/s]).
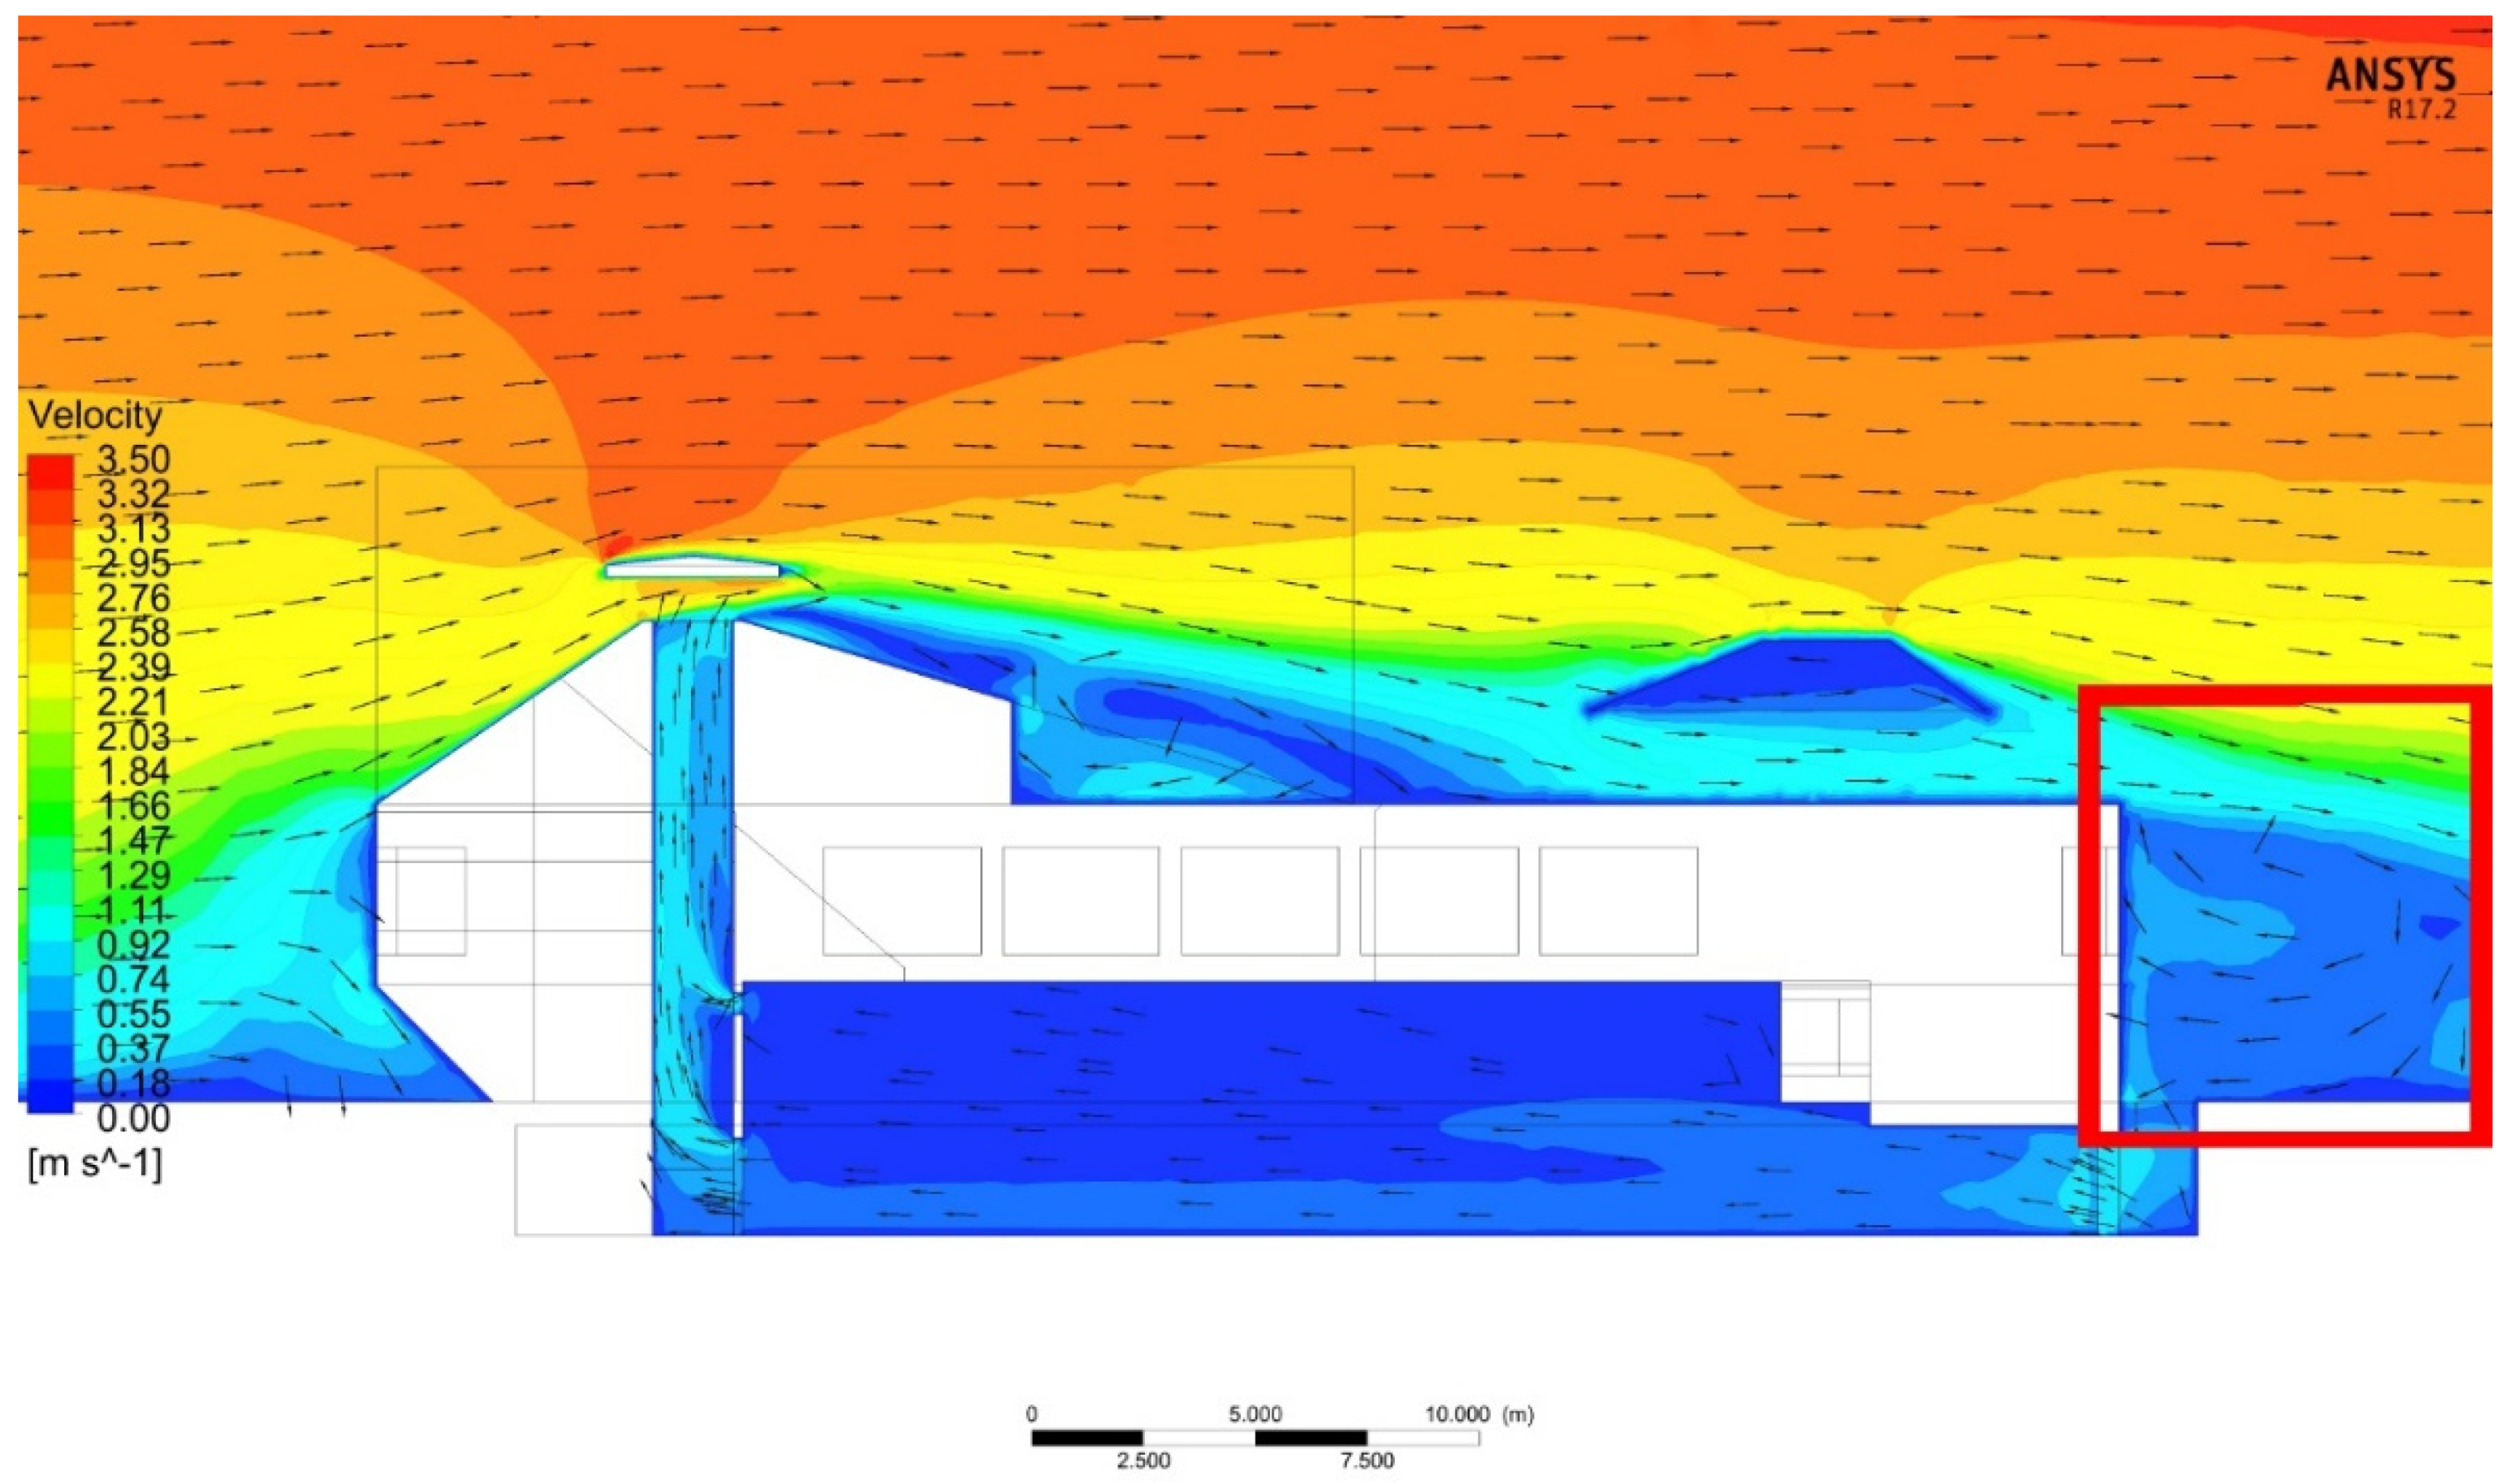
Figure 10.
Airflow patterns in the cellar and the industry hall in the case of updraft (UD) PACS (colors and vectors by air velocity [m/s])—(a) cross section of the airflow through the UD tower under NE wind direction, (b) cross section through the inlet gates behind the building under NE wind direction with counter wise vortices, which are responsible for the negative ACH amplitudes, (c) longitudinal section of the airflow in and around the building under NW wind direction; (d) 3D streamlines of the airflow under NW wind direction.
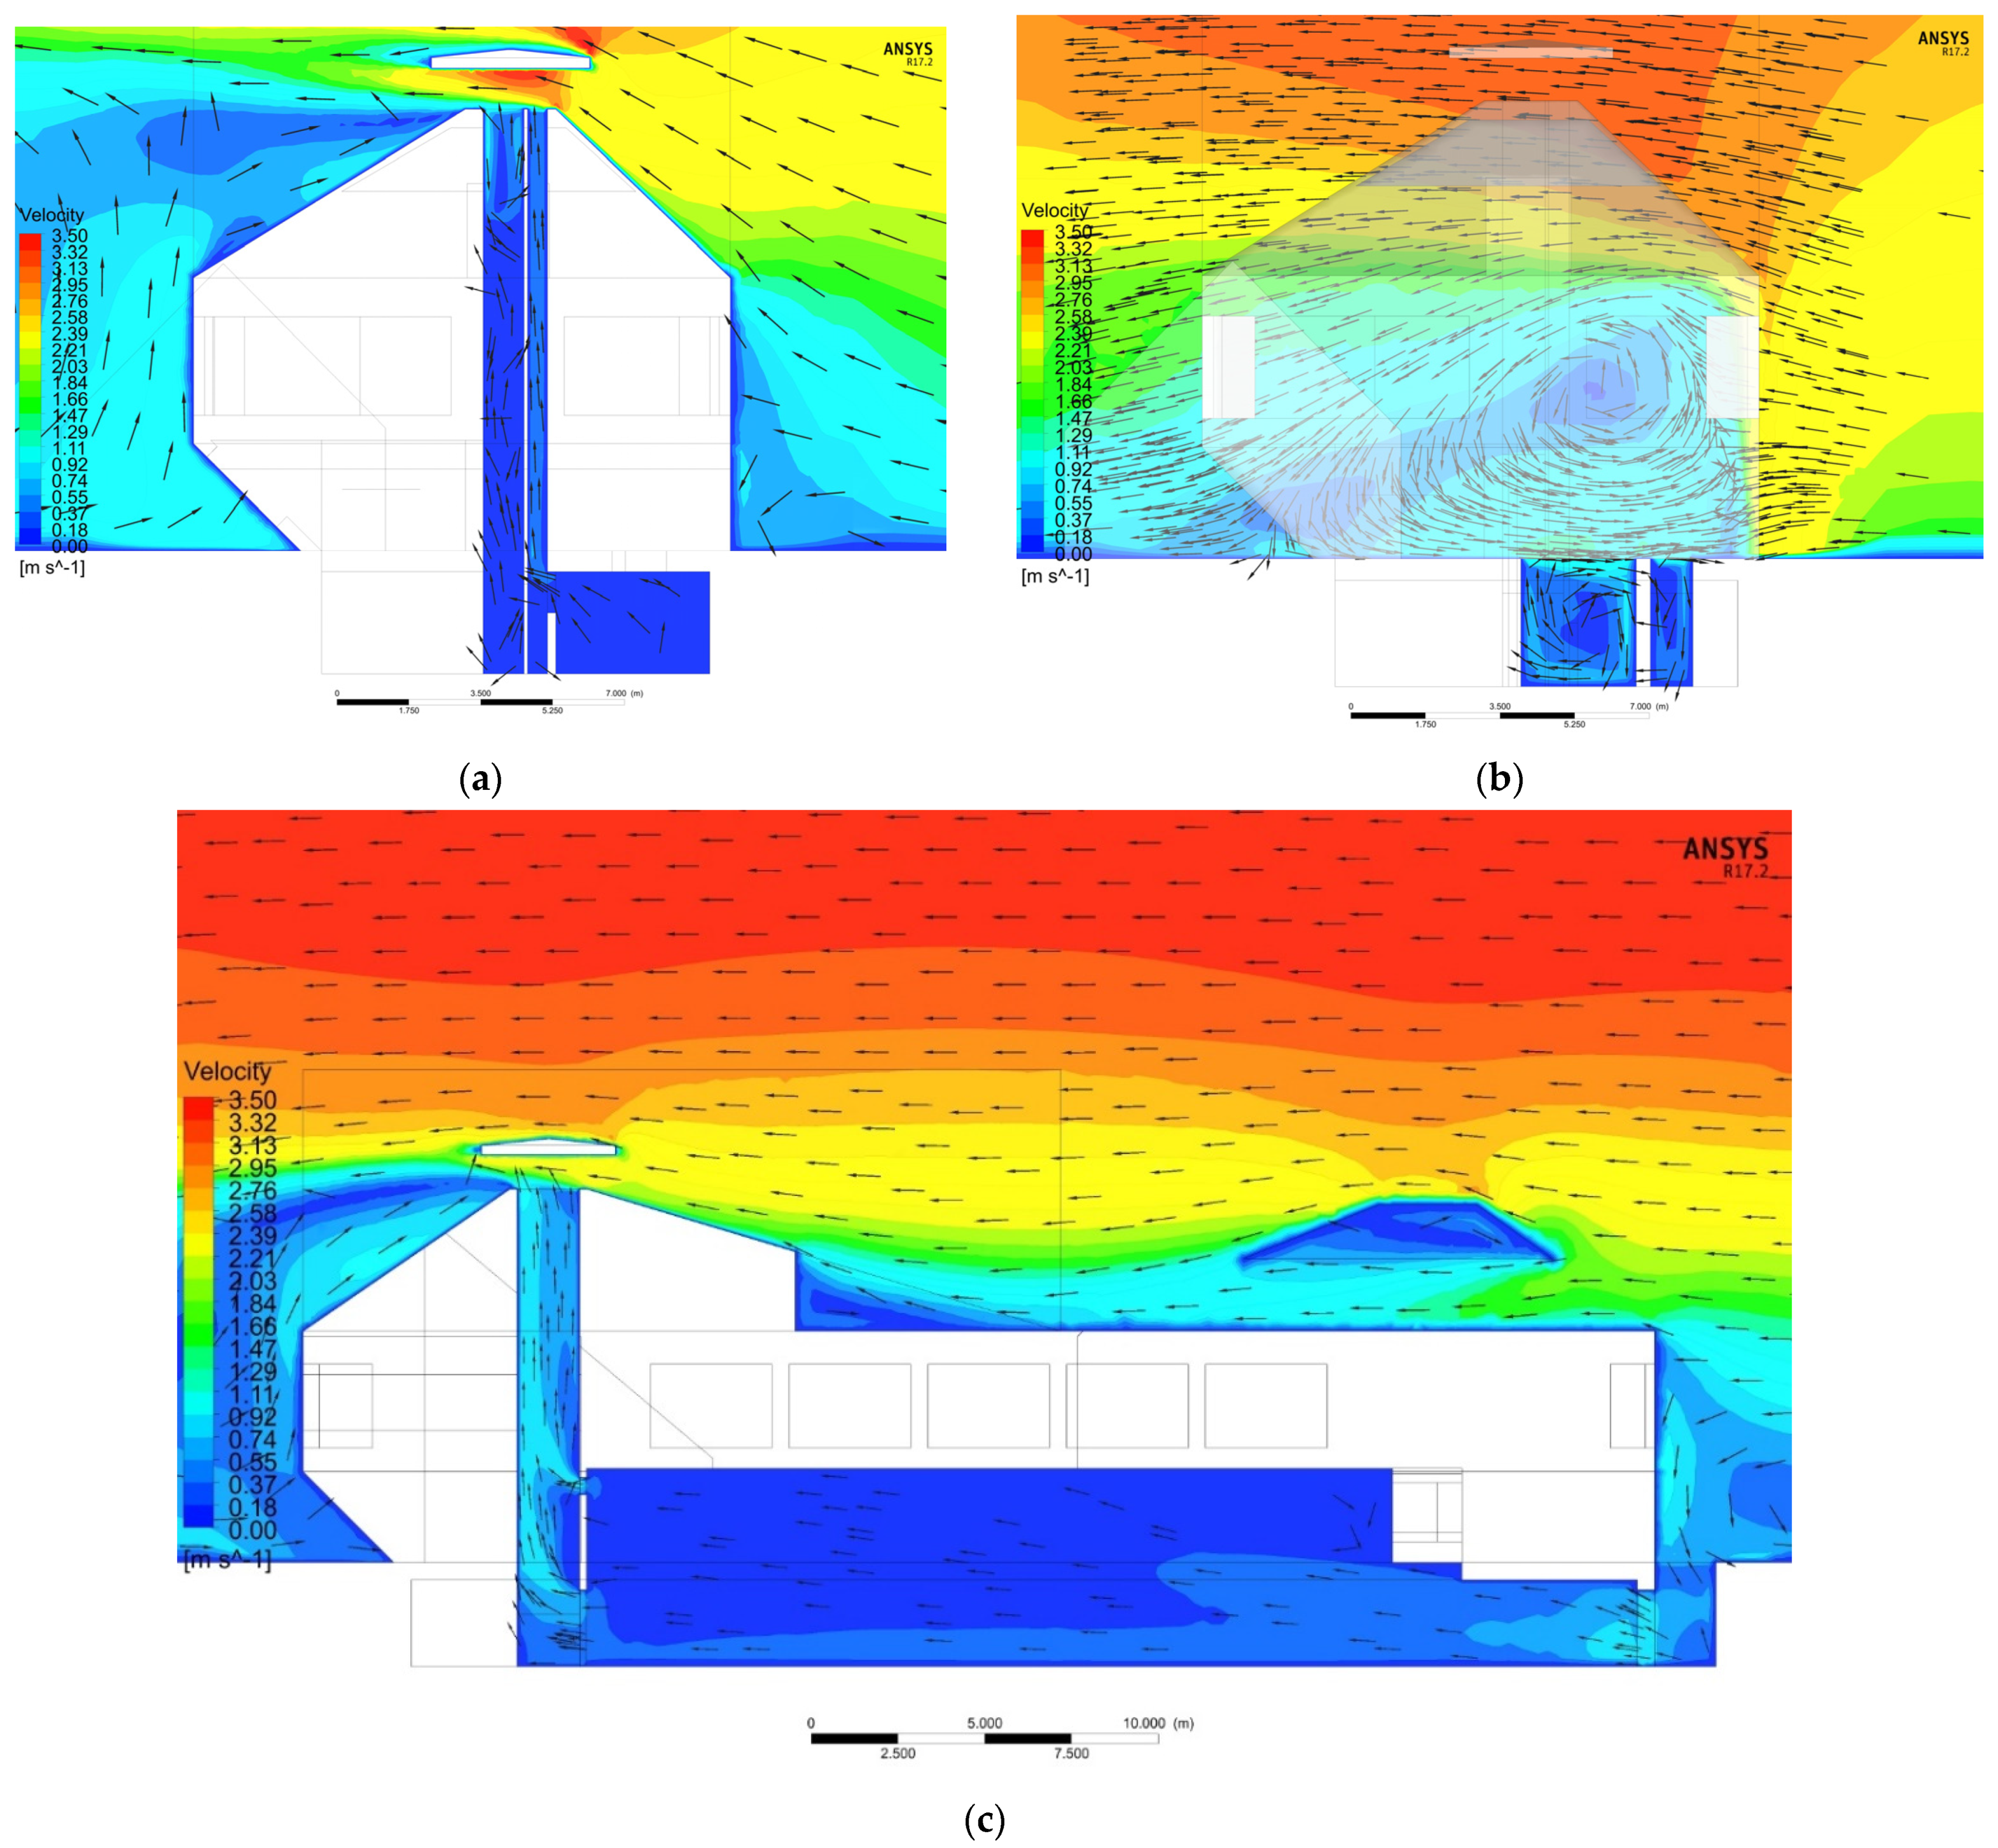

Figure 11.
Airflow patterns in the cellar and the industry hall in the case of downdraught (DD) PACS (colors and vectors by air velocity [m/s])—(a) cross section of the airflow through the outlet tower under NE wind direction, (b) cross section through the inlet tower under NE wind direction, (c) longitudinal section of the airflow in and around the building under NW wind direction, (d) 3D streamlines of the airflow under NW wind direction.
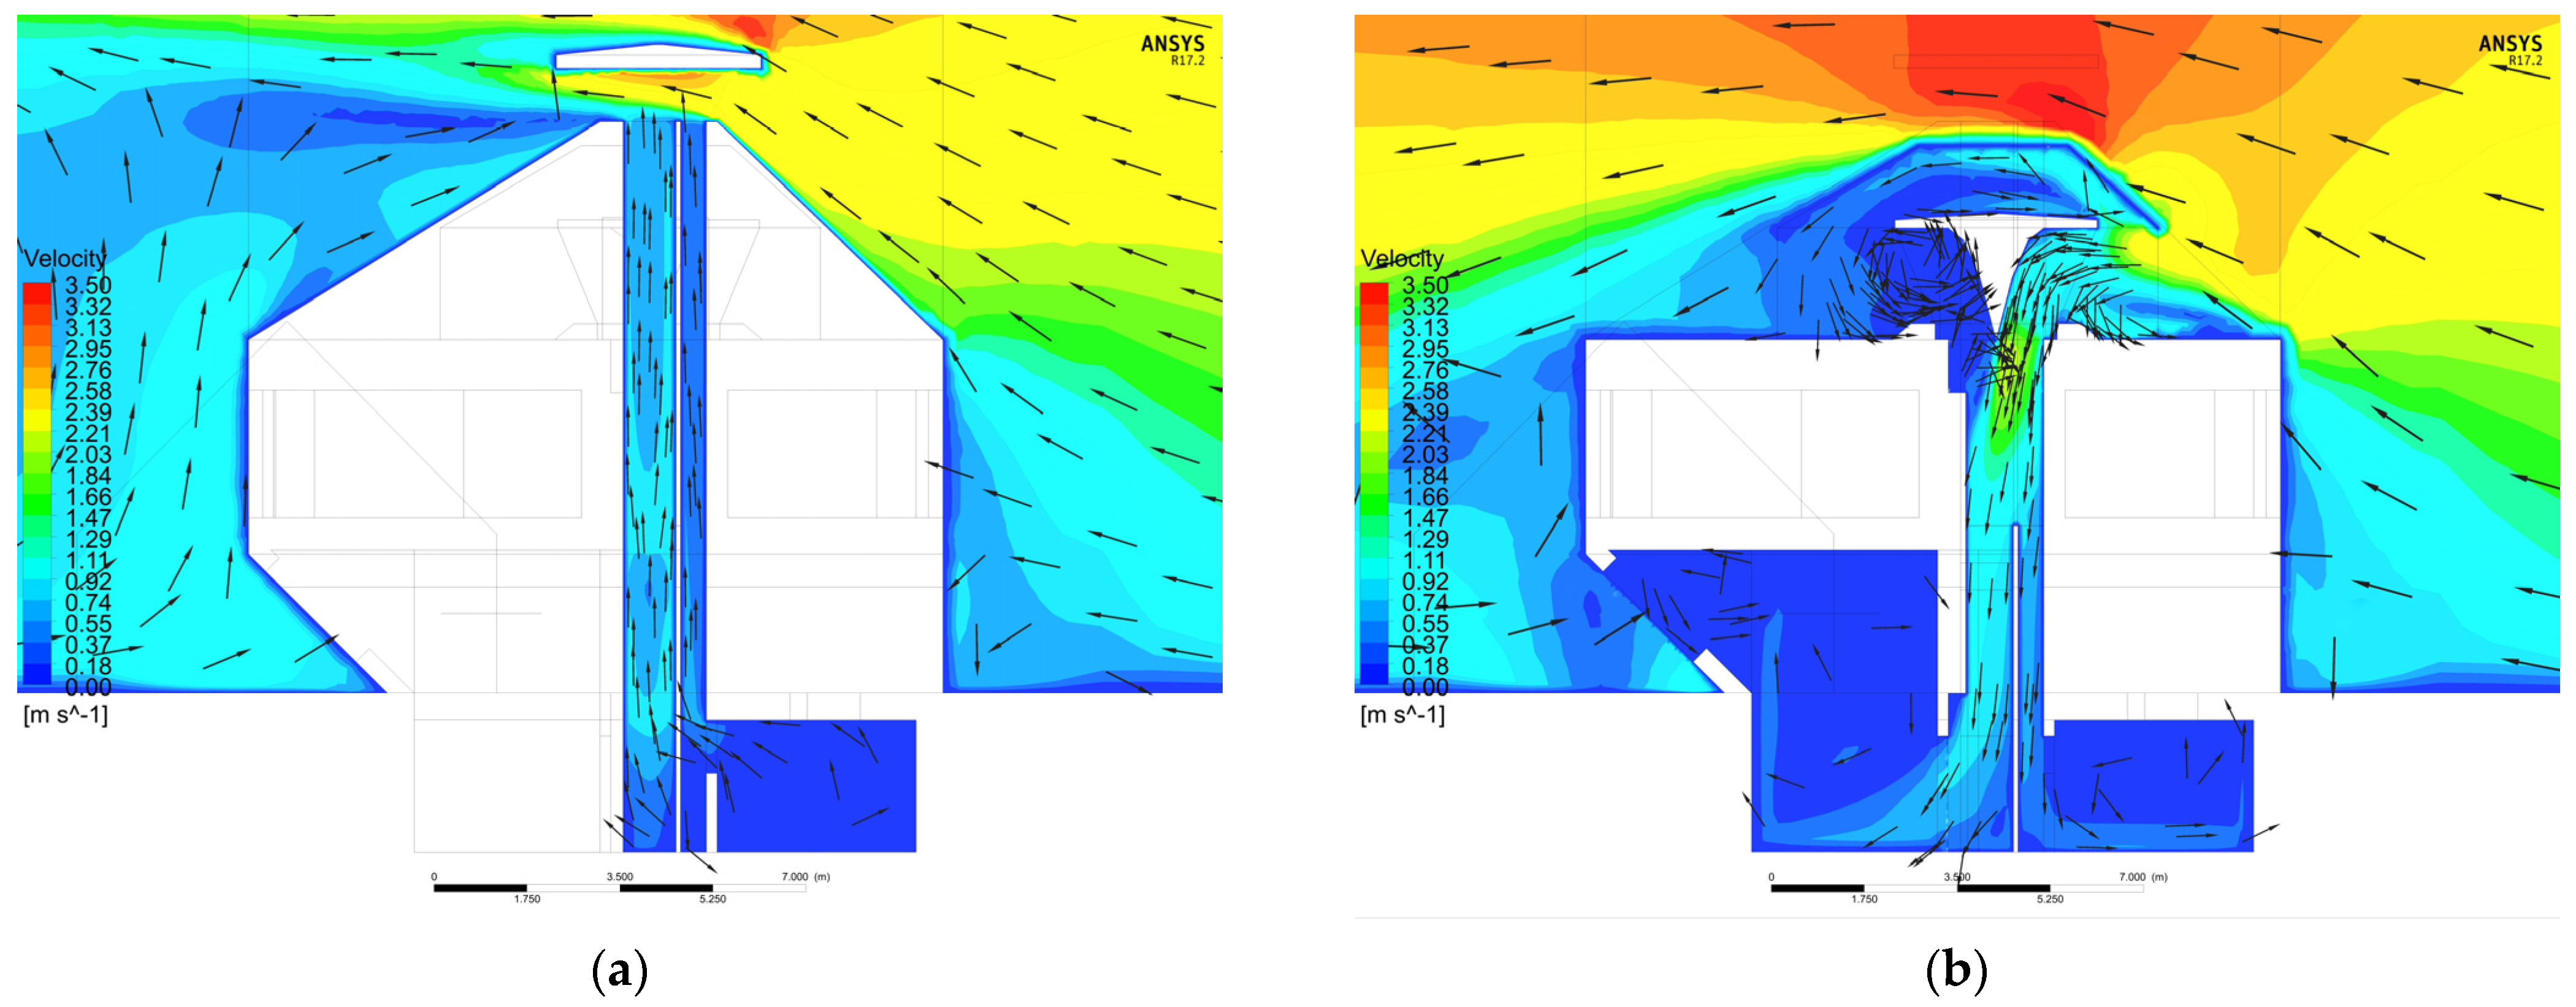
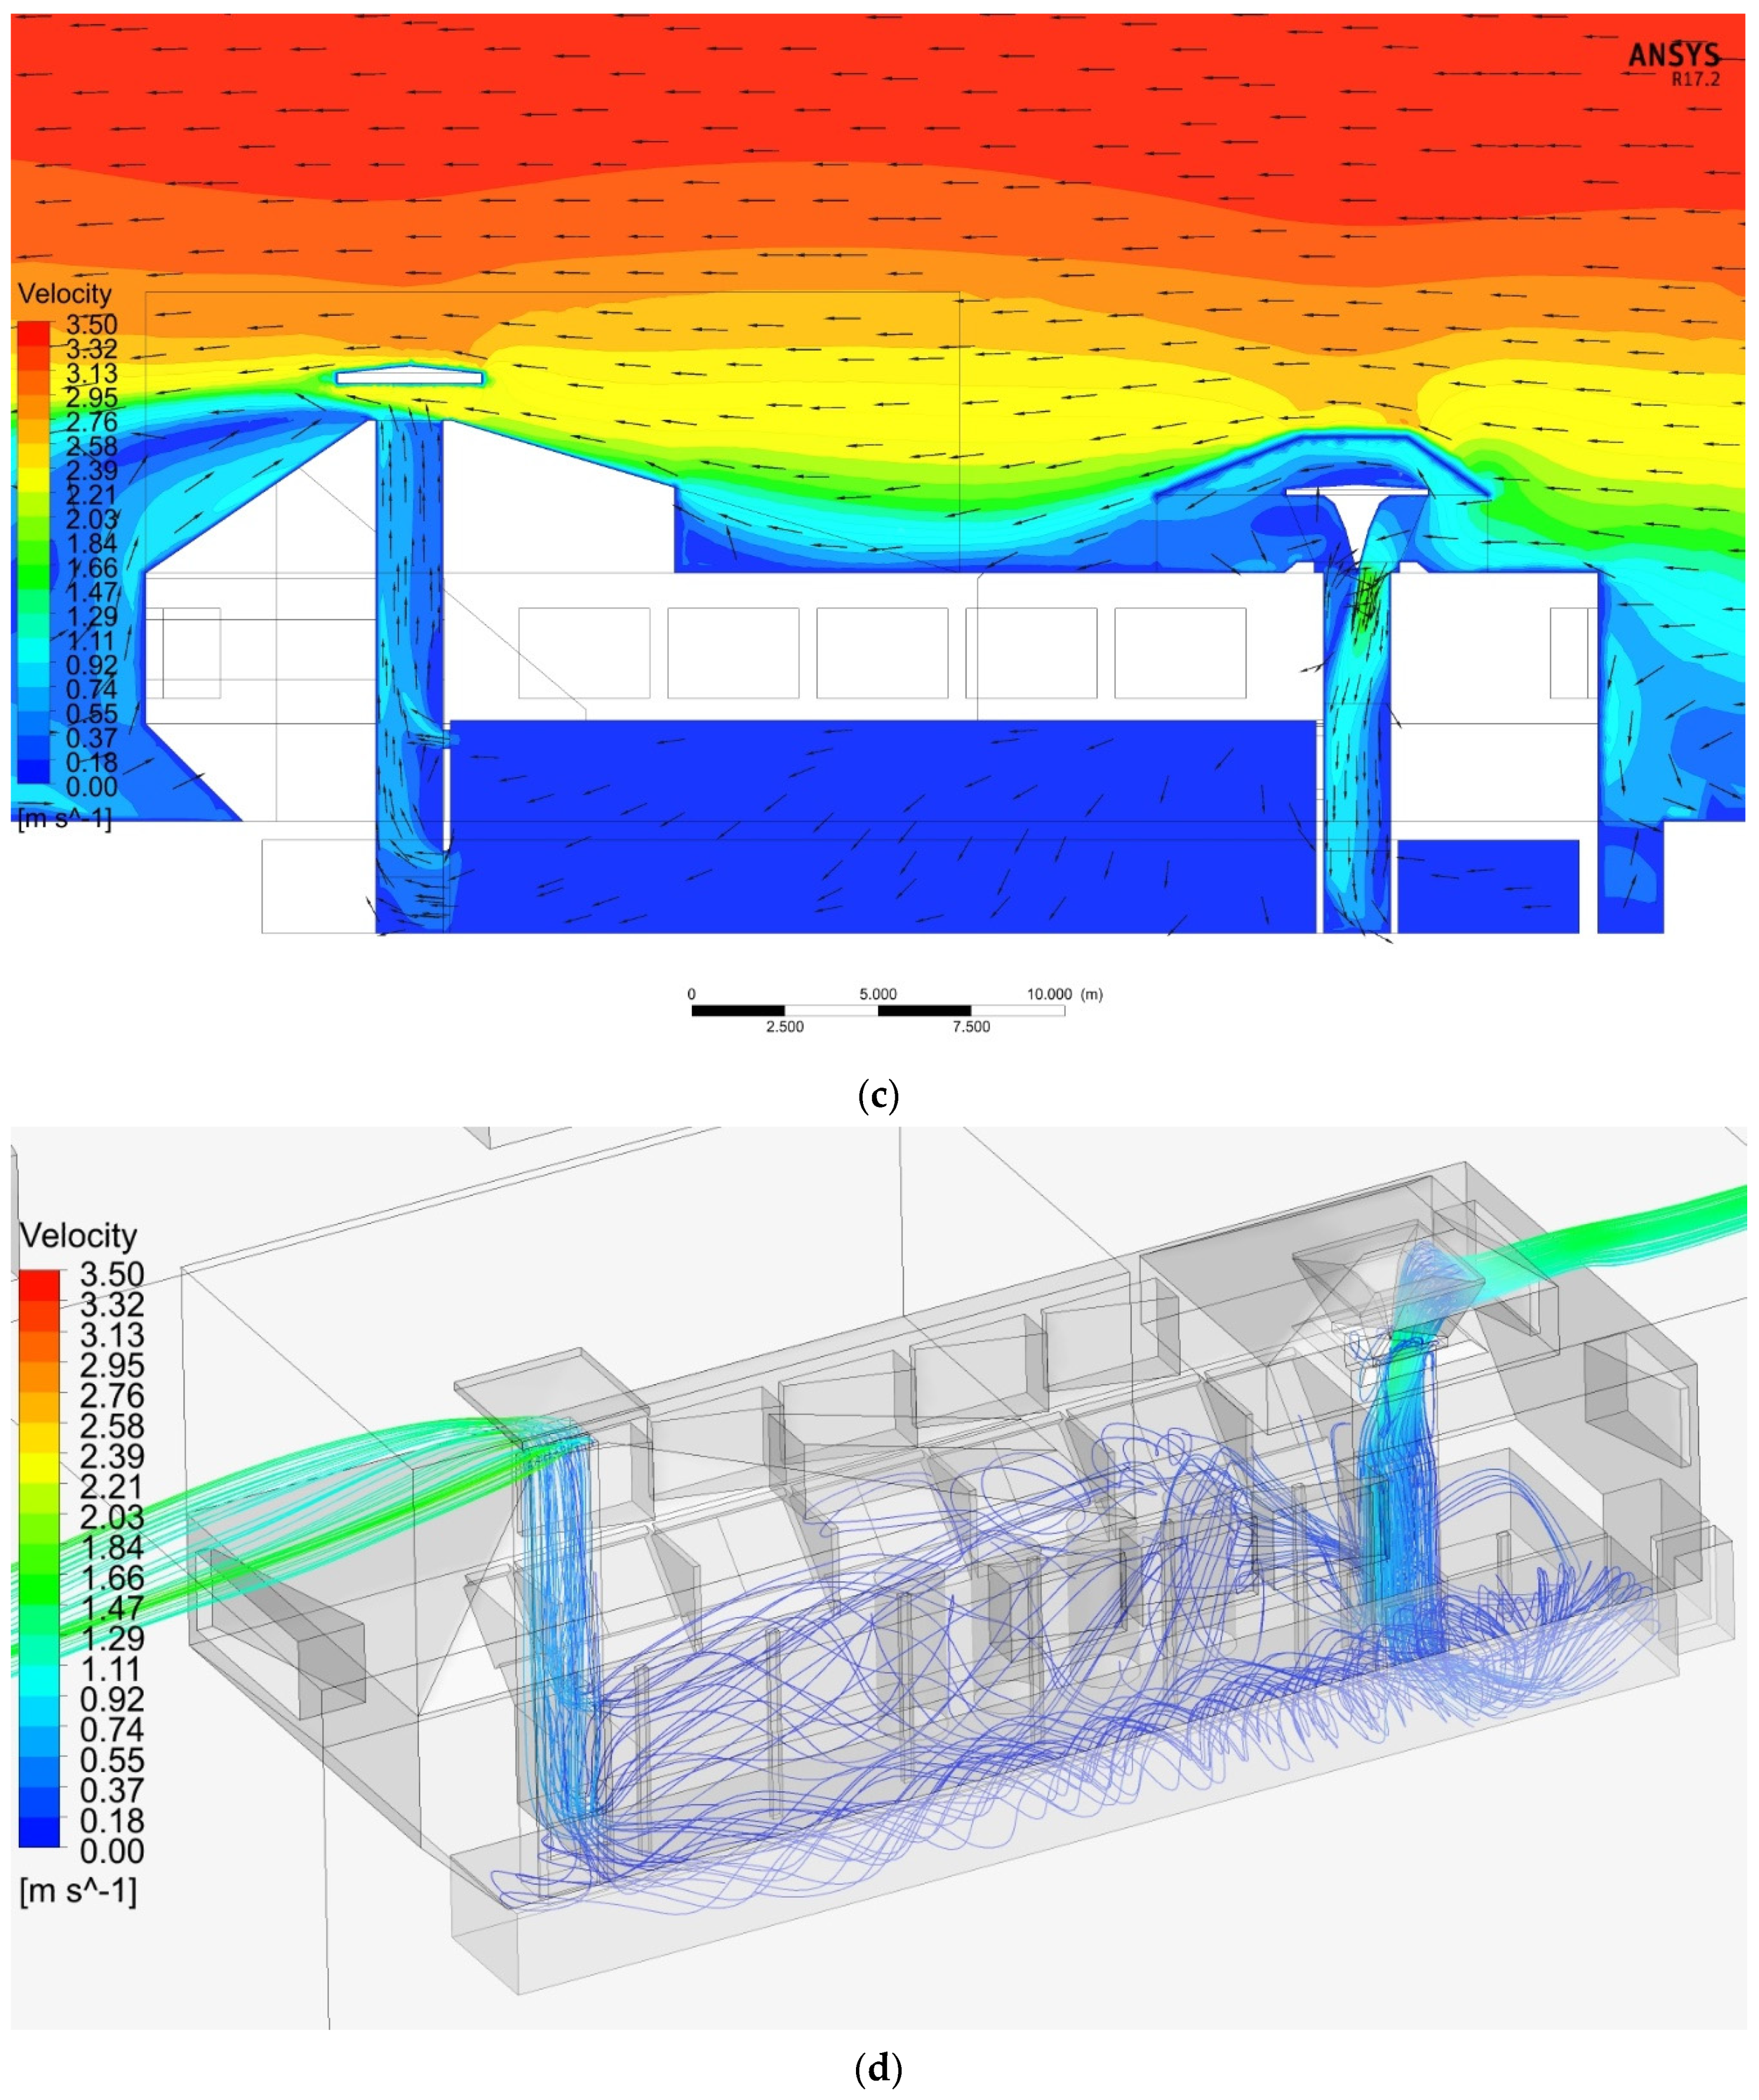
Figure 12.
Results of air change per hour [h−1] (a) in the cellar and (b) in the production hall where grey shows the mentioned area in the sematic figure of the building—Site B with denser but further neighbors.
Figure 12.
Results of air change per hour [h−1] (a) in the cellar and (b) in the production hall where grey shows the mentioned area in the sematic figure of the building—Site B with denser but further neighbors.

Figure 13.
Next step of optimization a PACS- multiple geometry scenarios for partial development.
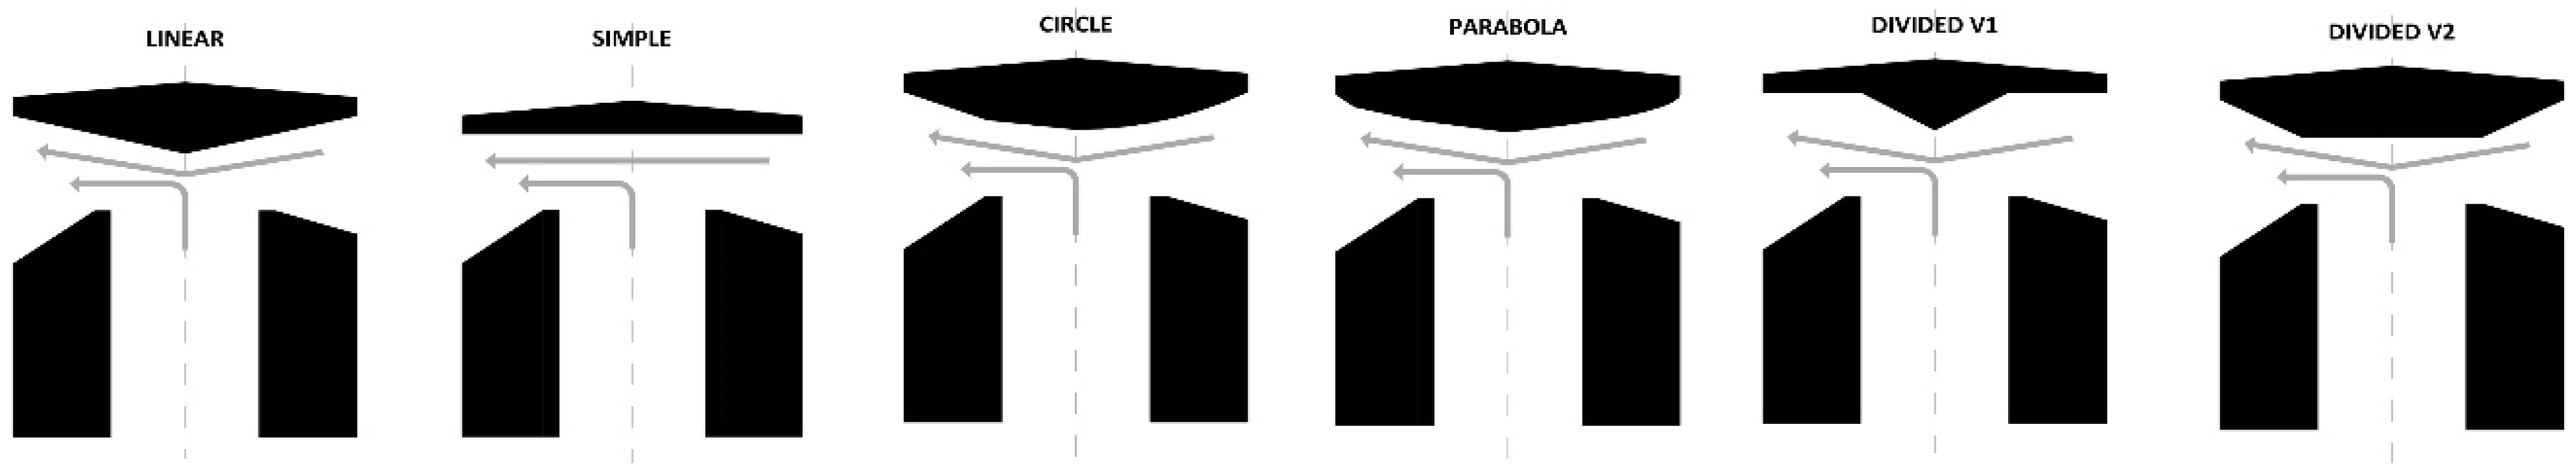
Table 1.
Representative cell sizes of the generated meshes.
| Region | Validated Mesh | Current Mesh |
|---|---|---|
| Total domain size | 500 m × 500 m × 100 m | 200 m × 200 m × 80 m |
| Atmospheric | 6 m | 4 m |
| Macro environment | 3 m | 2 m |
| Micro environment | 2 m | 1 m |
| Near building walls | 0.5 m | 0.3 m |
| Towers/openings | 0.3 m | 0.1 m |
| Interior | 0.2 m | 0.25 m |
Publisher’s Note: MDPI stays neutral with regard to jurisdictional claims in published maps and institutional affiliations. |
© 2021 by the authors. Licensee MDPI, Basel, Switzerland. This article is an open access article distributed under the terms and conditions of the Creative Commons Attribution (CC BY) license (https://creativecommons.org/licenses/by/4.0/).
Share and Cite
MDPI and ACS Style
Katona, Á.L.; Háber, I.E.; Kistelegdi, I. Comparison of Downdraught and Up Draft Passive Air Conduction Systems (PACS) in a Winery Building. Buildings 2021, 11, 259. https://doi.org/10.3390/buildings11060259
AMA Style
Katona ÁL, Háber IE, Kistelegdi I. Comparison of Downdraught and Up Draft Passive Air Conduction Systems (PACS) in a Winery Building. Buildings. 2021; 11(6):259. https://doi.org/10.3390/buildings11060259
Chicago/Turabian StyleKatona, Ádám László, István Ervin Háber, and István Kistelegdi. 2021. "Comparison of Downdraught and Up Draft Passive Air Conduction Systems (PACS) in a Winery Building" Buildings 11, no. 6: 259. https://doi.org/10.3390/buildings11060259
Note that from the first issue of 2016, this journal uses article numbers instead of page numbers. See further details here.