
Decarbonization of the Colombian Building Sector: Social Network Analysis of Enabling Stakeholders

1
Department of Civil and Environmental Engineering, Universidad de los Andes, Bogota 111711, Colombia
2
Hill Consulting, Bogota 111711, Colombia
*
Author to whom correspondence should be addressed.
Buildings 2022, 12(10), 1531; https://doi.org/10.3390/buildings12101531
Submission received: 28 August 2022
/
Revised: 13 September 2022
/
Accepted: 14 September 2022
/
Published: 26 September 2022
(This article belongs to the Collection Strategies for Sustainable Urban Development)
Abstract
:Reducing greenhouse gas (GHG) emissions is one of the main challenges to stopping climate change; in particular, the building sector acts as one of the main emitters. In response, governments have been developing nationally determined contributions (NDCs) and roadmaps to establish measures to achieve net-zero emissions. One of the main barriers to implementing these measures, particularly in the building sector, underlays in stakeholder integration. Through social network analysis (SNA) concepts, this research explores the roles of the actors whose participation is required in decarbonizing the Colombian building sector. These stakeholders engage in enabling categories (e.g., policy, finance, technology, and capacity development) required to achieve net-zero emissions, according to the goals proposed by the Colombian Green Building Council (CGBC). For the network analysis, we employ the results of semi-structured interviews led by the CGBC within the framework of the Zero Carbon Building Accelerator (ZCBA) project. Findings show highly interconnected networks characterized by redundant connections among actors. Three types of actors are identified within each enabler network: prominent actors with high centrality values, in charge of coordinating most of the actions required to achieve net-zero emissions; second-level actors limited to specific roles in policy-making processes; and perimeter actors focused on a few particular actions.
1. Introduction
According to the Intergovernmental Panel on Climate Change (IPCC), in 2019, the building sector emitted 19% of global greenhouse gases (GHGs) and 31% of carbon dioxide (CO2) emissions [1]. Under the current policy scenario, GHGs associated with the construction sector will increase by 2.2% yearly [2]. Developing countries are one of the main drivers of global emissions because these economies are growing in population and economy, with increasing floor areas per capita, while employing non-efficient construction methods as a standard practice [1,3]. Building-related emissions, particularly CO2, are closely linked to energy production and use. Energy is responsible for 67% of the emissions from buildings [4,5]. Future energy–building consumption growth is a major concern because emerging economies hold a large portion of the world’s housing demand potential [6], and more than 80% of the nations with the highest projected population growth through 2030 lack any kind of obligatory energy code [5].
Although carbon emissions per capita in high- and upper-middle-income countries are more elevated than those in low- and lower-middle-income countries, most industrialized economies have implemented programs to reduce energy consumption and mitigate GHG emissions [7], in particular, in the building sector [5]. In contrast, many developing nations have chosen to expand their investment in fossil fuel energy and keep their tendencies in the construction and operation of buildings instead of migrating to cleaner options [8,9]. The development of programs to reduce energy consumption and mitigate GHG emissions remains one of the main challenges for all sectors and regions, including the building sector in developing countries.
Within the Paris Agreement, 196 participants presented their updated nationally determined contributions (NDCs) in COP26 in 2020 to reiterate their commitment to reducing GHG emissions [10]. The two most common GHG mitigation measures in international pledges are to increase renewable energy use and enhance building energy efficiency [5]. However, many nations have struggled to address GHG mitigation in the life cycle of buildings and continue to use inefficient construction and building operation methods [5,11]. Scholars, industry practitioners, and government officials have proposed ambitious measures to reduce buildings’ energy consumption and GHG emissions in buildings throughout their life cycle. There are different alternatives to reduce emissions at the product stage, construction phase, usage stage, and end-of-life stage [12]. Among others, the options include changes in the steel [13] and cement production [14] processes; optimization of building designs and alternative construction systems in the construction stage [15]; passive design and service systems in the operational stage [16]; and circularity of materials at the end of life stage [17].
Despite extensive research on GHG emission reduction strategies for the building industry, these strategies are only just beginning to be implemented globally [5]. A lack of integration among stakeholders is one of the key obstacles to GHG emissions mitigation actions in the building sector [18]. The reasons for this are multiple. First, the plurality of participants throughout all life cycle phases creates complicated relationships in the building sector [19]. There are different actors intervening in building design, construction, financing, operation, and maintenance processes [20]. Second, actors have different interests, affecting decision-making procedures [20,21,22]. Third, different players are impacted in very diverse ways by the adoption of GHG mitigation strategies. Some actors win, and some actors lose, depending on the type of interventions used to minimize GHG emissions [23]. These factors generate differences and conflicts between actors. One of the main goals established during COP26 to develop mitigation actions to face climate change is mutual work among all stakeholders [24]. This includes governments, businesses, academia, and civil society. In order to understand the role and importance of different stakeholders inside specific contexts, social network analysis (SNA) has been widely applied [25,26]. In the building sector, SNA has been used to understand the relationships between stakeholders of the biomass industry [25], comprehend the influence of the actors impacting building energy efficiency [27], and understand stakeholders’ influence on green retrofit projects’ success [28], among other analyzes.
Therefore, even though SNA has been applied in the building field, and the absence of integration among stakeholders has been recognized as one of the main barriers to achieving GHG emissions mitigation, most studies have focused on specific problems rather than the overall characterization of the sector [29]. In particular, building sector stakeholders’ characterization via SNA strives to improve engagement and knowledge transfer [30], align internal collaboration [29], and identify potential problems [31]. Thus, due to the necessity of lining up stakeholders toward common goals to achieve GHG emissions mitigation, this study analyzes the network of key actors and stakeholders involved in the design and implementation of the Colombian Net-Zero Carbon Buildings Roadmap.
This study aimed to identify the key players within the major enablers of the roadmap (policy, technology, finance, and capacity development) and to identify the critical links and relationships among stakeholders. The results of this analysis are useful for the implementation phase of the Colombian Net-Zero Carbon Buildings Roadmap. Policymakers can take advantage of the findings in multiple ways. First, they can identify fundamental actors per category and their tasks. Second, they also can recognize potential challenges, such as the lack of integration among crucial stakeholders in certain links within the networks. Third, SNA helps identify potential opportunities for collaboration. Due to the complexity of relations among actors in the different enablers to achieving GHG emissions mitigation, SNA is a suitable tool for supporting the subsequent phases of the roadmap.
2. Background
2.1. Zero Carbon Building Accelerator Project in Colombia
There are different international initiatives to support compliance with the long-term mitigation goals established in the Paris Agreement. An example of these initiatives is the Zero Carbon Building Accelerator (ZCBA) project carried out by the World Resources Institute (WRI) with the support of global partners such as the Global Environment Facility (GEF), the United Nations Environment Program (UNEP), and the World Green Building Council (WGBC) [32]. In the first stage, the program supports Colombia in mitigating buildings’ GHG emissions. The project led by the CGBC consisted in designing the Colombian Net-Zero Carbon Buildings Roadmap. Between 2021 and 2022, different stakeholders from the national government, local governments, building industry, and academia participated in formulating the roadmap. The CGBC performed nine workshops between May 2021 and February 2022. Each month, nine groups of experts met to elaborate and define the roadmap by discussing multiple points of view. The CBGC employed a snowball technique [33,34] to gather as many experts as possible during the workshops [35]. This technique involved beginning the initial workshops with a group of experts and gradually approaching new experts through the initial group. In total, 357 actors participated in the workshops, representing universities, private companies, construction guilds, the Colombian government, NGOs, and international organizations, among others [35]. Information about the participants is shown in Table 1.
In the process conducted by the CGBC, an exhaustive literature review to define the transformative actions required to achieve net-zero emissions in the Colombian building industry [35] was developed. These actions were established in concordance with the national policy of sustainable buildings [36] and classified according to their strategic importance in first-, second-, and third-level action categories. Additionally, actions were examined through the lens of four enablers (i.e., policy, technology, finance, and capacity development) (Table 2), as defined by the Global ABC Roadmap for Latin America [37]. Transformative first-level measures were defined (i.e., life cycle assessment, energy efficiency, green labeling, promotion of sustainable materials and systems, decarbonization of energy sources, sustainability standards, sustainability practices in the industry sector, information management, integrated urban planning, resilience, ecosystemic services, construction processes, and cross-cutting actions). Based on that, second-level actions were established for every first-level category within each enabler (i.e., 54 for policy, 43 for technology, 15 for capacity development, and 50 for finance). Subsequently, every second-level action was associated with a set of third-level action categories (or subgroups). Table 3 displays a graphical representation of a typical enabler associated with first level-measures, second-level actions, and third-level action categories.
The working groups, one per action category, responded to a questionnaire (Appendix A) [35] to evaluate second-level actions within the enabling groups. The results of this process were the base for the network analysis presented in this manuscript.
2.2. SNA in Construction and Sustainability
SNA has been implemented in a great variety of research fields for more than 80 years [34,38]. Grounded on graph theory, SNA takes advantage of its notation to represent sets of actors (nodes) and their relationships (links or edges) [39]. Therefore, it is frequently considered a relational model focused mainly on the stakeholders’ connections instead of their individual attributes [40]. Accordingly, SNA grants information about social structures, recognizing that each stakeholder is embedded in multiple systems defined by its connections [34]. To grasp information and construct SNA models, researchers usually rely on qualitative (e.g., semi-structured interviews) and quantitative (e.g., SNA metrics) methods [41].
Those qualitative and quantitative methods have been widely applied in the construction and sustainability fields. Schröpfer et al. (2017) evaluated, via questionnaires, the flow of knowledge of sustainable construction project teams in the UK and Germany [42]. Alexandrescu et al. (2016) studied the social network of brownfield regeneration actors through semi-structured interviews, evaluating their embeddedness across regeneration goals [43]. Xu et al. (2021) investigated the stakeholders’ power in cutting emissions and energy savings in building energy performance; this was achieved through literature review and semi-structured interviews [27]. More recently, Jin et al. (2021) proposed qualitative and quantitative methods to create an SNA model to evaluate construction industrialization in the Hong Kong building sector, focusing on industrial performance and sustainability [44]. These studies collected qualitative information through surveys, which subsequently were processed to build social networks and compute network- and actor-based metrics to understand underlying information about network structures and stakeholders [21,45,46].
Furthermore, similar studies within specific contexts have found network structures for green building projects prone to be dominated by consultant enterprises rather than universities [1], highlighting the importance of studying network structures rather than assuming main actors. Moreover, SNA studies focused on timber structure building observed that a lack of collaboration and understanding of network structures could jeopardize a project’s quality [4]. Indeed, researchers have identified major project concerns to achieve common goals through the position of stakeholders in networks, prioritizing the main concerns according to the actor’s centrality indexes [2]. In line with this, this study strived to identify the potential network structures of the four major action categories (policy, technology, finance, and capacity development) of the Colombian net-zero roadmap for the building sector, finding the prominent actors and underlying network structures of each category.
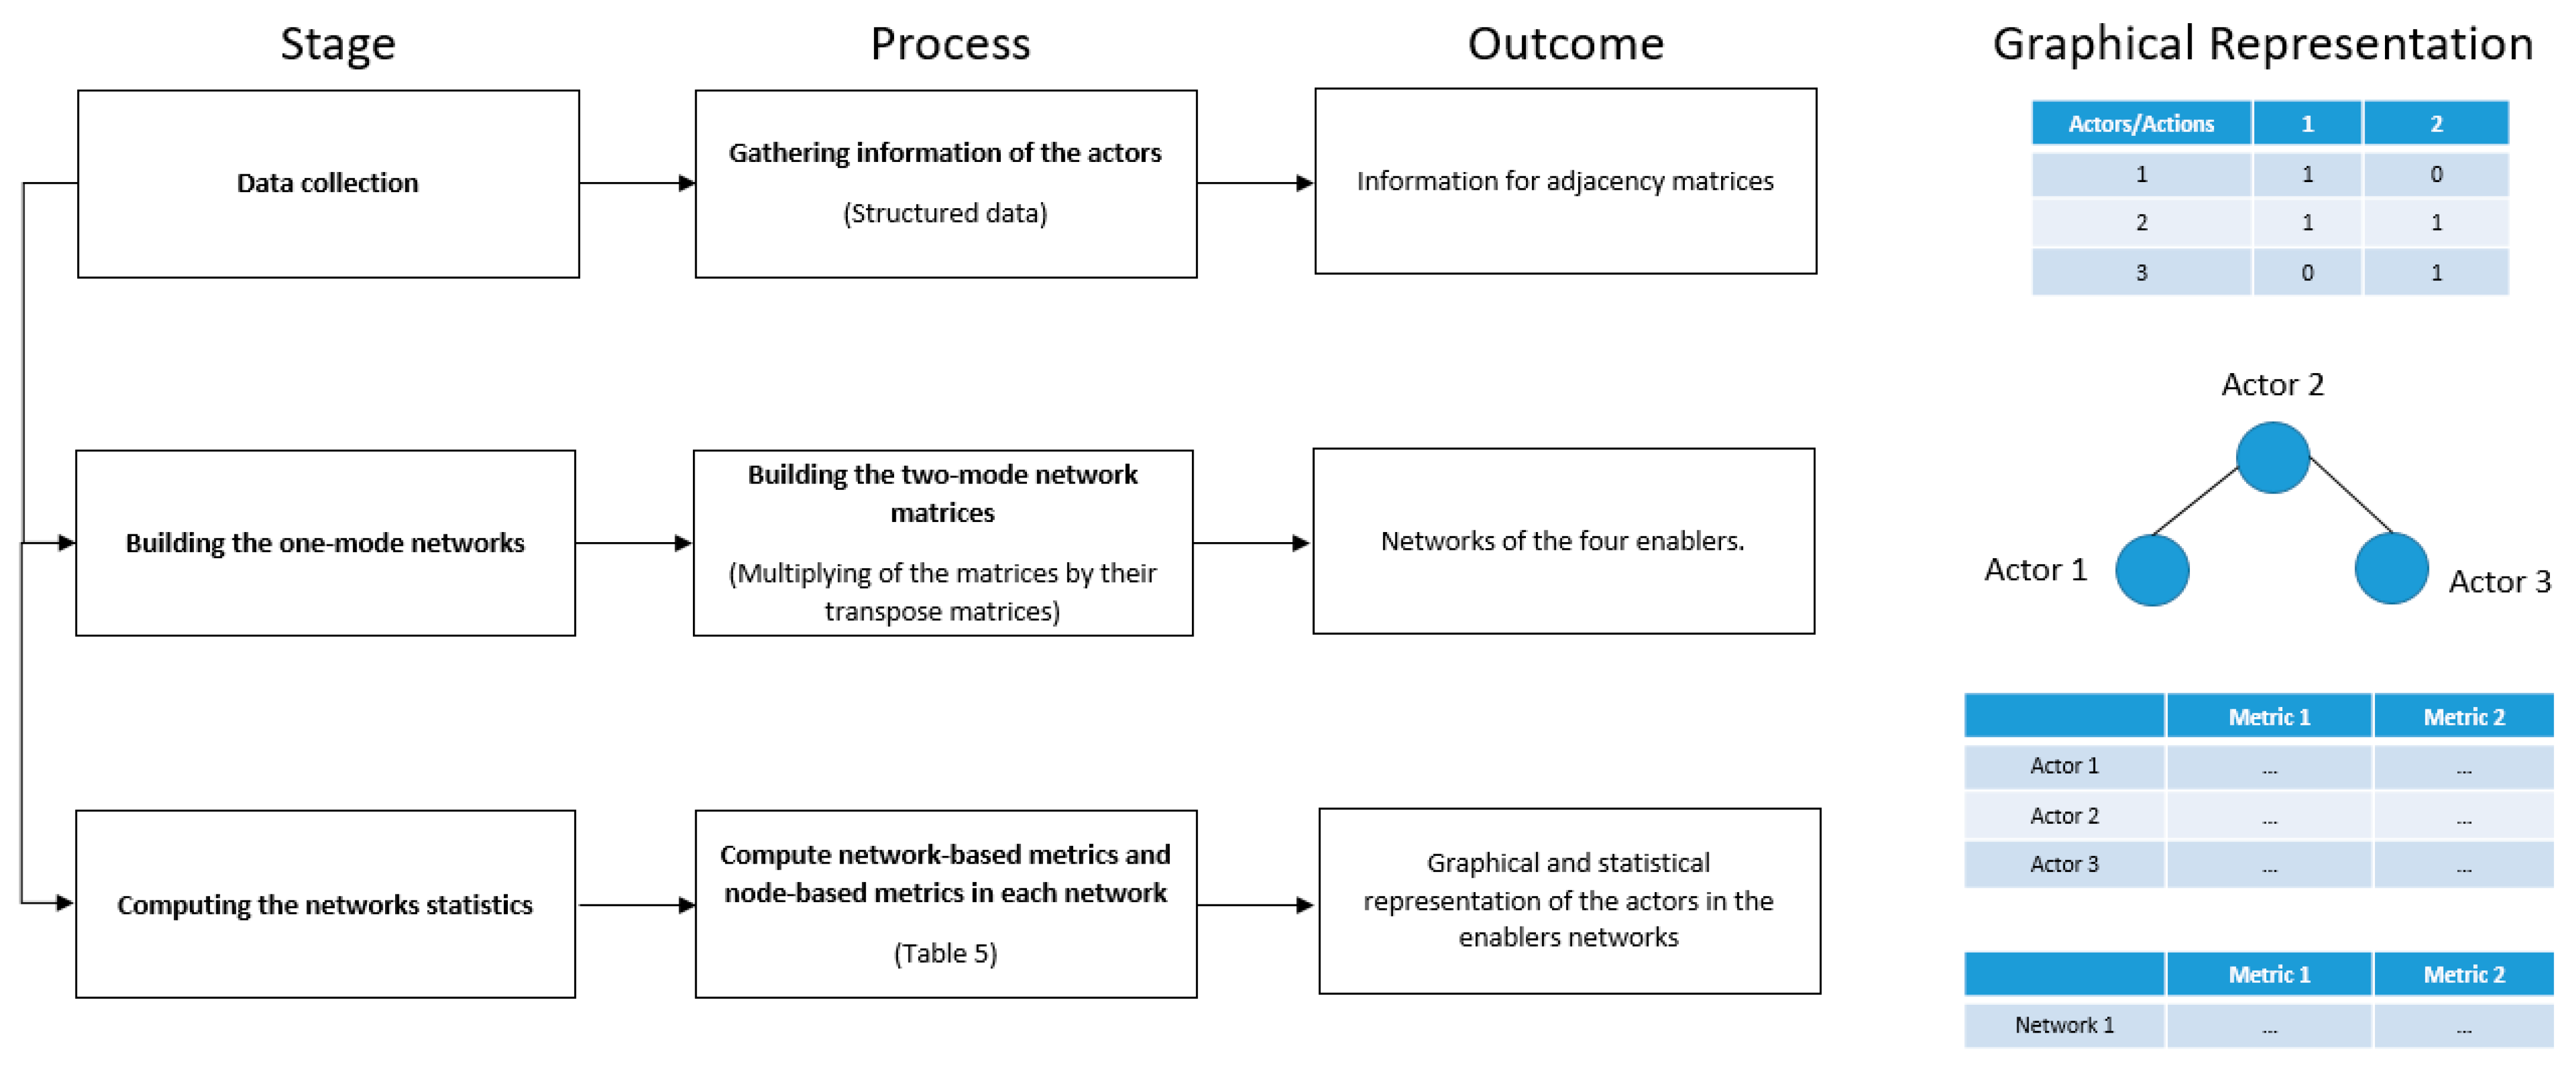
3. Methodology
This study sought to analyze the network of key actors and stakeholders involved in the design and implementation of the Colombian Net-Zero Carbon Buildings Roadmap. We conducted an SNA to characterize and examine prominent actors and critical relationships associated with achieving a net-zero carbon transition in the Colombian building sector. We followed a three-step methodological approach, as shown in Figure 1. Stage 1 involved collecting data from the results of the questionnaires conducted by the CGBC. The data referred to information that regarded stakeholders that had to participate in the main goals established to achieve net-zero emissions. These data were represented initially within reference matrices. In the matrix, if actor i participated in the second-level action j, the value of this cell was 1. With the expert answers, we filled out one reference matrix per each enabler, following the rule: a cell filled with the number “one” represented the situation when, according to the experts’ answers, there was a common ground of the necessity of an actor to participate in an SLA (Figure 2). In the second stage, we processed the collected data and developed four two-mode networks following the methodology proposed in previous studies [21,34]. For each enabler, we built a two-mode network. In step three, the two-mode networks were transformed into one-mode networks by multiplying each enabler matrix by their transpose matrix. We developed four actor networks per enabler and finally computed the SNA metrics. These networks were drawn and computed with UCINET 6 [47].
3.1. Stage 1: Data Collection
We employed the information collected by the CGBC, supplementary information (https://www.cccs.org.co/wp/download/reporte-de-recomendaciones-proyecto-acelerador-de-edificaciones-neto-cero-carbono/, accessed on 28 August 2022), across the workshops (Appendix A) and analyzed the responses to the questionnaires to develop network diagrams and indicators. We identified participants and actor categories within the Colombian building sector (see Table 4) and their corresponding links with second-level actions (SLAs) in each one of the four enablers (e.g., policy, technology, finance, and capacity development actions). We considered actors’ and SLAs’ complexity, nature, and specific properties.
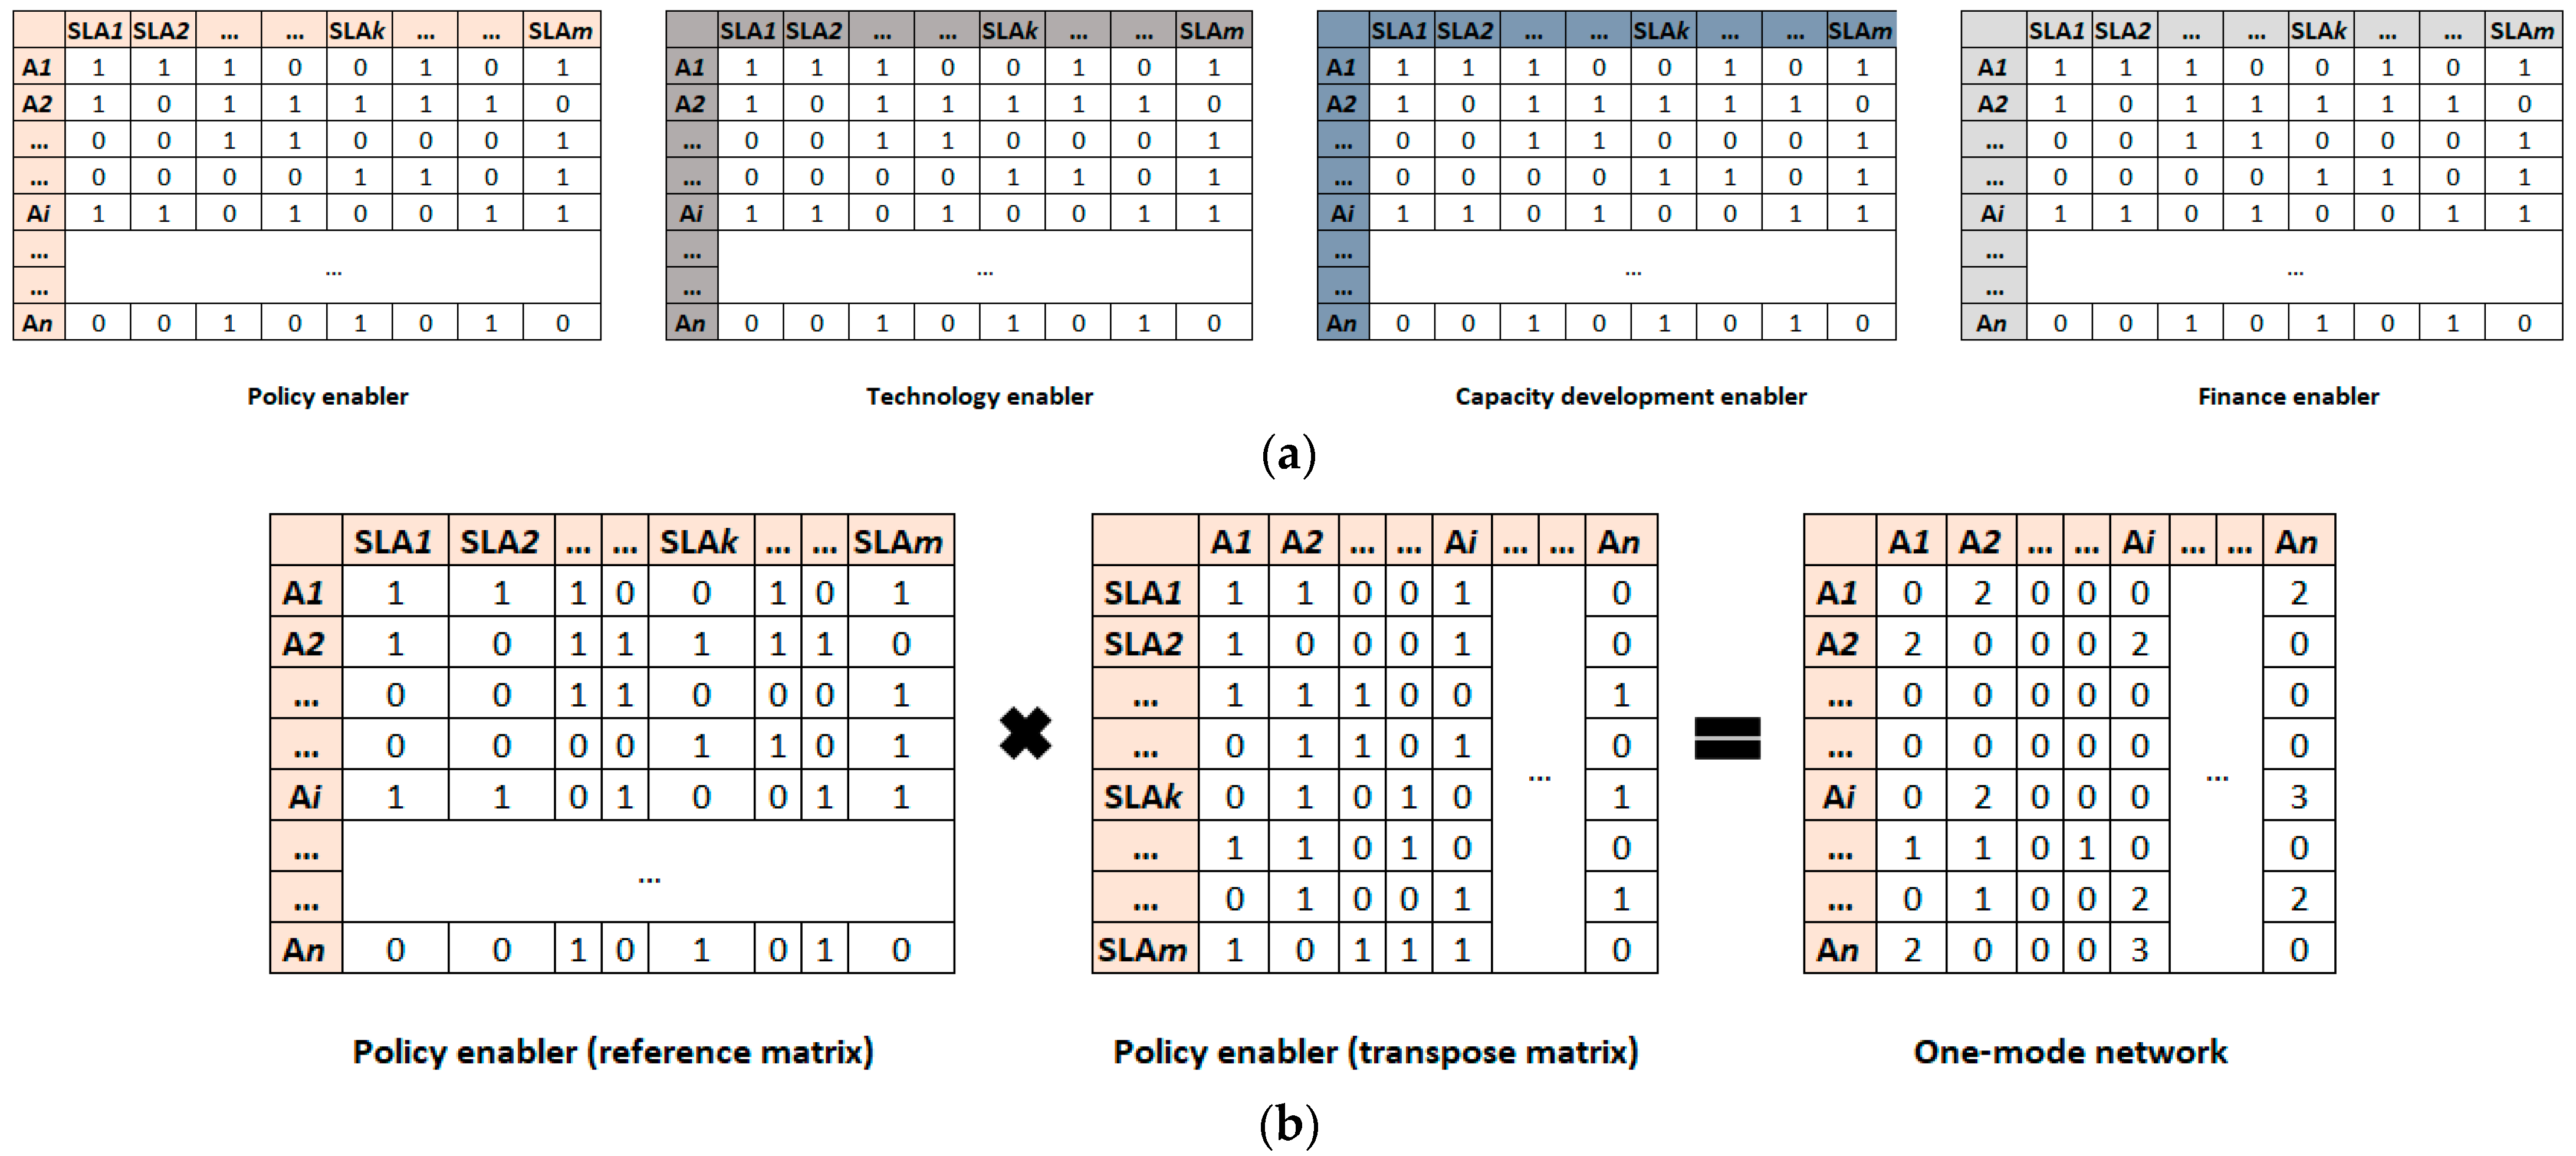
Relationships between actors and SLAs were organized into four reference matrices (one per enabler) (Figure 2a). We followed the methodology proposed in similar analyzes [21]. For each enabler, the rows corresponded to actors, and the columns represented the second-level actions. In each cell in this matrix, Aik was assigned a value of 1 if actor i participated in the SLA k; or 0 otherwise.
3.2. Stage 2: One-Mode Networks
Once the reference matrices (two-mode arrays) were developed, we calculated the adjacency matrix (one-mode array) associated with each enabler. To obtain the one-mode network adjacency matrix per enabler, it was required to multiply the reference matrices obtained in Figure 2a by each one of their transpose matrices. This step followed the projection method for transforming two-mode networks to one-mode networks presented in previous studies [48]. Figure 2b represents this process for the policy enabler network. This process allowed for obtaining the arrangements representing one-mode networks, which related to all the participants in any given enabler [21]. The cells Aik and Aki in Figure 2b represented the number of SLAs in which actor i (Ai) needed to participate with actor j to develop the established actions per enabler.
3.3. Stage 3: Computing Network Statistics
After developing the four one-mode matrices, the authors input them into UCINET 6 in order to produce network metrics and diagrams. Table 5 describes the two types of network metrics employed in this study. Network-based metrics helped to understand each network globally [21]. Actor-based metrics provided information on the role of each individual stakeholder within their specific network. The selection of these metrics was consistent with previous studies in the fields of construction and sustainability [21,34,41,42,43,44,45,49], which have proven to provide valuable information about network configuration [21,50]. For each one of the four enablers (e.g., policy, technology, finance, and capacity development), using the matrices obtained in stage 2, this last stage consisted of drawing one-mode networks with UCINET 6 [47] and computing network statistics according to the metrics presented in Table 5.
4. Results
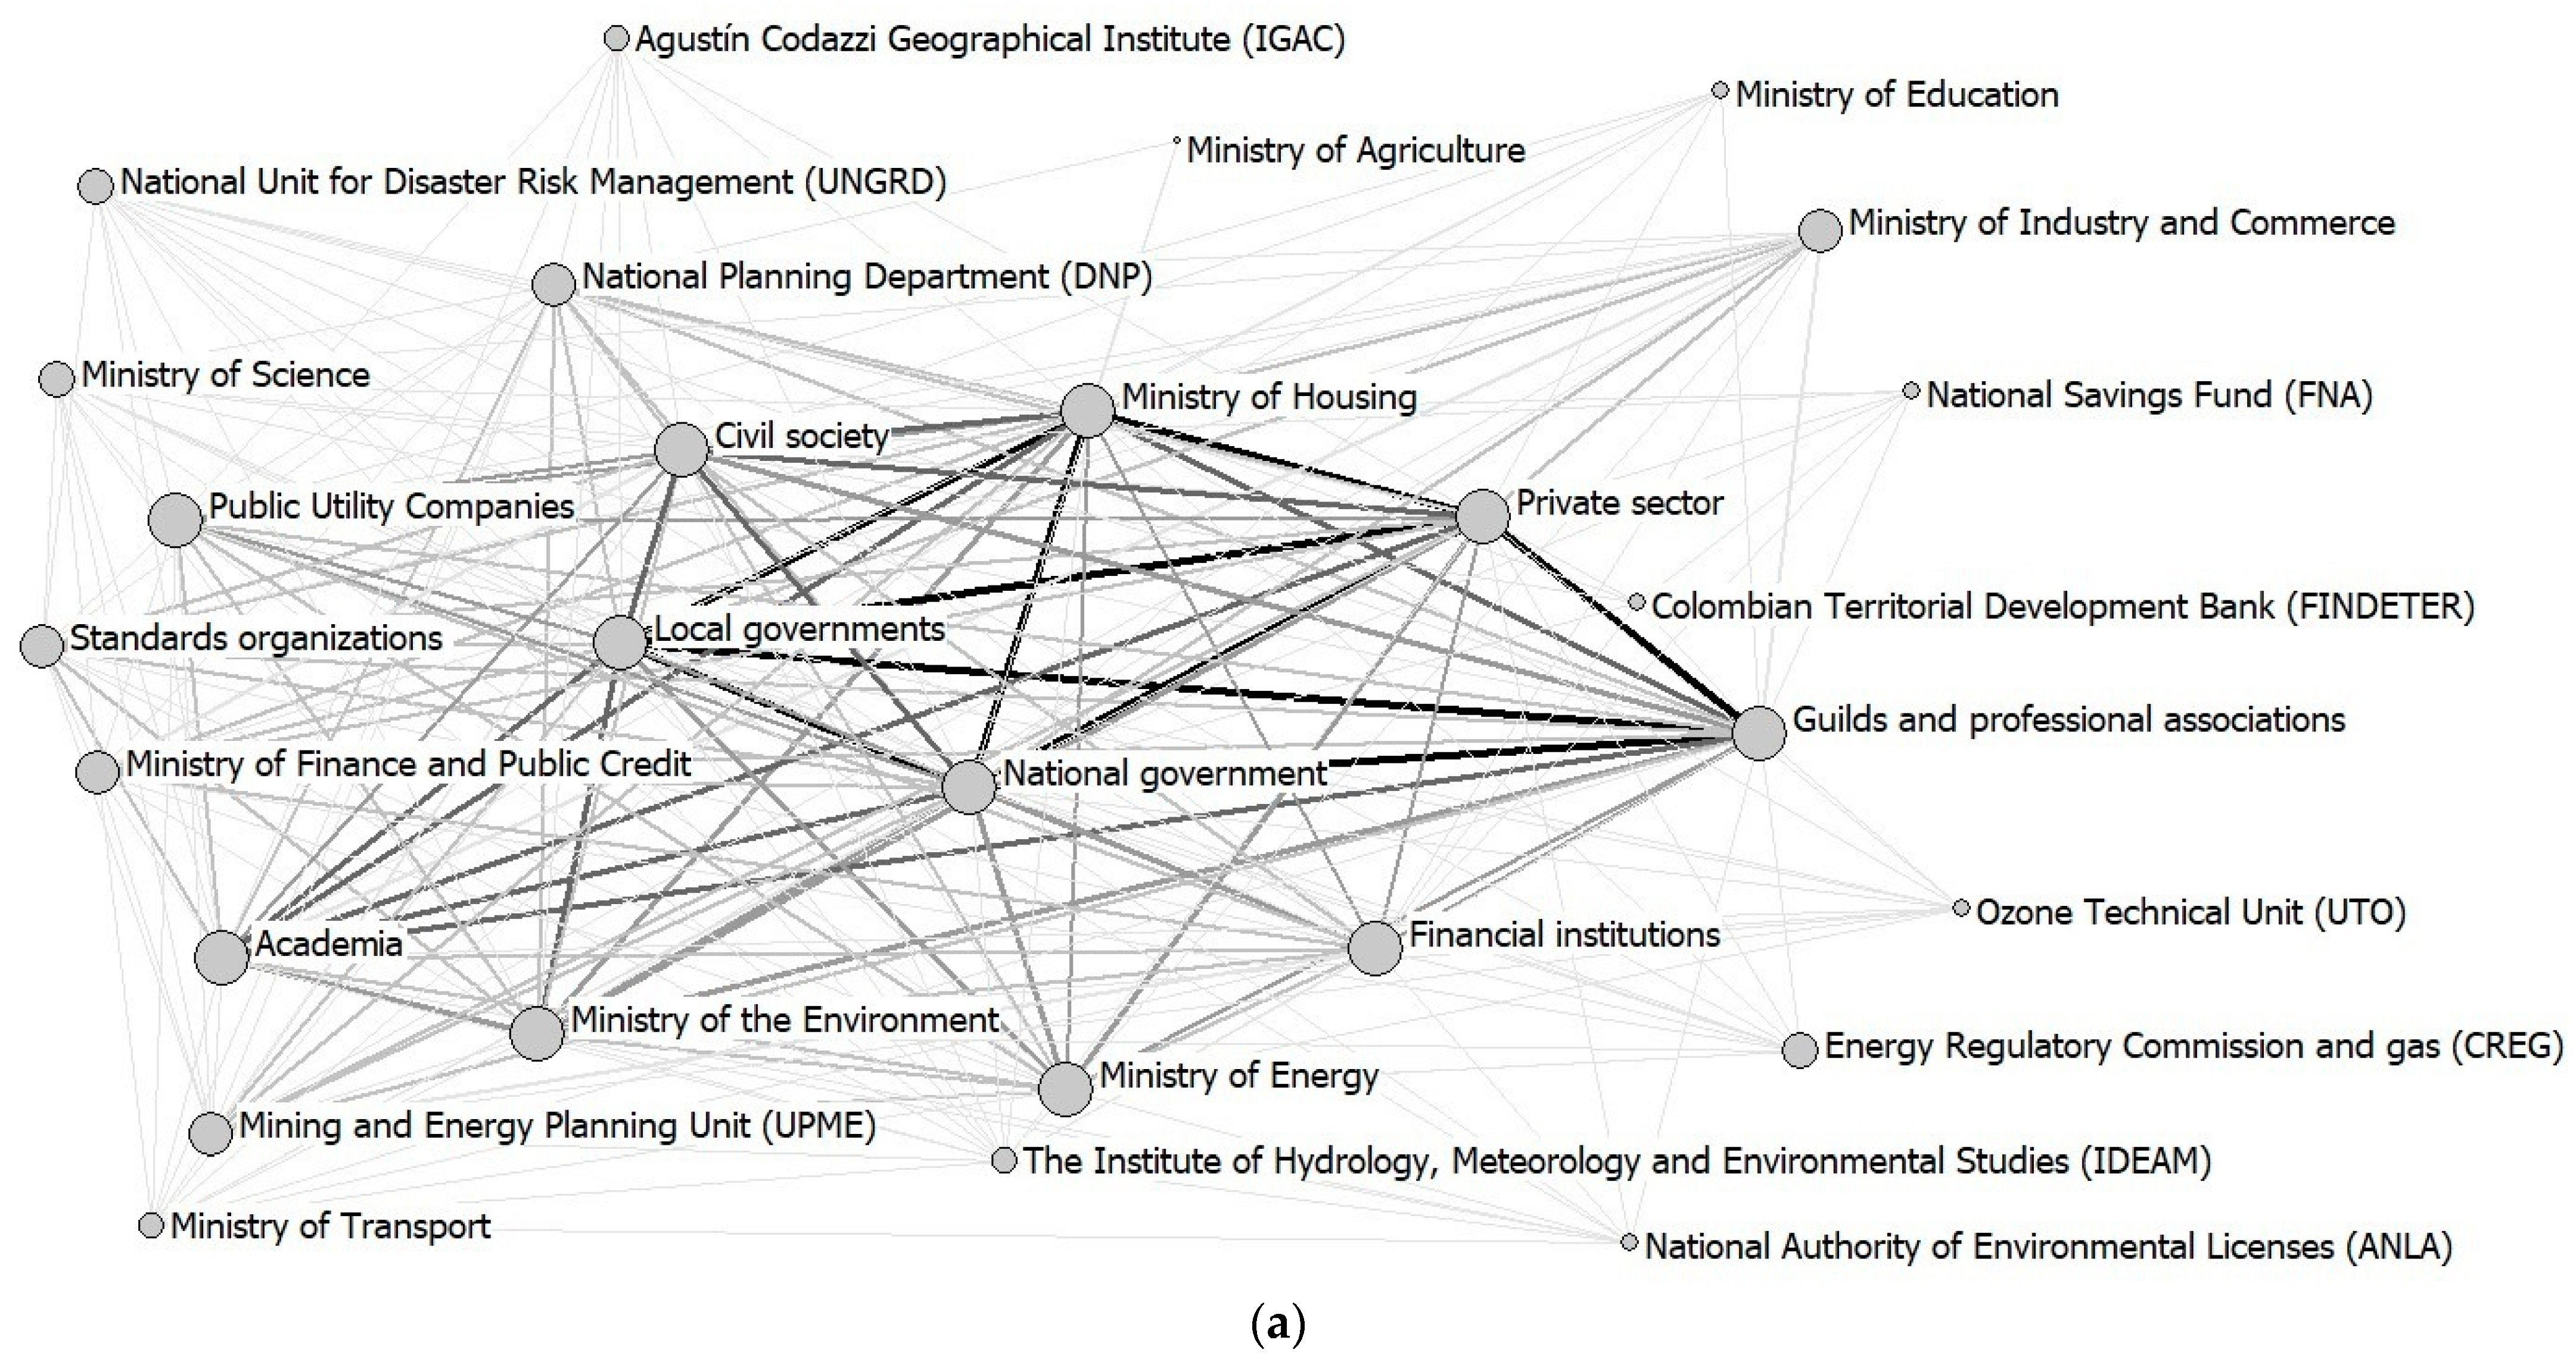
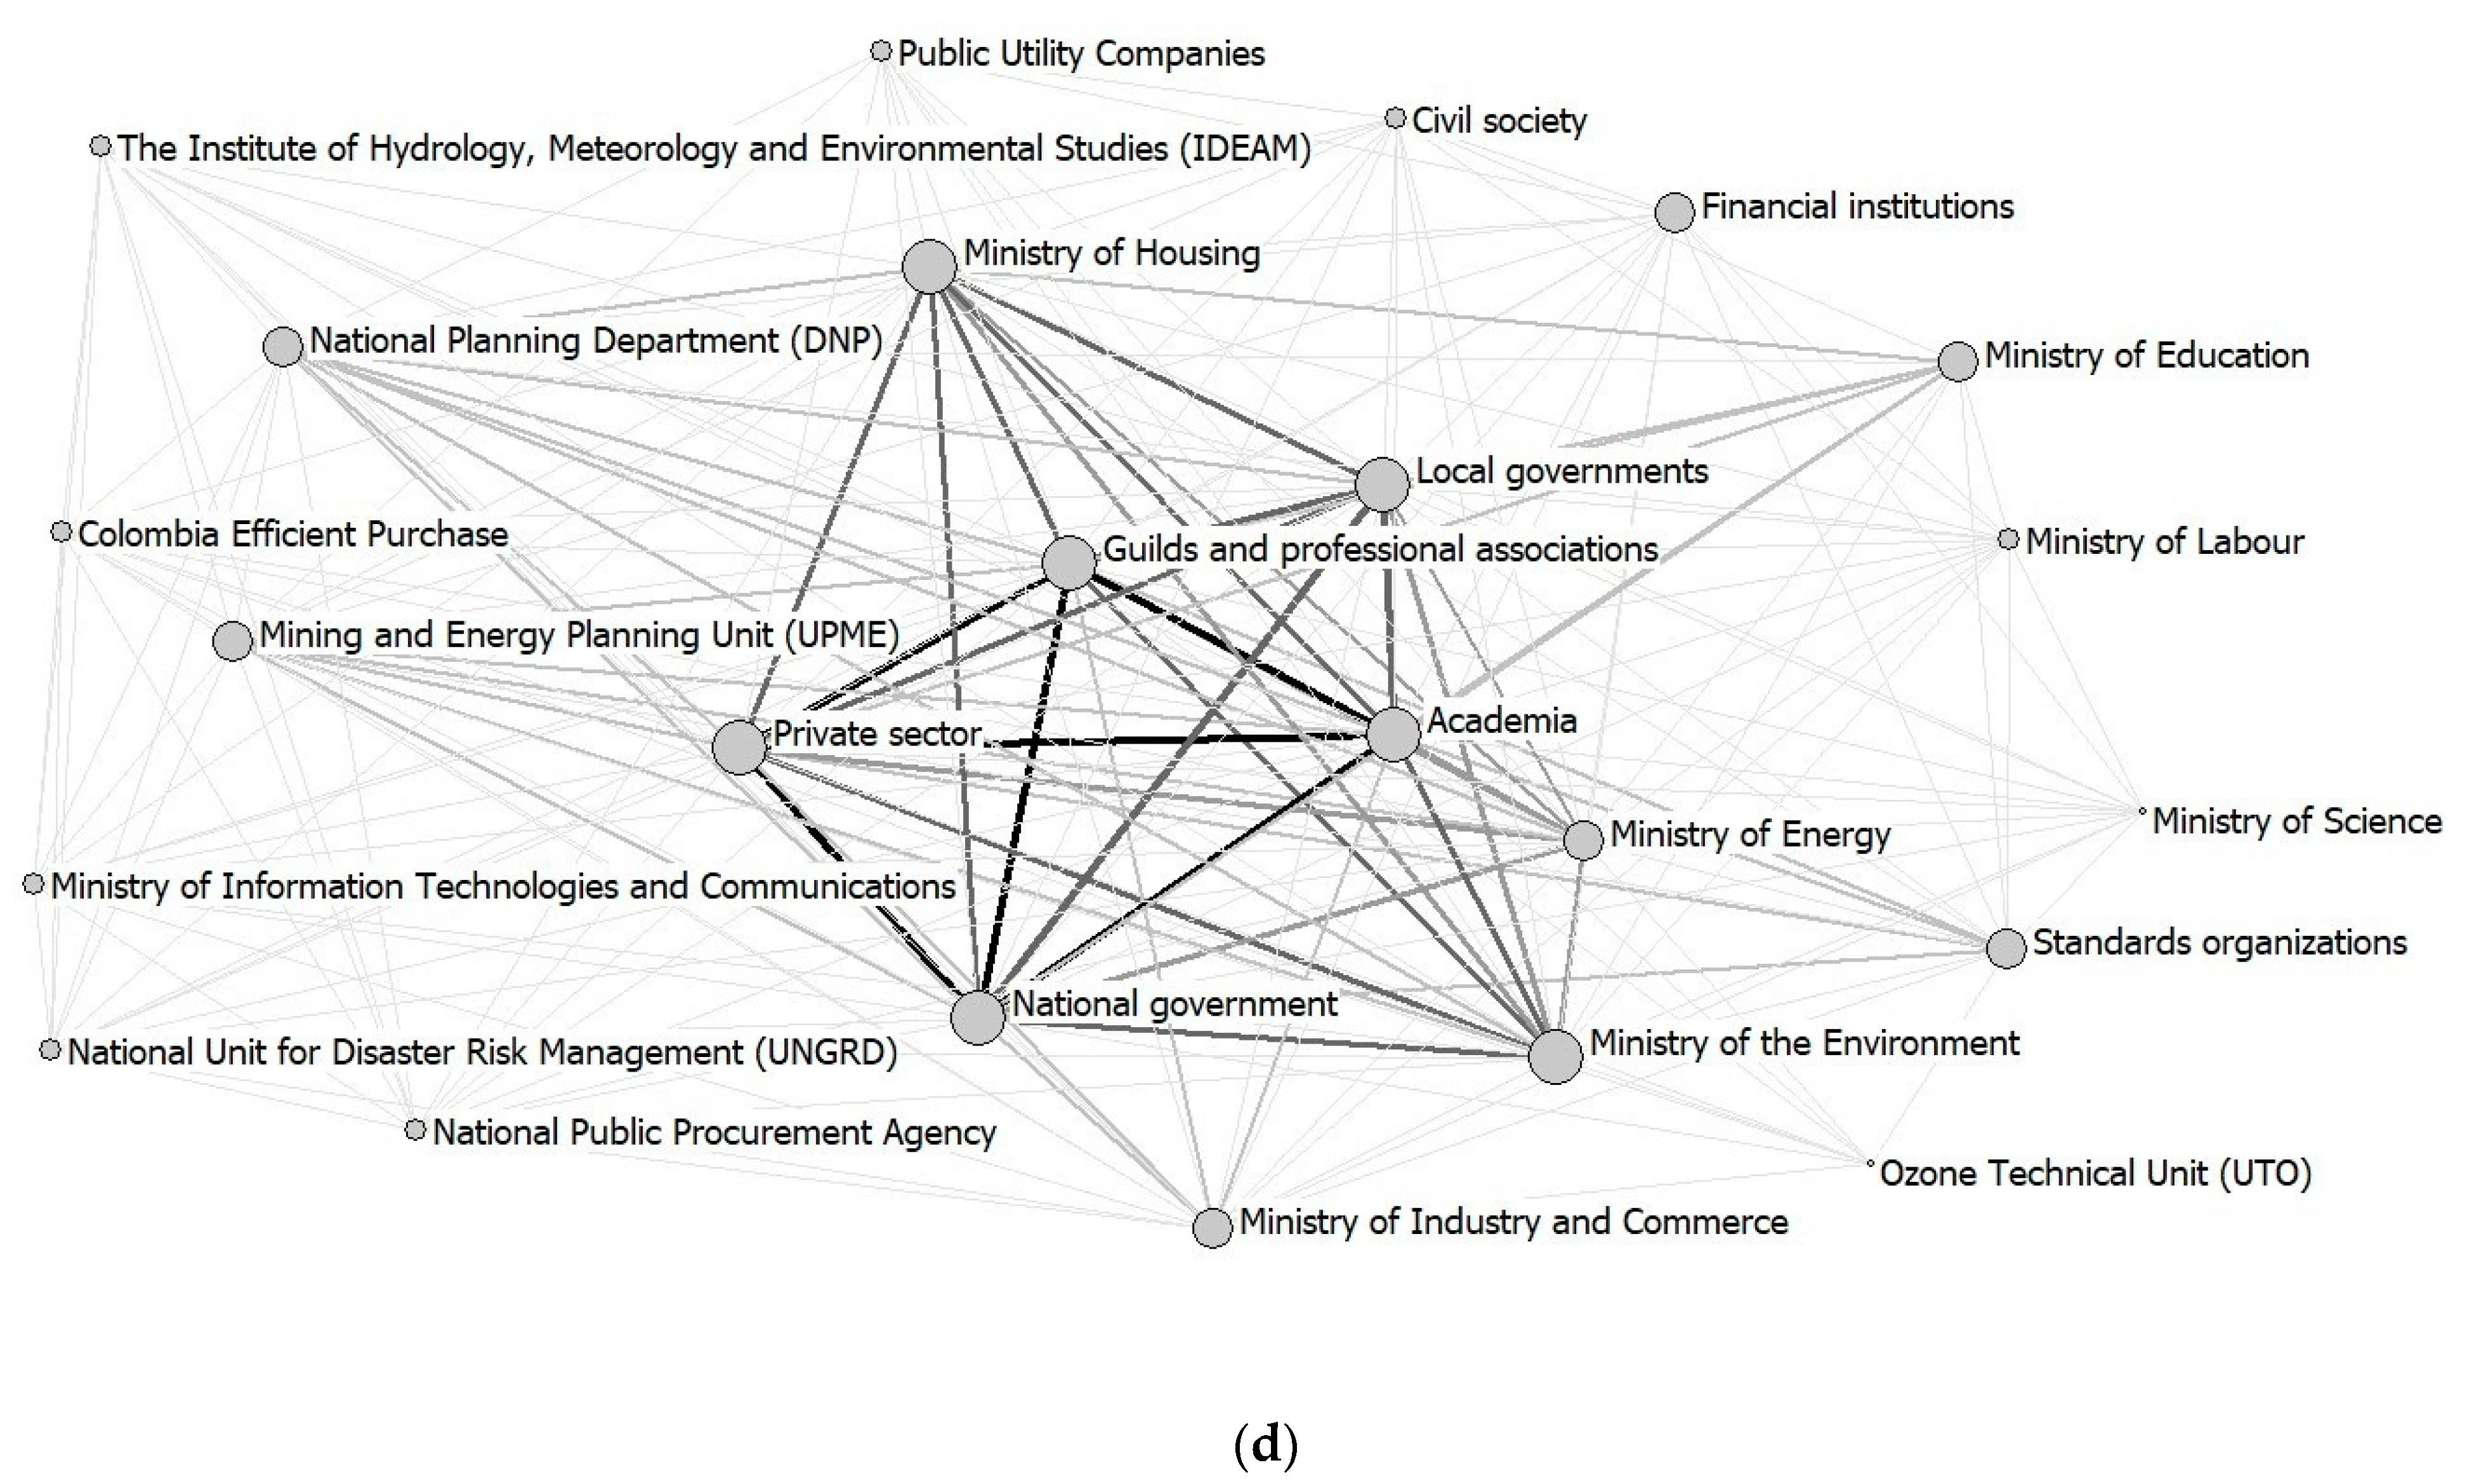
The networks developed for each enabler are shown in Figure 3. These networks showed the ties established between actors and the way each actor was integrated into the set of SLAs per enabler. This reflected the way the roadmap of the Colombian Net-Zero Carbon Building Roadmap was intended to be implemented. In each network, the size of the node representing each of the actors was proportional to the number of relationships of each stakeholder.
For each link in any network, the thickness and darkness of color were proportional to the number of times the pair of actors needed to participate together per enabler. The darker and thicker the link, the stronger the relationship between stakeholders because they had to participate more times together in second-level actions per enabler. To provide a quantitative interpretation of Figure 3, Table 6 and Table 7 show the results of the network-based metrics and actor-based metrics per network, respectively. These results allowed comparing the networks and actors participating in each enabler.
According to the network-based metrics (Table 6), all networks showed at least 23 stakeholders and exhibited density values higher than 0.5. The density values obtained meant that more than 50% of the possible relationships between actors took place within the proposed structures. Such density values also indicated that the actors participating in achieving net-zero emissions in the Colombian building sector needed to keep redundant relationships among them. The density values obtained showed a difference from previous studies, in which similar networks exhibited density values lower than 0.5 [21,41,45]. The redundancy in network relationships could also be examined by exploring indicators such as average distance and degree. While many studies in the extant literature exhibited short average path lengths higher than 1.5 [45,50], the four structures presented in this study exhibited values lower than those. This denoted that Colombian stakeholders required fewer links to communicate with each other, suggesting that all actors in the enabling networks remained highly interconnected. Furthermore, regarding the average degree, most stakeholders revealed multiple relationships, supporting the idea of a vastly interconnected network.
Even though the above-mentioned network-based metrics (e.g., density and short average path length) suggested the idea of highly interrelated networks with well-connected actors in each enabler, the degree of centralization indicated that the studied networks seemed to be dominated by central actors. In particular, the degree centralization exhibited its highest value in the finance network, in which the degree centralization for the national government showed a value of 0.45 (see Table 7). Overall, degree centralization values were higher than 0.25 in all networks, indicating the dominance of well-connected players across all arrangements.
Table 7 identifies the main actors whose efforts are necessary to achieve net-zero emissions in the Colombian building sector. This table shows the 15 most prominent actors in each network by considering multiple actor-based metrics (i.e., D—degree centrality, C—closeness centrality, B—betweenness centrality, and E—eigenvector centrality). It is important to highlight that the national government, local governments, guilds and professional associations, financial institutions, the Ministry of Environment, the Ministry of Housing, and the private sector were cross-sectional participants in all enabling networks within the building sector. This means that they all should participate as leading actors in supporting the proposed SLAs.
4.1. Characterization of Enabling Networks: Similarities and Differences
All the enabling networks shared some common structures. Figure 3 and Table 6 show that the short average path length in all networks exhibited low values, varying between 1.23 and 1.36, thus, indicating efficiency and few intermediaries in the communication among stakeholders [50,53]. In respect of the average stakeholders per network, it is worth appreciating that the average number of actors in charge of each second-level action varied between 8.82 and 10.4, exhibiting high levels of participation per SLA in each enabler. In this sense, the density values varied between 0.57 and 0.77, and the average weighted degree indicated very interrelated networks, strengthening the idea of highly cohesive networks with redundant components and connectivity [41,50,57]. Even though there were common attributes across the enabling networks and relative homogeneity in their network-based metrics, there were also some singular attributes. Specifically, in terms of network sizes, it is important to highlight that despite differences in the number of SLAs assigned to each network, the number of participants in every structure remained very similar across the four studied structures. For instance, while the capacity development network incorporated three times fewer SLAs than the policy network (i.e., 15 vs. 54 SLAs), the number of actors in each one was 23 and 28, respectively. Similarly, the technology and finance networks had associated 43 and 50 SLAs and 30 and 35 participants, respectively. This indicated that the number of actors was not related to the number of second-level actions but to the complexity and synergies of each specific enabling network. Consequently, the set of actors in charge of developing the proposed enablers varied according to the priorities, value chains, and skillsets [58].
On the other hand, the degree centralization metric displayed in Table 6 highlighted differences among enablers. Even though all the degree centralization values were low (less than 0.5) compared to some values found in the literature [59,60], the enabling networks denoted important variations in this metric. In particular, the values of the finance (0.45) and technology (0.42) networks were close to 0.5, indicating the presence of intertwined structures prone to be controlled by a few main actors (i.e., the national government). This tendency was smaller in the policy and capacity development networks due to these exhibiting less centralized structures. In general, while high centralization values were associated with the degree of power of an actor in the decision-making process, low centralization figures indicated plurality in such a process [61,62]. Thus, and according to Table 6 and Table 7, the national government seemed to act to coordinate and avoid conflicts among actors, mainly in the policy, technology, and finance enabling networks, as it was the most dominant player in these structures. In contrast, in the capacity development network, in which there was not a clear, prominent player, the guilds and professional associations, national government, and academia seemed to be responsible for playing a crucial function in coordinating their roles to develop innovation [61].
This proposed set of network-based metrics allowed for understanding the overall structure of the networks’ actors in charge of decarbonizing the Colombian building sector. This analysis exhibited the strengths and weaknesses of each enabler network in terms of connectivity, participation, and centralization by finding similarities and distinctions between the networks of stakeholders. A deeper analysis of the main actors participating in each of the four enabling networks is presented below.
4.2. Characterization of ZCBA Actors across the Enabling Networks
Table 7 displays the 15 most important stakeholders in each enabling network according to their degree centrality (D), closeness centrality (C), betweenness centrality (B), and eigenvector centrality (E). Most of these actors were public entities (Colombian ministries, national government, and local governments). Still, many actors belonged to non-public sectors (private companies, guilds, standards organizations, and civil society), showing the need for joint work and coordination among different actors in achieving net-zero emissions goals in the Colombian building sector.
4.2.1. Public Policy Enabling Network
According to Figure 3a and Table 6, the public policy enabling network allowed for visualizing a highly interconnected structure within one single cluster. In this network, the five most prominent actors were the national government, local governments, the private sector, the Ministry of Housing, and guilds and professional associations. These players participated in at least 47 (87%) of the 54 SLAs proposed for this network. They held the highest values in all the actor-based metrics, showing the need to achieve a balance between the public sector and other actors to reach the net-zero emissions targets. Specifically, while the public sector seemed to be in charge of defining technical specifications, determining environmentally friendly procurement methods, and establishing mandatory energy codes, the non-public sector seemed to require working on procurement processes focused on the mitigation of CO2 emissions [63].
In addition to the five main actors in this network, four additional stakeholders appeared as second-tier actors, participating in more than 50% of the SLAs. In particular, academia, civil society, the Ministry of Environment, and the Ministry of Energy were seemingly important in implementing 29 of the 54 second-level actions within this network. According to the connection exhibited in Figure 3a and the metrics shown in Table 6, these second-tier actors seemed to focus on objectives associated with social inclusion and structural changes within the public policy realm [64].
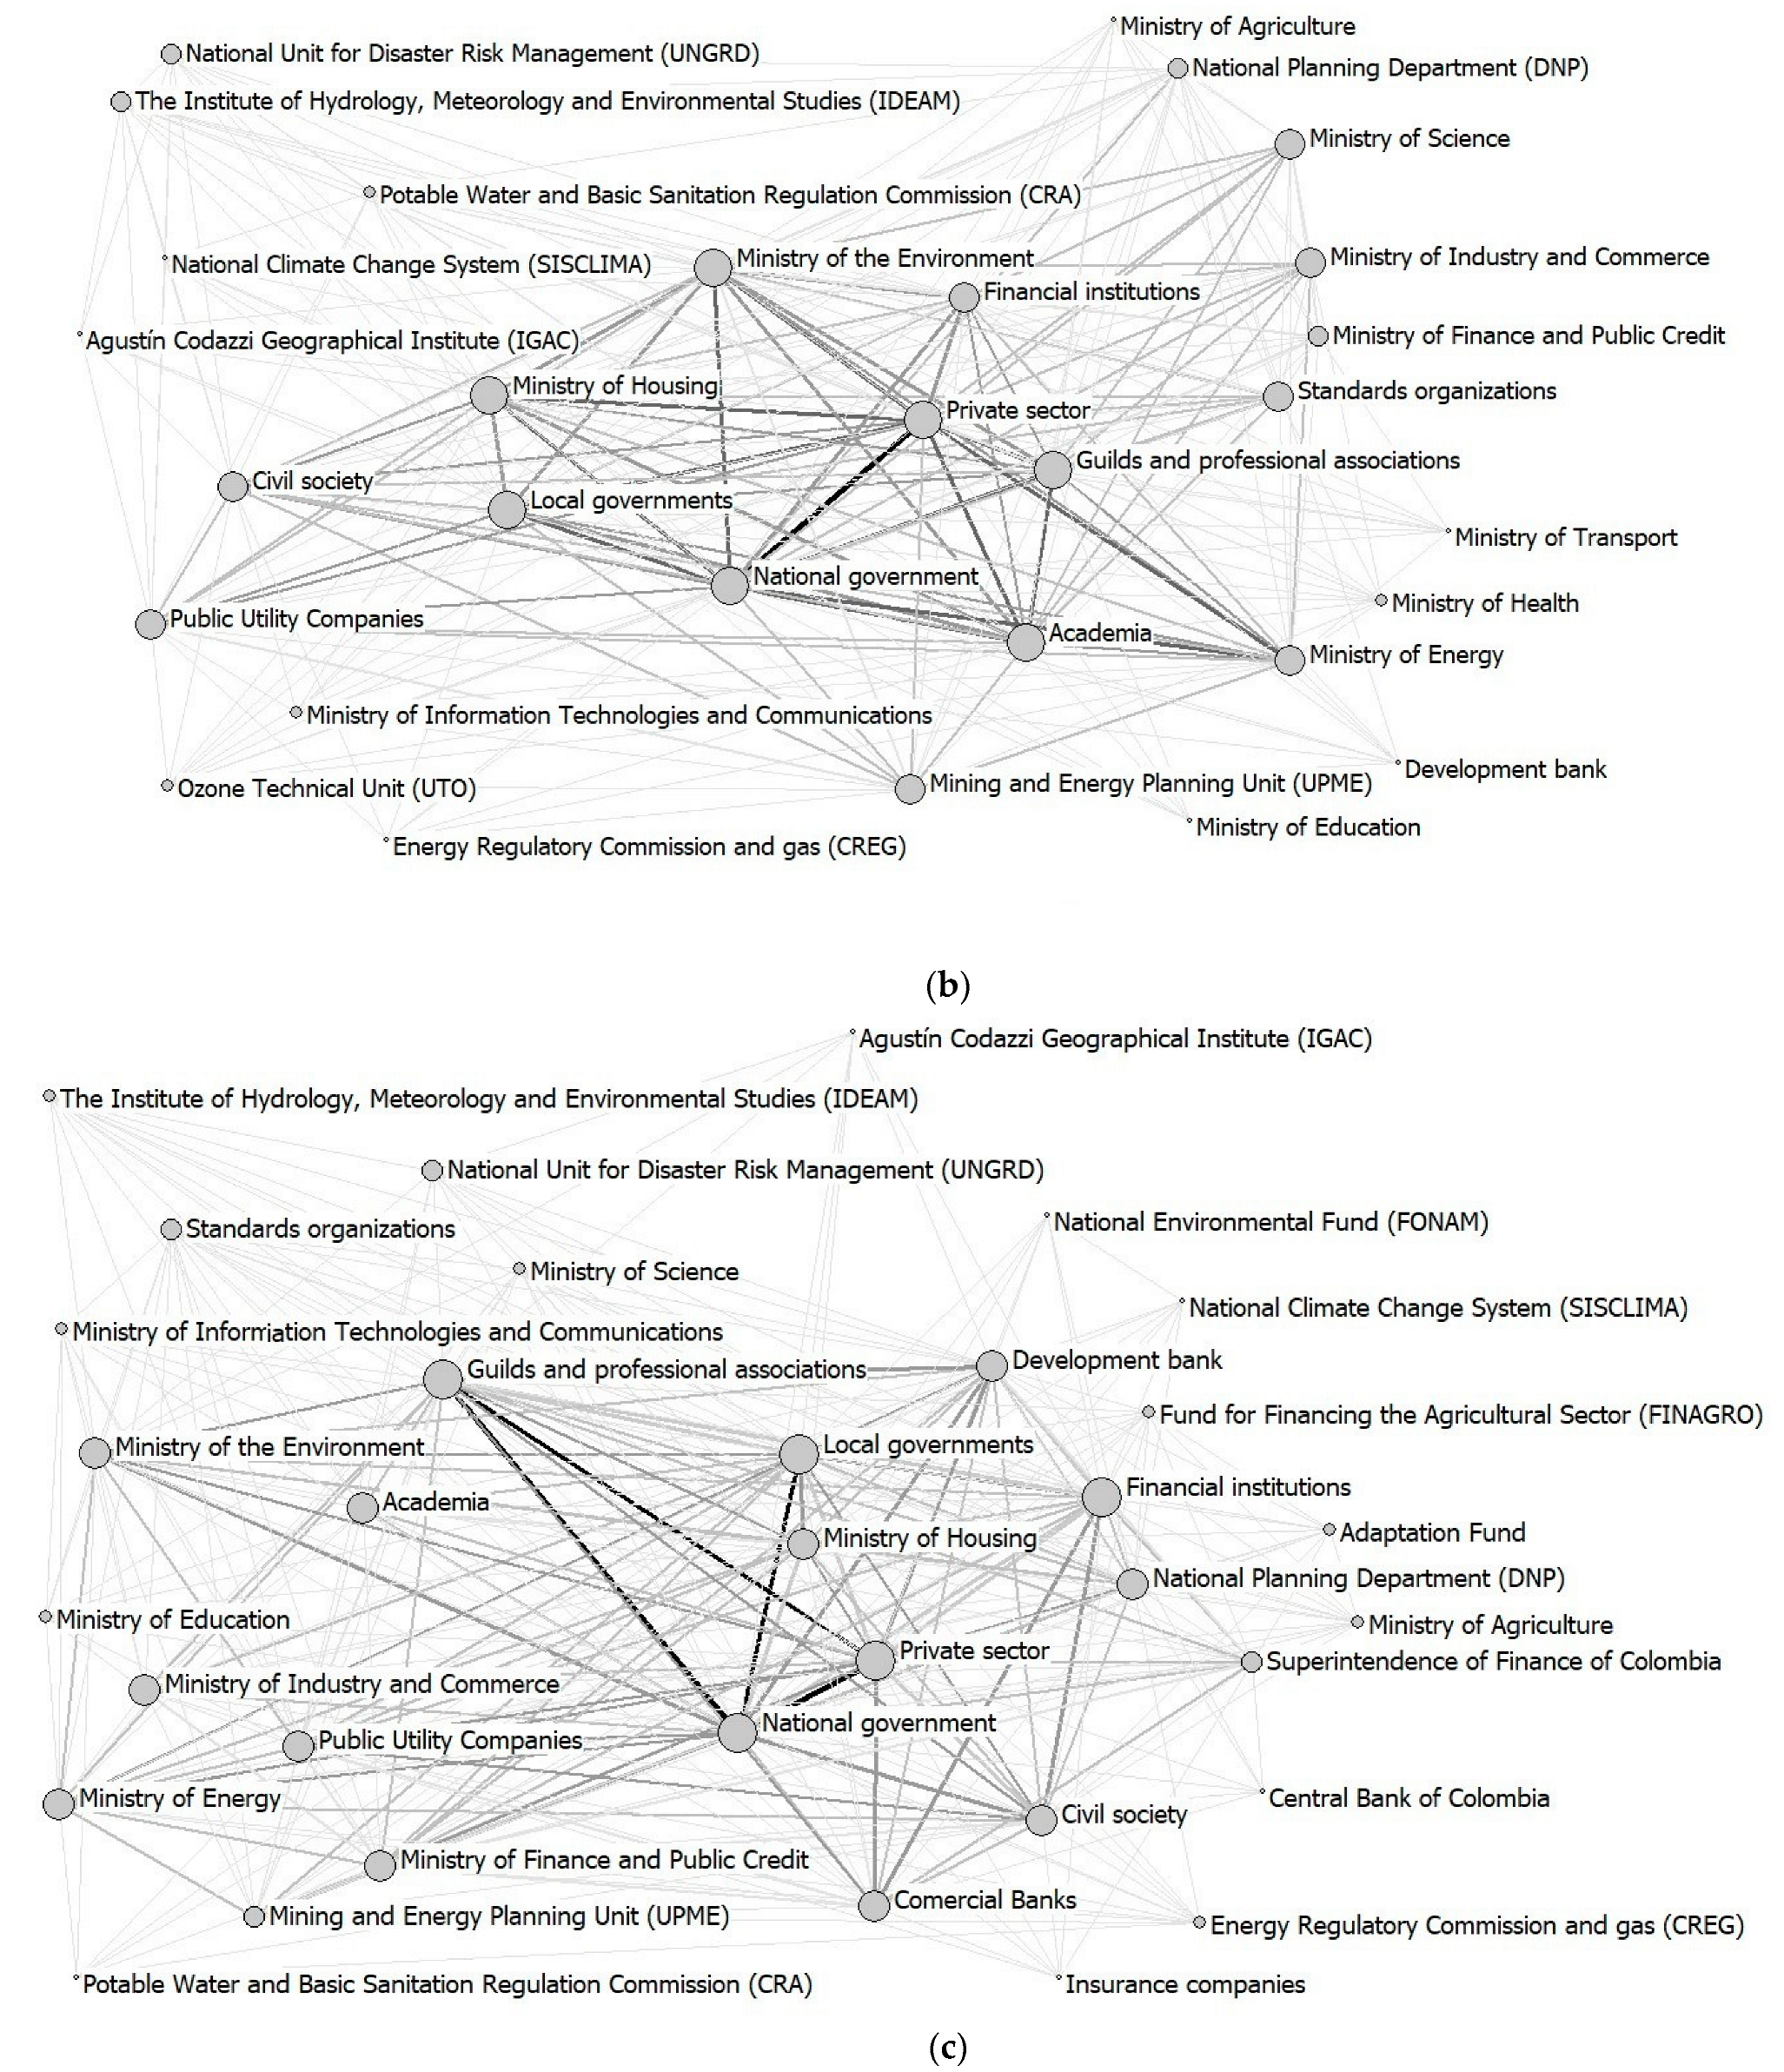
4.2.2. Technology Enabling Network
According to Figure 3b and Table 7, the technology-enabling network showed two prominent actors, the national government and the private sector. These two participants were involved in 42 second-level actions within this structure (i.e., 98% of all SLAs in this network). Both of these actors had the highest values in all actor-based metrics, showing their importance in developing the technology actions required to achieve net-zero emissions in the Colombian building sector. As proposed in previous studies [65], the government seemed fundamental in supporting research and development for environmental sustainability, while the private sector had a role in supporting innovation by investing in cleaner productive processes [65].
Apart from the two most prominent actors, eight stakeholders also exhibited essential values in their actor-based metrics (i.e., the Ministry of the Environment, academia, local governments, guilds and professional associations, the Ministry of Housing, the Ministry of Energy, financial institutions, and civil society). All these actors were influential in at least 21 second-level actions (i.e., 49% of all SLAs in this network). These stakeholders are prone to pursue multiple goals: improving sustainability, research, and development by establishing frameworks and supporting innovation, supporting the technological transformation financially, and veiling up for societal welfare.
4.2.3. Finance Enabling Network
Although highly interconnected, the finance enabling network was the least dense network within the four studied structures (Figure 3c and Table 7). This can be partially explained by the roles of the leading, prominent actors in this arrangement. In particular, the finance enabling network had the same two prominent actors as the technology enabling network (i.e., the national government and the private sector). However, and in contrast to the policy enabler network and the technology enabler network, the national government and the private sector participated in at least 42 SLAs (i.e., 84% of all SLAs within the network). This percentage was marginally smaller than the share of participation of the main actors in the policy and technology networks, even though the network-based metric values were in line with the values of the previously analyzed structures.
In this sense, the role of the government in this network seemed to be providing financial incentives and resources to make the transition towards net-zero emissions in the building sector economically viable. On the other hand, as suggested by previous studies, the private sector seemed to be involved in continuous collaboration with all stakeholders by mobilizing capital and capabilities [66].
Along with the leading actors in the finance enabler network, participants such as guilds and professional associations, local governments, financial institutions, the Development Bank, and civil society also stood out as important players in this structure. All these actors participated in at least 24 SLAs (i.e., 48% of all SLAs within the network). Interestingly, this set of actors contained mainly stakeholders belonging to the non-public sector. This group of participants seemed to focus on developing financial mechanisms to achieve net-zero emissions and guarantee coordination among government actors and other players.
4.2.4. Capacity Development Enabling Network
The capacity development enabling network exhibited four main stakeholders, namely, guilds and professional associations, the national government, academia, and the private sector (Figure 3d and Table 7). In general, these leading actors had the highest actor-based metrics and dominated the flow of information within the network, as they participated in at least 14 SLAs (i.e., 63% of all SLAs in the structure). However, compared to the other three enabling networks, these actors exhibited slightly less centralized behaviors, which made relationship patterns less dependent on the national government and private sector. Instead, relationships seemed to focus on the roles of guilds and professional associations, and academia, as these players seemed to be centered on disseminating the knowledge and establishing the technical bases required to achieve net-zero emissions.
In addition to the leading actors mentioned before, the local governments, the Ministry of Housing, the Ministry of Environment, and the Ministry of Energy exhibited an important role within this network, as each one of these stakeholders participated in at least eight SLAs (i.e., 53% of all SLAs within the structure). While local governments seemed to be focused on coordinating the dissemination of information and knowledge at local scales, the ministries of housing, environment, and energy showed behaviors associated with developing standards and defining regulations for establishing common ground regarding the knowledge and capacity required to reach net-zero emissions.
5. Discussion
There were common actors leading the four enablers (policy, technology, finance, and capacity development) to achieve GHG emissions reduction in the building sector. Three of these actors, the national government, local governments, and the private sector, appeared as one of the main five leaders in all the categories, suggesting common main actors of all networks. These similitudes were strengthened with the network-based metrics, presenting high values compared to previous literature analyzes [21,41,45]. Despite this, the action category networks also had distinct features. For instance, while in the policy network, the Ministry of Housing was the main actor, in the technology network, this role was occupied by the Ministry of Environment. The guilds and professional associations became the leaders in the finance and capacity development networks.
The results suggest multiple ways to take advantage of each enabler’s network structures and show options to anticipate the best strategies. Regarding the policy networks, the two main actors were the national government and local governments. The experts recognized the role of the national government in leading the decision-making process to implement the roadmap to net-zero buildings. However, according to the results, this is only possible with the intervention of local governments implementing the policies in a differentiated way according to each region’s context. Therefore, it is essential to consider decentralization mechanisms [67] for a successful low-carbon roadmap application. Additional to this, other actors such as the private sector, the guilds and professional associations, academia, and civil society exhibit the importance of coordinating public policies articulated by the interest of all the actors in the Colombian building sector.
Concerning the technology network, in addition to the national government and the local governments, the private sector, the Ministry of Environment, and academia were the following three main actors. It is possible to visualize the role of the private sector in supporting the adoption of new technology via the Ministry of Environment’s regulations and the academia’s innovation [65].
The two main actors in the finance network corresponded to the national government and the private sector. The private sector plays a role in funding sustainable infrastructure jointly with the national government [68] and simultaneously opened the debate on the feasibility of exploring alternative financial methods such as public–private partnerships [69].
In contrast to the other networks, the guilds and professional associations played the primary role in the capacity development network. They are vital in adopting new technologies and in promoting new capacities. The national and local governments, academia, and the private sector are essential in supporting the new capacity formation in the entire Colombian building sector.
Lastly, it is necessary to depict potential problems associated with the enablers’ network structure. Even though it has been widely assumed that high cohesion values, associated with density, lead to improving team performance, some studies have shown that excessive density values can exhibit underperformance issues [70]. The four major categories of the roadmap presented network-based metrics higher than previous studies [21,41], potentially leading to stagnation, poor team performance, and lack of coordination [70]. For this reason, the Colombian government should constantly evaluate the role of the main actors and define their tasks specifically. Additionally, future studies based on improving team performance can be carried out to the extent of the execution of the Colombian roadmap.
6. Limitations and Future Research
This research had several limitations. Even though the sample size corresponded to 357 participants from diverse sectors, the inclusion of participants in the building sector from rural and other areas, rather than main cities, might add vital information to further studies.
Regarding how the CGBC classified actors in the survey, it would be better to have more specific categories of actors for future analysis. For instance, within the private sector would be valuable information to know the types of companies they represent.
This study adopted many metrics from the literature [45,50]; however, other methodologies, such as community analysis, might allow obtaining more specific results for the different groups of participants. Future investigations could also explore metrics at different points in time; one option is to use temporal social network analysis [71].
7. Conclusions
We analyzed the networks of actors involved in designing and implementing the Colombian Net-Zero Carbon Buildings Roadmap. Through SNA, we identified the key players within the major categories of the roadmap (policy, technology, finance, and capacity development) and the critical links and relationships among actors. Compact and dense structures characterized the four enabling networks (e.g., public policy, finance, technology, and capacity development) required to achieve net-zero emissions in the Colombian building sector. Small short average path lengths and a high degree of collaboration defined these network structures. Three types of players composed the networks:
- ₋ Leading stakeholders participated in more than two-thirds of the SLAs. They exhibited high centrality values and dominated most network connections and information flows.
- ₋ Second-tier actors participated in approximately one-half of the SLAs and coordinated specific objectives and information flows.
- ₋ Perimeter actors had low centrality values and participated in less than one-half of the SLAs. They were in charge of developing punctual actions of the roadmap and worked together with the leading and second-tier actors.
The studied networks had singularities, most of them regarding their leading actors and roles. While the national government and the private sector participated as leading actors in all enabling fields, other main actors changed according to the attributes of each network. For example, while academia was one of the five most prominent actors in the technology and capacity development networks, its role was less pronounced in the policy network and very limited in the finance network.
Overall, this research supports the field of sustainability and management in several ways. Even though the academic literature provides examples of social networks for sustainability in specific contexts, there is little evidence of using this methodology to analyze a whole economic sector. Social network analyzes allow identifying the actors, their interactions, and their roles in implementing net-zero roadmaps in the building sector. The diversity of actors intervening in the building sector and the complexity of the relations are vital factors in implementing effective GHG mitigation strategies.
This study provides a novel approach to studying decarbonization roadmaps by using SNA. Developing a social network through the actions required to achieve net-zero emissions allows a better definition of responsible actors at different levels and is an alternative for changing the focus from traditional actor maps to relational structures incorporating communication flows between multiple stakeholders. Governments and policymakers can take advantage of the shape of the enabling networks to achieve strategic goals within their roadmaps toward net-zero emissions.
Author Contributions
Conceptualization, J.S., J.G., M.E., F.R. and J.F.F.; Data curation, J.S.; Formal analysis, J.S., J.G., M.E., F.R. and J.F.F.; Investigation, J.S., J.G., M.E., F.R. and J.F.F.; Methodology, J.S. and J.G.; Project administration, J.G. and J.F.F.; Resources, J.F.F.; Supervision, J.G., M.E. and J.F.F.; Validation, J.S., J.G., M.E., F.R. and J.F.F.; Visualization, J.S.; Writing—original draft, J.S., M.E. and F.R.; Writing—review & editing, J.G., M.E., F.R. and J.F.F. All authors have read and agreed to the published version of the manuscript.
Funding
This research was funded by Hill Consulting and Universidad de los Andes.
Data Availability Statement
Data, models, and codes that support the findings of this study are available from the corresponding author upon reasonable request.
Acknowledgments
We thank the Colombian Green Building Council (CGBC), especially its director Angelica Ospina, and the World Resource Institute (WRI) for supporting this research and providing the required information.
Conflicts of Interest
The authors declare no conflict of interest.
Appendix A
Semi-structured interview for the group of experts in the ZCBA project.
| Question 1. |
|
| Question 2. |
|
| Question 3. |
|
| Question 4. |
|
| Question 5. |
|
| Question 6. |
|
| Question 7. |
|
| Question 8. |
|
References
- IPCC. AR6 Climate Change 2022: Mitigation of Climate Change; IPCC: Geneva, Switzerland, 2022. [Google Scholar]
- IEA. World Energy Outlook 2019–Analysis—IEA. Available online: https://www.iea.org/reports/world-energy-outlook-2019 (accessed on 25 April 2022).
- Patiño, L.I.; Padilla, E.; Alcántara, V.; Raymond, J.L. The relationship of energy and CO2 emissions with GDP per capita in Colombia. Atmosphere 2020, 11, 778. [Google Scholar] [CrossRef]
- Patiño, L.I.; Alcántara, V.; Padilla, E. Driving forces of CO2 emissions and energy intensity in Colombia. Energy Policy 2021, 151, 112130. [Google Scholar] [CrossRef]
- United Nations Environment Programme. 2021 Global Status Report for Buildings and Construction: Towards a Zero-Emission, Efficient and Resilient Buildings and Construction Sector; United Nations: Nairobi, Kenya, 2021. [Google Scholar]
- Escamilla, E.Z.; Habert, G.; Daza, J.F.C.; Archilla, H.F.; Echeverry Fernández, J.S.; Trujillo, D. Industrial or Traditional Bamboo Construction? Comparative Life Cycle Assessment (LCA) of Bamboo-Based Buildings. Sustainability 2018, 10, 3096. [Google Scholar] [CrossRef]
- Wu, Y.; Zhu, Q.; Zhu, B. Decoupling analysis of world economic growth and CO2 emissions: A study comparing developed and developing countries. J. Clean. Prod. 2018, 190, 94–103. [Google Scholar] [CrossRef]
- Mehmood Mirza, F.; Sinha, A.; Rehman Khan, J.; Kalugina, O.A.; Wasif Zafar, M. Impact of energy efficiency on CO2 Emissions: Empirical evidence from developing countries. Gondwana Res. 2022, 106, 64–77. [Google Scholar] [CrossRef]
- United Nations. The Sustainable Development Goals Report 2022; United Nations: New York, NY, USA, 2022. [Google Scholar]
- Arora, N.K.; Mishra, I. COP26: More challenges than achievements. Environ. Sustain. 2021, 4, 585–588. [Google Scholar] [CrossRef]
- Di Placido, A.M.; Pressnail, K.D.; Touchie, M.F. Exceeding the Ontario Building Code for low-rise residential buildings: Economic and environmental implications. Build. Environ. 2014, 77, 40–49. [Google Scholar] [CrossRef]
- Ruiz, A.; Guevara, J. Energy Efficiency Strategies in the Social Housing Sector: Dynamic Considerations and Policies. J. Manag. Eng. 2021, 37, 04021040. [Google Scholar] [CrossRef]
- International Energy Agency. Iron and Steel Technology roadmap: Towards more sustainable steelmaking; International Energy Agency: Paris, France, 2020; Volume 3. [Google Scholar]
- Cement Sustainability Initiative. Existing and Potential Technologies for Carbon Emissions Reductions in the Indian Cement Industry; International Finance Corporation: Delhi, India, 2013. [Google Scholar]
- Basbagill, J.; Flager, F.; Lepech, M.; Fischer, M. Application of life-cycle assessment to early stage building design for reduced embodied environmental impacts. Build. Environ. 2013, 60, 81–92. [Google Scholar] [CrossRef]
- Cao, X.; Dai, X.; Liu, J. Building energy-consumption status worldwide and the state-of-the-art technologies for zero-energy buildings during the past decade. Energy Build. 2016, 128, 198–213. [Google Scholar] [CrossRef]
- Zhang, N.; Han, Q.; de Vries, B. Building circularity assessment in the architecture, engineering, and construction industry: A new framework. Sustainability 2021, 13, 12466. [Google Scholar] [CrossRef]
- Feige, A.; Wallbaum, H.; Krank, S. Harnessing stakeholder motivation: Towards a Swiss sustainable building sector. Build. Res. Inf. 2011, 39, 504–517. [Google Scholar] [CrossRef]
- Yang, J.; Shen, Q.; Ho, M. An overview of previous studies in stakeholder management and its implications for the construction industry. J. Facil. Manag. 2009, 7, 159–175. [Google Scholar] [CrossRef]
- Salazar, J.; Guevara, J.; Verhoest, K. Inferential Analysis of Road Infrastructure PPP Sponsor Networks. J. Manag. Eng. 2021, 37, 04021069. [Google Scholar] [CrossRef]
- Guevara, J.; Salazar, J.; Garvin, M.J. Social Network Analysis of Road PPP Equity Markets in Canada, Chile, and the United States. J. Manag. Eng. 2020, 36, 04020058. [Google Scholar] [CrossRef]
- Matinheikki, J.; Naderpajouh, N.; Aranda-Mena, G.; Jayasuriya, S.; Teo, P. Befriending Aliens: Institutional Complexity and Organizational Responses in Infrastructure Public–Private Partnerships. Proj. Manag. J. 2021, 52, 453–470. [Google Scholar] [CrossRef]
- Karunathilake, H.; Hewage, K.; Brinkerhoff, J.; Sadiq, R. Optimal renewable energy supply choices for net-zero ready buildings: A life cycle thinking approach under uncertainty. Energy Build. 2019, 201, 70–89. [Google Scholar] [CrossRef]
- COP26 COP26 Goals—UN Climate Change Conference (COP26) at the SEC–Glasgow 2021. Available online: https://ukcop26.org/cop26-goals/ (accessed on 13 February 2022).
- Zhu, J.; Lin, H.; Yang, X.; Yang, X.; Jiang, P.; Del Valle, T.M. Social Network Relationships between Biomass Industry Stakeholders in the Agricultural Waste Power Generation Industry—A Case of Northern Jiangsu, China. Sustainability 2022, 14, 571. [Google Scholar] [CrossRef]
- Matous, P.; Pollack, J.; Helm, J. Reprint of: Collecting experimental network data from interventions on critical links in workplace networks. Soc. Netw. 2022, 69, 274–292. [Google Scholar] [CrossRef]
- Xu, X.; Xiao, B.; Li, C.Z. Stakeholders’ power over the impact issues of building energy performance gap: A two-mode social network analysis. J. Clean. Prod. 2021, 289, 125623. [Google Scholar] [CrossRef]
- Liang, X.; Yu, T.; Guo, L. Understanding stakeholders’ influence on project success with a new sna method: A case study of the green retrofit in china. Sustainability 2017, 9, 1927. [Google Scholar] [CrossRef]
- Wang, G.; Li, Y.; Zuo, J.; Hu, W.; Nie, Q.; Lei, H. Who drives green innovations? Characteristics and policy implications for green building collaborative innovation networks in China. Renew. Sustain. Energy Rev. 2021, 143, 110875. [Google Scholar] [CrossRef]
- Mok, K.Y.; Shen, G.Q.; Yang, R. Stakeholder complexity in large scale green building projects: A holistic analysis towards a better understanding. Eng. Constr. Archit. Manag. 2018, 25, 1454–1474. [Google Scholar] [CrossRef]
- Goforth, E.; Yosri, A.; El-Dakhakhni, W.; Wiebe, L. Infrastructure Asset Management System Optimized Configuration: A Genetic Algorithm–Complex Network Theoretic Metamanagement Approach. J. Infrastruct. Syst. 2022, 28, 04022029. [Google Scholar] [CrossRef]
- World Resource Institute Global Launch: Zero Carbon Building Accelerator. Available online: https://www.wri.org/events/2021/6/global-launch-zero-carbon-building-accelerator (accessed on 15 September 2022).
- Ghaljaie, F.; Naderifar, M.; Goli, H. Snowball Sampling: A Purposeful Method of Sampling in Qualitative Research. Strides Dev. Med. Educ. 2017, 14, e67670. [Google Scholar] [CrossRef]
- Castelblanco, G.; Guevara, J.; Salazar, J. Remedies to the PPP Crisis in the Covid-19 Pandemic: Lessons from the 2008 Global Financial Crisis. J. Manag. Eng. 2022, 38, 04022017. [Google Scholar] [CrossRef]
- Consejo Colombiano de la Construcción Sostenible. Reporte de Recomendaciones Proyecto Acelerador de Edificaciones Neto Cero Carbono; Consejo Colombiano de la Construcción Sostenible: Bogotá, Colombia, 2022. [Google Scholar]
- Manuel Santos Calderón, J.; Abel Rivera Flórez, G.; Cárdenas Santamaría, M.; Carlos Villegas Echeverri, L.; Guillermo Zuluaga Cardona, J.; Gaviria Uribe, A.; Janeth Restrepo Gallego, G.; Arce Zapata, G.; Lorena Gutiérrez Botero, M.; Giha Tovar, Y.; et al. Documento Conpes 3919; Departamento Nacional de Planeación: Cartagena, Colombia, 2018. [Google Scholar]
- GlobalABC (Global Alliance for Buildings and Construction); IEA; UNEP (Nations Environment Programme). GlobalABC Regional Roadmap for Buildings and Construction in Latin America: Towards a Zero-Emission, Efficient and Resilient Buildings and Construction Sector; United Nations: Paris, France, 2020. [Google Scholar]
- Moreno, J.L. Sociometry in Relation to Other Social Sciences. Sociometry 1937, 1, 206. [Google Scholar] [CrossRef]
- Eissa, R.; Eid, M.S.; Elbeltagi, E. Current Applications of Game Theory in Construction Engineering and Management Research: A Social Network Analysis Approach. J. Constr. Eng. Manag. 2021, 147, 04021066. [Google Scholar] [CrossRef]
- Lusher, D.; Koskinen, J.; Robins, G. Exponential Random Graph Models for Social Networks: Theory, Methods, and Applications; Cambridge University Press: Cambridge, UK, 2013; Volume 123, ISBN 9780521193566. [Google Scholar]
- Karali, E.; Bojovic, D.; Michalek, G.; Giupponi, C.; Schwarze, R. Who is connected with whom? A Social network analysis of institutional interactions in the European CCA and DRR landscape. Sustainability 2020, 12, 1275. [Google Scholar] [CrossRef]
- Schröpfer, V.L.M.; Tah, J.; Kurul, E. Mapping the knowledge flow in sustainable construction project teams using social network analysis. Eng. Constr. Archit. Manag. 2017, 24, 229–259. [Google Scholar] [CrossRef]
- Alexandrescu, F.M.; Rizzo, E.; Pizzol, L.; Critto, A.; Marcomini, A. The social embeddedness of brownfield regeneration actors: Insights from social network analysis. J. Clean. Prod. 2016, 139, 1539–1550. [Google Scholar] [CrossRef]
- Jin, X.; Shen, G.Q.P.; Ekanayake, E.M.A.C. Improving construction industrialization practices from a socio-technical system perspective: A hong kong case. Int. J. Environ. Res. Public Health 2021, 18, 9017. [Google Scholar] [CrossRef] [PubMed]
- Guevara, J.; Herrera, L.; Salazar, J. Interorganizational Sponsor Networks in Road and Social Infrastructure PPP Equity Markets. J. Constr. Eng. Manag. 2022, 148, 04022009. [Google Scholar] [CrossRef]
- Salazar, J.; Guevara, J.; Herrera, L. Transferal of responsibilities of PPP European Equity Markets: Dependency Analysis. In Proceedings of the Construction Research Congress 2022, Arlington, VA, USA, 9–12 March 2022. [Google Scholar]
- Borgatti, S.P.; Everett, M.G.; Freeman, L.C. UCINET 6 for Windows: Software for social network analysis (Version 6.102). Harvard MA Anal. Technol. 2002, 6, 12–15. [Google Scholar]
- Malik, H.A.M.; Mahesar, A.W.; Abid, F.; Waqas, A.; Wahiddin, M.R. Two-mode network modeling and analysis of dengue epidemic behavior in Gombak, Malaysia. Appl. Math. Model. 2017, 43, 207–220. [Google Scholar] [CrossRef]
- Eteifa, S.O.; El-adaway, I.H. Using Social Network Analysis to Model the Interaction between Root Causes of Fatalities in the Construction Industry. J. Manag. Eng. 2018, 34, 04017045. [Google Scholar] [CrossRef]
- Pryke, S.; Badi, S.; Almadhoob, H.; Soundararaj, B.; Addyman, S. Self-Organizing Networks in Complex Infrastructure Projects. Proj. Manag. J. 2018, 49, 18–41. [Google Scholar] [CrossRef]
- Borgatti, S.P.; Everett, M.G.; Johnson, J.C. Analyzing Social Networks; Sage: Newcastle upon Tyne, UK, 2018. [Google Scholar]
- Newman, M.E.J. The structure of scientific collaboration networks. Proc. Natl. Acad. Sci. USA 2001, 98, 404–409. [Google Scholar] [CrossRef]
- Borgatti, S.P.; Mehra, A.; Brass, D.J.; Labianca, G. Network analysis in the social sciences. Science 2009, 323, 892–895. [Google Scholar] [CrossRef]
- Wasserman, S.; Faust, K. Social Network Analysis: Methods and Applications; Structural Analysis in the Social Sciences; Cambridge University Press: Cambridge, UK, 1994. [Google Scholar]
- Freeman, L.C.; Roeder, D.; Mulholland, R.R. Centrality in social networks: Ii. experimental results. Soc. Netw. 1979, 2, 119–141. [Google Scholar] [CrossRef]
- Freeman, L.C. Centrality in social networks conceptual clarification. Soc. Netw. 1978, 1, 215–239. [Google Scholar] [CrossRef] [Green Version]
- Wu, G.; Qiang, G.; Zuo, J.; Zhao, X.; Chang, R. What are the key indicators of mega sustainable construction projects?-A stakeholder-network perspective. Sustainability 2018, 10, 2939. [Google Scholar] [CrossRef]
- Global Alliance for Buildings and Construction; OID. Buildings and Climate Change Adaptation: A Call for Action; United Nations: Paris, France, 2021. [Google Scholar]
- Gui, Q.; Liu, C.; Du, D. Bin Globalization of science and international scientific collaboration: A network perspective. Geoforum 2019, 105, 1–12. [Google Scholar] [CrossRef]
- Gui, Q.; Liu, C.; Du, D. Bin The structure and dynamic of scientific collaboration network among countries along the belt and road. Sustainability 2019, 11, 5187. [Google Scholar] [CrossRef]
- Giannoccaro, I. Centralized vs. decentralized supply chains: The importance of decision maker’s cognitive ability and resistance to change. Ind. Mark. Manag. 2018, 73, 59–69. [Google Scholar] [CrossRef]
- Fu, D.; Ionescu, C.M.; Aghezzaf, E.H.; De Keyser, R. Decentralized and centralized model predictive control to reduce the bullwhip effect in supply chain management. Comput. Ind. Eng. 2014, 73, 21–31. [Google Scholar] [CrossRef]
- Roelich, K.; Giesekam, J. Decision making under uncertainty in climate change mitigation: Introducing multiple actor motivations, agency and influence. Clim. Policy 2019, 19, 175–188. [Google Scholar] [CrossRef]
- Jakob, M.; Flachsland, C.; Christoph Steckel, J.; Urpelainen, J. Actors, objectives, context: A framework of the political economy of energy and climate policy applied to India, Indonesia, and Vietnam. Energy Res. Soc. Sci. 2020, 70, 101775. [Google Scholar] [CrossRef]
- Ganda, F. The impact of innovation and technology investments on carbon emissions in selected organisation for economic Co-operation and development countries. J. Clean. Prod. 2019, 217, 469–483. [Google Scholar] [CrossRef]
- Alkhani, R. Understanding private-sector engagement in sustainable urban development and delivering the climate agenda in northwestern europe—A case study of london and copenhagen. Sustainability 2020, 12, 8431. [Google Scholar] [CrossRef]
- Lowatcharin, G.; Stallmann, J.I. The differential effects of decentralization on police intensity: A cross-national comparison. Soc. Sci. J. 2019, 56, 196–207. [Google Scholar] [CrossRef]
- Azhgaliyeva, D.; Kapoor, A.; Liu, Y. Green bonds for financing renewable energy and energy efficiency in South-East Asia: A review of policies. J. Sustain. Financ. Investig. 2020, 10, 113–140. [Google Scholar] [CrossRef]
- Koppenjan, J.F. Public-private partnerships for green infrastructures: Tensions and challenges. Curr. Opin. Environ. Sustain. 2015, 12, 30–34. [Google Scholar] [CrossRef]
- Wise, S. Can a team have too much cohesion? The dark side to network density. Eur. Manag. J. 2014, 32, 703–711. [Google Scholar] [CrossRef]
- Kim, H.; Anderson, R. Temporal node centrality in complex networks. Phys. Rev. E-Stat. Nonlinear Soft Matter Phys. 2012, 85, 026107. [Google Scholar] [CrossRef] [PubMed] [Green Version]
Figure 1.
Methodology.

Figure 2.
Reference matrices (a). Multiplication of the reference matrix by its transpose matrix (b).
Figure 2.
Reference matrices (a). Multiplication of the reference matrix by its transpose matrix (b).

Figure 3.
(a) Public policy network; (b) technology network; (c) finance network; and (d) capacity development network.
Figure 3.
(a) Public policy network; (b) technology network; (c) finance network; and (d) capacity development network.


Table 1.
Workshop participants.
| Organization Role | Number of Participants | Roles of Participants |
|---|---|---|
| Universities | 35 | Professors, graduate students, legal representatives, and program directors. |
| Construction guilds | 33 | Technical experts, consultants, technical directors, project directors, and coordinators. |
| Private companies | 191 | Analysts, architects, CEOs, consultants, coordinators, directors, technical experts, engineers, researchers, builders, and contractors. |
| Colombian government | 79 | Advisors, contractors, coordinators, directors, and technical specialists. |
| Non-governmental organizations | 11 | Managers, consultants, coordinators, directors, and technical experts. |
| International organizations | 8 | Consultants, directors, and CEOs. |
Table 2.
Definition of enablers in the Colombian Net-Zero Carbon Buildings Roadmap.
| Enabler | Definition |
|---|---|
| Policy | Includes processes to be developed through regulation and other public policy instruments. |
| Technology | Includes processes of technological improvement. |
| Capacity development | Includes processes to improve the capabilities of the actors in the supply chain of the building sector. |
| Finance | Includes processes to create financial mechanisms to make possible the actions required. |
Table 3.
Example of a typical enabler.
| First-Level Measures | Second-Level Actions | Action Categories or Subgroups | ||||||
|---|---|---|---|---|---|---|---|---|
| Group 1 | Group 2 | Group 3 | Group 4 | Group 5 | Group 6 | Group 7 | ||
| 1 | 1.1 | x | x | x | ||||
| 1.2 | x | |||||||
| 1.3 | x | x | ||||||
| … | … | |||||||
| 1.n | x | x | ||||||
| … | … | … | ||||||
| 12 | 12.1 | x | x | x | x | |||
| 12.2 | x | x | x | |||||
| 12.3 | x | x | x | |||||
| 12.4 | x | x | ||||||
| … | … | |||||||
| 12.m | x | x | x | |||||
Table 4.
Actor categories identified by the workshop participants.
| Actors | Role |
|---|---|
| National government | Official entities with jurisdiction at the national level. |
| Local governments | Official entities with jurisdiction at the local level. |
| Guilds and professional associations | Different groups of affiliated companies participating in the operation, construction, and maintenance of buildings. |
| Public utility companies | Entities in charge of providing public services across Colombia. |
| Standards organizations | Technical standardization entities. |
| Private sector | Private companies participating in the life cycle of buildings. |
| Financial institutions | Banks, pension funds, insurance companies, and brokerage commission companies related to the building sector. |
| Academia | Universities and research entities working in Colombia in related areas to buildings, sustainability, and carbon markets. |
| Civil society | Different groups representing civil society working in Colombia in related areas to buildings, sustainability, and low-carbon projects. |
Table 5.
Network-based metrics and Actor-based metrics.
| (a) | ||
|---|---|---|
| SNA Metric | Definition in Construction and Sustainability | |
| Network-based metrics | Network size | The number of stakeholders in each category of enablers [21,50,51,52]. |
| Short average path length | The average minimum number of links separating two actors [45,53]. | |
| Density | The ratio between the total number of links and the theoretical maximum number of relationships [21,41,54]. | |
| Average weighted degree | The mean number of relationships of an actor in a network [21,45]. | |
| Degree centralization | The measure of the concentration of the degree of centrality in a few actors [45,55]. | |
| Average stakeholders | The average number of stakeholders participating per second-level action in each enabler. | |
| Actor-based metrics | Degree centrality (D) | The number of links of each stakeholder within each enabler network [21,53,56]. |
| Betweenness centrality (B) | The propensity of each stakeholder to be a bridge that communicates multiple actors [21,49,50]. | |
| Closeness centrality (C) | The propensity of each stakeholder to be close to all the other actors in a given network [21,49,50]. | |
| Eigenvector centrality (E) | The propensity of each stakeholder to communicate with the most important actors in each network [21,49,50]. | |
Table 6.
Network-based metrics per enabler.
| Network of Enablers | Network Size | Short Average Path Length | Density | Average Weighted Degree | Degree Centralization | Average Stakeholders |
|---|---|---|---|---|---|---|
| Policy | 28 | 1.36 | 0.64 | 17.36 | 0.37 | 10.40 |
| Technology | 30 | 1.39 | 0.61 | 17.73 | 0.42 | 9.56 |
| Finance | 35 | 1.43 | 0.57 | 18.94 | 0.45 | 8.82 |
| Capacity development | 23 | 1.23 | 0.77 | 17.04 | 0.25 | 9.23 |
Table 7.
Network-based metrics per actor.
| Policy | D | C | E | B | Technology | D | C | E | B |
|---|---|---|---|---|---|---|---|---|---|
| National government | 18.15 | 1.00 | 0.51 | 0.07 | National government | 12.79 | 1.00 | 0.54 | 0.06 |
| Local governments | 18.07 | 0.90 | 0.51 | 0.02 | Private sector | 12.41 | 1.00 | 0.53 | 0.06 |
| Private sector | 17.44 | 0.96 | 0.50 | 0.04 | Ministry of the Environment | 10.24 | 0.94 | 0.44 | 0.04 |
| Ministry of Housing | 16.48 | 0.96 | 0.47 | 0.06 | Academia | 10.03 | 0.91 | 0.44 | 0.04 |
| Guilds and professional associations | 16.26 | 0.93 | 0.47 | 0.04 | Local governments | 9.86 | 0.97 | 0.43 | 0.05 |
| Academia | 13.33 | 0.87 | 0.39 | 0.02 | Guilds and professional associations | 9.07 | 0.85 | 0.41 | 0.03 |
| Civil society | 12.44 | 0.90 | 0.37 | 0.03 | Ministry of Housing | 8.83 | 0.91 | 0.39 | 0.04 |
| Ministry of the Environment | 11.07 | 0.87 | 0.33 | 0.02 | Ministry of Energy | 7.90 | 0.81 | 0.36 | 0.02 |
| Ministry of Energy | 10.70 | 0.84 | 0.31 | 0.01 | Financial institutions | 7.00 | 0.88 | 0.32 | 0.03 |
| Financial institutions | 9.33 | 0.90 | 0.27 | 0.03 | Civil society | 6.52 | 0.85 | 0.29 | 0.02 |
| Public utility companies | 9.30 | 0.87 | 0.28 | 0.02 | Public utility companies | 5.52 | 0.81 | 0.25 | 0.02 |
| Standards organizations | 6.59 | 0.75 | 0.21 | 0.00 | Ministry of Industry and Commerce | 4.72 | 0.69 | 0.22 | 0.00 |
| National Planning Department (DNP) | 5.44 | 0.79 | 0.17 | 0.02 | Standards organizations | 4.21 | 0.78 | 0.19 | 0.01 |
| Ministry of Finance and Public Credit | 5.44 | 0.75 | 0.17 | 0.00 | Mining and Energy Planning Unit (UPME) | 3.79 | 0.73 | 0.18 | 0.01 |
| Mining and Energy Planning Unit (UPME) | 5.04 | 0.77 | 0.15 | 0.00 | Ministry of Science | 3.48 | 0.67 | 0.16 | 0.00 |
| Finance | D | C | E | B | Capacity Development | D | C | E | B |
| National government | 10.82 | 1.00 | 0.54 | 0.07 | Guilds and professional associations | 5.55 | 1.00 | 0.52 | 0.03 |
| Private sector | 10.30 | 0.94 | 0.52 | 0.05 | National government | 5.46 | 1.00 | 0.51 | 0.03 |
| Guilds and professional associations | 8.70 | 0.87 | 0.45 | 0.03 | Academia | 5.46 | 1.00 | 0.51 | 0.03 |
| Local governments | 8.24 | 0.94 | 0.42 | 0.05 | Private sector | 5.27 | 1.00 | 0.50 | 0.03 |
| Financial institutions | 7.94 | 0.89 | 0.42 | 0.04 | Local governments | 4.82 | 0.98 | 0.46 | 0.02 |
| Development Bank | 6.58 | 0.87 | 0.35 | 0.03 | Ministry of Housing | 4.59 | 0.98 | 0.44 | 0.02 |
| Civil society | 6.42 | 0.77 | 0.35 | 0.02 | Ministry of the Environment | 4.41 | 1.00 | 0.41 | 0.03 |
| Ministry of Housing | 6.09 | 0.92 | 0.33 | 0.04 | Ministry of Energy | 3.86 | 1.00 | 0.35 | 0.03 |
| Ministry of the Environment | 5.27 | 0.83 | 0.28 | 0.02 | National Planning Department (DNP) | 2.50 | 0.93 | 0.23 | 0.01 |
| National Planning Department (DNP) | 4.94 | 0.85 | 0.27 | 0.03 | Mining and Energy Planning Unit (UPME) | 2.09 | 0.93 | 0.19 | 0.02 |
| Commercial bank | 4.85 | 0.73 | 0.28 | 0.01 | Standards organizations | 1.86 | 0.84 | 0.19 | 0.01 |
| Ministry of Energy | 4.82 | 0.77 | 0.26 | 0.01 | Ministry of Industry and Commerce | 1.82 | 0.88 | 0.16 | 0.02 |
| Ministry of Finance and Public Credit | 4.64 | 0.81 | 0.25 | 0.02 | Ministry of Education | 1.82 | 0.88 | 0.20 | 0.00 |
| Public utility companies | 4.58 | 0.81 | 0.25 | 0.02 | Financial institutions | 1.59 | 0.78 | 0.15 | 0.00 |
| Ministry of Industry and Commerce | 3.33 | 0.73 | 0.18 | 0.00 | Ministry of Labour | 1.05 | 0.76 | 0.10 | 0.00 |
Degree centrality (D), betweenness centrality (B), closeness centrality (C), and eigenvector centrality (E).
Publisher’s Note: MDPI stays neutral with regard to jurisdictional claims in published maps and institutional affiliations. |
© 2022 by the authors. Licensee MDPI, Basel, Switzerland. This article is an open access article distributed under the terms and conditions of the Creative Commons Attribution (CC BY) license (https://creativecommons.org/licenses/by/4.0/).
Share and Cite
MDPI and ACS Style
Salazar, J.; Guevara, J.; Espinosa, M.; Rivera, F.; Franco, J.F. Decarbonization of the Colombian Building Sector: Social Network Analysis of Enabling Stakeholders. Buildings 2022, 12, 1531. https://doi.org/10.3390/buildings12101531
AMA Style
Salazar J, Guevara J, Espinosa M, Rivera F, Franco JF. Decarbonization of the Colombian Building Sector: Social Network Analysis of Enabling Stakeholders. Buildings. 2022; 12(10):1531. https://doi.org/10.3390/buildings12101531
Chicago/Turabian StyleSalazar, John, Jose Guevara, Monica Espinosa, Felipe Rivera, and Juan F. Franco. 2022. "Decarbonization of the Colombian Building Sector: Social Network Analysis of Enabling Stakeholders" Buildings 12, no. 10: 1531. https://doi.org/10.3390/buildings12101531
Note that from the first issue of 2016, this journal uses article numbers instead of page numbers. See further details here.