Article

Sectional Model Wind Tunnel Test and Research on the Wind-Induced Vibration Response of a Curved Beam Unilateral Stayed Bridge

1
School of Civil Engineering and Architecture, Chongqing University of Science and Technology, Chongqing 401331, China
2
Chongqing Key Laboratory of Energy Engineering Mechanics & Disaster Prevention and Mitigation, Chongqing 401331, China
3
China Construction Second Engineering Bureau Ltd., Beijing 100160, China
4
CMCU Engineering Co., Ltd., Chongqing 400039, China
*
Author to whom correspondence should be addressed.
Buildings 2022, 12(10), 1643; https://doi.org/10.3390/buildings12101643
Submission received: 20 July 2022 / Revised: 5 September 2022 / Accepted: 16 September 2022 / Published: 10 October 2022

Abstract

:
The linear curve distribution of the beam and the asymmetrical layout of the stay cables may have beneficial or adverse influences on cable-stayed bridges. Sectional model wind tunnel tests and numerical simulations were used to analyze the influence of these two factors on the wind-induced vibration characteristics of a curved beam unilateral stayed bridges (CBUSB) and the interaction between its stay cables and curved beams. According to the basic similarity law, the sectional models of a CBUSB example were designed and manufactured. The aerodynamic force and wind-induced vibration of the models were measured in an atmospheric boundary wind tunnel laboratory to obtain the aerodynamic coefficient and displacement, respectively. Based on the wind tunnel test results, the verified finite element model was used to determine the displacement, acceleration, and cable tension of the CBUSB excited by the buffeting force under 5 curvature cases and 4 cable layout cases. Then, band-pass filter technology and fast Fourier transform technology were used to analyze the influence of these two parameters on the wind-induced vibration characteristics of the CBUSB. Results show that the CBUSB had good aerodynamic stability in the wind tunnel at low and high wind speeds. With increasing curvature, the high-order modal vibration and modal coupling vibration of the CBUSB may be generated. The frequency, the proportion of wind-induced vibration response components, and the distribution characteristics of spectrum energy of CBUSB will be affected by 4 cable layout schemes. Cables arranged on both sides of the bridge and near the center of curvature can improve pedestrian comfort and reduce wind-induced vibration, respectively. Affected by the interaction between cable and bridge, the cable and bridge transmit their own vibration to each other, both of which contain the response components of each other.

1. Introduction

A curved beam unilateral stayed bridge (CBUSB) is suitable for dams, cliffs, and other unilateral fixed structures. CBUSB is mainly used as a pedestrian landscape bridge because of its light weight and beauty. The wind-induced vibration characteristics of CBUSB are different from those of conventional stayed bridges because the bridge geometric line type is curve distribution, and the stayed cables are asymmetric layouts and understanding the wind-induced vibration characteristics of such structures can help analyze the wind-induced vibration response. However, wind-induced vibration response is also a concern for stayed bridges in the design and operation stages, and model wind tunnel testing and numerical simulation are effective methods for studying the wind-induced vibration characteristics of structures.
Sectional model wind tunnel tests are important methods for studying aerodynamic forces and the wind-induced vibration of bridges [1]. Aerostatic force and sectional model vibration tests can be used to determine the aerodynamic force coefficient and the vortex vibration response [2], respectively. Sectional model vibration tests can not only accurately reflect the vortex vibration stability of a bridge structure, but they can also analyze the effect of equivalent static wind load and damping on wind vibration [3,4]. The wind tunnel test of a curved beam bridge sectional model is used to investigate the interaction between pedestrian excitation and wind load, and numerical analysis is used to propose the minimum structural damping required to guarantee aerodynamic stability [5,6].
Furthermore, finite element simulation is an effective method for analyzing wind vibration on bridges [7]. The finite element simulation of a curved beam bridge with box sections started with Swapan [8], where the solution of differential equations for static deformation and motion boundary conditions of the curved beam was used to derive the unit displacement function, which was widely used in the wind vibration simulation of curved beams. When performing a finite element analysis on a stayed bridge, the traditional approach [9] significantly simplified the towers, cables, and decks. Unilateral stayed bridges can be simulated using Arzoumanidis’ element [10] superposition method, which is a time-consuming method for finite element analysis. While the number of beam elements between the stay cables can be simplified, the analysis time can be reduced while ensuring the accuracy of the results [11].
Curved beam bridges are more susceptible to wind loads because of their section characteristics. The curved beam bridge with irregular sections and uneven mass distribution has no fixed stiffness center, making the simulation of the sectional model torsional frequency more difficult. The support restraints of a curved beam bridge have a significant impact on the structural stress [12] and changing the support restraints has a significant impact on the natural frequency of the structure. Previous studies [13,14] have shown that the geometric line type of the main beam is curved, which can be affected by the eccentric force, and there is a torsion tendency, and when an incoming wind load acts on the curved beam bridge at a specific wind attack angle, the bridge may lose stability toward the torsion. The change in the curvature of the bridge line shape can produce a series of effects, such as impacts on seismic response [15], impacts on the natural frequency of bending-torsion coupling structure [16], and impacts on the vibration failure mechanism [17]. Similarly, the change in curvature does not have a negligible effect on the wind-induced vibration of the curved beam bridges. Unfortunately, the research on the impact of CBUSB on wind-induced vibration response with a curvature change is scarce, and this deficiency can influence the application and promotion of this structure in practical engineering.
The variation of cable arrangement will affect the wind-induced vibration characteristics of cable-stayed bridges. The study on wind-induced vibration of stayed bridges mainly focused on wind-induced vibration response [18,19]. The cable-stayed mode of stayed bridges affects vortex vibration stability, and some scholars have studied how to change the angle of cables to improve the vortex vibration stability of unilateral stayed bridges by measuring the wind-induced vibration response using wind tunnel tests [20]. Currently, the influence of the damper system in cables on the wind-induced vibration of cable-stayed bridges has also been analyzed in the study of other locking arrangements [21,22]. Two important variables of the ventilation rate of guardrails and the roughness on the beam surface can be used for aerodynamic optimization design to control the buffeting of suspension bridges [23]. A new numerical framework for bridge buffeting optimization design was proposed, which can reduce the buffeting response by changing the shape of bridge decks [24]. However, these studies assume that the connection point between the stay cable and the bridge is on the center line of the bridge or on both sides of the center line and symmetrical with the center line, but CBUSB is a unilateral arrangement of cables, so it does not meet this assumption. Therefore, the previous research results cannot be copied and applied to the CBUSB structure. On the other hand, as the substructure of CBUSB, the bridge and cable will produce time-varying dynamic tension and displacement when the wind-induced vibration of the cable is pulled down under the wind load, which not only changes the dynamic characteristics of the stayed bridge, but also causes the displacement of the bridge and superimposes with the wind vibration displacement, and the vibration of the bridge will affect the vibration of the cable in turn. The coupling wind-induced vibration between these substructures [25,26,27] has attracted a lot of attention in transmission lines. In this way, when the cables are arranged asymmetrically on both sides of the bridge centerline, the influence of this arrangement scheme on the wind-induced vibration interaction of the bridge cables should also be analyzed.
Most of the preceding studies are wind-induced vibration studies on a curved beam or stayed straight beam bridges. The linear distribution of CBUSB bridge is a curve, and the wind-induced vibration tension transmitted by the cable to the bridge acts on one side of the bridge deck, which may produce the increasing effect of wind vibration caused by additional torque. The above two factors need to be further studied. In this paper, the aerodynamic coefficients and wind-induced vibration responses are obtained through the wind tunnel tests of the aerostatic force and the sectional model vibration test of CBUSB, and the aeroelastic stability of the structure is verified. Based on the test data, the full bridge finite element model of the CBUSB is established, and the influence of curvature parameters and different cable layout schemes on buffeting responses of the CBUSB is studied through the established model. It is expected that the research results of this paper will have reference value for wind resistant design, safety evaluation, and cable-breaking analysis of CBUSB.

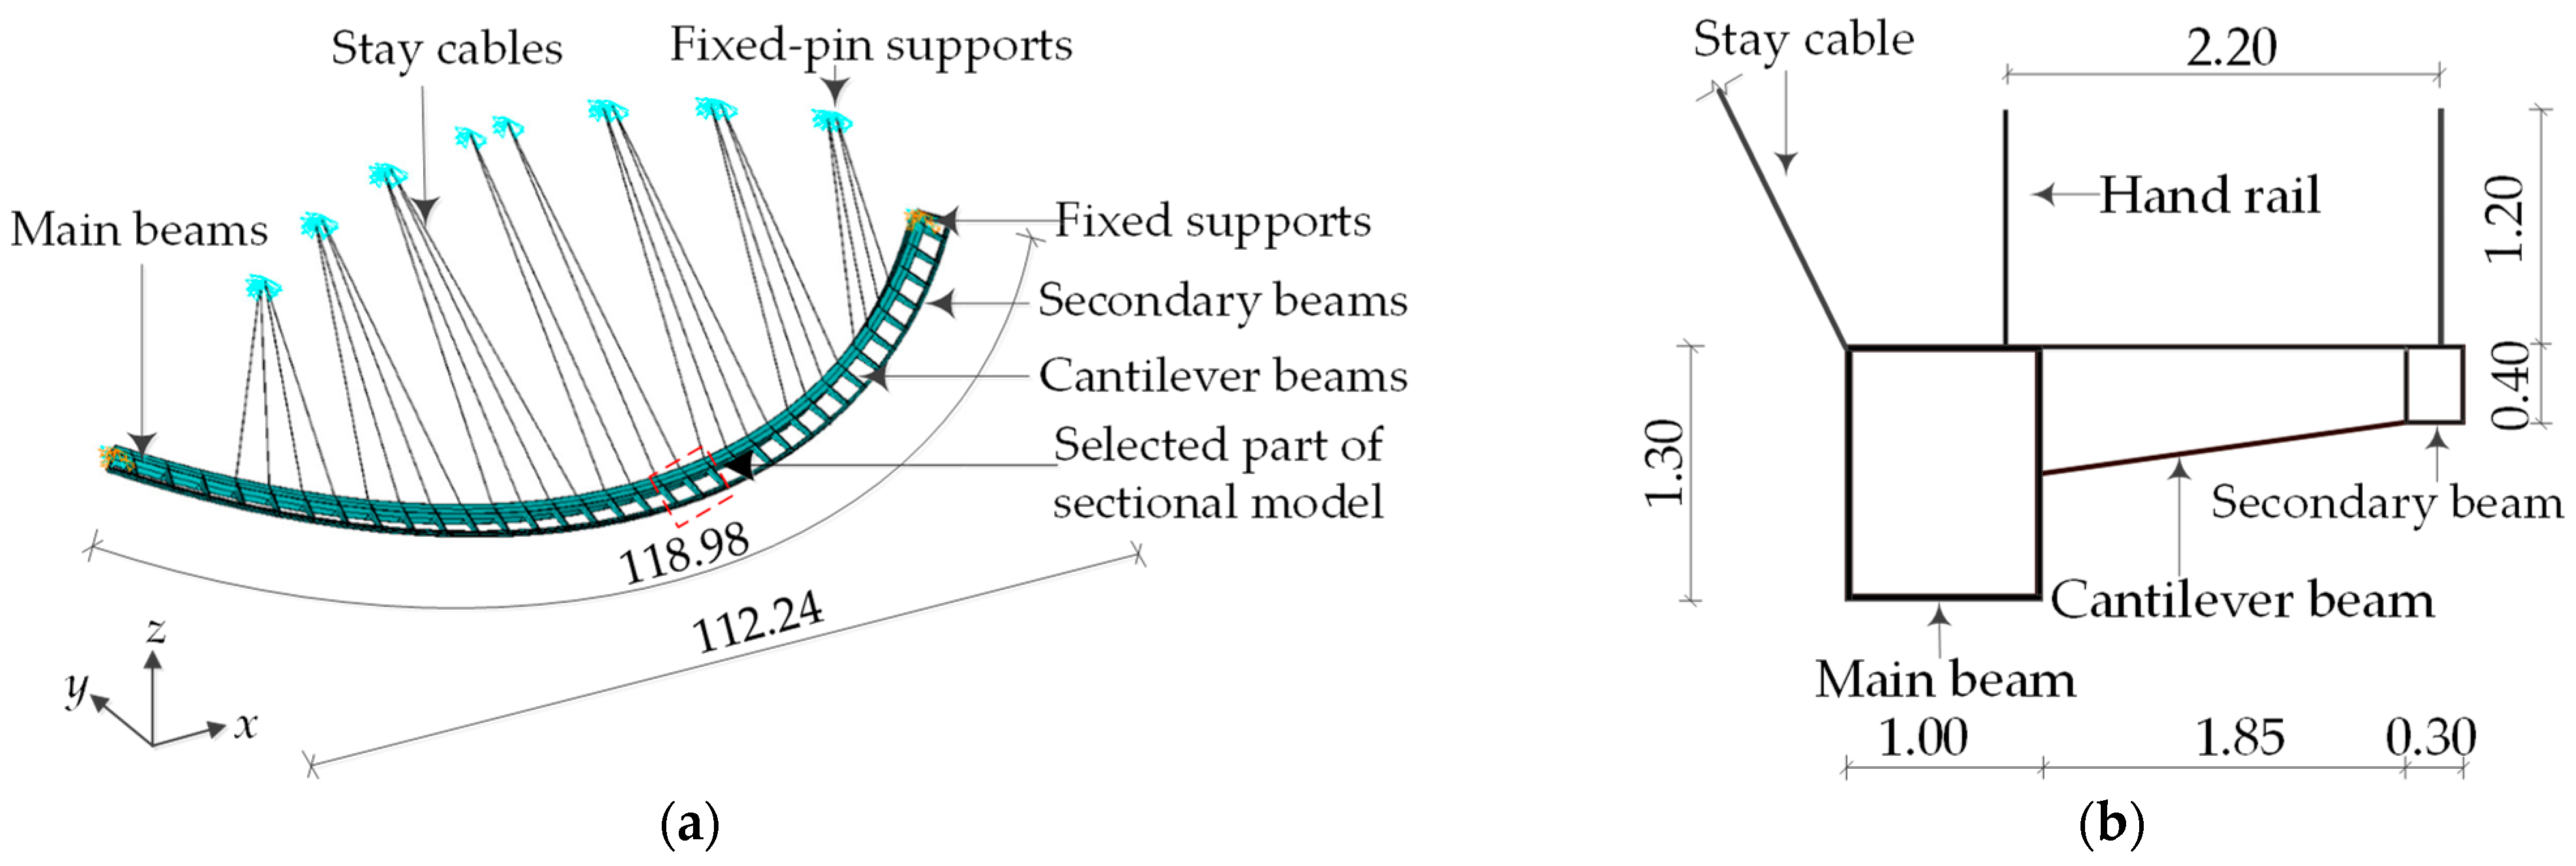
2. Engineering Background and Sectional Model Wind Tunnel Tests

2.1. Background in Engineering and Laboratory

In this study, a glass landscape bridge in Hanzhong City, China, was selected as an example for analysis to study the wind vibration response of CBUSB. The bridge is composed of the main beam, secondary beam, cantilever beam, and stayed cable, and the center line is considered an arc in the design as shown in Figure 1a; x is the coordinate axis parallel to the direction of the main beam in the middle of the bridge; y is the coordinate axis perpendicular to the x coordinate axis in the horizontal plane; z is the vertical coordinate axis; the arc length and straight length of the main beam are 118.98 and 112.24 m, respectively; 28 stay cables are arranged with an effective section diameter of 0.03 m; fixed supports are used at both ends of the main beam, and fixed-pin supports are used at the stay cable fix points. As shown in Figure 1b, the height and width of the main beam are 1.30 and 1.00 m, respectively; the height and width of the secondary beam are 0.40 and 0.30 m, respectively; the sections of the main and secondary beams are box sections; the cantilever beam is a tapered beam with a width of 1.85 m; the heights of both ends of the cantilever beam are 0.65 and 0.40 m; and the intermediate heights vary linearly.
In this study, wind tunnel tests were performed in the TK-400 wind tunnel laboratory of the Tianjin research institute for water transport engineering in China. The dimensions of the wind tunnel laboratory were 15.0 (length) × 4.4 (width) × 2.5 m (height) (Figure 2), and the minimum and maximum wind speeds were 1.8 and 18 m/s, respectively. The instruments used in this wind tunnel test were a cobra-probe wind speed sensor from TFI in Australia for measuring the test wind speed, HL-C236BE laser displacement sensor from Panasonic in Japan for measuring the small displacement, with a sampling frequency of 1024 Hz, and an ATI three-component force/torque sensor from Denmark for measuring aerodynamic forces with a sampling frequency of 1000 Hz. The main instruments used in wind tunnel tests were a cobra-probe wind speed probe from TFI in Australia for measuring the test wind speed with a sampling frequency of 1024 Hz, a HL-C236BE laser displacement sensor from Panasonic in Japan for measuring the small displacement with a sampling frequency of 1024 Hz, and an ATI three-component moment transducer from Denmark for measuring the three-component force with a sampling frequency of 1000 Hz. The sampling time of all instruments was 60 s.

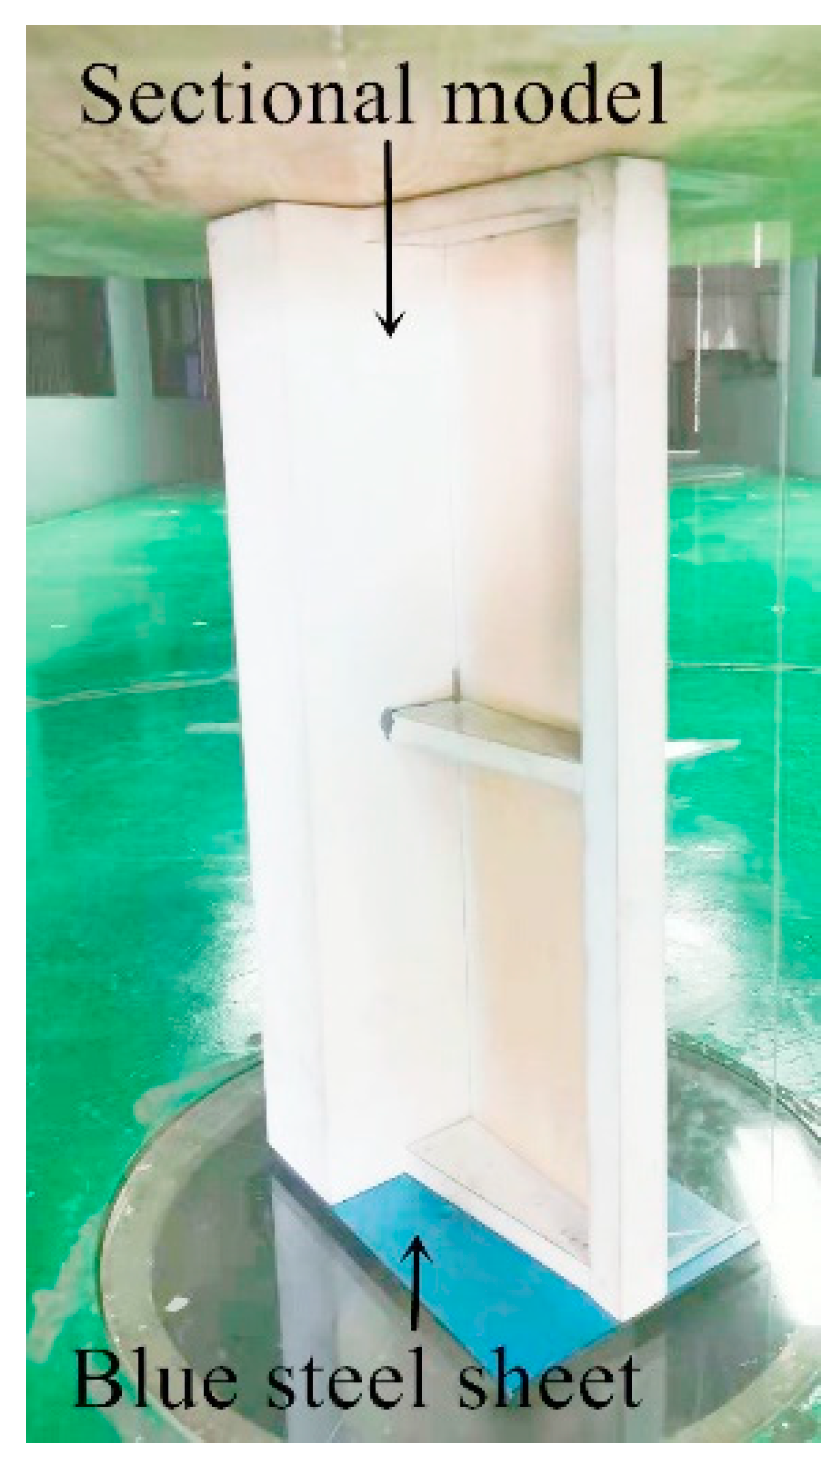
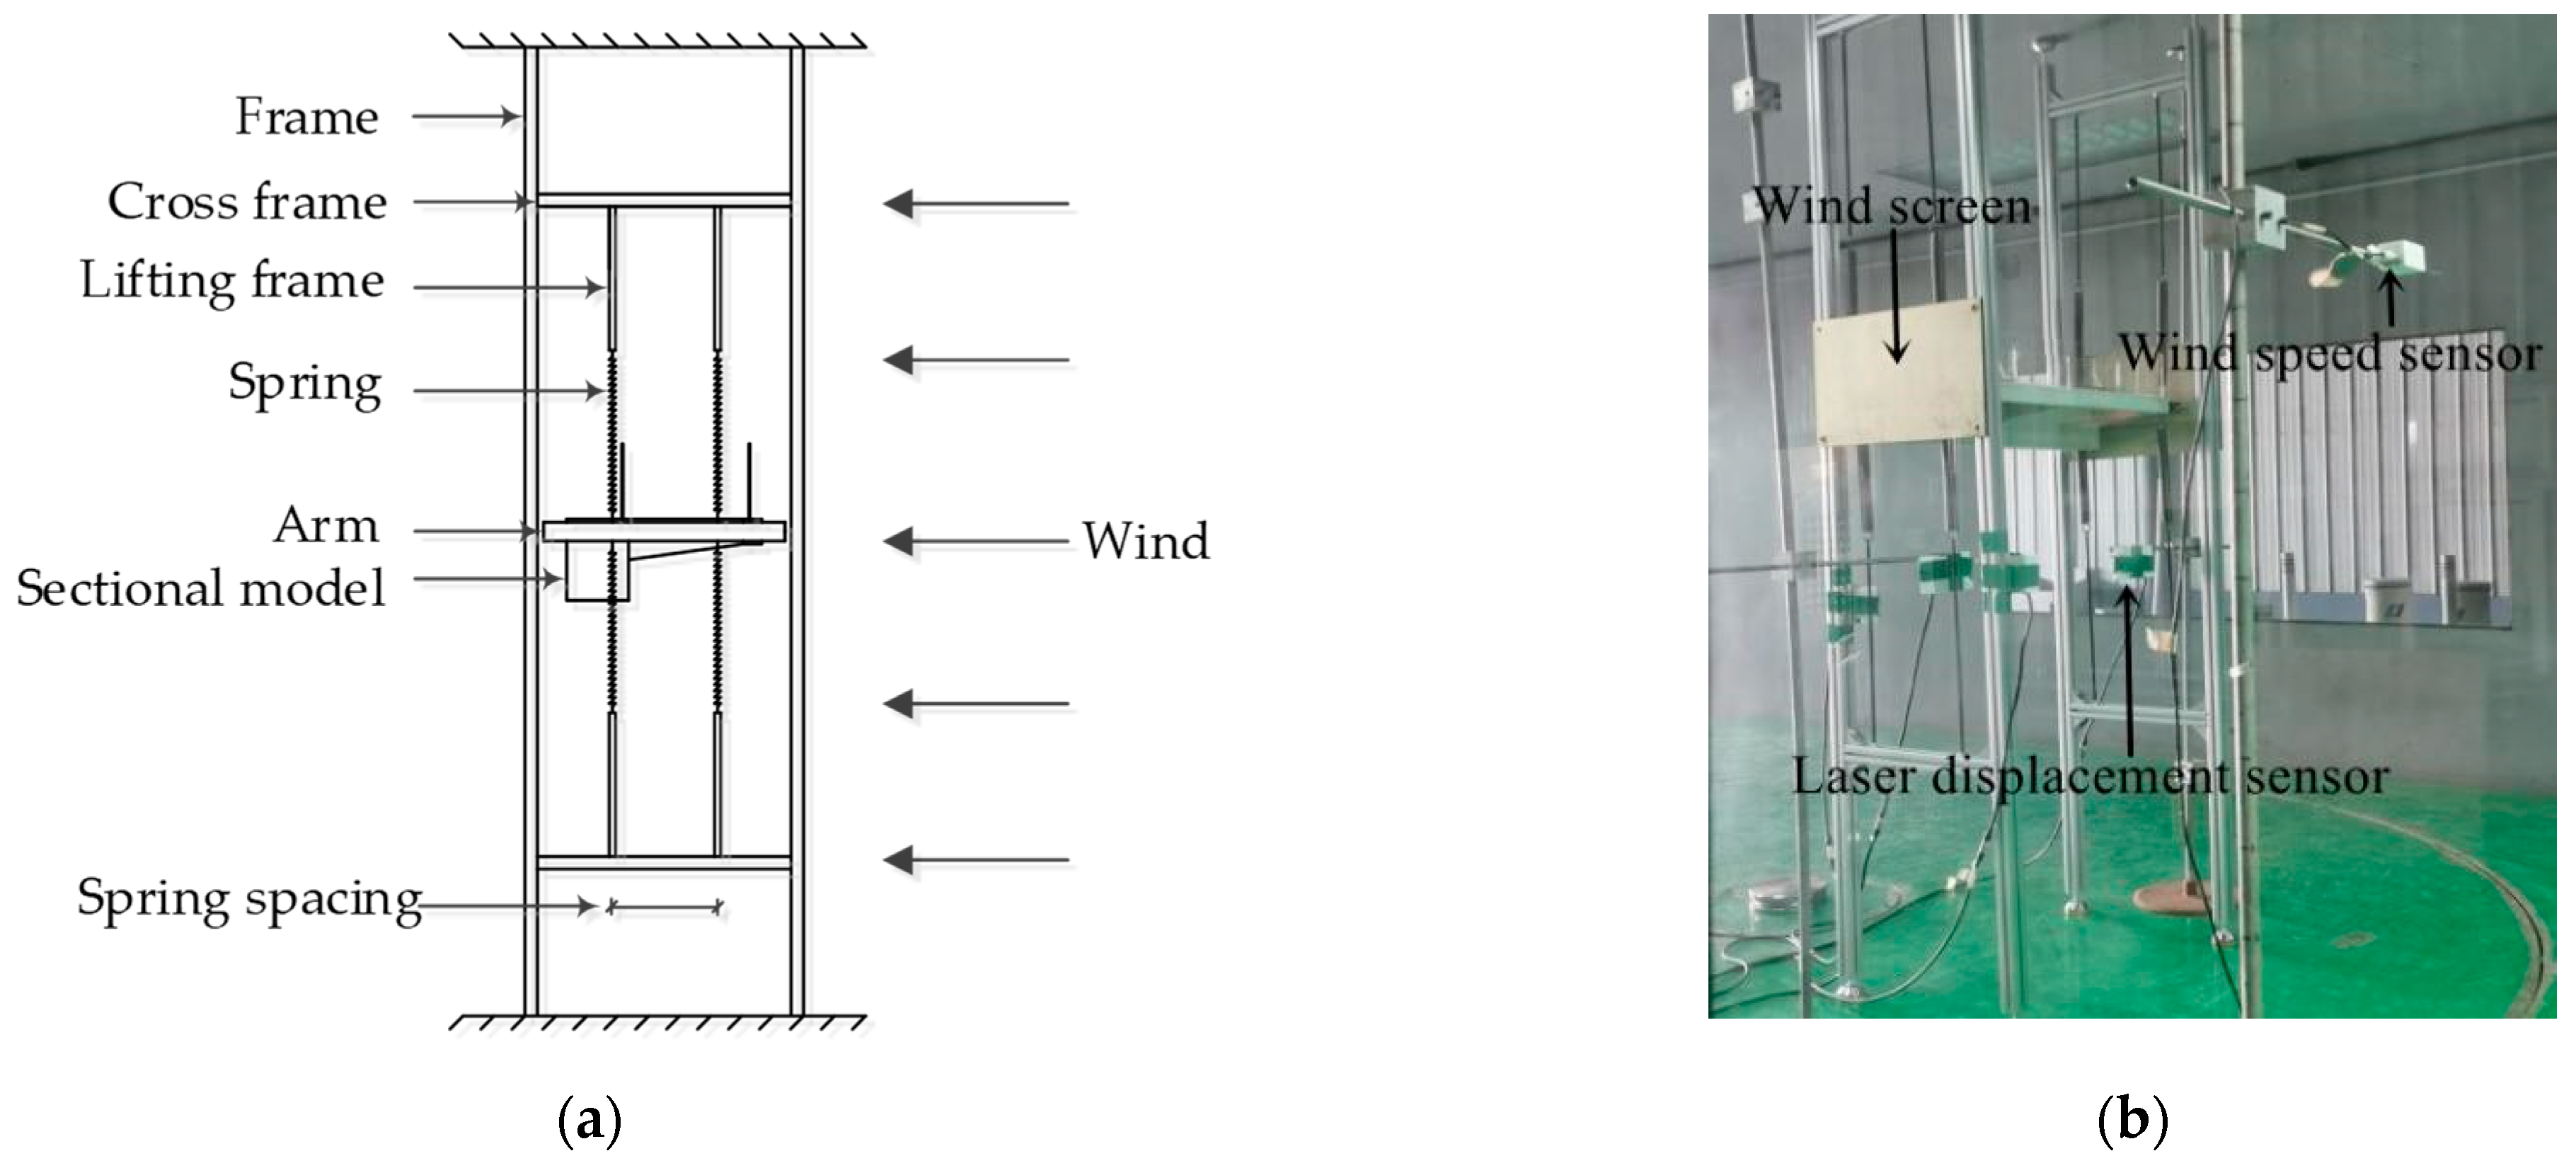
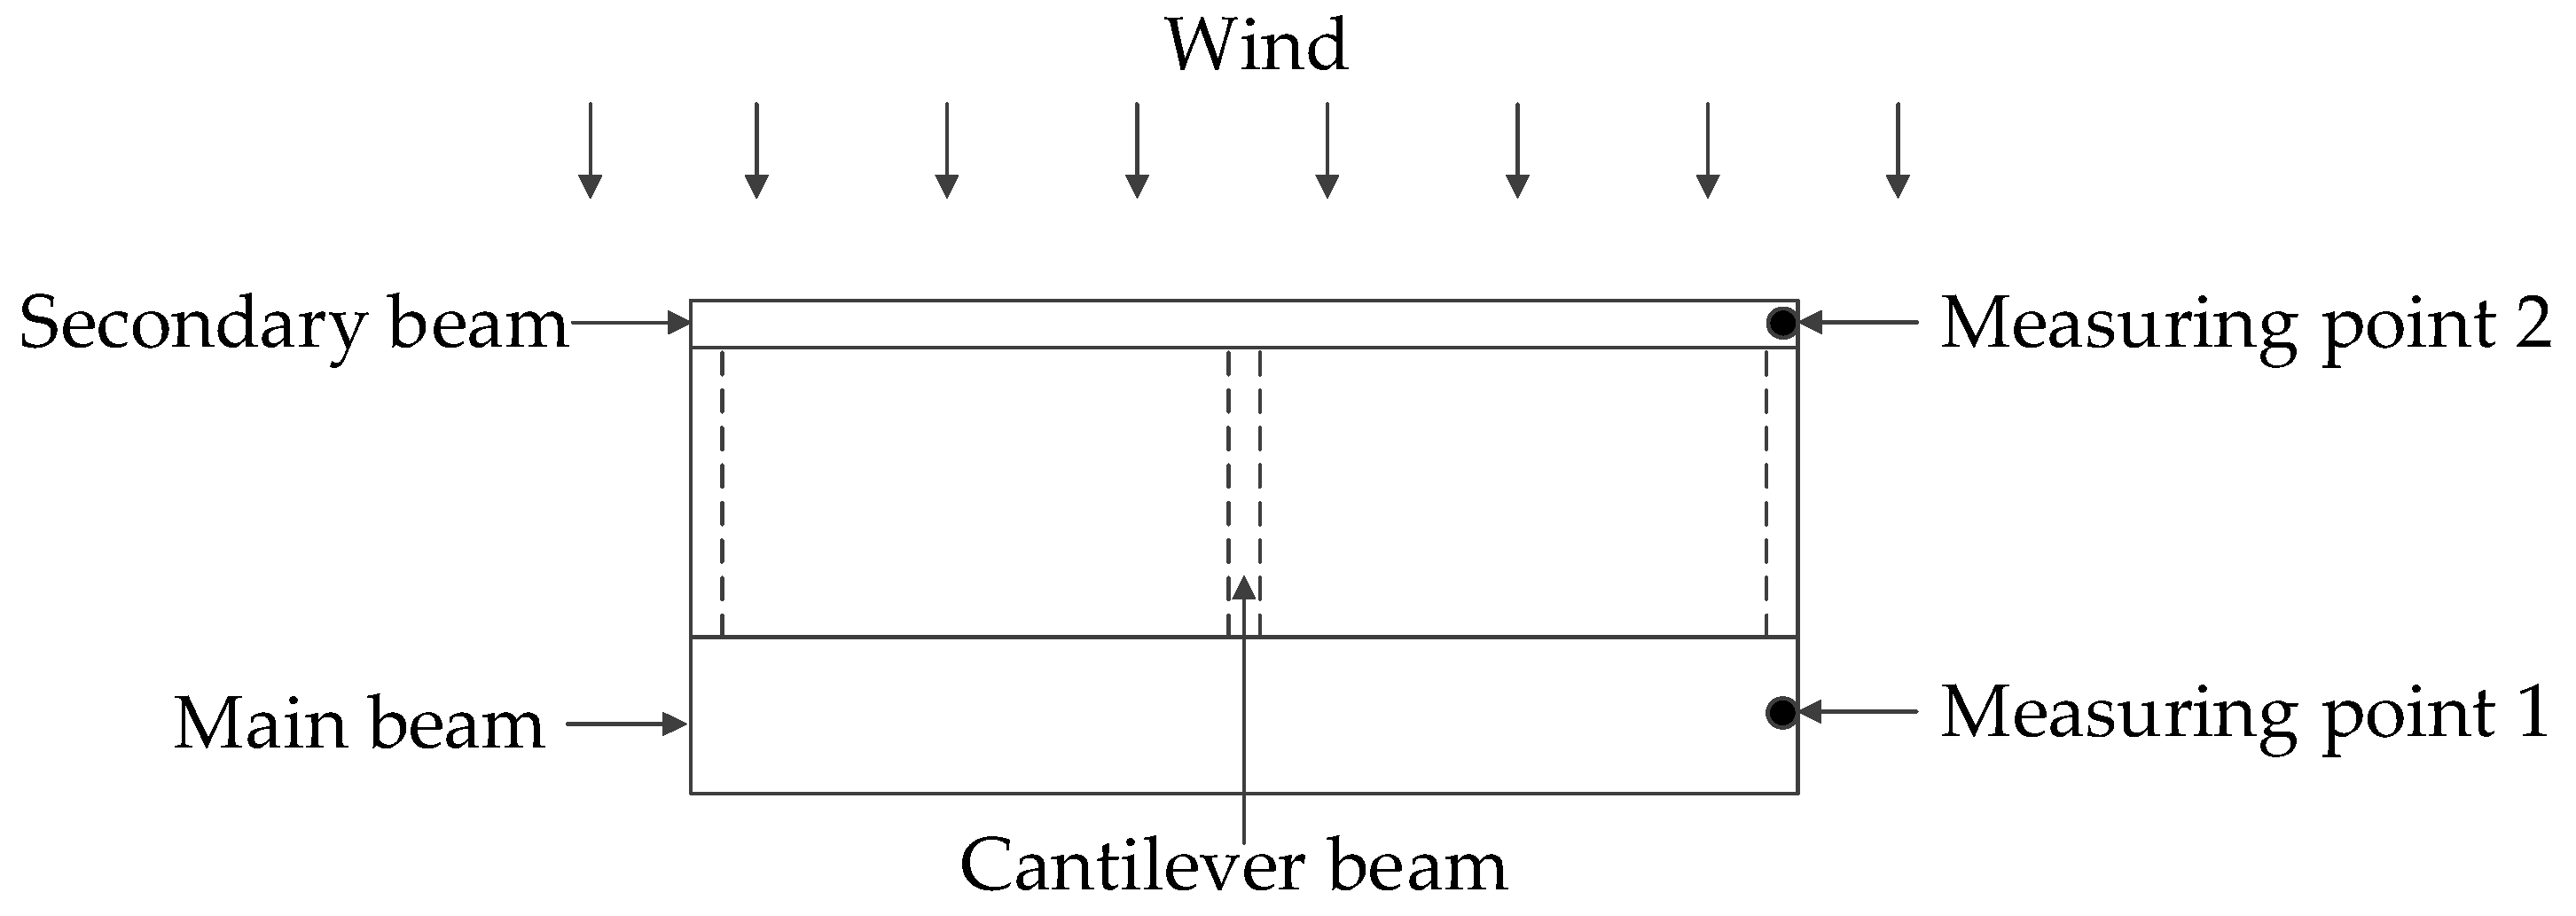
2.2. Design and Fabrication of Section Model and Vibration Test System

According to the Chinese load code (JGJ/T 338-2014) [28], the geometric scale of the sectional model was determined as 1:10 based on the dimensions of the wind tunnel laboratory and case bridge in Section 2.1, and the sectional model was fabricated using aluminum according to the geometric scale. The sectional model is shown in Figure 2, and a blue steel sheet was used for the connection of the three-component force/torque sensor and the sectional model in the aerostatic force testing.
The same sectional model was used for sectional model vibration tests and aerostatic force tests. The sectional model vibration test must meet the similarity requirements of geometric, elastic, and inertia parameters, and the section model had only vertical and torsional degrees of freedom. The sectional model was suspended by eight springs for vibration testing (Figure 3), which is referred to as the vibration test system in the following. Spring stiffness and spring spacing controlled the vertical and torsion frequencies (Figure 3a), respectively. The windscreen at both ends of the model was used to simulate two-dimensional (2D) flow in the sectional model (Figure 3b); the wind speed sensor was placed at the same height as the sectional models, and laser displacement sensors were installed under the sectional model.
Table 1 shows the main parameters of the sectional model. The mass per unit length was not only the mass of the sectional model but also the mass contribution of 1/3 of 8 springs and lead blocks. The fast Fourier transform method [29] was used to determine the vertical and torsion frequencies.

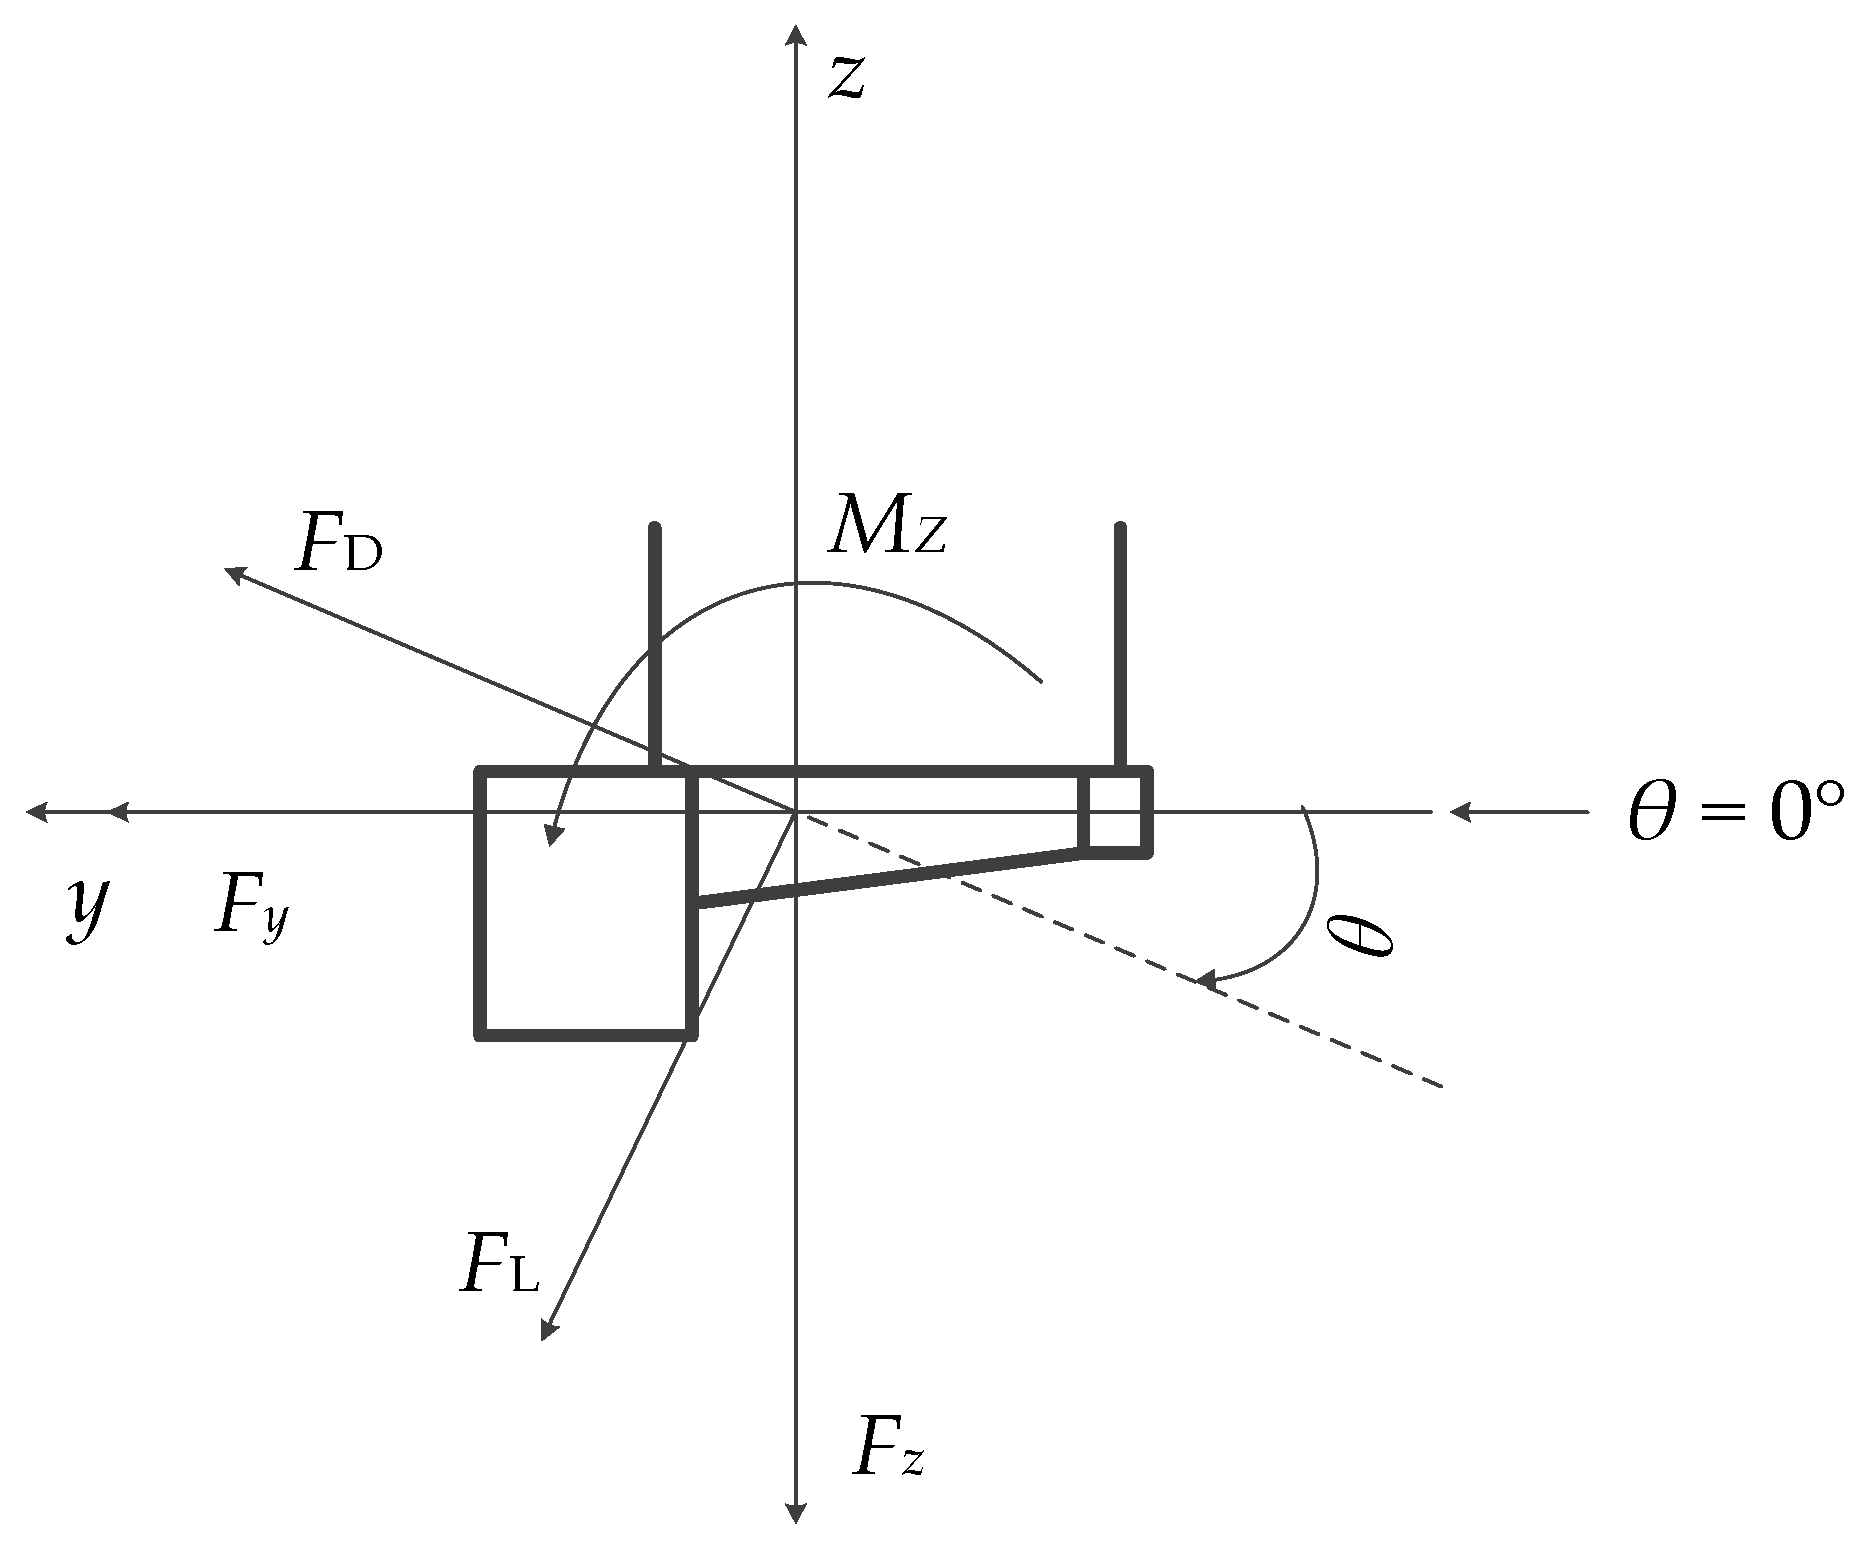
2.3. Aerostatic Force Tests of CBUSB

Aerostatic force tests can be used to obtain aerodynamic force coefficients for numerical analysis, and to verify aerodynamic stability. The aerostatic force test is shown in Figure 2, where a blue steel sheet was used to connect a three-component force/torque sensor to the sectional model, and a yellow windscreen was used to simulate 2D flow. The wind attack angle is defined in Figure 4, in which θ is the attack angle of the incoming wind, and it rotates counterclockwise as a positive value; FD, FL, and MZ are the aerodynamic drag force, aerodynamic lift force, and aerodynamic moment, respectively; Fy and Fz are the y-direction force and z-direction force measured by the three-component force/torque sensor, respectively; along-wind and crosswind directions are in the same direction as FD and FL, respectively. The wind attack angle cases for the aerostatic force test were set to −12°, Δθ = 1°, and 25 cases were determined.
Both Fy and Fz are obtained in the sensor coordinate system; because the sensor coordinate system coincides with the sectional model coordinate system, the aerodynamic force in the sectional model coordinate system is equal to the force measured by the sensor. There is no trigonometric relationship between Mz and θ. Fy and Fz can be converted to FD and FL, respectively, using the following formulas:
F D = F y cos θ + F z sin θ
F L = F y sin θ + F z cos θ
Under the wind axis system, the aerodynamic drag coefficient CD, aerodynamic lift coefficient CL, and aerodynamic moment coefficient CM are defined as follows:
C D = F D 1 2 ρ a v 2 B
C L = F L 1 2 ρ a v 2 H m
C M = M Z 1 2 ρ a v 2 B 2
where ρa is the density of air mass, ρa = 1.225 kg/m3; v is the incoming mean wind speed; B and Hm are the projected width and projected height of the section model in the x-z plane when θ = 0°, and the values of B and Hm are 0.130 m and 0.702 m, respectively.
Figure 5 shows the distribution of aerodynamic coefficients calculated using Equations (3)–(5). With the increase in θ, CD increased, CL increased, CM initially decreased and then increased (Figure 5). According to the analysis of the aerodynamic coefficient trends, slopes of the CL-θ, and CM-θ were positive in various θ, indicating that the main beam had the necessary conditions for aerodynamic stability.

2.4. Sectional Model Vibration Tests of CBUSB

Usually, a sectional model vibration test is used to verify vortex vibration stability. In this sectional model vibration test, 29 wind speed cases were determined, and the minimum and maximum wind speed cases were 2.07 and 12.10 m/s, respectively. The scope of the Reynolds numbers was 0.97 × 10⁵ and 5.66 × 10⁵ in the test cases. A uniform flow field with θ = 0° was simulated in a wind tunnel for the sectional model vibration test. Measurement point 1 was defined (Figure 6), which was used to measure vertical displacements.
According to the Chinese load code (JTG/T 3360-01) [30], the recommended value of the vortex vibration amplitude from the code is calculated using the following formula:
h v = γ v 0.04 f v
where hv is the recommended value of vortex vibration amplitude from code; γ v is a vortex vibration coefficient because vortex vibration stability is verified using the sectional model vibration test in this section, γ v = 1.0; fv is the sectional model vertical frequency, fv = 4.101 Hz.
Figure 7 shows the displacement amplitudes of each case, and each amplitude did not exceed the calculated value in Equation (6), indicating that the CBUSB had good vortex vibration stability.

3. Numerical Analysis of CBUSB Wind-Induced Vibration Response

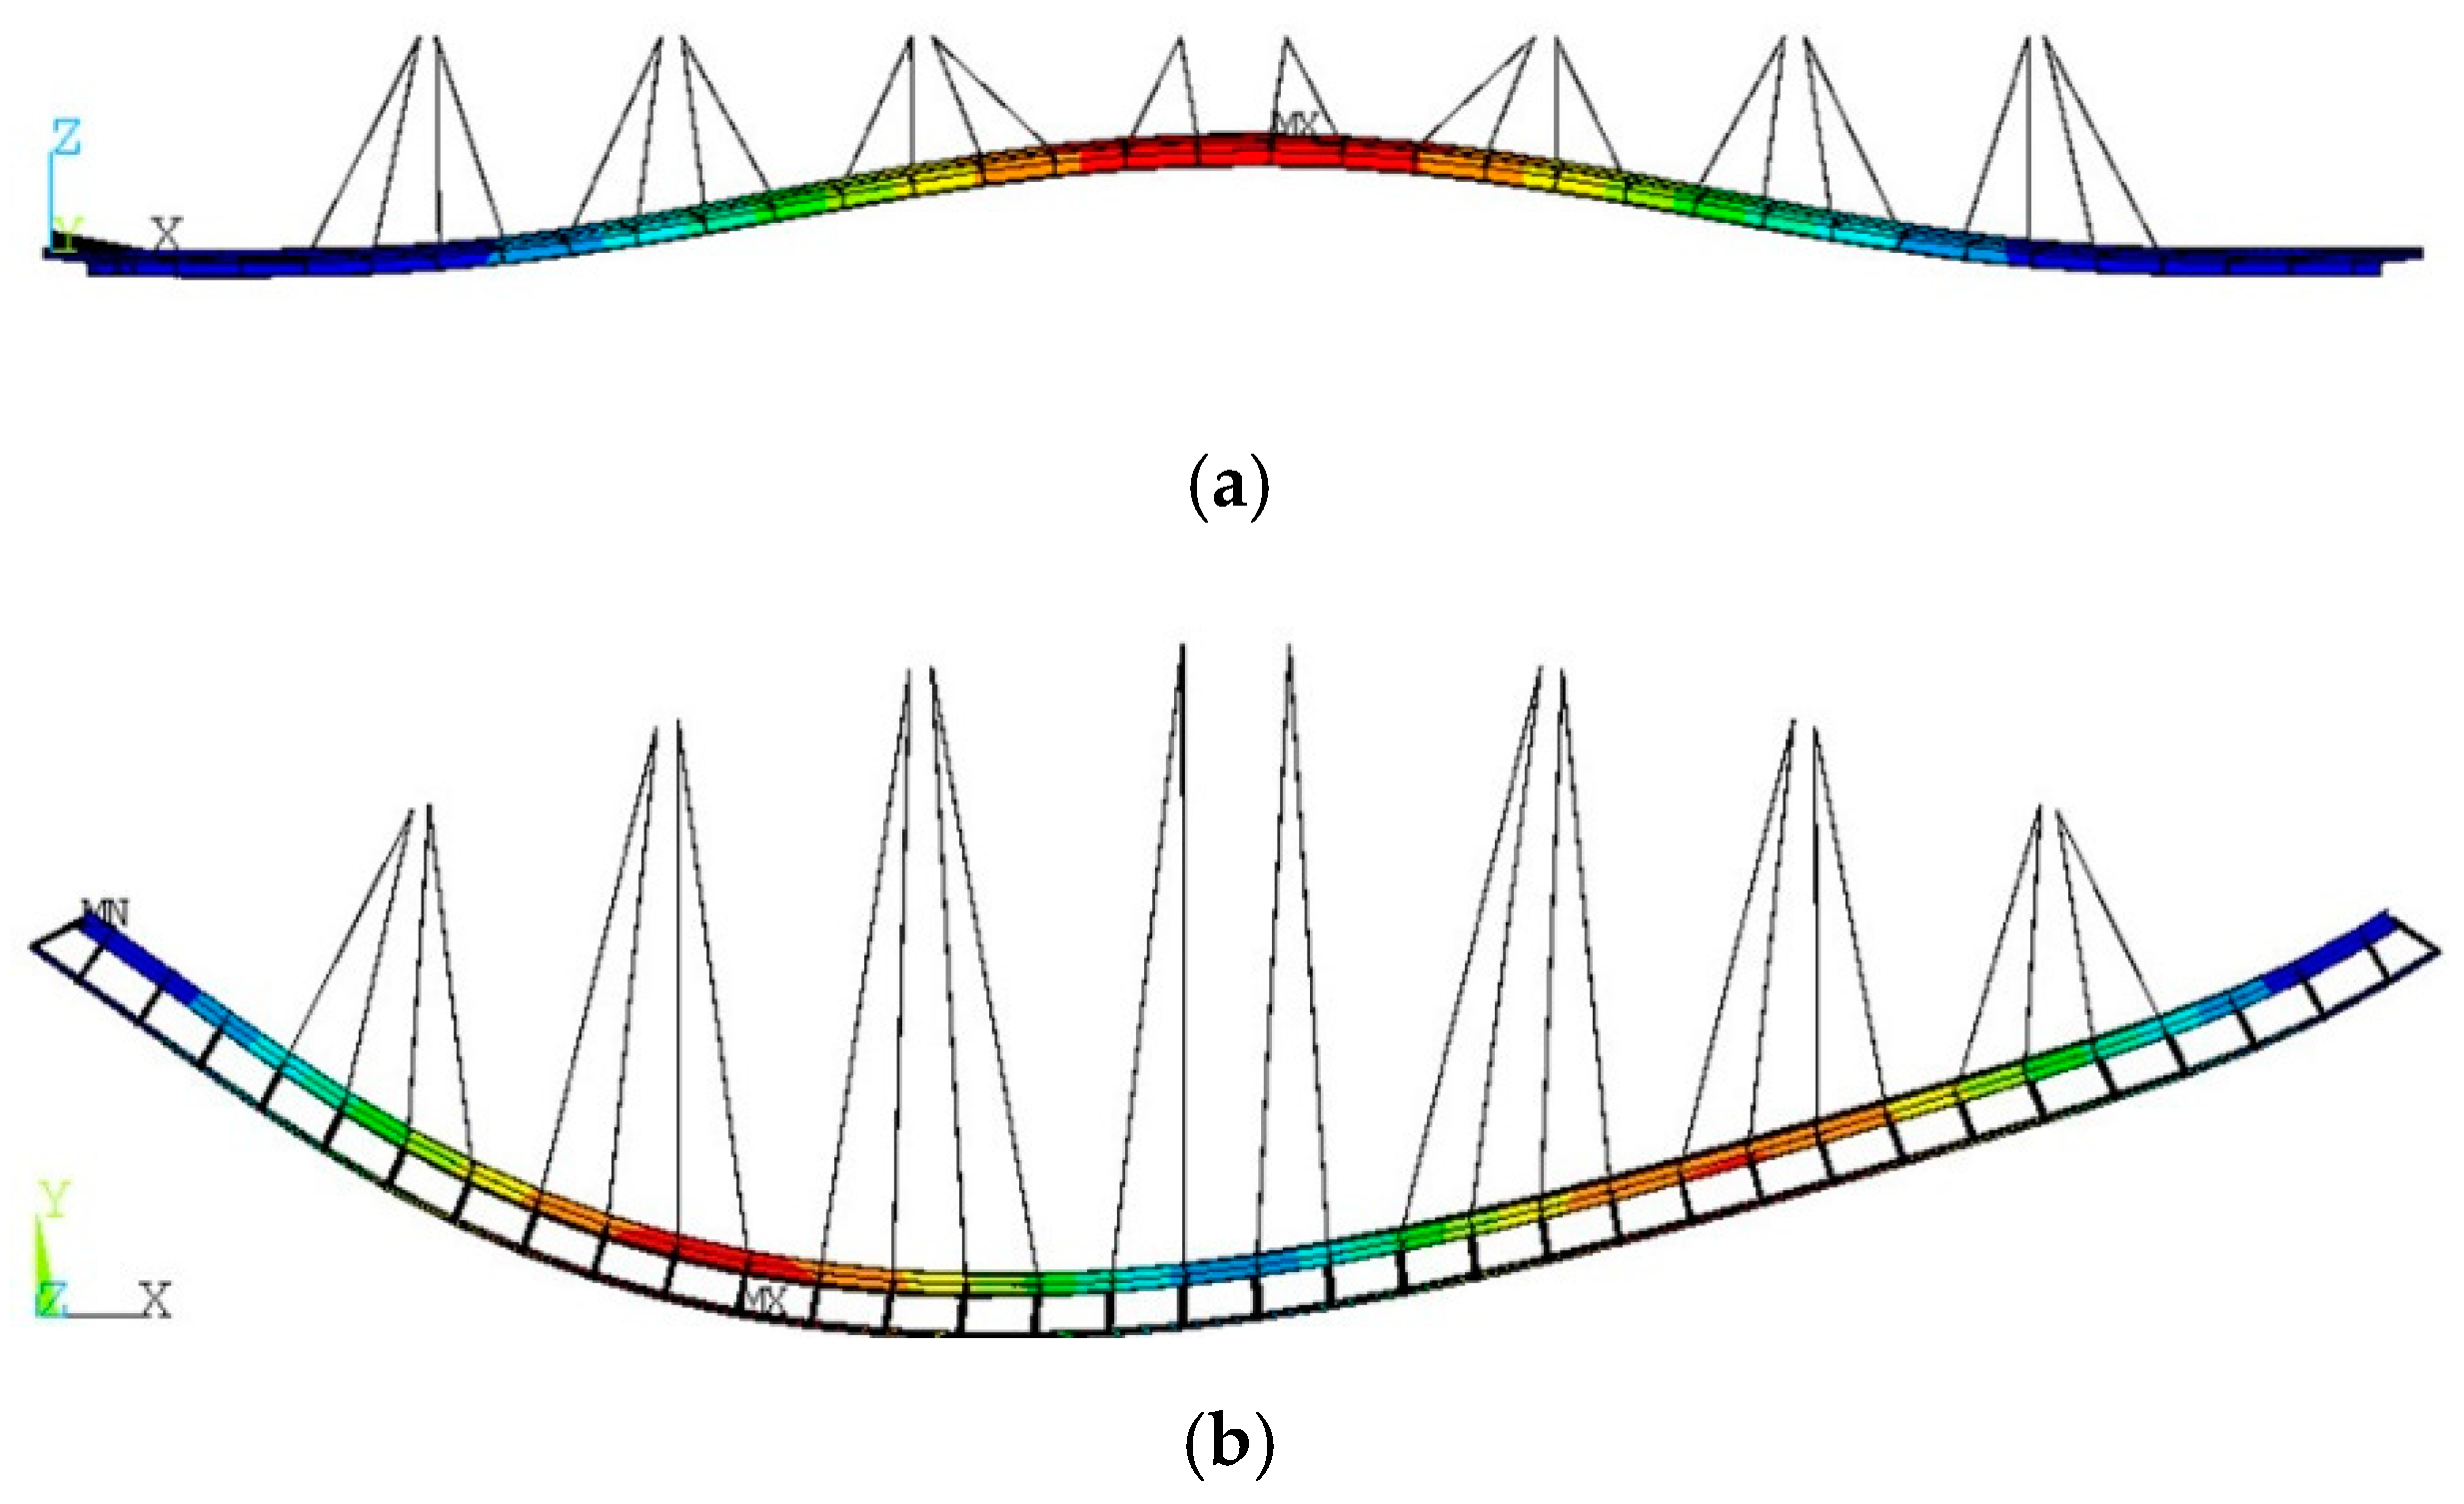
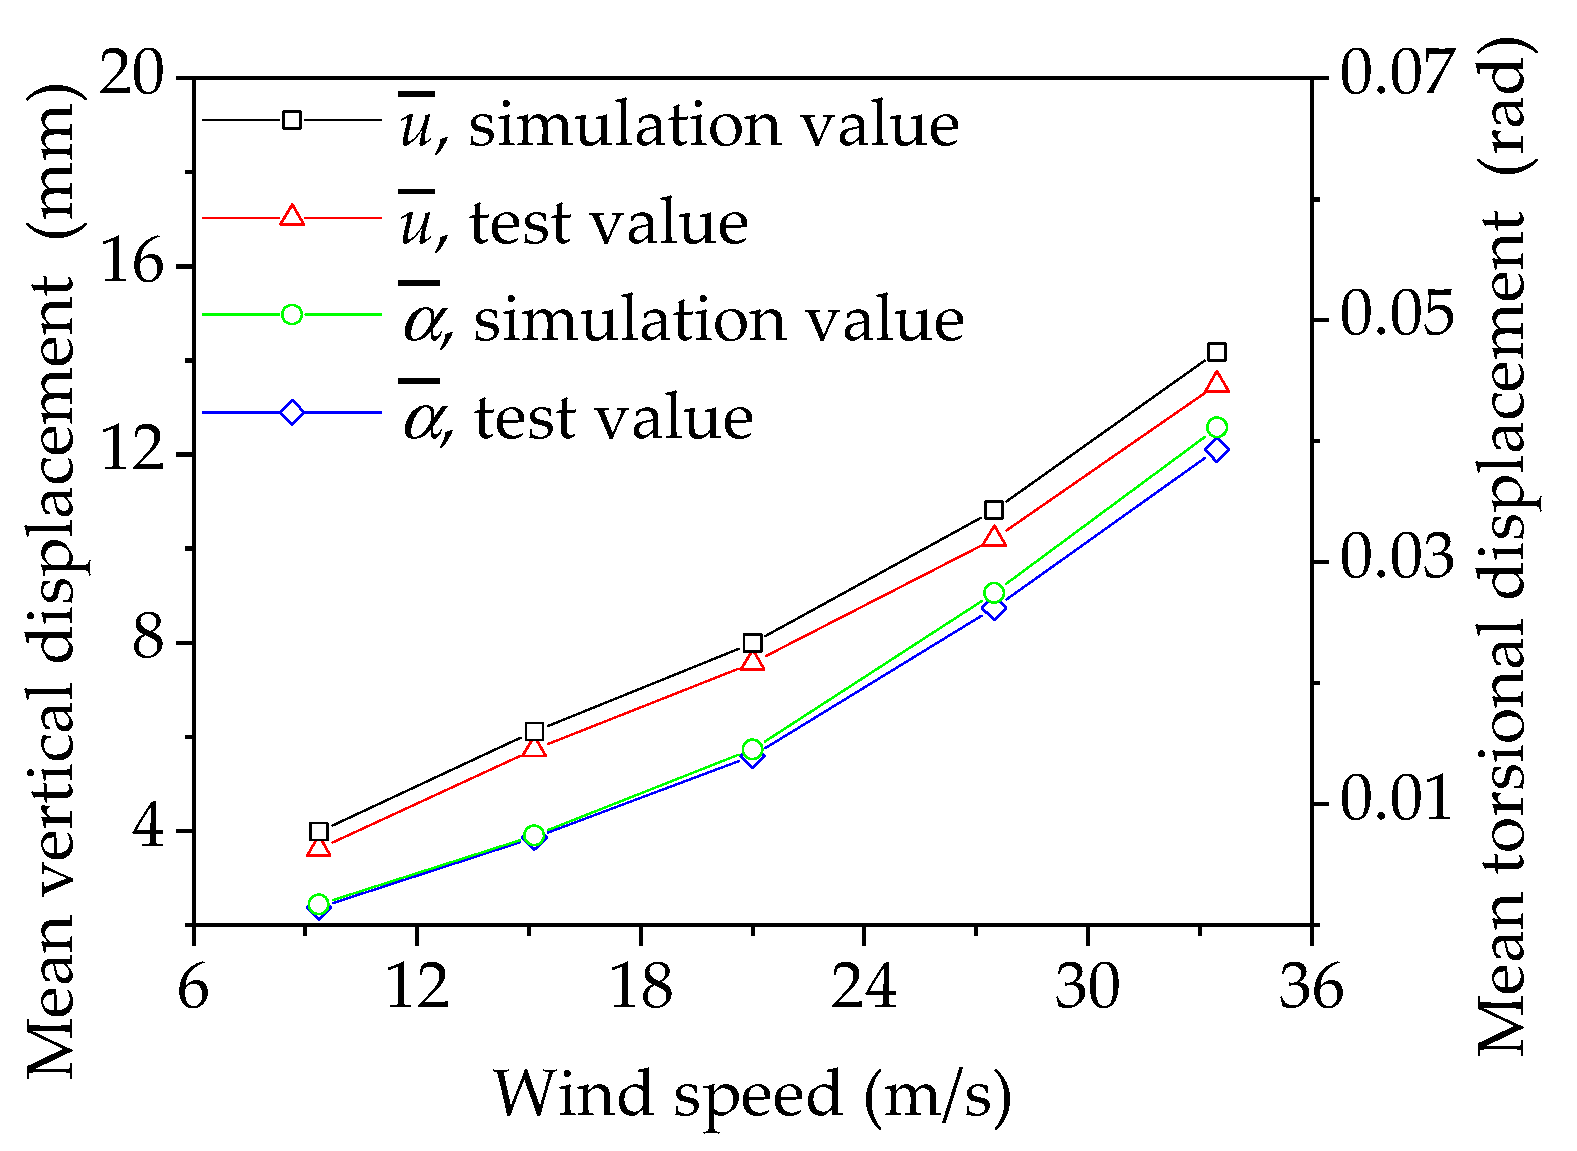
3.1. Establishment and Verification of Finite Element Model

Figure 1a shows that the CBUSB finite element model was established using ANSYS software [31], where beam188 element, link10 element, and mass21 elements were used to establish the curved beam model, stayed cable model, and handrail and bridge deck model, respectively. The Beam188 element is a two-node three-dimensional (3D) linear beam element based on the Timoshenko theory [32]. Link 10 is a tension-only or pressure-only element based on finite displacement theory [33]. The Mass21 element is a particle without shape and only has the function of stimulating quality. Note that the mass21 element was uniformly distributed in the main beam and secondary beam models to simulate the mass distribution of the railing and bridge deck, and the contribution of the handrail to the windshielding area was considered in the total windshielding area of CBUSB. The natural frequencies and modal shapes obtained through dynamic analysis are shown in Figure 8, where the first-order vertical and torsional models were symmetric and antisymmetric shapes, respectively. The difference in the fundamental frequencies between the first-order vertical and transverse bending models was small. Therefore, the modal coupling between first-order vertical and first-order transverse bending was dynamically intrinsic. The first-order torsional mode had an antisymmetric shape, and the frequency difference between the first-order vertical bending mode and the first-order vertical bending mode was large, so the possibility of bending torsional coupling was small.
Table 2 shows that the comparison of physical parameters between the finite element model in Figure 1a and the sectional model in Figure 2, as well as the errors of physical parameters, were small, indicating that the physical parameters of the finite element model were well simulated. The error e can be calculated using the following formula:
e = p m r s p f p f × 100 %
where rs is the similarity ratio corresponding to different parameters; pm and pf are parameter values of the sectional and finite element models, respectively.
Based on the quasi-steady assumption and the results of aerodynamic force tests, the mean lift force and the mean torque were applied to the finite element model (Figure 1a), and then the mean vertical displacement, u ¯ , and the mean torsional displacement, α ¯ , at the midspan of the finite element model were calculated. The mean displacement responses of measuring point 1 in Section 2.4 were converted using the geometric scale 1:10. By comparing the mean vertical displacement responses and the mean torsional displacement responses, the difference between the sectional model vibration test and finite element simulation was small (Figure 9). Therefore, the static wind load characteristics of the finite element model were well simulated.
The results show that the physical parameters and static wind load characteristics of the finite element model were well simulated.

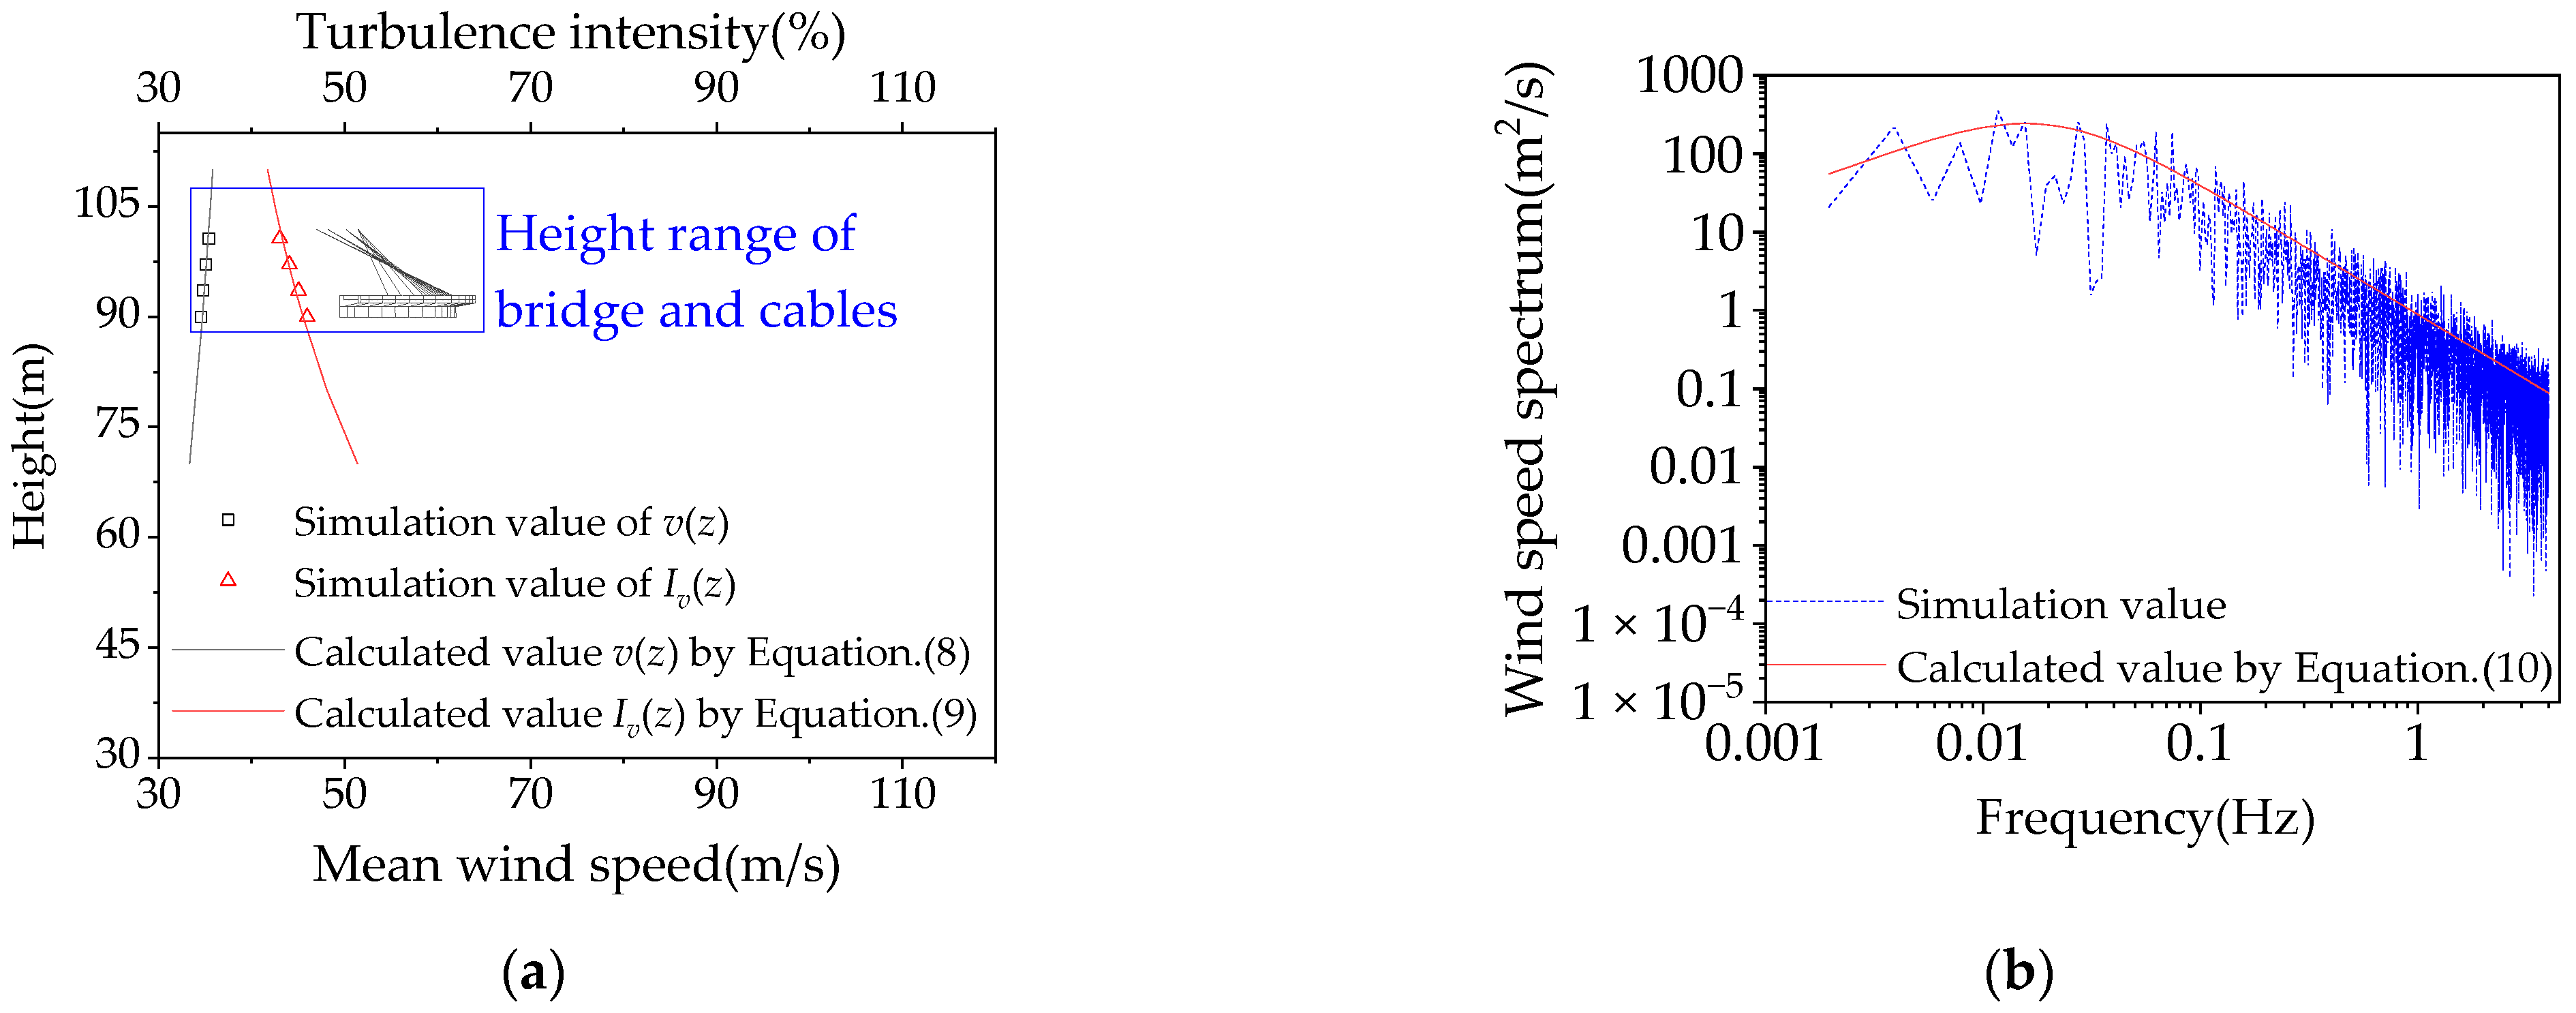
3.2. Numerical Simulation and Characteristic Verification of Wind Field

Based on the harmonic wave superposition method [34,35], turbulent wind fields under category B ground roughness [36] were simulated using MATLAB software, which can obtain wind speed time history values in finite element model nodes. The height range of the simulated turbulent wind fields was 90.00–100.66 m and the CBUSB was 90.00 m above the ground.
The simulated turbulent wind field was then verified to ensure the accuracy of turbulent wind loads imposed on the finite element model. According to the Chinese load code [30], the mean wind speed profile function is written as follows:
v ¯ ( z ) = v ¯ 10 z 10 α
where v ¯ is mean wind speed; z is ground clearance; v ¯ 10 is mean wind speed at z = 10 m; α is the ground roughness exponent, and under category B ground roughness, α = 0.16.
The turbulence intensity function is written as follows:
I v ( z ) = 1 ln z z 0
where Iv is turbulence intensity; z0 is terrain roughness height, z0 = 0.05.
Fluctuating wind velocity power spectrum functions proposed by Davenport are written as follows:
S v ( n ) = 4 K v 10 2 x 2 n ( 1 + x 2 ) 4 / 3
x = 1200 n v 10 , n 0
where n is the frequency of the fluctuating wind velocity; K is the ground roughness coefficient, and under category B ground roughness, K = 0.005.
Figure 10 shows wind field characteristics comparison between calculated values using Equations (8)–(10) and simulated values, indicating that the wind fields were well simulated.
According to the verification of wind field characteristics and the comparison between the finite element calculation result and the sectional model vibration test result, physical parameters, static wind load characteristics, and dynamic wind load applications of the finite element model had accurate simulation reliability, which shows that the next parametric analysis was accurate and reasonable.

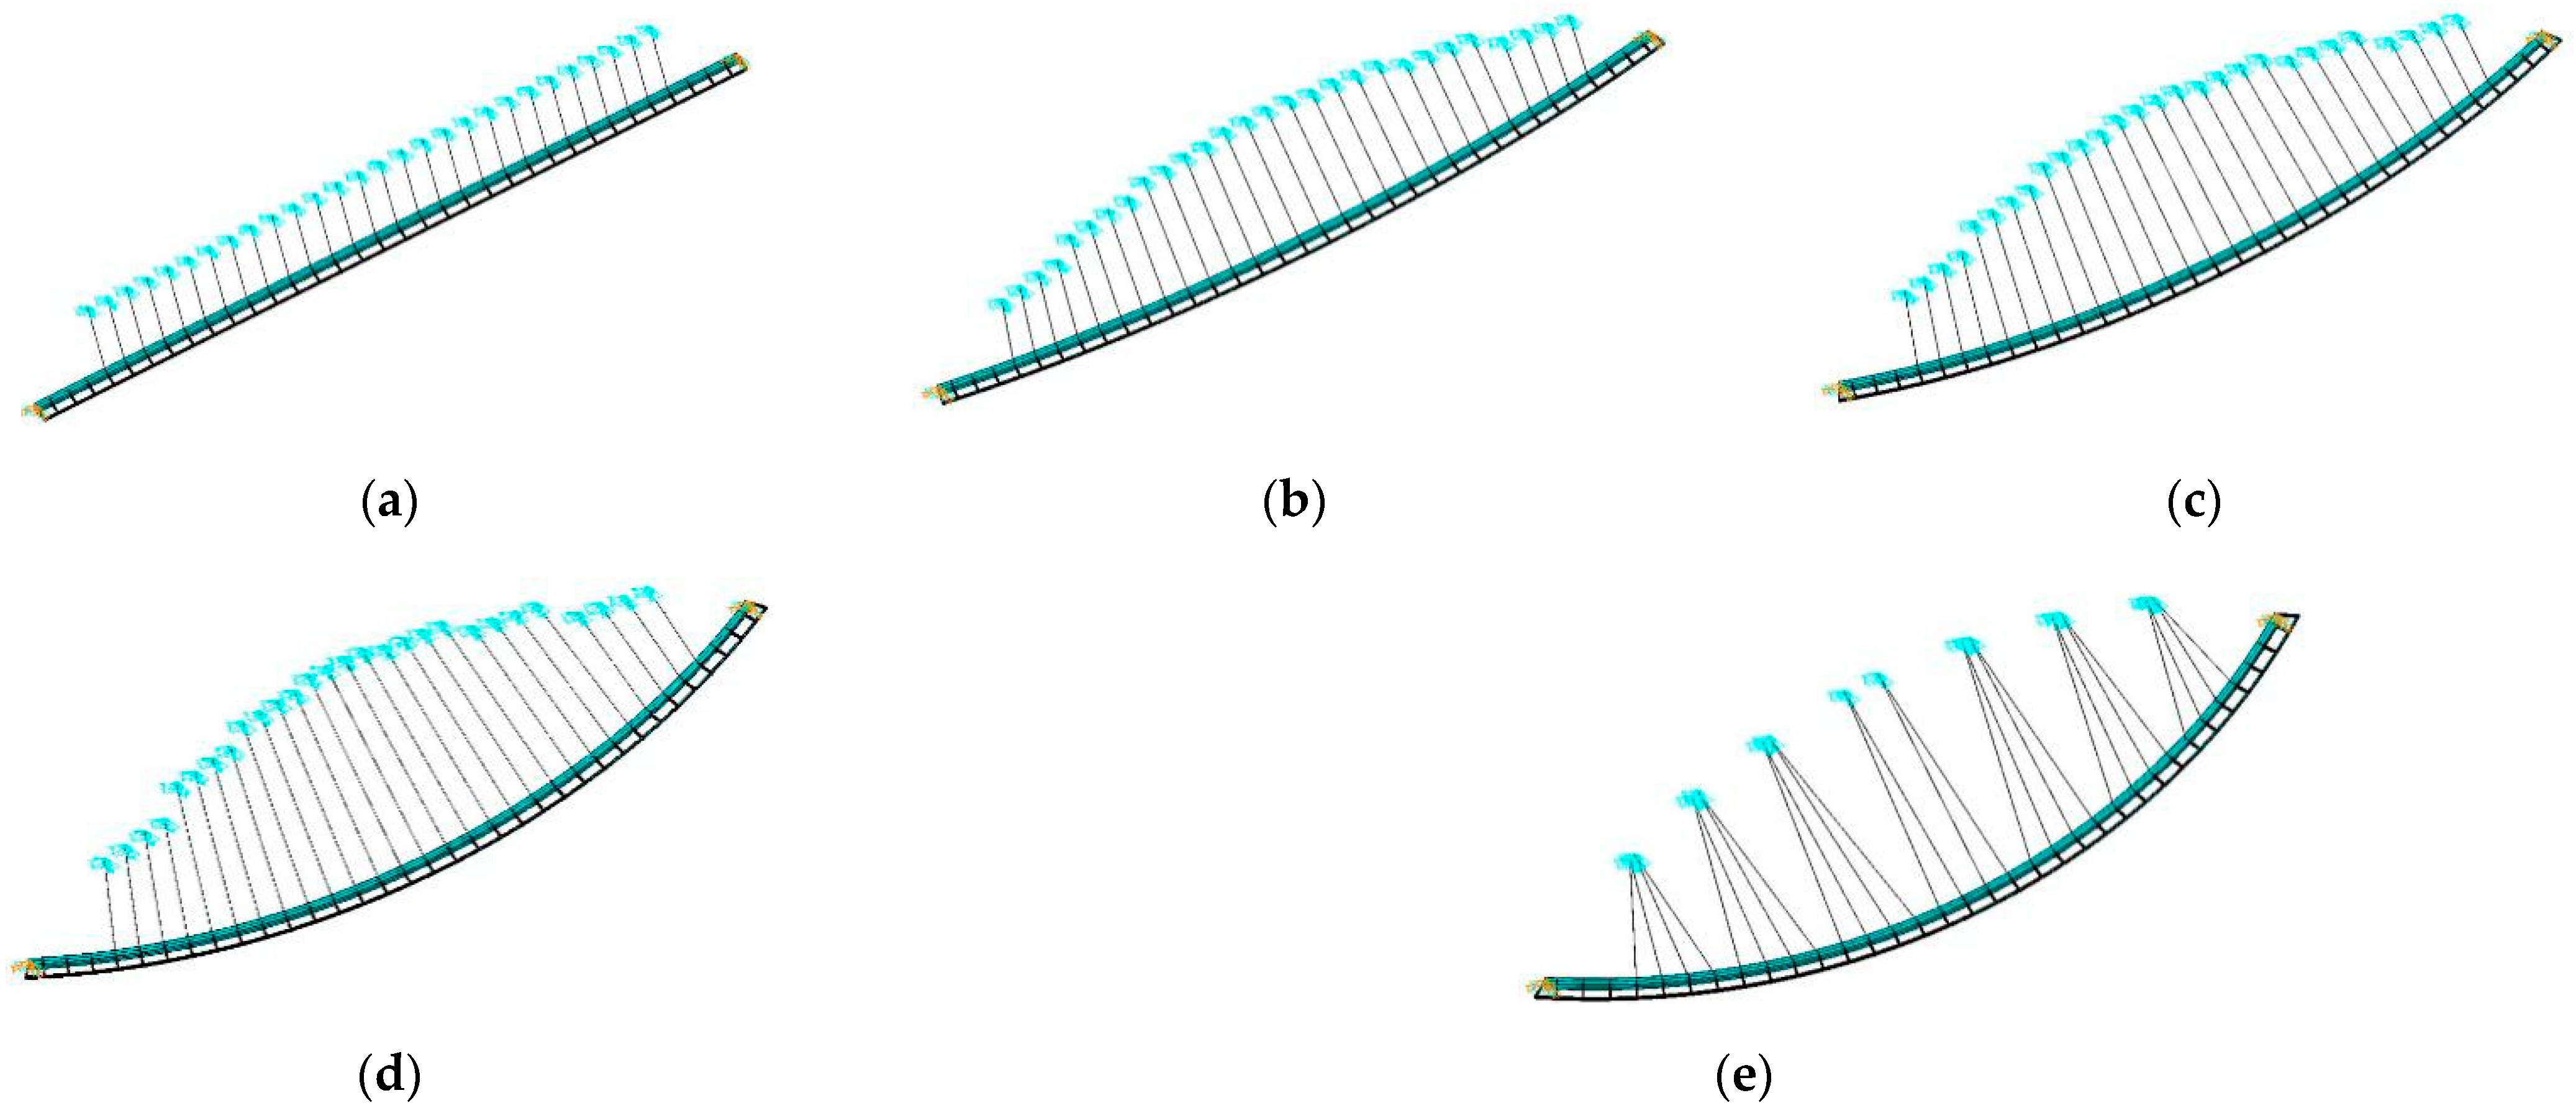
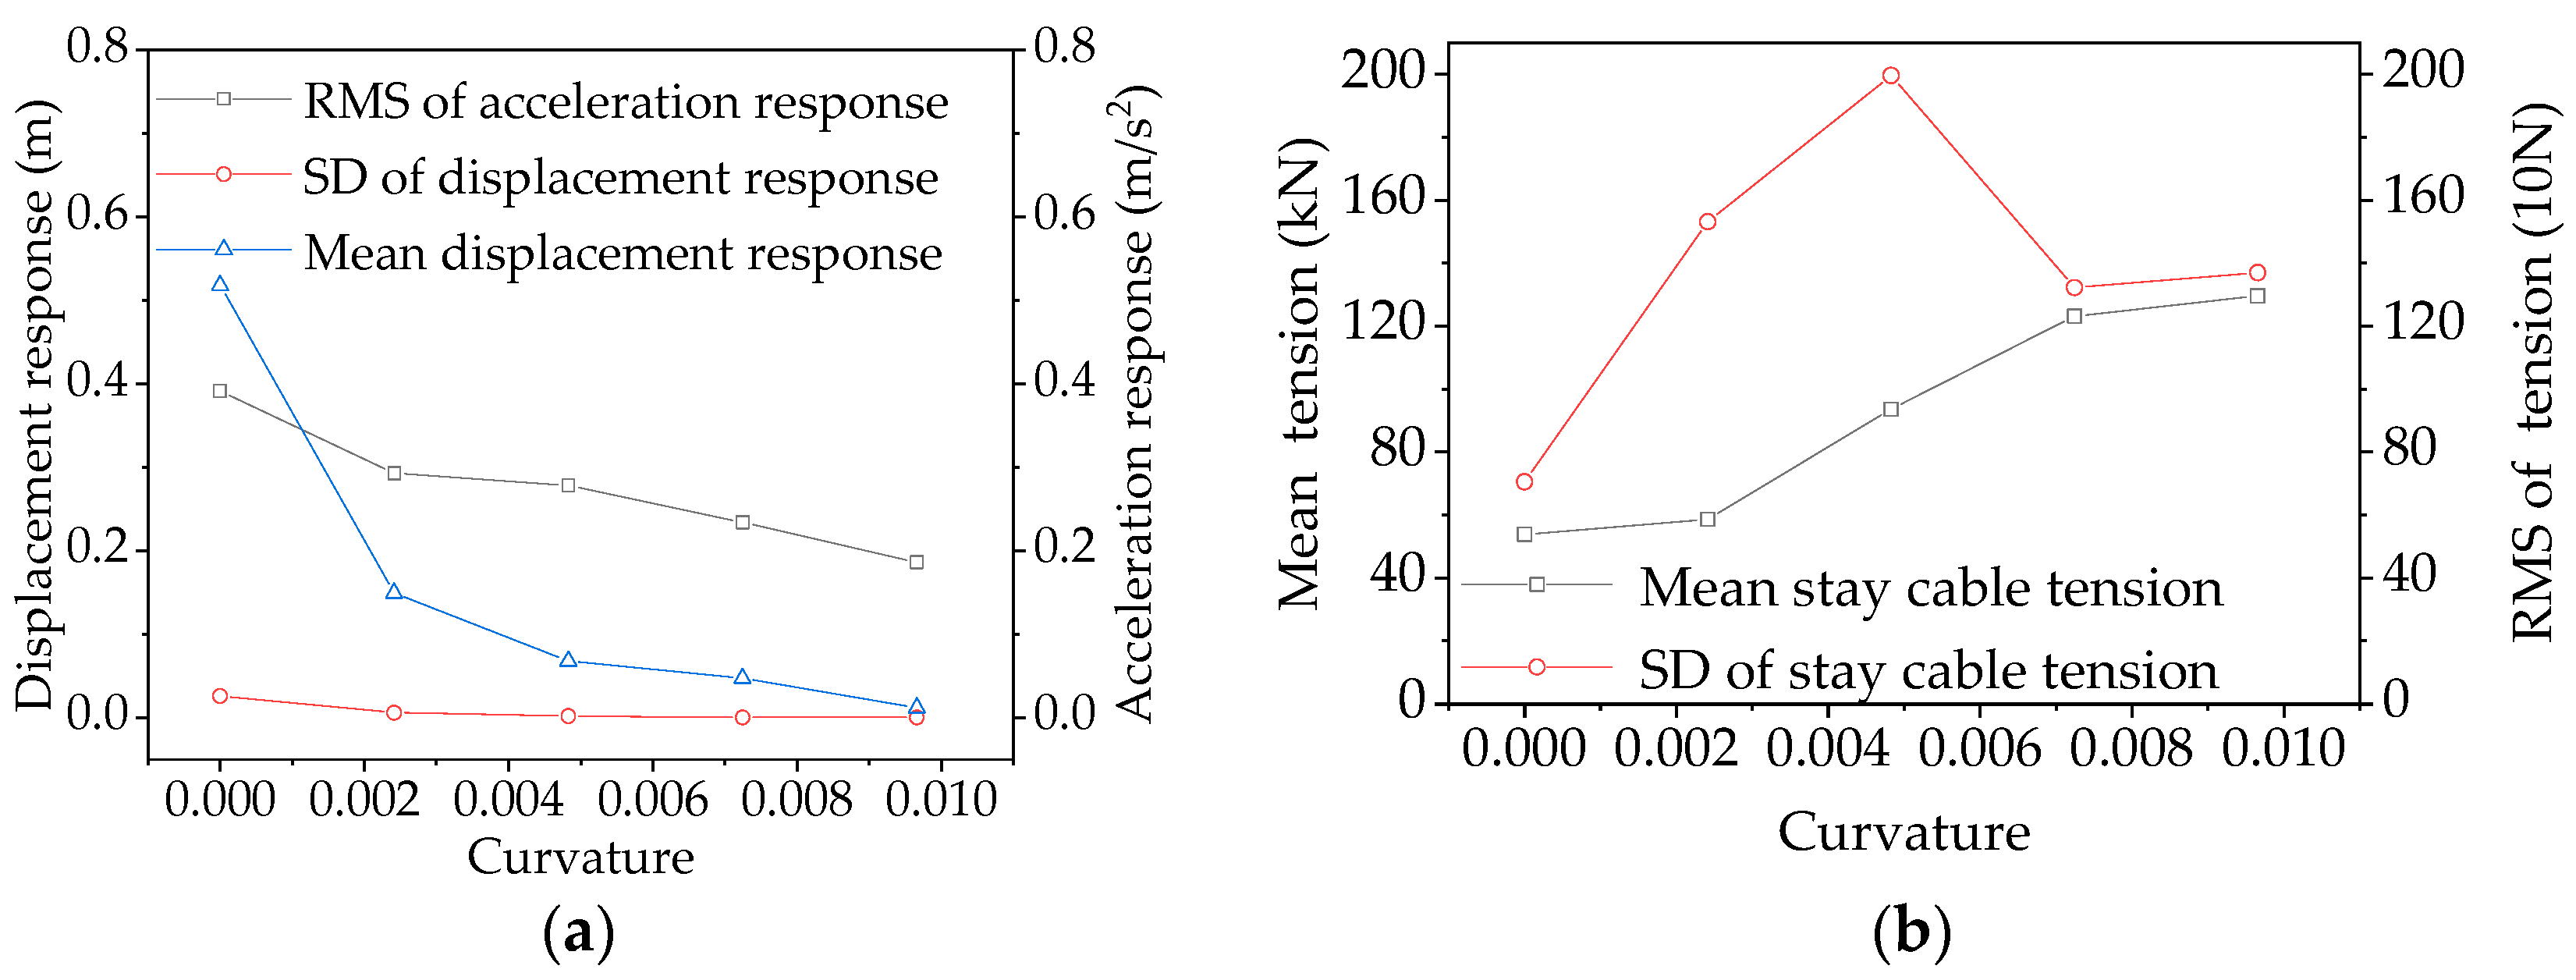
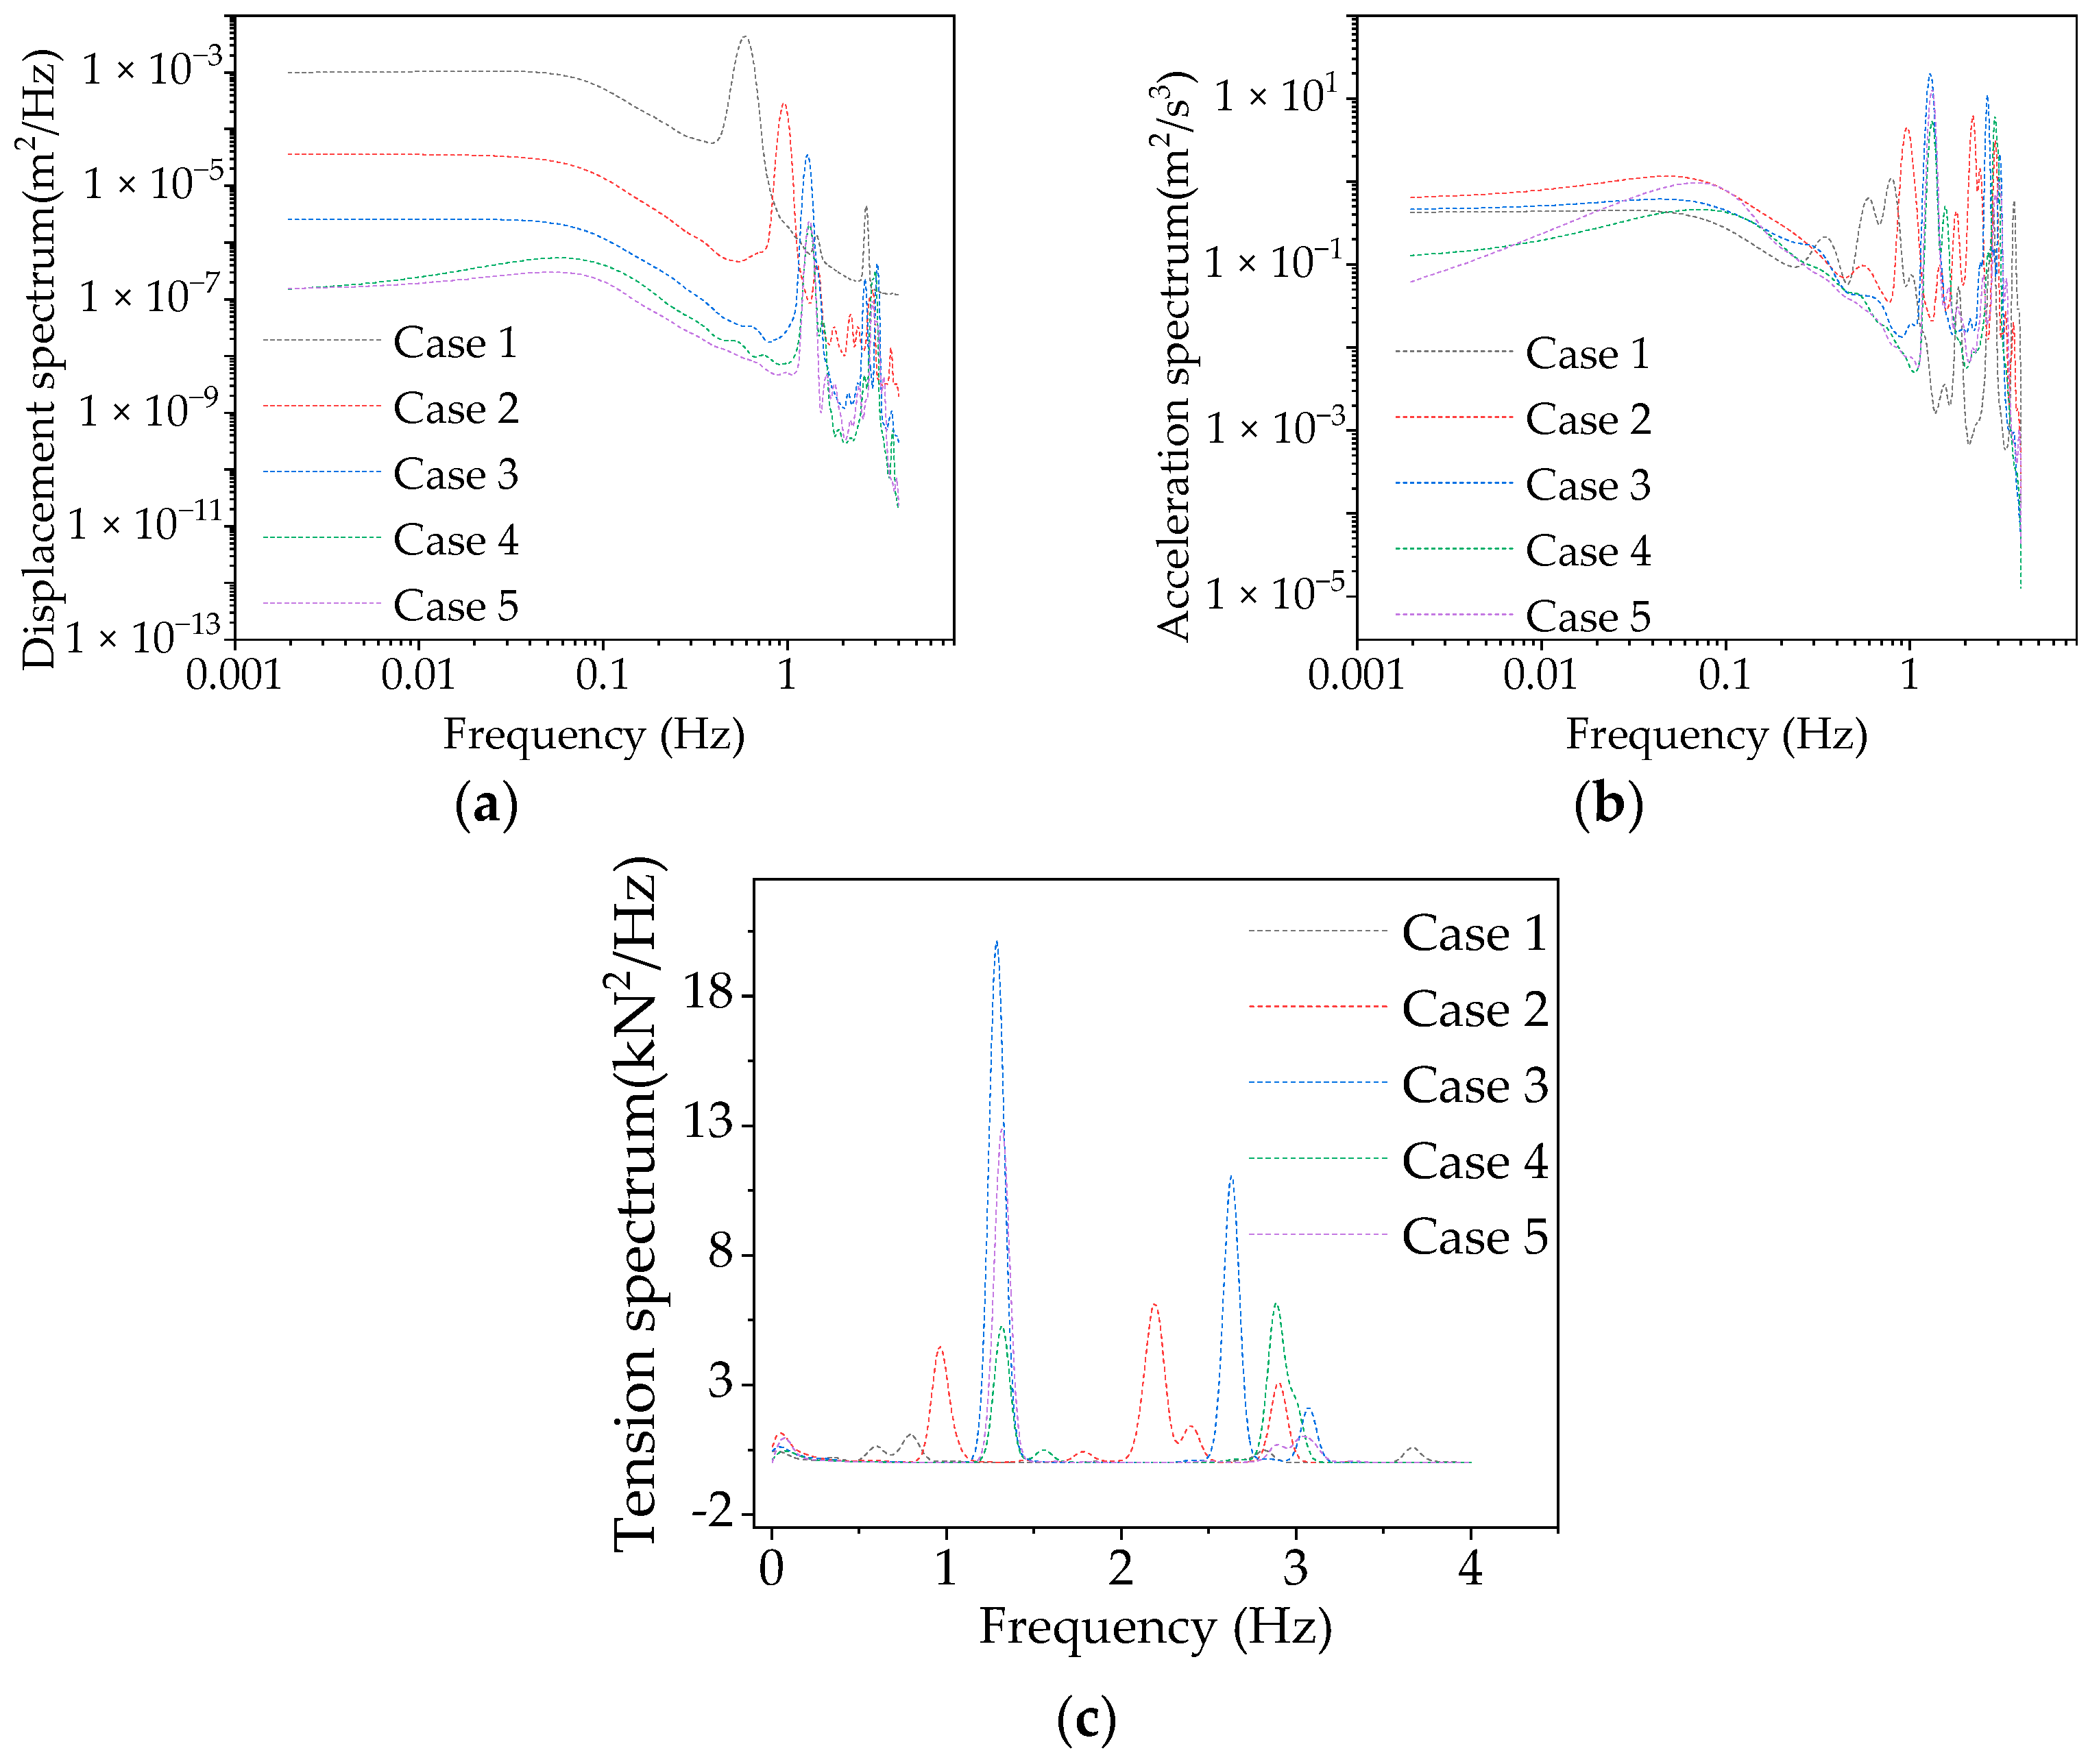
3.3. CBUSB Parametric Analysis of Curvature Variation

The curvature variation in geometric line type may result in variations in mass, stiffness, and dynamic characteristics, which can then influence wind-induced vibration response. The wind-induced vibration response of CBUSB is investigated in this section with curvature variation. The curvature of the finite element model in Figure 1a can be calculated using:
k = f ( x ) [ 1 + f ( x ) 2 ] 3 2
where k is the curvature; x is the coordinate value of the x-axis under the coordinate system in Figure 1a; f ( x ) and f ( x ) are the second-order and first-order derivatives of x, respectively.
The curvature of the finite element model in Figure 1a calculated using Equation (12) was 0.0097, which is defined as curvature case 5. Then, the definitions of curvature cases 1–4 are shown in Figure 11, and the corresponding curvatures were 0.0000, 0.0024, 0.0048, and 0.0072, respectively. During the curvature adjustment, the cross-section of the bridge and the fixed supports at both ends remained stationary; the connection point between stay cables and bridges remained stationary; and the z-axis coordinate values of each stay cable fixed-pin support remained stationary. Wind loads were applied to finite element model nodes under each curvature case, then the finite element model was analyzed transiently.
Figure 12 shows the trend of wind-induced response with curvature, and standard deviation abbreviated (SD). CBUSB was dominated by mean wind loads under wind loads (Figure 12a); with curvature increases, the mean displacement response and the SD of the displacement response decreased, indicating that the total wind-induced vibration response was suppressed. As the curvature increased, the RMS of the acceleration response decreased, and peak acceleration also decreased, indicating that increasing the curvature is conducive to improving pedestrian comfort of CBUSB. As the curvature increased, mean stay cable tension also increased (Figure 12b); SD of stay cable tension initially increased, then decreased, then increased, and the maximum RMS was found in curvature case 3.
Figure 13 shows the spectrum analysis of bridge and stayed cable. The first-order frequencies of case 1–5 were 0.586, 0.957, 1.283, 1.308, and 1.318 Hz (Figure 13a). As the curvature increased, the first-order frequency of CBUSB also increased, demonstrating that the excitation frequency of resonance the response was far away from the wind predominant frequency (0.006–0.037 Hz), and the resonance energy excited by wind load decreased at a certain wind speed. As the curvature increased, the high-order modal resonance response was excited, and the bandwidth of high-order modal resonance frequency gradually increased, but the peak value of the high-order mode was smaller than the low-order modal, so the high-frequency vibration reduction should be considered for pedestrian comfort control at high wind speed, and a broadband vibration reduction method can be used. As the curvature increased, the resonance acceleration energy distribution gradually changed from sparse to dense in the range of 1–4 Hz bandwidth (Figure 13b), resulting in a modal coupling vibration. The peak values of cable tension resonance energy in case 3 was high (Figure 13c), and after band-pass filter [37], the resonance response of case 3 accounted for 43.11% of the fluctuating response. Due to the long-term dynamic response, the cable was in fatigue loss and may have had fracture failure. Therefore, further study is necessary.

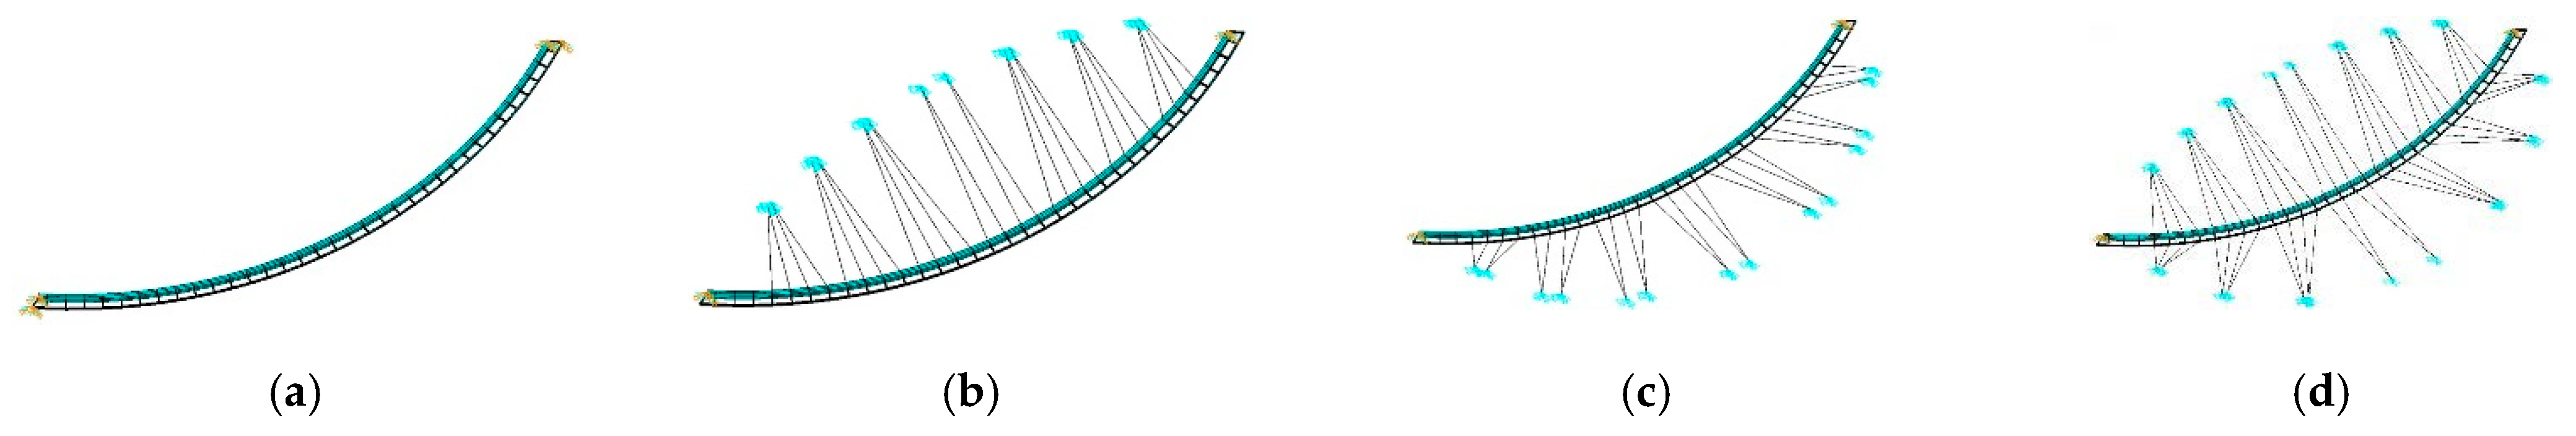
3.4. CBUSB Parametric Analysis of Stay Cable Layout Scheme

The variation in the stay cable layout scheme may result in variations in mass, stiffness, and dynamic characteristics, which can influence the wind-induced vibration response. The wind-induced vibration response of CBUSB in this section was investigated using stay cable layout scheme variations.
A curved beam bridge was set with four cable layout cases, which were no cable layout in Figure 14a, cables arranged near the center of the curvature (as same as the CBUSB example) in Figure 14b, cables arranged away from the center of the curvature in Figure 14c, and cables arranged on both sides of the bridge in Figure 14d. Symmetries of the cables in case 2 and 3 were arranged with respect to the tangent of the connection point. The cable layout of case 4 was a combination of cases 2 and 3. The finite element model of each case was analyzed, and the dimensionless data were analyzed by dividing the time domain calculation results of each case by the calculation results of case 2.
The y-direction bridge displacement response and cable tension response at the midspan of cases 1–4 were extracted, and the response components were obtained by band-pass filtering. Figure 15 shows the effect of a change in the cable layout scheme on various parameters. The along-wind mean displacement response of cases 3 and 4 was 2.05 and 0.95 times that of case 2, respectively (Figure 15a) because the arrangement of cables outside the center of the curvature may reduce the horizontal stiffness in the y-direction and increase the displacement response. The acceleration RMS of cases 1, 3, and 4 were 1.27, 1.26, and 0.81 times that of case 2, respectively. Cables arranged near the center of the curvature and on both sides of the bridge can reduce the peak acceleration in the y-direction of the bridge, allowing pedestrian comfort control. The natural frequency of the CBUSU can be increased by arranging cables (Figure 15b), and the resonance energy distribution of case 4 was more dense than that of case 1, and that of case 1 was more dense than that of case 2 and 3, which indicates that the possibility of modal coupling vibration will be reduced by arranging cables on one side, and the possibility of modal coupling vibration will be increased by arranging cables on both sides. As shown in Figure 15c, the frequency of the cable in cases 2, 3, and 4 and the frequency of the bridge in Figure 15b increased at 1.25 Hz, 1.32 Hz, and 1.52 Hz, respectively. The result shows that after the bridge cable interaction, the bridge and the cable resonated at the same frequency, that is, the nonlinear vibration of the cable included the response of the bridge, and the vibration of the bridge also included the response of the cable. As shown in Figure 15d, by comparing the proportion of each response component in the total response, CBUSB was dominated by the mean displacement response, the fluctuating response of cases 1 and 2 was dominated by the background response, and the fluctuating response of cases 3 and 4 was dominated by the resonance response. Therefore, the arrangement of cables away from the center of curvature can significantly increase the proportion of resonance response and increase the possibility of resonance failure of the bridge at high wind speed. Therefore, when CBUSB arranges the cable, it should be arranged inside the curvature center as far as possible to reduce the possibility of resonance damage.

4. Conclusions

In this study, the curved beam unilateral stayed bridge (CBUSB) in China was taken as an example. Sectional model wind tunnel tests were used as a reference, and a finite element model was established to analyze the influence of CUBSB curvature and stay cable arrangement on wind-induced vibration response. The main conclusions are as follows:
  • The aerodynamic force coefficients were obtained through aerostatic force tests and slopes of the CL-θ and CM-θ were positive in various θ, indicating that the main beam had the necessary conditions for aerodynamic stability. Each test value in the sectional model vibration test met the code requirements, indicating that the CBUSB had good vortex vibration stability;
  • With increasing curvature, the resonance energy excited by the wind load decreased at a certain wind speed, and the high-order modal resonance response was excited, indicating that high-frequency vibration reduction should be considered for pedestrian comfort control at high wind speeds, and a broadband vibration reduction method can be used. As the curvature increase, the resonance acceleration energy distribution gradually changes from sparse to dense, potentially resulting in modal coupling vibration. When the curvature is 0.0048, the resonance response regarding the fluctuating response is high, so fatigue failure of cables may occur; thus, further study on cable fracture for CBUSB is required;
  • CBUSB is dominated by mean response under wind loads. The arrangement of cables can increase the proportion of mean displacement response in the total response and increase the natural frequency of the curved beam bridge. The arrangement of cables on the side close to the center of curvature helps to reduce the proportion of resonance response. The arrangement of cables on both sides can reduce the peak acceleration in the transverse direction of the bridge, which is conducive to the control of pedestrian comfort, and cause the distribution of high-order and low-order resonance energy to be closer, which may result in modal coupling vibration. The arrangement of cables on the side away from the center of curvature can significantly increase the proportion of resonance response and increase the possibility of resonance failure of the bridge under high wind speed. Therefore, when CBUSB arranges the cable, it should be arranged inside the curvature center as far as possible to reduce the possibility of resonance damage. Affected by the interaction between cable and bridge, the cable and Bridge transmit their own vibration to each other, both of which contain the response components of each other.

Author Contributions

Conceptualization, S.Z.; Writing—review & editing, S.Z., J.C. (Jiahao Chen) and Z.Y.; Formal analysis, S.Z., J.C. (Jiahao Chen) and J.Y.; Software, S.Z., J.C. (Jiahao Chen) and J.Y.; Supervision, S.Z. and J.C. (Jianfeng Chen); Writing—original draft, J.C. (Jiahao Chen); Data curation, J.Y.; Methodology, Z.Y.; Validation, Z.Y. and J.L.; Resources, J.L., J.C. (Jianfeng Chen); Project administration, B.Z.; Funding acquisition, J.C. (Jianfeng Chen). All authors have read and agreed to the published version of the manuscript.

Funding

This research was funded by the Science and Technology Research Program of Chongqing Municipal Education Commission (Grant No. KJQN202001548), the Open Fund of Chongqing Key Laboratory of Energy Engineering Mechanics & Disaster Prevention and Mitigation (EEMDPM2021104), the Chongqing Jiulongpo science Foundation (2021-01-017-Y) and the R&D Program of China Construction Second Engineering Bureau Co. Ltd. (2021ZX180001), The National Natural Science Foundation of China via Grant (No. 52178458), The Foundation of Chongqing Science and Technology Commission (2022NSCQ-MSX3631).

Conflicts of Interest

The authors declare no conflict of interest.

References

  1. Cermak, J.E. Wind-tunnel development and trends in applications to civil engineering. J. Wind Eng. Ind. Aerodyn. 2003, 91, 355–370. [Google Scholar] [CrossRef]
  2. Gao, G.Z.; Zhu, L.D. Nonlinearity of mechanical damping and stiffness of a spring-suspended sectional model system for wind tunnel tests. J. Vib. Control. 2008, 318, 850–857. [Google Scholar] [CrossRef]
  3. Huang, M.H.; Lo, Y.L. A refined method of multi-target equivalent static wind loads: A bridge case. J. Wind Eng. Ind. Aerodyn. 2021, 212, 104609. [Google Scholar] [CrossRef]
  4. Xu, K.; Ge, Y.J.; Zhao, L. Quantitative evaluation of empirical models of vortex-induced vibration of bridge decks through sectional model wind tunnel testing. Eng. Struct. 2020, 219, 110860. [Google Scholar] [CrossRef]
  5. Zasso, A.; Belloli, M.; Muggiasca, S. Wind tunnel study on the Pescara footbridge. Eur. Afr. Conf. Wind. Eng. 2009, 10, 2309062. [Google Scholar]
  6. Li, H.; Piekarski, B.; DeVoe, D.L.; Balachandran, B. Nonlinear oscillations of piezoelectric microresonators with curved cross-sections. Sens. Actuator A Phys. 2008, 144, 194–200. [Google Scholar] [CrossRef]
  7. Yang, F.; Sedaghatia, R.; Esmailzadehb, E. Free in-plane vibration of general curved beams using finite element method. J. Vib. Control. 2008, 318, 850–857. [Google Scholar] [CrossRef]
  8. Swapan, K.C.; Sidney, S. Thin-walled curved beam finite element. J. Eng. Mech. 1977, 103, 921–937. [Google Scholar]
  9. Hu, J.; Ou, J.P. Comparison between field measurement and theoretical analysis results for a long-span suspension bridge’s wind-induced vibration responses. J. Vib. Shock. 2013, 32, 149–154. [Google Scholar]
  10. Arzoumanidis, S.G.; Bienie, M.P. Finite element analysis of suspension bridges. Comput. Struct. 1985, 21, 1237–1253. [Google Scholar] [CrossRef]
  11. Law, S.S.; Chan, T.H.T.; Wu, D. Super element with semi-rigid joints in model updating. J. Sound. Vib. 2001, 239, 19–39. [Google Scholar] [CrossRef]
  12. Lee, Y.Y.; Poon, W.Y.; Ng, C.F. Anti-symmetric mode vibration of a curved beam subject to auto parametric excitation. J. Sound. Vib. 2006, 290, 48–64. [Google Scholar] [CrossRef]
  13. Li, S.H.; Ren, J.Y. Analytical study on dynamic responses of a curved beam subjected to three-directional moving loads. Appl. Math. Model. 2018, 58, 355–387. [Google Scholar] [CrossRef]
  14. Yang, Y.B.; Wu, C.M.; Yau, J.D. Dynamic response of a horizontally curved beam subjected to vertical and horizontal moving loads. J. Sound. Vib. 2001, 242, 519–537. [Google Scholar] [CrossRef]
  15. Bao, Y.L.; Xiang, H.Y.; Li, Y.L.; Hou, G.Y. Dynamic effects of turbulent crosswinds on a suspended monorail vehicle–curved bridge coupled system. J. Vib. Control. 2021, 28, 1135–1147. [Google Scholar] [CrossRef]
  16. Lin, M.K.; Shi, J.Q. Analysis of Torsional vibration frequency of steel box-concrete composite beams with curved wavy webs. J. Lanzhou Jiaotong Univ. 2022, 41, 1–7. [Google Scholar]
  17. Xie, T.; Mohamed, A.M.S.; Elchalakani, M.; David, M. Experimental and analytical study of ultrahigh-performance fiber-reinforced concrete curved beams. J. Struct. Eng. 2020, 146, 91–92. [Google Scholar] [CrossRef]
  18. Arco, D.C.; Aparicio, Á.C. Improving suspension bridge wind stability with aerodynamic appendages. J. Struct. Eng. 1999, 125, 1357–1375. [Google Scholar] [CrossRef]
  19. Fenerci, A.; Oiseth, O.; Ronnquist, A. Long-term monitoring of wind field characteristics and dynamic response of a long-span suspension bridge in complex terrain. Eng. Struct. 2017, 147, 269–284. [Google Scholar] [CrossRef]
  20. Zhao, G.H.; Wang, Z.C.; Zhu, S.; Hao, J.M.; Wang, J. Experimental study of mitigation of wind-induced vibration in asymmetric cable-stayed bridge using sharp wind fairings. Appl. Sci. 2021, 12, 242. [Google Scholar] [CrossRef]
  21. Zhou, H.J.; Xu, Y.L. Wind–rain-induced vibration and control of stay cables in a cable-stayed bridge. J. Bridge. Eng. 2007, 303, 330–342. [Google Scholar] [CrossRef]
  22. Xing, C.X.; Wang, H.; Li, A.Q.; Xu, Y. Study on wind-induced vibration control of a long-span cable-stayed bridge using TMD-type counterweight. J. Brigde Eng. 2014, 19, 141–148. [Google Scholar] [CrossRef]
  23. Wu, B.; Zhang, L.L.; Yang, Y.; Liu, L.J.; Ni, Z.J. Refined time-domain buffeting analysis of a long-span suspension bridge in mountainous urban terrain. Adv. Civ. Eng. 2020, 2020, 4703169. [Google Scholar] [CrossRef]
  24. Montoya, M.C.; Hernández, S.; Nieto, F.; Kareem, A. Aero-structural design of bridges focusing on the buffeting response: Formulation, parametric studies and deck shape tailoring. J. Wind Eng. Ind. Aerodyn. 2020, 204, 104243. [Google Scholar] [CrossRef]
  25. He, B.; Zhao, M.X.; Feng, W.T.; Xiu, Y.P.; Wang, Y.; Feng, L.J.; Qin, Y.J.; Wang, C.K. A method for analyzing stability of tower-line system under strong winds. Adi. Eng. Softw. 2019, 127, 1–7. [Google Scholar] [CrossRef]
  26. Zhao, S.; Yan, Z.T.; Li, Z.L.; Dong, J.Y.; Zhong, Y.L. Investigation on wind tunnel tests of an aeroelastic model of 1000 kV sutong long span transmission tower-line system. Proc. CSEE 2018, 38, 5257–5265. [Google Scholar]
  27. Zhao, S.; Yue, J.H.; Savory, E.; Yan, Z.T.; Chen, J.H.; Zhang, B.; Peng, L.L. Dynamic windage yaw angle and dynamic wind load factor of a suspension insulator string. J. Vib. Shock. 2022, 2022, 6822689. [Google Scholar] [CrossRef]
  28. Ministry of Housing and Urban-Rural Development of the People’s Republic of China. Standard for Wind Tunnel Test of Buildings and Structures; JGJ/T 338-2014; China Architecture and Building Press: Beijing, China, 2014. [Google Scholar]
  29. Nussbaumer, H.J. The Fast Fourier Transform and Convolution Algorithms; Springer: Heidelberg, Germany, 1981; pp. 80–111. [Google Scholar]
  30. Ministry of Transport of the People’s Republic of China. Wind-Resistant Design Specification for Highway Bridges; JTG/T 3360-01-2018; China Communication Press: Beijing, China, 2018. [Google Scholar]
  31. Stolarski, T.; Nakasone, Y.; Yoshimoto, S. Engineering Analysis with ANSYS Software; Butterworth-Heinemann: London, UK, 2018; pp. 37–207. [Google Scholar]
  32. Hutchinson, J.R. Shear Coefficients for Timoshenko Beam Theory. J. Appl. Mech. 2001, 68, 87–92. [Google Scholar] [CrossRef]
  33. Hay, G.E. The finite displacement of thin rods. Trans. Am. Math. Soc. 1942, 51, 65–102. [Google Scholar] [CrossRef] [Green Version]
  34. Deodatis, G. Simulation of ergodic multivariate stochastic processes. J. Eng. Mech. 1996, 122, 778–787. [Google Scholar] [CrossRef]
  35. Jiang, Y.; Zhao, N.; Peng, L.L.; Liu, S.Y.; Xin, J.Z. Fast simulation of fully non-stationary wind fields using a new matrix factorization assisted interpolation method. Mech. Syst. Signal. Process. 2022, 172, 108973. [Google Scholar] [CrossRef]
  36. Zhao, S.; Yan, Z.T.; Savory, E. Design wind loads for transmission towers with cantilever cross-arms based on the inertial load method. J. Wind Eng. Ind. Aerodyn. 2020, 205, 104286. [Google Scholar] [CrossRef]
  37. Lawrence, J.C.; Terry, J.F. The Band Pass Filter. Int. Econ. Rev. 2003, 44, 435–465. [Google Scholar]
Figure 1. Diagram of curved beam unilateral stayed bridge (Unit: m). (a) Overall diagram of glass landscape bridge, (b) Bridge cross-section.
Buildings 12 01643 g001
Figure 2. Sectional model in TK-400 wind tunnel laboratory.
Buildings 12 01643 g002
Figure 3. Diagram of sectional model vibration testing. (a) Diagram of vibration test system, (b) Picture of vibration test system.
Buildings 12 01643 g003
Figure 4. Definition of sectional model wind attack angle.
Buildings 12 01643 g004
Figure 5. The distribution of aerodynamic coefficients with a wind attack angle.
Buildings 12 01643 g005
Figure 6. Measuring points of sectional model vibration testing.
Buildings 12 01643 g006
Figure 7. Comparison between the calculated value in the code and the measured value.
Buildings 12 01643 g007
Figure 8. Vibration modal shape diagram. (a) First-order vertical modal (1.318 Hz), (b) First-order transverse bending modal (1.339 Hz), (c) First-order torsional modal (10.875 Hz).
Buildings 12 01643 g008aBuildings 12 01643 g008b
Figure 9. Mean displacement response comparison between the sectional model vibration tests and the calculation results of the finite element simulation.
Buildings 12 01643 g009
Figure 10. Wind field characteristics comparison between simulation and calculated values. (a) Mean wind speed and turbulence intensity, (b) Wind speed spectrum.
Buildings 12 01643 g010
Figure 11. Diagram of curvature cases. (a) Curvature case 1 (k = 0.0000), (b) Curvature case 2 (k = 0.0024), (c) Curvature case 3 (k = 0.0048), (d) Curvature case 4 (k = 0.0072), (e) Curvature case 5 (k = 0.0097).
Buildings 12 01643 g011
Figure 12. Wind-induced vibration response analysis of CBUSB with curvature transform. (a) Along-wind wind-induced vibration response of bridge, (b) Stayed cable tension response.
Buildings 12 01643 g012
Figure 13. Spectrum analysis of bridge and stayed cable. (a) Bridge displacement spectrum, (b) Bridge acceleration spectrum, (c) Stayed cable tension spectrum.
Buildings 12 01643 g013
Figure 14. Cases of stay cable layout scheme. (a) Stayed cable case 1, (b) Stayed cable case 2, (c) Stayed cable case 3, (d) Stayed cable case 4.
Buildings 12 01643 g014
Figure 15. Parametric analysis of stayed cables layout cases. (a) Wind-induced vibration response, (b) Bridge displacement spectrum, (c) Stayed cables tension spectrum, (d) Response ratio.
Buildings 12 01643 g015aBuildings 12 01643 g015b
Table 1. Main parameters of sectional model.
ParametersSectional Model
Length (mm)702.00
width (mm)315.00
Main beam height (mm)130.00
Mass per unit length (kg/m)16.53
Mass moment of inertia per unit length (kgm2/m)2.78
Vertical frequency fv (Hz)4.101
Torsional frequency (Hz)36.541
Table 2. Comparison of the parameters between the sectional model and the finite element model.
ParametersSectional Model (pm)Similarity Ratio (rs)Finite Element Model (pf)Error (e)
Mass moment of inertia per unit (kg·m2/m)2.781:10427176.241.6%
Mass per unit (kg/m)16.531:1021653.140.1%
Vertical frequency (Hz)4.101 10 : 1 1.3181.6%
Torsional frequency (Hz)36.541 10 : 1 11.5893.0%
Publisher’s Note: MDPI stays neutral with regard to jurisdictional claims in published maps and institutional affiliations.

