

Measuring Street Network Efficiency and Block Sizes in Superblocks—Addressing the Gap between Policy and Practice

Department of Architectural Engineering, Collage of Engineering, United Arab University, Abu Dhabi P.O. Box 15551, United Arab Emirates
*
Author to whom correspondence should be addressed.
Buildings 2022, 12(10), 1686; https://doi.org/10.3390/buildings12101686
Submission received: 30 June 2022
/
Revised: 5 September 2022
/
Accepted: 13 September 2022
/
Published: 13 October 2022
(This article belongs to the Collection Strategies for Sustainable Urban Development)
Abstract
:This paper uses quantitative methods to evaluate the application of street connectivity policies stated by Abu Dhabi’s Urban Planning Council (UPC) on newly developed projects. The evaluation of the study was performed by measuring efficiency, i.e., how short and direct are paths between residential and nonresidential destinations to understand the ability of street networks to support sustainable transportation modes in the Capital District project. Efficiency is measured in twelve neighborhoods of the Capital District using Pedestrian Route Directness (PRD), a metric that meets Estidama—Abu Dhabi Green Rating System—walkability standards. Observation and analysis of the current stage of development show that more than 58% of the neighborhoods failed the route efficiency test to connect residential plots to one another. In addition, more than 40% of the neighborhood’s residential plots could not efficiently connect to nonresidential plots. The study includes recommendations for policymakers and project developers to enhance the street infrastructure to correlate with Estidama ratings by taking advantage of sikkak, the alleyways system that is found in other neighborhoods in the city. Significantly, recommendations are based on rigorous quantitative analyses that can be used for implementation in real-world projects, thus strengthening the connection between policy and practice.
1. Introduction
Today, achieving the UN’s sustainable development goals (SDGs) lies upfront in cities’ development strategies. The advocacy for a more sustainable urban form is at the center of city planning agendas. A growing body of research provides evidence of a link between the sustainable urban form of cities and street connectivity [1,2,3]. Street systems can potentially increase urban transportation mobility and support walkability by efficiently linking spatially separated spaces when well-connected street networks are present [4]. The quality of street connections has been found to reduce car dependency, lower fossil fuel consumption, improve air quality, and enhance the overall quality of urban life [5].
After years of designing residential street networks with low levels of connectivity, multiple city planning agendas, visions, and green rating standards started to consider the contributions of improved connectivity [4]. As a result, street connectivity measures are now an established tool to achieve more sustainable transportation strategies for residential street networks. However, the application of connectivity measures highlighted in promising planning agendas and sustainability rating standards for new developments worldwide, especially in the Gulf region, is still understudied. This paper investigates the street connectivity of residential street networks in a newly developed sustainable urbanization project, the Capital District, Figure 1, in Abu Dhabi, United Arab Emirates (UAE). In addition, it focuses on retrofitting opportunities in the early stages of project development to bridge potential gaps between policy and practice.
The UAE has been experiencing rapid urbanization since 1970, and much urban growth and development tend to be made virtually instantly. This fast growth of the built-up area in UAE was possible using “superblocks” as an urban planning strategy. Superblocks are commonly used in the UAE. and Gulf Cooperation Council (GCC) countries such as Saudi Arabia, Bahrain, Kuwait, and others, as a planning system that helped the Arabian Gulf expand post-oil discovery [6]. Superblocks are designed as large areas of land enclosed with arterial avenues and are approximately 600×900 m in size. They are commonly used in residential neighborhoods in Abu Dhabi and are especially prominent in the Capital District project, the context of this study.
Interestingly, the new integrated public transport network proposed for the Capital District project incorporates advanced sustainable urban mobility strategies applied for the first time in Abu Dhabi, including high-speed rail, metro rail, and tram networks [7]. Once completed, the district is planned within a five-minute walk (300 m) from transit to all key destinations [8]. However, the project’s current stage of development does not include any advanced transit systems yet, likely due to the current phase being focused on the development of twelve low-density residential superblocks which rely on their street networks to support walkability and cycling, as mentioned in the project proposal (USDM, 2015 P.63) [7].
Considering this, this research investigates the street connectivity of these twelve residential neighborhoods, looking at their role and impact on the overall mobility vision for the Capital District, particularly regarding its focus on creating an integrated multi-modal public transport network. Three different questions are addressed. First, how do the neighborhoods’ street networks contribute to the overall mobility vision of the Capital District? This question is asked to assess the potential of those neighborhoods’ street connectivity to be a part of the bigger urban mobility vision of the Capital District through a fully integrated transportation system. Second, what is the street network efficiency—i.e., to what extent can the network provide short and direct routes between plots in the low-density residential superblocks—of the Capital District? This question concerns the street network efficiency of developments constructed after the introduction of Estidama (Abu Dhabi’s Green Building Rating System). It evaluates whether the superblocks’ street connectivity performance meets the objectives and standards set not only by Estidama but and Abu Dhabi’s Urban Planning Council (UPC). Third, what early retrofitting solutions are available for the street networks that do not meet UPC and Estidama standards? The third question concerns the impact of adding streets that cater to pedestrians, such as alleys and shared streets—respectively, sikkak and mushtarak in Arabic language, to the neighborhoods’ street networks. In this case, the focus is on assessing their impact on the overall efficiency of the street system, and how they can be added after construction begins so that practice and policy are in better agreement.
By answering these three questions, this paper provides quantitative data to adjust and improve Urban Development Projects’ street connectivity and efficiency of urban development projects before the urban form is finally established. In addition, the paper outlines recommendations to strengthen the connection between policy and practice through the continuous auditing and retrofitting of a residential project development.
2. Literature Review
2.1. Abu Dhabi’s Superblock Development
Abu Dhabi’s superblock neighborhoods were proposed first by British planner John Elliot in the 1960s, to the founding father of the U.A.E., Sheikh Zayed [9]. The early proposed superblocks were inspired by American planning ideas of the late 1920s, especially by Clarence Perry’s Neighborhood Planning Unit (NPU) [10]. The neighborhood planning units in Abu Dubai were developed as components of a modular system that would work both as aggregations to form the larger, global city fabric and as independent “self-sustained” units where key land uses, such as mosques, schools, parks, and corner shops would support the local population.
As currently conceived and implemented, Abu Dhabi’s superblock neighborhoods foster car dependency, and the transportation system is highly dependent on fossil fuels [6]. Therefore, Abu Dhabi is considered to have a high rate of car ownership. This high rate of car dependency makes it extremely important for Abu Dhabi to think of a future vision for its street system, such that automobile use is reduced and more sustainable mobility modes are supported and encouraged.
Fortunately, Abu Dhabi’s government has been aware of the sustainability challenges brought by the predominance of motorized transportation. Multiple initiatives were outlined in Abu Dhabi’s 2030 Vision, the city’s forward-looking plan, as well as Estidama, Abu Dhabi’s Green Building Standard, in a set of regulations to enhance different modes of transportation [10,11]. As a part of the Abu Dhabi 2030 regulation, The Urban Street Design Manual (USDM) was published to the public in 2010 and later updated in 2015 [12]. The manual included eight goals; one of the main goals is street efficiency, noting specifically short blocks and greater route choice as a means by which to achieve this (USDM, 2015, p. 27 [12]). Further, four different types of streets were introduced in the manual. These are: one-way streets (cars only), mushtarak (shared streets that serving both pedestrians and cars), Sikkak (pedestrian alleys), and shared access lane (cars and sidewalks) (USDM, 2015, pp. 77–79 [12]).
Mushtarak and sikkak are designed to enhance pedestrian movement within the neighborhood. Mushtarak (مُشْتَرَك) is the Arabic word for spaces shared by multiple modes of transport. A street concept similar to the popular Dutch’s woonerf street introduced in the late 1960s, Mushtrak is designed to accommodate both cars and pedestrian movements [13,14]. Additionally, sikkak (سِكَكٌ) are characteristically present in superblocks in the UAE. and numerous other GCC countries’ cities. Sikkak plays an essential role in enlarging the basic street network available to pedestrians and shortening superblocks’ internal blocks. Their role has not been consistently studied; only recently have scholars tried to bring this issue to the foreground [15,16,17]. Scoppa et al. (2018) tested the street efficiency of ten different superblock designs, including orthogonal grids, Inward-looping street layouts, patterns with cul-de-sacs, and several other design variations [17]. The study found that sikkak make quite substantial contributions to street connectivity in all the tested network designs [17]. Additionally, the study noted that superblocks in Abu Dhabi have more sikkak than are necessary to ensure efficient connectivity and proposed a methodology for optimizing their provision, which is applied in this study.
Notably, the importance of sikkak has been underlined by Abu Dhabi’s Urban Planning Council (UPC), the agency in charge of planning and managing the UAE.’s capital city’s future growth. The UPC highlights the significance of sikkak in superblocks as critical pedestrian networks that improve access to services in neighborhoods (UPC, 2007, pp. 122, 154; UPC 2015, pp. 73, 91) [10]. Similarly, Estidama, Abu Dhabi’s green building rating framework, encourages Sikkak to plan more sustainable neighborhoods by giving extra points for neighborhoods that improve walkability. Furthermore, Estidama defines sikkak as “key pedestrian routes” (Estidama, 2010 pp. 73–74, p. 166) [18]. Both street typologies enhance walkability and have been a critical component in efforts to support sustainable transportation modes in all new developments in Abu Dhabi. Especially, the design of residential networks is planned to enhance walkability and cycling as stated in the UPC and USDM [8,12] (UPC p. 51, 2009, USDM. p.71).
The UPC report also includes three significant challenges addressed in the design of pedestrian networks. First, designing smaller blocks to establish accessible and attractive pedestrian networks. Second, creating shaded zones to control the climate through the street and building orientation, and finally, land use distributions that enhance neighborhood diversity (UPC p. 51, 2009). Unfortunately, although those requirements and recommendations have been crystallized in multiple regulations and sustainable urban planning agendas for more than ten years, their application is still not evident in new and ongoing neighborhood projects and other large scale developments.
One of the most promising projects, designed and developed by Abu Dhabi’s UPC, sets out to achieve high levels of street connectivity by following the Abu Dhabi 2030 Vision recommendation and Estidama Green Building. This project is the “Capital District” [7], and is regarded by the UPC as a demonstration project where numerous measures that Abu Dhabi developed for future sustainable development will be applied [16].
2.2. The Capital District, Abu Dhabi
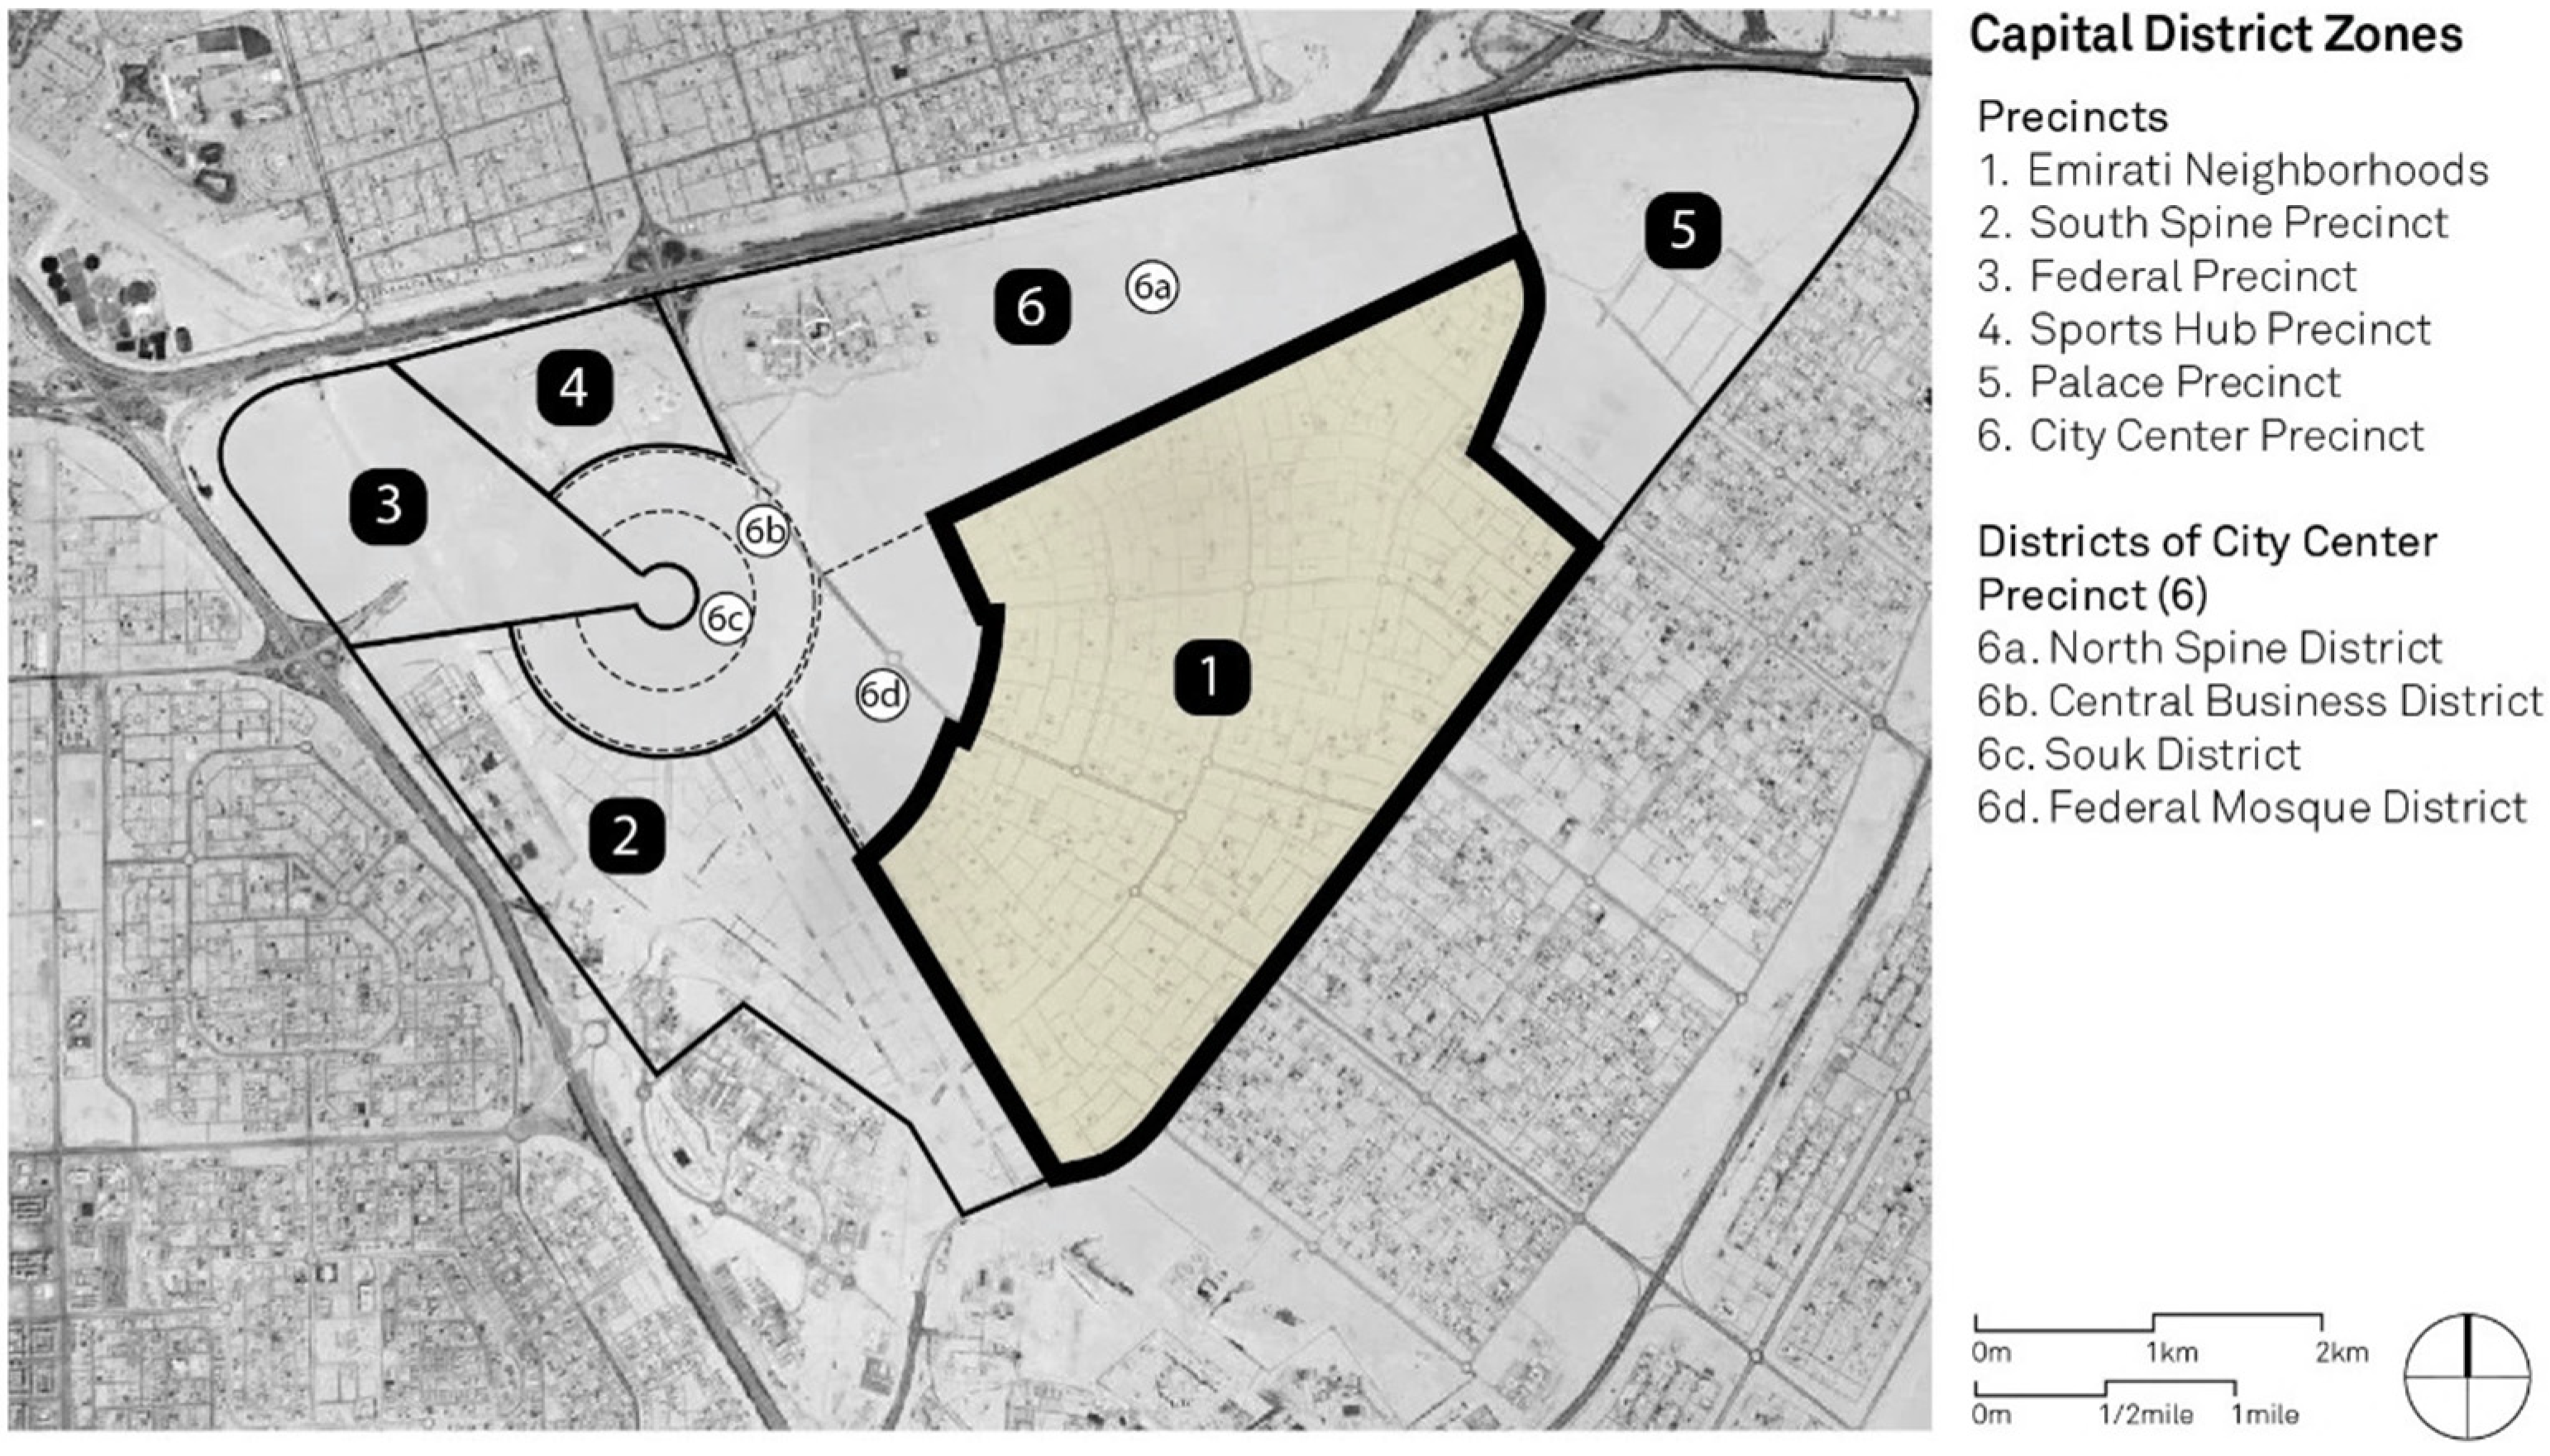
The Capital District is a mega-development project currently under construction in Abu Dhabi, planned on a land area of forty-five square kilometers and designed for a population of three hundred and seventy thousand residents. The district is regarded as the physical development of the sustainable visions of the Abu Dhabi 2030 Plan [10]. The UPC planned the Capital District to enhance connectivity and promote walkability [8,10] (UPC, p. 51, 2009). The design of the capital district includes six major precincts: City Centre Precinct, Federal Precinct, Emirati Neighbourhood, Sports Hub Precinct, South Spine Precinct, and Palace Precinct, all of which can be seen in Figure 1.
Figure 1.
The Capital District Zones Diagram adapted by the authors from Abu Dhabi Urban Planning Council Report 2009 [8].
Figure 1.
The Capital District Zones Diagram adapted by the authors from Abu Dhabi Urban Planning Council Report 2009 [8].

The Capital District’s center is designed as a radial pattern of streets connecting the six major precincts. Five of which are designed as high-density developments with the plan of providing an extensive public transit system to connect them to the rest of the city and the larger region. The system will include high-speed rail, metro rail, and tram networks (UPC, 2015, pp. 48–49). The high-speed rail will connect the capital district to major locations in Abu Dhabi and other cities. Also, the proposed ten metro stations along the major spines of the district are designed to support the higher ridership associated to the higher built densities of these spines. Finally, the tram and bus networks will extend to the low-density development areas and connect with the higher-level transit system. Figure 2 illustrates the transit plan proposed by the UPC. Considering the different modes of transportation within the district, a more complex interconnected street system for Abu Dhabi was designed to enhance urban mobility with different street hierarchies and its cure Figure 3A. The low-density residential development called “Emirates neighborhoods Precinct” is planned to have amenities such as mosques, parks, and schools within walking distance. However, Figure 3 shows no pedestrian-only street or sikkak planned or laid out for the neighborhoods. Once completed, the twelve neighborhoods for Emirate national will be composed of villas for almost 3000 families. The precinct is made of plots planned to accommodate residential villas. Each neighborhood is designed to be self-sufficient, including all the necessary land uses, reflecting its inspiration to the neighborhood planning unit. The size and characteristics of each neighborhood differ largely. The main infrastructure and street network are currently established and completed as the first phase of the Capital District.
2.3. Street Connectivity Measures
As earlier noted, street network connectivity gained increased importance over the past years. In fact, considerable research has associated street connectivity with sustainable urban form development in cities, leading to increased research on the topic as well as increased used of connectivity metrics in practice [19,20,21]. As the body of knowledge grew, many metrics emerged as quantitatively testing tools for street connectivity [22]. Yet, studies show that no standard approach to testing connectivity exists [23]. For example, multiple studies focused primarily on density-based metrics, such as street, blocks, and intersections densities [24,25]. Urban planners usually prefer density measurements in regulations since they require simple calculations [4,25,26]. Thus, they are found in multiple sustainable rating codes for neighborhood design.
On the other hand, block size-based measures are regularly used in street connectivity research as well as regulatory frameworks. Block size metrics include block perimeter, area, and face length [26]. Just as density metrics, they are relatively easy to calculate and implement in development codes and regulations, and numerous studies have focused on block area and perimeter as a means to address connectivity [27,28]. In fact, multiple city regulations suggest limiting block perimeter to 400–900 m. or block area to 10 acres (~4 Has.). However, some geometrical flaws are evident when only using block perimeters or areas, which may reduce the efficiency of these metrics for land use regulations while also producing disproportionately long narrow blocks [29]. Considering this, several neighborhoods have adopted average block face length for new neighborhood development since it is more robust, not being distorted when different block configurations are tested. The standard block face is usually set at 100–200 m and applied to every neighborhood block. Understanding block sizes and their effect on permeability in street networks is essential. Nevertheless, a shortcoming of block size measures is that it is hard to understand how patterns or different block sizes fit together [26]. Consequently, studies have considered such measures unreliable street connectivity indicators because they are usually affected by the shape of the study area [25].
In addition, as shown by Peponis et al. (2008), substantially different street patterns could have the same density values, thus weakening the usefulness of these metrics, and are limited in terms of their ability to address the connectivity of the network [30]. This inability to detect street patterns makes block size and density measures alone unsuitable for this study. Indeed, these limitations are the reason for adopting a metric able to address connections between origins and destinations in this study, in what can be termed targeted connectivity analyses. Many studies have tested walkability as targeted connectivity of access to different locations using residential plots as origins. For instance, Altman-Hall measured the walking distance between residential plots and nonresidential plots, with the latter including schools, transit stops, and open spaces within neighborhoods [31]. Similarly, Song and Knapp tested access to bus and other transit stops, parks, and commercial spaces [32]. At the same time, Dill evaluated accessibility to transit stations only [24].
Other studies have tested street network connectivity using Pedestrian Route Directness (PRD) [33,34]. PRD was first proposed by Hess (1997); since then, it has been used more frequently in quantitative street connectivity studies [33]. PRD is defined as the ratio of the shortest network distance between given origin and destination pairs, to the straight-line or Euclidean distance between them. In doing this, this metric extends the concept of simple metric distance by introducing the notion of efficiency. Networks able to provide more direct routes—i.e., straighter, and less meandering routes—between origins and destinations, are more efficient networks in terms of supporting non-motorized mobility. This is the method used by the UPC to measure the quality of street connections in Abu Dhabi and will be further elaborated on in the next section, given that it is also the method adopted for this study. In fact, recent UAE-based studies have selected PRD to test the street connectivity efficiency in different superblock’s street networks. Scoppa et al., 2018, tested PRD on ten different superblock street layouts, and found that orthogonal grids are highly efficient patterns, while patterns with cul-de-sacs may cause interrupted routes with low street efficiency [17]. This study also highlights the importance of alleys—sikkak—on improving the overall efficiency of the superblocks’ street networks. Soon after, the same group of researchers further tested these neighborhoods’ walkability potential by focusing on route directness to corners of the superblock, the points where superblocks connect and the points from where pedestrians can access surrounding areas. The study found that nearly all the tested neighborhoods have an efficient connection to the corners, providing further insight into the walkability of superblock street systems and their integration [35].
3. Methods
The study adopted a quantitative methodology based on the notion of route efficiency. In particular, the evaluation of walking routes in the superblocks that form the Emirati neighborhood precincts of the Capital District was based on the measurement of route directness. The study evaluated all the twelve superblocks within the emirate neighborhood precincts. Each Superblock has different characteristics and design configurations of street networks and characteristics. Figure 3A shows the position of the 12 neighborhoods and their current stage of development. At the same time, Figure 3B shows the street network of each neighborhood and dots representing the plots. More details about the characteristics of these twelve superblocks are introduced in Table 1.
Figure 3.
(A). The current stage of development of the Capital District in addition to the location of the 12 neighborhoods, June 2022; (B) illustrates street networks and dots representing plots.
Figure 3.
(A). The current stage of development of the Capital District in addition to the location of the 12 neighborhoods, June 2022; (B) illustrates street networks and dots representing plots.

The measure of network efficiency and directness used in this study is Pedestrian Route Directness or PRD. Proposed in the mid to late 1990’s [33], this metric has seen increased use in research of UAE neighborhoods and superblocks [35]. Importantly, it forms part of Estidama—Abu Dhabi’s Green Building Standards—regulations addressing walkability and sustainable urban development [18]. PRD is the ratio of the network distance to the Euclidean distance connecting an origin–destination pair of points. The lower this ratio, the more efficient the route. Calculations were performed based on the equation below.
where PRD [i] is the pedestrian route directness of origin plot i, is the network distance separating origin plot i from destination plots j, is the Euclidean or airline distance between the origin and destination, and n is the total number of plots in the Superblock. A graphic representation for a simple origin–destination pair is introduced in Figure 3A.
The evaluation of this research was based on the ability of the twelve neighborhoods to support efficient connections between origins and destinations (O–D pairs) that the superblock residents would need or want to reach. Efficiency is understood in this study as the ability to provide short and direct connections between O–D pairs. The study included two sets of analyses between O–D pairs using two different networks illustrated in Figure 4b,c, Network 1 is the current network without any added sikkak while in Figure 4b, the added sikkak are shown.
First, the study tested each plot’s ability to connect to other residential plots, following an all-lots-to-all-plots rationale. The reason for considering all plots as origins as well as destinations for trips is based on the need to evaluate all possible routes within a given superblock, leading to a better understanding of the overall efficiency of the whole network, not just between single origin–destination pairs [15,36]. The second set of analyses observed the network’s performance in providing direct access between all residential plots (the origins) and all nonresidential plots (the destinations). In this second evaluation, which we called all-residential-plots-to-all-non-residential-plots, the focus was placed on the evaluation of the efficiency of the land use distribution pattern as mandated by zoning regulations. Hence, the analyses focused on each neighborhood’s ability to have connected pedestrian routes as per Estidama standards of a walkable community while also meeting universal walkable neighborhoods designs guidelines with accessible destinations within a 5 to 10 min walk, as per the original neighborhood planning unit (NPU) concept [11,37]. In addition, numerous previous studies suggest that, more direct routes connecting origins and destinations provide an incentive to walk as routes are shorter and, thus, more efficient [13,15,27,38,39,40,41].
In order to proceed with the calculation of PRD for the all-plots-to-all-plots and the all-residential-plots-to-all-non-residential-plots, it was necessary to build the street network maps, representing the street centerlines of each of the twelve neighborhoods studied. All superblock’s maps were digitized using CAD and GIS software. Using these street centerline maps, and the points representing plot centroids, the data was ready for analysis. The analyses were performed using the ArcMap 10.8 GIS and used its Network Analyst module. As expected, the street centerlines represented the network, and the origin–destination matrix was built using the plot centroids.
As calculations proceeded, it was possible to estimate the two key values that make PRD. These are the network distance between each origin plot to each destination, as well as the straight—Euclidean—the distance between them. After all calculations were completed, the ratio of these two values was computed, and further evaluated following a pedestrian route directness test [38]. This test calculates the percentage of plots in a superblock whose PRD value is less than a 1.5 threshold. This threshold, utilized in Estidama regulations, indicates that plots have acceptable directness if they are, on average, no further than 1.5 times the shortest distance that connects them to other plots.
As earlier noted, two networks were used in this project. So, in addition to evaluating PRD and conducting PRD Tests on the base network (i.e., Network 1), we further evaluated the role of pedestrian network, sikkak, in providing efficient connectivity between origins and destinations. Previous local studies showed that sikkak break up long blocks in neighborhoods into smaller blocks, facilitating directness as demonstrated in several recent studies [17,35]. Considering these previous findings, the second network has added segments representing sikkak, as can be seen, in Figure 4c; sikkak were placed following a clear criterion. If the block’s faces were over 200 m long, a sikka should be added in the middle to break long blocks into smaller ones. As mentioned before, previous studies and policies of block size regulations limit measures to 200 m block face from through street to through street [4,29]. In addition, a “continuity principle”, adopted from previous studies, splits the blocks to create more continuous street centerlines [39,42].
A similar process was done on the twelve neighborhoods and then tested to study whether there were any improvements in network connectivity efficiency. The evaluation of the impact of the sikkak system in the Neighborhoods of the Capital District constitutes a key objective of this study. Currently, as shown in Figure 3A,B, the 12 neighborhood studies have no clear, planned sikkak, potentially missing the opportunity to create a better connected and more efficient system of pedestrian neighborhoods, as they are not yet built and could be added paths.
4. Results
As the analyses of all-residential-plots-to-all-residential-plots and all-residential-plots-to-all-non-residential-plots were completed for Networks 1 and 2, it was possible to evaluate the performance of each neighborhood in terms of providing efficient and direct paths between origins and destinations. It’ss important to note that the results are not comparable across the different superblocks studied, given that they have different characteristics in terms of size and shape. However, essential observations can be made to answer the study’s questions. Table 2 shows that in Network 1—the network that does not include sikkak—the number of plots that passed the PRD test, i.e., had an average PRD value of 1.5 or less, varied between a maximum of 82.4% for superblock 12, and the lowest value of 16.4% for superblock 3.
These results demonstrate that the superblock street layout’s design can significantly affect their connectivity efficiency. Likewise, to the noted maxima and minima, we can highlight that 7 out of 12 neighborhoods have more than 50% of their plots failing the directness test. In contrast, only one has passing plots percentages above 80%. As well as the distance between plots in each of these superblock neighborhoods differs significantly. In fact, as outlined in the table, five neighborhoods have average trip lengths longer than 800 m and thus exceeding the standard 10 min walk.
Following the results obtained using Network 1, the evaluation of the role of sikkak as added to Network 2, is presented in the last three columns of Table 3. It is clear from the results that sikkak makes a remarkable contribution to the efficiency of the neighborhood networks. Without exception, the neighborhoods’ percentage of passing plots exceeds 90% in ten of the studied neighborhoods, and only two cases show values below this percentage threshold and above 80%. Figure 4 illustrates the passing and failing plots in Superblock 3 using the two different networks.
Particularly noteworthy is superblock 3, shown in Figure 5, as well as neighborhoods 4, 5, and 6, which show many-fold increases in terms of passing plots and average PRD values. Consequently, the average trip distance also decreased in all neighborhoods, with only two neighborhoods offering average trip lengths above 800 m.
Similar to what occurred in the previous case, Table 3 shows that the efficiency of access to nonresidential destinations in the studied superblocks varies, but at least 5 neighborhoods show values below 50% of passing plots. However, and once again, it is worth noting the impact that sikkak has on improving the circulation efficiency provided by the road network when these alleyways are added.
A remarkable number of neighborhoods increase the number of plots passing the PRD test. In fact, eight neighborhoods achieve values above 90%, four with values above 80%. It’ss worth noting that the average distance length was reduced in all the cases resulting in only 2 neighborhoods above 800 m or a 10 min walk. Lastly, and as expected, besides a significant increase in the percentage of passing plots, the results obtained with Network 2 show substantial decreases in terms of the average PRD value for all the neighborhoods studied.
After outlining the results of both analyses, it is now possible to highlight the link between these street connectivity analyses and each network’s general characteristics, focusing on the block size measure of each Superblock. A summary of the PRD results and block subdivisions is presented in Table 4. It is essential to note again that the superblocks are not directly comparable given variations in terms of their size and shape. However, important observations can be made regarding the contribution of Sikkak to the block size measures of the network.
On average, 15% additional street length was added to all the superblocks, reducing the average block face length by 28%, average block perimeter by 29% and average block area by 40%. Considering these results, as expected, Sikkak traversing long blocks increases the block density and enhances the street system’s overall connectivity. It is also essential to look at the block length difference between superblocks. For instance, Superblocks 9 and 11 both had average block face lengths of more than 200 m, while all other superblocks had block faces of more than 150 m. on the contrary, when Sikkak was added, all the superblocks except superblock 11 were lower than 155 m.
5. Discussion
The study tested the street network efficiency of the twelve residential superblocks that make the Emirate Neighborhoods precinct of the Capital District project of Abu Dhabi. Two sets of analyses were conducted, uncovering the efficiency of the network in terms of connecting all plots in these neighborhoods, and between residential and non-residential plots by means of short and direct routes. The results provide valuable information by which to support several observations regarding the route efficiency that the neighborhoods provide.
First, the results highlight that only a few neighborhoods in Capital District currently provide short and direct routes between all possible pairs of origins and destinations. In fact, the results indicate that 7 out of the 12 neighborhoods studied failed the PRD test. More precisely, the test indicates that direct and efficient routes connecting the plots of the superblocks are characteristically absent in the majority of the neighborhoods. Similarly, 5 out of 12 neighborhoods failed the PRD test of providing efficient paths connecting residential and nonresidential plots. Indeed, in about half of the superblocks studied, reaching non-residential destinations involves route deviations that are larger than 1.5 times the shortest possible route. Taken together, these results show that there exist quite large variations in the street efficiency of the tested neighborhoods, and highlight the importance of addressing this matter if the Emirate Neighborhoods are to support the sustainable mobility vision of the Capital District project. In other words, the analyses bring forward that there exists an opportunity or optimizing the contribution of the Emirati Neighborhoods precincts to the ambitious sustainable urban mobility plans highlighted by the UPC for the Capital District. These results answer the first two questions outlined in the introduction, noting that the Emirates Neighborhood street networks are not all efficient, and that they will likely affect the overall mobility plans that the UPC set out to achieve.
Second, the neighborhoods’ currently “as-built” status doesn’t yet include alleys—i.e., sikkak—even though these have been noted to be key pedestrian infrastructure by the UPCs Urban Street Design Manual, Estidama rating system principles, and multiple recent studies of Abu Dhabi [7,11,14,15]. Following this observation, the study tested the addition of sikkak to answer the last question of the study. To do this, a tried and tested methodology previously applied in the study of Abu Dhabi superblocks was used, and actually enlarged by addressing the need to limit block face lengths to 200 m following international standards and research findings. As expected, given the previous results from tested neighborhoods with similar network designs [17], sikkak improved route directness where more than 80% of the plots pass the PRD test in the case of connections between residential plots to other residential plots as well as nonresidential destinations. However, unlike previous studies which focused on consolidated neighborhoods with already established plots, sikkak, and buildings, the Emirate Neighborhoods of the Capital District project can still be retrofitted as their construction is currently underway.
While these results provide actionable information to planning authorities, it is important to note that other properties of Abu Dhabi’s Superblocks’ physical form are not always covered in the city’s sustainable development standards and manuals. Indeed, while the superblock framework, as a means to build cities and neighborhoods, has been adopted by multiple cities around the world and the Gulf, key urban theorists such as Alexander and Jacobs have long criticized it for creating fragmented and segregated neighborhoods that do not integrate well with their surroundings [40,43]. More specifically, according to Jane Jacobs, the large sizes that characterize superblocks were a major reason in isolating neighborhoods, especially when long blocks were present [41]. Recent studies considered scaling down the superblock to 400 m, resulting in more permeability between neighborhoods [44]. A recent example form practice regarding limiting sizes to about 400 × 400 Superblock can be found in the Barcelona superblock model, in which the sustainable mobility goals are constructed on the basis of shared streets, i.e., with cars and pedestrians sharing the right of way. Particularly, on this last point, it is worth noting that shared streets, or mushtarak in Arabic language, do feature in Abu Dhabi’s planning strategies and standards when noting that pedestrians and pedestrianism are a priority for the city [45]. While this reduced superblock size seems optimal for supporting walkable distances with destinations reachable within five minutes walk, those superblocks are not yet being implemented in Abu Dhabi. In fact, the overall size of the neighborhoods is not currently directly addressed in any of the planning manuals and standards. Considering this, this study only tested the role of shorter blocks, as these are discussed multiple times in the UPC (UPC, pp. 51, 29, 41, 2009) and U.D.S.M (U.S.D.M., 2015, pp. 27, 77–79), noting that more clarity is needed regarding how short blocks should be as actual lengths are not currently discussed. This study shed light on the impact that block size regulations, specifically reducing block face length by adding alleys or sikkak, can have on the overall route efficiency that the street network provides.
After adding sikkak to block faces above 200 m, a quick assessment of the block subdivisions suggests some consistency between other block measures. For instance, the difference between the maximum and minimum average block perimeter of Network 1 is 258 m, while in network 2 the difference is narrowed to 119 m. Multiple city regulations suggest limiting block perimeter to 400–900 m or block area to 10 acres (~4 Has.) and keeping the average block face flexible. Further research may assist in testing different block size measures, limits, and standards for Abu Dhabi.
Lastly, The Capital District is a massive transit-oriented development project that, as it is still under construction, cannot yet be fully assessed. Still, this study’s observations could inform and assist planning auditors and the UPC on the current situation of street efficiency of the project, so that the connection between policy and practice can be strengthened. Several phases of development are yet to be built in order for the Capital District project to be completed. As the project continues, additional studies would be needed in order to more comprehensively assess the extent to which policy and practice have actually merged in this ambitious project, especially with regard to its role in supporting sustainable mobility and transportation in particular, and sustainable urban development in general.
6. Conclusions
Over the last fifty years the NPU concept, materialized through superblocks, has played an essential role in Abu Dhabi’s planning. The Abu Dhabi Planning Council recognizes the importance of planning more sustainable neighborhoods with more sustainable transportation modes in mind, as is reflected in the Capital District’s plans. However, the challenge that remains is that of ensuring that the vision of sustainable mobility that underpins the Capital District project is fully and completely achieved.
This preliminary research into the street connectivity of the Emirate Neighborhoods area of the project was conducted to better understand the relationship between research, regulation, plans, and practice. Undoubtfully, narrowing the gap between policy and practice is considered a critical issue in all disciplines. In this paper, this gap is bridged by noting how slight additions to the total street network length by adding sikkak and shortening blocks could enhance the neighborhoods’ street connectivity to support better walkability, encouraging individuals to use more sustainable and healthy transportation modes. In this study, the efficiency of the street networks of all the neighborhoods was quantified in terms of their ability to provide short and direct routes between origins and destinations. Precisely, their efficiency was measured using the Pedestrian Route Directness (PRD) index and its associated PRD Test. The results of the study show that most of the tested neighborhoods failed this connectivity efficiency test. This might affect the overall urban transit-oriented development that the Abu Dhabi aims to achieve. Further, besides providing a clear picture regarding the efficiency of each neighborhoods’ street network, this study evaluated the possibility of improving their efficiency by adding sikkak to the existing street system. The results reveal that all the studied neighborhoods can significantly increase their potential for walkability, and destinations could be more easily reached, if and when sikkak are added to them. Therefore, enhancing the street efficiency of each neighborhood will further support the urban mobility of the Capital District. Given these results, and in the interest of strengthening the link between policy and practice, this study recommends:
- That the Neighborhoods in the Capital District are retrofitted with pedestrian walkways such as sikkak (pedestrian only alleys) or mushtarak (shared streets). also, the role of sikkak and mushtarak as key pedestrian infrastructure is further strengthened in planning new neighborhoods and retrofitting existing ones.
- That block face length is evaluated as an additional standard for green building regulations that focus on neighborhood design in the UAE. In this case, more research, such as that presented in this paper, would be necessary to establish block face length limits and thresholds.
- That the connection and integration of the different precinct of the project is ensured by actively and comprehensively testing route directness, as well as block sizes and lengths, thus perfecting the necessary merger of planning standards and planning practice.
To conclude, the UPC is developing sustainable community measures, standards, and codes, which are in line with those outlined by cities and regions worldwide. Such codes allow for urban development to achieve the urban form and density that is needed to support walking and transit, thus reducing automobile dependence. Notably, the work presented in this paper transcends the specific context of the United Arab Emirates and its cities. This is the case because they not only provide a means by which to address the larger call of Goal 11 of the United Nations Sustainable Development Goals with respect to Sustainable Cities and Communities, but also because they constitute a useful reference to other GCC countries’ cities that share urbanization patterns and characteristics with the UAE.
Author Contributions
Conceptualization, M.S. and R.A.; methodology, M.S.; software, R.A., M.S.; validation, M.S., R.A.; formal analysis; investigation, R.A., M.S.; resources, M.S.; data curation, M.S., R.A.; writing—original draft preparation, M.S., R.A.; writing—review and editing, M.S.; visualization, M.S., R.A.; supervision, M.S.; project administration, M.S.; funding acquisition, M.S. All authors have read and agreed to the published version of the manuscript.
Funding
This research was supported by the United Arab Emirates University Start-Up Grant G00003328 and Sustainable Development Goals Research Program Grant 1984.
Acknowledgments
The authors would like to acknowledge the exceptional contribution of Architectural Engineering undergraduate students in this research, especially Hind Almheiri, Amna Aleghfeli, Shamma Alrashdi and Mira Aleghfeli.
Conflicts of Interest
The authors declare no conflict of interest.
References
- Ewing, R.; Handy, S.; Brownson, R.C.; Clemente, O.; Winston, E. Identifying and measuring urban design qualities related to walkability. J. Phys. Act. Health 2006, 3, S223–S240. [Google Scholar] [CrossRef] [PubMed]
- Berrigan, D.; Pickle, L.W.; Dill, J. Associations between street connectivity and active transportation. Int. J. Health Geogr. 2010, 9, 20. [Google Scholar] [CrossRef] [PubMed] [Green Version]
- Talen, E. Sprawl Retrofit: Sustainable Urban Form in Unsustainable Places. Environ. Plan. B Plan. Des. 2011, 38, 952–978. [Google Scholar] [CrossRef]
- Handy, S.; Paterson, R.G.; Butler, K. Planning for Street Connectivity. Getting from Here to There; Planning Advisory Service Report, No. 515; American Planning Association, Planning Advisory Service: Chicago, IL, USA, 2003. [Google Scholar]
- Frank, L.D.; Engelke, P.O. The built environment and human activity patterns: Exploring the impacts of urban form on public health. J. Plan. Lit. 2001, 16, 202–218. [Google Scholar] [CrossRef]
- Hashim, A.R.B. Planning Abu Dhabi: An Urban History; Routledge: London, UK, 2019. [Google Scholar]
- Abu Dhabi Urban Planning Council. Capital District. Abu Dhabi 2030 Vision; Abu Dhabi Urban Planning Council: Abu Dhabi, United Arab Emirates, 2009; p. 153.
- Abu Dhabi Urban Planning Council. Capital District. Abu Dhabi 2030 Vision; Abu Dhabi Urban Planning Council: Abu Dhabi, United Arab Emirates, 2007.
- Abdo, R.; Batzel, G.M. Planning the Modern Arab City: The Case of Abu Dhabi. In Reconsidering Jane Jacobs; Routledge: London, UK, 2011; pp. 105–118. [Google Scholar]
- Abu Dhabi Urban Planning Council. Plan Abu Dhabi 2030: Urban Structure Framework Plan; Abu Dhabi Urban Planning Council: Abu Dhabi, United Arab Emirates, 2007.
- Abu Dhabi Urban Planning Council. The Pearl Community Rating System; Abu Dhabi Urban Planning Council: Abu Dhabi, United Arab Emirates, 2010.
- Abu Dhabi Urban Planning Council. Abu Dhabi Urban Street Design Manual; Abu Dhabi Urban Planning Council: Abu Dhabi, United Arab Emirates, 2014.
- Jonquiere, P. Woonerf: An Environment for Man and Transport Together: The Present Aspects; Japan, Tokyo, 1978. [Google Scholar]
- Kraay, J.H. Woonerven and other experiments in the Netherlands. Built Environ. 1986, 12, 20–29. [Google Scholar]
- Scoppa, M.; Anabtawi, R. Connectivity in Superblock Street Networks: Measuring Distance, Directness, and the Diversity of Pedestrian Paths. Sustainability 2021, 13, 13862. [Google Scholar] [CrossRef]
- Alawadi, K.; Alameri, H.; Scoppa, M. Reclaiming Alleyways to improve network connectivity: Lessons from Dubai’s neighborhoods. J. Plan. Educ. Res. 2020. [Google Scholar] [CrossRef]
- Scoppa, M.; Bawazir, K.; Alawadi, K. Walking the superblocks: Street layout efficiency and the sikkak system in Abu Dhabi. Sustain. Cities Soc. 2018, 38, 359–369. [Google Scholar] [CrossRef]
- Abu Dhabi Urban Planning Council. The Pearl Rating System for Estidama: Community Rating System; Abu Dhabi Urban Planning Council: Abu Dhabi, United Arab Emirates, 2010.
- Talen, E. Neighborhoods as service providers: A methodology for evaluating pedestrian access. Environ. Plan. B Plan. Des. 2003, 30, 181–200. [Google Scholar] [CrossRef]
- Condon, P.M. Seven Rules for Sustainable Communities: Design Strategies for the Post Carbon World; Island Press: London, UK, 2012. [Google Scholar]
- Jabareen, Y. Sustainable Urban Forms. J. Plan. Educ. Res. 2006, 26, 38–52. [Google Scholar] [CrossRef]
- Ellis, G.; Hunter, R.; Tully, M.A.; Donnelly, M.; Kelleher, L.; Kee, F. Connectivity and physical activity: Using footpath networks to measure the walkability of built environments. Environ. Plan. B Plan. Des. 2016, 43, 130–151. [Google Scholar] [CrossRef]
- Marshall, W.E.; Garrick, N.W. Effect of street network design on walking and biking. Transp. Res. Rec. 2010, 2198, 103–115. [Google Scholar] [CrossRef]
- Dill, J. Measuring network connectivity for bicycling and walking. In Proceedings of the 83rd Annual Meeting of the Transportation Research Board, Washington, DC, USA, 11–15 January 2004. [Google Scholar]
- Knight, P.L.; Marshall, W.E. The metrics of street network connectivity: Their inconsistencies. J. Urban. Int. Res. Placemaking Urban Sustain. 2015, 8, 241–259. [Google Scholar] [CrossRef]
- Stangl, P. Overcoming flaws in permeability measures: Modified route directness. J. Urban. Int. Res. Placemaking Urban Sustain. 2017, 12, 1–14. [Google Scholar] [CrossRef]
- Hooper, P.; Giles-Corti, B.; Knuiman, M. Evaluating the implementation and active living impacts of a state government planning policy designed to create walkable neighborhoods in Perth, Western Australia. Am. J. Health Promot. 2014, 28 (Suppl. S3), S5. [Google Scholar] [CrossRef] [PubMed]
- McDonald, K.; Oakes, J.M.; Forsyth, A.J. Effect of street connectivity and density on adult BMI: Results from the Twin Cities Walking Study. J. Epidemiol. Community Health 2012, 66, 636. [Google Scholar] [CrossRef] [PubMed]
- Stangl, P. Block size-based measures of street connectivity: A critical assessment and new approach. Urban Des. Int. 2015, 20, 44–55. [Google Scholar] [CrossRef]
- Peponis, J.; Bafna, S.; Zhang, Z. The Connectivity of Streets: Reach and Directional Distance. Environ. Plan. B Plan. Des. 2008, 35, 881–901. [Google Scholar] [CrossRef]
- Aultman-Hall, L.; Roorda, M.; Baetz, B.W. Using GIS for evaluation of neighborhood pedestrian accessibility. J. Urban Plan. Dev. 1997, 123, 10–17. [Google Scholar] [CrossRef]
- Song, Y.; Merlin, L.; Rodriguez, D. Comparing measures of urban land use mix. Comput. Environ. Urban Syst. 2013, 42, 1–13. [Google Scholar] [CrossRef]
- Hess, P.M. Measures of Connectivity [Streets: Old paradigm, new investment]. Places 1997, 11. [Google Scholar] [CrossRef]
- Moudon, A.V.; Hess, P.M.; Snyder, M.C.; Stanilov, K. Effects of Site Design on Pedestrian Travel in Mixed-Use, Medium-Density Environments. Transp. Res. Rec. 1997, 1578, 48–55. [Google Scholar] [CrossRef]
- Scoppa, M.; Bawazir, K.; Alawadi, K. Straddling boundaries in superblock cities. Assessing local and global network connectivity using cases from Abu Dhabi, UAE. Transp. Res. Part A Policy Pract. 2019, 130, 770–782. [Google Scholar] [CrossRef]
- Porta, S.; Crucitti, P.; Latora, V. The Network Analysis of Urban Streets: A Primal Approach. Environ. Plan. B Plan. Des. 2006, 33, 705–725. [Google Scholar] [CrossRef] [Green Version]
- Perry, C.A. City planning for neighborhood life. Soc. F. 1929, 8, 98. [Google Scholar] [CrossRef]
- Stangl, P. The pedestrian route directness test: A new level-of-service model. Urban Des. Int. 2012, 17, 228–238. [Google Scholar] [CrossRef]
- Figueiredo, L.; Amorim, L. Continuity lines in the axial system. In The Fifth Space Syntax International Symposium; Delft University of Technology: Delft, The Netherlands, 2005. [Google Scholar]
- Alexander, C. A City Is Not a Tree. In A Pattern Language: Towns, Buildings, Construction; Oxford University Press: New York, NY, USA, 1977. [Google Scholar]
- Jacobs, J. The Death and Life of Great American Cities; Random House: New York, NY, USA, 1961; 458p. [Google Scholar]
- Jiang, B. A topological pattern of urban street networks: Universality and peculiarity. Phys. A Stat. Mech. Its Appl. 2007, 384, 647–655. [Google Scholar] [CrossRef] [Green Version]
- Plunz, R.; Sheridan, M. Deadlock Plus 50: On Public Housing in New York. In Urban Planning Today: A Harvard Design Magazine Reader; University of Minnesota Press: Minneapolis, MN, USA, 2006; pp. 14–23. [Google Scholar]
- Mehaffy, M.W.; Porta, S.; Romice, O. The “neighborhood unit” on trial: A case study in the impacts of urban morphology. J. Urban. Int. Res. Placemaking Urban Sustain. 2015, 8, 199–217. [Google Scholar] [CrossRef]
- Mueller, N.; Rojas-Rueda, D.; Khreis, H.; Cirach, M.; Andrés, D.; Ballester, J.; Bartoll, X.; Daher, C.; Deluca, A.; Echave, C.; et al. Changing the urban design of cities for health: The superblock model. Environ. Int. 2020, 134, 105132. [Google Scholar] [CrossRef]
Figure 2.
The transit plan of the Capital District. Diagram adapted by the authors from Abu Dhabi Urban Planning Council Report 2009 [8].
Figure 2.
The transit plan of the Capital District. Diagram adapted by the authors from Abu Dhabi Urban Planning Council Report 2009 [8].

Figure 4.
(a) An illustration of the route directness metric (PRD); (b) an illustration of the current network of the study (Network 1); (c) illustrates the current network with potential sikkak added (Network 2).
Figure 4.
(a) An illustration of the route directness metric (PRD); (b) an illustration of the current network of the study (Network 1); (c) illustrates the current network with potential sikkak added (Network 2).

Figure 5.
(a) Route directness results in terms of passing plots (shown in a darker color) using Network 1; (b) route directness results in terms of passing plots (shown in darker color) using Network 2, the network that included potential sikkak.
Figure 5.
(a) Route directness results in terms of passing plots (shown in a darker color) using Network 1; (b) route directness results in terms of passing plots (shown in darker color) using Network 2, the network that included potential sikkak.


Table 1.
Descriptive statistics of the all-residential-plots-to-all-residential-plots route directness analysis.
Table 1.
Descriptive statistics of the all-residential-plots-to-all-residential-plots route directness analysis.
| Superblocks ID | Area (Ha.) | Width (Mts.) | Length (Mts.) | Number of Internal Blocks | Avg. Block Face Length (Mts.) | Avg. Block Perimeter (Mts.) | Avg. Internal Block Area (m2) | Total Plot Number |
|---|---|---|---|---|---|---|---|---|
| Neighborhood 1 | 121.3 | 854.8 | 1835 | 27 | 187.9 | 941.2 | 45,699.3 | 241 |
| Neighborhood 2 | 62.5 | 669.5 | 1088.6 | 14 | 187.2 | 894.4 | 44,628.8 | 133 |
| Neighborhood 3 | 59.18 | 817.6 | 1006 | 24 | 153.9 | 793.0 | 32,966.6 | 254 |
| Neighborhood 4 | 101.2 | 1238.3 | 713.5 | 48 | 167.2 | 789.3 | 36,015.2 | 198 |
| Neighborhood 5 | 103.69 | 1157.5 | 1243.7 | 22 | 193.7 | 923.9 | 45,684.9 | 202 |
| Neighborhood 6 | 165.39 | 1000.3 | 1321.2 | 31 | 195.5 | 1047.3 | 55,762.1 | 309 |
| Neighborhood 7 | 120.6 | 1021.2 | 1248.8 | 25 | 188.2 | 924.9 | 46,967.4 | 211 |
| Neighborhood 8 | 65.6 | 1237.6 | 879.6 | 13 | 197.3 | 927.8 | 47,490.5 | 114 |
| Neighborhood 9 | 130.5 | 1395.7 | 933.4 | 24 | 203.2 | 1025.4 | 54,580.1 | 284 |
| Neighborhood 10 | 99.1 | 1497.8 | 1608 | 34 | 109.4 | 935.8 | 21,454.7 | 305 |
| Neighborhood 11 | 191.5 | 1204.4 | 1.131 | 24 | 205.0 | 993.7 | 55,975.2 | 235 |
| Neighborhood 12 | 57.89 | 1000.2 | 800 | 13 | 186.7 | 912.1 | 45,955.0 | 105 |
Table 2.
Descriptive statistics of the all-residential-plots-to-all-residential-plots route directness analysis of network 1 in columns (3–6). Results of using Network 2—the network that includes sikkak—are presented in columns (7–9).
Table 2.
Descriptive statistics of the all-residential-plots-to-all-residential-plots route directness analysis of network 1 in columns (3–6). Results of using Network 2—the network that includes sikkak—are presented in columns (7–9).
| Superblock ID | Residential Plots | Network 1 | Network 2 (sikkak) | ||||||
|---|---|---|---|---|---|---|---|---|---|
| Passing Plots | % of Passing Plots | Avg. PRD | Avg. Trip Length (mts.) | Passing Plots | % of Passing Plots | Avg. PRD | Avg. Trip Length (mts.) | ||
| Superblock 1 | 232 | 106 | 45.7% | 1.55 | 860.5 | 229 | 98.71% | 1.32 | 766.4 |
| Superblock 2 | 123 | 53 | 43.1% | 1.50 | 589.7 | 117 | 95.12% | 1.36 | 544.5 |
| Superblock 3 | 238 | 39 | 16.4% | 1.63 | 691.2 | 195 | 81.93% | 1.41 | 571.5 |
| Superblock 4 | 186 | 43 | 23.1% | 1.68 | 848.7 | 173 | 93.01% | 1.30 | 766.8 |
| Superblock 5 | 192 | 56 | 29.2% | 1.61 | 786.1 | 155 | 80.73% | 1.43 | 695.5 |
| Superblock 6 | 297 | 90 | 30.3% | 1.84 | 977.8 | 277 | 93.27% | 1.46 | 839.2 |
| Superblock 7 | 198 | 126 | 63.6% | 1.53 | 743.5 | 195 | 98.48% | 1.30 | 688.8 |
| Superblock 8 | 109 | 81 | 74.3% | 1.39 | 633.6 | 109 | 100.00% | 1.27 | 569.1 |
| Superblock 9 | 274 | 126 | 45.9% | 1.49 | 870.9 | 269 | 98.18% | 1.32 | 786.1 |
| Superblock 10 | 291 | 225 | 77.3% | 1.43 | 887.8 | 291 | 100.00% | 1.30 | 832.3 |
| Superblock 11 | 226 | 159 | 70.3% | 1.44 | 724.6 | 226 | 100.00% | 1.30 | 724.6 |
| Superblock 12 | 97 | 80 | 82.4% | 1.40 | 516.1 | 95 | 97.94% | 1.34 | 495.2 |
Table 3.
Descriptive statistics of the all-residential-plots-to-all-non-residential-plots route directness analysis of Network 1 in column (3–6). Results of Network 2—the network that includes Sikkak—are presented in columns (7–9).
Table 3.
Descriptive statistics of the all-residential-plots-to-all-non-residential-plots route directness analysis of Network 1 in column (3–6). Results of Network 2—the network that includes Sikkak—are presented in columns (7–9).
| Superblock ID | Res. Plots | Non Res. Plots | Network 1 | Network 2 (Sikkak) | ||||||
|---|---|---|---|---|---|---|---|---|---|---|
| Passing Plots | % of Passing Plots | Avg. PRD | Avg. Trip Length (mts.) | Passing Plots | % of Passing Plots | Avg. PRD | Avg. Trip Length (mts.) | |||
| Superblock1 | 232 | 9 | 90 | 38.79% | 1.65 | 942.8 | 213 | 91.8% | 1.32 | 807.8 |
| Superblock 2 | 123 | 10 | 110 | 89.43% | 1.39 | 464.6 | 117 | 95.1% | 1.36 | 447.55 |
| Superblock 3 | 238 | 12 | 98 | 41.18% | 1.55 | 614.3 | 195 | 81.9% | 1.41 | 549.02 |
| Superblock 4 | 186 | 10 | 62 | 33.33% | 1.65 | 900.7 | 177 | 95.2% | 1.30 | 831.63 |
| Superblock 5 | 192 | 12 | 121 | 63.02% | 1.56 | 716.3 | 155 | 80.7% | 1.43 | 664.19 |
| Superblock 6 | 297 | 13 | 67 | 22.56% | 1.75 | 977.5 | 280 | 94.3% | 1.46 | 796.5 |
| Superblock 7 | 198 | 5 | 112 | 56.57% | 1.44 | 770.2 | 194 | 97.9% | 1.30 | 526.66 |
| Superblock 8 | 109 | 10 | 69 | 63.30% | 1.48 | 694.1 | 88 | 80.7% | 1.27 | 667.02 |
| Superblock 9 | 274 | 14 | 179 | 65.33% | 1.49 | 837.8 | 261 | 95.3% | 1.32 | 742.1 |
| Superblock 10 | 291 | 9 | 235 | 80.76% | 1.46 | 896.2 | 285 | 97.9% | 1.30 | 822.37 |
| Superblock 11 | 226 | 8 | 72 | 31.86% | 1.58 | 842.4 | 182 | 80.5% | 1.30 | 695.6 |
| Superblock 12 | 97 | 9 | 75 | 77.32% | 1.40 | 545.5 | 91 | 97.9% | 1.34 | 521.06 |
Table 4.
Summary of the block size characteristics and the result of PRD for the two tested networks.
Table 4.
Summary of the block size characteristics and the result of PRD for the two tested networks.
| Superblock ID | Network 1 | Network 2 (Sikkak) | ||||||||||
|---|---|---|---|---|---|---|---|---|---|---|---|---|
| Avg. Block Area (msq) | Avg. Block Face Length (mts) | Total Blocks | Avg. Block Perimeter (mts) | Avg. Street Length (mts) | ATA 1 Avg. PRD | Avg. Block Area (msq) | Avg. Block Face Length (mts) | Total Block | Avg. Block Perimeter (mts) | Avg. Street Length (mts | ATA 1 Avg. PRD | |
| Superblock 1 | 45,699 | 187.9 | 27 | 941.2 | 15,135 | 1.55 | 28,695 | 125.1 | 43 | 686.5 | 11,983 | 1.32 |
| Superblock 2 | 44,628 | 187.2 | 14 | 894.4 | 7862 | 1.50 | 28,583 | 142.4 | 22 | 684.1 | 9257 | 1.36 |
| Superblock 3 | 32,966 | 153.9 | 23 | 793.0 | 10,927 | 1.63 | 19,964 | 118.6 | 38 | 567.1 | 12,456 | 1.41 |
| Superblock 4 | 36,015 | 165.1 | 29 | 789.3 | 13,545 | 1.68 | 21,006 | 114.1 | 48 | 583.8 | 16,090 | 1.30 |
| Superblock 5 | 45,684 | 190.9 | 22 | 923.9 | 12,219 | 1.61 | 28,716 | 137.9 | 35 | 686.2 | 14,065 | 1.43 |
| Superblock 6 | 55,762 | 195.5 | 31 | 1047.3 | 17,996 | 1.84 | 27,992 | 149.8 | 58 | 683.8 | 22,619 | 1.46 |
| Superblock 7 | 46,967 | 188.2 | 25 | 924.9 | 14,309 | 1.53 | 27,951 | 135.8 | 42 | 672.4 | 16,440 | 1.30 |
| Superblock 8 | 47,490 | 197.3 | 13 | 927.8 | 8092 | 1.39 | 29,040 | 145.2 | 21 | 686.0 | 9222 | 1.27 |
| Superblock 9 | 54,580 | 203.2 | 24 | 1025.4 | 14,637 | 1.49 | 25,764 | 125.0 | 51 | 651.1 | 19,253 | 1.32 |
| Superblock 10 | 21,454 | 162.0 | 34 | 935.8 | 18,468 | 1.43 | 26,314 | 131.8 | 61 | 651.1 | 22,414 | 1.30 |
| Superblock 11 | 55,975 | 205.0 | 24 | 993.7 | 14,148 | 1.44 | 31,050 | 155.9 | 43 | 686.1 | 17,003 | 1.30 |
| Superblock 12 | 45,955 | 186.7 | 27 | 912.1 | 7598 | 1.40 | 23,897 | 128.1 | 25 | 614.4 | 9350 | 1.34 |
1 A.T.A. stands for all-residential-plots-to-all-residential-plots.
Publisher’s Note: MDPI stays neutral with regard to jurisdictional claims in published maps and institutional affiliations. |
© 2022 by the authors. Licensee MDPI, Basel, Switzerland. This article is an open access article distributed under the terms and conditions of the Creative Commons Attribution (CC BY) license (https://creativecommons.org/licenses/by/4.0/).
Share and Cite
MDPI and ACS Style
Anabtawi, R.; Scoppa, M. Measuring Street Network Efficiency and Block Sizes in Superblocks—Addressing the Gap between Policy and Practice. Buildings 2022, 12, 1686. https://doi.org/10.3390/buildings12101686
AMA Style
Anabtawi R, Scoppa M. Measuring Street Network Efficiency and Block Sizes in Superblocks—Addressing the Gap between Policy and Practice. Buildings. 2022; 12(10):1686. https://doi.org/10.3390/buildings12101686
Chicago/Turabian StyleAnabtawi, Rim, and Martin Scoppa. 2022. "Measuring Street Network Efficiency and Block Sizes in Superblocks—Addressing the Gap between Policy and Practice" Buildings 12, no. 10: 1686. https://doi.org/10.3390/buildings12101686
Note that from the first issue of 2016, this journal uses article numbers instead of page numbers. See further details here.