
Research on BIM Application Two-Dimensional Maturity Model

1
School of Economics and Management, China University of Mining and Technology, Xuzhou 221116, China
2
Zhongye Changtian International Engineering Co., Ltd., Changsha 410125, China
3
School of Business, Jiangnan University, Wuxi 214122, China
4
Institute of National Security and Green Development, Jiangnan University, Wuxi 214122, China
5
School of Information Technology, Hunan First Normal University, Changsha 410205, China
*
Authors to whom correspondence should be addressed.
Buildings 2022, 12(11), 1960; https://doi.org/10.3390/buildings12111960
Submission received: 20 October 2022
/
Revised: 5 November 2022
/
Accepted: 8 November 2022
/
Published: 11 November 2022
(This article belongs to the Topic Advances in Construction and Project Management)
Abstract
:The existing project management maturity models and BIM maturity models have obvious deficiencies in evaluating the management level of engineering projects with BIM applications. This study aimed to use accepted assessment indexes to design an innovative BIM application maturity model suitable for different projects with BIM applications. This study proposes the concept of BIM Application Two-Dimensional Maturity (BATM), which simultaneously emphasizes the project business management (PBM) and project BIM application (PBA) maturities. The BATM model assesses the PBM and PBA maturities based on eight performance domains and 37 desired outcomes of PMBOK 7th edition. The application case shows that the use of the BATM model is simple and its effect is obvious. This study is the first to assess the BIM application maturity from the two dimensions of PBM and PBA, and provides new insights into the project BIM application maturity assessment. The application case sets an example for other companies to assess and improve their BATM.
1. Introduction
In recent years, adopting building information modeling (BIM) has become increasingly popular in the design, construction, operations, and maintenance phases of the building’s life cycle [1,2]. BIM is a digital representation of physical and functional characteristics of a facility and a shared knowledge resource for information about a facility, forming a reliable basis for decisions during its life cycle [3]. In the engineering industry, owners, designers, builders, and managers have already reported the benefits of adopting the BIM methodology, which has led to its increasing acceptance at a global level [4].
Maturity models, which originated from total quality management [5] and are widely used in various industries [6], are primarily based upon the capability maturity model (CMM) of the Software Engineering Institute. Maturity models allow individuals and organizations to self-assess the maturity of various aspects of their processes against benchmarks [7], and enable organizations to accelerate the enhancement in their capabilities in fields such as business process management [8], software research and development [9], digital government [10], knowledge management [11], and project management [12]. Maturity models assume predictable patterns in every evolutionary phase of organization development [13]. These distinctive phases, with each later phase being superior to a previous phase, provide a roadmap for organizational improvement. The continuous progress of an organization on the evolutionary path implies gradual improvements in the organizational capabilities. The maturity levels represent a staged path for the performance and process improvement efforts of organizations [14].
BIM maturity can be defined as the level of “quality, repeatability and degree of excellence” in relation to performing a BIM-related task or delivering a BIM service or output [15]. Different BIM maturity models have been created to measure BIM maturity in the architecture, engineering, and construction industries [16]. Some models focus on assessing BIM against projects, while others target evaluating organizations [17].
However, the existing BIM maturity models have two main inadequacies. Firstly, most maturity models tend to evaluate the BIM application maturity at specific project phases under specified conditions, such as the design phase [18,19], construction phase [20,21], and facility management [22,23]. Few models can be applied to all phases from design and construction to operations and maintenance. Secondly, each model puts forward its own differing assessment indexes and has its own definition of maturity levels, and there is no commonly accepted model. As a result, it is difficult for users to choose a suitable model for their BIM maturity assessment [24].
In the era of digital twins, for the engineering industry, BIM represents the virtual world, whereas engineering construction represents the real world, and the two are like twins. Therefore, there is a need to study the BIM maturity and the project management maturity at the same time; however, there is no literature in this regard at present.
To this end, this study proposes an innovative BIM maturity model called the BIM Application Two-Dimensional Maturity (BATM) model, which combines the functions of the project management maturity model (PMMM) and BIM maturity model, simultaneously emphasizes project business management (PBM) and project BIM application (PBA) from the two dimensions of the real world (PBM) and virtual world (PBA), and achieves the effect of 1 + 1 > 2. The application of the BATM model helps in enhancing the maturity level of the project management and BIM application, improving the efficiency of organizational production management, and promoting organizational advancement along a maturity ladder.
The remainder of this paper is organized as follows. The next section provides the background of project management maturity models and BIM maturity models such that the BATM framework can be better understood. The Methods section introduces the BATM concept, definition, model structure, and the related questionnaire, as well as an example in which the BATM model is applied. Subsequently, the important functions and innovations of the study are discussed. Finally, the Conclusions section presents the theoretical and practical implications of the study.
2. Research Background
2.1. Project Management Maturity Models
The maturity in managing projects implies the established, proven, and innovative practices and procedures that lead to success in planning and completing projects [25]. Companies in various industries are pursuing improvements in project management maturity. A PMMM can enable an organization to seek perfect project management by implementing gradual maturity improvement processes within the organization [26]. PMMMs are regarded as the useful tools for evaluating an organization’s current project management capability [27]. Project management capability is the competence required to ensure an organization remains competitive when conducting projects [28]. Capability frameworks are the basis for maturity models that address how capabilities can be developed along an anticipated, desired, or logical path [29].
The successful application of the CMM in the software industry inspired the development of the maturity model for project management. A PMMM is a complete framework and a comprehensive tool for evaluating the maturity level of project management. Since its creation in the 1990s, it has been used to systematically improve the maturity level of project management. As higher project management maturity levels represent the ability of organizations to obtain better results from their projects, the stakeholders of organizations are willing to assess their current project management maturity status for future development and improve to the next phase if desired [30].
After more than 30 years of development, many PMMMs have become available. The Microframe project management maturity model is one of the earliest PMMMs to be applied practically [31]. The Berkeley project management process maturity model, known as PM2 and presented by Ibbs and Kwak, determines and positions an organization’s relative project management level based on those of other organizations [32]. A five-scale PMMM known as K-PMMM [33], which was established by Kerzner, analyzes the efficiency of project management organization, drawing attention to the importance of strategic project management to improve know-how in the marketplace. PMS-PMMM, which was released by Project Management Solutions in 2001, combines the five maturity levels proposed by the Software Engineering Institute and the project management knowledge areas proposed by the Project Management Institute (PMI) to form a comprehensive, easy-to-accept project management maturity improvement model [34]. The organizational project management maturity model (OPM3) introduced by the PMI not only provides a systematic assessment and improvement method for the enterprise from a single project to entrepreneur portfolio projects, but also introduces and solidifies the best practice in every business process [27]. The portfolio, programme, and project management maturity model (P3M3), which was developed by the UK’s Office of Government Commerce, comprises three independent sub-models (portfolio, programme, and project) and considers all seven processes as equally important. In the P3M3, the lowest maturity of the seven processes is the maturity of the organization [6]. In 2016, the International Project Management Association (IPMA) developed a methodology called “IPMA Delta” in order to certify the ability of an organization to use project management techniques. The assessment results of IPMA Delta show, in detail, the room for improvement, also giving recommendations for the future areas that need to be refined. MMM, focusing on a strategy of continuous improvement and following the four steps of the PDCA cycle to put this approach into practice, was developed by Langston and Ghanbaripour [35].
The only feature on which almost all models seem to converge is the determination of five maturity levels, even if they are not perfectly equal, either in the contents or in the denominations [36]. These levels and the corresponding main models can be summarized as follows:
- Level 1: initial or basic with awareness (OPM3, IPMA Delta, P3M3, CMMI, PM2, PMS-PMMM, MMM).
- Level 2: structured, managed, or repeatable (OPM3, P3M3, CMMI, PMS-PMMM, MMM).
- Level 3: defined, standardized, or institutionalized (OPM3, IPMA Delta, P3M3, CMMI, PMS-PMMM, MMM).
- Level 4: fully managed at the corporate level (OPM3, IPMA Delta, P3M3, CMMI, PM2, PMS-PMMM, MMM).
- Level 5: optimized with continuous learning and improvement (OPM3, IPMA Delta, P3M3, CMMI, PM2, PMS-PMMM, MMM).
In recent years, PMMM research has been expanded, and many scholars have investigated project risk management models [37,38]. Silvius and Schipper developed a sustainable PMMM as a practical tool for the assessment and development of the integration of sustainability in projects [39]. Seelhofer and Graf extended the concept of organizational project management maturity to the national context and developed a systematic framework of national project management maturity and the national PMMM [40].
Since most PMMMs are based on a guide to the project management body of knowledge (PMBOK) of PMI [41], by adopting PMMMs, organizations can systematically plan and improve their project management capabilities and benchmark their performance in accordance with the industry standards [31]. The assessment of maturity through PMMMs enables further improvement directions to be identified [26].
Despite their similarities, PMMMs differ from each other in terms of their assessment methodology. Hence, selecting an appropriate PMMM is a crucial managerial decision, and the organizational environment and project characteristics must be considered well to ensure the suitability of the selected model [30].
2.2. BIM Maturity Model
Over the past decade, a large number of BIM maturity models have been developed to measure the performance of BIM application. BIM maturity models are mainly divided into two categories [17,42]: one is the project BIM maturity model focusing on project application performance, and the other is the organizational BIM maturity model focusing on enterprise implementation capability. The famous project BIM maturity models include NBIMS CMM, iBIM, and VDC Scorecard, and the famous organizational BIM maturity models include BIM PM, BIM MM, BIM Quick Scan, and BIM AP. In addition, there are individual models that can be applied to the BIM maturity assessment of both organizations and projects.
The U.S. National BIM Standard (NBIMS) was published in 2007 and provided information as a guide for the adoption, implementation, and application of BIM to enable core principles. The Capability Maturity Model (CMM) of NBIMS is a matrix with 11 interest areas on the x-axis and 10 maturity levels on the y-axis [43], and is a useful tool for the strategic management in the BIM implementation of an organization [44]. The interactive capability maturity model (ICMM) is a further enhancement of CMM, developed to meet the growing need for an accurate and up-to-date model [45]. Bew and Richards developed the iBIM maturity model in 2008. Its assessment indexes focus on technology, standards, guidelines, classification, delivery, etc. Its maturity is divided into four levels. Level 0 is characterized by paper-based medium delivery methods. Level 1 represents structural elements by 2D or 3D digital objects. Model-based collaboration occurs in Level 2 between different parties, and network-based integration occurs in Level 3 [46]. VDC Scorecard was designed to measure the performance of the projects of virtual design firms with four major areas, 10 divisions, and 74 measures. Its distinct feature is the establishment of confidence levels to measure the degree of objective compliance [47]. VDC Scorecard has both quantitative and qualitative assessment methods with multiple choice and open-ended questions. It assesses performances of BIM projects against the industry benchmark and has five maturity levels.
The BIM Proficiency Matrix (BIM PM) was developed by Indiana University Architect’s Office to score the performance of BIM services of designers and contractors in Indiana University projects [48]. BIM PM is composed of 32 measures of eight areas and five maturity levels [17]. It has also been criticized for its heavy focus on the technical aspects of BIM implementation rather than process and protocol. The BIM maturity matrix (BIM MM) is multi-dimensional and can be represented by a tri-axial knowledge model comprising BIM Fields, BIM Stages, and BIM Lenses [49]. The model proposes five BIM maturity levels: initial, defined, managed, integrated, and optimized [50]. BIM MM assessment can be provided by the online BIM Excellence platform. The question number of assessment varies according to the assessment granularity level, and a maturity score is compiled related to 12 positions grouped into five areas [51]. BIM Quick Scan developed by TNO (The Netherlands Organization for applied scientific research) is a benchmarking tool for organizational performance with a reasonably extensive scope covering 44 measures in four main areas, including: organization and management, mentality and culture, information structure and information flow, and tools and applications [43]. It can combine quantitative and qualitative assessments of the “hard” and “soft” aspects of BIM, and distinguish the strengths and weaknesses of BIM application for an organization. Organizational BIM Assessment Profile (BIM AP) was created by Pennsylvania State University Computer Integrated Construction (CIC) Research Program in 2012. Its maturity is measured by 20 planning elements with six themes: Strategy, BIM Uses, Process, Information, Infrastructure and Personnel, Companies. Their maturity levels range from 0 (Non-Existent) to 5 (Optimizing) [22,51].
The multifunctional BIM maturity model (MPMM) focuses on BIM maturity at different scales from individual projects to an organization’s full projects portfolio, covering measurements across three domains: technology, process, and protocol. Detailed, operable rubrics enable the assessment of each subdomain of each domain, and the assessment result points to four maturity levels (0–3) [52].
From the above introduction, it can be seen that these existing studies mainly focus on the technology capability maturity of BIM from different perspectives and conditions, and ignore the digital twin relationship between BIM and projects. In addition, a large number of BIM maturity models have different assessment indexes and different level definitions. As a result, users can be confused and do not know how to choose assessment models.
2.3. Research Gaps
This study aims to fill several main literature gaps, as follows:
- Each of the existing BIM maturity models was developed to achieve a specific BIM assessment purpose [17]; moreover, many models can only be applied to an individual project phase from scheme design to facility maintenance, which leads to the situation of different assessment indexes and different level definitions for different models, increases the difficulty for users to choose an appropriate model [42], and then affects the popularization and use of these models. Determining how to design a BIM maturity model with a generally acceptable assessment index and maturity level system, and make the model applicable to all projects with BIM application, are problems worth studying.
- In the PMMM literature, the assessment indexes of most studies were based on PMBOK [31,41], but PMBOK was not used in the study of the PBA maturity. Because the objects of BIM services are projects and BIM implementation processes are also similar to project management processes, PMBOK should be of guiding and reference value for PBA maturity research. In addition, PMBOK 7th edition pays close attention to eight performance domains and 37 desired outcomes, which is more closely combined with the BIM application and creates favorable conditions for PBA maturity assessment based on PMBOK. However, to date, there is no research about the PBM maturity model or the PBA maturity model based on the PMBOK 7th edition.
- The PBM and PBA maturities are two important aspects of modern project management, and reflect the digital twin relationship from the two dimensions of the virtual and real worlds. In modern project management, the PMMMs can no longer ignore the existence of BIM, and the BIM maturity model also needs to consider the contribution of BIM in project management. However, there is no research that simultaneously assesses their maturities, or that identities problems and highlights directions for the improvement in PBM and PBA by a maturity assessment.
3. Method
3.1. Concept of BATM
As previously stated, the existing project management maturity models and BIM maturity models have obvious deficiencies in evaluating the management level of engineering projects with BIM applications. Against the background in which the idea of digital twins has become popular and 37 desired outcomes of the PMBOK 7th edition have become an acceptable global standard, in order to enable an organization to accurately understand the capabilities of its project management and BIM applications and then take effective measures for improvement, the PBM and PBA maturities can be evaluated simultaneously based on each desired outcome.
It is in this context that the BATM model is proposed. The BATM is expressed by a two-dimensional value such as (x, y), in which x reflects the PBM maturity level, and y reflects the PBA maturity level. The BATM model consists of the following items: maturity level definition, assessment indexes, questionnaire, maturity calculation and problem identification methods, improvement advice, etc.
The purpose of putting forward the concept of BATM is to use the PBM and PBA maturities to reflect the level of enterprises’ project management and project BIM applications; and, through the BATM model, determine enterprises’ strengths and weakness in the PBM and PBA aspects, identify the improvement directions, and promote the advancement of enterprises’ PBM and PBA maturities.
It is noteworthy that the two-dimensional maturity in this study differs significantly from the multi-dimensional maturity in other studies. The two dimensions investigated in this study were the PBM of the real world and the PBA of the virtual world. For example, considering “Effective management of procurements” which is one desired outcome of the project work performance domain in PMBOK 7th edition, the BATM value of (3, 1) means that the PBM maturity level of procurement management in the real world is 3 and the PBA maturity level in the virtual world is 1; it also means that there are obvious deficiencies in its online capabilities for supporting offline project management. However, the multiple dimensions in other studies refer to several aspects of pure project management. For example, Hu presented a three-dimensional PMMM constituted by best practice maturity, process maturity, and organization system maturity [53].
3.2. Classification of Maturity Level
The BATM assessment is inseparable from the level definition of the PBM and PBA maturities. The classification and definition of PBM and PBA maturity level should be clear.
The classification of the PBM maturity levels refers to that of the PMS-PMMM model, and its maturity levels, from 1 to 5, are the initial, managed, defined, quantitatively managed, and optimizing levels, respectively.
The classification of the PBA maturity levels refers to the information technology governance maturity model under the COBIT 4.1 framework. In COBIT 4.1, the maturity levels from 0 to 5 are the non-existent, initial, repeatable but intuitive, defined process, managed and measurable, and optimized levels, respectively [54], which match well with the maturity levels of PMS-PMMM.
The specific feature definitions of the PBM and PBA maturity level are shown in Table 1.
3.3. Definition of Model Structure
PMBOK is an excellent reference for analyzing project management capabilities, in which an abundance of “best practice” information is outlined in the document [34]. Because the knowledge content of each PMBOK performance domain is abundant, each performance domain is categorized into several key desired outcomes [55]. In total, there are eight performance domains and 37 desired outcomes in the PMBOK 7th edition.
In the BATM model, the eight performance domains are used as the first level assessment indexes, and the 37 desired outcomes are used as the second level assessment indexes; this constitutes the assessment index system of BATM model. The second level assessment indexes are used to measure the PBM and PBA maturities from the two dimensions of the virtual and real worlds, and the maturities of the first level assessment indexes are summarized from the second level indexes. For example, under the delivery performance domain, the maturity level is measured using five desired outcomes. They include: (1) projects contribute to business objectives and advancement of strategy; (2) projects realize the outcomes they were initiated to deliver; (3) project benefits are realized in the time frame in which they were planned; (4) the project team has a clear understanding of requirements; (5) stakeholders accept and are satisfied with project deliverables. The specific assessment indexes are shown in Table 2.
The BATM structure can be classified into three layers: project layer, performance domain layer, and desired outcome layer. Because the mode structure is based entirely on PMBOK 7th edition, we did not conduct an empirical analysis of it.
3.4. Questionnaire
The questionnaire consists of three parts. The first part introduces the purpose and requirements of the questionnaire, the second part explains the definition of PBM and PBA maturity levels, and the third part is the scoring table for experts to score. The left side of the scoring table lists the assessment indexes of the BATM model, including eight performance domains and their corresponding 37 desired outcomes. The right side is the selection area of PBM and PBA maturity levels, and the weights of desired outcomes can be set according to their performance domains.
In the questionnaire, a scale of 1 to 5 for PBM maturities and a scale of 0 to 5 for PBA maturities were adopted to measure the responses. Level 1 corresponds to score 1, level 2 corresponds to score 2, etc. Because the first, third, and fifth levels of the PBM and PBA maturities are the initial level, the defined level, and the optimized level, respectively, and their second and fourth levels are also similar, we can deem that their five maturity levels are relatively consistent. In addition, as there may be no PBA in some projects, the PBA maturity levels include the non-existent level. The format of the scoring table is shown in Table 3.
3.5. Calculation of BATM Level
After experts return the scoring table of the BATM questionnaire, the questionnaire organizers first identify whether experts’ responses are qualified (in the two-dimensional maturity options of a management process of the scoring table, multiple selections and no selection are regarded as unqualified), then deal with the qualified data to obtain the three-layer BATM. The courses of evaluating the BATM involve the maturity determination of desired outcome layers based on the two dimensions of PBA and PBM, and that of performance domain layers and the project layer according to certain weight ratios. In the following expressions, wikj is the weight of expert k in the desired outcome j of performance domain i, i.e. the weight in the scoring table; wik, decided by the organizers, is the weight of expert k in performance domain i (for simplicity, the weights among experts can be considered not to change with performance domains); wi, also decided by the organizers, is the weight of performance domain i; n is the number of desired outcomes in performance domain i; and l is the number of experts. When determining the expert weight wik, the questionnaire organizers need to consider the basic information, such as the experts’ education background, their corresponding positions, and their working years in each position. However, in order to simplify the statistical workload, experts’ scores can also be treated equally; that is, the default value 1 can be used as the experts’ weights.
The BATM value of each desired outcome () can be obtained by Formulas (1) and (2), which are equal to the weighted average of the desired outcome maturity values provided by the experts and the corresponding expert weights.
The BATM value of each performance domain () can be obtained using Formulas (3) and (4). They are equal to the weighted average of the experts’ performance domain maturity values and corresponding expert weights, in which the experts’ performance domain maturity values equal the weighted average of the desired outcome maturity values and corresponding desired outcome weights provided by the experts in their scoring tables.
The BATM value of the project layer is equal to the weighted average of all performance domain maturity values and the corresponding performance domain weight. They can be obtained by Formulas (5) and (6), in which mPBM and mPBA represent the project layer’s PBM and PBA maturities, respectively.
4. Results
4.1. Survey Method
In 2021, The BATM assessment was applied to an engineering company engaged in general contracting. Data were acquired using the questionnaire survey method, and 50 participants were selected for the survey from project staff who had worked in the company for more than 5 years. About half of the participants had used BIM software or participated in BIM training, and the other half were project managers and other management personnel who knew something about BIM but had no experience of operating BIM software. Their information is listed in Table 4.
After understanding the purpose of the survey, the participants carefully determined the PBM and PBA maturities of 37 desired outcomes according to the definition of maturity levels and their understanding of the actual PBM and PBA maturities in the company. Ultimately, a total of 49 valid questionnaires were acquired (in an unqualified questionnaire, some options were not answered).
4.2. Statistical Analysis
Content validity analysis: Because the BATM questionnaire was developed based on the PMBOK 7th edition, which is an acceptable standard, the researchers organized a pilot study to evaluate the internal validity. In this pilot study, researchers conducted comprehensive interviews with seven project personnel who had participated in at least two projects adopting BIM. Based on the positive assessment of these project managers, the conclusion obtained from them was that the content of the questionnaire was closely related to the PBM and PBA maturities, its structure was simple and clear, and its operability was appropriate.
Reliability analysis: The reliability analysis was conducted using Cronbach’s alpha coefficient. According to Kim and Feldt [56], when the internal consistency coefficient of the data reaches 0.70 or higher, the data can be considered to have sufficient reliability. In the study, the item scale was internally consistent because all of Cronbach’s alpha coefficients exceeded the threshold value (0.70) (Table 5).
Data analysis: To understand the data more effectively, we conducted a descriptive data analysis and a correlation analysis, and the results are listed in Table 5. The mean values reflect the maturity of each performance domain, in which the PBM maturities change from 2.15 to 2.71 and PBA maturities change from 1.29 to 1.79. Correlation analyses were conducted to verify the correlations between the PBM and PBA maturities. As can be seen from Table 5, the correlation coefficients in all performance domains are between 0.51 and 0.84; the t-test statistics are between 4.14 and 10.9, which are greater than ta/2 (α = 0.05; ta/2 = 2.008) and indicate clear correlations.
Table 6 shows the significant difference among different performance domain data and among different participant data, in which the results were obtained by the analysis of variance with two factors. The fact that all of the F-values were greater than the values of “F-crit,” and all of the p-values were less than the significance level of 0.05, implies that statistically significant differences existed among the maturities of the eight performance domains and among the feedback of the 49 participants.
4.3. Problems and Measures
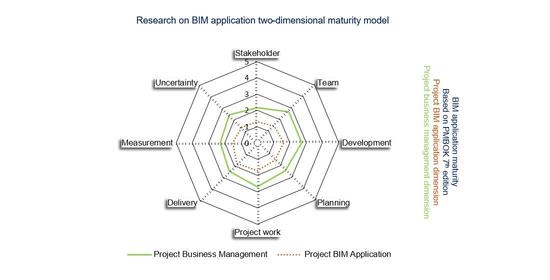
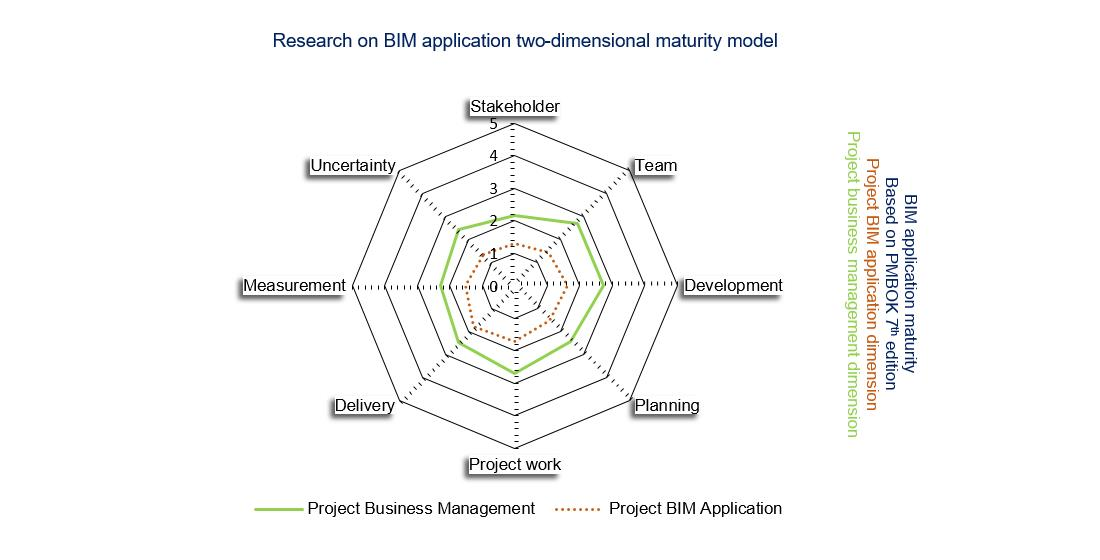
The BATMs of the eight performance domains are shown in Figure 1. The PBM and PBA lines represent the PBM and PBA maturities achieved in 2021, respectively. Based on the figure, we discovered the following problems: (1) the PBM maturities of two performance domains (i.e. stakeholder and measurement) are obviously lower than 2.5, and the rest are close to or more than 2.5; (2) the PBA maturities of the stakeholder and uncertainty domains are obviously lower than 1.5, and the rest are close to or more than 1.5; (3) the maturity gaps between PBM and PBA are large, in which the uncertainty and team domains are particularly prominent (their BATM values are (2.45, 1.35) and (2.71, 1.47), and the ratios of their gaps to the PBA maturities are 81.4% and 84.6%, respectively).
The obvious gaps between the PBM and PBA maturities shows that PBA not only does not guide and support PBM, but also lags far behind BPM, and there is a significant room for PBA to develop in the project, performance domain, and desired outcome layers. The organization should strengthen its support for PBA, ensure the PBA maturity catches up with the PBM maturity, and form a good interaction situation.
Through this assessment, the problems faced by the company were determined and the improvement directions were identified. In terms of the PBA maturity, the improvement priorities were the stakeholder and uncertainty domains. Regarding the PBM maturity, the improvement priorities were the stakeholder and measurement domains. In order to narrow the gap between PBA and PBM, the improvement priorities were the uncertainty and team domains.
The results of the BATM assessment aroused significant attention of the company leaders, and the company took a series of measures to improve the PBM and PBA maturities, referring to the improvement priorities provided by the BATM assessment.
5. Discussion
BIM technology has been developed globally for a period of more than 20 years. Because BIM applications exist in different phases of the project life cycle, including design, construction, operation, and maintenance, and BIM applications involve many stakeholders, such as the designers, equipment supplies, construction companies, consulting-related enterprises, project owners, and even relevant government departments, the whole process of BIM applications is complex. As a result of the complexity of BIM applications, they are not as good as expected under many circumstances [57], although BIM has been well applied in some countries and some projects. To promote BIM applications, various BIM application maturity assessment models based on different enterprise perspectives and different project phases have been developed [17,22,42,43,44,45,46,47,48,49,50,51,52].
However, all of the BIM application maturity models have several obvious deficiencies. First, the assessment indexes of all models are different, and a unified assessment index system has not been derived. Second, these models also have huge discrepancies in the definition of maturity levels, with the number of maturity levels ranging from three to ten. Third, these models are built under specific business perspectives and specified project conditions, and have application limitations under other project situations. These deficiencies make it difficult for various BIM application maturity models to be popularized and applied. BIM application maturity models do not have the good effect expected by the public, and create difficulties for users in choosing these models [24]. Hence, a holistic model enabling BIM maturity assessments is necessary [17].
Considering the digital twin relationship between BIM applications and engineering projects, and that the purpose of BIM applications is to achieve the project objectives and BIM application processes are deeply integrated with project implementation processes, in this study, the eight performance domains and 37 desired outcomes of PMBOK 7th edition were selected as the assessment indexes of BATM. The selection of such indexes not only ensures that the BATM indexes are consistent with the processes and objectives of BIM applications and project management, but also avoids the dilemma of designing different assessment indexes for different purposes; thus, projects and organizations can then promote the improvement in BIM application maturity under the unified standard. At the same time, the assessment indexes based on PMBOK also indicate that BATM is applicable to all types of projects, whether they are building projects or highway projects. The selection of BATM assessment indexes is an innovation of this study. In addition, it should be noted that the BIM-related software, hardware, personnel, standards, and other indexes are not the assessment indexes of the project BIM application maturity, but are those of the organizational BIM capability maturity.
In the engineering industry, the main purpose of BIM applications is to serve the engineering projects. It is clear that the high level of BIM applications plays an assisting and supporting role in the project implementation, and the high level of project management creates higher requirements for BIM applications. In the context of the continuous development of digital technology, BIM applications and project implementations are increasingly embodied in a digital twin relationship. Through the comparison of the project management maturity in the real world and the BIM application maturity in the virtual world, it is easier to identify the inadequacies and problems in project management and BIM applications. Under the guidance of this idea, this study proposes the BATM model for BIM maturity assessment from the two dimensions of the virtual and real worlds. The two-dimensional maturity ideology of the virtual and real worlds is another innovation of this study.
With regard to the maturity level, this paper refers to a large number of documents and selects the five-level scheme, which has a more intuitive definition of the levels and is more commonly used [6,27,34,35,36,50]. The five levels of PBA maturity are the initial, repeatable but intuitive, defined process, managed and measurable, and optimized levels (the non-existent level occurs without PBA), and the five levels of PBM maturity are the initial, managed, defined, quantitatively managed, and optimizing levels. The five level schemes of the two dimensions are basically the same.
The application case of the BATM model shows that the model is simple and its effect is obvious. Based on the statistical analysis of expert scores and the radar graph of the two-dimensional maturity values, the deficiencies existing in the PBM and PBA can be visually and accurately identified. Furthermore, the priority improvement direction of BIM application can be determined immediately, and organizations and projects can advance along the BATM ladder.
In the case of multiple BATM assessments, the dynamic changes in two-dimensional maturity can be clearly observed, which will be more effective for the improvement in maturity.
6. Conclusions
6.1. Theoretical Implications
In terms of theoretical contribution, most importantly, this study provides a scheme using generally accepted indexes to assess the BIM maturity for projects with BIM applications. This is the first study to present the BATM concept with the PBM and PBA maturities from the two dimensions of the virtual and real worlds, and the first to assess the PBM and PBA maturities based on the eight performance domains and 37 desired outcomes of PMBOK 7th edition. Furthermore, this study establishes a complete BATM assessment system by combining with an application case. Finally, the study further develops the maturity theory of project management and BIM applications.
6.2. Practical Implications
The practical implications are as follows. Firstly, because the assessment indexes of the BATM model are based on the PMBOK 7th edition, the BATM model can be applied to different project types and different project phases, which eliminates the user’s difficulty in choosing a model from various PBA models with different assessment indexes, and increases the practical value of the BATM model. Secondly, the eight performance domains and 37 desired outcomes of PMBOK are generally accepted, so they are more convenient and easier to use than the indexes of other models. Thirdly, the comparison between the PBM and PBA maturities makes it easier to identify the deficiencies and problems in project management and BIM applications, and then to take effective measures to improve their maturities. Fourthly, the actual application case showed that the questionnaire can be used easily by the participants, and set an example for other companies to improve their PBM and PBA capability.
6.3. Limitations and Future Studies
This paper focuses on the project BIM application maturity. The limitation of the paper is that it does not research the organizational BIM capability maturity. Similar research of the organizational BIM capability maturity can be carried out in the future. In addition, this paper takes an engineering company engaged in general contracting business as an example; however, the effect of BATM application to design or construction enterprises needs to be further validated.
Author Contributions
Conceptualization, H.C.; Methodology, R.L. (Ruyin Long); Writing—original draft, C.S.; Writing—review and editing, R.L. (Ruihua Liao). All authors have read and agreed to the published version of the manuscript.
Funding
This research received no external funding.
Data Availability Statement
Some or all data, models, or code that support the findings of this study are available from the corresponding author upon reasonable request.
Conflicts of Interest
The authors declare no conflict of interest.
Abbreviations
Comparison Table of Important Abbreviations.
| No. | Abbreviation | Meaning |
| 1 | BIM | Building information modeling |
| 2 | BATM | BIM application two-dimensional maturity |
| 3 | PBM | Project business management |
| 4 | PBA | Project BIM application |
| 5 | PMBOK | Project management body of knowledge |
| 6 | CMM | Capability maturity model |
| 7 | PMMM | Project management maturity model |
| 8 | PMS-PMMM | The PMMM leased by Project Management Solutions |
| 9 | PMI | Project Management Institute |
| 10 | IPMA | The International Project Management Association |
| 11 | NBIMS | U.S. National BIM Standard |
| 12 | OPM3 | Organizational project management maturity model |
| 13 | P3M3 | The portfolio, programme, and project management maturity model |
| 14 | CMMI | Capability maturity model integration |
| 15 | PM2 | The Berkeley project management process maturity model |
| 16 | MMM | The management maturity model developed by Langston and Ghanbaripour |
| 17 | COBIT | Control objectives for information and related technology |
References
- Wang, T.; Feng, J. Linking BIM Definition, BIM Capability Maturity, and Integrated Project Delivery in the AECO Industry: The Influences of BIM Diffusion and Moral Hazard. J. Urban Plan. Dev. 2020, 148, 04022025. [Google Scholar] [CrossRef]
- Alirezaei, S.; Taghaddos, H.; Ghorab, K.; Tak, A.N.; Alirezaei, S. BIM-augmented reality integrated approach to risk management. Autom. Constr. 2022, 141, 104458. [Google Scholar] [CrossRef]
- Vitiello, U.; Ciotta, V.; Salzano, A.; Asprone, D.; Manfredi, G.; Cosenza, E. BIM-based approach for the cost-optimization of seismic retrofit strategies on existing buildings. Autom. Constr. 2019, 98, 90–101. [Google Scholar] [CrossRef]
- Alcínia Zita Sampaio, Maturity of BIM Implementation in the Construction Industry: Governmental Policies. Int. J. Eng. Trends Technol. 2021, 69, 92–100. [CrossRef]
- Cooke-Davies, T. The ‘real’ success factors on projects. Int. J. Proj. Manag. 2002, 20, 185–190. [Google Scholar] [CrossRef]
- Young, M.; Young, R.; Romero Zapata, J. Project, programme and portfolio maturity: A case study of Australian Federal Government. Int. J. Manag. Proj. Bus. 2014, 7, 215–230. [Google Scholar] [CrossRef]
- Demir, C.; Kocabaş, I. Project Management Maturity Model (PMMM) in educational organizations. Procedia Soc. Behav. Sci. 2010, 9, 1641–1645. [Google Scholar] [CrossRef] [Green Version]
- Szelagowski, M.; Berniak-Woźny, J. The adaptation of business process management maturity models to the context of the knowledge economy. Bus. Process Manag. J. 2020, 26, 212–238. [Google Scholar] [CrossRef]
- Rashid, N.; Khan, S.U.; Khan, H.U.; Ilyas, M. Green-Agile Maturity Model: An Evaluation Framework for Global Software Development Vendors. IEEE Access 2021, 9, 71868–71886. [Google Scholar] [CrossRef]
- Rytova, E.; Verevka, T.; Gutman, S.; Kuznetsov, S. Assessing the Maturity Level of the Digital Government of Saint Petersburg. Int. J. Technol. 2020, 11, 1081–1090. [Google Scholar] [CrossRef]
- Alghail, A.; Yao, L.; Abbas, M.; Baashar, Y. Assessment of knowledge process capabilities toward project management maturity: An empirical study. J. Knowl. Manag. 2022, 26, 1207–1234. [Google Scholar] [CrossRef]
- Jia, G.; Ni, X.; Chen, Z.; Hong, B.; Chen, Y.; Yang, F.; Lin, C. Measuring the maturity of risk management in large-scale construction projects. Autom. Constr. 2013, 34, 56–66. [Google Scholar] [CrossRef]
- Kazanjian, R.K.; Drazin, R. An empirical test of a stage of growth progression model. Manag. Sci. 1989, 35, 1489–1503. [Google Scholar] [CrossRef]
- Hidayati, P.B.; Budiardjo, E.K.; Solichah, I. Global Software Development and Capability Maturity Model Integration: A Systematic Literature Review. In Proceedings of the 3rd International Conference on Informatics and Computing; ICIC: Roxbury, MA, USA, 2018. [Google Scholar] [CrossRef]
- Succar, B.; Sher, W.; Williams, A. Measuring BIM performance: Five metrics. Archit. Eng. Des. Manag. 2012, 8, 120–142. [Google Scholar] [CrossRef]
- Smits, W.; van Buiten, M.; Hartmann, T. Yield-to-BIM: Impacts of BIM maturity on project performance. Build. Res. Inf. 2017, 45, 336–346. [Google Scholar] [CrossRef]
- Yilmaz, G.; Akcamete, A.; Demirors, O. A reference model for BIM capability assessments. Autom. Constr. 2019, 101, 245–263. [Google Scholar] [CrossRef]
- Troiani, E.; Mahamadu, A.-M.; Manu, P.; Kissi, E.; Aigbavboa, C.; Oti, A. Macro-maturity factors and their influence on micro-level BIM implementation within design firms in Italy. Archit. Eng. Des. Manag. 2020, 16, 209–226. [Google Scholar] [CrossRef]
- Ferraz, C.; Loures, E.R.; Deschamps, F. BIM maturity models evaluated by design principles. Adv. Transdiscipl. Eng. 2020, 12, 504–513. [Google Scholar] [CrossRef]
- Olawumi, T.O.; Chan, D.W.M. Building information modelling and project information management framework for construction projects. J. Civ. Eng. Manag. 2019, 25, 53–75. [Google Scholar] [CrossRef]
- Mahamadu, A.-M.; Manu, P.; Mahdjoubi, L.; Booth, C.; Aigbavboa, C.; Abanda, F.H. The importance of BIM capability assessment: An evaluation of post-selection performance of organisations on construction projects. Eng. Constr. Archit. Manag. 2020, 27, 24–48. [Google Scholar] [CrossRef] [Green Version]
- CIC (Computer Integrated Construction Research Program). BIM Planning Guide for Facility Owners. 2013. Available online: https://www.bim.psu.edu/owners_guide/ (accessed on 12 July 2022).
- Giel, B.; Issa, R.R.A. Framework for Evaluating the BIM Competencies of Facility Owners. J. Manag. Eng. 2016, 32, 4015024. [Google Scholar] [CrossRef]
- Alankarage, S.; Chileshe, N.; Samaraweera, A.; Rameezdeen, R.; Edwards, D.J. Organisational BIM maturity models and their applications: A systematic literature review. Archit. Eng. Des. Manag. 2022, 1–19. [Google Scholar] [CrossRef]
- Vittal, S.A.; Parviz, F.R. Role of organizational project management maturity factors on project success. Eng. Manag. J. 2018, 30, 165–178. [Google Scholar] [CrossRef]
- Viana, J.C.; Mota, C.M.M. Enhancing organizational project management maturity: A framework based on the value focused thinking model. Producao 2016, 26, 313–329. [Google Scholar] [CrossRef]
- Zhang, L.; He, J.; Zhang, X. The project management maturity model and application based on PRINCE2. Procedia Eng. 2012, 29, 3691–3697. [Google Scholar] [CrossRef] [Green Version]
- Zhang, Q.; Yang, S.; Liao, P.-C.; Chen, W. Influence mechanisms of factors on project management capability. J. Manag. Eng. 2020, 36, 0000812. [Google Scholar] [CrossRef]
- Kerpedzhiev, G.D.; König, U.M.; Röglinger, M.; Rosemann, M. An Exploration into Future Business Process Management Capabilities in View of Digitalization. Bus. Inf. Syst. Eng. 2021, 63, 83–96. [Google Scholar] [CrossRef] [Green Version]
- Wendler, R. The maturity of maturity model research: A systematic mapping study. Inf. Softw. Technol. 2012, 54, 1317–1339. [Google Scholar] [CrossRef]
- Khoshgoftar, M.; Osman, O. Comparison of maturity models. In Proceedings of the 2009 2nd IEEE International Conference on Computer Science and Information Technology, Beijing, China, 8–11 August 2009; pp. 297–301. [Google Scholar] [CrossRef]
- Kwak, Y.H.; Ibbs, C.W. Project management process maturity (PM)2 model. J. Manag. Eng. 2002, 18, 150–155. [Google Scholar] [CrossRef] [Green Version]
- Permana, V.; Sucahyo, Y.G.; Gandhi, A. Measuring information technology project management maturity level: A case study from a project based organization in Indonesia. In Proceedings of the 2017 International Conference on Information Technology Systems and Innovation (ICITSI), Bandung, Indonesia, 23–24 October 2017; pp. 342–347. [Google Scholar] [CrossRef]
- Crawford, J.K. The project management maturity model. Inf. Syst. Manag. 2006, 23, 50–58. [Google Scholar] [CrossRef]
- Langston, C.; Ghanbaripour, A.N. A Management Maturity Model (MMM) for project-based organisational performance assessment. Constr. Econ. Build. 2016, 16, 68–85. [Google Scholar] [CrossRef] [Green Version]
- Fabbro, E.; Tonchia, S. Project management maturity models: Literature review and new developments. J. Mod. Proj. Manag. 2021, 8, 31–45. [Google Scholar] [CrossRef]
- Yeo, K.T.; Ren, Y.; Ren, Y. Risk management maturity in large complex rail projects: A case study. Int. J. Proj. Organ. Manag. 2016, 8, 301–323. [Google Scholar] [CrossRef]
- Heravi, G.; Gholami, A. The Influence of Project Risk Management Maturity and Organizational Learning on the Success of Power Plant Construction Projects. Proj. Manag. J. 2018, 49, 22–37. [Google Scholar] [CrossRef]
- Ma, L.; Fu, H. A Governance Framework for the Sustainable Delivery of Megaprojects: The Interaction of Megaproject Citizenship Behavior and Contracts. J. Constr. Eng. Manag. 2022, 148, 04022004. [Google Scholar] [CrossRef]
- Seelhofer, D.; Graf, C.O. National project management maturity: A conceptual framework. Cent. Eur. Bus. Rev. 2018, 7, 1–20. [Google Scholar] [CrossRef] [Green Version]
- Jugdev, K.; Thomas, J. Project management maturity models: The silver bullets of competitive advantage? Proj. Manag. J. 2002, 33, 4–14. [Google Scholar] [CrossRef]
- Wu, C.; Xu, B.; Mao, C.; Li, X. Overview of BIM maturity measurement tools. J. Inf. Technol. Constr. 2017, 22, 34–62. Available online: https://www.scopus.com/inward/record.uri?eid=2-s2.0-85011655077&partnerID=40&md5=4c64b9ba28831a5c519542f9a5b147dc (accessed on 19 October 2022).
- Sebastian, R.; Van Berlo, L. Tool for benchmarking BIM performance of design, engineering and construction firms in the Netherlands. Archit. Eng. Des. Manag. 2010, 6, 254–263. [Google Scholar] [CrossRef]
- McCuen, T.L.; Suermann, P.C.; Krogulecki, M.J. Evaluating award-winning BIM projects using the National Building Information Model Standard Capability Maturity Model. J. Manag. Eng. 2012, 28, 224–230. [Google Scholar] [CrossRef]
- Morlhon, R.; Pellerin, R.; Bourgault, M. Building information modeling implementation through maturity evaluation and critical success factors management. Procedia Technol. 2014, 16, 1126–1134. [Google Scholar] [CrossRef] [Green Version]
- Sinoh, S.S.; Ibrahim, Z.; Othman, F.; Muhammad, N.L.N. Review of BIM literature and government initiatives to promote BIM in Malaysia. IOP Conf. Ser. Mater. Sci. Eng. 2020, 943, 012057. [Google Scholar] [CrossRef]
- Kam, C.; Song, M.H.; Senaratna, D. VDC scorecard: Formulation, application, and validation. J. Constr. Eng. Manag. 2017, 143, 04016100. [Google Scholar] [CrossRef]
- Indiana University. BIM Guidelines and Standards for Architects, Engineers, and Contractors. 2015. Available online: https://knowledge.autodesk.com/akn-aknsite-article-attachments/8a7f652b-edb7-4fb4-87a2-2eaec27ec6cc.pdf (accessed on 12 July 2022).
- Succar, B. Building information modelling framework: A research and delivery foundation for industry stakeholders. Autom. Constr. 2009, 18, 357–375. [Google Scholar] [CrossRef]
- Succar, B. Building information modelling maturity matrix. In Handbook of Research on Building Information Modeling and Construction Informatics: Concepts and Technologies; IGI Global: Hershey, PA, USA, 2010; pp. 65–103. [Google Scholar] [CrossRef]
- Joblot, L.; Paviot, T.; Deneux, D.; Lamouri, S. Building Information Maturity Model specific to the renovation sector. Autom. Constr. 2019, 101, 140–159. [Google Scholar] [CrossRef]
- Lu, W.; Chen, K.; Zetkulic, A.; Liang, C. Measuring building information modeling maturity: A Hong Kong case study. Int. J. Constr. Manag. 2021, 21, 299–311. [Google Scholar] [CrossRef]
- Hu, W.; Li, D.; Hu, R. Three-dimensional complex construction project management maturity model: Case study of 2010 shanghai expo. Appl. Mech. Mater. 2012, 209–211, 1363–1369. [Google Scholar] [CrossRef]
- ISACA 2012. COBIT 5: A Business Framework for the Governance and Management of Enterprise IT. ISACA, Rolling Meadows. Available online: https://www.isaca.org/resources/cobit/cobit-5#sort=relevancy (accessed on 12 July 2022).
- PMI (Project Management Institute). A Guide to the Project Management Body of Knowledge (PMBOK® Guide), 7th ed.; PMI: Newtown Square, PA, USA, 2001; Available online: https://www.pmi.org/pmbok-guide-standards/foundational/pmbok (accessed on 12 July 2022).
- Kim, S.; Feldt, L.S. A Comparison of Tests for Equality of Two or More Independent Alpha Coefficients. J. Educ. Meas. 2008, 45, 179–193. [Google Scholar] [CrossRef]
- Volk, R.; Stengel, J.; Schultmann, F. Building Information Modeling (BIM) for existing buildings -Literature review and future needs. Autom. Constr. 2014, 38, 109–127. [Google Scholar] [CrossRef]
Figure 1.
Assessment result of BATM model.


Table 1.
Definition of maturity level.
| Level | Definition of PBM Maturity Level | Definition of PBA Maturity Level |
|---|---|---|
| Level 0 |
| |
| Level 1 |
|
|
| Level 2 |
|
|
| Level 3 |
|
|
| Level 4 |
|
|
| Level 5 |
|
|
Table 2.
Assessment index system of BATM.
| Performance Domains | Code | Desired Outcomes |
|---|---|---|
| Stakeholder performance domain | D11 | A productive working relationship with stakeholders throughout the project. |
| D12 | Stakeholder agreement with project objectives. | |
| D13 | Stakeholders who are project beneficiaries are supportive and satisfied while stakeholders who may oppose the project or its deliverables do not negatively impact project outcomes. | |
| Team performance domain | D21 | Shared ownership. |
| D22 | A high-performing team. | |
| D23 | Applicable leadership and other interpersonal skills demonstrated by all team members. | |
| Development approach and life cycle performance domain | D31 | Development approaches that are consistent with project deliverables. |
| D32 | A project life cycle consisting of phases that connect the delivery of business and stakeholder value from the beginning to the end of the project. | |
| D33 | A project life cycle consisting of phases that facilitate the delivery cadence and development approach required to produce the project deliverables. | |
| Planning performance domain | D41 | The project progresses in an organized, coordinated, and deliberate manner. |
| D42 | There is a holistic approach to delivering the project outcomes. | |
| D43 | Evolving information is elaborated to produce the deliverables and outcomes for which the project was undertaken. | |
| D44 | Time spent planning is appropriate for the situation. | |
| D45 | Planning information is sufficient to manage stakeholder expectations. | |
| D46 | There is a process for the adaptation of plans throughout the project based on emerging and changing needs or conditions. | |
| Project work performance domain | D51 | Efficient and effective project performance. |
| D52 | Project processes are appropriate for the project and the environment. | |
| D53 | Appropriate communication with stakeholders. | |
| D54 | Efficient management of physical resources. | |
| D55 | Effective management of procurements. | |
| D56 | Improved team capability due to continuous learning and process improvement. | |
| Delivery performance domain | D61 | Projects contribute to business objectives and advancement of strategy. |
| D62 | Projects realize the outcomes they were initiated to deliver. | |
| D63 | Project benefits are realized in the time frame in which they were planned. | |
| D64 | The project team has a clear understanding of requirements. | |
| D65 | Stakeholders accept and are satisfied with project deliverables. | |
| Measurement performance domain | D71 | A reliable understanding of the status of the project. |
| D72 | Actionable data to facilitate decision making. | |
| D73 | Timely and appropriate actions to keep project performance on track. | |
| D74 | Achieving targets and generating business value by making informed and timely decisions based on reliable forecasts and assessments. | |
| Uncertainty performance domain | D81 | An awareness of the environment in which projects occur, including, but not limited to, the technical, social, political, market, and economic environments. |
| D82 | Proactively exploring and responding to uncertainty. | |
| D83 | An awareness of the interdependence of multiple variables on the project. | |
| D84 | The capacity to anticipate threats and opportunities and understand the consequences of issues. | |
| D85 | Project delivery with little or no negative impact from unforeseen events or conditions. | |
| D86 | Opportunities are realized to improve project performance and outcomes. | |
| D87 | Cost and schedule reserves are utilized effectively to maintain alignment with project objectives. |
Table 3.
Scoring table of BATM questionnaire.
| Assessment Indexes | PBM Maturity | PBA Maturity | ||||||||||||
|---|---|---|---|---|---|---|---|---|---|---|---|---|---|---|
| L1 | L2 | L3 | L4 | L5 | Weight | L0 | L1 | L2 | L3 | L4 | L5 | Weight | ||
| Stakeholder performance domain | D11 | □ | □ | □ | □ | □ | _____ | □ | □ | □ | □ | □ | □ | _____ |
| D12 | □ | □ | □ | □ | □ | _____ | □ | □ | □ | □ | □ | □ | _____ | |
| D13 | □ | □ | □ | □ | □ | _____ | □ | □ | □ | □ | □ | □ | _____ | |
| Team performance domain | D21 | □ | □ | □ | □ | □ | _____ | □ | □ | □ | □ | □ | □ | _____ |
| D22 | □ | □ | □ | □ | □ | _____ | □ | □ | □ | □ | □ | □ | _____ | |
| D23 | □ | □ | □ | □ | □ | _____ | □ | □ | □ | □ | □ | □ | _____ | |
| Development approach and life cycle performance domain | D31 | □ | □ | □ | □ | □ | _____ | □ | □ | □ | □ | □ | □ | _____ |
| D32 | □ | □ | □ | □ | □ | _____ | □ | □ | □ | □ | □ | □ | _____ | |
| D33 | □ | □ | □ | □ | □ | _____ | □ | □ | □ | □ | □ | □ | _____ | |
| Planning performance domain | D41 | □ | □ | □ | □ | □ | _____ | □ | □ | □ | □ | □ | □ | _____ |
| D42 | □ | □ | □ | □ | □ | _____ | □ | □ | □ | □ | □ | □ | _____ | |
| D43 | □ | □ | □ | □ | □ | _____ | □ | □ | □ | □ | □ | □ | _____ | |
| D44 | □ | □ | □ | □ | □ | _____ | □ | □ | □ | □ | □ | □ | _____ | |
| D45 | □ | □ | □ | □ | □ | _____ | □ | □ | □ | □ | □ | □ | _____ | |
| D46 | □ | □ | □ | □ | □ | _____ | □ | □ | □ | □ | □ | □ | _____ | |
| Project work performance domain | D51 | □ | □ | □ | □ | □ | _____ | □ | □ | □ | □ | □ | □ | _____ |
| D52 | □ | □ | □ | □ | □ | _____ | □ | □ | □ | □ | □ | □ | _____ | |
| D53 | □ | □ | □ | □ | □ | _____ | □ | □ | □ | □ | □ | □ | _____ | |
| D54 | □ | □ | □ | □ | □ | _____ | □ | □ | □ | □ | □ | □ | _____ | |
| D55 | □ | □ | □ | □ | □ | _____ | □ | □ | □ | □ | □ | □ | _____ | |
| D56 | □ | □ | □ | □ | □ | _____ | □ | □ | □ | □ | □ | □ | _____ | |
| Delivery performance domain | D61 | □ | □ | □ | □ | □ | _____ | □ | □ | □ | □ | □ | □ | _____ |
| D62 | □ | □ | □ | □ | □ | _____ | □ | □ | □ | □ | □ | □ | _____ | |
| D63 | □ | □ | □ | □ | □ | _____ | □ | □ | □ | □ | □ | □ | _____ | |
| D64 | □ | □ | □ | □ | □ | _____ | □ | □ | □ | □ | □ | □ | _____ | |
| D65 | □ | □ | □ | □ | □ | _____ | □ | □ | □ | □ | □ | □ | _____ | |
| Measurement performance domain | D71 | □ | □ | □ | □ | □ | _____ | □ | □ | □ | □ | □ | □ | _____ |
| D72 | □ | □ | □ | □ | □ | _____ | □ | □ | □ | □ | □ | □ | _____ | |
| D73 | □ | □ | □ | □ | □ | _____ | □ | □ | □ | □ | □ | □ | _____ | |
| D74 | □ | □ | □ | □ | □ | _____ | □ | □ | □ | □ | □ | □ | _____ | |
| Uncertainty performance domain | D81 | □ | □ | □ | □ | □ | _____ | □ | □ | □ | □ | □ | □ | _____ |
| D82 | □ | □ | □ | □ | □ | _____ | □ | □ | □ | □ | □ | □ | _____ | |
| D83 | □ | □ | □ | □ | □ | _____ | □ | □ | □ | □ | □ | □ | _____ | |
| D84 | □ | □ | □ | □ | □ | _____ | □ | □ | □ | □ | □ | □ | _____ | |
| D85 | □ | □ | □ | □ | □ | _____ | □ | □ | □ | □ | □ | □ | _____ | |
| D86 | □ | □ | □ | □ | □ | _____ | □ | □ | □ | □ | □ | □ | _____ | |
| D87 | □ | □ | □ | □ | □ | _____ | □ | □ | □ | □ | □ | □ | _____ | |
Table 4.
Participant information table.
| Gender | Educational Background | Post | Work Experience | ||||
|---|---|---|---|---|---|---|---|
| Male | Female | Undergraduate | Graduate | BIM | Project Management | <10 | ≥10 |
| 42 | 8 | 37 | 13 | 6 | 44 | 11 | 39 |
Table 5.
Descriptive statistics, Cronbach’s alpha, and correlation coefficients.
| Minimum | Maximum | Mean | Std. Deviation | Cronbach Alpha | Correlation Coefficient | t | ||
|---|---|---|---|---|---|---|---|---|
| Stakeholder | PBM | 1.00 | 3.00 | 2.15 | 0.72 | 0.75 | 0.67 | 6.27 |
| PBA | 0.00 | 2.00 | 1.29 | 0.70 | 0.78 | |||
| Team | PBM | 1.33 | 3.33 | 2.71 | 0.51 | 0.93 | 0.53 | 4.40 |
| PBA | 0.00 | 2.00 | 1.47 | 0.66 | 0.95 | |||
| Development | PBM | 2.00 | 3.33 | 2.73 | 0.44 | 0.91 | 0.77 | 8.44 |
| PBA | 0.33 | 2.00 | 1.63 | 0.48 | 0.76 | |||
| Planning | PBM | 1.50 | 3.00 | 2.43 | 0.41 | 0.76 | 0.79 | 9.13 |
| PBA | 0.50 | 2.00 | 1.50 | 0.46 | 0.73 | |||
| Project work | PBM | 2.00 | 3.00 | 2.69 | 0.33 | 0.81 | 0.62 | 5.55 |
| PBA | 0.00 | 2.17 | 1.73 | 0.47 | 0.90 | |||
| Delivery | PBM | 1.00 | 3.00 | 2.47 | 0.43 | 0.86 | 0.51 | 4.14 |
| PBA | 0.00 | 2.00 | 1.79 | 0.45 | 0.95 | |||
| Measurement | PBM | 1.00 | 3.50 | 2.30 | 0.56 | 0.83 | 0.61 | 5.34 |
| PBA | 0.00 | 2.25 | 1.52 | 0.52 | 0.84 | |||
| Uncertainty | PBM | 1.00 | 3.43 | 2.45 | 0.65 | 0.94 | 0.84 | 10.9 |
| PBA | 0.00 | 2.00 | 1.35 | 0.53 | 0.87 |
Table 6.
Analysis of variance with two factors.
| Dimension | Source of Difference | Sum of Squares | Degree of Freedom | Mean Square | F | p-Value | F-Crit |
|---|---|---|---|---|---|---|---|
| PBM | Performance domains | 15.28 | 7 | 2.18 | 9.44 | 1.073 × 10⁹ | 2.037 |
| Participants | 38.53 | 48 | 0.80 | 3.47 | 1.513 × 10¹¹ | 1.396 | |
| PBA | Performance domains | 6.50 | 7 | 0.93 | 4.11 | 2.409 × 10⁴ | 2.037 |
| Participants | 52.60 | 48 | 1.10 | 4.84 | 1.735 × 10¹⁸ | 1.396 |
Publisher’s Note: MDPI stays neutral with regard to jurisdictional claims in published maps and institutional affiliations. |
© 2022 by the authors. Licensee MDPI, Basel, Switzerland. This article is an open access article distributed under the terms and conditions of the Creative Commons Attribution (CC BY) license (https://creativecommons.org/licenses/by/4.0/).
Share and Cite
MDPI and ACS Style
Sun, C.; Chen, H.; Long, R.; Liao, R. Research on BIM Application Two-Dimensional Maturity Model. Buildings 2022, 12, 1960. https://doi.org/10.3390/buildings12111960
AMA Style
Sun C, Chen H, Long R, Liao R. Research on BIM Application Two-Dimensional Maturity Model. Buildings. 2022; 12(11):1960. https://doi.org/10.3390/buildings12111960
Chicago/Turabian StyleSun, Changqing, Hong Chen, Ruyin Long, and Ruihua Liao. 2022. "Research on BIM Application Two-Dimensional Maturity Model" Buildings 12, no. 11: 1960. https://doi.org/10.3390/buildings12111960
Note that from the first issue of 2016, this journal uses article numbers instead of page numbers. See further details here.