
Test and Bearing Capacity Calculation of a New Energy-Dissipated Precast Shear Wall


1
College of Civil and Architectural Engineering, North China University of Science and Technology, Tangshan 063210, China
2
Earthquake Engineering Research Center of Hebei Province, Tangshan 063210, China
*
Author to whom correspondence should be addressed.
Buildings 2022, 12(11), 1990; https://doi.org/10.3390/buildings12111990
Submission received: 20 October 2022
/
Revised: 8 November 2022
/
Accepted: 14 November 2022
/
Published: 16 November 2022
(This article belongs to the Special Issue Advanced Studies of Risk Resistant Building Structures)
Abstract
:At present, most precast shear walls are implemented in accordance with the method equivalent to a cast-in-place structure, where the joint is complicated, and the construction is difficult. According to the characteristics of precast shear wall structures, the design method of “strong horizontal joints, weak vertical joints” for a precast shear wall structure is proposed. The existing horizontal joint method was used to form strong horizontal joints, and the damper was used to connect the vertical joints to form weak vertical joints. It can reduce the pouring of concrete and improve construction efficiency. Three types of specimens (Rectangle shape, T shape, L shape) were designed. Low cycle reciprocating load tests were carried out under different axial compression ratios (0.1, 0.3), and the bearing capacity and ductility of the specimens were studied. The results show that the precast shear wall structure has good mechanical properties. The ductility coefficient is close to or greater than three, and the maximum ductility coefficient is 3.62. The specimens have good ductility. The relative displacement of the damper is greater than 1.75 mm. All the dampers yield and dissipate energy, which improves the seismic performance of the structure and plays a good role in connecting the wall limbs. The strain distribution law of the specimen section is discussed, the simplified mechanical calculation model is given, and the calculation method of flexural capacity of a precast shear wall structure is put forward.
1. Introduction
A precast shear wall structure is a structural system of prefabricated members assembled and connected. There are a large number of horizontal and vertical joints in the structure. The horizontal joints transfer vertical loads and bear horizontal shear to ensure the connection strength of the wall. Vertical joints transfer the shear force between adjacent shear wall segments, which has a great influence on the deformation and energy dissipation performance of the structure [1]. The joint performance between components has a great influence on the structure, and a lot of research work has been carried out.
Soudki [2] conducted tests on the horizontal joint connection performance of prefabricated wall panels. The results show that the stress of horizontal joints shows three different states, and the horizontal joints of different structures mainly fail in the form of concrete crushing and spalling.
W. Wang [3] designed and constructed two 1/4-scaled structure models—a precast concrete shear wall (PCSW) structure model and a cast-in situ concrete shear wall (CCSW) structure model. The dynamic properties and seismic responses of the two structure models are compared via shaking table tests. The test results reveal that under earthquakes, the PCSW structure and the CCSW structure have similar failure processes, failure shapes, absolute acceleration responses, inter-storey drift responses, shear force responses, and shear-weight ratio responses; the improved assembly horizontal wall (AHW) connections in the PCSW structure are useful and effective and can consequently meet the seismic requirements for the wall.
Marriott [4] conducted a shaking table test study on four post-tension-prestressed shear walls with energy dissipation elements, and further improved the energy dissipation capacity of the structure by setting mild steel dampers, viscous dampers, and their combined energy dissipation elements.
Henin et al. [5] conducted tests and finite element and theoretical studies on a new type of sleeve grouting joint used for precast concrete components, and the study showed that the connection mode was reliable and economical.
M.H. Kisa et al. [6] designed two types of shear walls, which were constructed on a 1:3 scale. One type is a conventional reinforced concrete shear wall that has boundary zones consisting of only conventional reinforcement. The other walls tested were composite shear walls with boundary zones consisting of cold-formed steel sheets (CFSSs). The composite shear walls were tested under cyclic lateral loadings, and their behaviors were investigated.
Buddika et al. [7] established the equations to calculate shear forces in post-tensioned hybrid (PH) precast concrete walls, post-tensioned rocking (PR) precast concrete walls, and reinforced concrete (RC) shear walls, which were all examined and their limitations discussed. Then, an extensive numerical study of PH precast concrete walls designed using the equivalent lateral force procedure is carried out.
H. J. Jiang et al. [8] propose a new type of reinforced concrete (RC)-coupled shear wall with replaceable coupling beams and replaceable corner components (RCCs) installed at the bottom corners of wall piers. An the experimental study was carried out as well. The test results indicate that compared with conventional RC-coupled shear walls, the seismic performance of the new coupled shear wall is significantly improved.
In A. Biswal et al. [9], the in-plane shear behavior of vertical grouted joints between precast panels is studied. Thirteen jointed wall panel specimens were tested under direct shear. Based on the results, analytical expressions were developed to predict the shear load versus slip behavior. The wall was modeled for three cases, (a) a monolithic wall, (b) two walls with a gap, and (c) two walls with shear links. Based on a non-linear pushover analysis, it was demonstrated that the modeling of jointed walls using shear links reduces the conservatism inherent in a model, neglecting the shear transfer across the joint
Z.F. Zhu et al. [10] designed a precast shear wall structure connected by grouting sleeves and conducted low-cycle reciprocating load tests on it. The results show that the system has good mechanical and seismic performance.
F.J. Crisafulli et al. [11] carried out an experimental study on a new type of vertically welded joints with rectangular steel plates with circular holes, and gave simplified expressions of shear stiffness, yield strength, and ultimate strength of the vertical joints.
H.N. Li et al. [12] proposed the idea of a novel viscoelastic damped joint (VDJ) to create the vertical connection between two precast walls. By amplifying the displacements and velocities of the joint, the energy dissipating properties of damping materials can be fully used. The VDJ is suitable for improving the damping efficiency in stiff shear wall structural systems.
J.B. Li [13] designed twelve laminated reinforced concrete shear walls for cyclic loading tests. The seismic performance of laminated reinforced concrete shear walls with vertical seams are evaluated by the failure mode, deformability, hysteresis curve, stiffness degradation, and energy dissipation capacity.
M. Mirsadeghi [14] proposed an innovative analytical method to evaluate a steel plate shear wall with partial length connection to a vertical boundary element (VBE) that lacks the connection at the middle height of the VBE. Push-over loading was carried out on four small-scale designed test specimens so as to investigate the quality of the tension field formation in a web plate by not changing the connected length ratio. Based on the aforementioned experimental and numerical study evidence, governing equations have been developed for this analytical solution, including panel shear strength, tension field inclination angle, and minimum stiffness requirements in vertical boundary elements.
Richard [15] installed low-carbon steel energy-dissipating shear bonds in shear walls and conducted experimental studies. The results show that the elliptical shear bond has the best energy dissipation performance, and the seismic performance of the new system can be significantly improved.
Marriott [16] installed different forms of dampers in shear walls and conducted shaking table tests. The test results show that the seismic performance of the specimens with dampers is obviously better than that of the shear walls without dampers, and the structural damage is obviously reduced.
Pantelides [17] used fiber polymer materials to reinforce the vertical joints of prefabricated shear wall structures and conducted experimental studies. The results show that the vertical joints of shear walls with fiber polymer can not only transfer the load effectively, but also have a higher connection strength compared with welded joint plates.
Chung [18] installed a friction damper in the middle of the coupling beam and carried out numerical simulation analysis. The results show that the friction damper can improve the seismic performance of the structure and dissipate energy by friction when the wall is staggered.
J. Sun et al. [19,20] conducted a low cyclic loading test on a prefabricated RC shear wall by using connection steel frames and high-strength bolts. The results showed that this type of fabricated shear wall is of high bearing capacity and has good ductility and energy dissipation.
Q. Gu et al. [21] conducted a quasi-static seismic test on four double-sided composite shear wall specimens with different horizontal joint connection types and one full cast-in-place shear wall specimen, and the deformation characteristics, bearing capacity, hysteretic performance, displacement ductility, energy dissipation capacity, and stiffness degradation of the wall specimens were discussed. The results showed that the ultimate failure form of the double-sided composite shear wall specimen is the same as that of the cast-in-place shear wall specimen; the composite shear wall specimens have good seismic performance.
In order to ensure the integrity and continuity of the shear wall structure, the common practice is to design the connection into a strong connection, but the component processing is complex and construction is inconvenient. Some scholars set the dampers in the coupling beam to improve the seismic performance of the structure. On the basis of the existing research, the implementation method of “strong horizontal joints, weak vertical joints” for a precast shear wall structure is proposed. The existing “wet design” (grouting sleeve connection or slurry anchor lap) is used to form strong horizontal joints, and the displacement damper is used to connect wall limbs to form weak vertical joints. The vertical joints are connected by dampers, which can greatly reduce the work of concrete pouring on site and improve the construction efficiency. Three types of precast shear wall specimen were designed, and low-cycle reciprocating load tests were carried out under different axial compression ratios. The mechanical properties, hysteretic characteristics, energy dissipation capacity, and seismic performance of the specimens were studied. The ultimate flexural bearing capacity calculation formula of the precast shear wall structure was derived, and the test results were verified.
2. The Design Method of “Strong Horizontal Joints, Weak Vertical Joints”
The implementation method of “strong horizontal joints, weak vertical joints” for a precast shear wall structure adopts the existing “wet design” (grouting sleeve, etc.) to form strong horizontal joints, and adopts the displacement damper to form weak energy dissipation vertical joints. The vertical joints yield first due to the strong horizontal joints under the lateral force, which is similar to the “strong column and weak beam”model. The yield mechanism causing the collapse of the structure will not be formed. There are a large number of vertical joints in the precast structure, and the damper installation is very convenient. When the load is small, the precast wall has almost the same properties as the cast-in-place wall. When the load is large, the wall limbs move against each other, and the dampers dissipate energy and increase the damping ratio of specimens, which improves the seismic performance of the specimens. The slip of horizontal joints will lead to large deformation and even collapse of the structure. Therefore, the slip of horizontal joints should be avoided and the structure should meet the requirements of “strong horizontal joints”.
3. Experiment Design
3.1. Specimen Design
A total of six test specimens were designed, as shown in Table 1 and Figure 1. The specimen designations start with a letter indicating the shape of the specimen, with “R,” “T,” and “L,” indicating rectangular, T-shaped, and L-shaped walls, respectively. Based on the test results reported in reference [22], the damper shown in Figure 2 was used, and the corresponding working performance parameters are listed in Table 2. A displacement meter was placed at each end of the damper to measure the relative displacement between them. A steel plate was embedded into each of the two walls of the specimen and were welded to the damper, as shown in Figure 3. The connection of horizontal joints (such as grouting sleeve connection, etc.) can be equal to the design purpose of the cast-in-place. The horizontal joints of the specimens were cast-in-place to simplify the production of the specimens. To secure the connection between the two wall plates, each specimen was configured with three dampers. Strain gages were attached to the vertical rebars to measure their strain. The dimension of the strain gauge was 3 mm × 2 mm, the resistance value was 120.1 ± 0.1 Ω, and the sensitivity factor was 2.08 ± 1%. They were placed 80 mm above the foundation beam, as shown in Figure 1. Table 3 and Table 4 show the measured strengths of the rebars and concrete, respectively.
3.2. Test Setup and Loading Scheme
Figure 4 shows the test setup. A jack placed over the specimen generated an axial pressure. The horizontal displacement of the specimen was measured using a displacement meter (S, Z, X). The loading was controlled by angular displacement, with two cycles of loading applied at each level. Considering the maximum inter-layer elastic angular displacement as θp = 1/120, as suggested in references [23,24,25], and the distance from the center of the actuator to the bottom of the wall plates to be 2880 mm, the following loading method was adopted: increasing from 0.12 θp (3.4 mm) to 3 θp (72 mm) at a rate of 0.5 mm/s. The specific loading scheme is shown in Figure 5 and Table 5. The test was terminated when the bearing capacity of the specimen decreased to below 85% of the peak load, or the specimen was deformed to an extent that was too large to continue the loading, or the maximum capacity of the loading device was reached. The westward loading from the actuator was designated positive, and the eastward loading, negative.
4. Failure Modes of Specimens
Diagonal cracks first developed in the lower part of the specimens. As the loading increased, cracks developed in the upper part. Toward the end of the loading scheme, a plastic hinge developed in the lower part of the web or the larger wall, followed by decrease in the bearing capacity and ultimate failure of the specimen (Figure 6, Figure 7, Figure 8, Figure 9, Figure 10 and Figure 11). All specimens exhibited a bending-shear mode of failure, with the failure mainly occurring in the web or the larger wall. The process of failure can be divided into the following three stages:
- (1)
- Elastic stage: The specimens and dampers of the precast shear wall specimens exhibited no prominent changes.
- (2)
- Elastoplastic stage: As the loading increased from 0.25 θp to 0.5 θp, the tensile stress at the edge of the specimen increased gradually. When the tensile strength of concrete exceeds the limit, cracks developed in the lower part of the web and larger wall. The cracks were distributed horizontally near the edge of the wall but propagated obliquely toward the center of the wall. The flange and smaller wall did not exhibit prominent cracks. As the loading increased from 0.5 θp to 1.5 θp, the position of cracks gradually moved up, and the existing cracks also gradually developed to the center of the specimen, and the crack width increased. As the loading increased from 1.5 θp to 2 θp, a plastic hinge developed in the lower part of the web and larger wall. This was accompanied by the peel-off of concrete. Horizontal cracks also developed in the flange and smaller wall, and the dampers exhibited prominent plastic deformation. For the specimens with an axial compression ratio (ACR) of 0.3, due to the large axial pressure and the concentrated loading from the jack, vertical splitting cracks developed in the upper part of the specimens, and their stress state changed. The vertical rebars were pulled out from the foundation beam due to inadequate anchoring and other reasons. This changed the mechanical properties and deformation behavior of these specimens. The vertical reinforcement bars at the edges of the T-0.1, L-0.1, and L-0.3 specimens were pulled out from the foundation beam, which had a certain impact on the mechanical properties and deformation properties of the specimens.
- (3)
- Failure stage: When the loading increased to over 2 θp, intersecting oblique cracks occurred in the central area of the web and larger wall, the plastic-hinge area in the lower part deformed more prominently, the concrete was crushed, and the rebars were bent. Cracks penetrated horizontally across the entire width of the flange and smaller wall. The foundation beams split to different degrees. When the loading increased to over 2 θp, the loading beam of specimen R-0.1 underwent a lateral slip, the specimen underwent torsional deformation, and torsional oblique cracks developed in the smaller wall. The two ends of the dampers exhibited prominent relative displacement, and splitting occurred at the end of the bending unit. When the peak load was reached, the bearing capacity of the specimens decreased, followed by termination of the loading.
The failure mode of the specimens is seen in the plastic hinge at the lower part of the wall limb, the damper in the vertical joint reaches the yield, and no shear failure occurs at the joint between the wall limb and the foundation (horizontal joint) of each specimen. The failure mode was “strong horizontal joint, weak vertical joint”.
5. Test Results and Analysis
5.1. Bearing Capacity and Ductility Coefficient
Table 6 shows the horizontal and angular displacements of the specimens at crack initiation, yielding, and peak load and their ductility coefficients. The bearing capacity of the specimens mainly depended on the web and larger wall. Due to the effect of the yield stress of the dampers, the ACR of the web or the larger wall decreased during positive loading, thereby decreasing the overall bearing capacity of the specimen, but increased during negative loading, thereby increasing the overall bearing capacity of the specimens. Consequently, the bearing capacities of the specimens in the positive and negative directions differed significantly. As the ACR increased, the yield strengths of the specimens in the two loading directions increased by approximately 20~30%, but the peak load decreased. This is because vertical splitting cracks developed in the upper part of the specimens with an ACR of 0.3, thereby changing the stress state in these specimens and decreasing the bearing capacity. When the vertical bars of T-0.1, L-0.1, and L-0.3 were pulled out, the bearing capacity of the specimens increased slightly, indicating that the reliable horizontal joints (strong horizontal joints) had an impact on the overall bearing capacity of the specimens.
The displacement ductility coefficient (DDC) of a specimen is defined as the ratio of its displacement at the peak load and that at the yield strength. The specimens had a DDC of close to or greater than three, indicating good deformation behavior. Except for specimen L-0.1, all specimens had a larger DDC in the positive direction than in the negative direction. The DDC decreased with an increase in the bearing capacity.
5.2. Hysteresis Curves
Figure 12 shows the hysteresis curves of the specimens. In the initial stage of loading, the specimens were in an elastic state. As the loading increased, the area and height of the hysteresis loops increased, indicating residual deformation after release of the loading. The hysteresis loops exhibited different degrees of narrowing at the middle, indicating inadequate anchoring and slip of the rebars. The hysteresis loops were rounded, indicating that the specimens had a good energy-dissipation capacity.
5.3. Stiffness Degradation Curves
With the increase of horizontal displacement, the continuous damage in the specimen gradually accumulated, resulting in the reduction of the lateral stiffness of the specimen, that is, stiffness degradation. Figure 13 shows the stiffness degradation curve of the specimens. The stiffness degradation trend of all specimens is basically the same. The maximum negative stiffness is 32.40 kN/mm(ACR = 0.1) and 39.96 kN/mm(ACR = 0.3), whereas the positive stiffness is 31.16 kN/mm(ACR = 0.1) and 35.99 kN/mm(ACR = 0.3). Negative stiffness of the specimens is greater than positive stiffness, and this is because the yield force of dampers applied to the wall limb changed the actual ACR of the wall limbs, and during negative loading, the small horizontal displacement is caused by a loose loading device. The stiffness degradation of precast specimens in the early stage is slow, indicating that the overall mechanical properties and deformation properties of specimens are improved, the ductility of specimens is increased, and the overall seismic performance is enhanced after the installation of dampers in vertical joints.
5.4. Relative Displacement of Dampers
The two ends of the dampers underwent shear deformation under horizontal loading, and the corresponding displacements were measured. The maximum relative displacement values of the dampers at each loading stage are listed in Table 7, Table 8 and Table 9. Figure 14 shows the variations in the maximum relative displacement of the dampers with the loading level. When the loading was small, the dampers were in an elastic state. When the loading increased to 10~20 mm (0.42~0.83 θp), dampers DS and DZ yielded. When the loading increased to 20~35 mm (0.83~1.46 θp), damper DX yielded. Damper DS underwent the largest relative displacement, more than two times that of Damper DX and dissipated the largest amount of energy. Damper DZ underwent a slightly smaller relative displacement than damper DS, yielded later than damper DS, and performed well in energy dissipation. Damper DX underwent the smallest relative displacement and dissipated the smallest amount of energy. The maximum relative displacements of dampers DZ, DS, and DS were 15.43 mm, 9.74 mm, and 7.64 mm, respectively, and all the dampers yielded but did not fail completely, realizing a reliable connection between the components.
5.5. Strain Analysis of Specimens
Figure 15 shows the variations in the positive and negative direction cross-sectional strains of the specimens during the first three loading cycles. The mean of the strains of the two rebars with the same cross-sectional coordinate was used as the measure of the strain at that cross-sectional coordinate. For the T- shaped and L-shaped specimens, the flange displaced horizontally, exhibiting no prominent torsion. Only the strains of the vertical rebars in the embedded column were considered for measuring the strain of the flange. As shown in the figure, the cross-sectional distribution of the strain of the specimens is not continuous, exhibiting abrupt variations at the joint. The planar stress in the web and larger wall of the specimens varied linearly, indicating that the web and larger wall are consistent with the planar cross-section assumption. The flange and smaller wall experienced tensile or compressive stress depending on the direction of the loading. The strain distribution indicates an eccentric tensile or eccentric compressive stress state. Thus, the walls of the precast shear wall structures were analyzed separately for their stress state.
6. Mechanical Model for Calculation of Bearing Capacity
6.1. Calculation Model
Based on references [23,24,25,26,27,28] and the test results, when a yield mechanism formed in the specimens, a plastic hinge formed in the bottom part of the walls, and the dampers yielded. Thus, the overturning moment on the bottom cross-section of the shear walls can be considered as their overall ultimate flexural bearing capacity. Figure 16 shows a model for calculating the ultimate flexural bearing capacity of specimens.
According to the conditions for the equilibrium of the forces on a structure being subjected to horizontal loading, that is, when the overturning moment on the bottom cross-section of the structure is equal to the flexural bending capacity in the bottom cross-section, the flexural bending capacity of the specimens can be calculated as follows:
Mu—The ultimate flexural bearing capacity of the precast shear wall structure;
MuA, MuB—The ultimate flexural bending capacities of walls A and B at ultimate failure;
—The distance between the central line of wall A and that of wall B;
—The sum of the yield strengths of all the dampers in the vertical joint that generated an axial force on each wall.
6.2. Fundamenbtal Assumptions
As shown in Equation (1), the ultimate flexural bearing capacity of the specimens consists of two components: the inherent ultimate flexural bearing capacities of the individual walls and the contribution of the dampers to the final flexural bearing capacities. The effect of the yield strength of the dampers was considered in the calculation; that is, their contribution to the ultimate flexural bearing capacities of the walls was considered. Based on the above analysis of the composition of the ultimate flexural bearing capacity of the precast shear wall structures, the following assumptions were made:
- (1)
- To simplify the analysis, walls A and B of the precast shear wall structures were assumed to be identical. The cross-section of each wall remained planar after force-induced deformations; that is, each wall was consistent with the planar cross-section assumption. Each shear wall was considered as a component being subjected to eccentric forces for the calculation of its flexural bearing capacity and satisfied the various requirements set in relevant design specifications;
- (2)
- The tensile strength of the concrete in the tensile area of a wall was not considered;
- (3)
- For the calculation of the stress in the concrete in the compressive cross-sectional area, the actual concrete compressive stress diagram was substituted with an equivalent rectangular stress diagram. The average compressive stress in the compressive area of the concrete was assigned a value of α1fc. The height of the equivalent rectangular stress diagram, x, was assigned a value of β1xn. Here, fc was the axial compressive strength of the concrete; xn was the height of the actual compressive area in a pier; α1 and β1 were the coefficients of the equivalent rectangular diagram for the concrete and were assigned values of α1 = 1.0 and β1 = 0.8, respectively, when the grade of the concrete was lower than C50;
- (4)
- The strengthening effect of the dampers after yielding was not considered; that is, the post-yield bearing capacity of the dampers remained constant during the loading;
- (5)
- For the T-shaped and L-shaped specimens, the flange was considered as a component being subjected to an eccentric force, and all rebars in the flange were assumed to yield during ensile (compressive) loading. The bearing capacity of the flange can also be determined using the calculation model shown in Figure 16.
6.3. Calculation of Bearing Capacity
As shown by the calculation model in Figure 16, both walls A and B are subjected to a horizontal load, a vertical load from the upper part of the structure, and the yield shear stress from the dampers. The yield force of the dampers acts on the walls and generates a vertical upward or downward force (depending on the direction of the horizontal load), which combines with the vertical load from the upper part of the structure to act on the bottom of the walls. Taking wall A as an example, the internal forces on its bottom cross-section induced by all the external forces include moment M, shear force V, and axial force N. The axial force can be obtained using the following equation:
G—The vertical load on this individual wall can be obtained based on the actual load bearing area of the wall;
—The sum of yield forces of all dampers on the wall.
The yield forces of dampers have a positive value when is in the same direction of G and a negative value when is in the opposite direction of G. When N has a positive value, the wall is in a compressive state and is considered as a component being subjected to eccentric compression for the calculation. When N has a negative value, the wall is subjected to a vertical tensile force and is considered as a component being subjected to an eccentric tensile force for the calculation.
According to the test results and the strain of the section in Figure 15, it can be seen that the larger wall limb and web wall are in the state of large eccentric compression, whereas the smaller wall limb and flange wall are in the state of large eccentric compression and large eccentric tensile stress. The following two conditions will be analyzed.
6.3.1. Large Eccentric Compression-Induced Failure
In order to facilitate the construction and installation, the wall limbs are generally designed into the form of symmetric reinforcement. Figure 17 shows the cross-section and reinforcement configuration of a wall, where the reinforced area of each flange is designated as As and the vertically reinforced area of the wall is designated as Asw. The rebars are evenly distributed in the cross-section. The stress diagram of the compressive area of the concrete is substituted by an equivalent rectangular diagram, with the stress assigned a value of α1fc. When the stresses of As and As′ reach fy and fy′, respectively, some of the vertical rebars are in a compressive state, whereas others are in a tensile state. In addition, the rebars farther from the neutral axis have reached their design strength (that is, equal to fy and fy′), whereas those near the neutral axis have not yielded. Considering the actual stress state, and to simplify the calculations, the tensile rebars with a distance from the edge of the compressive area larger than 1.5x (x is the nominal height of the compressive area) were assumed to have yielded at a yield strength of fy, whereas the effect of the rebars with a distance smaller than 1.5x was neglected.
Individual walls of a precast shear wall are generally reinforced with symmetrically configured rebars to facilitate assembly and construction. Thus, the discussion will focus on the calculation of symmetrically reinforced shear walls. For symmetrical reinforcement, As = As′; thus, the bearing capacity can be calculated using the following equations:
6.3.2. Large Eccentric Tension-Induced Failure
When under the combined action of an axial force and moment, a component is predicted to fail due to large eccentric tension. Considering that some vertical rebars near the neutral axis have not yielded, and to simplify the calculation, the tensile rebars with a distance from the edge of the compressive area larger than 1.5x (x is the nominal height of the compressive area) are assumed to have yielded, whereas the effect of all the rebars with a distance smaller than 1.5x is neglected. Figure 18 shows the cross-sectional stress distribution in the wall. Considering that a wall is generally symmetrically reinforced (that is, As = As′), the bearing capacity can be calculated using the following equations:
6.4. Analysis of Flexural Bearing Capacity in Normal Cross-Sections
By substituting the calculated flexural bearing capacity of the precast shear wall into the following equation, the maximum horizontal load on the specimen can be obtained as follows:
Mu—The flexural bearing capacity of the precast shear wall;
H—The height of the precast shear wall; H = 2880 mm for the specimens used in this study.
The calculation is based on the measured material strength. Table 10 lists the measured and calculated bearing capacities in the normal cross-section of the precast shear wall specimens. The difference between the calculated and measured values was smaller than 10% for the specimens with an ACR of 0.1, indicating the validity of the calculation model. The torsion of the specimen R-0.1 reduced the bearing capacity, so the calculated value was smaller than the test value. For specimens T-0.1 and L-0.1, the calculated positive-direction bearing capacities are slightly larger than the measured values. This is due to the inadequate anchoring of the vertical rebars. This indicates that reliable connection and anchoring of vertical rebars is fundamental for ensuring the performance of precast shear walls, that is, precast shear walls need to first meet the design requirements of “strong horizontal joints”. Vertical splitting cracks were developed in the specimens with an ACR of 0.3 during loading and the splitting changed the stress state in these specimens. In addition, the slip and pull-out of the vertical rebars affected the overall bearing capacity of the structures, which explains the large difference between the calculated and measured values for these specimens.
7. Conclusions and Prospect
The implementation method of “strong horizontal joints, weak vertical joints” for precast shear wall structures is put forward. Three types of precast shear wall specimens were tested and analyzed. The bearing capacity of the specimen and the energy dissipation of the damper affected by the vertical reinforcement is pulled out. It shows that “strong horizontal joints” are the basis for realizing the overall performance of precast shear walls, and a reliable connection of horizontal joints can realize energy dissipation of weak vertical joints. The main conclusions are summarized as follows:
- (1)
- The bearing capacity of the specimen under positive loading is greater than 500 kN, and under negative loading is greater than 700 kN. The bearing capacity of the specimens is good. Due to the difference between the two wall limbs, the bearing capacity of the specimen in the two directions is different. Therefore, the two wall limbs should be close to each other so that the bearing capacity of the specimen in the two loading directions is similar. With the increase of ACR, the bearing capacity of the specimen increases, but the ductility decreases.
- (2)
- When the plastic hinge begins to appear at the lower part of the wall limbs, the displacement angle is about 1/60, which is twice the maximum elastic–plastic interlayer displacement angle (1/120) required by the code. When the specimen finally fails, the displacement angle is 1/40. The ductility coefficient is larger under positive loading and smaller under negative loading. Furthermore, the DDC of the specimen is close to or greater than three, indicating good ductility.
- (3)
- All dampers have reached yield, which played a role in improving the seismic performance of the structure. The dampers DS and DZ had reached yield before the failure of the specimen, which played an important role in alleviating the failure of the wall limbs. The damper DX yield late and served more to connect the wall limbs. The maximum relative displacement of the damper was 15.43 mm, which did not reach the ultimate displacement (20.19 mm) of the damper. The dampers functioned well as connectors at the failure of the specimens, securing the overall properties of the structure.
- (4)
- The simplified mechanical model of the precast shear wall structure is given, and the calculation formula of the bearing capacity is derived. The experimental results are compared with the calculated results, which show that the calculation method can better reflect the bearing capacity of the structure.
In this test, only the ACR was changed, and there are many factors affecting the precast shear wall, and the strengthening effect of the dampers was not considered in the calculation. The research group will carry out a series of tests in the future to conduct further study on this precast shear wall structure.
Author Contributions
Conceptualization, Y.W. and Y.Z. (Yunlong Zhou); methodology, Y.W., Y.Z. (Yunlong Zhou), and Z.Y.; software, Z.W. and Y.Z. (Yumin Zhang); validation, Z.Y. and Y.Z. (Yumin Zhang); writing—original draft preparation Y.W., Y.Z. (Yunlong Zhou) and Z.W.; writing—review and editing, Y.W, Z.Y., Y.Z. (Yumin Zhang), Y.Z. (Yunlong Zhou) and Z.W. All authors have read and agreed to the published version of the manuscript.
Funding
This research was supported by the National Natural Science Foundation of China (51678237), the Natural Science Foundation of Hebei Province, China (E2021209112), and the Applied Basic Research Program of Tangshan Science and Technology Bureau (21130222c).
Institutional Review Board Statement
Not applicable.
Informed Consent Statement
Not applicable.
Data Availability Statement
The experiment data used to support the findings of this study are included in the article.
Conflicts of Interest
The authors declare no conflict of interest.
References
- Li, A.Q.; Wang, W.; Jia, H.; Chen, M.F.; Zheng, J. Progress of investigation on seismic behavior of precast RC shear wall structures(I): Joint property study. J. Disaster Prev. Mitig. Eng. 2013, 33, 600–605. [Google Scholar] [CrossRef]
- Soudki, K.A.; West, J.S.; Rizkalla, S.H.; Blackett, B. Horizontal connections for precast concrete shear wall panels under cyclic shear loading. PCI J. 1996, 41, 64–80. [Google Scholar] [CrossRef]
- Wang, W.; Li, A.Q.; Wang, X.X. Seismic performance of precast concrete shear wall structure with improved assembly horizontal wall connections. Bull. Earthq. Eng. 2018, 16, 4133–4158. [Google Scholar] [CrossRef]
- Marriott, D.J.; Pampanin, S.; Palermo, A.; Bull, D. Shake-Table Testing of Hybrid Post-Tensioned Precast Wall Systems with Alternative Dissipating Solutions. In Proceedings of the 14th World Conference on Earthquake Engineering, Beijing, China, 12–17 October 2008. [Google Scholar]
- Henin, E.; Morcous, G. Non-proprietary bar splice sleeve for precast concrete construction. Eng. Struct. 2015, 83, 154–162. [Google Scholar] [CrossRef]
- Kisa, M.H.; Yuksel, S.B.; Caglar, N. Experimental study on hysteric behavior of composite shear walls with steel sheets. J. Build. Eng. 2020, 33, 101570. [Google Scholar] [CrossRef]
- Buddika, H.A.D.S.; Wijeyewickrema, A.C. Seismic shear force amplification in post-tensioned hybrid precast walls. J. Struct. Eng. 2018, 144, 04018086. [Google Scholar] [CrossRef]
- Jiang, H.J.; Li, S.R.; Bolander, J.E.; Kunnath, S.K. Seismic Performance of a New Type of Coupled Shear Wall with Replaceable Components: Experimental Validation. J. Earthq. Eng. 2022. [Google Scholar] [CrossRef]
- Biswal, A.; Prasad, A.M.; Sengupta, A.K. Study of shear behavior of grouted vertical joints between precast concrete wall panels under direct shear loading. Struct. Concr. 2019, 20, 564–582. [Google Scholar] [CrossRef]
- Zhu, Z.F.; Guo, Z.X. Seismic performance of the spatial model of precast concrete shear wall structure using grouted lap splice connection and cast-in-situ concrete. Struct. Concr. 2019, 20, 1316–1327. [Google Scholar] [CrossRef]
- Crisafulli, F.J.; Restrepo, J.I. Ductile steel connections for seismic resistant precast buildings. J. Earthq. Eng. 2003, 7, 541. [Google Scholar] [CrossRef]
- Zhang, C.; Li, H.; Gao, W.; Li, C. Experimental and analytical investigations on new viscoelastic damped joints for seismic mitigation of structures with precast shear walls. Struct. Control Health Monit. 2019, 27, e2485. [Google Scholar] [CrossRef]
- Li, J.; Wang, Y.; Lu, Z.; Li, J. Experimental Study and Numerical Simulation of a Laminated Reinforced Concrete Shear Wall with a Vertical Seam. Appl. Sci. 2017, 7, 629. [Google Scholar] [CrossRef] [Green Version]
- Mirsadeghi, M.; Fanaie, N. Steel plate shear walls with partial length connection to vertical boundary element. Structures 2021, 32, 1820–1838. [Google Scholar] [CrossRef]
- Henry, R.S.; Aaleti, S.; Sritharan, S.; Ingham, J.M. Concept and Finite-element Modeling of New Steel Shear Connectors for Self-centering Wall Systems. J. Eng. Mech. 2010, 136, 220–229. [Google Scholar] [CrossRef]
- Marriott, D.; Pampanin, S.; Bull, D.; Palermo, A. Dynamic Testing of Precast, Post-tensioned Rocking Wall Systems with Alternative Dissipating Solutions. Bull. N. Z. Soc. Earthq. Eng. 2008, 41, 90–103. [Google Scholar] [CrossRef] [Green Version]
- Pantelides, C.P.; Volnyy, V.A.; Gergely, J.; Reaveley, L.D. Seismic retrofit of precast concrete panel connections with carbon fiber reinforced polymer composites. PCI J. 2003, 48, 92–101. [Google Scholar] [CrossRef] [Green Version]
- Chung, H.S.; Moon, B.W.; Lee, S.K.; Park, J.H.; Min, K.W. Seismic Performance of Friction Dampers Using Flexure of RC Shear Wall System. Struct. Des. Tall Spec. Build. 2009, 18, 807–822. [Google Scholar] [CrossRef]
- Sun, J.; Qiu, H.; Lu, Y.; Jiang, H. Experimental study of lateral load behavior of H-shaped precast reinforced concrete shear walls with bolted steel connections. Struct. Des. Tall Spec. Build. 2019, 28, e1663. [Google Scholar] [CrossRef]
- Sun, J.; Qiu, H.X.; Jiang, H.B. Experimental study and associated mechanism analysis of horizontal bolted connections involved in a precast concrete shear wall system. Struct. Concr. 2019, 20, 282–295. [Google Scholar] [CrossRef] [Green Version]
- Gu, Q.; Dong, G.; Ke, Y.; Tian, S.; Wen, S.; Tan, Y.; Gao, X. Seismic behavior of precast double-face superposed shear walls with horizontal joints and lap spliced vertical reinforcement. Struct. Concr. 2020, 21, 1973–1988. [Google Scholar] [CrossRef]
- Wang, Y.L.; Cui, H.J.; Zhang, Y.M.; Ding, Z.X. Analysis and experimental study on mechanical properties of mild damper with different slit forms. Ind. Constr. 2019, 49, 170. [Google Scholar] [CrossRef]
- GB50011-2010; Code for Seismic Design of Buildings. China Academy of Building Research: Beijing, China; Ministry of Construction of the People’s Republic of China: Beijing, China, 2016.
- GB50010-2010; Code for Design of Concrete Structures. China Academy of Building Research: Beijing, China; Ministry of Construction of the People’s Republic of China: Beijing, China, 2015.
- JGJT101-2015; Specification for Seismic Test of Buildings. China Academy of Building Research: Beijing, China; Ministry of Construction of the People’s Republic of China: Beijing, China, 2015.
- Li, M. Study on the Design Method of Silt Shear Walls with Metal Dampers. Master’s Thesis, Southeast University, Nanjing, China, 2017. [Google Scholar]
- Yan, X.Y. Study on Seismic Behavior of Fabricated Shear Wall with Vertical Energy-Consuming Joints. Master’s Thesis, Southeast University, Nanjing, China, 2019. [Google Scholar]
- JGJ3-2010; Technical Specification for Concrete Structures of Tall Building. China Academy of Building Research: Beijing, China; Ministry of Construction of the People’s Republic of China: Beijing, China, 2010.
Figure 1.
Design parameters of the specimen.
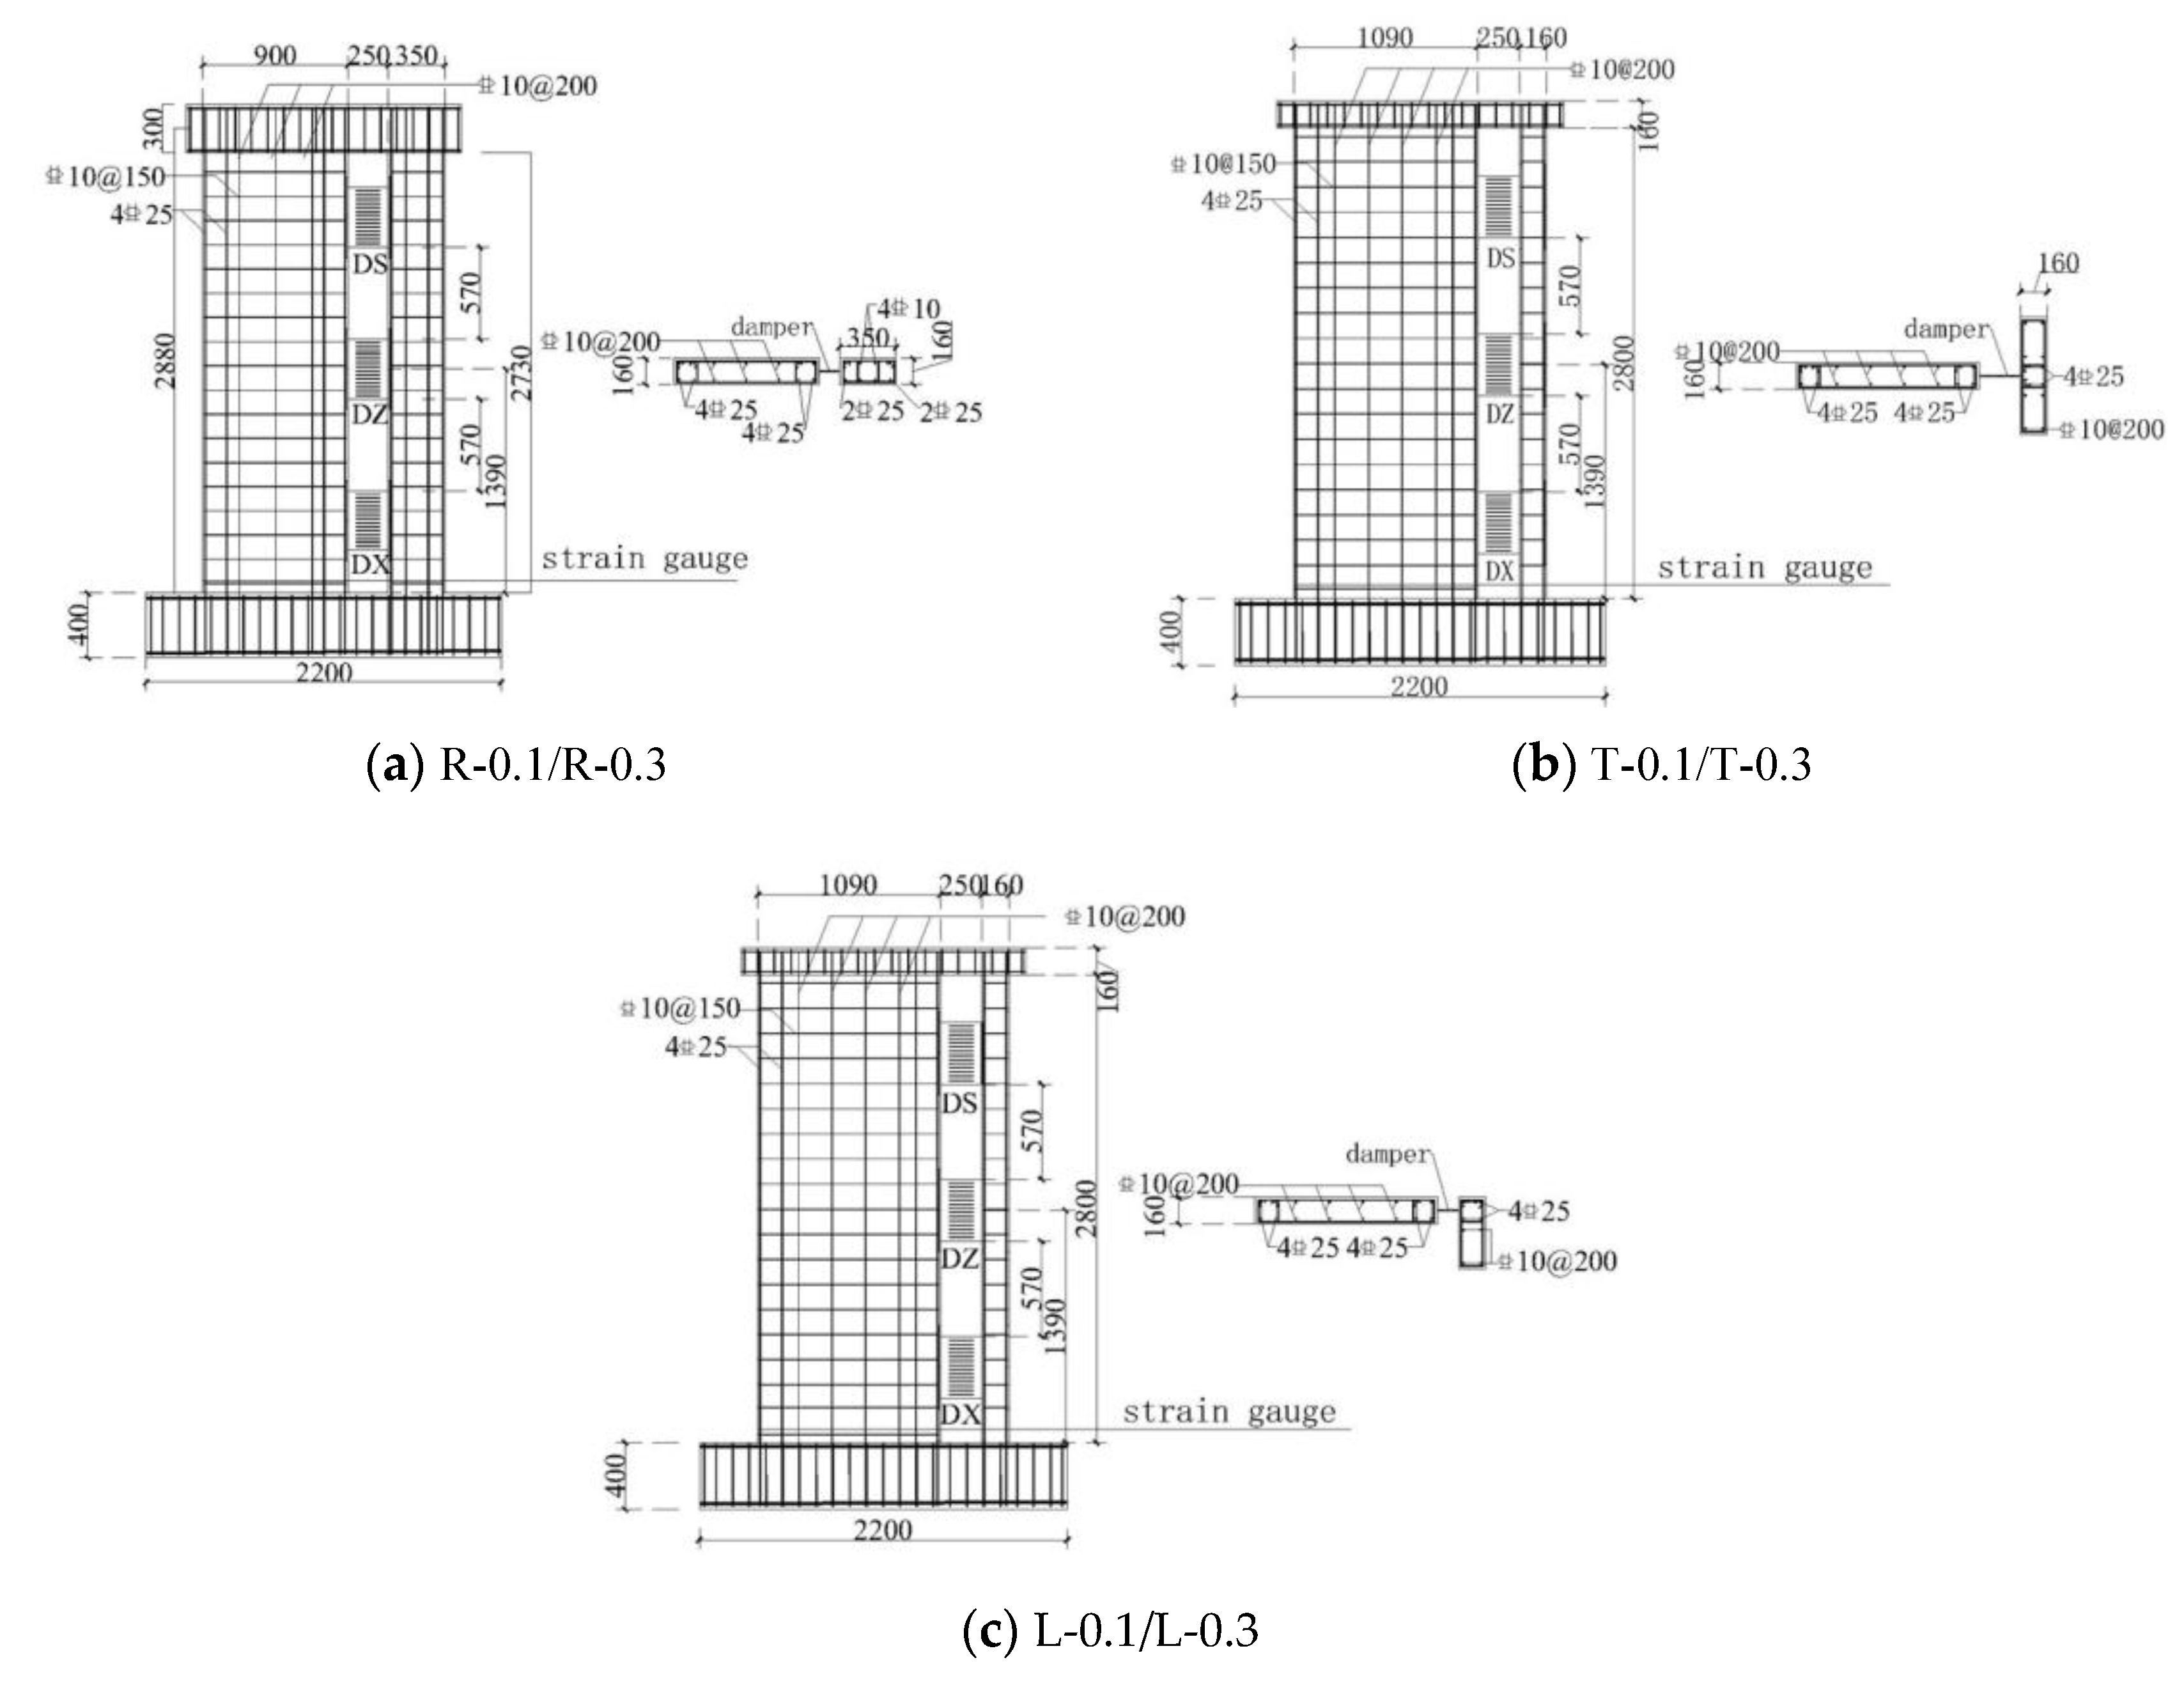
Figure 2.
Diagram of damper.

Figure 3.
Diagram of node.

Figure 4.
The loading device.
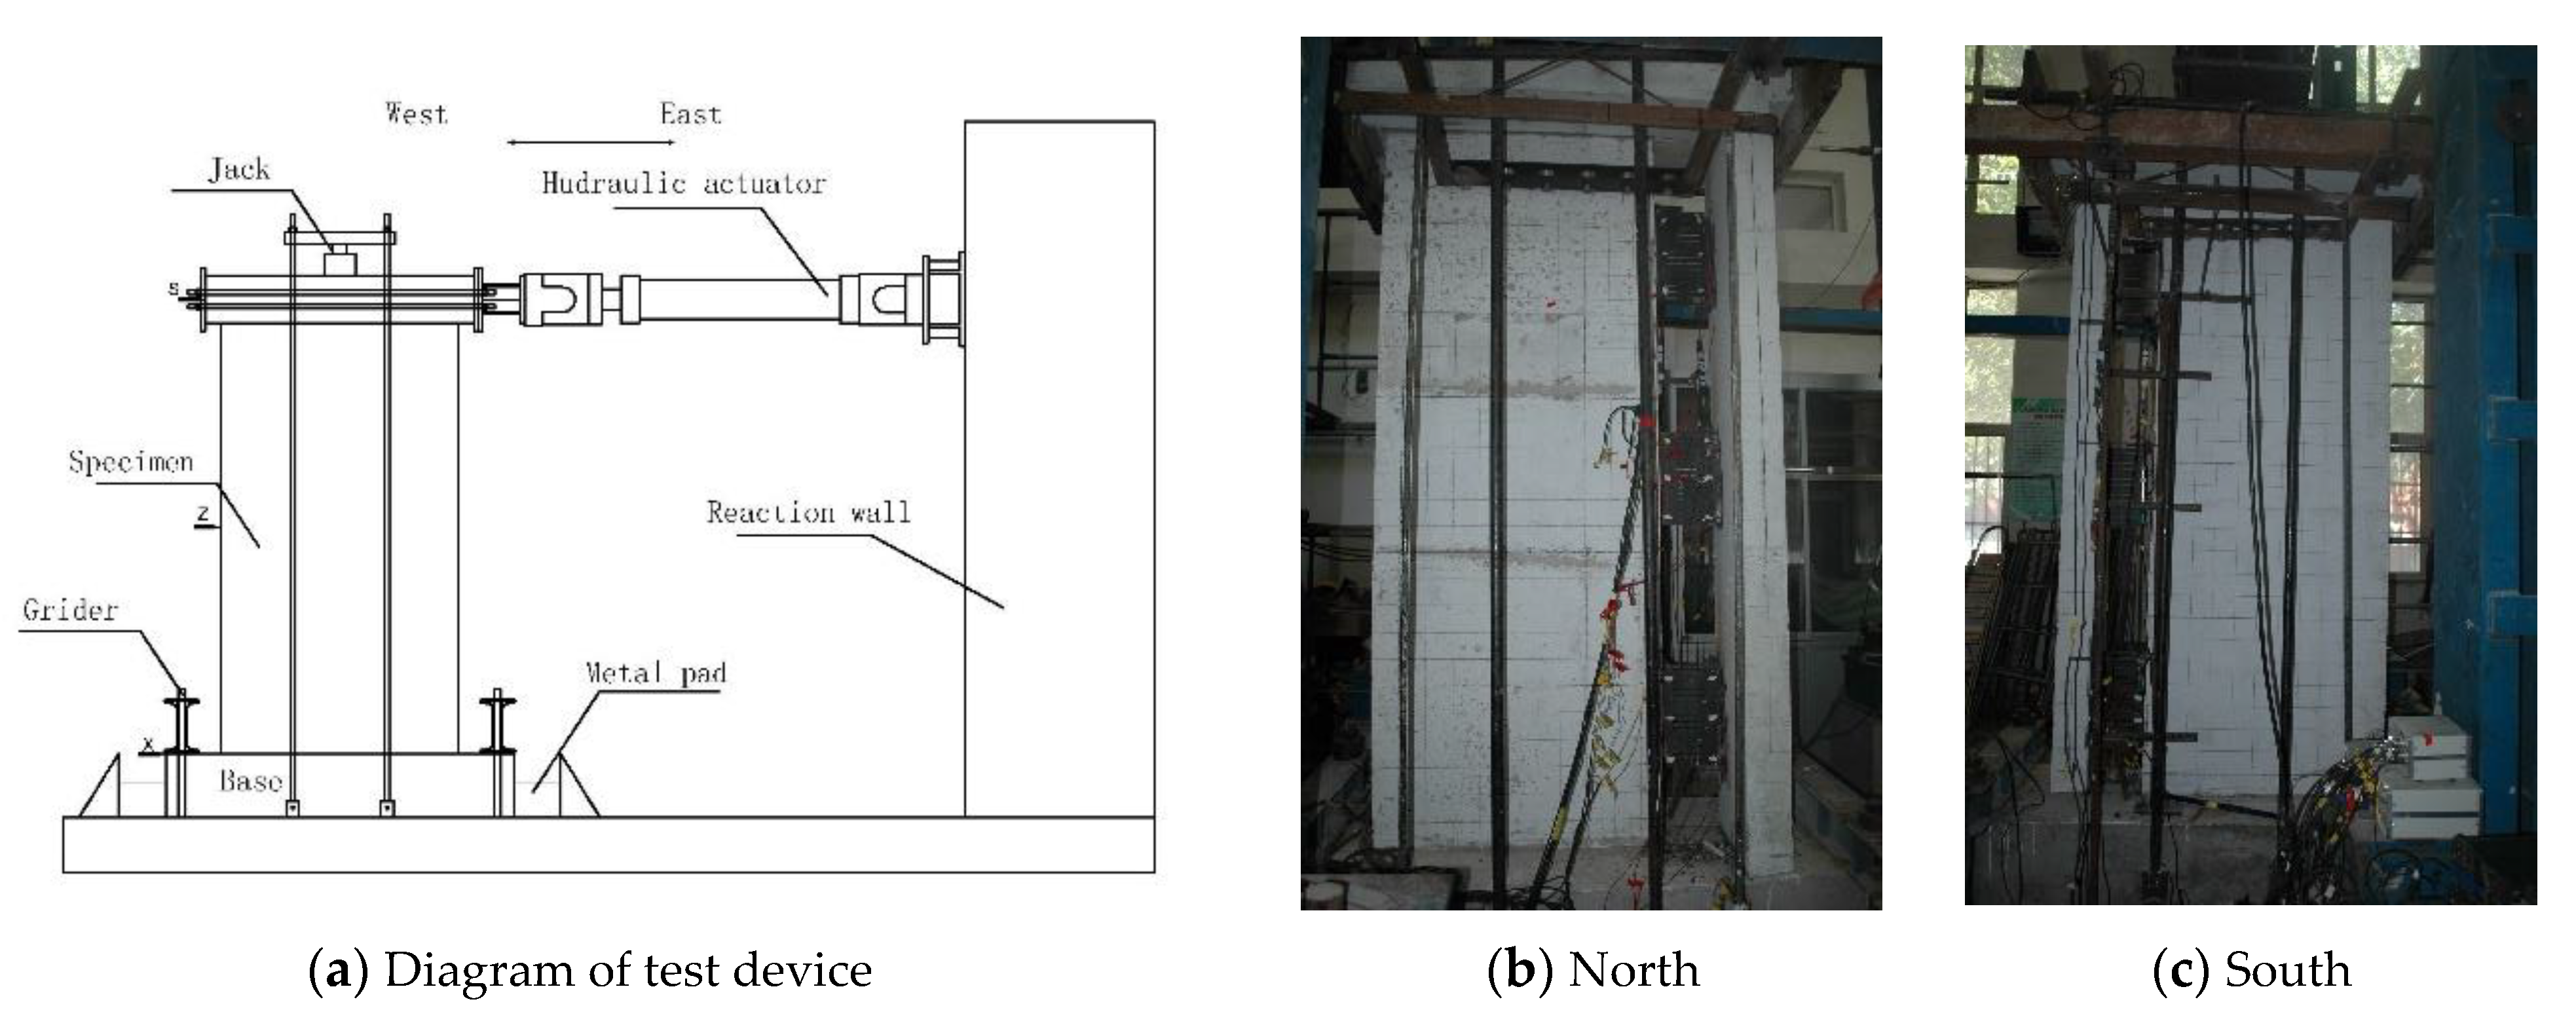
Figure 5.
Loading scheme.
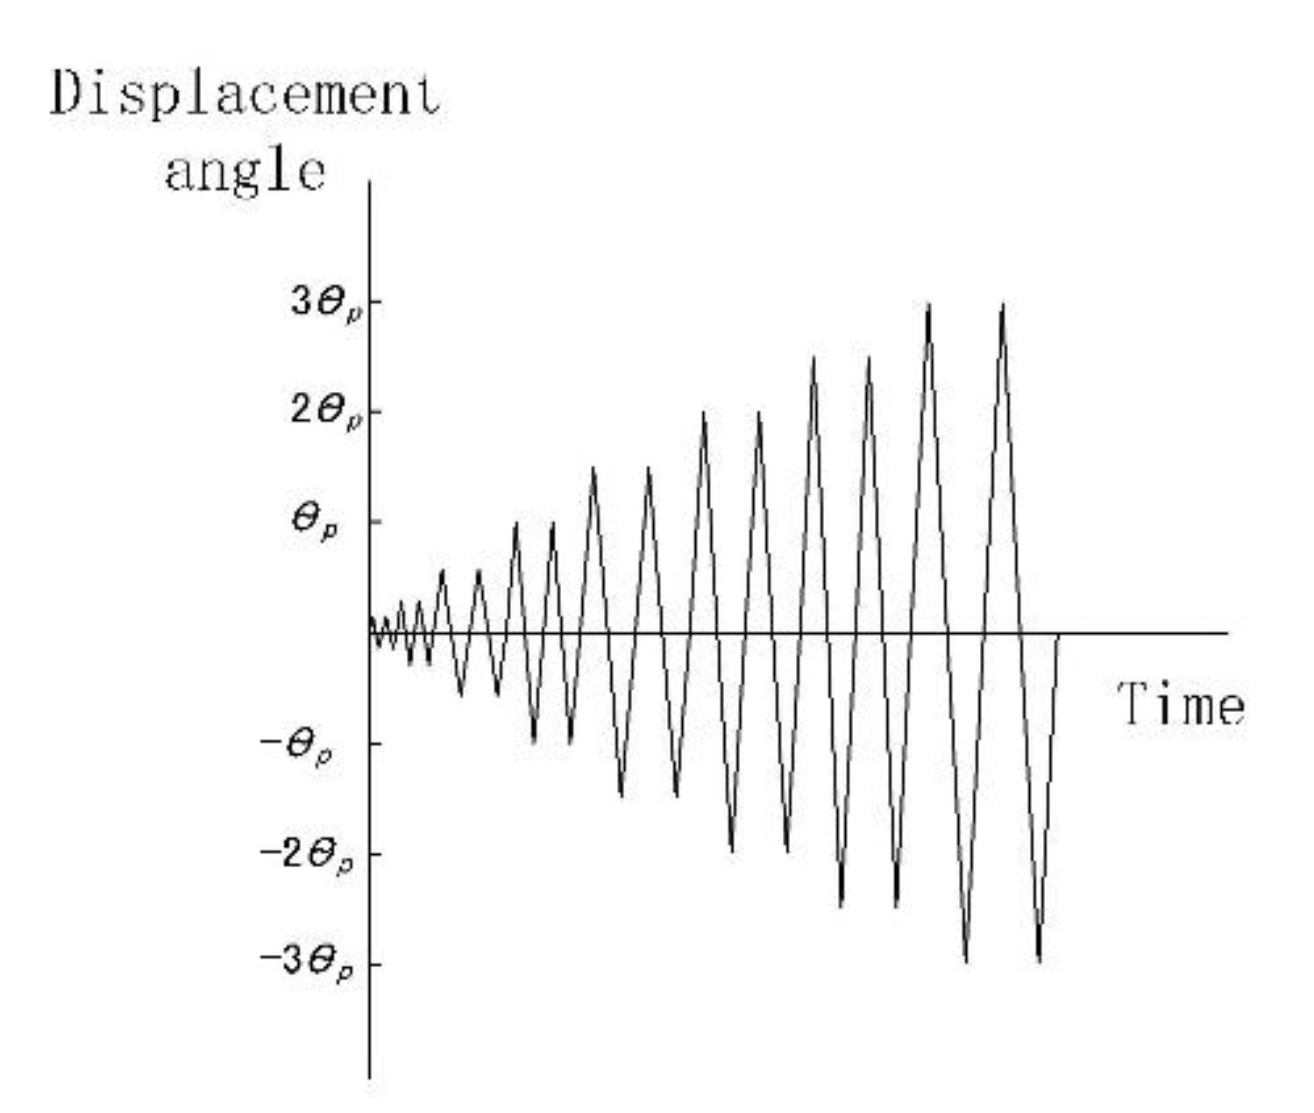
Figure 6.
Failure model of specimen R-0.1.

Figure 7.
Failure model of specimen R-0.3.
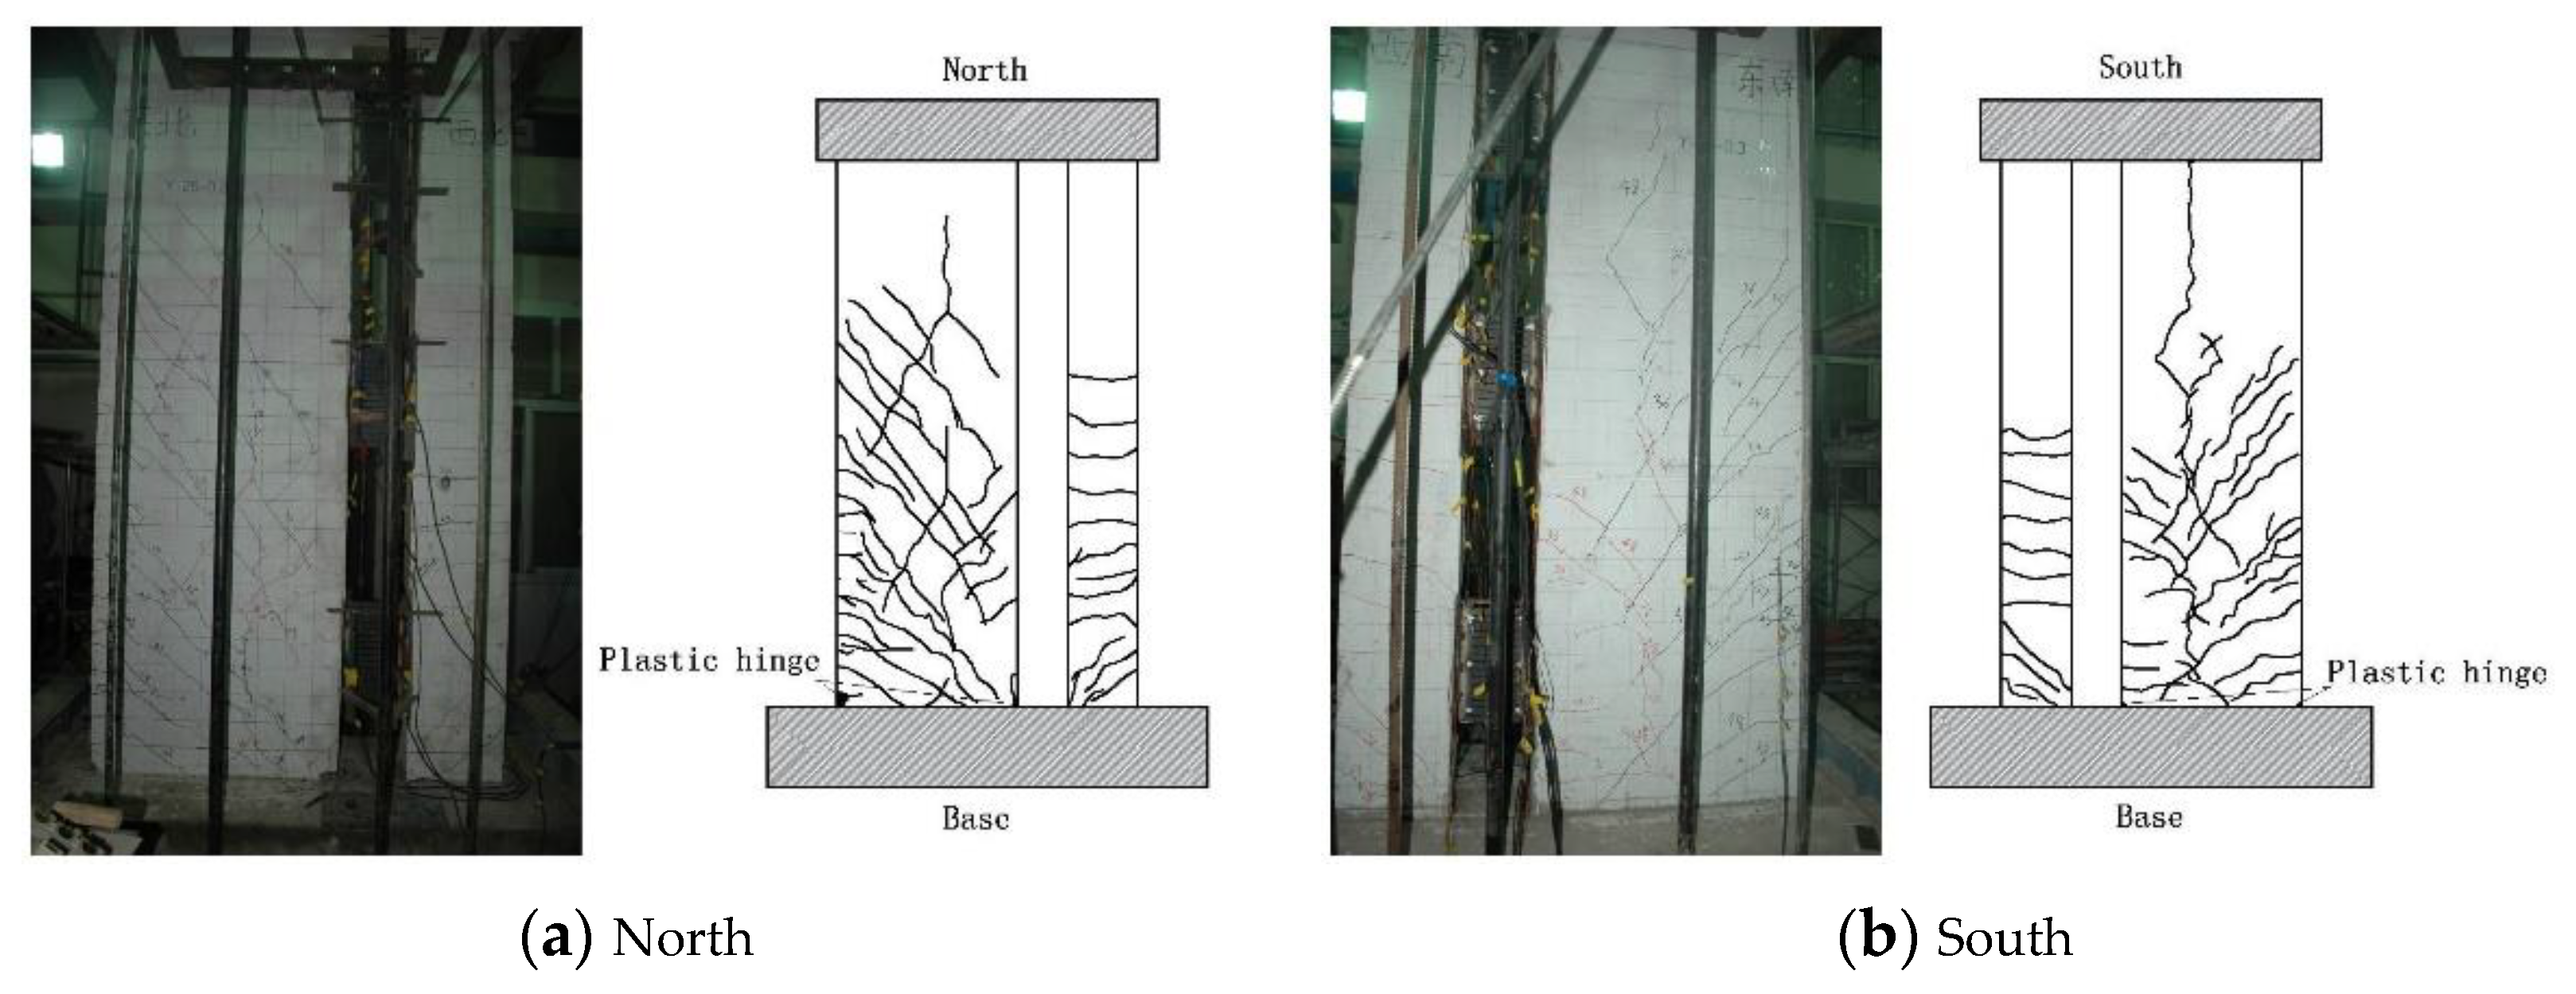
Figure 8.
Failure model of specimen T-0.1.
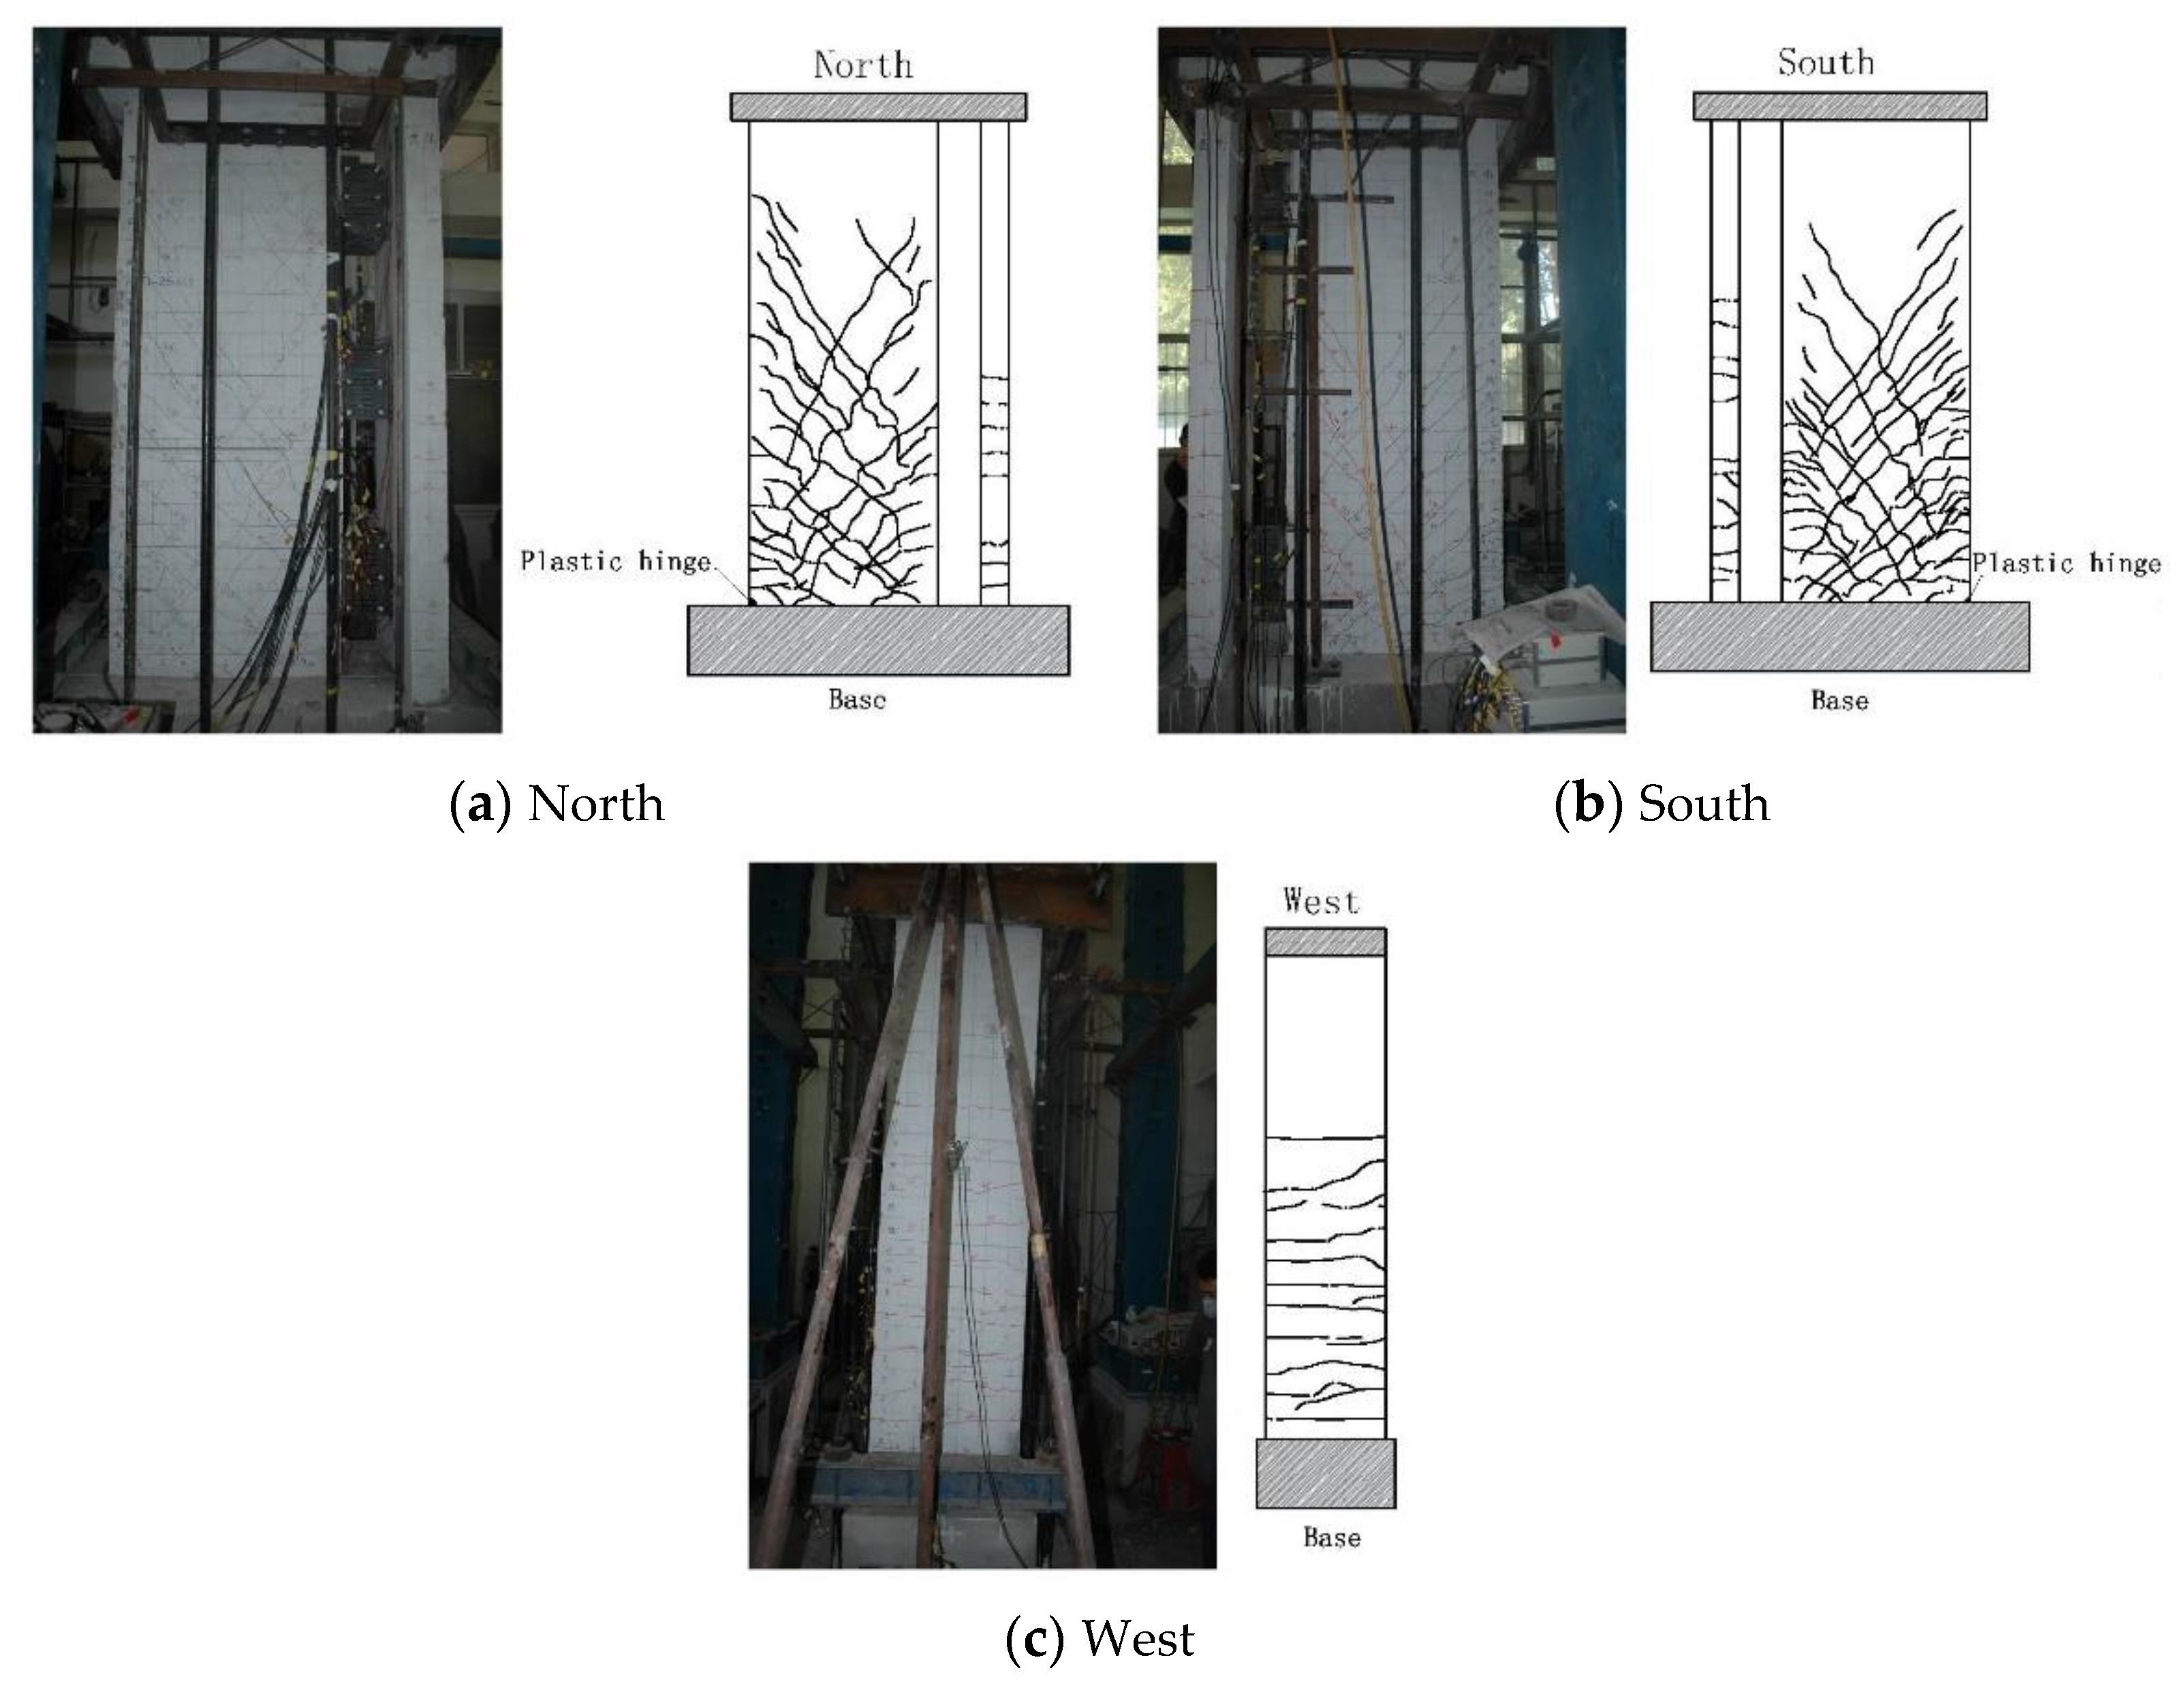
Figure 9.
Failure model of specimen T-0.3.

Figure 10.
Failure model of specimen L-0.1.

Figure 11.
Failure model of specimen L-0.3.

Figure 12.
Hysteretic curve.
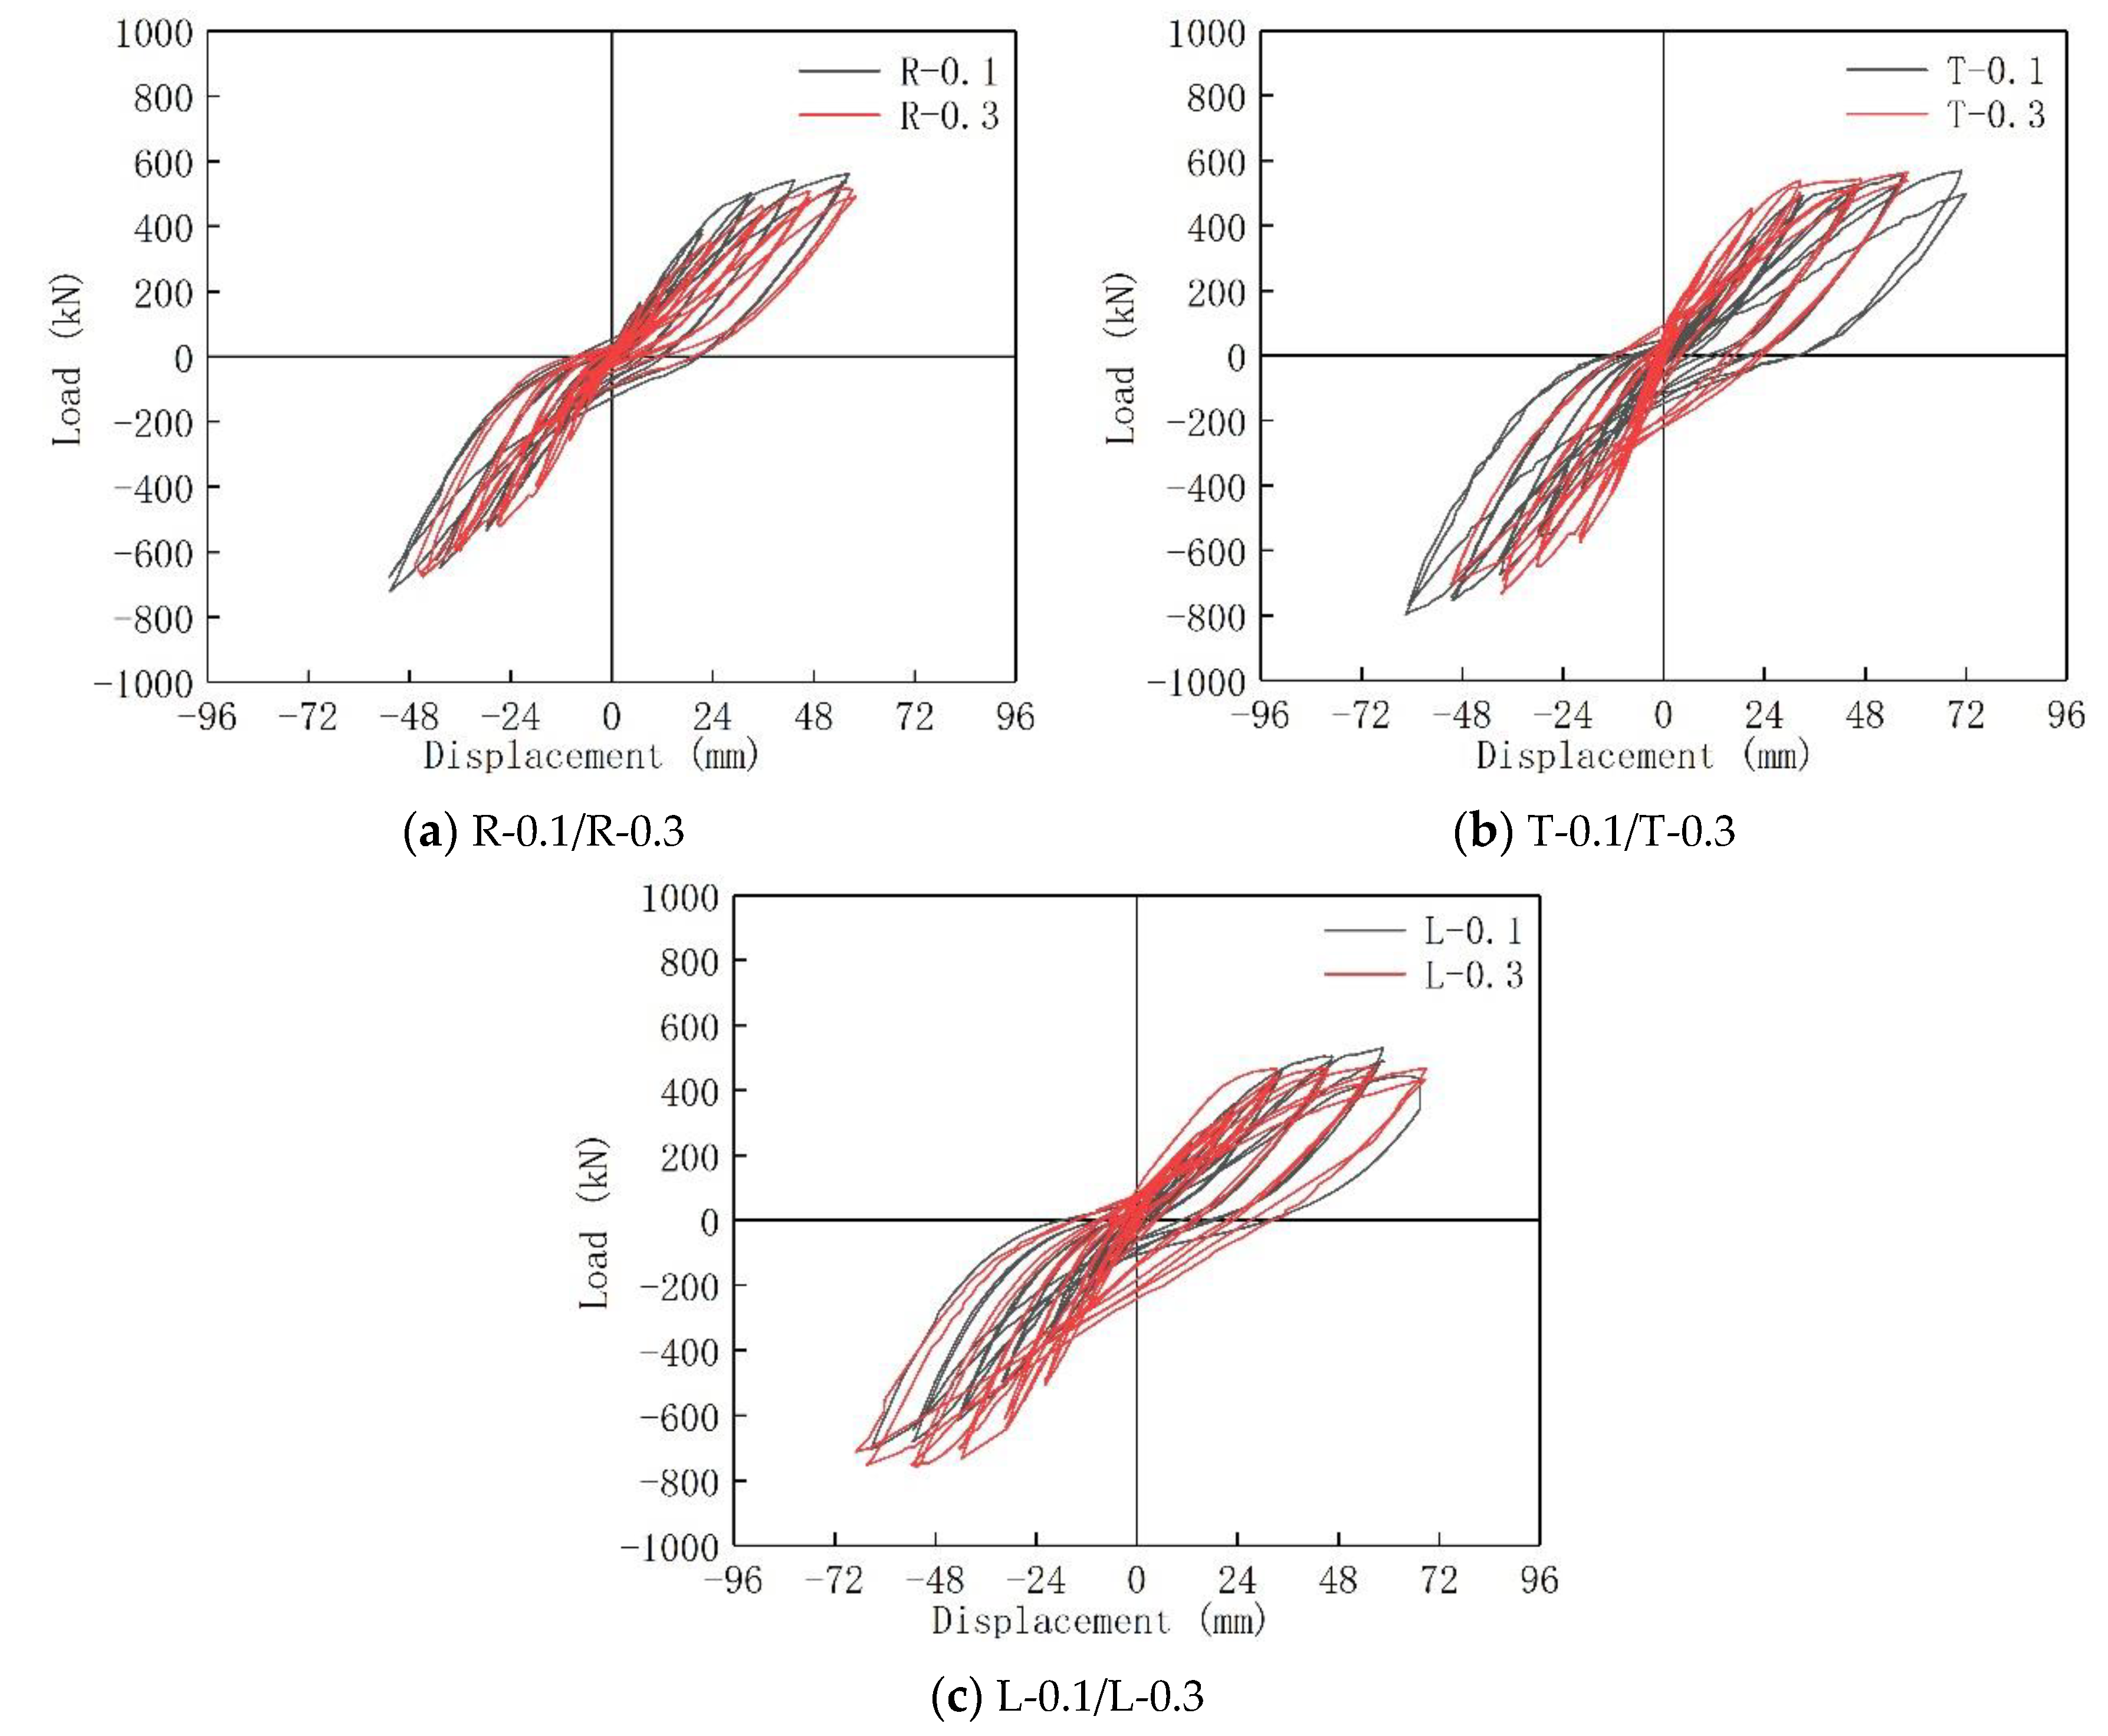
Figure 13.
Stiffness degradation curve.
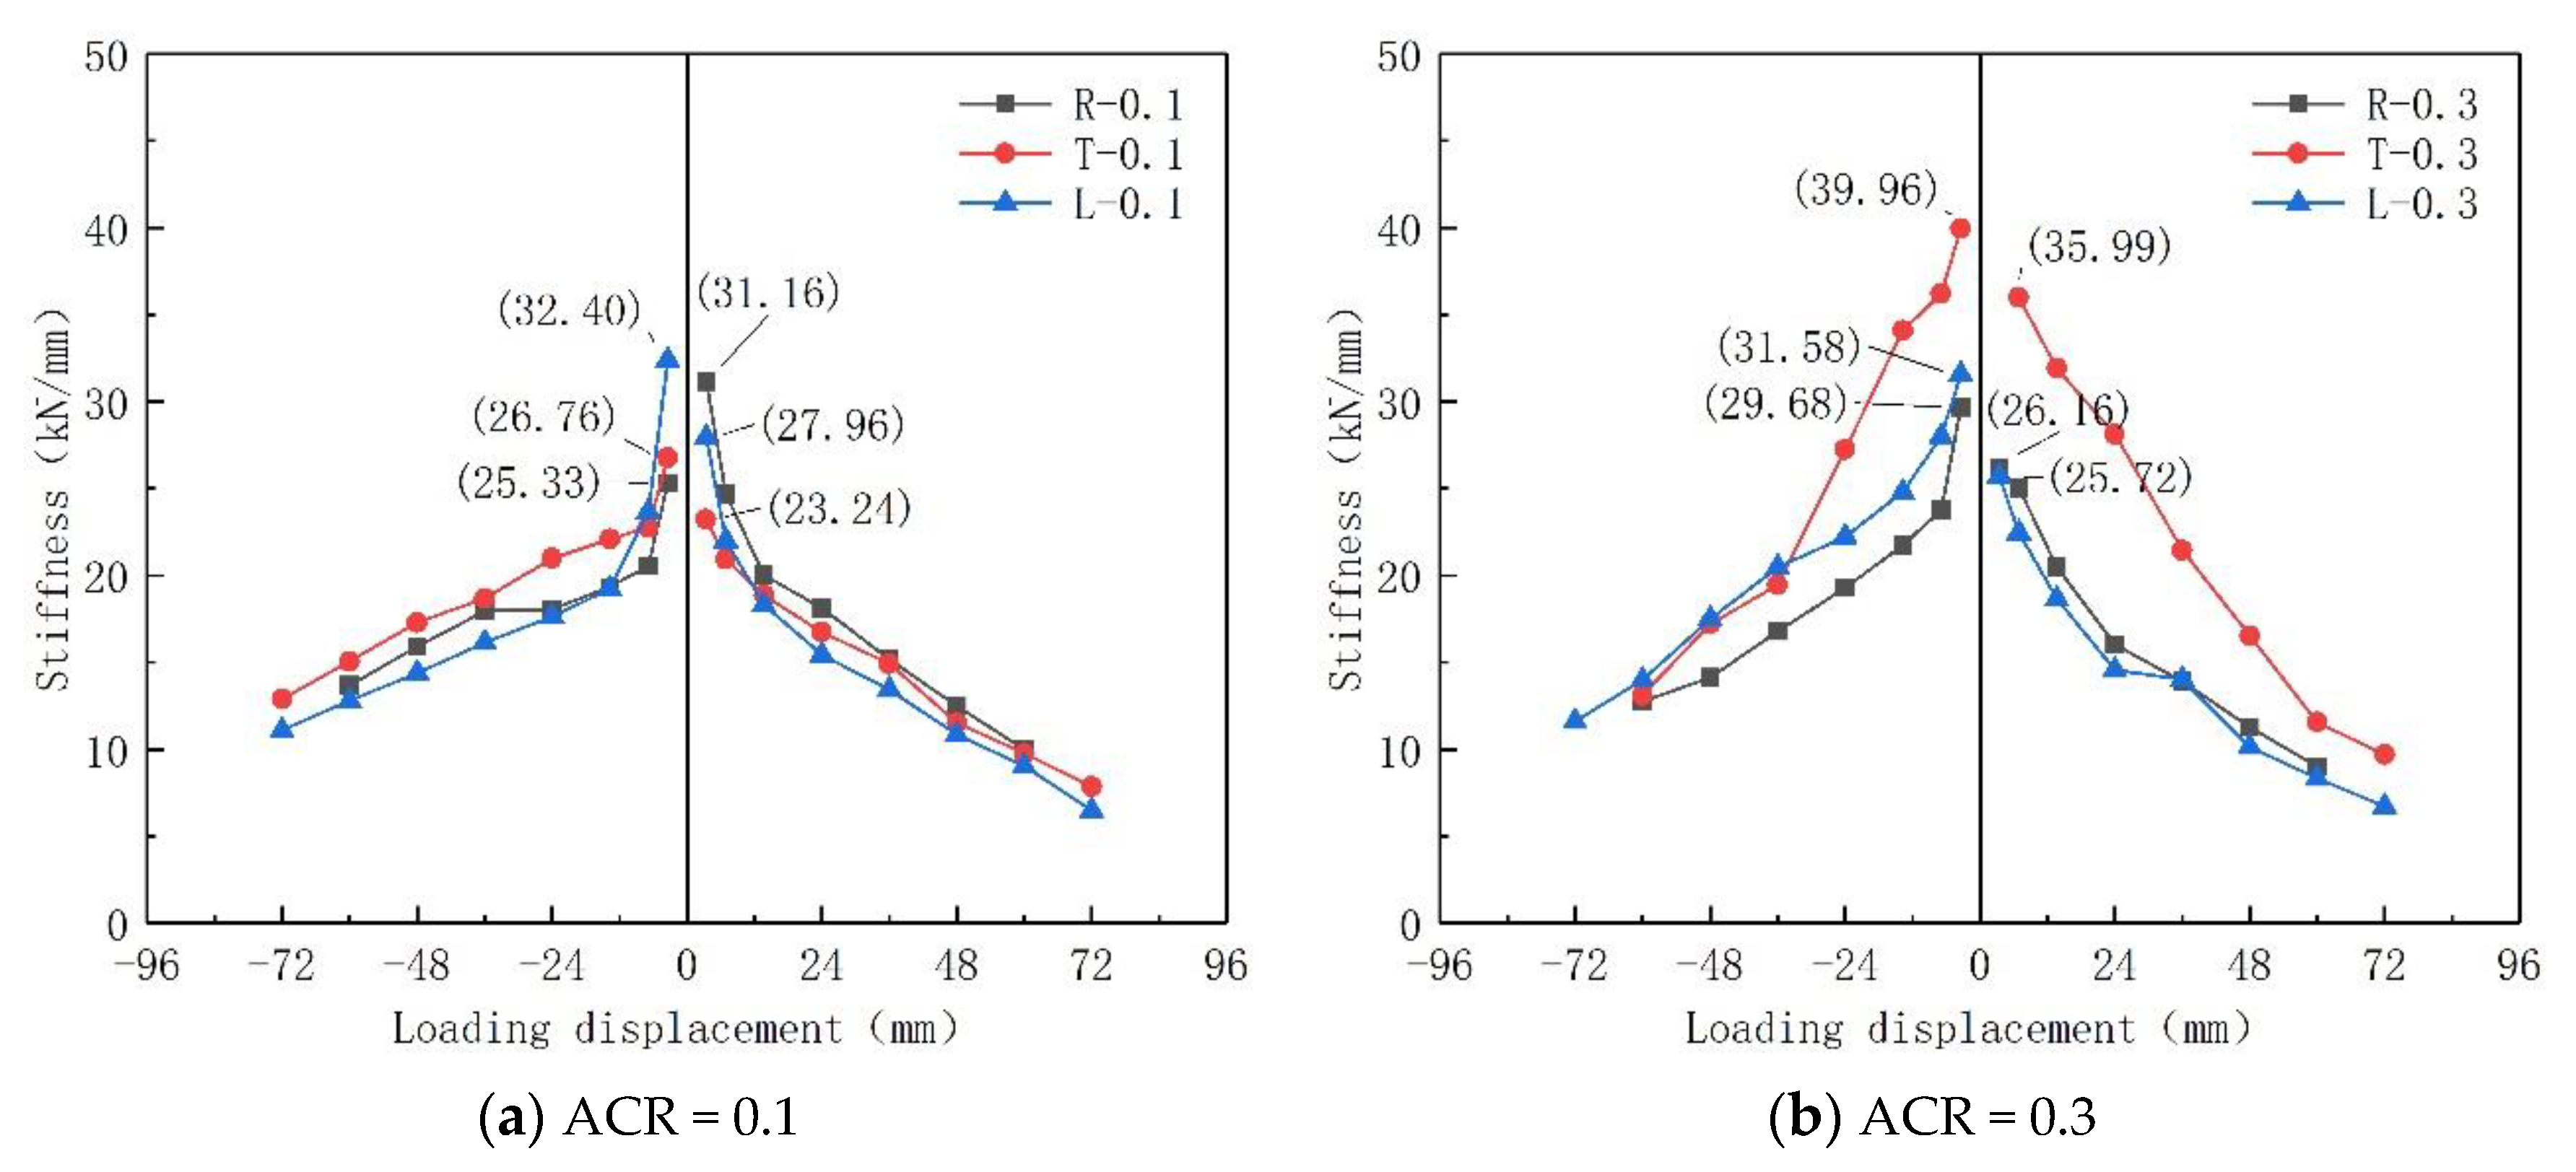
Figure 14.
Relative displacement of dampers.
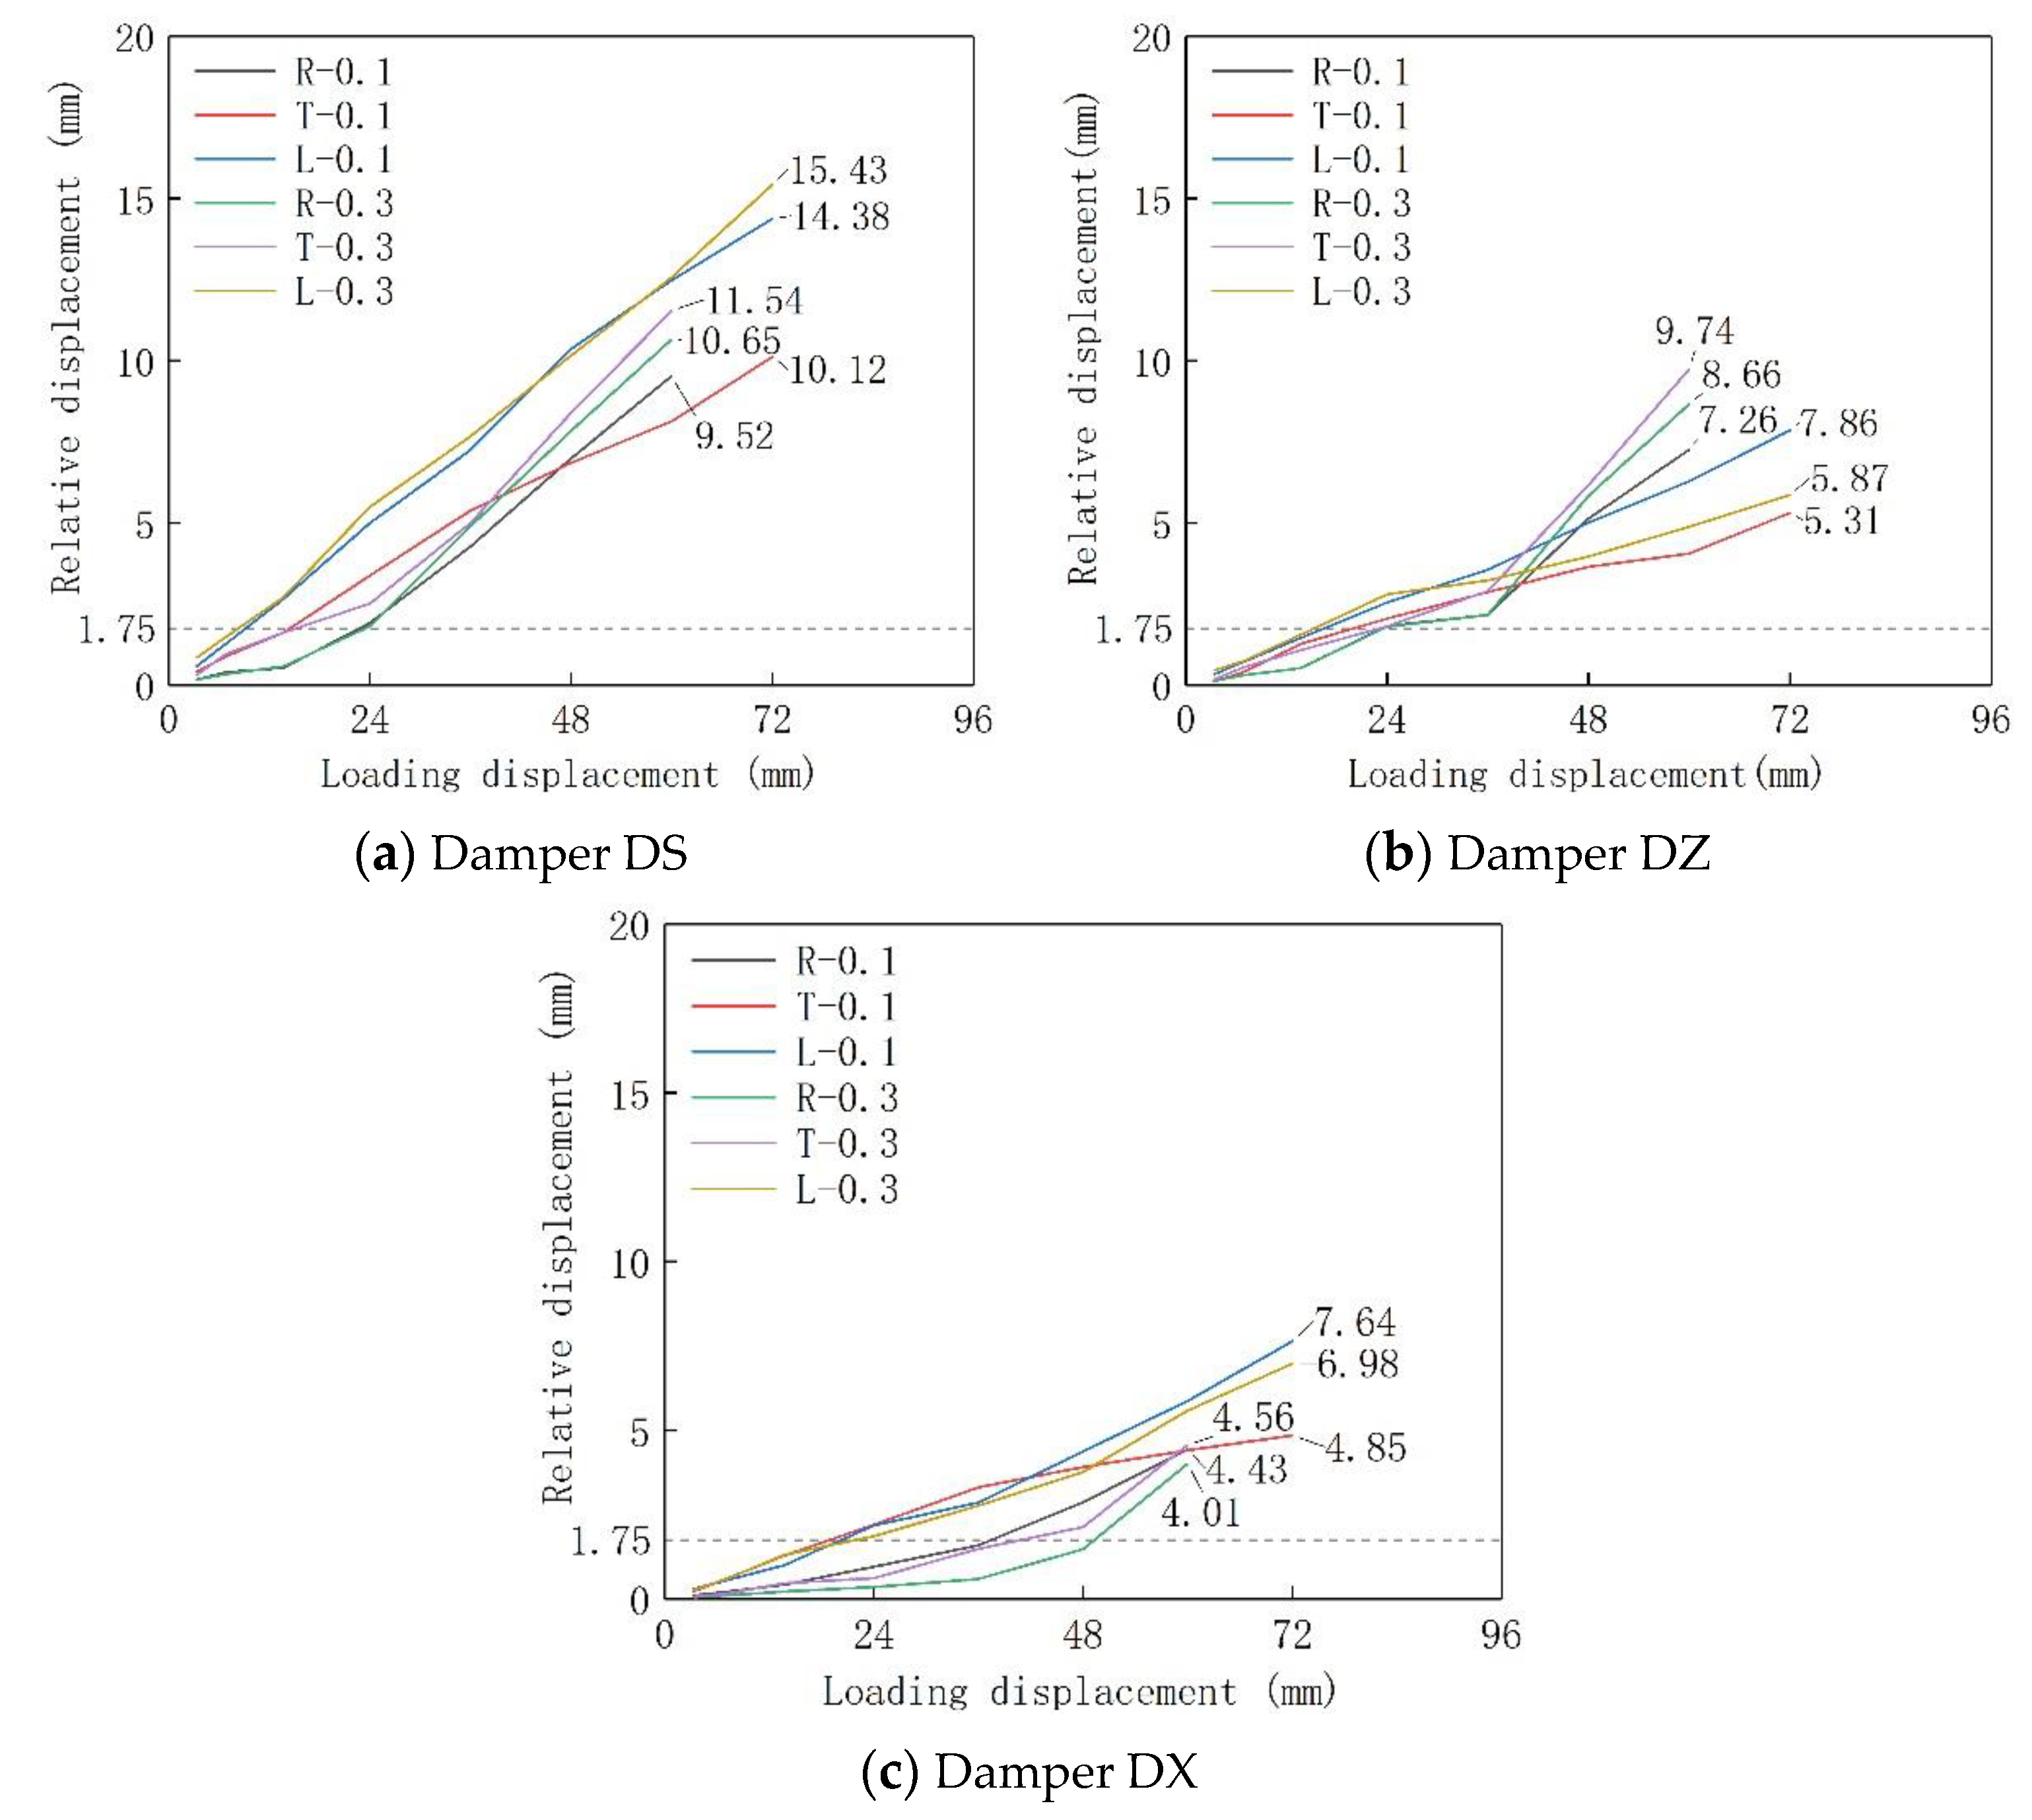
Figure 15.
Strain of section.

Figure 16.
Model of precast shear wall.

Figure 17.
Calculating diagram of large eccentric compression.

Figure 18.
Calculating diagram of large eccentricity tension.


Table 1.
Shear wall specimens.
| Specimens | Number | Concrete | Vertical Slit Width/mm | ACR |
|---|---|---|---|---|
| Rectangle | R-0.1 | C40 | 250 | 0.1 |
| R-0.3 | C40 | 250 | 0.3 | |
| T-shape | T-0.1 | C40 | 250 | 0.1 |
| T-0.3 | C40 | 250 | 0.3 | |
| L-shape | L-0.1 | C40 | 250 | 0.1 |
| L-0.3 | C40 | 250 | 0.3 |
Table 2.
Parameters of dampers.
| Yield Load | Yield Displacement | Ultimate Load | Ultimate Displacement | Initial Stiffness |
|---|---|---|---|---|
| 55.76 | 1.75 | 94.72 | 20.19 | 31.86 |
Table 3.
Properties of reinforcement.
| Diameter | Yield Stress | Ultimate Stress | Yield Strength ratio |
|---|---|---|---|
| 10 | 473 | 696 | 1.47 |
| 25 | 465 | 658 | 1.42 |
Table 4.
Properties of concrete.
| Concrete | ||
|---|---|---|
| C40 | 41.8 | 27.96 |
Table 5.
Loading protocol.
| Number | Displacement Angle | Loading Displacement/mm | Cycle-Index | Time/s |
|---|---|---|---|---|
| 1 | 1/840 (0.12 θp) | 3.4 | 2 | 6.8 × 8 = 54.4 |
| 2 | 2/840 (0.25 θp) | 6.9 | 2 | 13.8 × 8 = 110.4 |
| 3 | 4/840 (0.5 θp) | 13.7 | 2 | 27.4 × 8 = 219.2 |
| 4 | 7/840 (θp) | 24 | 2 | 48 × 8 = 384 |
| 5 | 10.5/840 (1.5 θp) | 36 | 2 | 72 × 8 = 576 |
| 6 | 14/840 (2 θp) | 48 | 2 | 96 × 8 = 768 |
| 7 | 17.5/840 (2.5 θp) | 60 | 2 | 120 × 8 = 960 |
| 8 | 21/840 (3 θp) | 72 | 2 | 144 × 8 = 1152 |
Table 6.
Bearing capacity, displacement, and ductility coefficient of specimens.
| Number | Cracking Load /kN | Cracking Displacement | Yield Load /kN | Yield Displacement | Peak Load | Peak Displacement | Ductility Factor μ | ||||
|---|---|---|---|---|---|---|---|---|---|---|---|
| R-0.1 | + | 166.81 | 6.74 | 1/427 | 328.07 | 17.36 | 1/166 | 562.58 | 56.34 | 1/51 | 3.25 |
| − | 132.74 | 6.20 | 1/465 | 338.50 | 18.46 | 1/156 | 720.57 | 52.65 | 1/55 | 2.85 | |
| R-0.3 | + | 168.09 | 8.33 | 1/347 | 273.93 | 17.02 | 1/169 | 514.85 | 58.06 | 1/50 | 3.41 |
| − | 133.90 | 6.73 | 1/428 | 421.25 | 18.26 | 1/158 | 679.39 | 54.47 | 1/53 | 2.98 | |
| T-0.1 | + | 173.90 | 6.83 | 1/422 | 380.39 | 19.89 | 1/145 | 568.45 | 70.92 | 1/41 | 3.56 |
| − | 207.73 | 9.16 | 1/314 | 455.03 | 21.46 | 1/134 | 798.07 | 61.49 | 1/47 | 2.87 | |
| T-0.3 | + | 216.96 | 6.87 | 1/419 | 414.76 | 17.88 | 1/161 | 563.70 | 58.08 | 1/50 | 3.25 |
| − | 349.20 | 9.06 | 1/318 | 538.98 | 18.21 | 1/158 | 735.74 | 50.80 | 1/57 | 2.79 | |
| L-0.1 | + | 159.71 | 6.97 | 1/413 | 320.48 | 19.87 | 1/145 | 529.93 | 58.65 | 1/49 | 2.95 |
| − | 151.87 | 7.45 | 1/387 | 355.30 | 20.06 | 1/144 | 702.47 | 63.34 | 1/45 | 3.16 | |
| L-0.3 | + | 199.96 | 9.95 | 1/289 | 396.54 | 19.03 | 1/151 | 473.13 | 68.92 | 1/42 | 3.62 |
| − | 263.52 | 10.59 | 1/272 | 457.57 | 19.46 | 1/148 | 758.28 | 64.40 | 1/45 | 3.31 | |
Table 7.
Relative displacement of damper DS.
| Displacement Angle | Relative Displacement of Dampers/mm | |||||
|---|---|---|---|---|---|---|
| R-0.1 | T-0.1 | L-0.1 | R-0.3 | T-0.3 | L-0.3 | |
| 0.12 θp | 0.17 | 0.43 | 0.59 | 0.17 | 0.32 | 0.85 |
| 0.25 θp | 0.40 | 0.89 | 1.28 | 0.34 | 0.96 | 1.50 |
| 0.5 θp | 0.53 | 1.63 | 2.66 | 0.58 | 1.62 | 2.71 |
| 1.0 θp | 1.91 | 3.37 | 4.99 | 1.81 | 2.51 | 5.49 |
| 1.5 θp | 4.27 | 5.38 | 7.24 | 4.89 | 4.99 | 7.67 |
| 2.0 θp | 6.99 | 6.85 | 10.37 | 7.84 | 8.39 | 10.15 |
| 2.5 θp | 9.52 | 8.13 | 12.48 | 10.65 | 11.54 | 12.57 |
| 3.0 θp | — | 10.12 | 14.38 | — | — | 15.43 |
Table 8.
Relative displacement of damper DZ.
| Displacement Angle | Relative Displacement of Dampers/mm | |||||
|---|---|---|---|---|---|---|
| R-0.1 | T-0.1 | L-0.1 | R-0.3 | T-0.3 | L-0.3 | |
| 0.12 θp | 0.13 | 0.12 | 0.33 | 0.13 | 0.17 | 0.46 |
| 0.25 θp | 0.31 | 0.40 | 0.72 | 0.31 | 0.55 | 0.74 |
| 0.5 θp | 0.53 | 1.27 | 1.45 | 0.52 | 1.07 | 1.55 |
| 1.0 θp | 1.83 | 2.05 | 2.55 | 1.80 | 1.81 | 2.80 |
| 1.5 θp | 2.17 | 2.87 | 3.56 | 2.17 | 2.90 | 3.22 |
| 2.0 θp | 5.13 | 3.64 | 5.01 | 5.83 | 6.16 | 3.96 |
| 2.5 θp | 7.26 | 4.06 | 6.28 | 8.66 | 9.74 | 4.88 |
| 3.0 θp | — | 5.31 | 7.86 | — | — | 5.87 |
Table 9.
Relative displacement of damper DX.
| Displacement Angle | Relative Displacement of Dampers/mm | |||||
|---|---|---|---|---|---|---|
| R-0.1 | T-0.1 | L-0.1 | R-0.3 | T-0.3 | L-0.3 | |
| 0.12 θp | 0.10 | 0.22 | 0.29 | 0.04 | 0.07 | 0.28 |
| 0.25 θp | 0.21 | 0.58 | 0.53 | 0.10 | 0.15 | 0.57 |
| 0.5 θp | 0.42 | 1.28 | 0.99 | 0.22 | 0.47 | 1.30 |
| 1.0 θp | 0.95 | 2.20 | 2.18 | 0.35 | 0.61 | 1.85 |
| 1.5 θp | 1.59 | 3.31 | 2.86 | 0.59 | 1.49 | 2.76 |
| 2.0 θp | 2.87 | 3.91 | 4.37 | 1.47 | 2.13 | 3.76 |
| 2.5 θp | 4.43 | 4.41 | 5.86 | 4.01 | 4.56 | 5.58 |
| 3.0 θp | — | 4.85 | 7.64 | — | — | 6.98 |
Table 10.
Calculation of normal section of precast shear wall specimens.
| Number | Test Results/kN | Calculation Results/kN | Test Results/Calculation Results | |||
|---|---|---|---|---|---|---|
| + | − | + | − | + | − | |
| R-0.1 | 562.58 | 720.57 | 519 | 626 | 0.92 | 0.87 |
| R-0.3 | 514.85 | 679.39 | 668 | 811 | 1.30 | 1.19 |
| T-0.1 | 568.45 | 798.07 | 581 | 732 | 1.02 | 0.92 |
| T-0.3 | 563.70 | 735.74 | 779 | 947 | 1.38 | 1.28 |
| L-0.1 | 529.93 | 702.47 | 550 | 698 | 1.04 | 0.99 |
| L-0.3 | 473.13 | 758.28 | 772 | 940 | 1.63 | 1.24 |
Publisher’s Note: MDPI stays neutral with regard to jurisdictional claims in published maps and institutional affiliations. |
© 2022 by the authors. Licensee MDPI, Basel, Switzerland. This article is an open access article distributed under the terms and conditions of the Creative Commons Attribution (CC BY) license (https://creativecommons.org/licenses/by/4.0/).
Share and Cite
MDPI and ACS Style
Wang, Y.; Wang, Z.; Zhou, Y.; Yang, Z.; Zhang, Y. Test and Bearing Capacity Calculation of a New Energy-Dissipated Precast Shear Wall. Buildings 2022, 12, 1990. https://doi.org/10.3390/buildings12111990
AMA Style
Wang Y, Wang Z, Zhou Y, Yang Z, Zhang Y. Test and Bearing Capacity Calculation of a New Energy-Dissipated Precast Shear Wall. Buildings. 2022; 12(11):1990. https://doi.org/10.3390/buildings12111990
Chicago/Turabian StyleWang, Yuliang, Zhaohui Wang, Yunlong Zhou, Zhinian Yang, and Yumin Zhang. 2022. "Test and Bearing Capacity Calculation of a New Energy-Dissipated Precast Shear Wall" Buildings 12, no. 11: 1990. https://doi.org/10.3390/buildings12111990
Note that from the first issue of 2016, this journal uses article numbers instead of page numbers. See further details here.