
The Potential of Structurally Insulated Panels (SIPs) to Supply Net Zero Carbon Housing

1
School of Architecture, University of Liverpool, Liverpool L69 3BX, UK
2
Business School, University of Nottingham, Nottingham NG7 2RD, UK
*
Author to whom correspondence should be addressed.
Buildings 2022, 12(12), 2081; https://doi.org/10.3390/buildings12122081
Submission received: 20 August 2022
/
Revised: 17 October 2022
/
Accepted: 24 November 2022
/
Published: 28 November 2022
(This article belongs to the Special Issue Sustainability and Energy Efficiency in Smart Cities and Construction)
Abstract
:Governments throughout the EU and the UK face a persistent challenge of satisfying the continual growth in demand for housing and create zero carbon buildings. This paper presents a novel conceptual framework and empirical results to evaluate the potential for Structurally Insulated Panels (SIPs) to address this challenge. Firstly, we present a comprehensive analysis of the energy performance of a SIPs building in the UK to evaluate the potential for such technologies to satisfy the energy and carbon objectives. Using our unique data set we show that SIPs can exceed the necessary energy efficiency standards and reach Net Zero Carbon. Secondly, we introduce game theory as a novel conceptual framework to understand the incentives of the manufacturers of SIPs and UK/EU authorities. This enables us to identify potential sources of incentive conflict, which inhibit the diffusion of such technologies. We demonstrate that it benefits both parties to engage in medium investment, but the inferior under investment scenario can emerge if the UK/EU does not provide leadership and commitment to SIPs technologies. Regardless of the market design in terms of the timing of decisions, the maximum level of support by both the UK/EU and the SIPs manufacturers cannot be achieved.
1. Introduction
Global warming, caused by the combustion of fossil fuels that lead to high levels of carbon dioxide and their equivalent greenhouse gases (CO2e), remains a persistent concern to governments worldwide. In particular, building and construction account for approximately 36% of final energy use and 40% of energy related CO2e emissions globally, motivating governments to reduce these emissions from all buildings wherever possible. Addressing this challenge is particularly difficult for the housing sector across the European Union (EU) due to the vast stock of existing inefficient housing and growing demand for new, affordable housing. For example, each year the UK, Ireland, Finland, Spain and Sweden require 300,000, 50,000, 38,000, 150,000 and 100,000 new homes, respectively [1]. This creates a conflict as traditional construction techniques cannot simultaneously deliver the number of new homes necessary and the required CO2e reductions.
The European 2050 roadmap outlines the requirement to deliver the necessary housing and reduce energy use, and therefore CO2e emissions, by at least 80% by 2050 compared to 1990 levels [1]. A report published by the University of Cambridge Institute for Sustainable Leadership [2] refers to the EU renovation roadmap and the need for deep renovations of existing housing stock. Indeed, three quarters of existing buildings across the EU will remain in 2050. The report and roadmap also point to the fact that for the EU to meet its climate reduction goals, approximately 250 million homes will need energy renovation. Equivalent to 23,000 homes renovated every day until 2050. The real prize in achieving zero energy housing in the UK and the EU is clearly through retrofit and there are already a very large number of retrofit projects underway as part of the EU Build Up programme, including but not limited to ALiance for Deep RENovation in Buildings (ALDREN), Nearly Zero Energy Renovation (NeZeR), Horizon 2020 Build Upon, Building Energy Efficiency for Massive market Uptake (Beem-UP), Collaboration for Housing Nearly Zero-Energy Renovation (COHERENO), Robust and Reliable technology concepts and business models for triggering deep Renovation of Residential buildings in EU (4RinEU), Transition Zero, iBRoad and Interreg ACE retrofitting.
The main EU policy to achieve zero energy and therefore zero carbon housing is the Energy Performance of Buildings Directive (EPBD) (Directive 2018/844) which seeks to increase the rate and quality of renovation and it stipulates that all new buildings across Europe are required to be nearly Zero Energy Buildings (nZEB) by 2021 and Net Zero Carbon (NZC) by 2050. It should be noted that this paper is focused only on new build and is not considered relevant for retrofit or refurbishment. Moreover, the paper will not consider the more innovative use of Building Renovation Passports (BRPs) as a means to achieve deep renovation of a building over its lifetime use.
A nZEB is defined as a building with very high energy performance with any energy that is required produced from a renewable source. To achieve nZEB, the building must not exceed a particular energy consumption, per unit area, per year (kWh/m2/year). A Net Zero Caron (NZC) building is one that can deliver all of its energy needs from zero carbon sources. Designing to Passivhaus standards provides one method of achieving nZEB/NZC. Passivhaus can be achieved using traditional construction methods however, the perceived increased initial capital costs, complexity in design, inexperience in construction techniques and unfamiliarity are prohibitive factors [3,4,5,6,7].
The Passivhaus technique can also be applied to non-standard or Modern Methods of Construction (MMC), powered by renewable energy such as Solar Photovoltaics (PV) in order to achieve nZEB/NZC [8]. However, despite the potential of MMC to simultaneously address concerns regarding emissions and housing demand, uptake of MMC has been relatively poor. Furthermore, surprisingly little research has been conducted to evaluate the merits of MMC or the implications for government policy in this area.
To what extent can MMC remedy the tension between delivering truly energy efficient housing and addressing the housing shortage? How can policy-makers cultivate an appropriate market environment and incentive structure to support the adoption of MMC? The contribution of this inter-disciplinary article is to address these important open questions. Our inquiry is motivated by three observations. First, the growing pressure on governments to address the housing shortage and create sustainable cities [9,10]. Second, the increasing call for research evaluating the merits of MMC. For example, [11] place emphasis on the fact that there is very little information available on the operation performance of MMC, yet this information is crucial in determining whether or not they can achieve nZEB/NZC standards. Third, the increasing policy focus on inefficient housing as a source of energy inefficiency.
The contribution of this paper can be decomposed into two complementary components. Firstly, this paper presents, to the best of our knowledge, the only data set of the real-world energy performance of a newly constructed Magnesium oxide (MgO) SIPs property, powered by 100% electricity. Therefore, our empirical contribution is to objectively evaluate whether SIPs; (a) can meet nZEB/NZC standards, (b) can, if supported by the UK and EU, help deliver nZEB/NZC buildings and achieve the energy reduction targets necessary on a UK and European scale.
Secondly, our theoretical contribution is to develop a game theoretic model that provides a first step in formally analysing the interaction between the manufacturers of SIPs, and a regulatory regime set by authorities, focusing on the case of the UK and EU. This draws on tools developed primarily in Economics. By developing an explicit set of guiding principles, we are able to model the incentives of UK/EU policy-makers and SIPs manufacturers in an unambiguous and tractable way. More specifically, we study the choice between low, medium and high support/investment from each party to such technologies. This enables us to understand the incentive tensions between these two parties and outline the optimal regulatory regime to support energy efficient home building. Moreover, combined with our empirical analysis, we are able to provide a complete picture of the potential for SIPs to address both energy emission objectives and housing demand, whilst outlining specific lessons for policy-makers.
At this point, it is helpful to emphasise the advantages of using Game Theory in this context. Firstly, game theory provides a tractable and unambiguous method of formally modelling the incentives of different parties. Secondly, the theoretical model enables us to zoom in on specific tensions faced by policy-makers and understand the consequences of alternative policies. The advantages of game theory in this context are evidenced by its increasing application to study home energy management [12,13,14], home energy storage [15,16], energy demand [17,18], spatial planning [19], land and property development processes [20] and green roofs [21].
Our empirical analysis shows that SIPs construction, can create an airtight building with exceptional performance properties, which is capable of achieving nZEB/NZC status across all EU member states and the UK if the property is powered from renewable energy sources. Furthermore, such construction methods can offer a significantly faster method of delivering the necessary increases in housing supply than traditional construction methods.
Given the demonstrated potential for SIPs, our game theoretic analysis explores the investment and support incentives of manufacturers and authorities. When the UK/EU and SIPs manufacturer make their commitment decisions with regard to SIPs simultaneously, it benefits both parties to engage in medium investment, rather than low investment; (b) if either party can act as a leader in this market and credibly commit to medium investment/support, both parties are better off and (c) regardless of the market design in terms of the timing of decisions, the maximum level of investment/support by both the UK/EU and the SIPs manufacturer cannot be achieved.
Positioning these results within the wider literature, there are three potential dimensions of incentive conflict that are relevant for this marketplace. Firstly, UK and EU member states may disagree regarding the level of support to provide to manufacturers and this problem has been extensively studied from a political economy perspective. Secondly, there exists competition between manufacturers to invest and supply such products and this interaction has been extensively studied. Thirdly, there exists incentive alignment and conflict between the manufacturer and government authorities. This issue has been studied in less detail within the literature and this is the gap that our paper addresses. By focusing exclusively on one of these three complex relationships, we isolate important results that we believe will survive in further analyses that incorporate such additional dimensions of political economy and market competition.
The paper is structured as follows. Section 2 outlines our formal research methodology and Section 3 discusses data collection. In Section 4 we analyse the results to establish the merits of nZEB/NZC and present a game theoretical framework to explore how UK/EU regulatory policy should be tailored to the incentives of SIPs manufacturers. Finally, we provide guidance for future policy in this area and conclude in Section 5.
2. Research Methodology
Motivated by (a) determining whether or not SIPs homes can achieve nZEB/NZC and (b) what role they could play in assisting the EU in meeting its housing requirements and demanding energy efficiency standards, this study develops a mixed method approach that combines both quantitative and qualitative techniques. This includes the creation and analysis of a unique empirical data set from primary and secondary sources. The overall research methodology is summarised in Figure 1.
Data collection involves three stages. Firstly, a case study is considered and a method of collecting energy data is established. Secondly, 12 months of energy data (kWh) is analysed and the potential for renewable technology is evaluated. Thirdly, these data are supported by an occupant survey.
3. Data Collection
3.1. Case Study Selection and Justification
In selecting a case study for this research project, a number of non-standard or Modern Methods of Construction (MMC) types were considered. During that investigation a particular prototype SIPs system was found that used Magnesium Oxide (MgO) boards in replacement of the traditional Oriented Strand Board (OSB). This new material claimed to have superior thermal performance properties in comparison to other MMC and SIPs systems. The Dragon Intelligent Panel (DIP) system was first tested at the Building Research Establishment (BRE) in 2010 and through the UK and EU there are no examples of “real world” houses built using this specific MgO system. It is for this reason that this building was selected for this study. To become a world first in testing the real-world performance of the DIP system in an urban environment and determining what role this specific and unique type of construction has to support the UK Governments ambition to build Net Zero Carbon housing.
3.2. Case Study
A two-storey DIPs building, (see Figure 2), built in 2016 in Heswall (UK) provides an ideal case study for this paper due to the availability of information, new project innovation and active participation of the owners. In addition to SIPs, concrete, steel, glass, aluminum, insulation, glulam and uPVC where used. The ground floor consists of an office, utility room and open plan kitchen and family room. The first floor consists of a bathroom and one large bedroom, see Figure 3. The total Gross Floor Area (GFA) is 92 m2. SIPs panels form all of the supporting exterior walls (150 mm) with a plastered interior and a cladded exterior. SIPs internal floors (100 mm) and a NU-LOK roofing system has been used; with double and triple glazed aluminum and uPVC framed windows and doors. The foundations consisted of reinforcement steel (220 kg), glass wool insulation (60 m2) and ready-mix concrete (9 m2 × 200 mm). The DIPs panels achieve a Grade A EPC rating, with U-Values of <0.10 (W/m2K).
3.2.1. Power
The house is powered by 100% grid connected electricity with no gas supply. The electricity powers all Mechanical and Electrical (M&E) systems inclusive of plug loads, appliances, lighting, thermal storage heating, an immersion heater, an Air Source Heat Pump (ASHP) and a Mechanical Ventilation with Heat Recovery (MVHR) system, external CCTV cameras and WiFi. No renewable solar, thermal energy technologies or battery storage systems are currently in place.
3.2.2. Space Heating, Ventilation, Cooling and Hot Water
Space heating and hot water is provided via a 300 L Daikin EKHWP300B hot water storage tank (thermal store) fitted with a 3 kW electric immersion heater. Hot water from the thermal store is pumped, through ductwork, to a post heater which in turn creates hot air which is circulated to each room of the house. The thermal store system also provides direct hot water for the bathroom and kitchen. In addition to the thermal store, an MVHR system is used to provide fresh air, extract stale air (whilst recovering heat) and interact with the post heater.
A secondary supply of space heating and cooling is provided through a separate Mitsubishi Ecodan ASHP, located on the ground floor. This system acts independently of the thermal store and MVHR and is used by the occupants to provide extra heating and cooling if and when required. Figure 4 shows a schematic of the house with the arrows representing the direction of air flow and/or heating throughout the building.
3.2.3. Occupants and Lifestyle
A number of studies have shown that occupant behaviour exerts a strong influence on the energy use of a building [22,23,24,25]. In particular [23] noted that the amount of energy used is caused by (a) the quality of the construction (b) the efficiency of the M&E systems and (c) the actual use of home amenities. In a paper by [26], they also categorised behavioural patterns into five factors from use of appliances and spaces through to temperature comfort. Concluding that there are principally five types of behavioural patterns. Each will have a different profile of energy use.
3.3. Energy Use
The total energy use (kWh) for the SIPs house has been calculated for 2020 via the placement of an Engage energy sensor. Unfortunately, the energy sensor only measures the total amount of electricity used by the home. There is no disaggregation of the data as it is not possible to sub meter all electrical consuming elements in the house. As a proxy measure, Equation (A1) (see Appendix A) was derived to infer energy use and create a disaggregated dataset.
3.4. Occupant Survey
In order to estimate the energy use (kWh) by appliance for the SIPs home it was necessary to follow Equation (A1) and list the devices present in the home, obtain the power rating for each device (watts), interview the occupants to determine the number of hours that each device was in use per day (h) and calculate the total number of devices. For this survey we interviewed the homeowners and discussed how they typically use energy within the home. For example, we asked questions on how often (hours per day) that they would use a particular appliance. Most importantly we wanted to ascertain how frequently they would use the thermal store (immersion) and Air Source Heat Pump (ASHP). With this information, it was then possible to determine energy use (kWh) per day and estimate for each week/month and year assuming that the operational behaviours remain consistent.
Consultation with the occupants has revealed that the way in which they use the property does in fact remain relatively consistent. In that they have regular patterns of behaviour from showering to cooking, working and sleeping. They will clearly use more energy in the winter than the summer for space heating and as a result the operating hours of equipment through the seasons will change to meet this demand. Due to the fact that the property is extremely well insulated and airtight, the amount of additional energy required in the winter is relatively small. With 7572 kWh recorded on the utility bill and 7489 kWh recorded by the energy sensor.
4. Analysis
4.1. Energy Use
Total energy consumption for 2020 was calculated via the energy sensor and is based on accurate half-hourly measured data. The SIPs house used 7489 kWh of electricity during the 12-month period with a maximum occurring in November (798 kWh) and minimum in December (287 kWh). The reason for this reduction in December was due to the fact that occupants vacating the property during this month. A cross check with the utility bill for 2020 revealed a similar energy use value. The SIPs home in its current configuration and occupancy pattern has a primary energy consumption figure of 122 kWh/m2/year, see Appendix A, which is considerably higher than the UK 2021 nZEB requirement of 44 kWh/m2/year (see Table 1) and a little higher than a recent 2018 EPC assessment of 112 kWh/m2/year. This SAP assessment was carried out using the NHER National Home Energy Rating SAP 2012 Plan Assessor software. Detail of the software are provided in [3]
Should the home have been fully occupied for 12 months, one would expect a slight rise in annual energy use. Interpolating for the reduction of occupancy in December 2019, we have taken the energy use in January 2020 (680 kWh) and assumed that the same amount would have been used in December 2018. With this adjustment, the total energy use for the house would increase to 7882 kWh/year for 2020. This is a more realistic calculation for standard occupancy, since most households do not vacate their properties for December.
As a comparison, the operational energy use of 73 conventional homes across 13 countries was calculated in a paper by [26], who revealed that on average they required 150–400 kWh of energy/m2/year. For an equivalent 92 m2 house the resultant energy demand is therefore 13,800–36,800 kWh/year. This paper serves to highlight the efficiency and reduction in energy required when using a SIPs home. Taking a “fabric first” approach to construction, results in less energy being required for the occupants in comparison to a conventional brick/block construction.
4.2. Renewable Technologies
In order to achieve UK and EU nZEB/NZC status, renewable technologies are required. This particular thermally efficient building, in its current configuration, is unable to achieve the required nZEB/NZC standards. There are a number of options to consider in order to reduce the amount of grid connected electricity required to power, heat and ventilate the SIPs home. One such measure is that of Solar PV (SPV). The NU-LOK roofing system can be replaced with SPV tiles and with an available roof space of 60 m2 an 8.5 kW array could be fitted. Equation (A8) in the renewable technologies section of Appendix A shows a general methodology to calculate energy yield given specific local solar conditions. NU-LOK (a private company specialising in Solar PV design, manufacture and assembly) have completed a detailed SPV energy yield calculation for this home based on a number of critical factors including: The orientation and inclination of the roof; the azimuth compensation factor; area efficiency; solar yield ratio, annual solar radiation and performance ratio. Based on a detailed SPV model, the proposed solar photovoltaic array (SPV) in the Northwest of England could potentially yield approximately 619 kWh of electricity per month with an annual estimate of approximately 7425 kWh (inclusive of summer and winter yields). Given that the SIPs home used 7489 kWh of electricity in 2020, then approximately 99% of the electricity could potentially be derived from renewable solar technology. This is of course a high-level approximation and more detailed and robust actual calculations and models would be necessary. This modelling has not been undertaken in this paper.
Figure 5 shows how this particular SPV configuration would interact with the building. Any solar generated electricity reduces the total primary energy consumption. Total delivered energy for the SIPs home is 7490 kWh. SPV potential generation is ~7425 kWh.
A new primary energy consumption figure with the inclusion of Solar PV can therefore be calculated (assuming no electricity is exported to the national grid and 100% is used within the property; See Equation (A9) in Appendix A).
In this example, primary energy consumption Eprim reduces from 202 kWh/m2/year to ~2 kWh/m2/year with the introduction of SPV to the SIPs home. Clearly the amount of electricity generated from solar would not be consistent per month and one would expect the output to be higher in the summer months and lower in the winter months. If for any reason the Solar PV does not perform as expected and there was, for example, a 15% drop in renewable electricity generation, the resultant Esolar is 31 kWh/m2/year. Even in this highly unlikely situation the SIPs home fitted with SPV is still able to achieve nZEB/NZC status.
Achieving nZEB across the UK and EU Member States
The SIPs house, with SPV, has a theoretical primary energy consumption of ~2 kWh/m2/year. This is low enough to achieve nZEB in the vast majority of EU countries and the UK, see Table 1, as the building sources ~99% of its energy needs from solar. Each country has set a primary energy consumption (Eprim kWh/m2/year) limit (Table 1). Some countries have set tighter energy standards than others and each can decide upon how they achieve nZEB through any construction method of their choosing. It should be noted that countries with varying primary energy factors would clearly yield different results.
In order to achieve a primary energy consumption of 2 kWh/m2/year, a traditional brick/block house would need to have a primary energy generation that exceeds the very latest Passivhaus Premium (≤30 kWh/m2/year) standards. These are more onerous than the Passivhaus plus (≤45 kWh/m2/year) and Passivhaus classic (≤60 kWh/m2/year) standards. This is a considerable challenge given that there are a large number of barriers to achieving nZEB [11,27,28,29,30,31]. The primary barriers have been identified as design and technical, cultural, legislative and financial.
A SIPs home, as analysis in this paper has demonstrated, can achieve exceptional energy standards beyond that of Passivhaus premium without the complications discussed. Admittedly, SIPs system will still be very unfamiliar to the majority of people and there are numerous questions around other factors such as unfamiliarity with construction methods, whole life performance, longevity and appearance but if these barriers could be overcome then SIPs housing has real potential on a mass scale for the EU. That potential at present is small. A report by [32] indicated that less than 10% of UK housing is built using MMC of which SIPs typically represent less than a third. In England, the 2017 Housing White Paper [33] set a target to deliver 250,000 homes a year by 2022 (since extended to 300,000 homes by the mid-2020s). Traditional homes do not meet nZEB/NZC standards, therefore in a post 2021 situation, there needs to be a vast improvement in the energy efficiency of these homes, and we supplement that with MMC.
4.3. Game Theory: Incentives, Market Design and Policy
One clear message from the preceding case study is that SIPs fitted with sustainable technology, provide a credible solution to achieve environmental objectives (nZEB/NZC) whilst addressing the growth in housing demand. However, the regulatory environment in which the SIPs manufacturers operate will play a significant role in determining the diffusion of such systems [34]. Therefore, an important question is how can the UK and EU create a regulatory environment that aligns the incentives of private suppliers of using SIPs nZEB/NZC buildings with those of the UK/EU, and maximise the ability of the UK/EU to meet energy efficiency targets?
To address this important issue, we use game theory, which is a framework developed primarily in Economics to study the incentives of different parties within markets. More recently, game theory has been adopted throughout other disciplines. This includes studying incentives for collective investment in building technologies [21], land and property development processes [20], spatial planning [18], home energy management [10,11,12,13], home energy storage [14,15] and energy demand [16,17]. Our contribution in this section is to provide the first formal evaluation of the potential for SIPs and, in particular, nZEB/NZC SIPs homes in the UK/EU under various broad regulatory strategies.
In general, a “game” is used to model the interaction between two or more parties, referred to as “players”. In our context, the players will be the UK/EU and a SIPs manufacturer. Following standard techniques, we focus only on the interaction between a representative manufacturer and the UK/EU, rather than considering multiple manufacturers. This simplification enables us to zoom in on the main interaction of interest between the UK/EU’s regulatory regime and the investment decisions of a manufacturer, rather than competition between manufacturers. However, it will be demonstrated (Section 4.3.3) that our results are preserved in a market with many competitive suppliers of SIPs technology.
Each player has a list of available options, referred to as their “actions”, and they must choose a “strategy” that specifies how each player should respond to each action of the other player. When an outcome is reached that is optimal for each player, conditional on the strategy of the other player, neither player wishes to deviate. This constitutes an “equilibrium”, which is a stable outcome of the game. A paper by [20] provided a more detailed overview of game theory in a related context.
Define the representative SIPs manufacturer as Player 1 and the UK/EU as Player 2. Each player has a choice of three actions. The SIPs manufacturer can choose between Low (L), Medium (M) and High (H) investment in the market for nZEB/NZC homes. The UK/EU can choose between creating a regulatory environment that provides Limited (l), Gradual (g) and Maximum (m) support for private investment in this industry. Whilst there are undoubtedly more alternative actions available to both the UK/EU and SIPs manufacturers, limiting the number of alternatives for each player to three is sufficient to capture the interaction between the two players. This technique of reducing the action space is also standard within game theory [19]. The following formal definitions help to interpret the available actions:
Definition I.
The actions available to the representative manufacturer are:
- Low investment (L), which corresponds to the SIPs manufacturer continuing to self-promote and self-finance SIPs, working on a production to order basis. The manufacturer is unlikely to be able to meet significant increases in demand in the near future.
- Medium investment (M), which corresponds to the SIPs manufacturer gradually increasing production and investing in larger manufacturing facilities. The manufacturer also seeks external investment to increase capacity.
- High investment (H), which involves large scale investment into SIPs across numerous countries with significant external funding sought. The capacity of the manufacturer is increased dramatically.
Definition II.
The actions available to the UK/EU in terms of their regulatory regime are:
- Limited support (l) from the UK/EU, which provides very limited prioritisation and advocation of SIPs. Parties commissioning new buildings receive little encouragement to prioritise this type of SIPs.
- Gradual support (g) from the UK/EU, which corresponds with a gradual increase in regulatory and financial support for SIPs. We can also consider an alternative interpretation of gradual support where the level of support is initially high and decreases during the policy period as the market establishes itself. It will be demonstrated in Section 4.3.3. that our main results are robust to this alternative definition.
- Maximum support (m) from the UK/EU, which involves major and immediate changes to UK/EU policy to support and prioritise SIPs.
Once the two players have chosen their actions, an outcome is reached and each player receives their respective payoff. We assign the payoffs that each player will receive for each outcome by ranking between the most preferred (Payoff = 9) and least preferred (Payoff = 1) outcome for each player.
A fundamental question is how do we measure the relative preferences of each party over the outcomes? To ensure that our approach is transparent, the payoff structure of the parties is characterised based on a set of general guiding principles, which are as outlined below; For a related example which estimates the payoffs of players without guiding principles, see [20].
Guiding Principles I: SIPs Manufacturer
- i.
- For any choice of the manufacturer, the manufacturer receives a higher payoff when the UK/EU provides greater support for SIPs.
- ii.
- For any choice of the UK/EU, the manufacturer earns a higher payoff when the manufacturer’s level of investment is consistent with the level of support provided by the UK/EU, than when the manufacturer’s commitment differs. Consistent refers to both parties choosing the same degree of support/investment.
- iii.
- For any choice of the UK/EU, if the manufacturer chooses a different level of investment than the corresponding level of support from the UK/EU, then:
- a.
- The manufacturer earns a lower payoff when the commitment of the two parties differs more significantly.
- b.
- The manufacturer earns a higher payoff from over-investing than under-investing.
- c.
- The manufacturer earns a higher payoff in the outcome: (H, g) than (L, m). Note that principle iii(c) enables us to fully characterize the preference ranking of the manufacturer but is not necessary. All of the subsequent results are unaffected when this principle is removed. We discuss how the results are robust to relaxing many of the guiding principles in Section 4.3.3.
Principle (i) reflects the benefit that the manufacturer receives from the support of the EU. Principles (ii) and (iii) reflect the idea that the firm wishes to invest to meet future demand and expand the diffusion of its product but, as investment is costly, the return on investment is only sufficient when equivalent support is provided by the EU’s regulatory regime.
Guiding Principles II: EU
- i.
- For any choice of the UK/EU, the UK/EU receives a higher payoff when the manufacturer chooses a higher level of investment.
- ii.
- For a given choice of the manufacturer, the UK/EU never prefers to choose maximum support over either gradual or limited support, due to the prohibitive costs and risks involved in providing maximum support for a specific type of construction. Furthermore, the UK/EU prefers (M, g) over (H, m).
- iii.
- The UK/EU earns a higher payoff when it chooses the same level of commitment as the manufacturer (except the case of high investment because maximum support is prohibitively costly, and the UK/EU prefers gradual investment).
- iv.
- If the support of the UK/EU is consistent with the investment of the manufacturer, the UK/EU prefers gradual support over limited support.
Principle (i) establishes that the EU benefits from investment by the manufacturer because this increases the likelihood that energy efficiency targets will be met. Principle (ii) reflects the prohibitive costs and risk for the UK/EU to provide maximum support for one particular type of construction. There exists long standing relationships and agreements with numerous traditional house builders and contractors, which would be costly to completely discard. Principle (iii) reinforces the idea that both parties benefit from reciprocal investment by the other party and principle iv captures the fact that the EU prefers to achieve higher diffusion of SIPs technologies, to meet nZEB/NZC efficiency targets, as it is a legal requirement to do so.
Using these principles, we can present the payoff structure of the firms using a payoff matrix:
The payoffs are written in the standard form: (SIPs manufacturer payoff, UK/EU payoff), for each possible outcome.
Remark 1.
The payoff matrix in Figure 6 is the unique ranking of preferences that satisfy the guiding principles for the SIPs manufacturer. The ranking for the UK/EU is consistent with the guiding principles but is not unique. That is, there exists alternative preference rankings that satisfy the guiding principles. However, it will be demonstrated that the equilibrium outcomes and conclusions are robust to any alternative ranking consistent with these guiding principles. Full details are given in Appendix B.
We now solve the game by analysing the case where both parties make their decisions simultaneously (Section 4.3.1). We subsequently consider a sequential environment where one party commits to a strategy before the other party (Section 4.3.2) to highlight the benefit of commitment by one party.
4.3.1. Simultaneous Decision-Making
We are now in a position to identify the best response (marked * in Figure 6) of each player to each possible action of the other player. When both players are simultaneously choosing their best response, neither party has an incentive to change their decision and a (Nash) equilibrium is reached, which is a stable outcome of the game.
The procedure is as follows; First, consider the best responses of the SIPs manufacturer to each possible decision of the UK/EU. If the UK/EU chooses limited support (l), the best response of the SIPs manufacturer is to choose low investment (L). If the UK/EU chooses gradual support (g), the best response of the SIPs manufacturer is to choose medium investment (M). If the UK/EU chooses maximum support (m), the best response of the SIPs manufacturer is to choose (H). Second, consider the best response of the UK/EU regulatory regimes to any choice of the SIPs manufacturer. If the SIPs manufacturer chooses Low (L), the best response is (l). If they choose Medium (M), the best response is (g). If they choose High (H), the best response remains (g).
In this game, two equilibria exist at outcomes: (L, l) and (M, g). For (L, l), neither party has an incentive to deviate from the outcome where the UK/EU chooses limited support and the manufacturer chooses limited investment. If the UK/EU increased support, the cost of additional support outweighs the benefits from the increase in uptake of the new SIPs buildings because manufacturers have limited ability to meet any increase in demand. If the manufacturer increased investment, the firm would have excess capacity because the limited support of the UK/EU suppresses demand.
At the second equilibrium (M, g), where the UK/EU chooses gradual support and the manufacturer chooses medium investment, both parties earn a higher payoff than at (L, l). That is, they prefer this outcome over the case of limited support and low investment. The explanation is that the UK/EU is in a better position to meet its energy efficiency targets and the manufacturer’s additional investment facilitates higher sales. Neither party wishes to deviate. Notably, if either party selected a lower level of investment/support, both parties suffer. Lower UK/EU support would create excess capacity for the firm and reduce sales. Lower investment by the manufacturer would reduce the availability and diffusion of such technologies, reducing the likelihood of the UK/EU meeting nZEB/NZC standards.
The manufacturer would also prefer both parties to increase their commitment to SIPs but the costs and risks associated with maximum support are prohibitive for the UK/EU. Therefore, if the manufacturer increases investment, the benefit of a relatively small increase in additional sales is outweighed by the cost of investment. This helps us to understand why the UK/EU would be better off when it chooses gradual support if the manufacturer deviated from medium to high investment; the diffusion of SIPs buildings increases but the UK/EU does not bear any additional cost of support. However, this is not optimal for the manufacturer.
Note that (H, g) is not an equilibrium because, conditional on the UK/EU choosing g, the SIP’s manufacturer would prefer to deviate from H to M. The presence of multiple equilibria reflects the idea that the optimal choice for one party will be conditional on the choice of the other party. Furthermore, there are multiple potential outcomes where neither the UK/EU nor the manufacturer can increase their payoff by changing their decision, given the decision of the other party. However, the existence of multiple possible equilibria generates an important policy question; Given that both parties prefer (M, g), over (L, l), is there a mechanism to induce this outcome in the design of the market? We now show that if either party is able to credibly commit to their strategy, before the other party makes their decision, both parties can achieve the superior outcome.
4.3.2. Sequential Decision-Making and Market Design
The choice of each player will naturally be sensitive to the order in which players make their decisions. Where both parties prefer one equilibrium over another, a credible commitment by one party to the preferred equilibrium can enable the parties to coordinate to an outcome both prefer. Moreover, it is natural for one player to make their choice first in practice; the manufacturer may decide to postpone investment decisions until the UK/EU has committed to a support regime, generating a first-mover role for the EU. Alternatively, the manufacturer may be obligated to commit to a long-term investment strategy that is difficult to adjust, whereas the UK/EU can change regulatory support relatively quickly, generating a first-mover role for the manufacturer. We explore both cases.
To formalise these sequential scenarios, we consider an extensive form payoff tree, which indicates the timing of the moves. The ranking of the outcomes, and therefore the payoffs, is unaffected. We consider the best response of the second-mover to each possible choice of the first-mover, before considering the choice of the first mover based upon the three possible outcomes.
We start with the case in which the UK/EU is the first-mover, which is consistent with the idea that the UK/EU creates a regulatory environment and the firm subsequently makes their investment choice (Figure 7, LHS). The payoffs are written in the standard form: (First mover payoff, second mover payoff). With the * indicating the bets option.
Solving by backward induction, we characterise the optimal behaviour of the manufacturer. If the UK/EU chooses low support, the manufacturer prefers to choose low investment. If the UK/EU were to choose gradual support, the best response of the manufacturer is to choose medium investment. If the UK/EU were to choose maximal support, the best response of the manufacturer is to choose maximum investment. Therefore, the three possible outcomes of the game are: (low support, low investment), (gradual support, medium investment), (maximal support, maximum investment). Of these three possible outcomes, the UK/EU obtains the highest payoff when choosing gradual support. Therefore, the unique equilibrium is: Gradual Support from the UK/EU and Medium Investment from the manufacturer.
Now consider the case where the manufacturer is the first mover (Figure 7, RHS). Following the same process as before, the unique equilibrium remains unchanged between the two sequential games. The UK/EU chooses Gradual Support and the manufacturer chooses Medium Investment. The key implication is that if one party is able to irrevocably commit to their strategy, a superior outcome is reached for both parties. Therefore, from a policy-perspective, UK/EU policy-makers must recognise the importance of committing to a specific level of support.
4.3.3. Discussion, Policy Implications and Robustness
This game theoretical analysis identifies three important results. Firstly, when the UK/EU and SIPs manufacturer make their commitment decisions with regard to SIPs, it benefits both parties to engage in medium investment, rather than low investment. The UK/EU benefits from the increased provision of nZEB/NZC buildings, and the manufacturer benefits from increased sales. However, if both parties must decide their commitment simultaneously, there is no reason ai priori why this outcome would be achieved.
Secondly, if either party can credibly commit to medium investment/support, both parties are better off. This is one beauty of exploring a game theoretical framework; by zooming in on the underlying mechanisms, we can robustly show that neither party is harmed by one party having a first mover advantage. Moreover, such a first mover advantage is in the interest of both parties. The implication is that the UK/EU should credibly commit to a gradual support strategy for nZEB/NZC, which induces medium investment from the manufacturer.
Thirdly, regardless of the market design in terms of the timing of decisions, the maximum level of investment/support by both the UK/EU and the SIPs manufacturer cannot be achieved. The explanation is that if the SIPs manufacturer moves first and commits to maximum investment, the incentive for the UK/EU to also invest in supporting the technology is lower because uptake will already be high. This leads the UK/EU to choose gradual investment and free ride on the investment made by the manufacturer, whilst enabling it to meet its targets.
At this point, it is helpful to explore how sensitive these results and equilibrium outcomes are to individually relaxing any of the guiding principles for the manufacturer or the UK/EU. Formal mathematical proofs of these results are given in Appendix B. Given the guiding principles of the UK/EU, the equilibrium behaviour of the manufacturer in the simultaneous game requires minimal assumptions. Providing guiding principle, I(ii) is satisfied, all other remaining principles can be relaxed without affecting the existing equilibria or introducing additional equilibria. The same is true in the sequential game where the manufacturer is the second-mover. In the sequential game where the manufacturer is the first-mover, guiding principles I(i) and I(ii) are sufficient to generate the stated equilibrium.
Given the guiding principles of the manufacturer, guiding principle II(iii) for the UK/EU is sufficient to ensure that the equilibria of the game are preserved. To ensure that a third equilibrium does not arise, we also require: II(ii). In the sequential case where the UK/EU moves first, only guiding principles II(ii) and II(iv) are required. If the UK/EU moves second, only guiding principles II(ii) and II(iii) are needed. Therefore, the conclusions generated from this game theoretical analysis are very general and the model allows for a wide range of adjustment to the guiding principles without affecting the results.
The game theoretical model identifies the introduction of gradual support by the UK/EU and medium investment by the manufacturer as the (superior) Nash equilibrium, where gradual UK/EU support has been defined as the gradual increase in support for SIPs construction during the policy period. However, when implementing gradual support the UK/EU may wish to follow a slightly different interpretation where initially a high level of support is provided but this gradually decreases during the policy period as the market establishes itself.
Whilst adjusting the definition of gradual support can have qualitative implications for the market’s development, such as the pace of diffusion of SIPs technologies, the model is sufficiently flexible that it does not impact on the main results of the paper. The explanation is that changing the definition of gradual support to a slightly different implementation method may increase or decrease the absolute value of the payoffs to each party in the equilibrium outcome but it does not affect the ranking of the payoffs to each player. Therefore, their best responses, and subsequently the equilibrium decisions of each party, are unaffected.
This does not mean, however, that the way in which gradual support is implemented will not affect the value of the market outcomes to each party. Rather, at the implementation stage, the UK/EU should identify a form of gradual support that enables them to meet their objectives most effectively. However, both interpretations of gradual support are compatible with the guiding principles underpinning the behaviour of each player and therefore the adjustment will not cause the manufacturer to unilaterally deviate away from the equilibrium strategy of medium investment. In other words, whilst the UK/EU or manufacturer may prefer that gradual support is enacted in a certain way, both parties prefer gradual support to be implemented over a unilateral deviation to a different support/investment level. We provide further discussion of this point and a formal example in Appendix B.
The game theory results have also been presented in the context of a single representative manufacturer of SIPs technology. This is consistent with mainstream modelling techniques and enables us to zoom in on the main interaction of interest, between the UK/EU and the manufacturer, as simply and clearly as possible. However, all of the main results continue to be preserved and relevant for a market with many competitive suppliers of SIPs technology.
The intuition is that introducing competition in the supply of SIPs will impact the absolute payoff that a firm earns in each outcome of game. However, it does not change the relative ranking of the payoffs of the manufacturer for each possible outcome of the game. That is, SIPs manufacturers continue to respond in the same way to changes in the level of support from the UK/EU, independently of the level of competition in the market. We are also able to establish this result by formally extending the guiding principles, which underpin the manufacturer’s incentives, to a competitive market environment to show that the resulting equilibria and policy implications remain unchanged. Full details are provided in Appendix B.
5. Conclusions and Policy Implications
There is a growing and urgent Global need to minimise the amount of energy we use. If we do so there will be a reduction in carbon emissions. Across the UK/EU all new buildings are required to be nearly Zero Energy Buildings (nZEB) by 2021. In addition, there is now a further requirement for member states to achieve Net Zero Carbon (NZC) standards by 2050. For example, the UK has become the first country to set a legally binding targets to achieve NZC by 2050. Housing has a major role to play; with three quarters of existing buildings across the EU remaining with us in 2050. The retrofit of existing homes provides the single greatest opportunity to achieve nZEB/NZC standards. This paper considers the impact of new housing, learning from the past and considering a post 2050 position. It is unique in that it contributes a new perspective on resolving the tension between reducing carbon emissions associated with building operations and rapidly increasing the provision of housing. Whilst traditional methods of construction struggle to address either of these two objectives, our empirical case study provides evidence that modern methods of construction (in this case a SIPs building), fitted with renewable technologies, has the ability to satisfy both objectives simultaneously. Furthermore, the case study analysed in this paper is able to achieve exceptional energy and thermal performance standards comparable to other Passivhaus standard traditional and modern methods of construction. The home (fitted with a solar PV array) is capable of meeting 98% of its energy needs on site, providing a theoretical ~7425 kWh of renewable electricity to meet the demand for ~7490 kWh per annum and delivering a nZEB and potentially a NZC building. Incentivising and stimulating a market for SIPs of this type will enable the UK and EU countries to achieve nZEB/NZC whilst providing the much-needed supply of new sustainable housing.
We also provide a new conceptual framework in this context to cast light on the interaction between a manufacturer of SIPs and UK/EU authorities. Using game theory, we are able to understand potential sources of conflict and provide insights for optimal market design. If both parties are making their commitment decisions to this SIPs technology and zero energy housing simultaneously, an outcome can emerge where manufacturers under-invest in their capacity for this technology and UK/EU authorities provide limited support for the technology. This leads the UK/EU to have limited ability to meet environmental targets relating to buildings and sufficiently increase the available housing stock to meet demand.
There is also a second possible outcome that is better for both parties, where SIPs manufacturers and UK/EU authorities invest more heavily in this technology. This increases sales for manufacturers and the increased diffusion of the technology enhances the UK/EU’s home-building and energy efficiency objectives. However, to ensure that this superior outcome emerges, the UK/EU or SIPs manufacturer are required to take strong leadership in committing to this technology. Most broadly, our conceptual analysis demonstrates the importance of commitment by UK/EU authorities to stimulate investment by the private sector.
The results, on a practical level, also show that the construction of a 100% electric SIPs home can, if fitted with Solar PV panels, achieve exceptional environmental standards and is capable of providing all of its energy needs on site. With the huge demand for new homes across the UK/EU; the results from this paper can pave the way to creating a more sustainable and ultimately zero energy housing solution. The key insights from the study show that it is essential to get the building fabric right and create a home which requires as little energy as possible. The next step is to then consider if that energy can be sourced on site via the use of renewables. If that is not cost effective to do so, then purchasing 100% renewable energy will ensure that the home can achieve nZEB/NZC standards.
Author Contributions
Methodology, B.A.-D.; Validation, M.F.; Data curation, R.E.; Writing – original draft, S.F.; Project administration, I.C. All authors have read and agreed to the published version of the manuscript.
Funding
This research received no external funding.
Institutional Review Board Statement
Not applicable.
Informed Consent Statement
Not applicable.
Data Availability Statement
Not applicable.
Acknowledgments
We are grateful for comments and support from Sarah Hall, Heather Lovell and Harvey Upton. We would also like to thank the SIPs property owners for access to their home, fitting of sensors and completion of questionnaires. We are grateful to Greg Barton from Dragonipanel Ltd. for his support and information on his SIPs panels and construction methodologies.
Conflicts of Interest
The authors declare no conflict of interest.
Nomenclature
| ALDREN | ALiance for Deep RENovation in Buildings |
| ASHP | Air Source Heat Pump |
| Beem-UP | Building Energy Efficiency for Massive market Uptake |
| BRP | Building Renovation Passports |
| CCTV | Closed Circuit Television |
| CO2e | Carbon Dioxide and Equivalents |
| CO-HERENO | Collaboration for Housing Nearly Zero-Energy Renovation |
| DIPS | Dragon Intelligent Panel System |
| Eprim | Primary Energy |
| Esolar | Solar Energy |
| EPBD | Energy Performance of Buildings Directive |
| EU | European Union |
| GFA | Gross Floor Area |
| MMC | Modern Methods of Construction |
| M&E | Mechanical and Electrical |
| MgO | Magnesium Oxide |
| MVHR | Mechanical Ventilation and Heat Recovery |
| NeZeR | Nearly Zero Energy Renovation |
| NHER | National Home Energy Rating |
| NZC | Net Zero Carbon |
| nZEB | Nearly Zero Energy Building |
| OSB | Oriented Strand Board |
| SIPs | Structurally Insulated Panels |
| SPV | Solar Photovoltaics |
| WiFi | Wireless Fidelity |
| 4RinEU | Renovation of Residential buildings in EU |
Appendix A
This Appendix A provides a methodology to infer energy use and create a disaggregated dataset from the monitored energy use of the home. The total energy use figure E is disaggregated as follows:
where: E is the total energy use (kWh), A is the type of device in use, A1 is LED lights; A2 is a LED TVs; A3 is a LCD TV; A4 is a desktop PC; A5 is a Laptop computer; A6 is the Wifi; A7 is the phone charger; A8 is the cordless phone; A9 is the washing machine; A10 is the dishwasher; A11 is the fridge freezer; A12 is the oven, A13; is the induction hob; A14 is the microwave; A15 is the coffee maker; A16 is the toaster; A17 is the hairdryer; A18 is the iron; A19 is the vacuum; A20 is the ASHP; A21 is the immersion heater; A22 is the MVHR; pn = power of device n (Watts), hn = hours per day that each device n is in use (h) and bn = number of devices n in use (number).
Appendix A.1. Primary Energy Consumption
The nZEB primary energy (kWh/m2/year) for new build residential homes is calculated using the following equation:
where: E is the primary energy (kWh); Edel,i is the delivered energy of the energy carrier i (kWh); Eexp,i is the exported energy of the energy carrier i (kWh); fdel,i is the primary energy factor for the delivered energy carrier i (kWh); fexp,i is the primary energy factor for the exported energy carrier i (kWh).
The SIPs house is powered by 100% electricity and the delivered energy (Edel) can be calculated using Equation 3. The Primary Energy Factor (PEF) for electricity in the UK is 1.5 [35] and the floor area of the house is 92 m2. No electricity is exported to the grid. Therefore, the Edel,i is calculated as follows:
and with fdel for UK electricity equal to 2.5.
Appendix A.2. Renewable Technologies
Appendix B
This Appendix contains the formal mathematical proofs underpinning the claims made in the game theory analysis.
Claim 1.
The payoff matrix presented in Figure 4 is the unique preference ranking that satisfies the guiding principles of the manufacturer’s incentives.
Proof of Claim 1.
Let the payoffs of the manufacturer be denoted A − I, where A denotes payoff 1 and I denotes payoff 9. The resulting payoffs for the manufacturer only are given below:

Table A1.
Playoff matrix.
| EU | ||||
| Limited Support | Gradual Support | Maximum Support | ||
| SIPs Manufacturer | Low Investment | C | D | E |
| Medium Investment | B | G | H | |
| High Investment | A | F | I | |
We must now show that, given the guiding principles for the manufacturer: A < B < C < D < E < F < G < H < I. Firstly, we translate the guiding principles into a system of restrictions over these payoffs:
- i.
- C < D < E; B < G < H; A < F < I
- ii.
- A, B < C; D, F < G; H, E < I
- iii.
- a.
- A < B < C, E < H < I
- b.
- D < F
- c.
- E < F
Secondly, we prove claim 1. From (iii), A < B < C, from (i) C < D < E, using (iii) E < F, using (ii) F < G. Using (i), G < H, using (ii) H < I. Therefore, the unique preference relation elicited by the above guiding principles is: A < B < C < D < E < F < G < H < I. Moreover, none of the guiding principles cause any conflict in the ranking.
Claim 2.
For clarity, we separate the claim into two parts:
- (a)
- The payoff matrix presented in Figure 4 represents the preference ranking that satisfies the guiding principles of the EU’s incentives.
- (b)
- The payoff matrix is not unique. That is, there exists other preference rankings that satisfy these principles. However, any other preference ranking that does satisfy these general principles yields the exact same Nash equilibrium. Therefore, the equilibrium is robust to all possible permutations.
Proof of Claim 2.
(a): As before, let the payoffs of the EU be denoted A − I, where A denotes payoff 1 and I denotes payoff 9. The resulting payoffs for the EU only are given below:
Table A2.
Playoff matrix.
| EU | ||||
| Limited Support | Gradual Support | Maximum Support | ||
| SIPs Manufacturer | Low Investment | C | B | A |
| Medium Investment | E | G | D | |
| High Investment | H | I | F | |
We now show that the payoff ranking A < B < C < D < E < F < G < H < I, is consistent with the guiding principles for the EU. As before, we translate the guiding principles into a system of restrictions over these payoffs:
- i.
- C < E < H; B < G < I; A < D < F.
- ii.
- A < B, C; D < G, E; F < I, H; F < G.
- iii.
- A, B < C; D, E < G; H < I.
- iv.
- C < G
From (ii) and (iii): A < B < C and D < E < G. By combining (i), (ii) and (iii); D < F < H < I. Importantly, none of the guiding principles violate the proposed preference ranking: A < B < C < D < E < F < G < H < I. However, the full characterization in the preference ranking need not be unique. For instance, based solely on the guiding principles, it is feasible that: C > D and F > E.
Proof of Claim 2.
(b): We now show that whilst the preference ranking is not the only preference ranking that satisfies the general principles, any other ranking that is compatible with the guiding principles yields the same equilibria.
In order for the equilibria to be influenced, the best responses for the EU must change with different permutations of the payoff matrix and any such permutation must remain consistent with the guiding principles. We now show that this cannot be the case.
Suppose to the contrary, that there exists a payoff structure that is both consistent with the guiding principles and yields different best responses, and therefore can influence the equilibria. For the best responses to be changed, we require one or more of the following conditions to hold:
- C < B or A,
- G < E or D,
- I < H or F.
The first condition cannot be true because, from guiding principle II(iii): A, B < C. The second point cannot be true because, from II(iii): D, E < G. The third point cannot be true because, from combining II(ii) and II(iii): F < H < I.
The guiding principles also guarantee G > C (G > E and E > C). Therefore, whilst there exist alternative rankings of the payoffs for the EU, the resulting equilibria and preferences of the players over these equilibria are robust to any of these.
The final question is whether an additional equilibrium could arise under a different preference ranking that is consistent with the guiding principles for the EU. The only potential candidate for a third equilibrium is: (High Investment, Maximum Support). However, in order for this outcome to be an equilibrium, it must be that: F > I, H, which violates II(ii). Therefore, to summarise, any permutation of the preference ordering that is consistent with the guiding principles yields (and only yields) the specified equilibria of the game.
How should we interpret this result? To begin, it should be emphasized that the robustness of our equilibria to alternative payoff structures supports, rather than detracts from, the credibility of our model. The intuition follows that, for any decision of the manufacturer, the best response of the EU is well-defined by the guiding principles. However, it is possible that the ranking of preferences for the EU over two separate outcomes, such as (Low Investment, Limited Support) and (Medium Investment, Maximum Support) can be reversed without affecting the outcome of the model.
Claim 3.
The resulting equilibria in the simultaneous move game are unaffected when all of the guiding principles for the manufacturer are relaxed except I(ii).
Proof of Claim 3.
With reference to the payoff ordering given in the proof of Claim 1, Guiding Principle I(ii) requires that: A, B < C; D, F < G and H, E < I. Using these restrictions, the best responses of the manufacturer are fully defined and the additional guiding principles can be relaxed.
Claim 4.
The resulting equilibria in the sequential move game, where the manufacturer is the second mover, are unaffected when all of the guiding principles for the manufacturer are relaxed except I(ii).
Proof of Claim 4.
This result follows from the Proof of Claim 3. The best responses are well defined by guiding principle I(ii).
Claim 5.
The resulting equilibria in the sequential move game, where the manufacturer is the first mover, are unaffected when all of the guiding principles for the manufacturer are relaxed except I(i) and I(ii).
Proof of Claim 5.
With reference to the payoff ordering given in the proof of Claim 1, Guiding Principle I(ii) requires that: A, B < C; D, F < G and H, E < I. Guiding Principle I(i) requires that C < D < E; B < G < H, A < F < I.
- Step 1:
- Given the conditional choices of the EU, the manufacturer must choose their action. Therefore, there exists only three possible equilibrium outcomes of the game: (Low, limited), (Medium, gradual), (High, gradual) and the manufacturer must choose the alternative that yields the highest payoff. In the language of the payoff ordering in the proof of Claim 1, to ensure that the outcome is an equilibrium: (Medium, gradual), we require: G > F and G > C.
- Step 2:
- To show that G > F, we use Guiding Principle I(ii).
- Step 3:
- From Guiding Principle I(i), it must be true that: C < D. From Guiding Principle I(ii), it must be true that D < G. Therefore, combining these two restrictions ensures C < G.
Claim 6.
The resulting equilibria in the simultaneous move game are unaffected when all of the guiding principles for the EU are relaxed except II(iii). To ensure that an additional equilibrium cannot arise, we must also impose II(ii).
Proof of Claim 6.
With reference to the payoff ordering given in the proof of Claim 2, Guiding Principle II(iii) requires: C > B, A; G > D, E; I > H. To ensure that the two equilibria exist, given the optimal behaviour of the manufacturer, we require: C > B, A and G > D, E. These requirements are satisfied by Guiding Principle II(iii).
Note that to ensure that a third equilibrium does not arise, we also require that either I > F or H > F. This condition is satisfied by Guiding Principle II(ii), which imposes: F < H, I.
Claim 7.
The resulting equilibria in the sequential model where the EU moves first are unaffected when all of the guiding principles for the EU are relaxed, except either: II(ii) and II(iv).
Proof of Claim 7.
Conditional on the best responses of the manufacturer, there are three potential outcomes over which the EU must decide; (Low, limited), (Medium, gradual) and (High, maximum). Following the payoff ordering given in the proof of Claim 2, to ensure that the equilibrium (Medium, gradual) arises, we require: G > C, F for EU. This condition is satisfied by combining either II(ii) and II(iv).
Claim 8.
The resulting equilibria in the sequential model where the EU moves second are unaffected when all of the guiding principles for the EU are relaxed, except II(ii) and II(iii).
Proof of Claim 8.
To define the best responses of the EU to the three possible decisions of the manufacturer in stage 1, we require C > B, A; G > D, E and I > F, H. The first two conditions are satisfied by II(iii). The third condition is satisfied by a combination of II(ii) and II(iii).
References
- BPIE Nearly Zero Energy Buildings Definitions across Europe (2010) Energy. 2010. Available online: https://www.bpie.eu/wp-content/uploads/2015/09/BPIE_factsheet_nZEB_definitions_across_Europe.pdf (accessed on 15 February 2022).
- Cambridge Institute for Sustainability Leadership. 2018. Available online: https://www.cisl.cam.ac.uk/resources/low-carbon-transformation-publications/renovation-roadmap (accessed on 15 February 2022).
- Hopfe, C.; McLeod, R.S. The Passivhaus Designer’s Manual; Routledge: Oxfordshire, UK, 2015. [Google Scholar] [CrossRef]
- Maruejols, L.; Ryan, D.L.; Young, D. Eco-houses and the environment: A case study of occupant experiences in a cold climate. Energy Build. 2013, 62, 368–380. [Google Scholar] [CrossRef]
- Mlecnik, E.; Visscher, H.; van Hal, A. Barriers and opportunities for labels for highly energy-efficient houses. Energy Policy 2010, 38, 4592–4603. [Google Scholar] [CrossRef]
- Mahdavi, A.; Doppelbauer, E.-M. A performance comparison of passive and low-energy buildings. Energy Build. 2010, 42, 1314–1319. [Google Scholar] [CrossRef]
- Zeng, C.; Liu, S.; Shukla, A.; Yang, B. Identifying the occupant’s satisfaction and awareness for the performance of Eco houses in the United Kingdom. J. Build. Eng. 2018, 18, 281–291. [Google Scholar] [CrossRef]
- Akintoye, A.; Goulding, J.S.; Zawdie, G. Construction Innovation and Process Improvement; Wiley-Blackwell: Hoboken, NJ, USA, 2012; pp. 1–17. [Google Scholar] [CrossRef] [Green Version]
- Farreny, R.; Oliver-Solà, J.; Montlleó, M.; Escribà, E.; Gabarrell, X.; Rieradevall, J. Transition towards Sustainable Cities: Opportunities, Constraints, and Strategies in Planning. A Neighbourhood Ecodesign Case Study in Barcelona. Environ. Plan. A Econ. Space 2011, 43, 1118–1134. [Google Scholar] [CrossRef]
- Van Waeyenberge, E. Crisis? What crisis? A critical appraisal of World Bank housing policy in the wake of the global financial crisis. Environ. Plan. A Econ. Space 2018, 50, 288–309. [Google Scholar] [CrossRef] [Green Version]
- Belussi, L.; Barozzi, B.; Bellazzi, A.; Danza, L.; Devitofrancesco, A.; Fanciulli, C.; Ghellere, M.; Guazzi, G.; Meroni, I.; Salamone, F.; et al. A review of performance of zero energy buildings and energy efficiency solutions. J. Build. Eng. 2019, 25, 100772. [Google Scholar] [CrossRef]
- Lokeshgupta, B.; Sivasubramani, S. Cooperative game theory approach for multi-objective home energy management with renewable energy integration. IET Smart Grid 2019, 2, 34–41. [Google Scholar] [CrossRef]
- Mondal, A.; Misra, S.; Obaidat, M.S. Distributed Home Energy Management System With Storage in Smart Grid Using Game Theory. IEEE Syst. J. 2017, 11, 1857–1866. [Google Scholar] [CrossRef]
- Marzband, M.; Javadi, M.; Domínguez-García, J.L.; Moghaddam, M.M. Non-cooperative game theory based energy management systems for energy district in the retail market considering DER uncertainties. IET Gener. Transm. Distrib. 2016, 10, 2999–3009. [Google Scholar] [CrossRef] [Green Version]
- Liu, Y.; Hu, S.; Huang, H.; Ranjan, R.; Zomaya, A.Y.; Wang, L. Game-Theoretic Market-Driven Smart Home Scheduling Considering Energy Balancing. IEEE Syst. J. 2017, 11, 910–921. [Google Scholar] [CrossRef] [Green Version]
- Zhu, Z.; Lambotharan, S.; Chin, W.H.; Fan, Z. A Game Theoretic Optimization Framework for Home Demand Management Incorporating Local Energy Resources. IEEE Trans. Ind. Informatics 2015, 11, 353–362. [Google Scholar] [CrossRef] [Green Version]
- Sheikhi, A.; Rayati, M.; Bahrami, S.; Ranjbar, A.M. Integrated Demand Side Management Game in Smart Energy Hubs. IEEE Trans. Smart Grid 2015, 6, 675–683. [Google Scholar] [CrossRef]
- Srinivasan, D.; Rajgarhia, S.; Radhakrishnan, B.M.; Sharma, A.; Khincha, H. Game-Theory based dynamic pricing strategies for demand side management in smart grids. Energy 2017, 126, 132–143. [Google Scholar] [CrossRef]
- Lord, A.; Gu, Y. Can the market be tamed? A thought experiment on the value(s) of planning. Environ. Plan. A Econ. Space 2019, 51, 11–24. [Google Scholar] [CrossRef]
- Samsura, D.A.; van der Krabben, E.; van Deemen, A. A game theory approach to the analysis of land and property development processes. Land Use Policy 2010, 27, 564–578. [Google Scholar] [CrossRef]
- Tsang, S.W.; Jim, C.Y. Game-Theory Approach for Resident Coalitions to Allocate Green-Roof Benefits. Environ. Plan. A Econ. Space 2011, 43, 363–377. [Google Scholar] [CrossRef]
- Branco, G.; Lachal, B.; Gallinelli, P.; Weber, W. Predicted versus observed heat consumption of a low energy multifamily complex in Switzerland based on long-term experimental data. Energy Build. 2004, 36, 543–555. [Google Scholar] [CrossRef]
- Santin, O.G. Behavioural Patterns and User Profiles related to energy consumption for heating. Energy Build. 2011, 43, 2662–2672. [Google Scholar] [CrossRef]
- Guerra Santin, O. Actual Energy Consumption in Dwellings: The Effect of Energy Performance Regulations and Occupant Behaviour; IOS Press: Amsterdam, The Netherlands, 2010. [Google Scholar]
- Haas, R.; Auer, H.; Biermayr, P. The impact of consumer behavior on residential energy demand for space heating. Energy Build. 1998, 27, 195–205. [Google Scholar] [CrossRef]
- Guardigli, L. Comparing the Environmental Impact of Reinforced Concrete and Wooden Structures; Woodhead Publishing: Sawston, UK, 2014; pp. 407–433. [Google Scholar] [CrossRef]
- D’Agostino, D.; Mazzarella, L. What is a Nearly zero energy building? Overview, implementation and comparison of definitions. J. Build. Eng. 2019, 21, 200–212. [Google Scholar] [CrossRef]
- Ramesh, T.; Prakash, R.; Shukla, K.K. Life cycle energy analysis of buildings: An overview. Energy Build. 2010, 42, 1592–1600. [Google Scholar] [CrossRef]
- Attia, S.; Eleftheriou, P.; Xeni, F.; Morlot, R.; Ménézo, C.; Kostopoulos, V.; Betsi, M.; Kalaitzoglou, I.; Pagliano, L.; Cellura, M.; et al. Overview and future challenges of nearly zero energy buildings (nZEB) design in Southern Europe. Energy Build. 2017, 155, 439–458. [Google Scholar] [CrossRef]
- D׳agostino, D. Assessment of the progress towards the establishment of definitions of Nearly Zero Energy Buildings (nZEBs) in European Member States. J. Build. Eng. 2015, 1, 20–32. [Google Scholar] [CrossRef]
- Trebut, F.; Warmuth, H.; Supper, S.; Hilderson, W.; Artola, I.; Thuring, M.; Van Holm, M.; Münke, R.; Pannier, P.; Bensmann, K.; et al. Barriers and Opportunities for Business Collaboration in the nZEB Single-Family Housing Renovation Market. COHERENO D3.2 Version 1.0. COHERENO (Collaboration for Housing Nearly Zero-Energy Renovation). 2014. Available online: https://www.narcis.nl/publication/RecordID/oai:tudelft.nl:uuid%3Ab9fc01d5-500b-467b-8630-c5aba1d45a8a (accessed on 23 May 2019).
- Evans, V.; Kerr, K. How Modern Methods of Construction Can Deliver ‘More’ through the Planning System, Solving the Housing Crisis. 2018. Available online: https://www.arup.com/perspectives/publications/research/section/how-modern-methods-of-construction-can-deliver-more-through-the-planning-system (accessed on 19 June 2019).
- Local, D. for C. Fixing our Broken Housing Market, Department for Communities and Local Government. 2017. Available online: https://assets.publishing.service.gov.uk/government/uploads/system/uploads/attachment_data/file/590464/Fixing_our_broken_housing_market_-_print_ready_version.pdf (accessed on 19 June 2019).
- CITB (Construction Industry Training Board). The Impact of Modern Methods of Construction on Skills Requirements for Housing. Available online: https://www.gov.uk/government/publications/impact-of-modern-methods-of-construction-on-skills-requirements-for-housing-research-summary (accessed on 21 March 2021).
- BRE. Available online: https://www.bregroup.com/wp-content/uploads/2019/10/Briefing-note-on-derivation-of-PE-factors-V1.3-01-10-2019.pdf (accessed on 26 November 2022).
Figure 1.
Research Methodology.

Figure 2.
Case study.

Figure 3.
Ground and first floor plans.
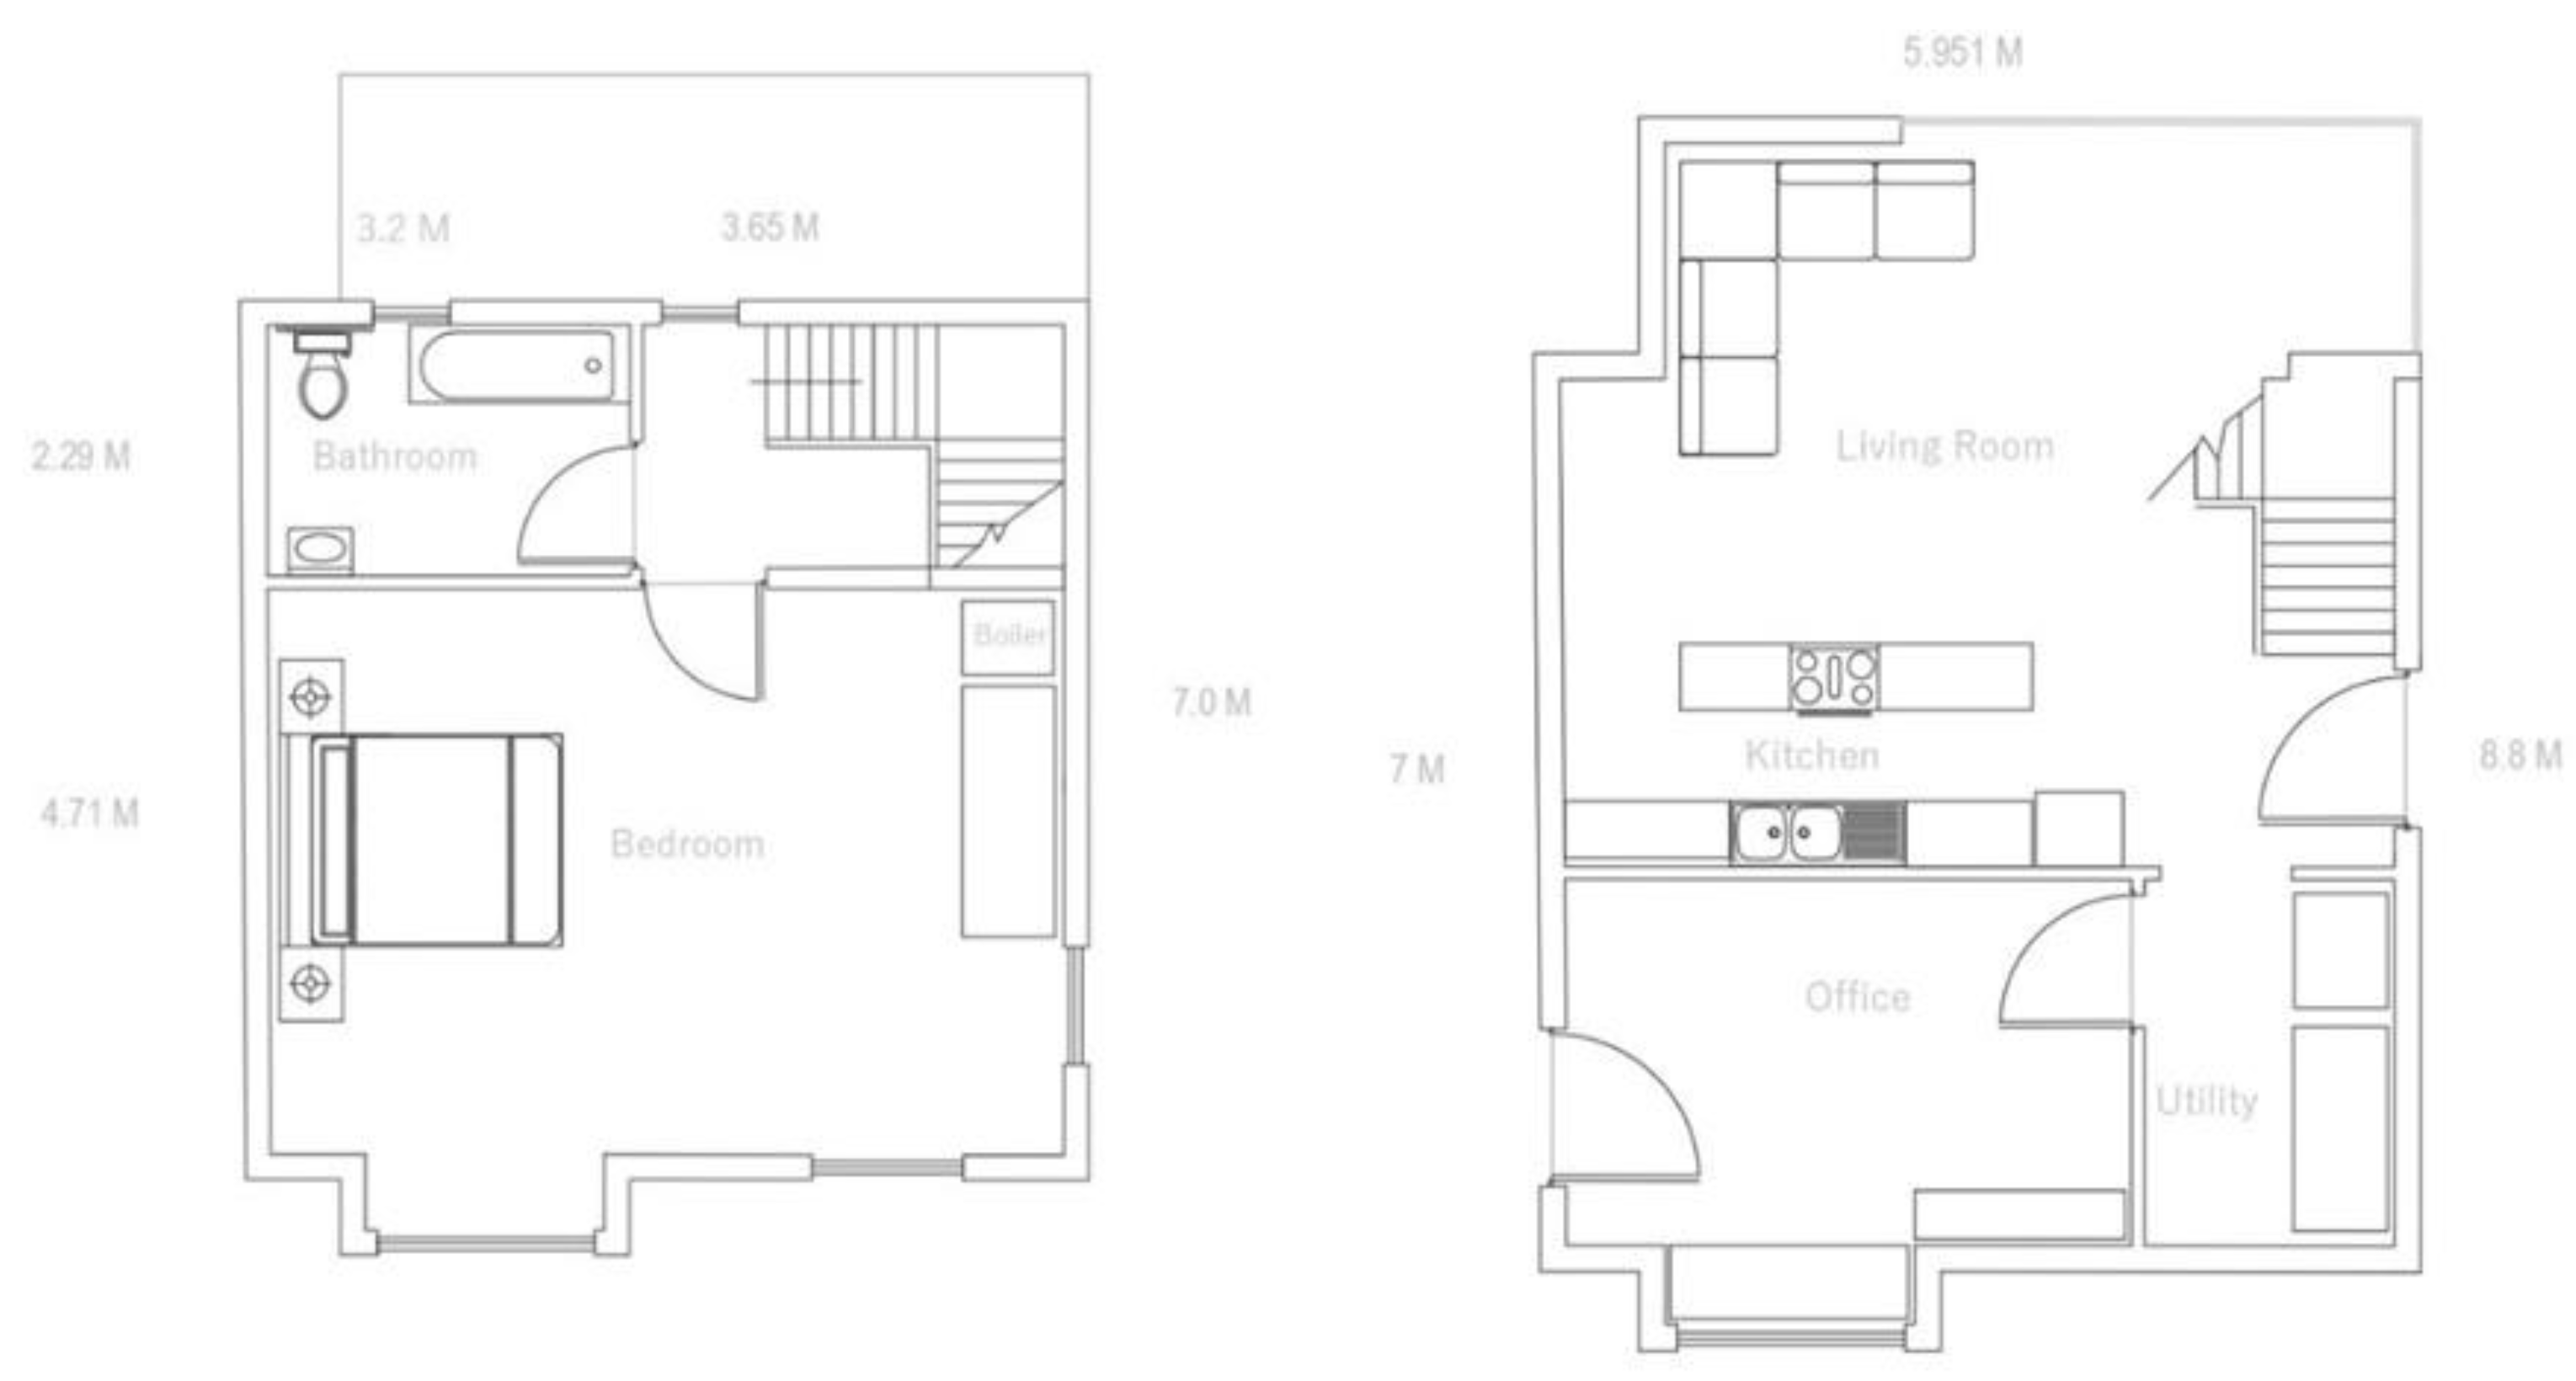
Figure 4.
SIPs house schematic.
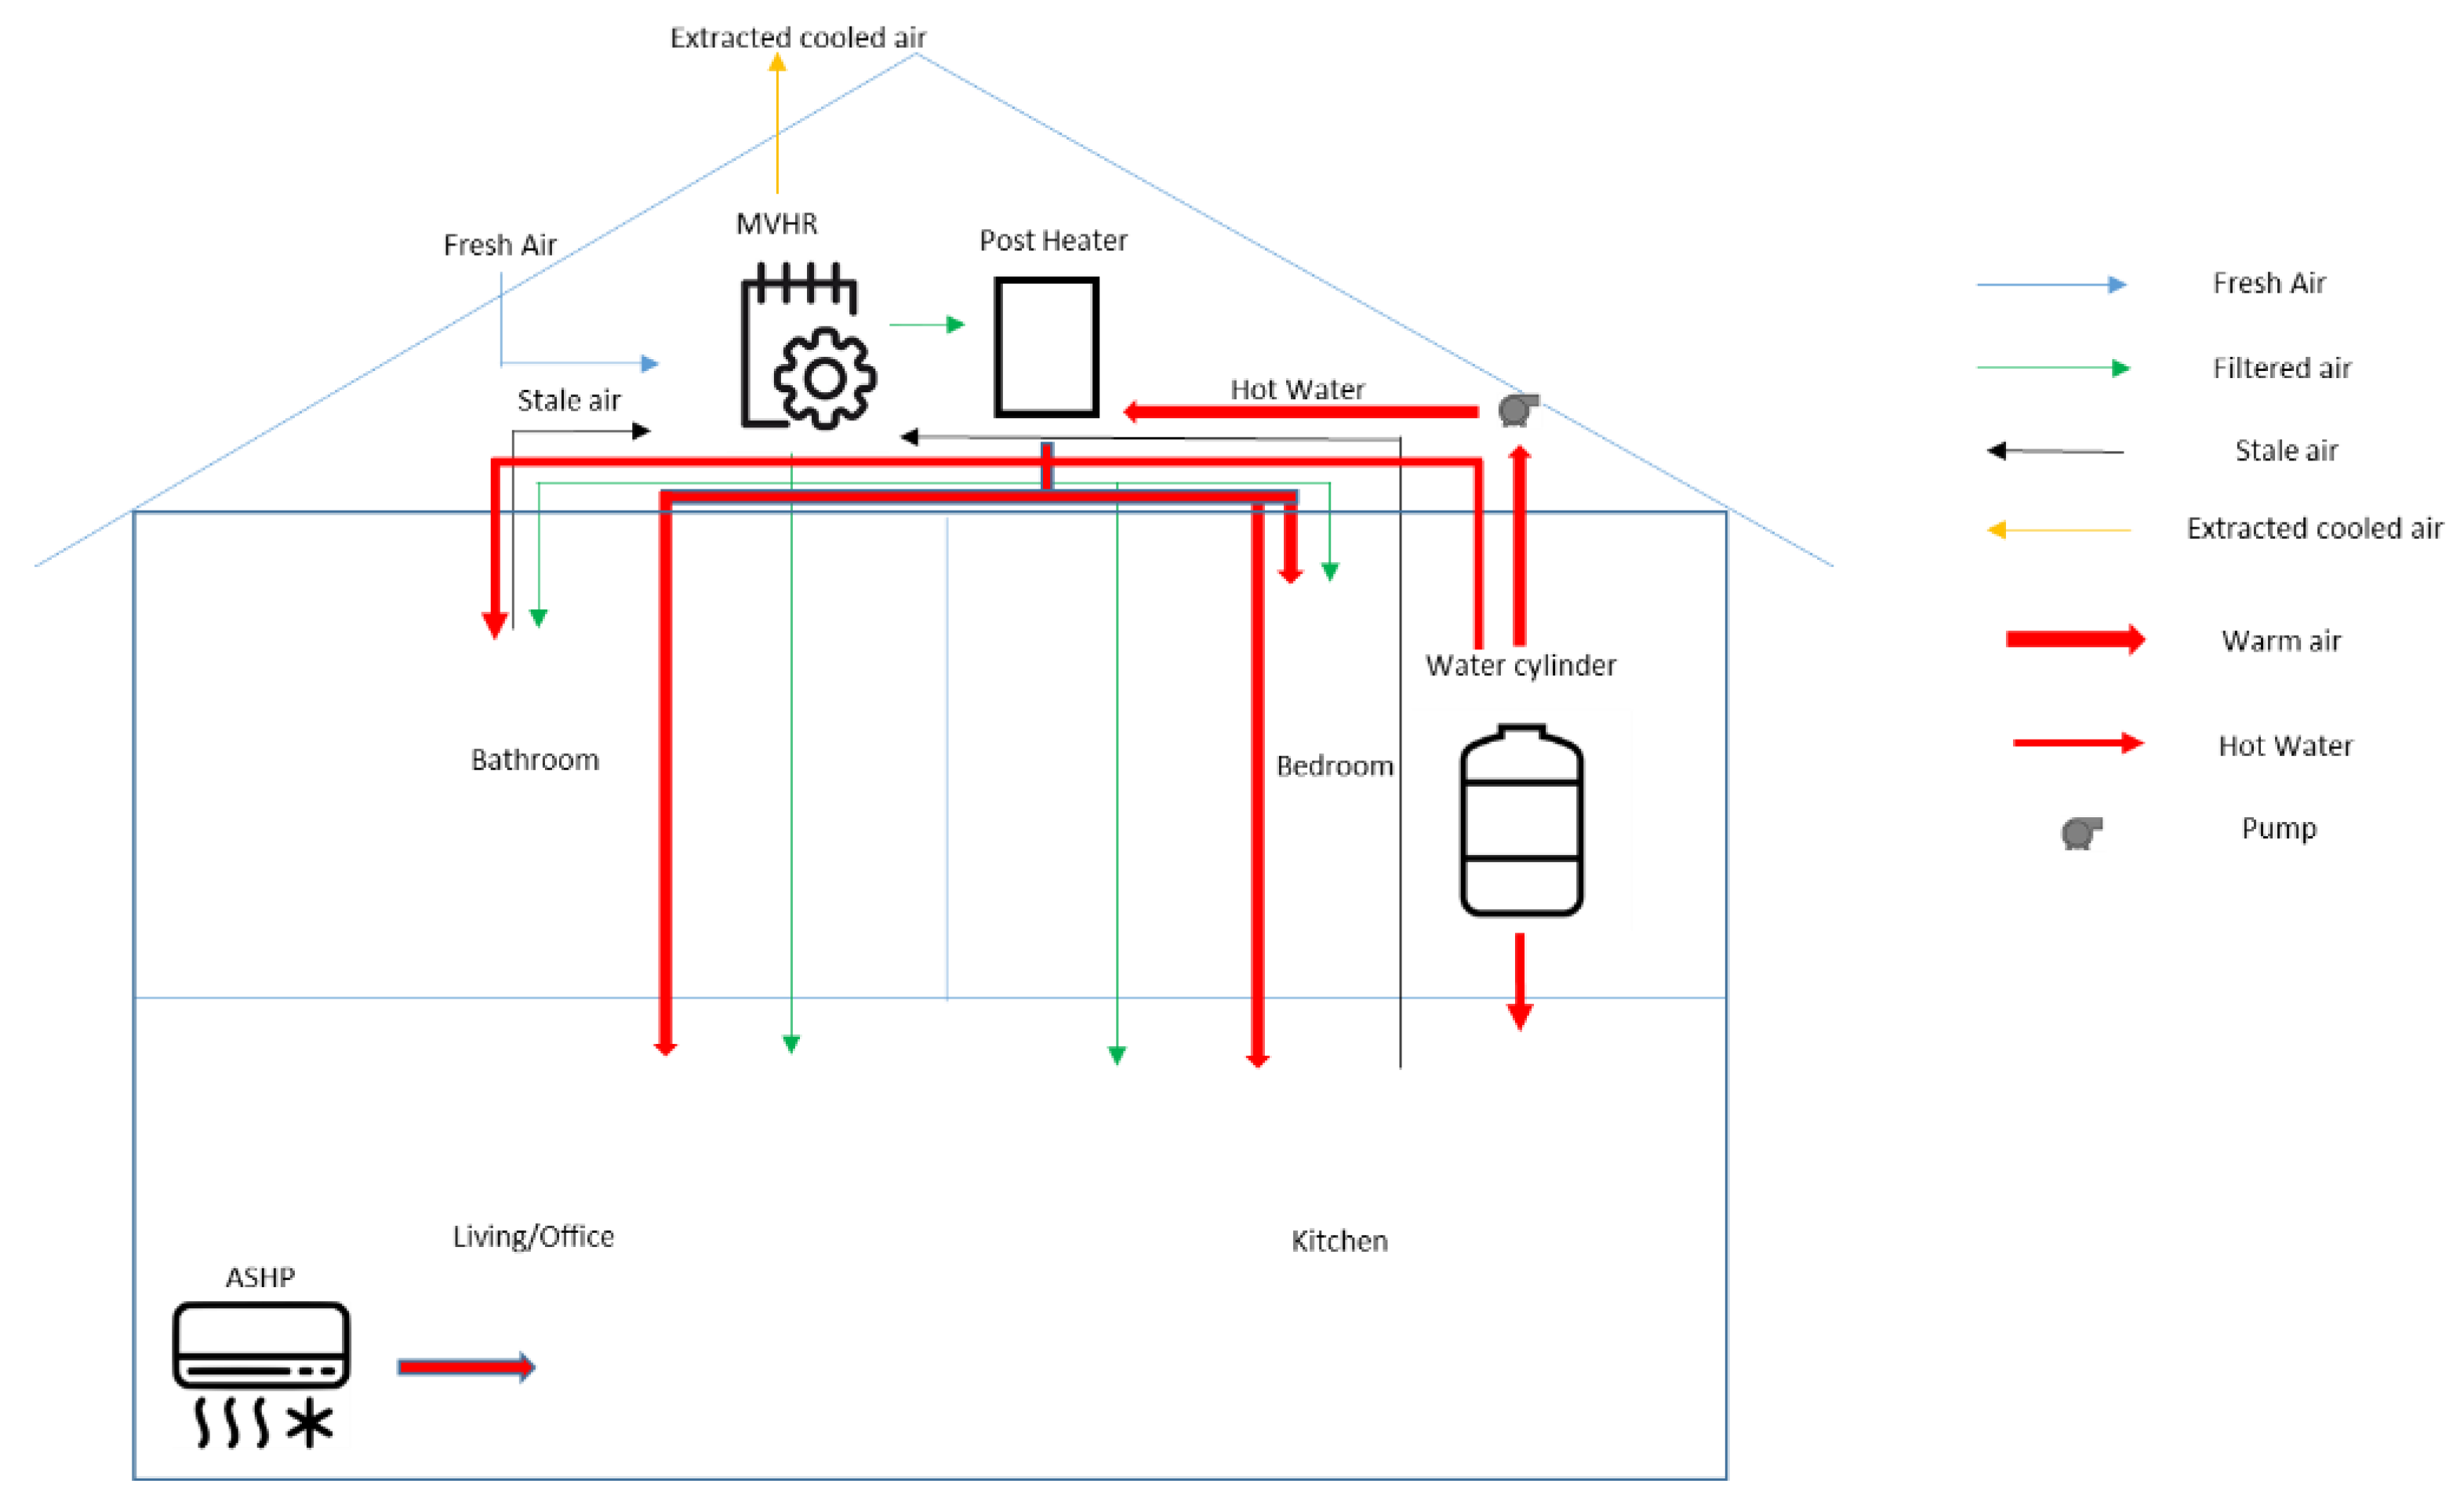
Figure 5.
SIPs house with Solar PV installation.
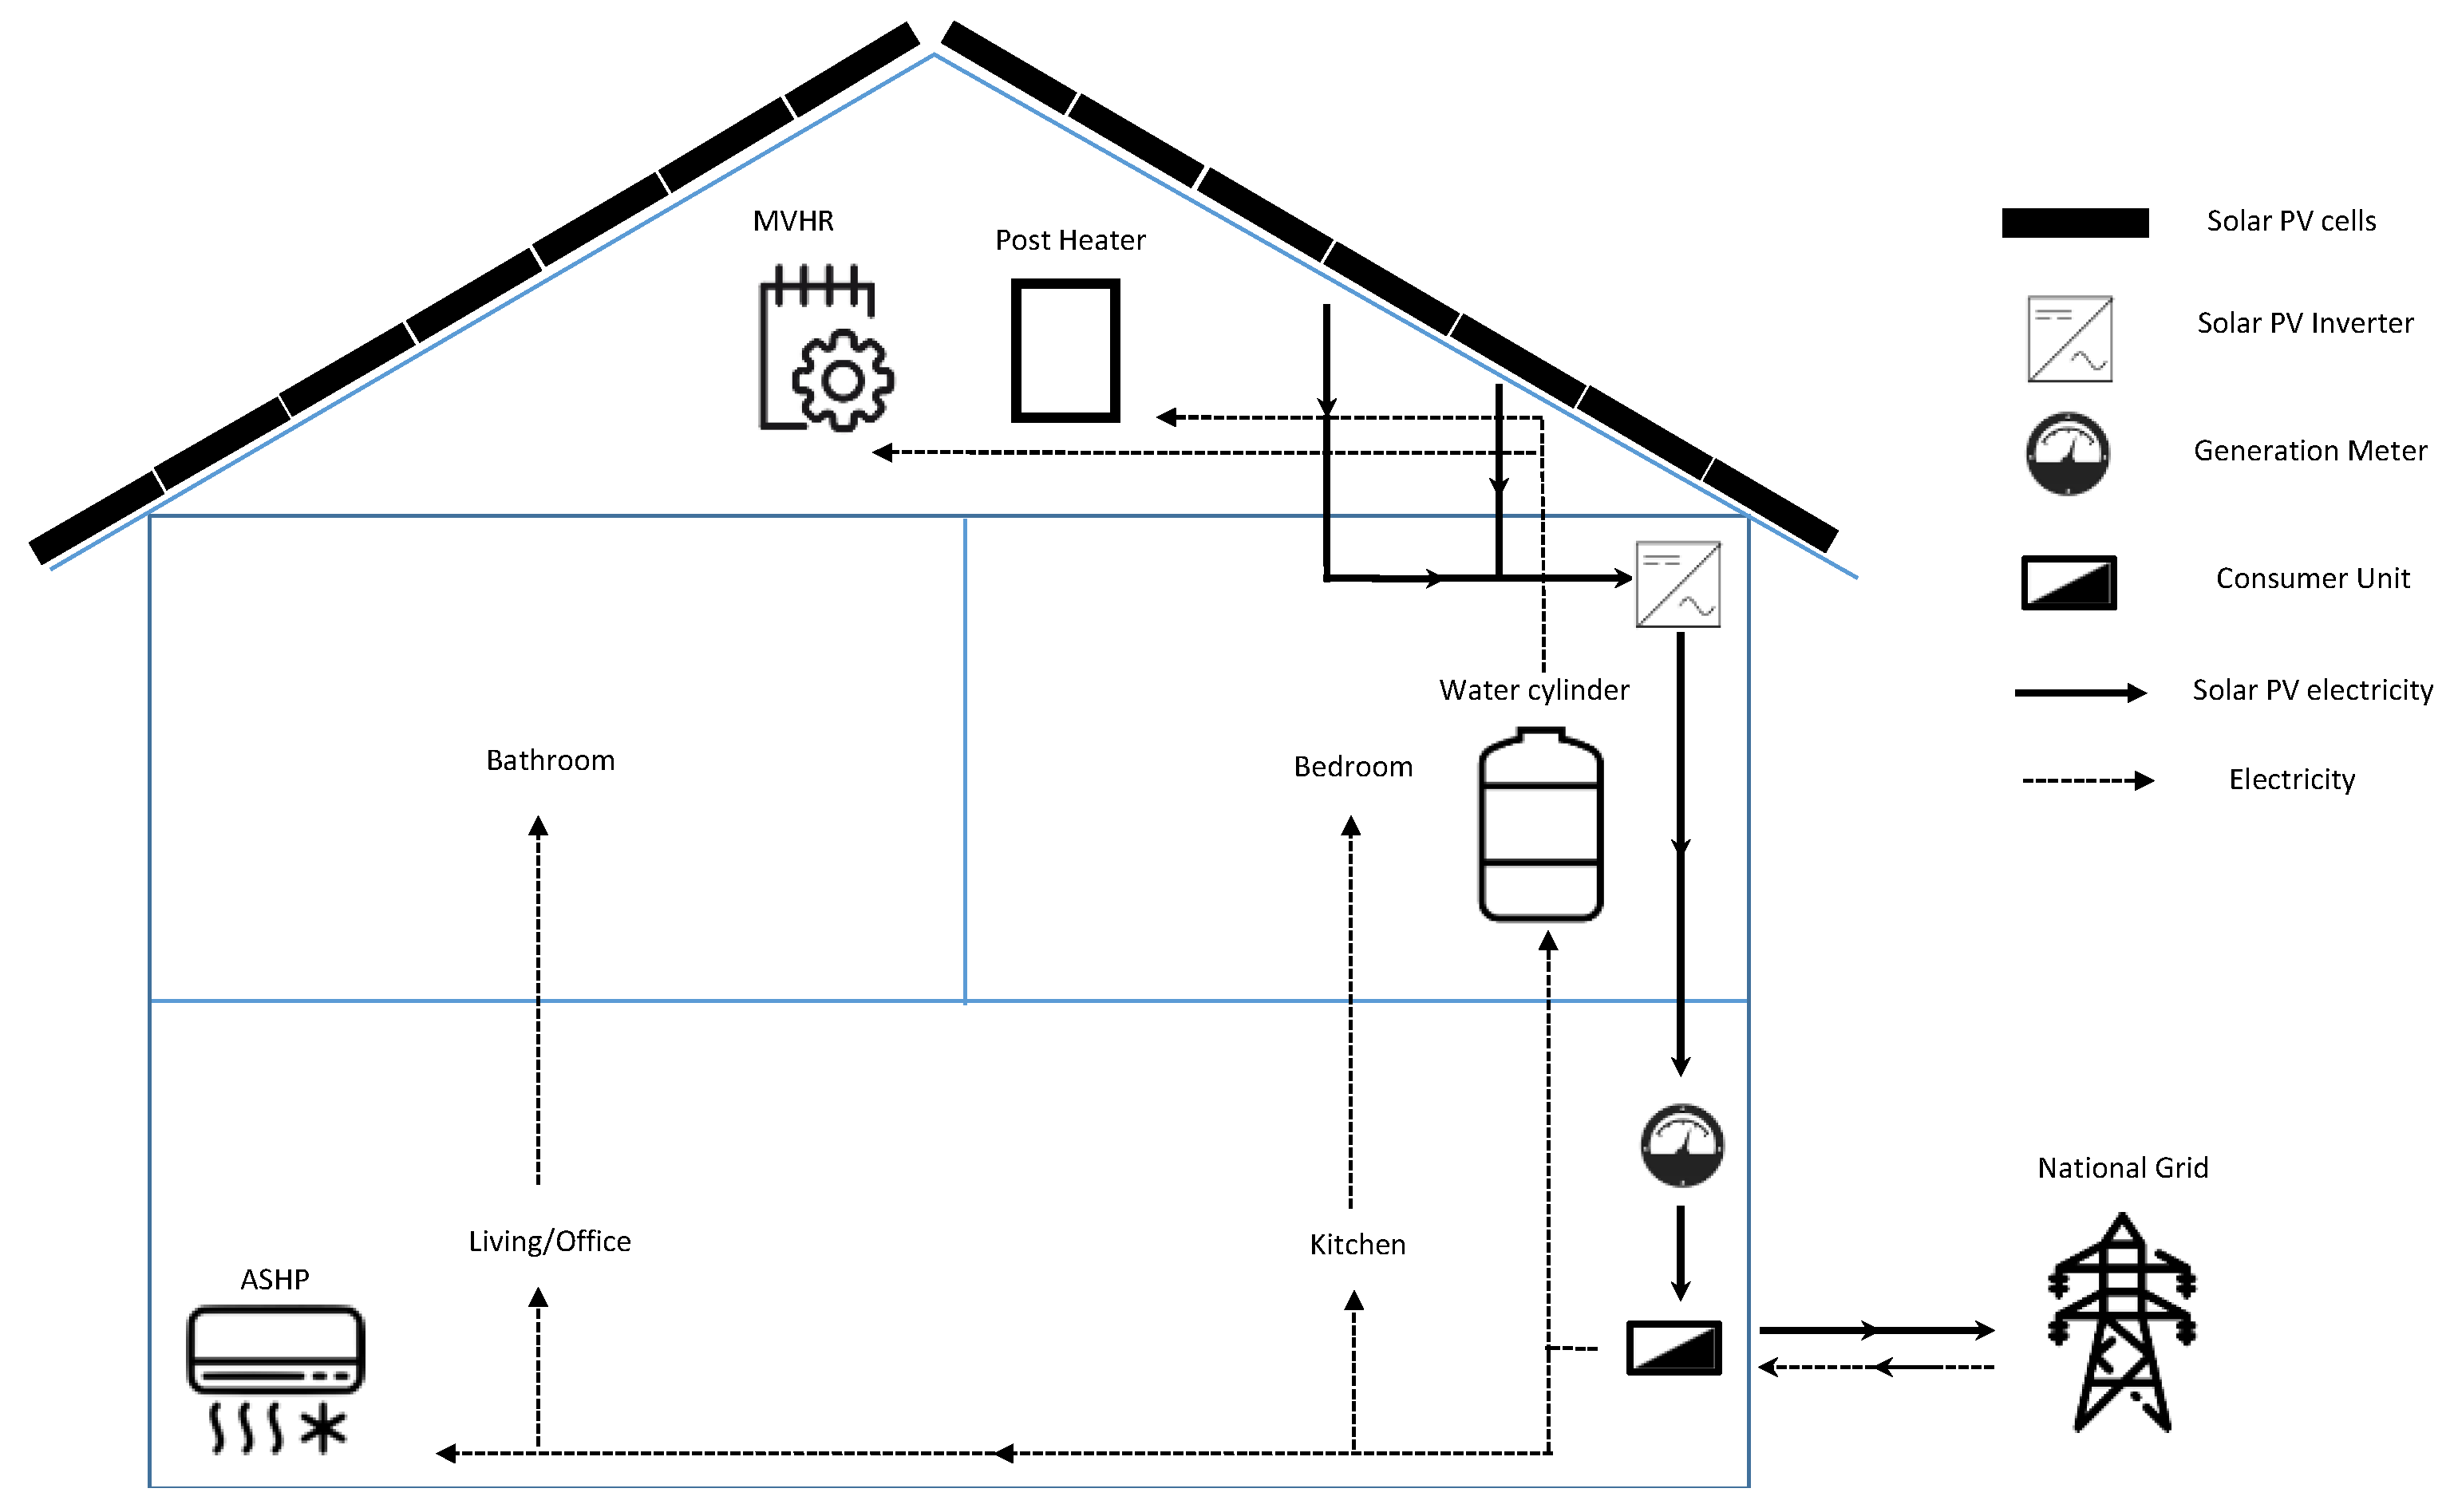
Figure 6.
Simultaneous game payoff matrix.

Figure 7.
Sequential Timing.
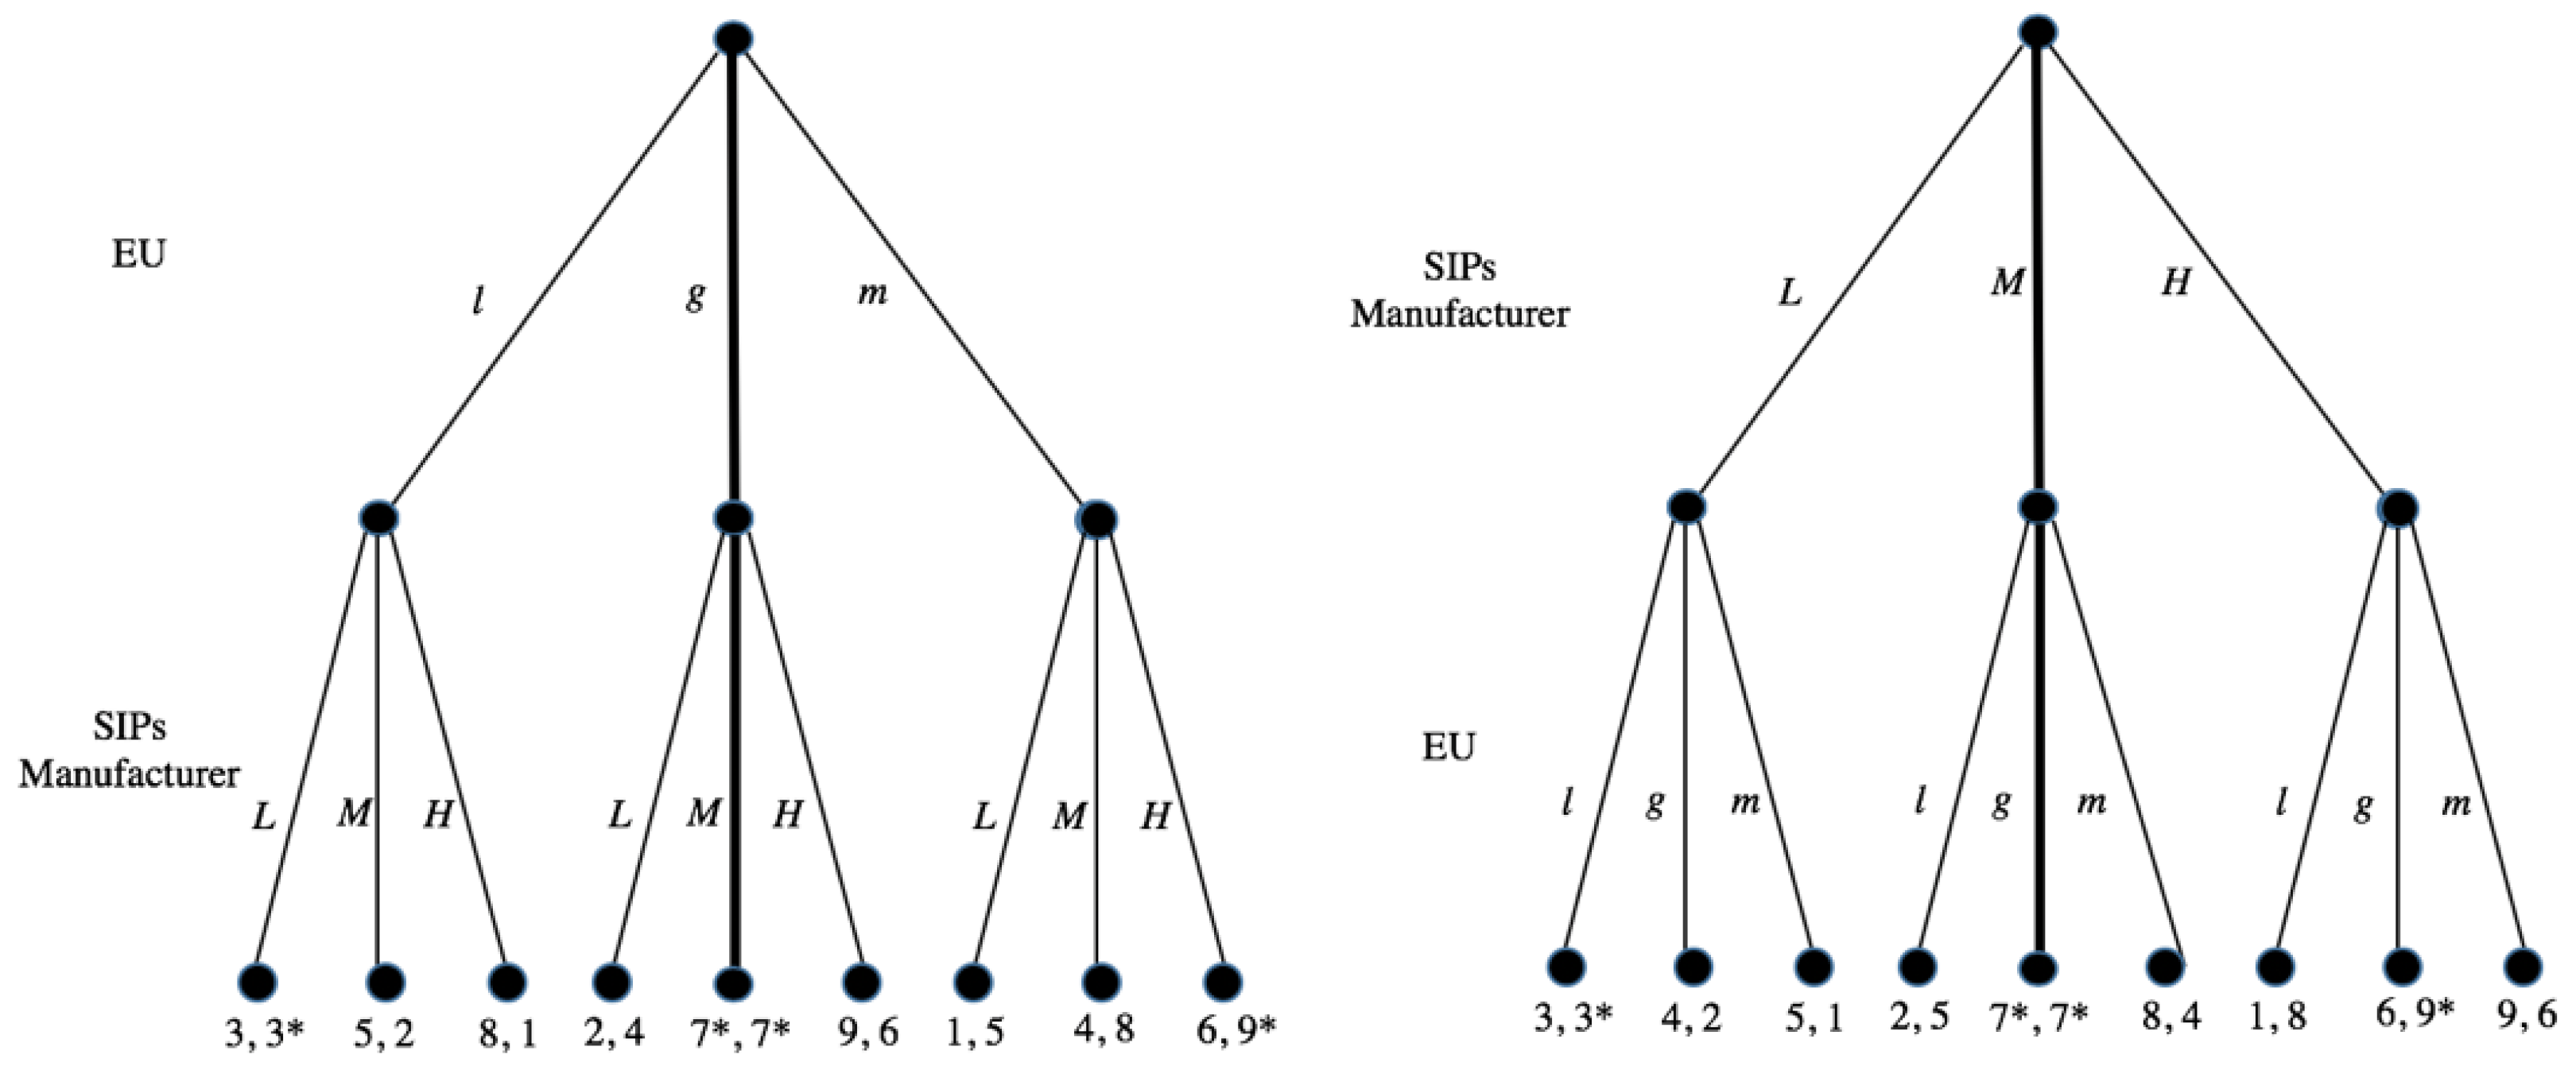
Table 1.
nZEB standards across the UK and EU.
| Country | 2021 nZEB Standard Eprim kWh/m2/Year | Country | 2021 nZEB Standard Eprim kWh/m2/Year |
|---|---|---|---|
| Austria | 160 [1] | Italy | Available with no specific values set |
| Belgium | 45 [1] | Latvia | 95 [1] |
| Bulgaria | 30–50 [1] | Lithuania | Under development |
| Croatia | 33–41 [1] | Luxembourg | Under development |
| Cyprus | 100 [1] | Malta | 40 [1] |
| Czech Republic | Under development | Netherlands | Under development |
| Denmark | 20 [1] | Poland | 60–75 [1] |
| Estonia | 50–100 [1] | Portugal | Under development |
| Finland | Under development | Romania | 93–217 [1] |
| France | 40–65 [1] | Slovakia | 32–54 [1] |
| Germany | Under development | Slovenia | 45–50 [1] |
| Greece | Under development | Spain | Under development |
| Hungary | 50–72 [1] | Sweden | 30–75 [1] |
| Ireland | 45 [1,27] | UK | 44 [1] |
Publisher’s Note: MDPI stays neutral with regard to jurisdictional claims in published maps and institutional affiliations. |
© 2022 by the authors. Licensee MDPI, Basel, Switzerland. This article is an open access article distributed under the terms and conditions of the Creative Commons Attribution (CC BY) license (https://creativecommons.org/licenses/by/4.0/).
Share and Cite
MDPI and ACS Style
Finnegan, S.; Edwards, R.; Al-Derbi, B.; Campbell, I.; Fulton, M. The Potential of Structurally Insulated Panels (SIPs) to Supply Net Zero Carbon Housing. Buildings 2022, 12, 2081. https://doi.org/10.3390/buildings12122081
AMA Style
Finnegan S, Edwards R, Al-Derbi B, Campbell I, Fulton M. The Potential of Structurally Insulated Panels (SIPs) to Supply Net Zero Carbon Housing. Buildings. 2022; 12(12):2081. https://doi.org/10.3390/buildings12122081
Chicago/Turabian StyleFinnegan, Stephen, Robert Edwards, Bushra Al-Derbi, Iona Campbell, and Matt Fulton. 2022. "The Potential of Structurally Insulated Panels (SIPs) to Supply Net Zero Carbon Housing" Buildings 12, no. 12: 2081. https://doi.org/10.3390/buildings12122081
Note that from the first issue of 2016, this journal uses article numbers instead of page numbers. See further details here.