
Data-Driven Analysis for Facility Management in Higher Education Institution
by
 , and
, and
Ashish Kumar Pampana
1, 
JungHo Jeon
2 ,
,
Soojin Yoon
3,*,
Theodore J. Weidner
4 and
Makarand Hastak
5 1
Civil and Environmental Engineering, Oklahoma State University, 503 Engineering North, Stillwater, OK 74078, USA
2
Department of Civil and Environmental Engineering and Engineering Mechanics, University of Dayton, Dayton, OH 45469, USA
3
Division of Engineering Technology, Oklahoma State University, 511 Engineering North, Stillwater, OK 74078, USA
4
Construction Engineering and Management, Purdue University, 550 Stadium Mall Drive, West Lafayette, IN 47907, USA
5
Lyles School of Civil Engineering, Purdue University, 550 Stadium Mall Drive, West Lafayette, IN 47907, USA
*
Author to whom correspondence should be addressed.
Buildings 2022, 12(12), 2094; https://doi.org/10.3390/buildings12122094
Submission received: 27 October 2022
/
Revised: 19 November 2022
/
Accepted: 23 November 2022
/
Published: 29 November 2022
(This article belongs to the Topic Advances in Construction and Project Management)
Abstract
:Planned Preventive Maintenance (PPM) and Unplanned Maintenance (UPM) are the most common types of facility maintenance. This paper analyzes current trends and status of Facility Management (FM) practice at higher education institutions by proposing a systematic data-driven methodology using Natural Language Process (NLP) approaches, statistical analysis, risk-profile analysis, and outlier analysis. This study utilizes a descriptive database entitled “Facility Management Unified Classification Database (FMUCD)” to conduct the systematic data-driven analyses. The 5-year data from 2015 to 2019 was collected from eight universities in North America. A preprocessing step included but was not limited to identifying common data attributes, cleaning noisy data, and removing unnecessary data. The outcomes of this study can facilitate the decision-making process by providing an understanding of various aspects of educational facility management trends and risks. The methodology developed gives decision makers of higher education institutions, including facility managers and institution administrators, effective strategies to establish long-term budgetary goals, which will lead to the enhancement of the asset value of the institutions.
1. Introduction
“APPA—Leadership in Educational Facilities” defines maintenance as a combination of all the technical administrative actions taken during the service life of a building to retain its parts and functions [1]. Higher education institutions consist of different varieties of buildings in a large number compared to other organizations, which requires a more diverse approach in operational maintenance [2]. Planned Preventive Maintenance (PPM) is one of the maintenance strategies that aims to increase the reliability or lifespan of equipment as time-based or condition-based; it refers to a proactive approach to maintenance in which maintenance work is scheduled to take place regularly [3]. Unplanned Maintenance (UPM) occurs on a random basis as reactive or emergency maintenance. An unexpected component (or equipment) failure can cost a significant amount of money or time to restore, which results in uncertainty in budget allocation in the facility management [4,5]. A study published by APPA identified a major problem in the facilities management for university premises in North America; there is a lack of planning to adequately fund FM activities in the entire building life cycle [6]. Another study identified that $26 billion are needed to fix the accumulated deferred maintenance backlog (DeM) caused by the inability to fund capital renewal/replacement of building equipment, and $5.7 billion are required to handle more urgent DeM [7]. As a result, insufficient facility maintenance, including DeM and UPM, have accelerated facility deterioration at most campus-sized institutions in the United States [7]. A study conducted in-depth interviews of 37 FM directors from Canada and identified that deferred maintenance of campus buildings resulted from declining financial aspects with growing institution size and concluded that there were insufficient funds, staff, and other resources to repair and maintain the built environment of campuses sufficiently [8].
Based on a case study [9], it was found that there is a need to improve communication between the university level facility maintenance and individual facility maintenance managers to track and implement programs, reduce redundancy, and strategically plan for the building as part of the overall campus. Unfortunately, the lack of a study exploring the status of PPM and UPM in the campus-scale higher education institutions is the primary barrier towards effective facility management. In addition, it remains unclear how the current standpoint can be analyzed based on quantitative and data-driven approaches. Therefore, there is a critical need to explore the current status of FM based on data-driven analyses.
In this context, this study analyzes the FM practices in the North American universities, with a particular focus on both PPM and UPM, based on the proposed systematic methodology. The objective was achieved via the following four steps. First, a survey was designed, distributed to facility managers at universities, and the results were analyzed to investigate the current status of PPM. Second, phone interviews were conducted to understand the overall FM practice. At this stage, natural language processing techniques (topic modeling and sentiment analysis) were used on the interview transcripts as an exploratory approach. Third, a database was developed based on the facility management data (e.g., work orders and labor hours) collected from eight universities. Fourth, three quantitative analyses (statistical comparison analysis, risk-profile analysis, and outlier analysis) were performed to analyze the database and identify critical information associated with PPM and UPM.
The results of this study are expected to facilitate the decision-making process of educational facilities by providing an understanding of various aspects of educational facility management trends and risks. It can allow administrators of higher education institutions (e.g., facility managers) to implement effective FM strategies systematically to establish long-term budgetary goals, which will lead to the enhancement of the asset value of the higher education institutions.
2. Background and Related Studies
2.1. Planned Preventive Maintenance (PPM) and Unplanned Maintenance (UPM)
PPM and UPM are two well-established approaches in the facility maintenance domain. A study proposed that PPM is carefully prepared in advance as it is done at scheduled times and is expected to be very efficient [3]. PPM is also defined as pro-active, where planning and execution of maintenance work are carried out in anticipation of the failure of facility [10]. Another study speculated in their case study that PPM can reduce the demand for correction [11]. Preventive Maintenance (PM) and planned maintenance are two primary components comprising PPM [1]. PM is a type of facility maintenance that increases the reliability or lifespan of a building and equipment is performed through periodic inspection, lubrication, and minor replacements [1,4,12]. Planned maintenance is a pre-determined job procedure that documents labor, materials, tools, and equipment to perform the task before implementing maintenance work [1].
In contrast to PPM, UPM is the work performed as the direct result of equipment failure. Since equipment failure occurs randomly, controlling UPM occurrences is a challenging task. A study reviewed maintenance definition for maintenance, repair, and replacement (MR&R) types, where UPM includes service calls, emergency responses, and unanticipated tasks [5]. UPM is also defined as reactive or emergency maintenance which leads to high maintenance costs [4]. Within UPM, reactive maintenance is a type of work done immediately after a failure to bring an asset back into operation [1]. Figure 1 illustrates the hierarchical structure of facility management as per operations & maintenance (O&M) defined by APPA [1].
As shown in Figure 1, annual resource allocation for facility management can be divided into four major maintenance categories: PPM, UPM, deferred, and non-maintenance. PPM consists of planned and preventive maintenance. Planned maintenance refers to scheduled and corrective maintenance, while preventive maintenance reflects routine and predictive maintenance. The corrective maintenance can be categorized under both planned and unplanned maintenance based on APPA [1]. However, corrective maintenance has been used differently by institutions or facility managers [13,14,15], this study considered the corrective to be unplanned maintenance. Reactive maintenance refers to emergency and unscheduled maintenance. Deferred Maintenance can be divided into many maintenance types, such as deferred corrective, recurring, backlogs, renewals, demolition, etc. [1,7]. The non-maintenance work orders include events, custodial work, warranty work, delivery and transportation of equipment and supplies, signage, banners, etc. This study also excluded project-based work orders (i.e., renovations) which involve contractors outside of the facility management.
2.2. Current FM Guideline and FM Computerized Platform
A published guideline supported by APPA, “Maintenance Staffing Guidelines for Educational Facilities”, focuses on determining the adequate maintenance staff size in managing educational facilities [16]. The guide also established baseline attribute standards for each maintenance level, which is now widely accepted as an industry standard. Another published guideline, “Operational Guidelines for Educational Facilities—Maintenance, second edition”, introduced maintenance operations that offer best management practices for effective performance in each maintenance department along with the tools of determining staff levels with several case studies and statistical methods [17]. The staffing resources were calculated for a wide variety of campus sizes using the ‘Aggregate method’ in each case study. The full-time equivalent (FTE) calculation was performed by gathering all building-related data, determining staffing factors, selecting adjustment factors (e.g., campus age, varied facilities, DeM levels, campus missions, etc.), and applying a simple formula to get the FTE value. The formula used five adjustments ranging between −10% and +10%. Adjustments were made to recognize economies of scale, condition of buildings, facility age, and campus mission. The adjustments were summed and used to increase or decrease the initial FTE estimate based on variations from the norm. Equation (1) shows the formula for FTE estimate.
A combination of computed FTE can support a work management system and provide an efficient organizational structure. APPA also introduced the “Facilities Performance Indicators (FPI)” program, which is based on a survey distributed to hundreds of North American universities, includes questions associated with facility condition index (FCI), current replacement value (CRV), energy cost, and age of buildings. The FPI report has been published every year and contains key information about the current trend and status of educational facilities. FPI aims to constantly improve the facilities by developing new tools in the field. Moreover, it provides insights on preventive maintenance programs, including reduced overtime needs, large-scale repairs, and customer service practices for improved facilities.
Additionally, the U.S. Department of Education, National Center for Education Statistics (NCES), and National Forum on Education Statistics (NFES) published a guideline, “Planning Guide for Maintaining School Facilities” [18], to develop, implement, and evaluate a facilities maintenance plan at the school district level. The guideline offers budgets, planning of school facilities maintenance, and facility audits. It also provides effective management of staff and contractors and training guidelines of school facilities for the hired staff.
Lastly, Whitestone Research published a cost reference guideline for facility maintenance and repair costs for over 1700 components and their associated maintenance tasks [19]. The components and tasks listed in Whitestone cost reference follow Uniformat II classification. The cost reference consists of various tools and critical information of the life of specific asset components, trade labor hours, historical inflation rate of maintenance and repair costs, and total cost required to maintain a facility over its service lifetime. The reference is a huge asset to the facility managers as it provides the estimates of 50-year maintenance cost profiles for 74 different models, which offers an advantage while creating budgets and cost estimates.
There are many computerized platforms available in the current market for facilities management. The platforms/variations of functionality that are applicable to this study [20] are as follows:
- IWMS: An integrated workshop management system (IWMS) is an all-in-one way to manage your facility. It includes from real estate portfolio management to floor plan. This is the most comprehensive tool in facility management;
- CMMS: A computerized maintenance management system (CMMS) focuses solely on handling facility maintenance requests. Once the MR&R is recognized, the CMMS coordinates from ticketing requests to delegating and performing the repair activity;
- CAFM: A computer-aided facility management (CAFM) is a platform to manage the actual workplace in facility management. The system handles floor plan creation, space utilization, and MR&R. This system is more effective for space management and accommodation of workers;
- EAM: An enterprise asset management (EAM) system focuses on asset management. This system tracks the number of computers and workstations, locations of the copiers, and printers. It helps facility managers update and manage the current asset and accounting.
For clarity and simplicity, all four platforms/variations are referred to as CMMS.
2.3. Facility Management Classifications
The advancement of equipment technologies and constantly evolving products in the facility domain have opened a new door towards the development of different classification systems; they categorize building elements and their related site work based on the functionality. The most widely used international classification systems in construction and facilities management include Uniformat II, OmniClassTM, MasterFormat®, UniformatTM, Uniclass, UNSPSC, etc. These classification systems follow international standards, and facility managers at the universities rely on them to maintain their database, which records varying day-to-day activities. Table 1 illustrates current FM classification systems based on their origin, updated year, classification structure, hierarchy levels, a grouping of elements, and component details.
As can be seen from Table 1, Uniformat II was developed by ASTM (American Society of Testing and Materials) International [23]. It has a hierarchical structure with three standard levels: major group elements (e.g., substructure, shell, etc.), group elements (systems), and individual elements (subsystems). However, due to limited sub-elements in this system, different organizations can highly customize it by adding elements according to their requirements [22]. MasterFormat®, a product of ‘Construction Specifications Institute’ (CSI) and ‘Construction Specifications Canada’ (CSC), is solely based on mounted elements and has a hierarchical structure with four levels: divisions, sections, elements, and sub-elements [24]. Similar to MasterFormat®, UniformatTM was developed by CSI & CSC, based on functional elements [21,25]. The structure of this classification system is hierarchical with five levels: categories, classes, two subclasses, and elements. Additionally, OmniClass Construction Classification System was developed by CSI & CSC [26]; this is similar to UK-based Uniclass [27] as both cover complete lifecycle classification of facility-built environment. The structure of OmniClassTM is faceted with six levels, which consists of work results from MasterFormat® and elements from UniformatTM [21]. Another classification system used by the state of California, i.e., United Nations Standard Products and Services Code (UNSPSC) which is based on mounted elements and its structure is hierarchical with five levels [28]. The component details criteria, Detailed/Neutral/Less Details/Not Detailed, compared the specific details present based on component characteristics provided by Whitestone cost reference [19] such as units, trade, labor details, material costs, equipment type, task type, etc.
It was observed that the classification structure of four out of six systems were hierarchical and two were faceted or combinatory. A faceted structure is defined as the categorization of elements under a combination of facets [22]. All the aforementioned classification systems are used internationally, but most of them are specifically designed for the construction industry, not for facilities management. The available classification systems are either based on functionality or mounted elements with less or no details. Therefore, there is a critical need to develop a classification system that includes component details based on both mounted elements and functionality, which can be suitable for diverse building types. This study introduces Facility Management Unified Classification Database (FMUCD) based on functionality and conduct data driven analysis to provide guidelines the facility management to make an appropriate decision in an uncertain situation at higher education institutions.
3. Methodology
The objective of this study was to explore the current status of FM practices by establishing Facility Management Unified Classification Database (FMUCD) and performing data-driven analysis for facility management in higher education institutions. Figure 2 illustrates the overall research framework. First, the survey questionnaires were distributed to the universities for data collection. Second, phone interviews were conducted, various questions about facility management practices were asked, and detailed work order history data from CMMS were collected from each university. At this stage, NLP analysis (topic modeling and sentiment analysis) was additionally conducted based on interview transcripts. Third, the database was developed using the collected raw data where all work orders were classified into different descriptive codes based on the Equipment Naming Convention; it was designed for this study by integrating the standard classification of major grouping elements of building Uniformat II with the elements published in Whitestone Cost References [19,23]. Lastly, further quantitative analyses were conducted: (1) statistical comparison analysis, (2) risk-profile analysis, and (3) outlier analysis.
3.1. Qualitative Analysis
A survey was conducted to explore the current state of PPM at universities in North America. The survey, which consists of ten questions, was developed based on five aspects (process, cost plan, budget allocation, scheduling, and decision making) of PPM. For example, two survey questions were designed to investigate the current practice and workflow of PPM in universities. The survey was distributed to facility managers who were registered as a member of the APPA at twelve universities. When collecting responses from the universities, the responses with incomplete information were excluded. In addition, out of a total of ten questions, only five questions were analyzed and presented in this study because the remaining five questions were related to personal information, data availability, etc. Table 2 summarizes the five important questions, multiple answers provided for each question, and the corresponding number of responses.
Analyzing the survey results led to the following three main observations: First, the progress of the PPM work assignments was mainly monitored based on the reports generated by CMMS (No. 1 in Table 2). This suggests that CMMS has been mainly adopted by at least half of the facility managers in universities in order to automatically monitor PPM work progress. Second, work, set-up, clean-up, and documentation were identified as the most significant four factors included in the PPM work order estimates; they accounted for 78% of the responses in question No. 3 in Table 2. Third, it was found that most of the university facility managers (76%) responded that the prioritization strategy is the most critical component to improve the effectiveness of the current PPM practice, as illustrated in question No. 5 in Table 2.
Phone interviews were conducted to understand the current status (e.g., types of management systems, maintenance components, and data recorded) of facility management and investigate practical issues in higher education institutions (i.e., universities) in North America. Compared to the survey analysis illustrated in the previous section, the focus of the interview was on exploring the overall FM practice, not being limited to the PPM. A flyer was created and distributed to facility managers who were registered as a member of APPA at thirty-five universities. As a result, twelve participants were recruited for a phone interview which was conducted from November 2019 to January 2020. A total of thirteen questions (three for planning and definition, six for data quality and variables, one for prioritization, and three for methodology) were developed and asked to respondents during the interview. (Additional survey questions can be developed in the future for a more comprehensive understanding of the current status of facility management practice at universities.) The phone interview took approximately 30 min, and each interview was recorded and transcribed digitally.
In this study, seven interview questions were excluded for further analysis since they were associated with definitions of terminologies, willingness to offer raw data, and personal information. As a result, responses to the remaining six important questions were analyzed and presented in Table 3.
It was observed that scheduled maintenance (42%) and PPM (41%) were two major organized maintenance plans adopted in most universities. Within each university, building systems and components were classified based on Uniformat (42%) and MasterFormat (33%). The maintenance task was performed on an individual component tracked. Additionally, it was found that a work order was mostly recorded at the end of the activity (58%) by the technician (83%) using CMMS (75%). The result of the interviews is assumed to reflect the recommended practices of the operation perspective in the facility management at the referenced higher education institutions.
3.2. Data Driven Analysis for Qualitative Data
Two natural language processing (NLP) techniques (topic modeling and sentiment analysis) were applied to the collected interview transcriptions containing a significant amount of textual data (over 50,000 words) to reveal important latent information that was not able to be captured during the interview. NLP techniques have been increasingly used as a quantitative method to derive meaningful insights such as keywords [29], topics [30], and sentiment [31] from a set of textual data (e.g., transcripts) obtained from the interview. Previous studies have demonstrated the efficacy and potential of applying NLP techniques, addressing limitations (e.g., time-consuming, subjective, and error-prone) that reside in qualitative approaches such as interviews and surveys. In other words, conducting NLP analysis provides an opportunity to find unexpected observations or insights based on semantic and syntactic similarities that can be observed within textual data comprising interview transcriptions.
Raw data, interview transcriptions, from 12 universities were preprocessed through the following steps: removing stop words (e.g., “the”, “am” and “a”) and noises (e.g., blanks and punctuation), word stemming, and tokenization.
Latent Dirichlet Allocation (LDA)—one of the well-established topic modeling approaches—was adopted to identify keywords and prevalent topics in the interview. LDA allows for identifying patterns that can be observed within textual data without a tedious labeling process [32]. In general, LDA produces a couple of topic groups, each of which consists of corresponding keywords. Labeling topic group (naming) relies on human interpretation and judgment [33]. As a result, two topics were identified based on the semantic similarity of keywords in Table 4, which implies that the focus of respondents during the interview was on two aspects of PPM and the maintenance system. Another interesting observation was that Archibus, an integrated platform system for infrastructure and building management [34] frequently appeared during the interviews, which suggests that it was one of the most widely used software in the universities.
Sentiment analysis was further conducted to identify the facility managers’ degree of positiveness or negativeness towards the use of PPM. Note that it was assumed that PPM was the main subject of the phone interview since it was identified as the main topic, as illustrated in Table 4. For the analysis, a large number of tokenized words derived from the previous LDA analysis were used as input to the well-established pre-trained Python module, Valence Aware Dictionary and sentiment Reasoner (VADER) [35]. VADER allows for quantitatively assessing the level of sentiments for the given texts. As a result, it provided a sentiment score between 0 and 1, where 0 indicates complete negative sentiment and 1 denotes complete positive sentiment. The criteria for positive (0.7~1.0), neutral (0.4~0.7), and negative (0.0~0.4) range was set based on the previous studies [36,37].
3.3. Facility Management Unified Classification Database (FMUCD)
Over the years, higher education institutions in North America have employed many classification systems (e.g., Uniformat II, UniformatTM, OmniClassTM, and MasterFormat®) to classify building systems, construction, and maintenance activities. As illustrated in Figure 4, Uniformat II [23] provides a more specific facility management structure with three levels (level 1-major group elements, level 2-systems, and level 3-subsystems). For example, in the figure, level 1 includes shell, interiors, services, etc. Regarding “Services” at level 1, it can be divided into HVAC, plumbing, electrical, conveying, and fire protection. For HVAC at level 3, it consists of heating, cooling, distribution systems, controls & instrumentation, terminal & package units, energy supply, etc.
This study established a descriptive code entitled Facility Management Unified Classification Code (FMUCO) in the database. The purpose of the FMUCO is (1) to compile the current data from universities to create Mega data and (2) to conduct the data-driven analysis to explore the current status of the facility management in higher education institutions. The FMUCO code is created by combining Uniformat II with generic descriptions of building components from Whitestone cost reference [19] shown in Figure 5.
As illustrated in Figure 5, the proposed descriptive code is composed of an 8-digit code; the first three digits describe the system code, the next two digits define the subsystem, and the last three digits are the abbreviation of the component description. The FMUCO has 543 descriptive codes, new elements can be added in the future. This classification method permitted the collected data for each university, which varied significantly in terms of data type, data points, and data attributes (e.g., work order description, cost information, labor hours, etc.), to be managed for the study. Data preprocessing was performed to develop a structured and organized database shown in Figure 6. This preprocessing step included but was not limited to identifying common data attributes, cleaning noisy data, and removing unnecessary data.
3.4. Quantitative Analysis
The database developed for this study allowed identification of critical information and risks involved in the facilities management at the component level. Three types of data-driven approaches were adopted for quantitative analysis: (1) statistical comparison analysis, (2) risk-profile analysis, and (3) outlier analysis. Statistical comparison analysis (1) was conducted to explore the current trend of PPM and UPM for the referenced universities. At this stage, the ten systems (e.g., HVAC, electrical, plumbing, conveying, fire protection, etc.) were compared to identify the highest number of work orders and labor hours associated with PPM and UPM at the system level. (2) Risk-profile analysis was conducted on the top three systems to distinguish the risks in the subsystem level of UPM. The risk profiles for top systems aimed to provide basic knowledge to the facility managers about the subsystems with a high probability of getting a UPM work order. The outlier analysis (3) was conducted to identify components with a high risk of generating UPM work orders.
3.5. Data Driven Analysis for Quantitative Data: Statistical Comparison Analysis
The statistical comparison analysis was performed on the developed database to explore the current trend in PPM and UPM shown Figure 7 and Figure 8. As can be seen from Figure 7 and Figure 8, the bar charts indicate the annual average numbers, i.e., the five-year trend of PPM and UPM with work order counts (WO) and labor hours (LH) per million square feet (MSF) at eight universities for the years 2015 to 2019.
Comparing the five-year trend of PPM and UPM revealed that, the PPM recorded an average of 3725 work orders, while there was an average of 2491 UPM work orders during the given period. Similarly, the average PPM labor hours were 13,935.5 and the average UPM labor hours were 8487.5. As deterioration of buildings is considered, although the budget for PPM has been increased, it is revealed that the budget for UPM has remained consistent. Therefore, such a finding will be able to utilize as a guideline for facility managers or decision makers to allocate the budget for the PPM and UPM. Figure 9 and Figure 10 illustrate the number of work orders and labor hours at the system level for the entire area maintained. The annual average work order count and labor hours of ten systems were investigated for PPM and UPM.
As can be seen from Figure 9 and Figure 10, HVAC was identified as the most significant system resulting in the highest number of work orders and labor hours every year, followed by electrical, fire protection, and plumbing systems in the PPM, while the HVAC system again was identified as the most critical system resulting in the highest number of work orders and labor hours, followed by plumbing, and electrical systems in the UPM. Although work order counts for the top two systems are similar, HVAC (4874) and plumbing (4870), HVAC consumed significantly higher number of labor hours in both PPM and UPM. Additionally, interior construction, interior finishes, and furnishings are also identified to be on the higher side compared to PPM whereas conveying systems and exterior enclosure generated lower UPM work orders.
3.6. Data Driven Analysis for Quantitative Data: Risk Profile Analysis
The risk-profile analysis in facilities management can be defined as the assessment of the inoperability of building equipments. A study conducted the severity analysis of Indian coal mine accidents with the historical data of 100 years with Weibull and Exponential distributions for evaluating hazard rate functions; whereas Poisson and Negative Binomial distributions for risk profiles of mine accidents [38]. To compare which distribution fits best to the data, a recent study analyzed the robustness of different methods of comparing fitted distributions such as AIC (Akaike Information Criterion), BIC (Bayesian Information Criterion), LRT (log-likelihood ration test), etc. [39]. AIC and BIC measure the performance of the models based on their complexity. AIC is a prediction error estimator which prevents overfitting of data whereas BIC penalizes the model more based on the number of parameters. While comparing the AIC and BIC, lower scores are preferred and both information criteria are used for appropriate model selection, and it can also be used for distribution selection [39]. The Negative Binomial (NB) distribution for a discrete random variable (X) can be calculated based on Equation (2) [40]:
where x = r, r + 1, …, p refers to the independent Bernoulli trials, r is a fixed integer. From Equation (1), it can be said that X follows NB distribution at which rth success occurs. The parameters of NB fit are denoted by the number of successes (r) and event probability (p).
In this study, survival function risk profiles were developed to identify the high probability of getting a UPM work order at the subsystem level. Risk-profile consists of three steps: (1) Data mining, (2) Distribution fitting, and (3) Generation of the survival function risk-profiles. The data mining (1) is to select the appropriate data points from the raw data. The distribution fitting (2) is to find appropriate probability distributions by calculating AIC and BIC scores. The last step is generation of the survival function risk-profiles (3) where, the top three systems (HVAC, electrical, and plumbing from Figure 10) with their respective subsystems (e.g., heating, cooling, distribution, etc. for HVAC), identified to distinguish the risks in the UPM. As a result, Table 5 shows the comparison of distribution fits for the systems and subsystems based on AIC & BIC scores. The distribution fitting and comparisons were performed using R-programming.
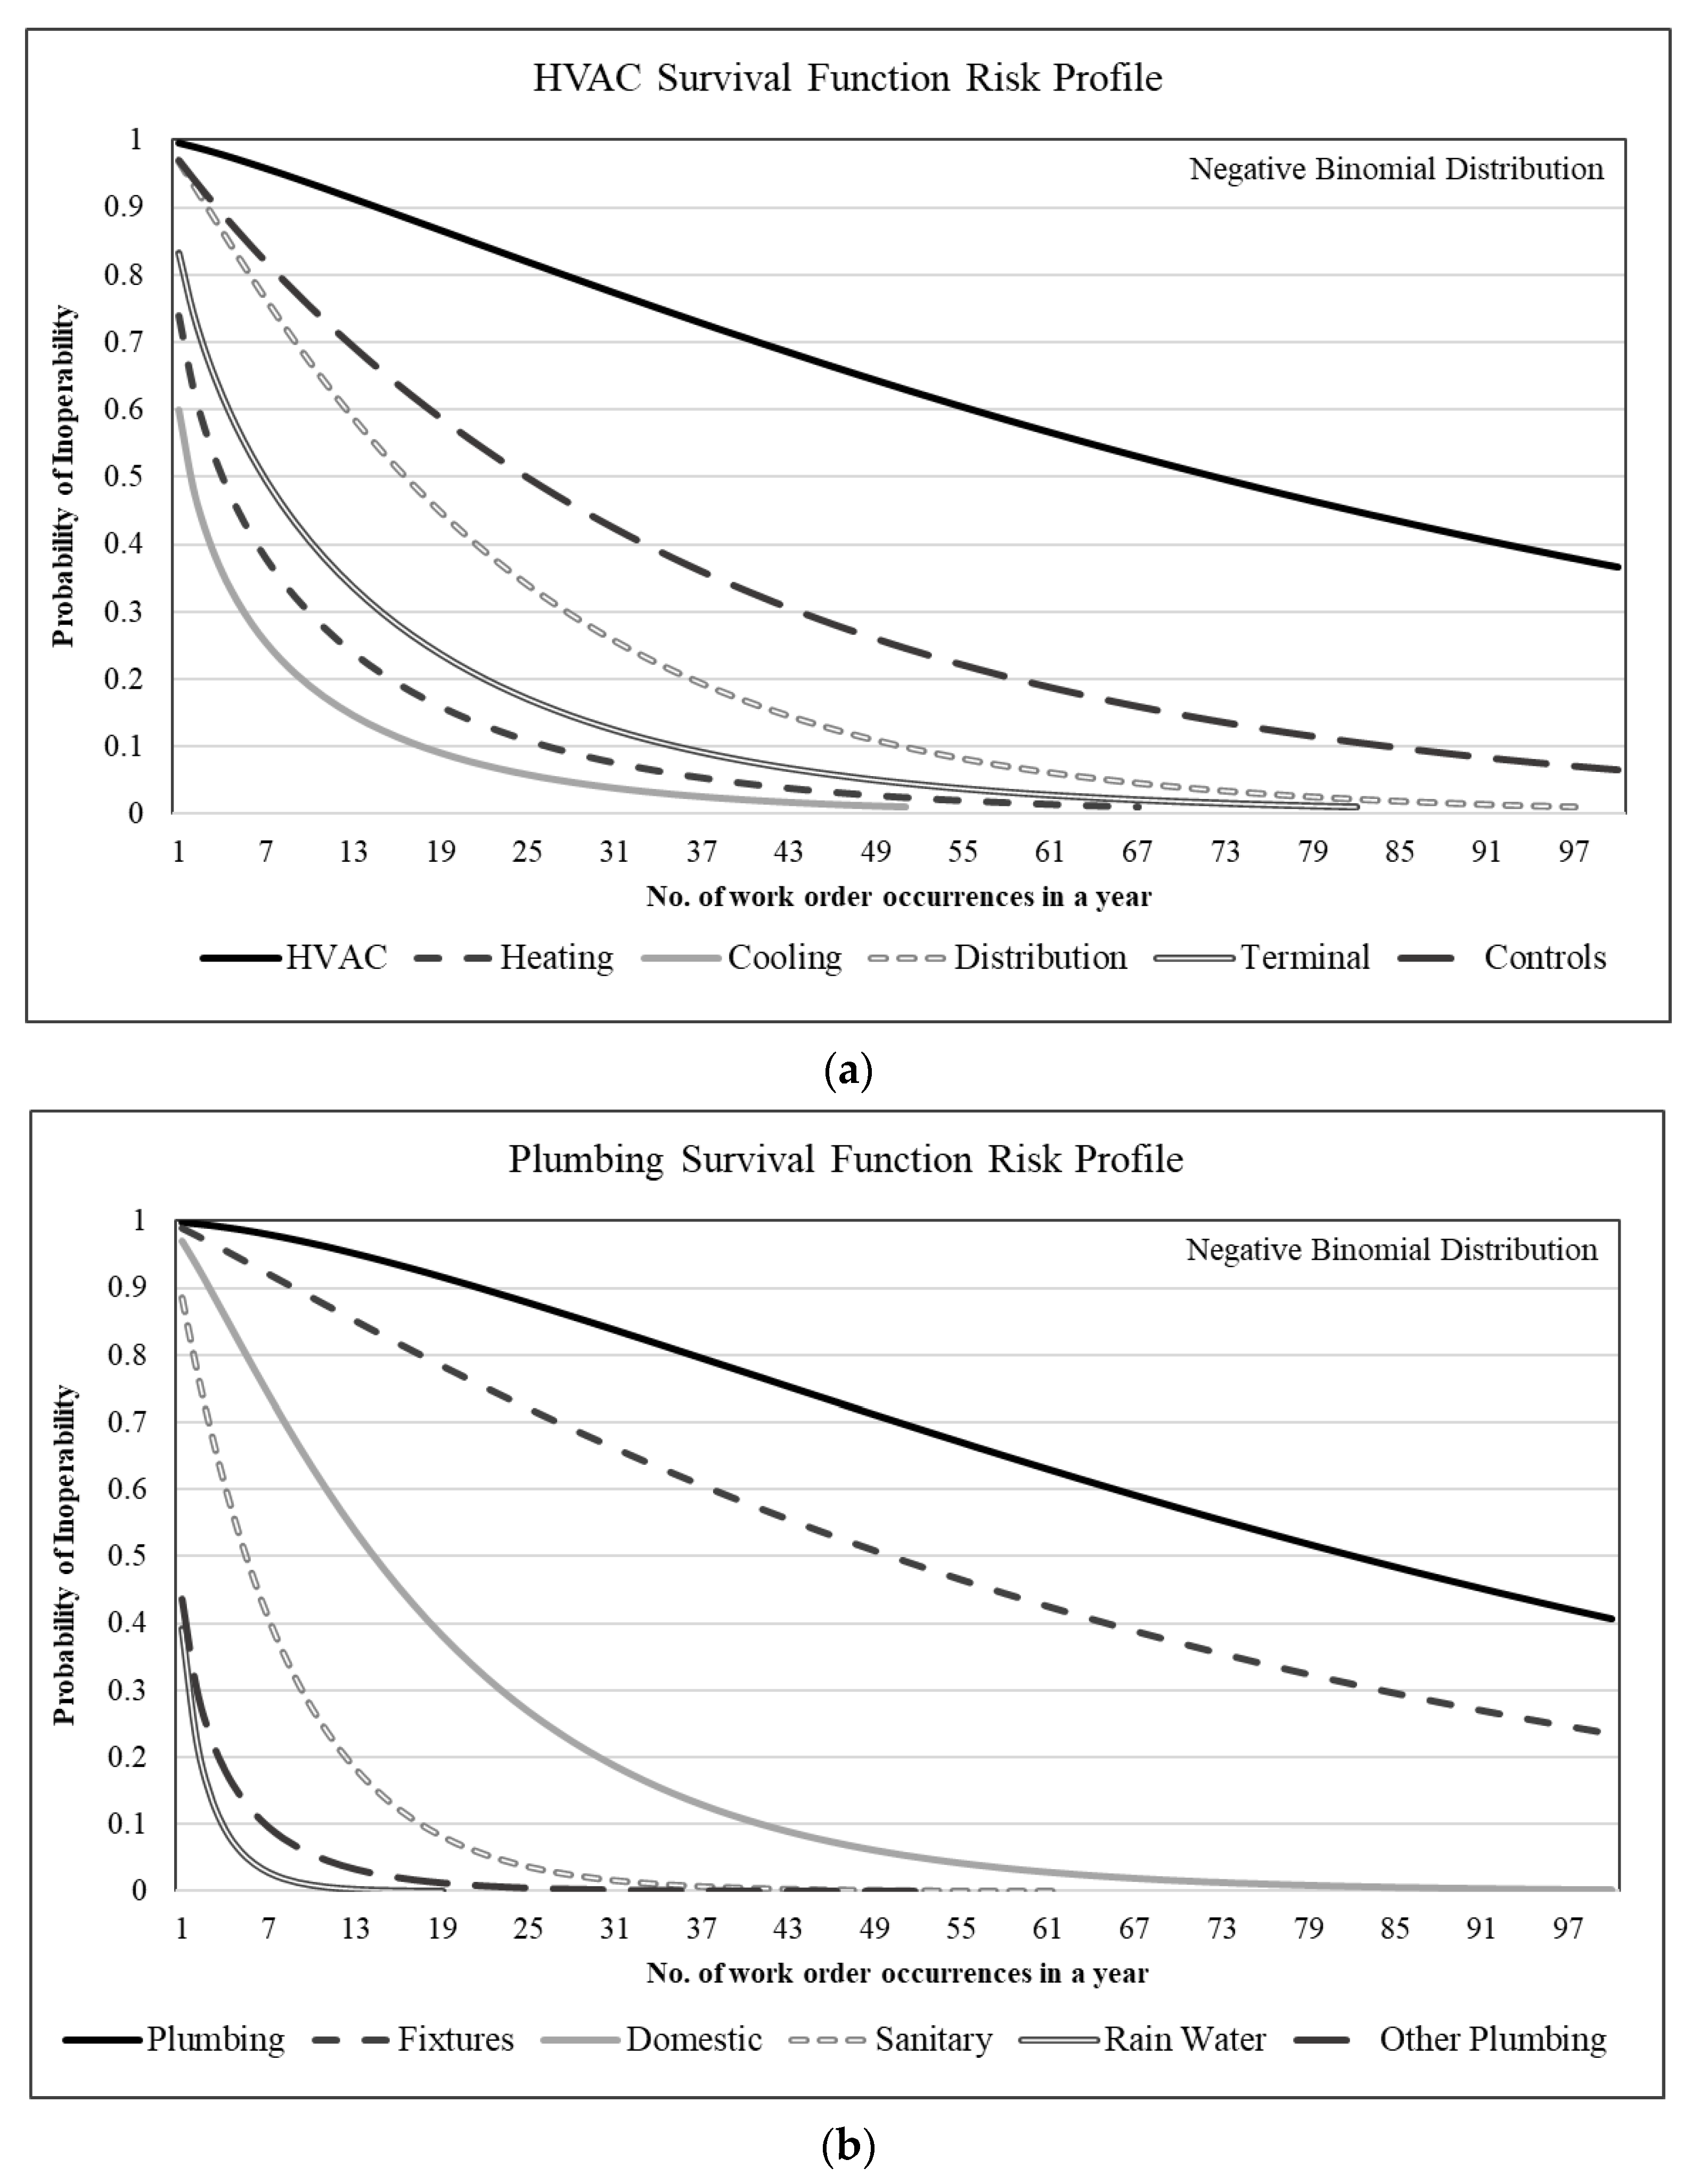
Table 5 shows that NB distribution fits the data best based on lower AIC & BIC scores. The table also shows the NB fit parameters (r and p) which were used to generate the risk profiles of the individual systems as well as their subsystems. Figure 11 illustrate the results of the survival function risk profiles for HVAC, plumbing, and electrical systems.
The risk-profiles are presented in Figure 11 where the x-axis represents the number of work order occurrences in a year for a building and y-axis represents the probability of inoperability. The probability of inoperability refers to all the occurrences which hindered the operation of the building elements. The probabilities for each occurrence were calculated for the x-axis ranging from 1 to 100. Each plot represents the probability of all major subsystems of a respective system with 850 data points of the top 25 buildings with most UPM work orders were identified for each of the eight universities for 2 to 5 years. As can be seen from Figure 11a, the controls & instrumentation resulted in highest inoperability probability as HVAC control panel, airflow and thermostat adjustment requests are very frequent in a building. Distribution systems resulted in the second most work order generating subsystem with repair requests as it is comprised of components like air handlers, fans, filters, ventilation, etc. Terminal & package units and heat generation systems were found to generate moderate number of MR&R requests with cooling generation systems being the lowest probability of generating UPM work orders. In Figure 11b, plumbing fixtures resulted in the highest probability of inoperability in plumbing systems. The key components in fixtures are sink, toilet, shower, bathtub, etc. Domestic water distribution being the second most prone subsystem followed by sanitary waste. Rain water drainage and other plumbing systems resulted in low inoperability probability. Additionally, Figure 11c illustrates that lighting and branch wiring subsystem dominated the system in terms of inoperability in electrical systems. Communications and security being moderate in terms of work order requests followed by electrical service and distributions. Other electrical system was found to be negligible in terms of UPM work order requests.
Interestingly enough, the HVAC work consisted of mostly controls and distribution systems work orders where controls and instrumentation having only 4 components (control panel, thermostat, digital controls, and meters) generated adjustment work orders in majority while distribution system generated more MR&R activities having more diverse components. On the other hand, plumbing work was dominated by plumbing fixtures and electrical work primarily consisted of lighting and branch wiring work orders. Considering the fact that universities spend a great deal of resources doing PPM work in fire protection which benefited the FM in reducing UPM work significantly but failed to do the same for other major systems. Therefore, the proposed diverse analyses, including a statistical analysis and a risk-profile analysis, are necessary to acknowledge the current status of the facility management from different angles.
Additionally, the outlier analysis allowed for understanding which building elements require careful consideration when planning PPM work. Out of the top 25 UPM buildings selected, the outliers from the HVAC system included the exhaust fan, air-conditioner, unit heater, fan, and thermostat (temperature issues). Similarly, the top components having the higher risk for generating electrical work orders involved the light fixtures, circuit breaker, smoke detector, and receptacle. The top outliers for plumbing systems were found to be toilet & stall, sink, urinals, floor drains, and shower. Table 6 presents the components recorded for over 100 number of occurrences generated for a building in a year.
As shown in Table 6, thermostat adjustments and issues recorded the highest number of workorder for a university in a year. This is one of the most requested facility operations in the buildings. For HVAC, air conditioners, air handlers, and radiators also generate high work order numbers. For electrical, light changing requests are frequent and changing of batteries in equipments seems more like routine requests. For Plumbing, sink and toilet repair requests are the most common request followed by the bathtub and shower enclosure. As a result, the outlier analysis helps facility managers (1) recognize the components registering more than 100 work orders in MR&R, and (2) to prepare budget allocation for facility management.
4. Discussion and Conclusions
This study attempted to analyze the current trend and status of Facility Management (FM) practice at higher education institutions by proposing (1) the Facility Management Unified Classification Database (FMUCD), and (2) the systematic data-driven analyses: survey questionnaires and phone interviews, Natural Language Process (NLP) approaches, statistical analysis, risk-profile analysis, and outlier analysis.
The current trends and status of PPM at universities were mainly identified from the survey, phone interview, and statistical comparison analysis. The survey revealed that the progress of the PPM work was mostly monitored based on the Computer Maintenance Management System (CMMS) reports and four factors (work, set-up, clean-up, and documentation) were critical for the PPM estimates. Analyzing interview results suggested that schedule maintenance and PPM were two major organized maintenance plans at universities. At this stage, the application of NLP approaches found that the focus of the interview was on PPM, supported by the positive sentiment scores. From the statistical analysis, it was revealed that although PPM work order count increased over the years, UPM work orders remains consistent. Therefore, such a finding will be applied to be a guideline for facility managers or decision makers to allocate budgets for PPM and UPM; the budget of the UPM can be similar to the last year while, the budget of the PPM can be increased according to the budget flexibility. Additionally, HVAC was identified as the most significant system resulting in the highest number of work orders and labor hours every year in both PPM and UPM.
Findings related to UPM were mostly derived from risk-profile analysis and outlier analysis. At the system level, the main trades were HVAC, electrical, and plumbing which generated higher work orders and labor hours. Especially, while distribution systems and controls & instrumentation in HVAC were found to generate the maximum number of UPM work orders, lighting and branch wirings and communication & security for electrical, and plumbing fixtures in plumbing systems were identified as a major proportion of UPM work. Therefore, the proposed FMUCD and the results of the data-driven analyses will provide guidelines and best practices for the facility management to make an appropriate decision in an uncertain situation at higher education institutions. Moreover, the broader impact of this research is that it would help stakeholders of any campus-sized institution to develop, operate, maintain, upgrade, and disperse their assets in a cost-effective manner.
Author Contributions
Conceptualization, S.Y., T.J.W., M.H.; Methodology, A.K.P., S.Y., T.J.W. and J.J.; Software, A.K.P., J.J.; Validation, A.K.P., S.Y., J.J. and M.H.; Formal Analysis, A.K.P., S.Y., J.J. and T.J.W.; Investigation, T.J.W., S.Y., J.J. and M.H.; Resources, S.Y., T.J.W. and M.H.; Data Curation, S.Y. and T.J.W.; Writing—Original Draft Preparation, A.K.P., S.Y., T.J.W. and J.J.; Writing—Review and Editing, A.K.P., S.Y., T.J.W. and J.J.; Visualization, A.K.P., S.Y.; Supervision, S.Y., T.J.W. and M.H.; Project Administration, S.Y., T.J.W. and M.H.; Funding Acquisition, S.Y., T.J.W. and M.H. All authors have read and agreed to the published version of the manuscript.
Funding
This research received no external funding.
Data Availability Statement
Some or all data, models, or code that support the findings of this study are available from the corresponding author upon reasonable request.
Conflicts of Interest
The authors declare that the research was conducted in the absence of any commercial or financial relationships that could be construed as a potential conflict of interest.
References
- Association of Physical Plant Administrators (APPA) Facilities Maintenance and Operations. Available online: https://www.appa.org/bok/facilities-maintenance-and-operations/ (accessed on 12 September 2021).
- Amaratunga, D.; Baldry, D. Assessment of Facilities Management Performance in Higher Education Properties. Facilities 2000, 18, 293–301. [Google Scholar] [CrossRef]
- Doyen, L.; Gaudoin, O. Modeling and Assessment of Aging and Efficiency of Corrective and Planned Preventive Maintenance. IEEE Trans. Reliab. 2011, 60, 759–769. [Google Scholar] [CrossRef]
- Rani, N.A.A.; Baharum, M.R.; Akbar, A.R.N.; Nawawi, A.H. Perception of Maintenance Management Strategy on Healthcare Facilities. Procedia-Soc. Behav. Sci. 2015, 170, 272–281. [Google Scholar] [CrossRef] [Green Version]
- Yoon, S.J. New Paradigm for Deferred Maintenance Budget Allocation 2018; Purdue University: West Lafayette, IN, USA, 2018. [Google Scholar]
- Rose, R. Buildings—The Gifts That Keep on Taking: A Framework for Integrated Decision Making; APPA CFaR Center for Facilities Research; APPA: Alexandria, VA, USA, 2007; ISBN 1890956384. [Google Scholar]
- Yoon, S.; Weidner, T.; Hastak, M. Total-Package-Prioritization Mitigation Strategy for Deferred Maintenance of a Campus-Sized Institution. J. Constr. Eng. Manag. 2021, 147, 4020185. [Google Scholar] [CrossRef]
- Wright, T.S.A.; Wilton, H. Facilities Management Directors’ Conceptualizations of Sustainability in Higher Education. J. Clean. Prod. 2012, 31, 118–125. [Google Scholar] [CrossRef]
- Lavy, S. Facility Management Practices in Higher Education Buildings. J. Facil. Manag. 2008, 6, 303–315. [Google Scholar] [CrossRef]
- Oseghale, G.E.; Ikpo, I.J. An Evaluation of Industrial Facilities Defects in Selected Industrial Estates in Lagos State, Nigeria. Civ. Eng. Dimens. 2014, 16, 171–179. [Google Scholar] [CrossRef] [Green Version]
- Che-Ani, A.I.; Ali, R. Facility Management Demand Theory. J. Facil. Manag. 2019, 17, 344–355. [Google Scholar] [CrossRef]
- Fregonese, L.; Achille, C.; Adami, A.; Fassi, F.; Spezzoni, A.; Taffurelli, L. BIM: An Integrated Model for Planned and Preventive Maintenance of Architectural Heritage. In Proceedings of the 2015 Digital Heritage, Granada, Spain, 28 September–2 October 2015; Volume 2, pp. 77–80. [Google Scholar]
- Trojan, F.; Marçal, R.F.M. Proposal of Maintenance-Types Classification to Clarify Maintenance Concepts in Production and Operations Management. J. Bus. Econ. 2017, 8, 560–572. [Google Scholar]
- Stenström, C.; Norrbin, P.; Parida, A.; Kumar, U. Preventive and Corrective Maintenance-Cost Comparison and Cost-Benefit Analysis. Struct. Infrastruct. Eng. 2016, 12, 603–617. [Google Scholar] [CrossRef]
- Wang, Y.; Deng, C.; Wu, J.; Wang, Y.; Xiong, Y. A Corrective Maintenance Scheme for Engineering Equipment. Eng. Fail. Anal. 2014, 36, 269–283. [Google Scholar] [CrossRef]
- Weidner, T.; Adams, M. Maintenance Staffing Guidelines for Educational Facilities; APPA: Alexandria, VA, USA, 2002; ISBN 1-890956-23-6. [Google Scholar]
- Bigger, A.S.; Becker, J.T. Operational Guidelines for Educational Facilities-Maintenance, 2nd ed.; APPA: Alexandria, VA, USA, 2011; Volume 2, ISBN 1-890956-67-8. [Google Scholar]
- Szuba, T. Planning Guide for Maintaining School Facilities; DIANE Publishing: Darby, PA, USA, 2003; ISBN 1428925597. [Google Scholar]
- Whitestone Research. The Whitestone Facility Maintenance and Repair Cost Reference, 18th ed.; Whitestone Research: Santa Barbara, CA, USA, 2014. [Google Scholar]
- Sheynkman, A. What’s the Difference: IWMS, CMMS, CAFM and EAM? Available online: https://spaceiq.com/blog/difference-between-iwms-cmms-cafm-eam/ (accessed on 27 July 2021).
- Afsari, K.; Eastman, C.M. A Comparison of Construction Classification Systems Used for Classifying Building Product Models. In Proceedings of the 52nd ASC Annual International Conference Proceedings, Provo, UT, USA, 13–16 April 2016; pp. 1–8. [Google Scholar]
- Kula, B.; Ergen, E.; Kula, B.; Ergen, E. Review of Classification Systems for Facilities Management. In Proceedings of the 13th International Congress on Advances in Civil Engineering, Izmir, Turkey, 12–14 September 2018; pp. 1–8. [Google Scholar]
- Charette, R.P.; Marshall, H.E. UNIFORMAT II Elemental Classification for Building Specifications, Cost Estimating, and Cost Analysis; Department of Commerce, Technology Administration, National Institute of Standards and Technology: USA, 1999; ISBN NISTIR 6389.
- MasterFormat®. Available online: https://www.csiresources.org/standards/masterformat (accessed on 21 July 2021).
- UniFormatTM: A Uniform Classification of Construction Systems and Assemblies; The Construction Specifications Institute: Alexandria, VA, USA, 2010; ISBN 978-0-9845357-1-2.
- OmniClassTM. Available online: https://www.csiresources.org/standards/omniclass (accessed on 21 July 2021).
- Gelder, J. The Principles of a Classification System for BIM: Uniclass 2015. In Proceedings of the 49th International Conference of the Architectural Science Association, Melbourne, VIC, Australia, 2–4 December 2015; Volume 1, pp. 287–297. [Google Scholar]
- UNSPSC. Available online: https://www.unspsc.org/ (accessed on 21 July 2021).
- Leh, A.; Köhler, J.; Gref, M.; Himmelmann, N.P. Speech Analytics in Research Based on Qualitative Interviews. VIEW J. Eur. Telev. Hist. Cult. 2018, 7, 138. [Google Scholar] [CrossRef]
- Valenti, A.P.; Chita-Tegmark, M.; Tickle-Degnen, L.; Bock, A.W.; Scheutz, M.J. Using Topic Modeling to Infer the Emotional State of People Living with Parkinson’s Disease. Assist. Technol. 2021, 33, 136–145. [Google Scholar] [CrossRef] [PubMed]
- Parmar, M.; Maturi, B.; Dutt, J.M.; Phate, H. Sentiment Analysis on Interview Transcripts: An Application of NLP for Quantitative Analysis. In Proceedings of the 2018 International Conference on Advances in Computing, Communications and Informatics (ICACCI), Bangalore, India, 19–22 September 2018; pp. 1063–1068. [Google Scholar]
- Hagen, L.; Uzuner, O.; Kotfila, C.; Harrison, T.M.; Lamanna, D. Understanding Citizens’ Direct Policy Suggestions to the Federal Government: A Natural Language Processing and Topic Modeling Approach. In Proceedings of the 2015 48th Hawaii International Conference on System Sciences, Kauai, HI, USA, 5–8 January 2015; Volume 2015, pp. 2134–2143. [Google Scholar]
- Lee, T.Y.; Smith, A.; Seppi, K.; Elmqvist, N.; Boyd-Graber, J.; Findlater, L. The Human Touch: How Non-Expert Users Perceive, Interpret, and Fix Topic Models. Int. J. Hum. Comput. Stud. 2017, 105, 28–42. [Google Scholar] [CrossRef] [Green Version]
- Archibus Inc. Available online: https://archibus.com/about/ (accessed on 10 August 2021).
- Hutto, C.; Gilbert, E. Vader: A Parsimonious Rule-Based Model for Sentiment Analysis of Social Media Text. In Proceedings of the International AAAI Conference on Web and Social Media, Ann Arbor, MI, USA, 1–4 July 2014; Volume 8, pp. 216–225. [Google Scholar]
- Chatterjee, A.; Perrizo, W. Sentiment Trends and Classifying Stocks Using P-Trees. In From Social Data Mining and Analysis to Prediction and Community Detection; Springer: Berlin/Heidelberg, Germany, 2017; pp. 103–121. [Google Scholar]
- Chatterjee, A.; Perrizo, W. Investor Classification and Sentiment Analysis. In Proceedings of the 2016 IEEE/ACM International Conference on Advances in Social Networks Analysis and Mining (ASONAM), San Francisco, CA, USA, 18–21 August 2016; pp. 1177–1180. [Google Scholar]
- Maiti, J.; Khanzode, V.V.; Ray, P.K. Severity Analysis of Indian Coal Mine Accidents—A Retrospective Study for 100 Years. Saf. Sci. 2009, 47, 1033–1042. [Google Scholar] [CrossRef]
- Chiew, E.; Cauthen, K.; Brown, N.; Nozick, L. Comparison of Distribution Selection Methods. Commun. Stat.-Simul. Comput. 2022, 51, 1982–2005. [Google Scholar] [CrossRef]
- Washington, S.; Karlaftis, M.; Mannering, F.; Anastasopoulos, P. Statistical and Econometric Methods for Transportation Data Analysis; Chapman and Hall: London, UK; CRC: Boca Raton, FL, USA, 2020; ISBN 0429244010. [Google Scholar]
Figure 1.
Hierarchical structure of facility management [1].
Figure 1.
Hierarchical structure of facility management [1].
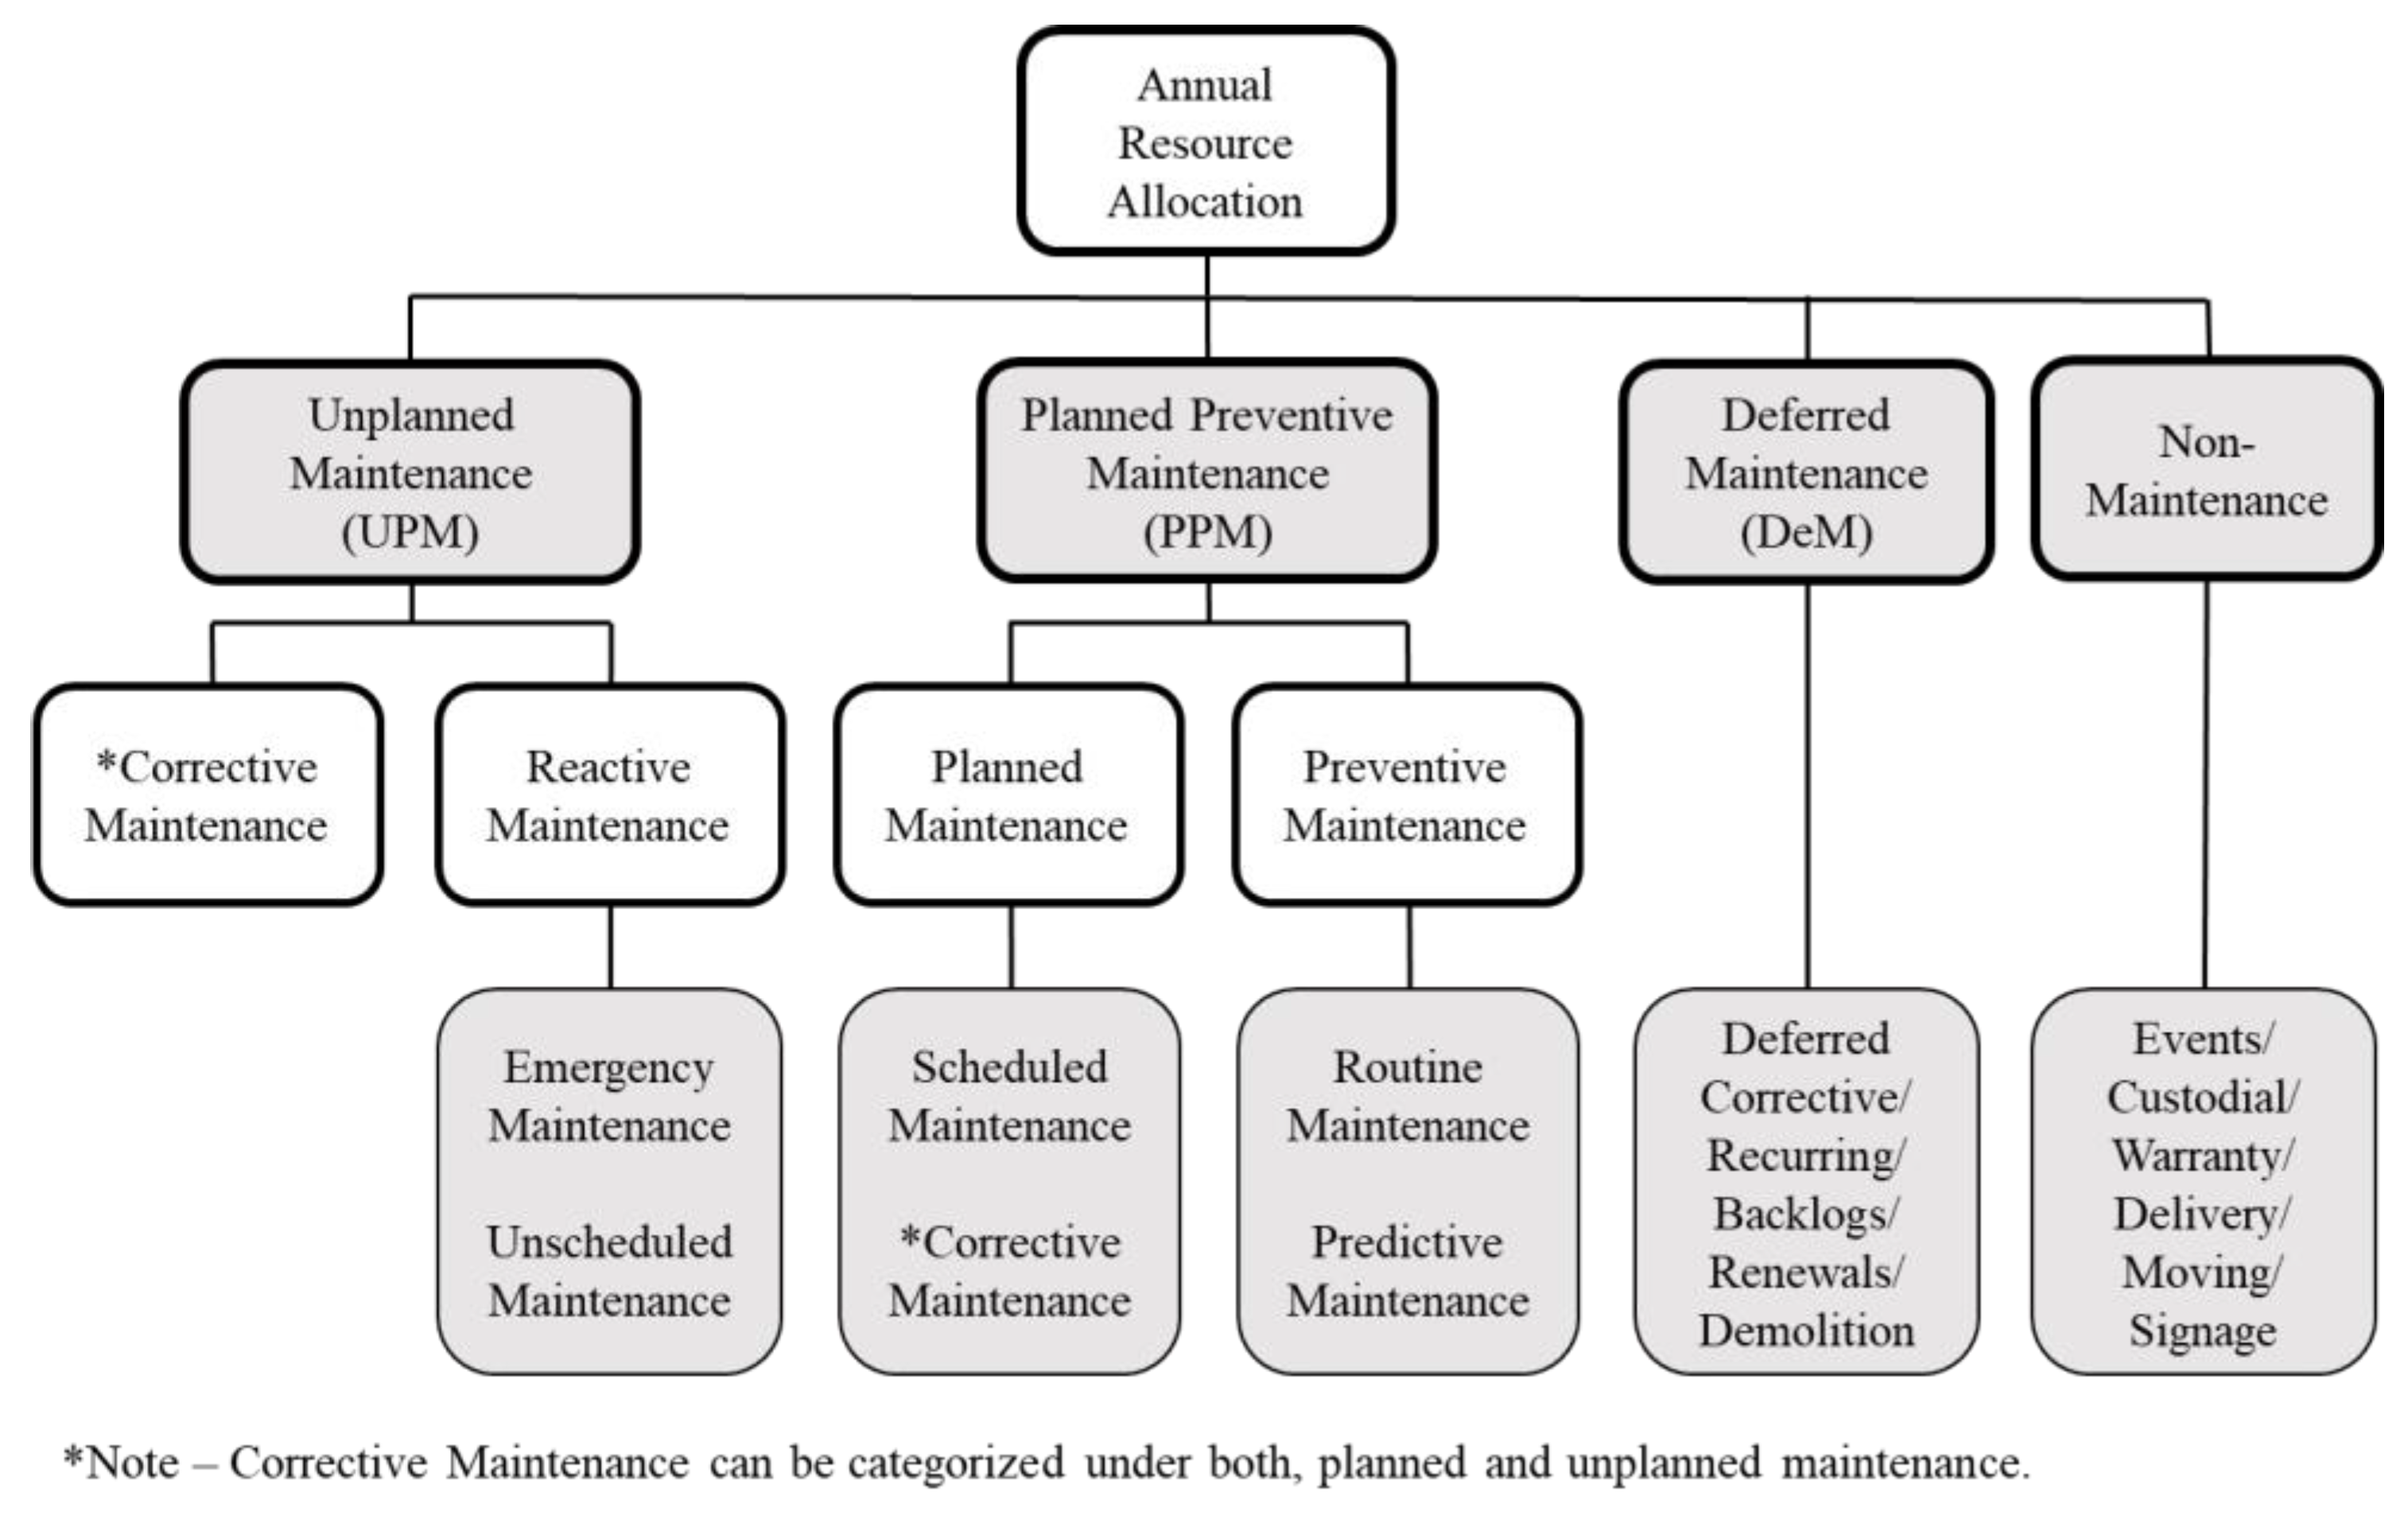
Figure 2.
Overall research framework.
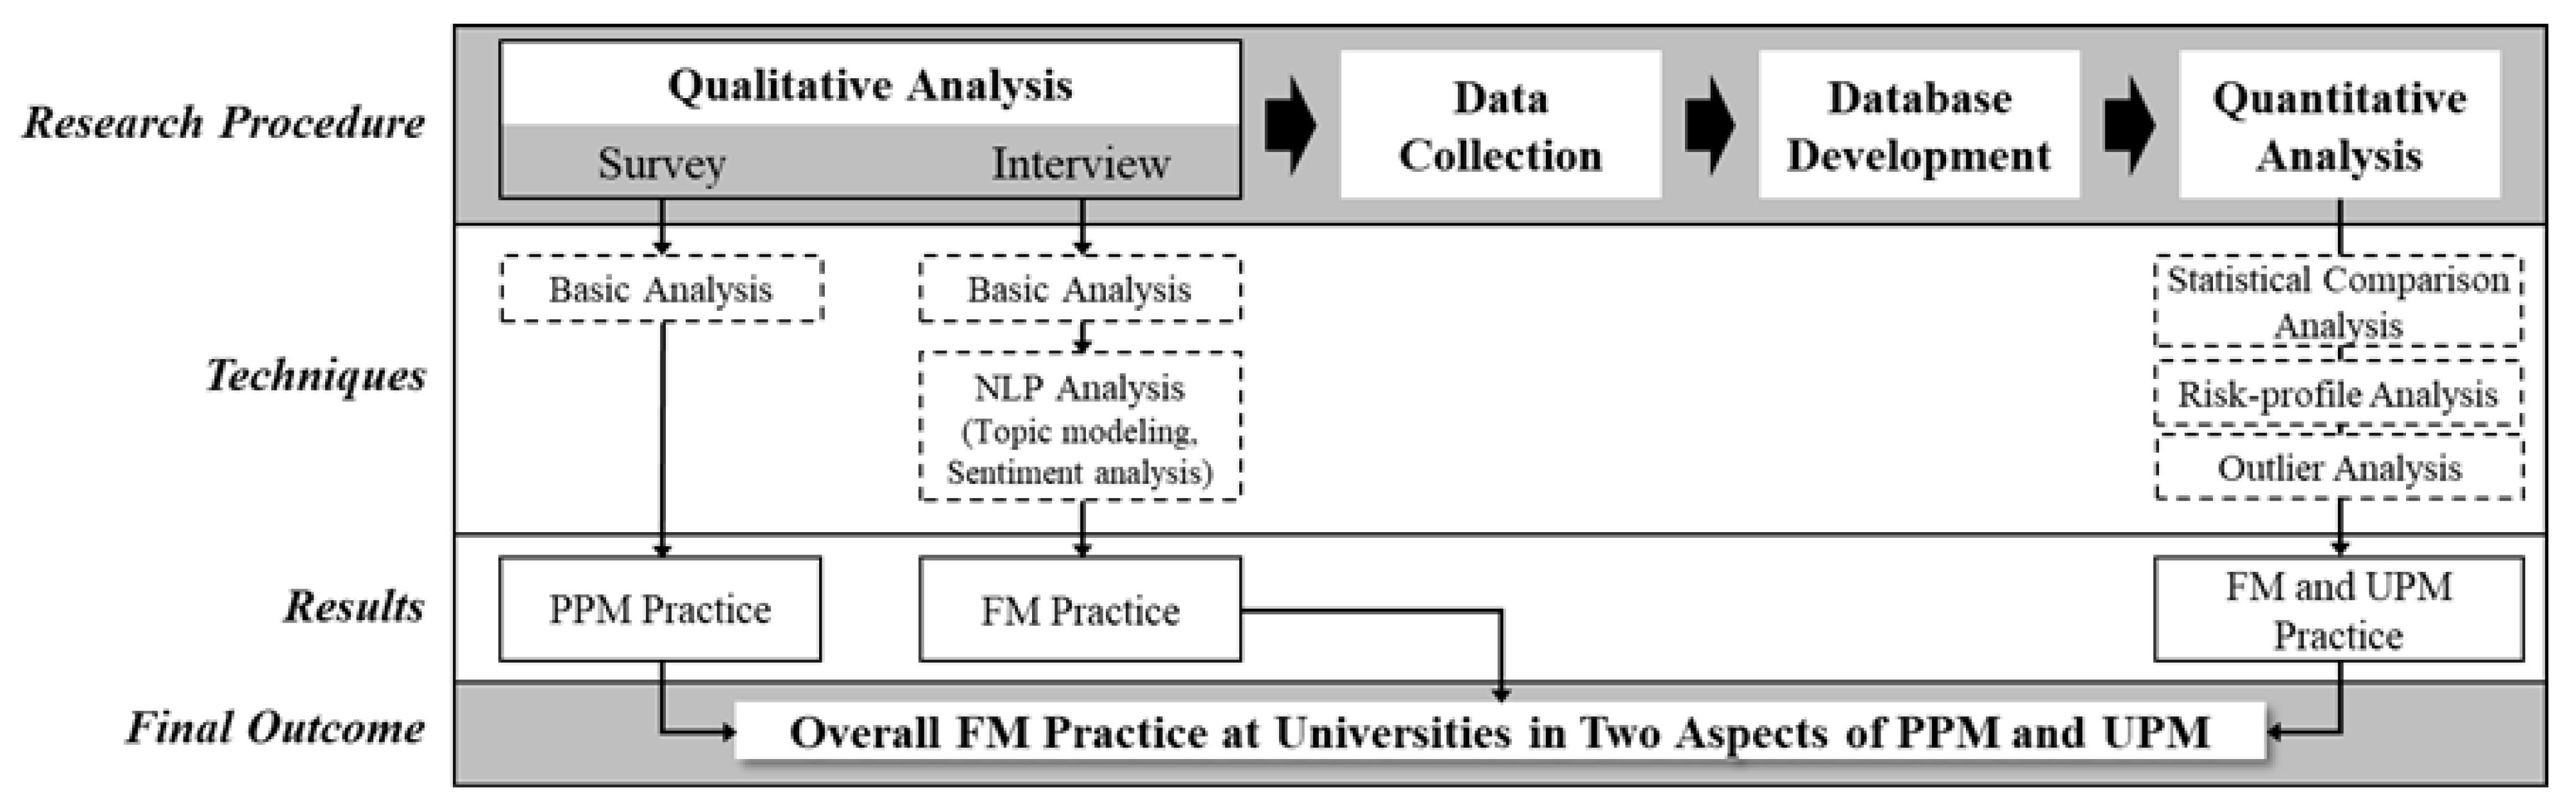
Figure 3.
Sentiment analysis results based on phone interview transcriptions.

Figure 4.
Uniformat II classification [23].
Figure 4.
Uniformat II classification [23].
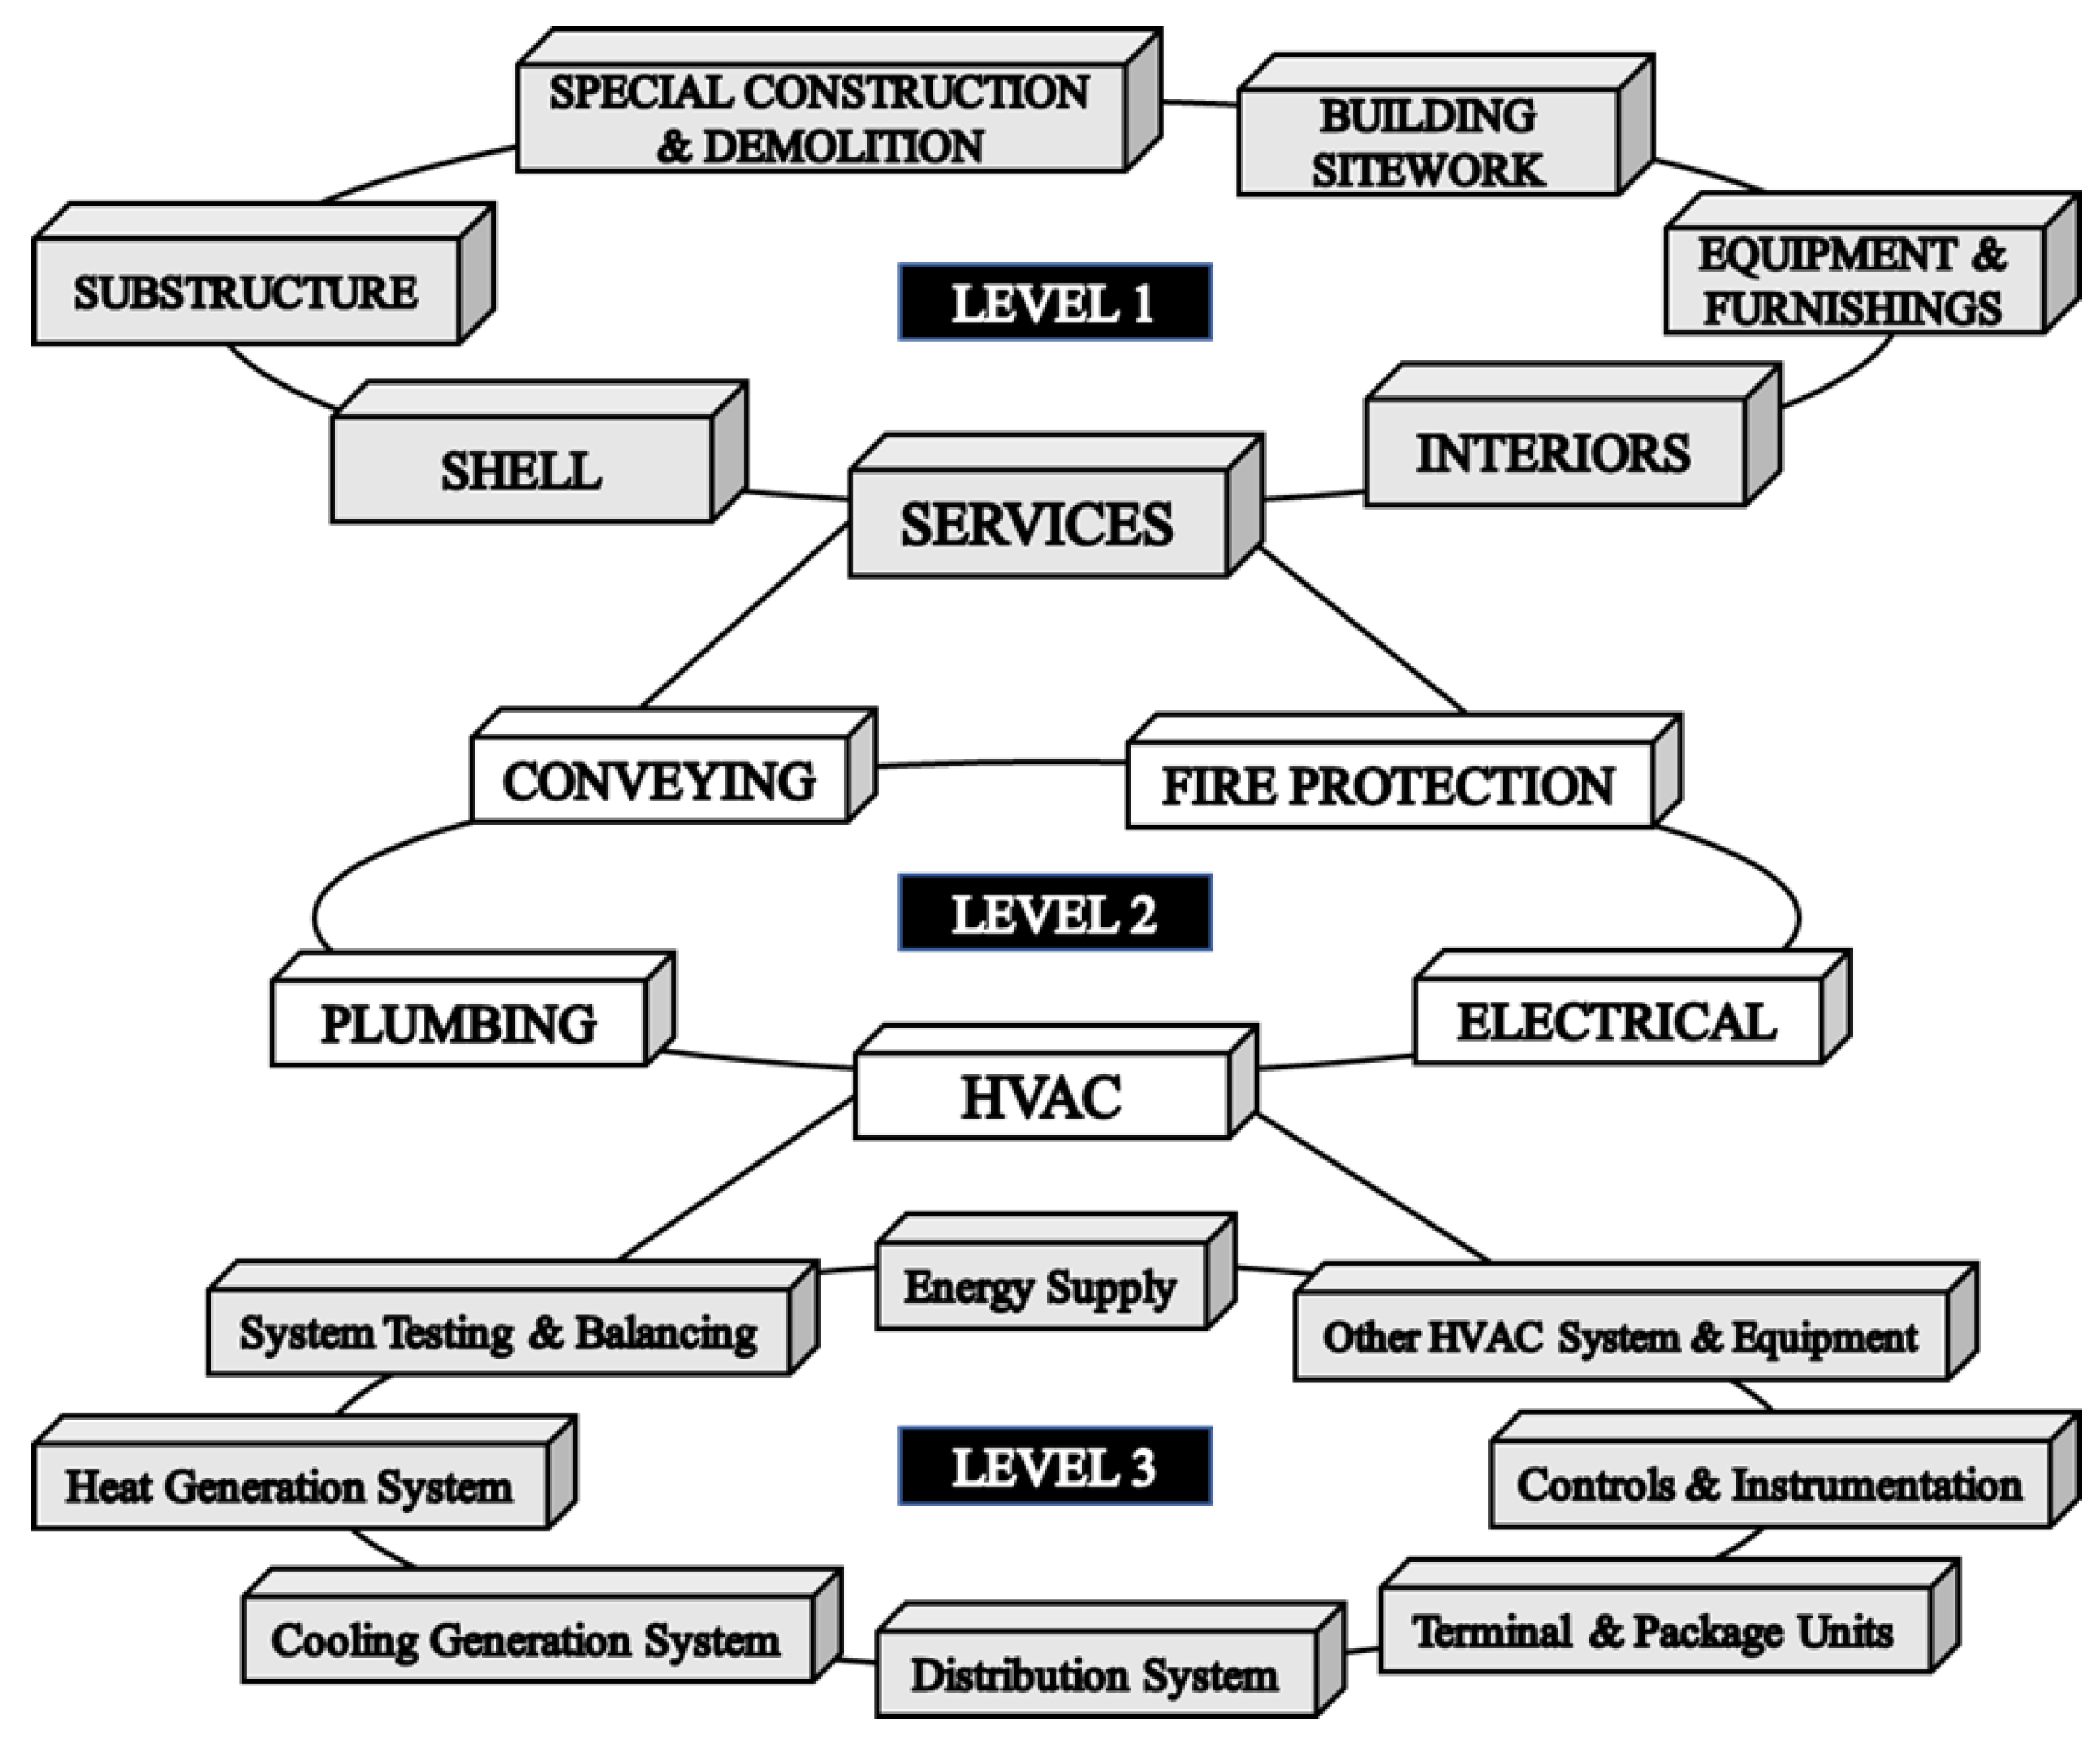
Figure 5.
Facility Management Unified Classification Code (FMUCO).

Figure 6.
FMUCD structure.
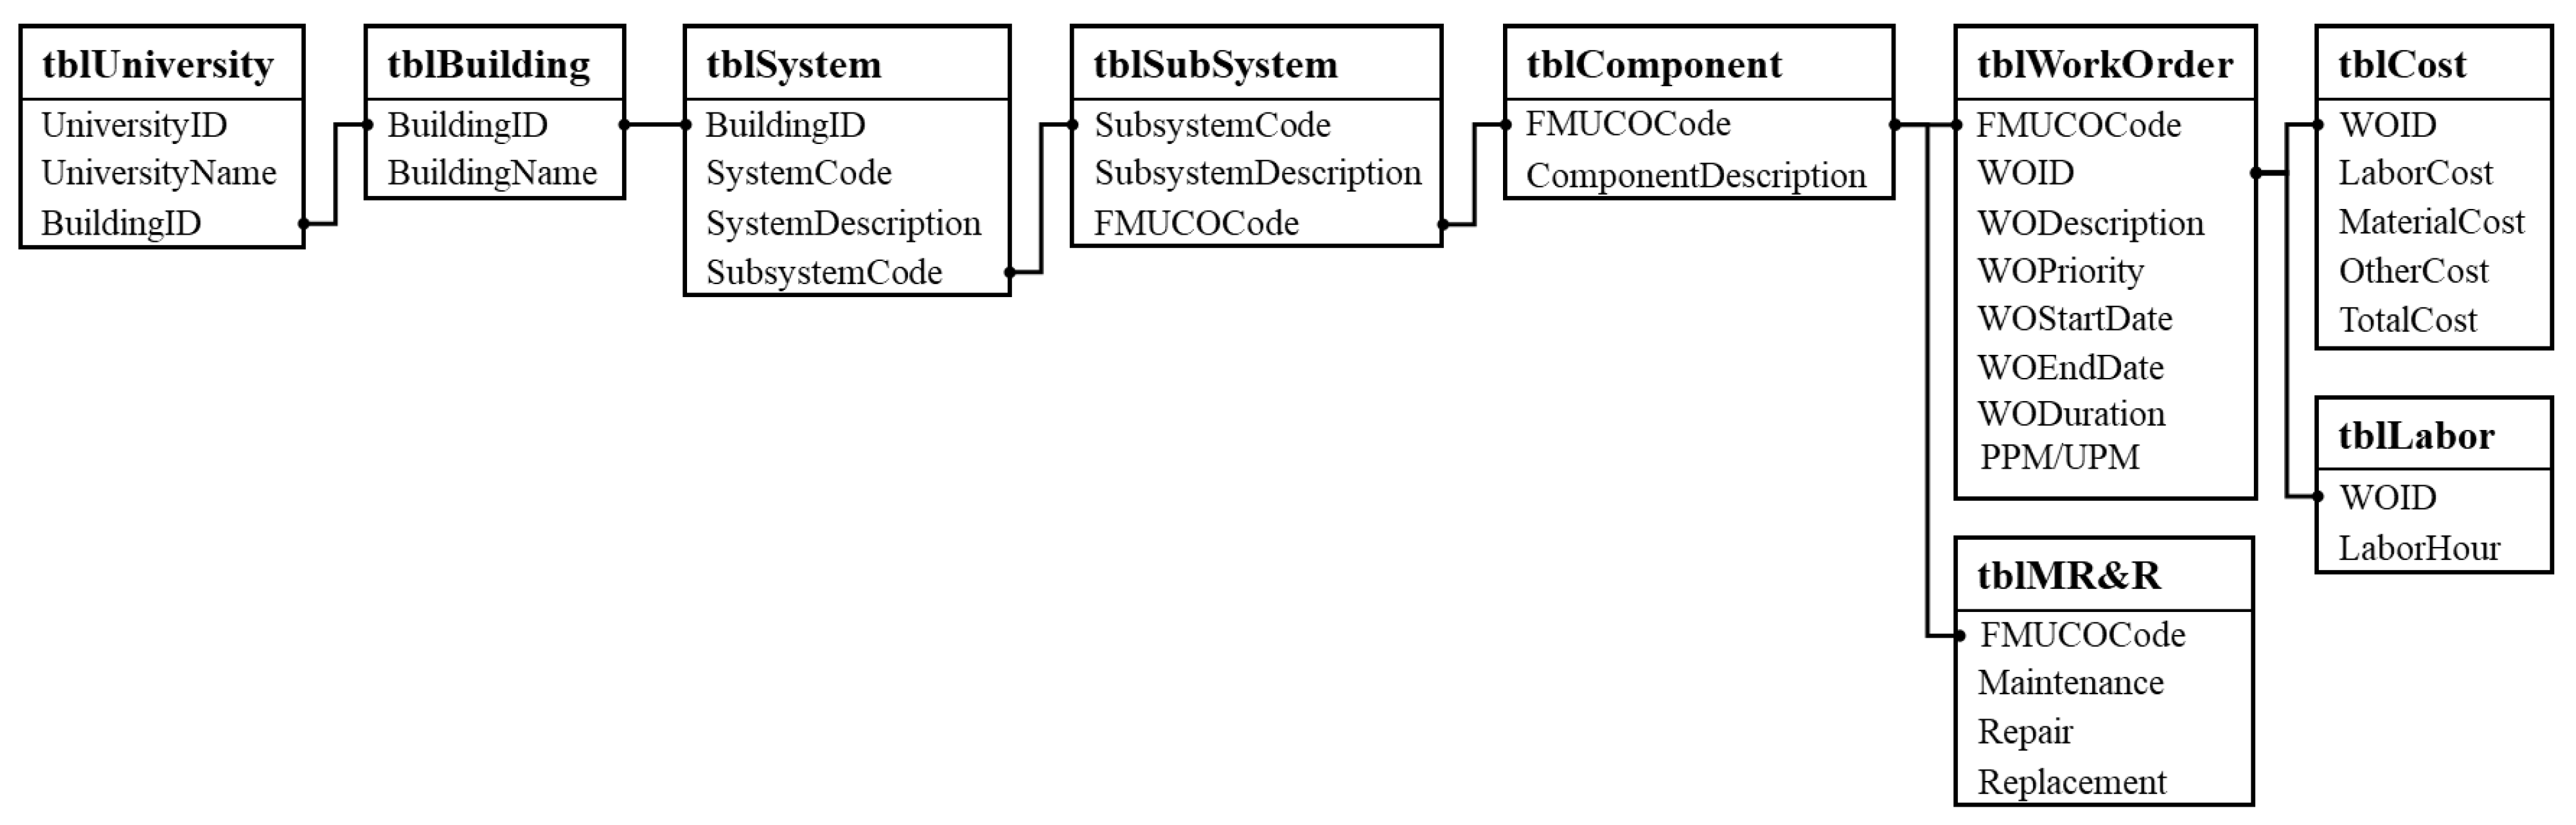
Figure 7.
Five-year trend of PPM: (a) Work Order Counts; (b) Labor Hours.
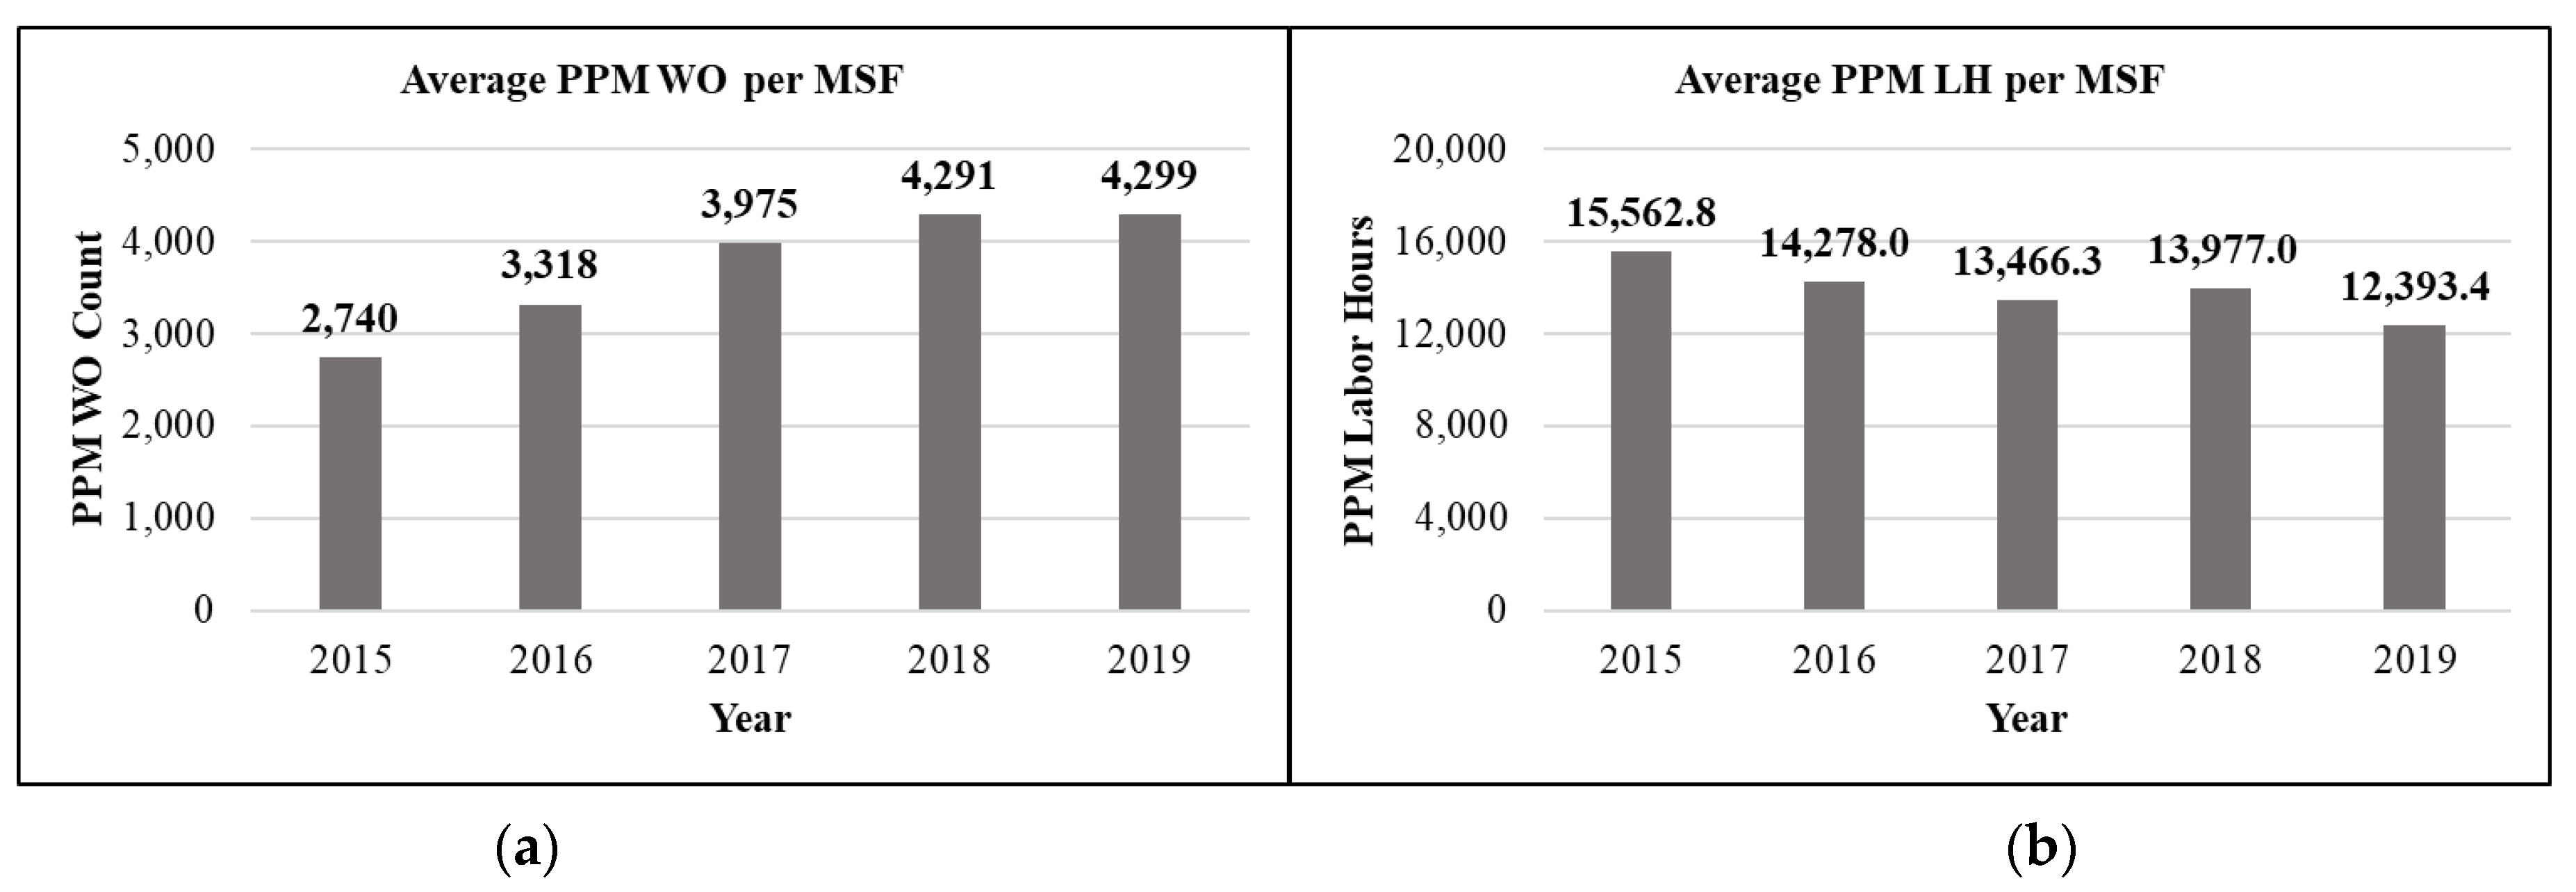
Figure 8.
Five-year trend of UPM: (a) Work Order Counts; (b) Labor Hours.

Figure 9.
System-level comparison of the PPM: (a) Work Order Counts; (b) Labor Hours.
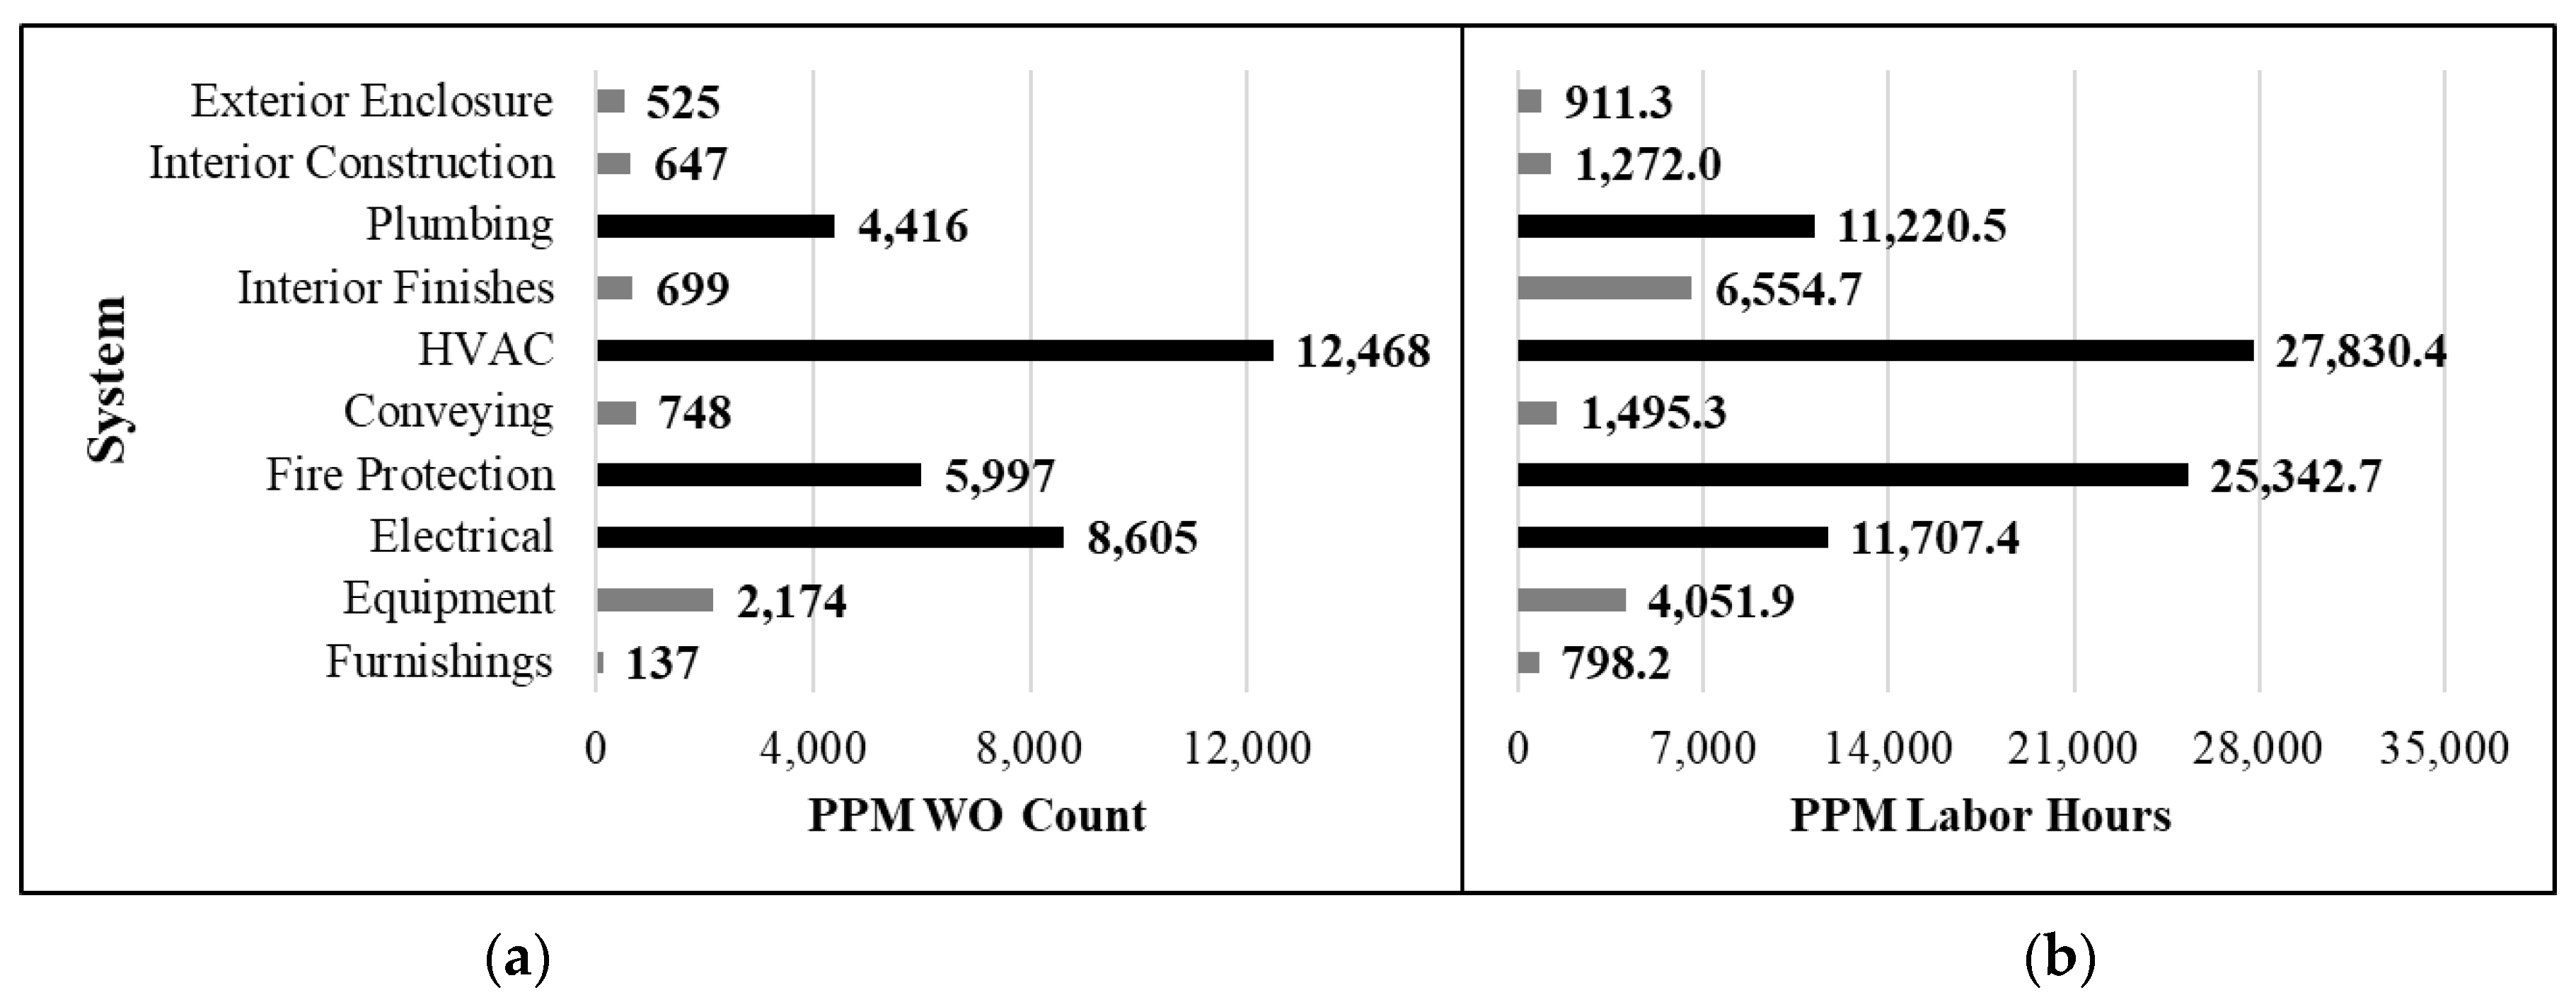
Figure 10.
System-level comparison of the UPM: (a) Work Order Counts; (b) Labor Hours.
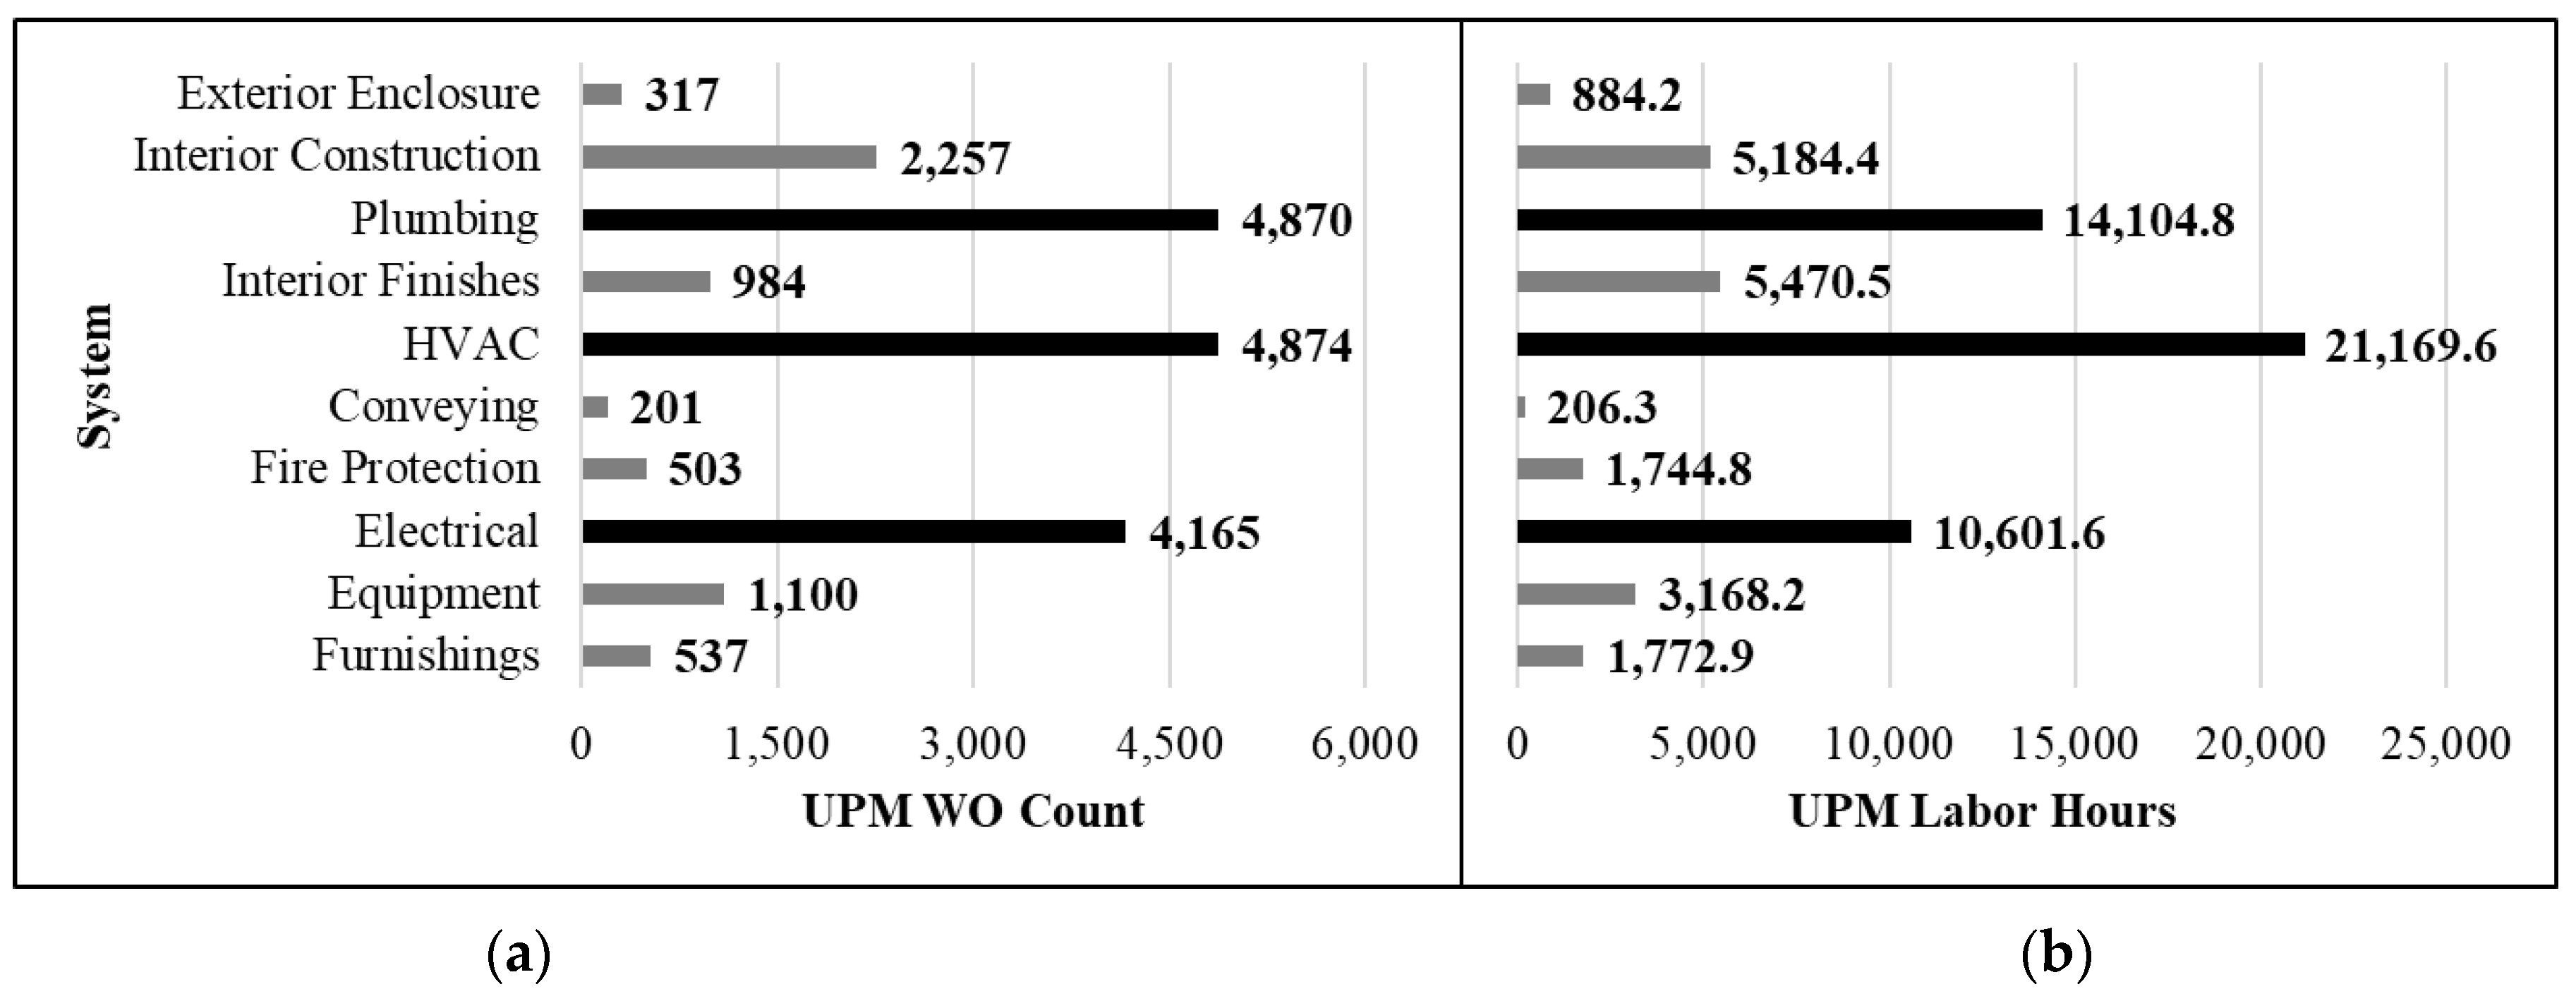
Figure 11.
Survival Function Risk Profile for UPM Work Orders: (a) HVAC; (b) Plumbing; and (c) Electrical.
Figure 11.
Survival Function Risk Profile for UPM Work Orders: (a) HVAC; (b) Plumbing; and (c) Electrical.


| No | Classification System | Origin | Updated Year | Classification Structure | Levels | Elements Grouping | Component (Detailed/Neutral/Less Details/Not Detailed) |
|---|---|---|---|---|---|---|---|
| 1 | Uniformat II | North America | 1999 | Hierarchical | 3 | Functional | Not Detailed |
| 2 | MasterFormat® | North America | 2020 | Hierarchical | 4 | Mounted Elements | Less Detailed |
| 3 | UniformatTM | North America | 2010 | Hierarchical | 5 | Functional | Neutral |
| 4 | OmniClassTM | North America | 2015 | Faceted | 6 | Functional | Less Detailed |
| 5 | Uniclass | United Kingdom | 2015 | Faceted | 4 to 5 | Functional | Less Detailed |
| 6 | UNSPSC | North America | 2017 | Hierarchical | 5 | Mounted Elements | Not Detailed |
Table 2.
Survey result.
| No | Question | Answers | Responses | |
|---|---|---|---|---|
| n | % | |||
| 1 | How do you evaluate progress of the PPM work assignments? | Reports generated by CMMS | 24 | 50% |
| Key Performance Indicator—KPI | 15 | 31% | ||
| Paper reports | 7 | 15% | ||
| Other | 2 | 4% | ||
| 2 | Where are PPM work orders prioritized among all work order types? | Above scheduled corrective | 12 | 43% |
| Dedicated crew for PPM work | 8 | 29% | ||
| Lowest priority | 7 | 25% | ||
| Above critical | 1 | 3% | ||
| 3 | What is included in the PPM work order estimates? | Work | 26 | 25% |
| Set-up | 21 | 20% | ||
| Clean-up | 20 | 19% | ||
| Documentation | 15 | 14% | ||
| Travel (before the PPM) | 13 | 12% | ||
| Travel (after the PPM) | 8 | 8% | ||
| Others | 3 | 3% | ||
| 4 | How do you estimate PPM worker time? | Prior experience | 17 | 28% |
| Multiple factors (e.g., guide, prior records) | 16 | 26% | ||
| Prior time records | 13 | 21% | ||
| Estimating guide (RS Means, Dodge, other) | 9 | 15% | ||
| Manufacturer recommendations | 6 | 10% | ||
| 5 | Prioritize how you would improve PPM effectiveness | Prioritization strategy | 19 | 76% |
| Additional funding | 4 | 16% | ||
| Additional staff | 2 | 8% | ||
Table 3.
Phone interview result.
| No | Question | Answers | Responses (N = 12) | |
|---|---|---|---|---|
| n | % | |||
| 1 | Do you have an organized maintenance plan? | Schedule maintenance | 5 | 42% |
| PPM | 5 | 41% | ||
| System/Subsystem | 2 | 17% | ||
| 2 | How do you classify the building systems and components? | Uniformat | 5 | 42% |
| MasterFormat | 4 | 33% | ||
| OmniClass | 2 | 17% | ||
| Other | 1 | 8% | ||
| 3 | Is each maintenance task performed on an individual component tracked? | Yes | 7 | 58% |
| No | 5 | 42% | ||
| 4 | When do you record work order information? | End of activity | 7 | 58% |
| End of shift | 5 | 42% | ||
| Mid-shift | 0 | 0% | ||
| 5 | Who records work order? | Craft/Technician | 10 | 83% |
| Supervisor | 2 | 17% | ||
| Office clerk | 0 | 0% | ||
| 6 | Where is the data recorded? | Electronically/CMMS | 9 | 75% |
| Both | 2 | 17% | ||
| Manually/Papers | 1 | 8% | ||
Table 4.
Topics and keywords identified from the interview.
| No | Topic | Keywords |
|---|---|---|
| 1 | PPM | Maintenance, plan, work, preventive, evaluate, worker, frequency, critical, year, order, asset, schedule, fix |
| 2 | Maintenance system | PMS, system, work, zone, order, equipment, time, Archibus, record, manager, worker |
Table 5.
Goodness-of-fit of distributions for systems and subsystems.
| System | Subsystem | Data Range | Poisson AIC | Poisson BIC | Negative Binomial AIC | Negative Binomial BIC | No. of Successes (r) | Event Prob. (p) |
|---|---|---|---|---|---|---|---|---|
| HVAC | Total HVAC | 1 to 1023 | 51,684.54 | 51,689.29 | 9325.54 | 9335.03 | 1.2583 | 0.0130 |
| Heating | 0 to 184 | 13,351.13 | 13,355.87 | 5510.13 | 5519.62 | 0.4350 | 0.0453 | |
| Cooling | 0 to 118 | 11,943.97 | 11,948.72 | 4509.96 | 4519.45 | 0.3058 | 0.0505 | |
| Distributions | 0 to 153 | 17,653.43 | 17,658.18 | 6981.43 | 6990.92 | 1.1479 | 0.0489 | |
| Terminal Units | 0 to 200 | 16,133.57 | 16,138.31 | 6121.44 | 6130.93 | 0.5614 | 0.0414 | |
| Controls | 0 to 440 | 26,742.70 | 26,747.44 | 7761.73 | 7771.22 | 0.9742 | 0.0264 | |
| Plumbing | Total Plumbing | 0 to 566 | 47,664.31 | 47,669.06 | 9334.98 | 9344.47 | 1.6313 | 0.0157 |
| Fixtures | 0 to 497 | 43,823.68 | 43,828.42 | 8801.60 | 8811.09 | 1.1198 | 0.0160 | |
| Domestic | 0 to 129 | 14,114.42 | 14,119.17 | 6627.55 | 6637.04 | 1.2877 | 0.0652 | |
| Sanitary | 0 to 62 | 8295.90 | 8300.64 | 5164.35 | 5173.84 | 1.0520 | 0.1273 | |
| Rainwater | 0 to 19 | 3023.30 | 3028.05 | 2351.56 | 2361.05 | 0.3733 | 0.2628 | |
| Other Plumbing | 0 to 52 | 5490.91 | 5495.66 | 2945.88 | 2955.37 | 0.2667 | 0.1169 | |
| Electrical | Total Electrical | 1 to 541 | 54,697.38 | 54,702.13 | 9205.89 | 9215.38 | 1.1549 | 0.0132 |
| Service | 0 to 81 | 8876.86 | 8881.61 | 4844.37 | 4853.86 | 0.6360 | 0.0967 | |
| Lighting | 1 to 393 | 43,445.45 | 43,450.20 | 8577.99 | 8587.48 | 0.9948 | 0.0169 | |
| Communications | 0 to 141 | 15,373.17 | 15,377.91 | 6454.95 | 6464.44 | 0.9544 | 0.0567 | |
| Other Electrical | 0 to 208 | 10,382.39 | 10,387.14 | 2933.79 | 2943.28 | 0.0483 | 0.0177 |
Table 6.
Outlier components for UPM.
| No | Top Component | No. of Occurrence | System | Subsystem | Descriptive Code |
|---|---|---|---|---|---|
| 1. | Thermostat | 390 | HVAC | Controls & Instrumentation | D3060THE |
| 2. | Fluorescent Light Fixture | 345 | Electrical | Lighting & Branch Wirings | D5020FLF |
| 3. | Sink | 232 | Plumbing | Plumbing Fixtures | D2010SNK |
| 4. | Battery | 207 | Electrical | Other Electrical Systems | D5090BAT |
| 5. | Toilet & Wash Basin | 180 | Plumbing | Plumbing Fixtures | D2010TWB |
| 6. | Air Conditioner | 136 | HVAC | Terminal & Package Units | D3050ACO |
| 7. | Air Handler | 127 | HVAC | Distribution Systems | D3040AHD |
| 8. | HVAC Control Panel | 127 | HVAC | Controls & Instrumentation | D3060HVA |
| 9. | Bathtub & Shower Enclosure | 116 | Plumbing | Plumbing Fixtures | D2010BSE |
| 10. | Radiator | 103 | HVAC | Heat Generation Systems | D3020RFW |
Publisher’s Note: MDPI stays neutral with regard to jurisdictional claims in published maps and institutional affiliations. |
© 2022 by the authors. Licensee MDPI, Basel, Switzerland. This article is an open access article distributed under the terms and conditions of the Creative Commons Attribution (CC BY) license (https://creativecommons.org/licenses/by/4.0/).
Share and Cite
MDPI and ACS Style
Pampana, A.K.; Jeon, J.; Yoon, S.; Weidner, T.J.; Hastak, M. Data-Driven Analysis for Facility Management in Higher Education Institution. Buildings 2022, 12, 2094. https://doi.org/10.3390/buildings12122094
AMA Style
Pampana AK, Jeon J, Yoon S, Weidner TJ, Hastak M. Data-Driven Analysis for Facility Management in Higher Education Institution. Buildings. 2022; 12(12):2094. https://doi.org/10.3390/buildings12122094
Chicago/Turabian StylePampana, Ashish Kumar, JungHo Jeon, Soojin Yoon, Theodore J. Weidner, and Makarand Hastak. 2022. "Data-Driven Analysis for Facility Management in Higher Education Institution" Buildings 12, no. 12: 2094. https://doi.org/10.3390/buildings12122094
Note that from the first issue of 2016, this journal uses article numbers instead of page numbers. See further details here.