

Risk Response Strategies Selection over the Life Cycle of Project Portfolio

School of Economics and Management, Chang’an University, Xi’an 710064, China
*
Author to whom correspondence should be addressed.
Buildings 2022, 12(12), 2191; https://doi.org/10.3390/buildings12122191
Submission received: 23 October 2022
/
Revised: 30 November 2022
/
Accepted: 8 December 2022
/
Published: 11 December 2022
(This article belongs to the Section Construction Management, and Computers & Digitization)
Abstract
:The successful implementation of project portfolios (PP) calls for effective risk management, in which selecting optimal risk response strategies help to reduce the impact of risk. Project portfolio risks (PPRs) exhibit causality and time dependency over the life cycle, which result in cumulative effects over time. By accounting for these risk correlations, risk response could be more effective in reducing expected losses than risk independence assumption. To support effective and sustainable risk management, this study proposes a novel risk response method that integrates the dynamic Bayesian network (DBN) model and reward–risk optimization model to select risk response strategies for different stages of the PP life cycle. The proposed method supports a more comprehensive analysis of risk contagion paths by opening the black box of the risk propagation paths during the PP life cycle. In this method, the PPRs, as the DBN nodes, are first identified, considering the project’s interdependency. Second, DBN analysis is used to assess PPRs by visually modeling the causality and life cycle correlation among risks. Then, the reward–risk optimization model is built to determine risk response strategies for each stage of the life cycle under the constraints. Finally, the proposed method selects risk response strategies for different stages of the PP life cycle. The findings reveal that the risk response effects are maximized if the risks are responded to in earlier stages. Moreover, the findings contribute to helping managers choose the optimal risk response strategies consistent with the risk response budget. As the effect of the strategy depends on the actual situation of the PP, the factors affecting the response effect of the strategies are recommended for further study.
1. Introduction
Project portfolios (PPs) are a collection of projects, programs, and sub-portfolios that are identified as capable of accomplishing strategic goals [1]. In recent years, PPs have been widely applied by organizations to deal with the fierce competitive environment and promote the development of enterprises [2]. However, the relationship between projects in a PP is typically complex due to the number of project components and limited resources. Significant interdependencies among projects in terms of resources, technology, benefits, etc., trigger new risks in addition to those faced in the case of single projects [3,4]. Therefore, project risk management is insufficient within the context of a PP. PP risk management (PPRM), a broader approach that supports risk management and considers additional new risks, is an effective solution for managing PP risks (PPRs) [5]. Hence, PPRM has been widely considered in the practice of increasing the possibility of PP success [6].
The current literature widely considers the key aspects of PPRM, including three major phases: risk identification, assessment, and response [7]; risk identification includes identifying and documenting relevant risks [8]; risk assessment involves examining the identified risks and evaluating the related likelihoods and impacts [9]; and risk response involves identifying, assessing, selecting, and implementing actions to reduce the likelihood that risk will occur and reduce negative impacts to an acceptable level [10]. Among these three phases, risk response is the phase where managers take proactive action to decrease the likelihood and impact of risks, which directly impacts the success of the PP [10]. From this viewpoint, risk response is a critical phase in risk management [11,12]. However, as it has rarely been addressed in the literature relating to PPRM, this study concentrates on the PPR response and offers a view of the previous two phases to manage PPRs over the life cycle.
In the practice of risk response, risks are not independent but rather have causal relationships, resulting in cascading effects [13]. That is, the occurrence of one risk may increase the likelihood of other risks. In addition, risks themselves have a cumulative effect over time, and critical risks in a previous stage may be transformed into noncritical risks or become more important in the ensuing stages. In other words, the impact of risk can be transferred from one stage to the next via a network of risk associations, which, in this study, is referred to as life cycle correlation. Therefore, if PPRs are not managed in a timely manner, the negative effects can accumulate rapidly. Although the causality between risks is a widely recognized concern in the literature [8,14,15], few studies consider life cycle correlation, which may lead to inappropriate risk response and reduced efficacy in risk treatment. In this context, this study is guided by the following research question: What has to be done to select the optimal risk response strategies over the PP life cycle, considering the causality and life cycle correlation of PPRs?
To address this research question, it is critical to consider the risk correlations, that is, the causality and life cycle correlation of PPRs, in the management decision model. Dynamic Bayesian networks (DBNs) are often used to model interdependencies between risks. Specifically, a DBN can graphically represent complex relationships between variables [16] and capture the changes in failure states over time [17]. In addition, the DBN is one of the most helpful modeling approaches in the probabilistic knowledge representation and reasoning fields [18]. For these reasons, the DBN can be used to solve research problems because it can assess PPRs while considering the causality and the life cycle correlation between them. Therefore, this paper integrates a DBN and reward–risk optimization model for selecting risk response strategies from the life cycle perspective. First, the PPRs, as the nodes of the DBN model, are identified by considering the project’s interdependency. Second, a DBN assessment model is constructed based on the causality and life cycle correlation between PPRs. Third, a reward–risk optimization model is conducted to determine risk response strategies for each stage of the life cycle, which could meet acceptable levels of risk response budget and risk loss to maximize reduced risk effects. Finally, the validity of the proposed approach is verified by an example and illustrates how to achieve an optimal set of risk responses in the life cycle.
The remainder of this study is structured in the following way. The literature review of relevant studies is presented in Section 2. The construction steps for the PPR response model are presented in Section 3. In Section 4, a genuine construction PP is provided to demonstrate the effectiveness of the proposed model. Section 5 discusses the theoretical and managerial implications of the proposed risk response model, and Section 6 concludes by presenting the main findings, contributions, and limitations.
2. Literature Review
2.1. Risk Interdependence in Project Risk Response
As the critical phase of risk management, selecting the appropriate risk response strategies according to the risk assessment result is crucial [19], which is why many scholars have studied risk response strategies. For example, Fan et al. [20] analyzed the association between risk response actions and specific project features by developing mathematical model construction. Yang and Li [21] considered the two objectives and combined the risk preference of the risk manager to solve a satisfactory response strategy. Parsaei and Bamdad [22] provided a model that focused on secondary risks to improve the efficiency of risk response options. Soofifard and Bafruei [23] considered the relationship between risk responses during implementation and used a linear integer programming optimization model to choose the most appropriate risk responses. However, these studies on risk response strategy selection assume that risks are independent of each other, which is not consistent with the reality of dependencies between PPRs.
To compensate for these limitations, Ahmadi-Javid et al. [24] developed a quantitative method that incorporated two types of dependencies among risks, thus significantly increasing the overall expected risk mitigation. Mokhtari and Aghagoli [8] suggested a Bayesian network to model PPRs, in which a network of risks, risk effects, responses, and their interdependencies was developed. Fang et al. [15] proposed a risk coping strategy selection framework using the DSM approach to identify risk interactions. Zhang [14] analyzed the interaction between risks and established a risk response strategy selection model. At present, most of these studies have made significant contributions to risk interdependence analysis; however, they have ignored risk correlations over the life cycle, which may result in risk management failing to adapt to environmental changes [5]. Although some scholars have investigated the risk interdependence of project subprocesses and some achievements have been made, the issue requires further exploration. For instance, Wu et al. [25] proposed a risk response optimization model that considers different subprocesses to obtain an optimal response plan, but they did not consider the correlations among various risks in the same substages. Accordingly, this prompted us to conduct additional research on this aspect. In this study, this gap is bridged by proposing a method that considers risk interdependence in the different stages and causality in the same stage to select a risk response strategy.
2.2. Risk Response Approaches in Project Risk Management
The project risk response problem is typically modeled as identifying and selecting risk response strategies from a pool of options. The risk response approaches in the literature can be divided into four types, namely, the zonal-based approach [26], the trade-off approach [27], the work breakdown structure (WBS)-based method [28], and the optimization-model approach [7,14].
The zonal-based approach maps the risk response strategies to multiple areas presented in a two-dimensional diagram, where two dimensions represent the characteristics of projects. For instance, two dimensions can be selected based on the extent of the consequence and possibility of the risk [26]. The trade-off approach balances the project criteria concerning risks to obtain risk response strategies [22], while the WBS-based method divides the project into smaller components to control and manage the project [29]. Finally, the optimization-model approach formulates the challenge of choosing response strategies as a mathematical optimization model that considers various goals and limitations.
While these approaches make important contributions to the selection of risk response strategies, some limitations remain. For instance, the zonal-based approach is limited because only two standards can be simultaneously applied for consideration. The trade-off method has difficulties in viewing the connection between the policies and the impact. In addition, the optimality of the strategies determined by the WBS-based approach is uncertain. Although these constraints can be avoided by optimization methods that find optimal strategies, the majority of the literature identifies risk response strategies from the perspective of expected risk loss rather than risk probability and impact. Generally, even though the expected risk loss is the same, different response options should be adopted for the different risk probabilities and impacts. In addition, the existing optimization models ignore causality and time dependency between PPRs. Nonetheless, risks exist and are interrelated throughout the project life cycle, thus, ignoring life cycle correlation will not help an organization implement risk response strategies. Therefore, assessing risk probabilities and losses from the life cycle perspective is crucial for actualizing an efficient risk response.
In the literature, many scholars have conducted relevant research on causality between risks and proposed methods such as artificial neural networks [30], social networks [31], and Bayesian networks (BNs) [16]. Of these networks, BN not only has the ability to visually present risk interrelation and quantify the probability, but it also has been effectively applied to assess project risks. For example, Ghasemi et al. [32] constructed a BN model to analyze project interdependency and causal relationships among PPRs and provided valuable information for making strategic decisions. Furthermore, while they demonstrated the effectiveness of BN in capturing causality and quantifying probabilities, their focus was not on how to choose response strategies in different project situations. Similarly, Mokhtari and Aghagoli [8] constructed a BN for modeling PPRs, impacts, and responses and developed an optimization model to select the optimal risk response strategy. Their study enlightens us that the BN can be combined with optimization models to determine the optimal strategy by measuring the probability of risk while considering the causality of risk. However, the cumulative effect between risks over the life cycle is not considered in their methods. To compensate for this deficiency, DBN, an extension of the BN in the time dimension, is widely used in the field of risk assessment [33]. For example, Khan et al. [34] used a DBN to model the risk with time dependency and causality of ship-ice collision for ice-infested waters. Additionally, Li et al. [35] established a DBN model by introducing a time factor to study the dynamic features of dam-breach likelihood. Based on the dynamic reasoning features of the DBN, the authors are inspired to combine the DBN with the optimization model to solve project risk management problems. In this study, to better solve the challenge and curse, the causality and life cycle correlation between PPRs are modeled and assessed by a DBN. Then, by solving an optimization model that considers risk likelihood, risk of loss, response effectiveness and cost, the optimal risk response strategy is obtained.
3. Model Construction
This section describes the framework of the PPR response strategies selection model. First, PPRs are identified by considering project interdependency. Second, a dynamic evaluation model is established according to the causality and life cycle correlation between PPRs. Finally, a reward–risk optimization model is constructed to select a risk response strategy while considering risk correlations among different life cycle stages. The detailed process is presented in Figure 1.
3.1. Construction of the Index System
Risk identification, normally the initial step in PPR management, involves identifying risk events that could negatively or positively impact PP objectives [8,10]. It is important to have a systematic research approach for risk identification, as detailed in the systematic literature review adopted by Umar [36] in his paper. In this section, the risk identification method combines a literature review with expert experience that can maintain the credibility of the research results.
In the first stage, a systemic approach was adopted to identify the main risk factors in the implementation of PP. The process of systematic literature review was guided by Umar [37]. First, the Web of Science and Scopus databases were used to search for a total of 1896 items based on the keywords “project risk factors” and “uncertainty”. After retaining the topics in the field of construction engineering and excluding some other areas, such as medicine, the number of items was reduced to 1489. Second, after a second screening of the research with the keyword “project portfolio”, 756 items were obtained. On this basis, it was found that the research of the project portfolio from 2010 to 2022 is most relevant to its complex characteristics. Therefore, the search period was kept from 2010 to 2022, and a total of 132 items were obtained. Finally, 18 items were screened for keywords such as “identification” and “classification” which were reflected in the title and abstract. This screening focused on the systematic identification and analysis of project portfolio risks to ensure the reliability of risk identification. It is clear from these 18 studies that risk identification must be conducted according to certain criteria to ensure the completeness of the risk list, and the risk source criterion is the most important [38]. According to this criterion, a broad classification of PPRs includes technical, economic, political, and organizational risks. Moreover, Costa et al. [39] divided risks into design, coding and testing risk based on PP characteristics. From the perspective of risk portfolios, Ghasemi et al. [32] divided portfolio risk into dependent project risk, independent project risk, and portfolio level risk. In this study, by considering the impacts of risk on the realization of strategic objectives, the PPR categories are classified with references to the knowledge framework described by the Project Management Body of Knowledge (PMBOK) and Bai et al. [4].
In the next stage, experts were interviewed to screen and assess the appropriateness and comprehensiveness of the risk classification criteria. The experts were selected based on their professional background and knowledge as well as their extensive experience in the field of PP management. After expert interviews, although there are ten different knowledge areas in the PMBOK guide, to avoid overlapping, all risks are divided among six categories that affect the strategic objectives. These categories include time, cost, quality, human resources, and stakeholder management, and each dimension contains the corresponding PPRs. The specific risks are presented in Table 1.
3.2. Construction of the Dynamic Bayesian Network
This study uses the set of risks, i.e., , identified in Section 3.1 for the next step of risk assessment. With the increasing complexity of PPs, the interdependency of PPRs has become universal [53], and risks interact with each other, leading to a chain effect [13]. Specifically, two types of interdependencies exist between PPRs. One is the causality between the different risks, that is, the risk has a causal effect on risk , ; then, this type of relationship can be described as . The other relationship is the time dependence of the same risk at subsequent stages of life cycle; that is, risk has a time cumulative effect on risk . This type of relationship is described as . Both are natural and essential features in the process of PP development. A DBN is applied in this study to visually describe the two types of interdependency.
3.2.1. Structure of the Dynamic Bayesian Network
A DBN is defined as a pair (), where is an initial and static BN representing the causality between PPRs, and is a temporal BN that describes the relationship between two consecutive time slices [34]. To obtain , this study first judged the causal relationship between PPRs. Then, six experts with rich theoretical knowledge and years of work experience in project management were selected to correct the causal relationships and determine the network structure. Thus, was obtained and the results are presented in Figure 2. Based on , was constructed according to the time dependence of the same risk, as shown in Figure 3. The DBN structure in this study can be obtained by duplicating four time slices based on dividing the PP into four stages as identified in The Standard for Project Portfolio Management, namely, the initiation (I), planning (P), execution (E), and optimization (O) stages.
3.2.2. Parameterization of the Dynamic Bayesian Network
Probability calculation is essential to determine the strength of interdependency. Experts with expertise and experience are invited to quantify the risk interdependences [14]. Thus, the expert’s capability is significant for scientific conclusions. The selection of capable experts is established according to the following criteria [54]:
(1) Heterogeneous groups of experts are usually preferred over homogeneous groups because each expert’s judgment has individual weights on the basis of their background and expertise. (2) Regarding the education and experience of the experts in a field, the longer they have majored in a subject, the more precise their intuitionistic judgment is. (3) When considering an expert’s familiarity with a topic, an experienced expert can provide more details regarding that topic.
Based on the above criteria, we selected experts from an expert database consisting of 60 experts. First, an initial screening was conducted to identify experts who were familiar with the relevant content of the questionnaire. 18 experts were selected based on the business description using the keywords “project portfolio” and “risk management expert”. Then, a secondary screening was conducted based on the expert’s professional position and field of operation. This screening targeted senior and junior academics in different fields to ensure heterogeneity of experts completing the questionnaire, which facilitated the relevance of the result. Eight experts were selected and a questionnaire and instructions for completing it were mailed to them. Finally, follow-up calls were made after the initial contact to track the progress of the experts’ judgments. Only six of the eight experts were willing to provide their evaluation results. Therefore, a heterogeneous expert group of six experts was selected. The rating criteria in Table 2 are used to score the capabilities of every expert in the heterogeneous group.
Furthermore, the integration of fuzzy set theory with expert judgment can transform linguistic possibilities into crisp probability values [55]. Specifically, the probability calculation process is as follows:
Step 1: Collecting experts’ judgments of PPRs
First, a heterogeneous group that includes six experts with different backgrounds who are academic or industry experts were employed in this study. The six invited experts have at least a bachelor’s degree in a relevant discipline with at least 10 years of experience. The experience requirement is relaxed if the individuals have master’s or PhD qualifications. In this paper, the related expert information and scoring results are displayed in Table 3. Then, experts use linguistic terms such as ‘low’ or ‘high’ to express their judgment of the risk probabilities.
Step 2: Processing the linguistic terms
The linguistic terms are then converted into corresponding fuzzy numbers in a process known as fuzzification [56]. As a useful and fashionable way to deal with uncertainty, fuzzy triangular numbers are adopted to represent the linguistic variables in this paper. A triangular fuzzy number can be defined as where a, b, and c represent the lower least likely, the most likely, and the upper least likely value, respectively [57,58].
Step 3: Processing the fuzzy triangular numbers
The fuzzy set must be defuzzied to convert the fuzzy numbers into crisp values. To reduce information loss, the integral value method, which uses the operation of the cut set to achieve defuzzification, is adopted in this study [59]. The cut set of the triangular fuzzy number can be expressed as . The evaluation results of the heterogeneous group of experts are calculated in Equation (1):
where, is the truncated set of events after a weighted average of expert evaluation and is the weight of the nth expert’s evaluation result.
Step 4: Calculating the integral value
The integral values of the inverse functions of the right and left membership functions corresponding to event are denoted by and , respectively. For fuzzy triangular numbers, and are expressed by the -cut set as:
and are the upper and lower bounds of ; ; and indicates a fixed constant increment, in this study.
is the expected value of the defuzzied value of event ; is the optimism coefficient, where is taken as the completely neutral value between extreme optimism and extreme pessimism () in this study.
Step 5: Inputting the parameters of the DBN
In the DBN, one node usually has more than two causal nodes, so the crisp values must be converted into the parameters required by the DBN. The “discretization” method mentioned by [60] is introduced to simplify the calculation. The discretization process is described in Equation (7):
where is a normalized factor to ensure .
After inputting the parameters of all DBN nodes in the GeNIe 2.3 software, the risk occurrence probabilities considering causality and time dependency can be obtained.
3.3. Construction of the Risk Response Optimization Model
In this section, a risk response optimization model is constructed to select the most desirable strategies. The notations used in the optimization model are presented in Table 4.
3.3.1. Determining the Objective Function
There are two essential properties of risk, namely, the likelihood of occurrence and the impact. The expected loss () of PPRs is defined by the product of the likelihood and the impact [14,61]. The of the PPRs before a risk response (denoted ) must be analyzed and calculated. As PPRs interact with each other, the risks and the dependencies between them form a complex risk propagation network. The probability of risk occurrence is also propagated through the network. The occurrence of one risk causes other related risks, including risks at both the same stage and subsequent stages. Because cascading reactions amplify the impact of risks, the effects of risk correlations should be considered to characterize the actual negative impact of PPRs. Hence, the actual of PPRs should include their direct and indirect impacts. The former is a direct impact that stems from the risk itself, and the latter stems from the corrected risks when PPRs occur. The processes of indirect impacts is expressed, as in Figure 4. Specifically, the risk has a causal effect on risk in the kth stage, that is . In addition, the risk has a time cumulative effect on risk , that is . represents the ith risk factor that occurs in the kth stage. For example, “” can be propagated in the network in Figure 2, the risk contagion paths of “” in the same and subsequent stages are shown in Figure 5. When accounting for the direct and indirect impacts of PPRs collectively, the of is
where represents the direct risk loss, represents the indirect loss in subsequent stages, and represents the indirect loss within the same stage.
The of the PPRs after performing the risk response measures (denoted ) is also investigated. Risk response activities can be performed at any stage when the relevant risk factors are likely to occur. When response action is implemented in different stages, response results are likely to vary. To explore the effect of risk response implementation at different stages, this study assumes that risk can be completely controlled by strategy within the kth stage, that is, does not occur, and the state can be recorded as . In fact, if a strategy is implemented to address a risk, the strategy will have a direct impact on this risk and an indirect impact on other risks. To quantitatively describe the above effects, this study introduces the risk response decision variable into the mathematical expression of , as follows:
where is a binary integer decision variable and () means that is (not) under control.
Finally, this study constructs the optimization model’s objective function for choosing a group of strategies that maximize the effectiveness of risk response, as follows:
3.3.2. Identifying the Constraints
(1) Budget restriction
The constraint implies that the total cost of implementing risk response actions in each stage cannot surpass the allocated risk response budget.
(2) Expected losses restriction
This constraint keeps the total loss of PPRs in each stage from exceeding the upper limit, thus keeping the loss overrun problem under control.
(3) Other restrictions
Constraint (11) ensures that each is selected at most in one of the stages. Constraint (12) implies that and are mutually exclusive. Constraint (13) confirms that must be selected if is selected. Constraint (14) states that it is a 0–1 integer programming problem.
3.3.3. Solving the Model
On the basis of the above analysis, the PPR response optimization model is constructed by taking Equation (8) as the objective function and Equations (9)–(14) as constraints. This is a 0–1 integer programming model that can be solved using CPLEX software. If the optimization model is feasible, optimal risk response strategies over the PP life cycle can be obtained. Managers can implement targeted risk strategies within different stages to maximize the risk response effect of the PP life cycle. Otherwise, if the optimization model is not feasible or the solution does not meet the requirements of the managers, they can initiate another loop until the termination condition is reached. This loop relates to the readjustment of the PP’s budget and plans for expected losses according to objective requirements. In this way, the values of the budgets () and losses () in the model are updated according to acceptable trade-offs.
4. Illustrative Example
This section presents an example to demonstrate how to apply the presented model to solve the risk response strategy selection problems.
4.1. Problem Description
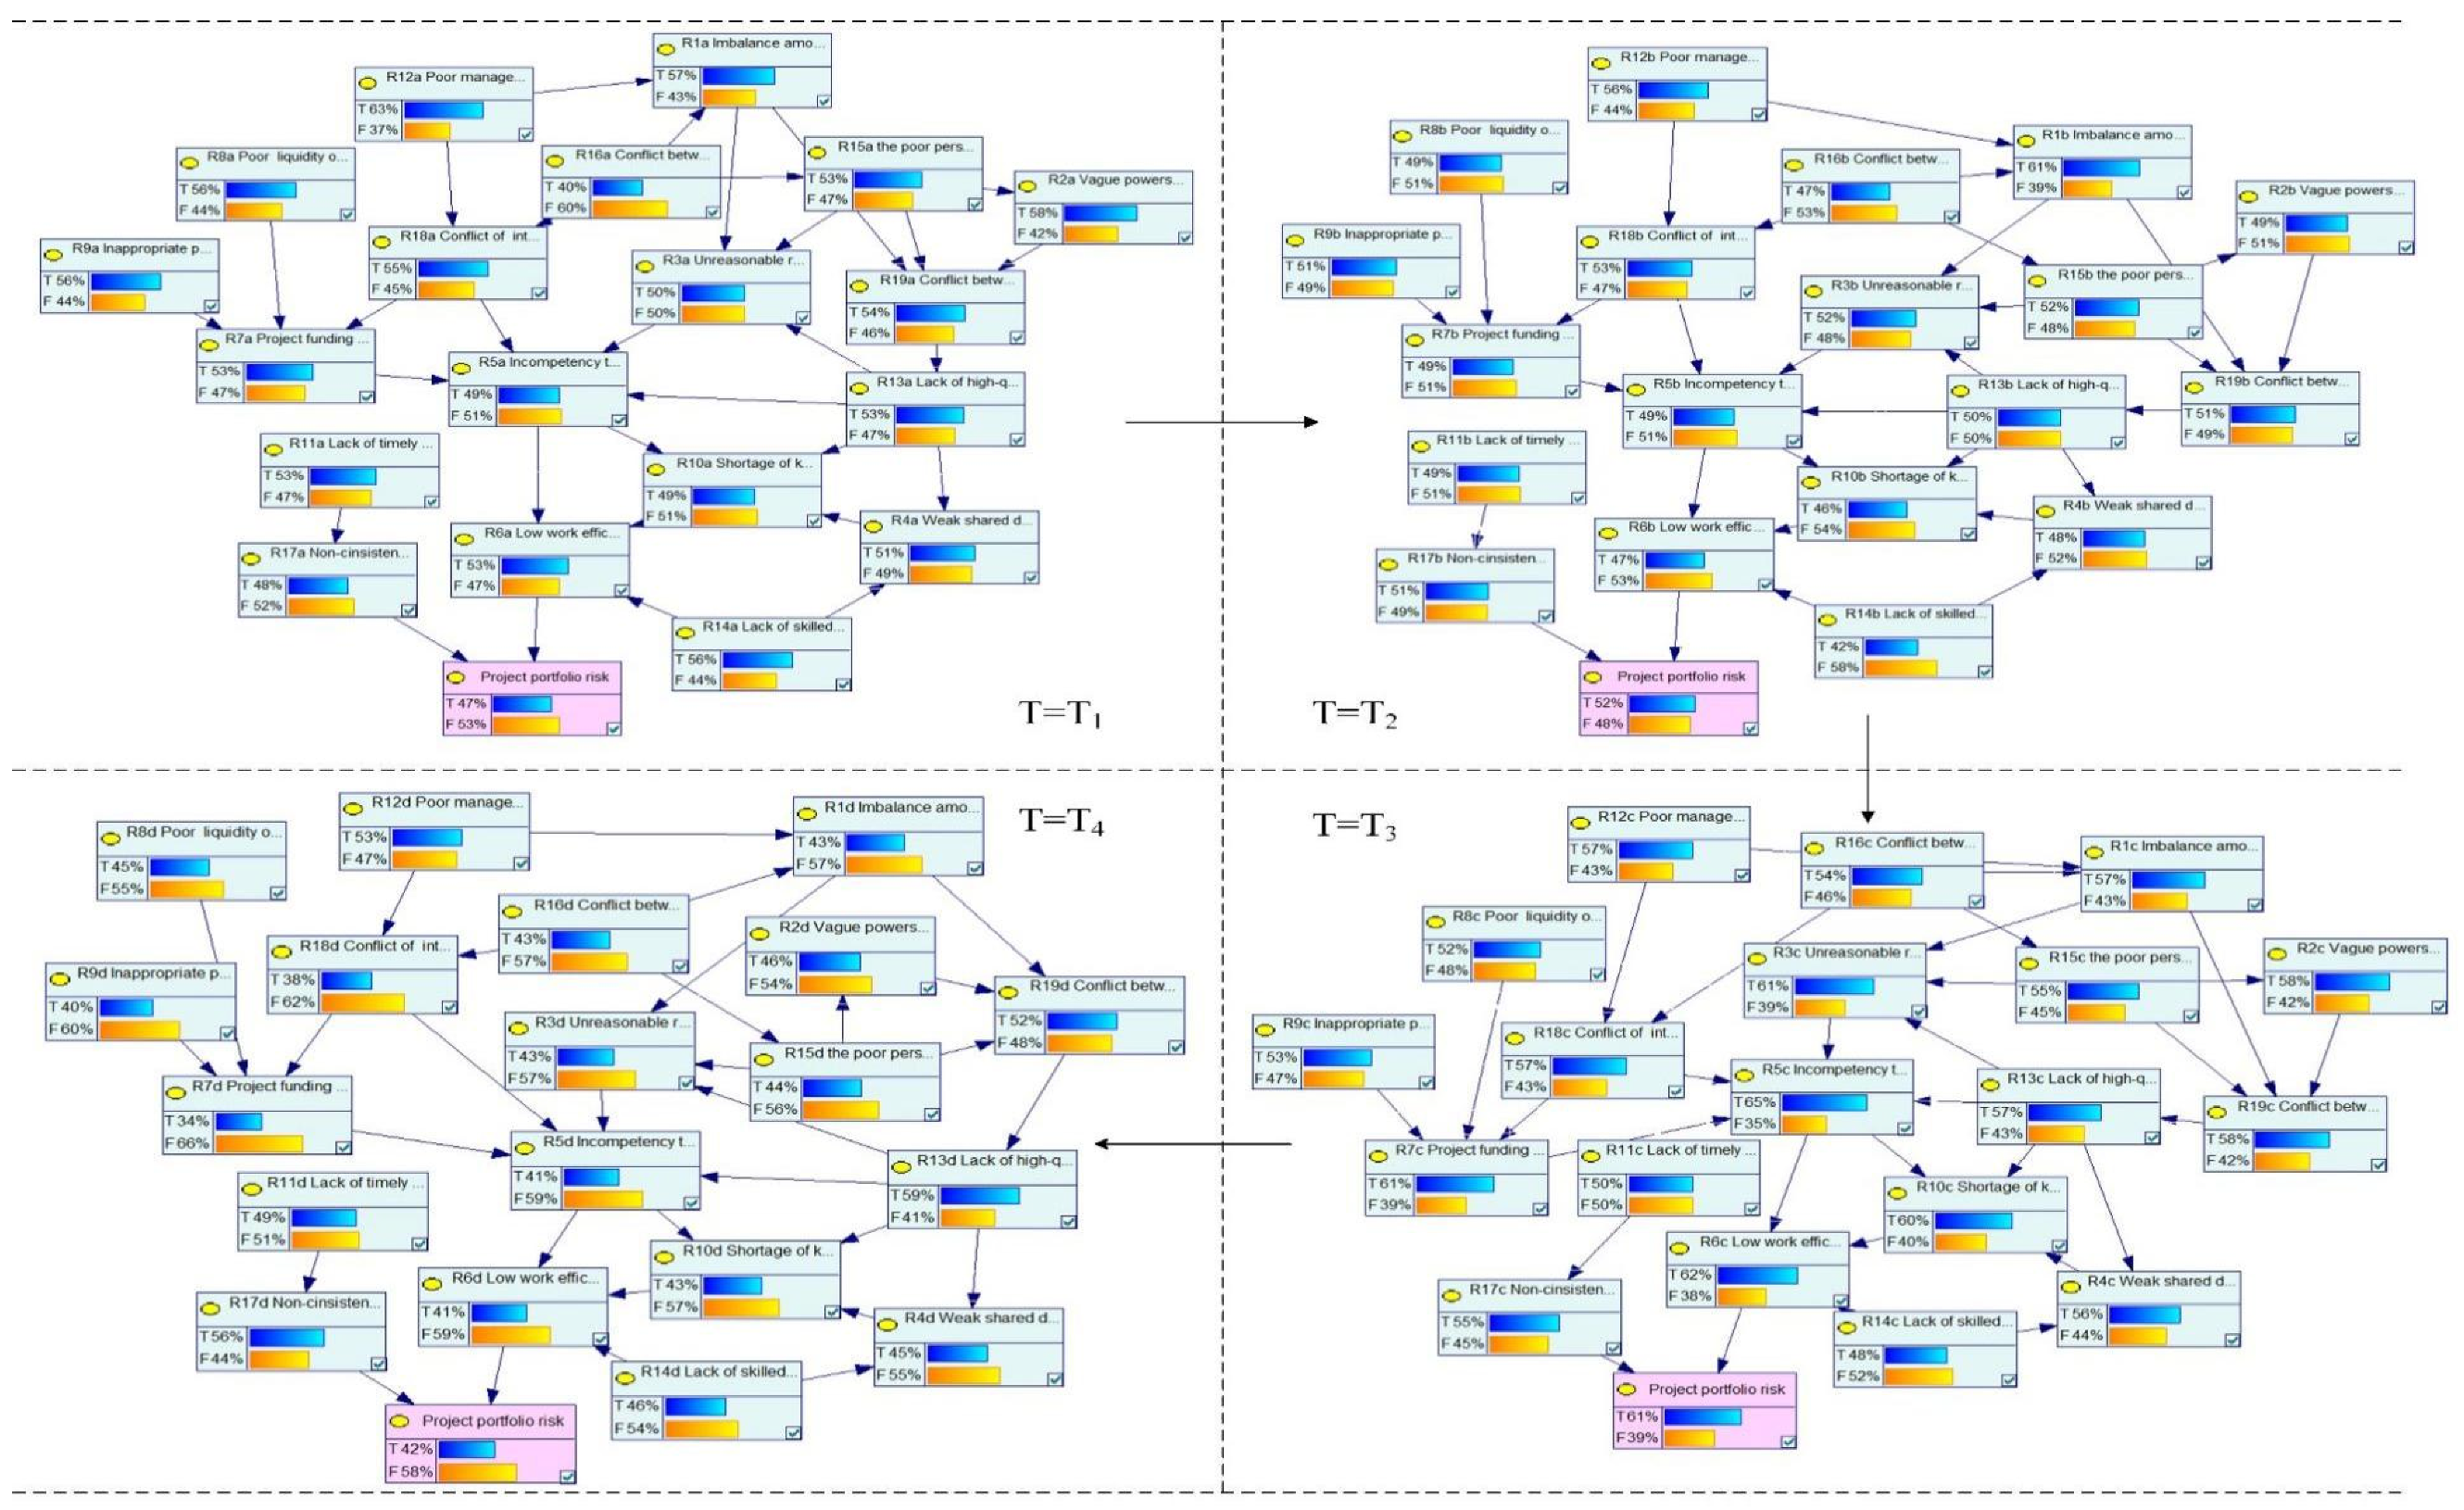
To demonstrate the PP’s risk response planning, a construction PP evaluated by HD Consulting Co., Ltd. in Xian, Shaanxi Province, China is considered. First, the impact of the PPRs on the life cycle is assessed based on a DBN. A heterogeneous group of experts, including six specialists from HD Consulting Co., Ltd., in Xian, Shaanxi Province, China was employed to complete the questionnaire. The specialists included professors, senior consultants, senior trainers, project managers, and senior engineers who possessed rich theoretical knowledge and years of work experience in project management. The CPTs were then computed as presented in Section 3.2. Finally, the evaluation model of PPRs using the DBN was determined using GeNIe 2.3, presented in Appendix A. After assessing the probabilities of PPRs, the of PPRs is obtained by combining them with the loss of PPRs. Appendix B presents the of the PPRs at different stages.
On the basis of the identification of the risks presented in Table 1, the managers proposed 19 candidate risk response strategies. Appendix C shows the potential risk response actions and the estimated costs . Among the strategies, strategies and exclude each other, and considering the budget constraint, only one can be selected, i.e., . The budget to implement the risk response actions should not exceed ¥25 million in each stage (i.e., = 25) (k = 1, 2, 3, 4). Furthermore, the next step is to determine the constraints on the losses. Based on the company’s experience in implementing similar projects and historical data, the most acceptable from the initiation stage to the optimization stage was = 5000, = 5000, = 5000, = 1000.
According to the data of the construction PP described above and based on Equations (8)–(14), the risk response optimization model can be constructed, as shown in Equations (15)–(20):
4.2. Results and Analysis
To solve the model, CPLEX is introduced to quickly find the optimal decision. The set of solutions obtained is presented in Table 5.
In the following, this study investigates the distributional features of risk response actions. As shown in Table 5, most risk response strategies are conducted in the initiation and planning stages. Specifically, in the initiation stage, six activities are planned, namely, , ,, , , and . The planning stage implements four actions, , , , and . Although the execution stage has the highest probability of risk in the PP life cycle [62], only four actions, , , and need to be implemented. In the optimization stage, and are selected to manage the associated risk. Most of the risk response measures are concentrated in the first two stages. This finding indicates that the remaining PPRs should be planned in the first two stages. Furthermore, by combining the risk response strategies implemented in the first two stages with the DBN, it can be observed that the strategies are more focused on the beginning of the risk propagation network, that is, those risk nodes that do not have a parent node. For example, as shown in Figure 6, and , which are controlled by risk response strategies and are the root nodes in the network and are the sources of risk in the network propagation process. The above shows that the earlier the risk chain reactions are stopped, the smaller the negative effects of the risk factors.
5. Discussion
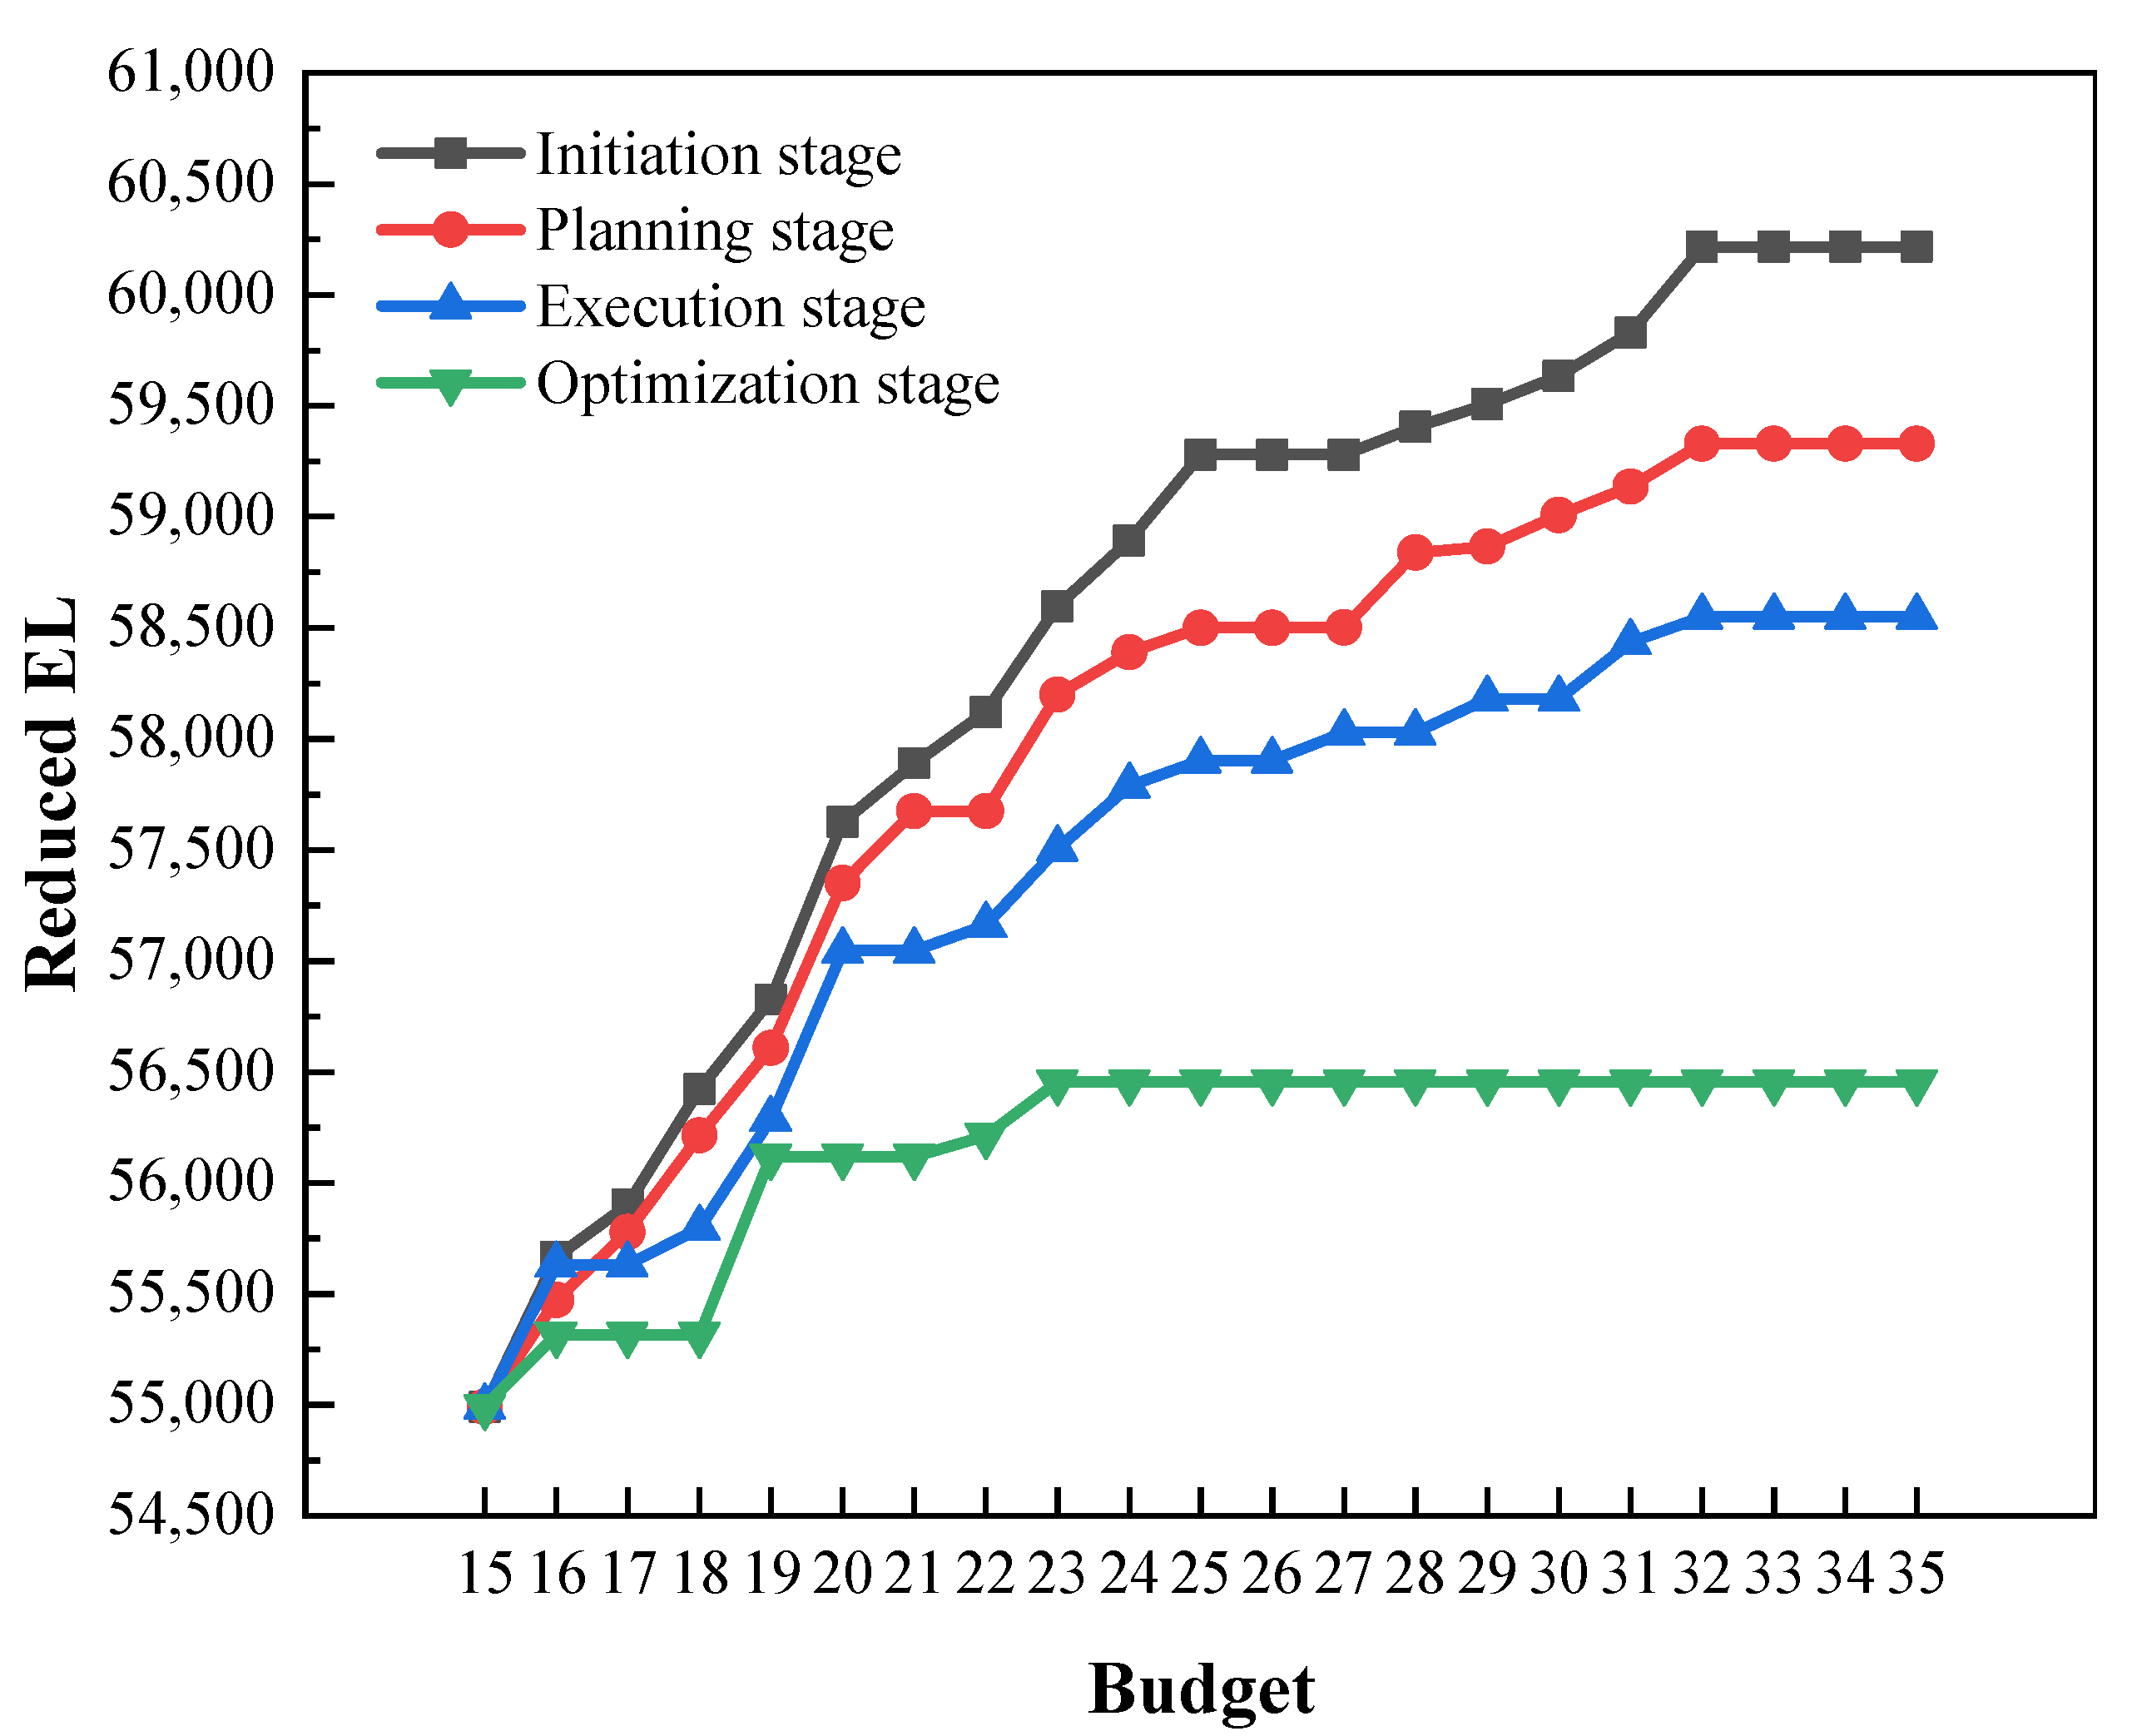
Based on the exploration of the risk losses that can be reduced with a given budget, further exploration of the impact of different budgets on the effectiveness of risk response result in a better understanding of the characteristics of risk response over the life cycle. To analyze the impact of the risk response budget, the effects of risk response strategies under four stages are calculated, as presented in Figure 6. The horizontal axis shows the response budget, and the vertical axis shows the response effect. The four different colored folding line charts depict the impact of the budget on the risk response in the four stages. As evidenced by Figure 6, although risk response effectiveness is positively related to the risk response budget, the correlation gradually decreases. The reason for this is that when the budget is large enough, nearly all risks in this stage are addressed. Furthermore, the effect of response strategies in earlier stages is always higher than those in later stages. These results indicate that the earlier response strategies are planned, the less negative the impacts of the risks. Therefore, it is advisable to control risks as early as possible to minimize their negative impacts.
5.1. Theoretical Implication
Analyzing the causality and life cycle correlation of PPRs can assist managers in choosing risk response strategies more effectively. The life cycle correlation of PPRs is one of the critical factors affecting risk response that, if analyzed appropriately, can lead to more successful risk management in PP. To the best of our knowledge, this work is the first to develop a response strategy selection model that considers the causality and life cycle correlation of PPRs. While the growing body of literature on risk response analytics concentrates on how to select a risk response plan considering risk causality. This study complements this approach by developing a model that elaborates the causality and life cycle correlation of risks considered simultaneously. Specifically, it distinguishes risk causality and life cycle correlations, finds the linkage between such determining interdependency and reduces . These findings can be built upon in future studies to provide a deeper understanding of the relationships between risk interdependency and risk response strategies.
In addition, the introduction of a DBN and the optimization model into PPR management represents new risk management instruments. Several risk response approaches presented in previous studies lack the ability to consider life cycle correlation and suggest an adjustment of budgetary resources to allow for greater response effects. The combination of DBN and the optimization model bridges this gap, where the DBN is used to assess the causality and life cycle correlation between risks. On this basis, the risk–reward optimization model allows for the selection of the set of risk response strategies with the greatest response effect over the life cycle according to the resource situation. The model in this study expands method systems of risk response and offers the support of methodology for the life cycle management of PPRs.
5.2. Managerial Implication
First, the propagation mechanism of risk response analyzed in this paper contributes to helping managers allocate limited resources to effectively implement risk response actions. Risk response strategies are implemented at different stages of the life cycle, and their implementation can influence the probabilities of other risks through propagation in the network. By combining the propagation mechanism of risk response with the PPs’ available resources, managers can enhance their managerial practice regarding PPRs. Second, the constructed optimization model can simulate reduced under different budgets. After modifying the parameters according to the PP category, managers can use this model to simulate risk mitigation based on the current resources of the PP. By using the simulation outcomes, the model provides a quantitative basis for managers to select response strategies to improve the risk-reducing effect. Finally, the PPR management process presented in this study provides managers with a tool to evaluate and respond to PPRs to improve management efficiency. By applying the management procedure, the critical factors and the intensity of its management in the PP life cycle can be identified. The procedure provides managers with indications of what needs to be improved or corrected. Given the above, PPR management in the life cycle is conducive to strategic realization, which contributes to PPR mitigation and the formulation of response strategies.
6. Conclusions
Selecting the optimal risk response strategies to deal with PPRs considering causality and life cycle correlation is a vital problem for PPRM. Consequently, this research proposes the following question: What has to be done to select the optimal risk response strategies over the PP life cycle, considering the causality and life cycle correlation of PPRs? To address this question, a decision model for integrating the DBN and risk-reward optimization model to choose risk response strategies is presented. First, PPRs are fully identified considering project interdependency and then classified into six risk categories. Second, the DBN analysis is used to assess PPRs by visually modeling the causality and life cycle interdependency between risks. Third, a reward–risk optimization model is conducted to determine risk response strategies for each stage of the life cycle. Finally, an illustrative example in the construction of PP demonstrates how to implement the proposed model to select response strategies in actual applications. Thus, the research problem is solved by selecting the optimal response strategy during the life cycle while considering causal and life cycle dependencies.
As opposed to previous risk response research that does not consider causality and the life cycle correlation of PPRs, this study develops an optimization model based on the DBN assessment to analyze and improve the effects of risk response strategies. The proposed model supports the visualization of risk propagation paths and decision-making for selecting risk response strategies in the life cycle. Furthermore, this research explores the effects of risk response strategies under different budgets and four stages. The research results indicate that risk response effectiveness positively relates to the risk response budget and that the correlation gradually decreases. The exploration of these effects helps managers to better understand the characteristics of risk response over the life cycle and, thus, to provide an appropriate combination of risk response strategies consistent with the risk response budget.
The contributions of this study are threefold:
(1) This study provides a new perspective for further research on PPRM by considering the causality and life cycle correlation of PPRs in the risk response. By accounting for these risk correlations, the risk response could be more effective in reducing expected losses compared to the risk independence assumption.
(2) A novel risk response method is proposed by combining the DBN and the optimization model for the PPR response. This method allows a more comprehensive analysis of risk contagion paths by unlocking the black box of the risk propagation in the life cycle.
(3) The effects of risk response strategies are simulated via an illustrative example, with the results observing reduced risk effects of the PPR under different parameter value combinations. The simulation results help managers choose optimal risk response strategies according to the PP’s requirements and current resources.
Although this study makes a significant contribution to risk response strategy selection, some limitations should be considered in future research. The limitations of the study are as follows. First, due to the lack of historical data, the input data for the DBN models are obtained by expert judgment. Although the data from expert judgment are managed via fuzzy set theory to reduce assessment deviation, uncertainty in expert judgment cannot be eliminated. Accordingly, future studies could combine various research techniques with parallel computing, self-learning, and fault tolerance (such as neural networks) to assess PPRs accurately. Second, regarding the weight scores of different experts, as presented in Table 2, the proposed four categories are used to rate the competence of experts, which are, “experience time”, “educational level”, “professional position”, and “age”. Although the age of an expert may suggest that the expert has more experience, there is a certain degree of overlap with experience time. Thus, future research could develop a more comprehensive and standardized expert scoring system.
Author Contributions
Conceptualization, B.Z.; Methodology, B.Z. and L.B.; Validation, B.Z., L.B. and S.K.; Writing—Original Draft Preparation, B.Z.; Writing—Review and Editing, S.K. All authors have read and agreed to the published version of the manuscript.
Funding
This research was funded by the National Natural Science Foundation of China (grant numbers 72002018, 72201040), the Ministry of Education Humanities and Social Sciences Fund (grant numbers 17XJC630001), the Youth Innovation Team of Shaanxi Universities (grant number 21JP009), the Innovation Capacity Support Plan of Shaanxi Province (grant number 2022KRM012, 2020KJXX-054), the Fundamental Research Funds for the Central Universities (grant numbers 300102230613, 300102231639, 300102232601), Social Science Planning Fund of Shaanxi Province (grand numbers 2020R028), and Social Science Planning Fund of Xi’an City (grant number 22GL92) and the Social Science Foundation of Shaanxi Province (grant number 2022R027).
Data Availability Statement
Not applicable.
Conflicts of Interest
The authors declare no conflict of interest.
Appendix A. F-DBN Model of the PPRs
Appendix B. Expected Losses of the Risks at Each Stage
| Ri | Initiation Stage | Planning Stage | Execution Stage | Optimization Stage |
| R1 | 1240.32 | 1327.36 | 1240.32 | 935.68 |
| R2 | 675.7 | 570.85 | 675.7 | 535.9 |
| R3 | 835 | 868.4 | 1018.7 | 718.1 |
| R4 | 239.7 | 225.6 | 263.2 | 211.5 |
| R5 | 938.35 | 938.35 | 1244.75 | 785.15 |
| R6 | 431.95 | 383.05 | 505.3 | 334.15 |
| R7 | 991.1 | 916.3 | 1140.7 | 635.8 |
| R8 | 344.4 | 301.35 | 319.8 | 276.75 |
| R9 | 1103.2 | 1004.7 | 1044.1 | 788 |
| R10 | 735 | 690 | 900 | 645 |
| R11 | 749.95 | 693.35 | 707.5 | 693.35 |
| R12 | 1307.88 | 1162.56 | 1183.32 | 1100.28 |
| R13 | 973.61 | 918.5 | 1047.09 | 1083.83 |
| R14 | 588 | 441 | 504 | 483 |
| R15 | 776.45 | 761.8 | 805.75 | 644.6 |
| R16 | 606 | 712.05 | 818.1 | 651.45 |
| R17 | 1050.24 | 1115.88 | 1203.4 | 1225.28 |
| R18 | 255.75 | 246.45 | 265.05 | 176.7 |
| R19 | 626.4 | 591.6 | 672.8 | 603.2 |
Appendix C. Proposed Risk Response Actions and Estimated Costs
| Proposed Risk Response Actions | (Million Yuan) | |
| Implementing decentralized management and improving the policy-making procedure | 5 | |
| Hiring management experts for online instruction | 4 | |
| Providing training for project manager | 7 | |
| Development of a database | 2 | |
| Review the procurement schedule of major equipment according to the plan | 3.55 | |
| Introduce professional technical talent | 3.5 | |
| Application of contingency reserves (unallocated funds) | 2.8 | |
| Developing funding sources, such as fixed-rate loan contracts with lending banks | 6.7 | |
| Hire experts or outsourcing modules to third parties | 2 | |
| Replace imported equipment with analogous domestic equipment | 3.1 | |
| Planning and holding training courses for contractors and employees | 2.4 | |
| Developing and implementing a management screening system | 3.6 | |
| Improve communication networks and enhance the ability to communicate | 1 | |
| Prepare backup persons | 1.5 | |
| Training personnel and gaining the loyalty of key personnel | 3.5 | |
| Hiring a professional management team | 1 | |
| Perform market research and connect with users | 1.5 | |
| Hiring a local agent | 7.2 | |
| Building the prestige of the critical members and establishing proper values in the team | 5 |
References
- Project Management Institute. A Guide to the Project Management Body of Knowledge (PMBOK® Guide), 7th ed.; Project Management Institute: Newtown Square, PA, USA, 2021. [Google Scholar]
- Bai, L.; Sun, Y.; Shi, H.; Shi, C.; Bai, J.; Han, X. Dynamic assessment modelling for project portfolio benefits. J. Oper. Res. Soc. 2021, 73, 1596–1619. [Google Scholar] [CrossRef]
- Teller, J. Portfolio Risk Management and Its Contribution to Project Portfolio Success: An Investigation of Organization, Process, and Culture. Proj. Manag. J. 2013, 44, 36–51. [Google Scholar] [CrossRef]
- Bai, L.B.; Shi, H.J.; Kang, S.Y.; Zhang, B.B. Project portfolio risk analysis with the consideration of project interdependencies. Eng. Constr. Archit. Manag. 2021. [Google Scholar] [CrossRef]
- Sanchez, H.; Robert, B.; Bourgault, M.; Pellerin, R. Risk management applied to projects, programs, and portfolios. Int. J. Manag. Proj. Bus. 2009, 2, 14–35. [Google Scholar] [CrossRef]
- Reyck, B.D.; Grushka-Cockayne, Y.; Lockett, M.; Calderini, S.R.; Moura, M.; Sloper, A. The impact of project portfolio management on information technology projects. Int. J. Proj. Manag. 2005, 23, 524–537. [Google Scholar] [CrossRef]
- Zhang, Y.; Fan, Z. An optimization method for selecting project risk response strategies. Int. J. Proj. Manag. 2014, 32, 412–422. [Google Scholar] [CrossRef]
- Mokhtari, G.; Aghagoli, F. Project Portfolio Risk Response Selection Using Bayesian Belief Networks. Iran. J. Basic Manag. Stud. 2020, 13, 197–219. [Google Scholar] [CrossRef]
- Ebrahimnejad, S.; Mousavi, S.M.; Seyrafianpour, H. Risk identification and assessment for build–operate–transfer projects: A fuzzy multi attribute decision making model. Expert Syst. Appl. 2010, 37, 575–586. [Google Scholar] [CrossRef]
- Teller, J.; Kock, A. An empirical investigation on how portfolio risk management influences project portfolio success. Int. J. Proj. Manag. 2013, 31, 817–829. [Google Scholar] [CrossRef]
- Miller, R.; Lessard, D. Understanding and managing risks in large engineering projects. Int. J. Proj. Manag. 2001, 19, 437–443. [Google Scholar] [CrossRef]
- Zhang, Y.; Guan, X. Selecting Project Risk Preventive and Protective Strategies Based on Bow-Tie Analysis. J. Manag. Eng. 2018, 34, 04018009. [Google Scholar] [CrossRef]
- Guan, D.; Guo, P. Assessment of Project Portfolio Risk Based on Bayesian Network. J. Industr. Eng. 2015, 18, 31–35. [Google Scholar] [CrossRef]
- Zhang, Y. Selecting risk response strategies considering project risk interdependence. Int. J. Proj. Manag. 2016, 34, 819–830. [Google Scholar] [CrossRef] [Green Version]
- Fang, C.; Marle, F.; Xie, M.; Zio, E. An Integrated Framework for Risk Response Planning Under Resource Constraints in Large Engineering Projects. IEEE Trans. Eng. Manag. 2013, 60, 627–639. [Google Scholar] [CrossRef] [Green Version]
- Qin, Z.; Ji, C.; Su, X.; Nawaz, A. Probability Analysis of Construction Risk based on Noisy-or Gate Bayesian Networks. Reliab. Eng. Syst. Saf. 2022, 217, 107974. [Google Scholar] [CrossRef]
- Mancuso, A.; Compare, M.; Salo, A.; Zio, E. Portfolio optimization of safety measures for the prevention of time-dependent accident scenarios. Reliab. Eng. Syst. Saf. 2019, 190, 106500. [Google Scholar] [CrossRef]
- Cai, B.; Zhang, Y.; Yuan, X.; Gao, C.; Liu, Y.; Chen, G.; Liu, Z.; Ji, R. A Dynamic-Bayesian-Networks-Based Resilience Assessment Approach of Structure Systems: Subsea Oil and Gas Pipelines as A Case Study. China Ocean Eng. 2020, 34, 597–607. [Google Scholar] [CrossRef]
- Cagliano, A.C.; Grimaldi, S.; Rafele, C. Choosing project risk management techniques. A theoretical framework. J. Risk Res. 2014, 18, 232–248. [Google Scholar] [CrossRef] [Green Version]
- Fan, M.; Lin, N.-P.; Sheu, C. Choosing a project risk-handling strategy: An analytical model. Int. J. Prod. Econ. 2008, 112, 700–713. [Google Scholar] [CrossRef]
- Yang, L.; Li, N. Interval model and its algorithm for optimal selecting of software project risk response actions. J. Control. Decis. 2011, 26, 530–534. [Google Scholar] [CrossRef]
- Parsaei Motamed, M.; Bamdad, S. A multi-objective optimization approach for selecting risk response actions: Considering environmental and secondary risks. Opsearch 2021, 59, 266–303. [Google Scholar] [CrossRef]
- Soofifard, R.; Bafruei, M.K. An optimal model for Project Risk Response Portfolio Selection (P2RPS) (Case study: Research institute of petroleum industry). Iran. J. Basic Manag. Stud. 2016, 9, 741–765. [Google Scholar]
- Ahmadi-Javid, A.; Fateminia, S.H.; Gemünden, H.G. A Method for Risk Response Planning in Project Portfolio Management. Proj. Manag. J. 2019, 51, 77–95. [Google Scholar] [CrossRef]
- Wu, D.; Li, J.; Xia, T.; Bao, C.; Zhao, Y.; Dai, Q. A multiobjective optimization method considering process risk correlation for project risk response planning. Inf. Sci. 2018, 467, 282–295. [Google Scholar] [CrossRef]
- Bao, C.; Wan, J.; Wu, D.; Li, J. Aggregating risk matrices under a normative framework. J. Risk Res. 2019, 24, 999–1015. [Google Scholar] [CrossRef]
- Haimes, Y.Y. Risk Modeling, Assessment, and Management, 4th ed.; John Wiley & Sons: Hoboken, NJ, USA, 2016. [Google Scholar]
- Cerezo-Narváez, A.; Pastor-Fernández, A.; Otero-Mateo, M.; Ballesteros-Pérez, P. Integration of Cost and Work Breakdown Structures in the Management of Construction Projects. Appl. Sci. 2020, 10, 1386. [Google Scholar] [CrossRef] [Green Version]
- Sharon, A.; Dori, D. A Project–Product Model–Based Approach to Planning Work Breakdown Structures of Complex System Projects. IEEE Syst. J. 2015, 9, 366–376. [Google Scholar] [CrossRef]
- Zhong, X.; Zhou, S. Risk analysis method of bank microfinance based on multiple genetic artificial neural networks. Neural. Comput. Appl. 2020, 32, 5367–5377. [Google Scholar] [CrossRef]
- Yang, R.J.; Zou, P.X.W. Stakeholder-associated risks and their interactions in complex green building projects: A social network model. Build Environ. 2014, 73, 208–222. [Google Scholar] [CrossRef]
- Ghasemi, F.; Sari, M.; Yousefi, V.; Falsafi, R.; Tamošaitienė, J. Project Portfolio Risk Identification and Analysis, Considering Project Risk Interactions and Using Bayesian Networks. Sustainability 2018, 10, 1609. [Google Scholar] [CrossRef] [Green Version]
- Fam, M.L.; He, X.; Konovessis, D.; Ong, L.S. Using Dynamic Bayesian Belief Network for analysing well decommissioning failures and long-term monitoring of decommissioned wells. Reliab. Eng. Syst. Saf. 2020, 197, 106855. [Google Scholar] [CrossRef]
- Khan, B.; Khan, F.; Veitch, B. A Dynamic Bayesian Network model for ship-ice collision risk in the Arctic waters. Saf. Sci. 2020, 130, 104858. [Google Scholar] [CrossRef]
- Li, Z.; Wang, T.; Ge, W.; Wei, D.; Li, H. Risk Analysis of Earth-Rock Dam Breach Based on Dynamic Bayesian Network. Water 2019, 11, 2305. [Google Scholar] [CrossRef] [Green Version]
- Umar, T. Key factors influencing the implementation of three-dimensional printing in construction. Proc. Inst. Civ. Eng. 2021, 174, 104–117. [Google Scholar] [CrossRef]
- Umar, T. Challenges of BIM implementation in GCC construction industry. Eng. Constr. Archit. Manag. 2021, 29, 1139–1168. [Google Scholar] [CrossRef]
- Eybpoosh, M.; Dikmen, I.; Talat Birgonul, M. Identification of Risk Paths in International Construction Projects Using Structural Equation Modeling. J. Constr. Eng. Manag. 2011, 137, 1164–1175. [Google Scholar] [CrossRef]
- Costa, H.R.; Barros, M.d.O.; Travassos, G.H. Evaluating software project portfolio risks. J. Syst. Softw. 2007, 80, 16–31. [Google Scholar] [CrossRef]
- Hadjinicolaou, N.; Dumrak, J. Investigating Association of Benefits and Barriers in Project Portfolio Management to Project Success. Procedia Eng. 2017, 182, 274–281. [Google Scholar] [CrossRef]
- Hofman, M.; Spalek, S.; Grela, G. Shedding New Light on Project Portfolio Risk Management. Sustainability 2017, 9, 1798. [Google Scholar] [CrossRef] [Green Version]
- Fang, C.; Marle, F. A simulation-based risk network model for decision support in project risk management. Decis. Support Syst. 2012, 52, 635–644. [Google Scholar] [CrossRef]
- Browning, T.R.; Yassine, A.A. Resource-constrained multi-project scheduling: Priority rule performance revisited. Int. J. Prod. Econ. 2010, 126, 212–228. [Google Scholar] [CrossRef]
- Zou, P.X.W.; Zhang, G.; Wang, J. Understanding the key risks in construction projects in China. Int. J. Proj. Manag. 2007, 25, 601–614. [Google Scholar] [CrossRef]
- Keshk, A.M.; Maarouf, I.; Annany, Y. Special studies in management of construction project risks, risk concept, plan building, risk quantitative and qualitative analysis, risk response strategies. Alex. Eng. J. 2018, 57, 3179–3187. [Google Scholar] [CrossRef]
- Nieto, M.A.; Ruz, V.F. A fuzzy approach to construction project risk assessment. Int. J. Proj. Manag. 2011, 29, 220–231. [Google Scholar] [CrossRef] [Green Version]
- Palomo, J.; Rios Insua, D.; Ruggeri, F. Modeling external risks in project management. Risk Anal. 2007, 27, 961–978. [Google Scholar] [CrossRef]
- Park, J.; Park, B.; Cha, Y.; Hyun, C. Risk Factors Assessment Considering Change Degree for Mega-projects. Procedia Soc. Behav. Sci. 2016, 218, 50–55. [Google Scholar] [CrossRef] [Green Version]
- Namazian, A.; Haji Yakhchali, S. Modified Bayesian Network–Based Risk Analysis of Construction Projects: Case Study of South Pars Gas Field Development Projects. ASCE-ASME J. Risk Uncertain. Eng. Syst. Part A 2018, 4, 05018003. [Google Scholar] [CrossRef]
- Micán, C.; Fernandes, G.; Araújo, M.; Araújo, E.A.A. Operational risk categorization in project-based organizations: A theoretical perspective from a project portfolio risk lens. In Proceedings of the 8th Manufacturing Engineering Society International Conference, Madrid, Spain, 19–21 June 2019. [Google Scholar]
- Abd El-Karim, M.S.B.A.; Mosa El Nawawy, O.A.; Abdel-Alim, A.M. Identification and assessment of risk factors affecting construction projects. HBRC J. 2019, 13, 202–216. [Google Scholar] [CrossRef] [Green Version]
- Yim, R.; Castaneda, J.; Doolen, T.; Tumer, I.; Malak, R. A study of the impact of project classification on project risk indicators. Int. J. Proj. Manag. 2015, 33, 863–876. [Google Scholar] [CrossRef]
- Vidal, L.A.; Marle, F. Understanding project complexity: Implications on project management. Kybernetes 2008, 37, 1094–1110. [Google Scholar] [CrossRef]
- Qiao, W.; Liu, Y.; Ma, X.; Liu, Y. Human Factors Analysis for Maritime Accidents Based on a Dynamic Fuzzy Bayesian Network. Risk Anal. 2020, 40, 957–980. [Google Scholar] [CrossRef]
- Zarei, E.; Yazdi, M.; Abbassi, R.; Khan, F. A hybrid model for human factor analysis in process accidents: FBN-HFACS. J Loss Prev. Process. Ind. 2019, 57, 142–155. [Google Scholar] [CrossRef]
- Ghasemi, F.; Ghasemi, A.; Kalatpour, O. Prediction of human error probability during the hydrocarbon road tanker loading operation using a hybrid technique of fuzzy sets, Bayesian network and CREAM. Int. J. Occup. Saf. Ergon. 2022, 28, 1342–1352. [Google Scholar] [CrossRef] [PubMed]
- Lyu, H.; Sun, W.; Shen, S.; Zhou, A. Risk Assessment Using a New Consulting Process in Fuzzy AHP. J. Constr. Eng. Manag. 2020, 146, 04019112. [Google Scholar] [CrossRef]
- Yang, X.; Ding, J.; Hou, H. Application of a triangular fuzzy AHP approach for flood risk evaluation and response measures analysis. Nat. Hazards 2013, 68, 657–674. [Google Scholar] [CrossRef]
- Zhang, L.; Wu, X.; Qin, Y.; Skibniewski, M.J.; Liu, W. Towards a Fuzzy Bayesian Network Based Approach for Safety Risk Analysis of Tunnel-Induced Pipeline Damage. Risk Anal. 2016, 36, 278–301. [Google Scholar] [CrossRef]
- Chin, K.; Tang, D.; Yang, J.; Wong, S.; Wang, H. Assessing new product development project risk by Bayesian network with a systematic probability generation methodology. Expert Syst. Appl. 2009, 36, 9879–9890. [Google Scholar] [CrossRef]
- Kwan, T.W.; Leung, H.K.N. A Risk Management Methodology for Project Risk Dependencies. IEEE Trans. Softw. Eng. 2011, 37, 635–648. [Google Scholar] [CrossRef]
- He, Q.; Yang, D.; Luo, L.; Ma, L.; Li, L. Research of large scale and complex construction programs’ schedule risk based on Bayesian network. Soft Sci. 2016, 30, 120–126+139. [Google Scholar] [CrossRef]
Figure 1.
Proposed framework for the selection of risk response strategies.

Figure 2.
The initial network of the DBN.
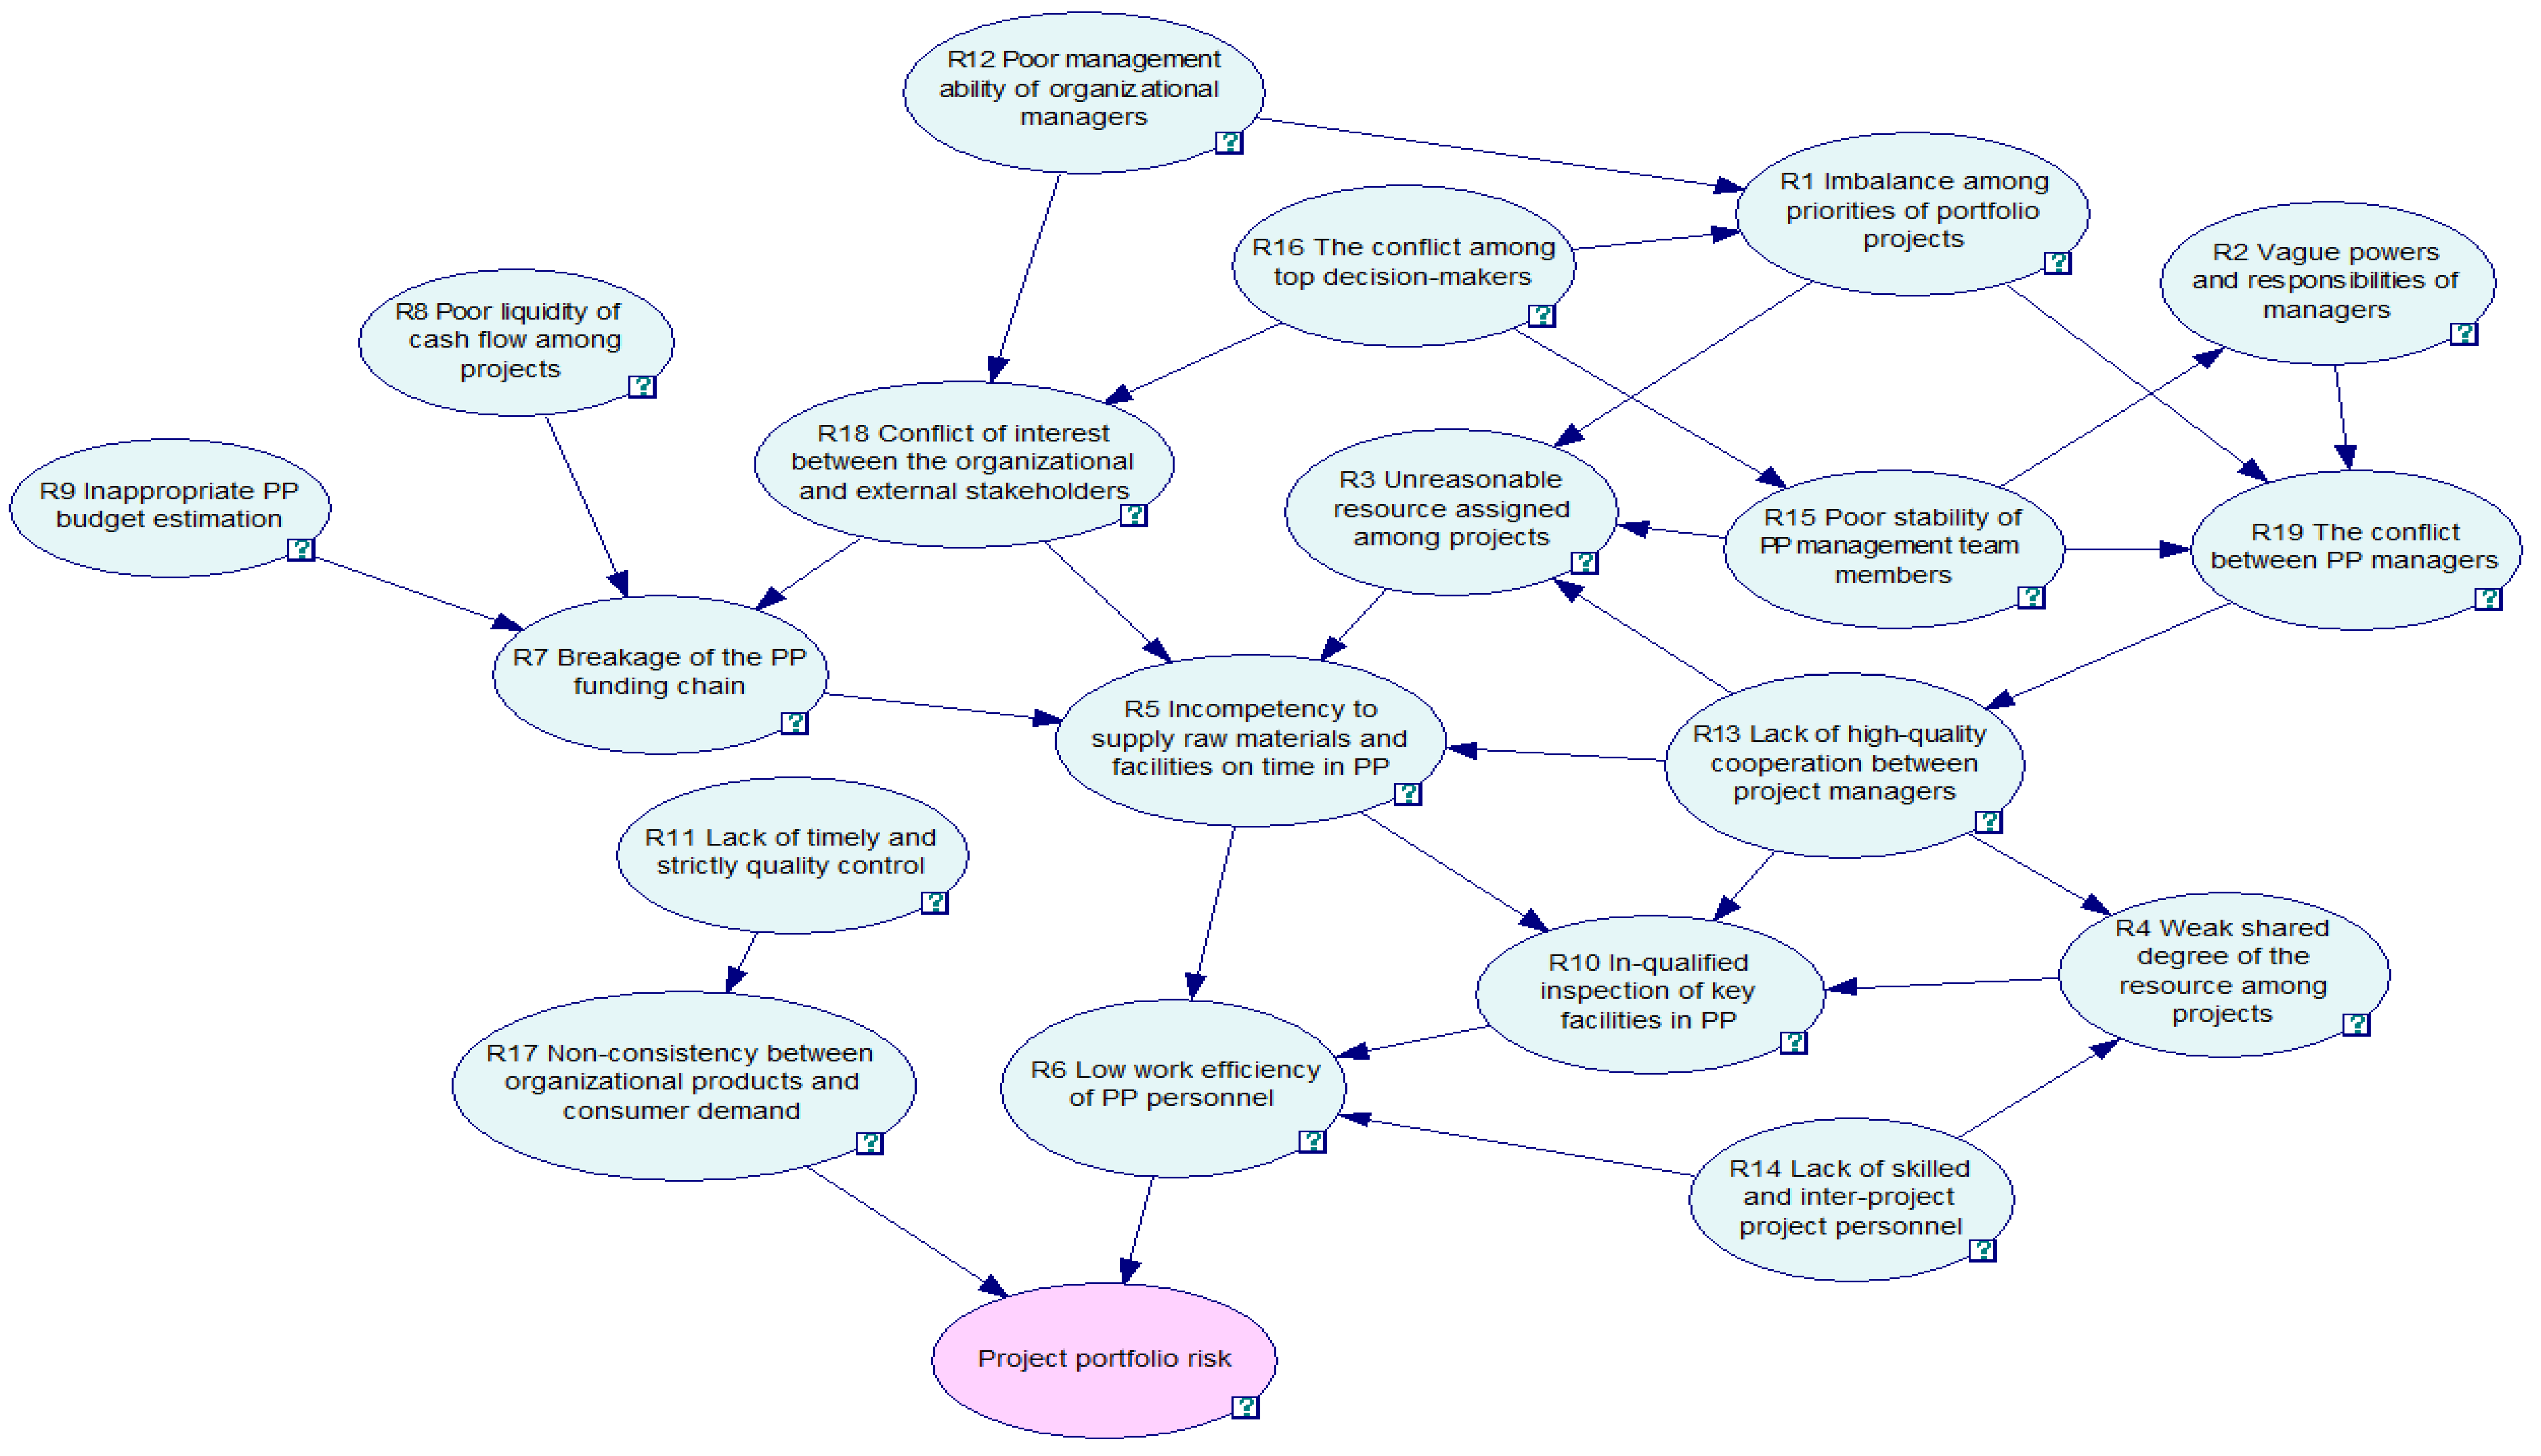
Figure 3.
An instance of the DBN model with two-time slices.

Figure 4.
Indirect impact path of risk.
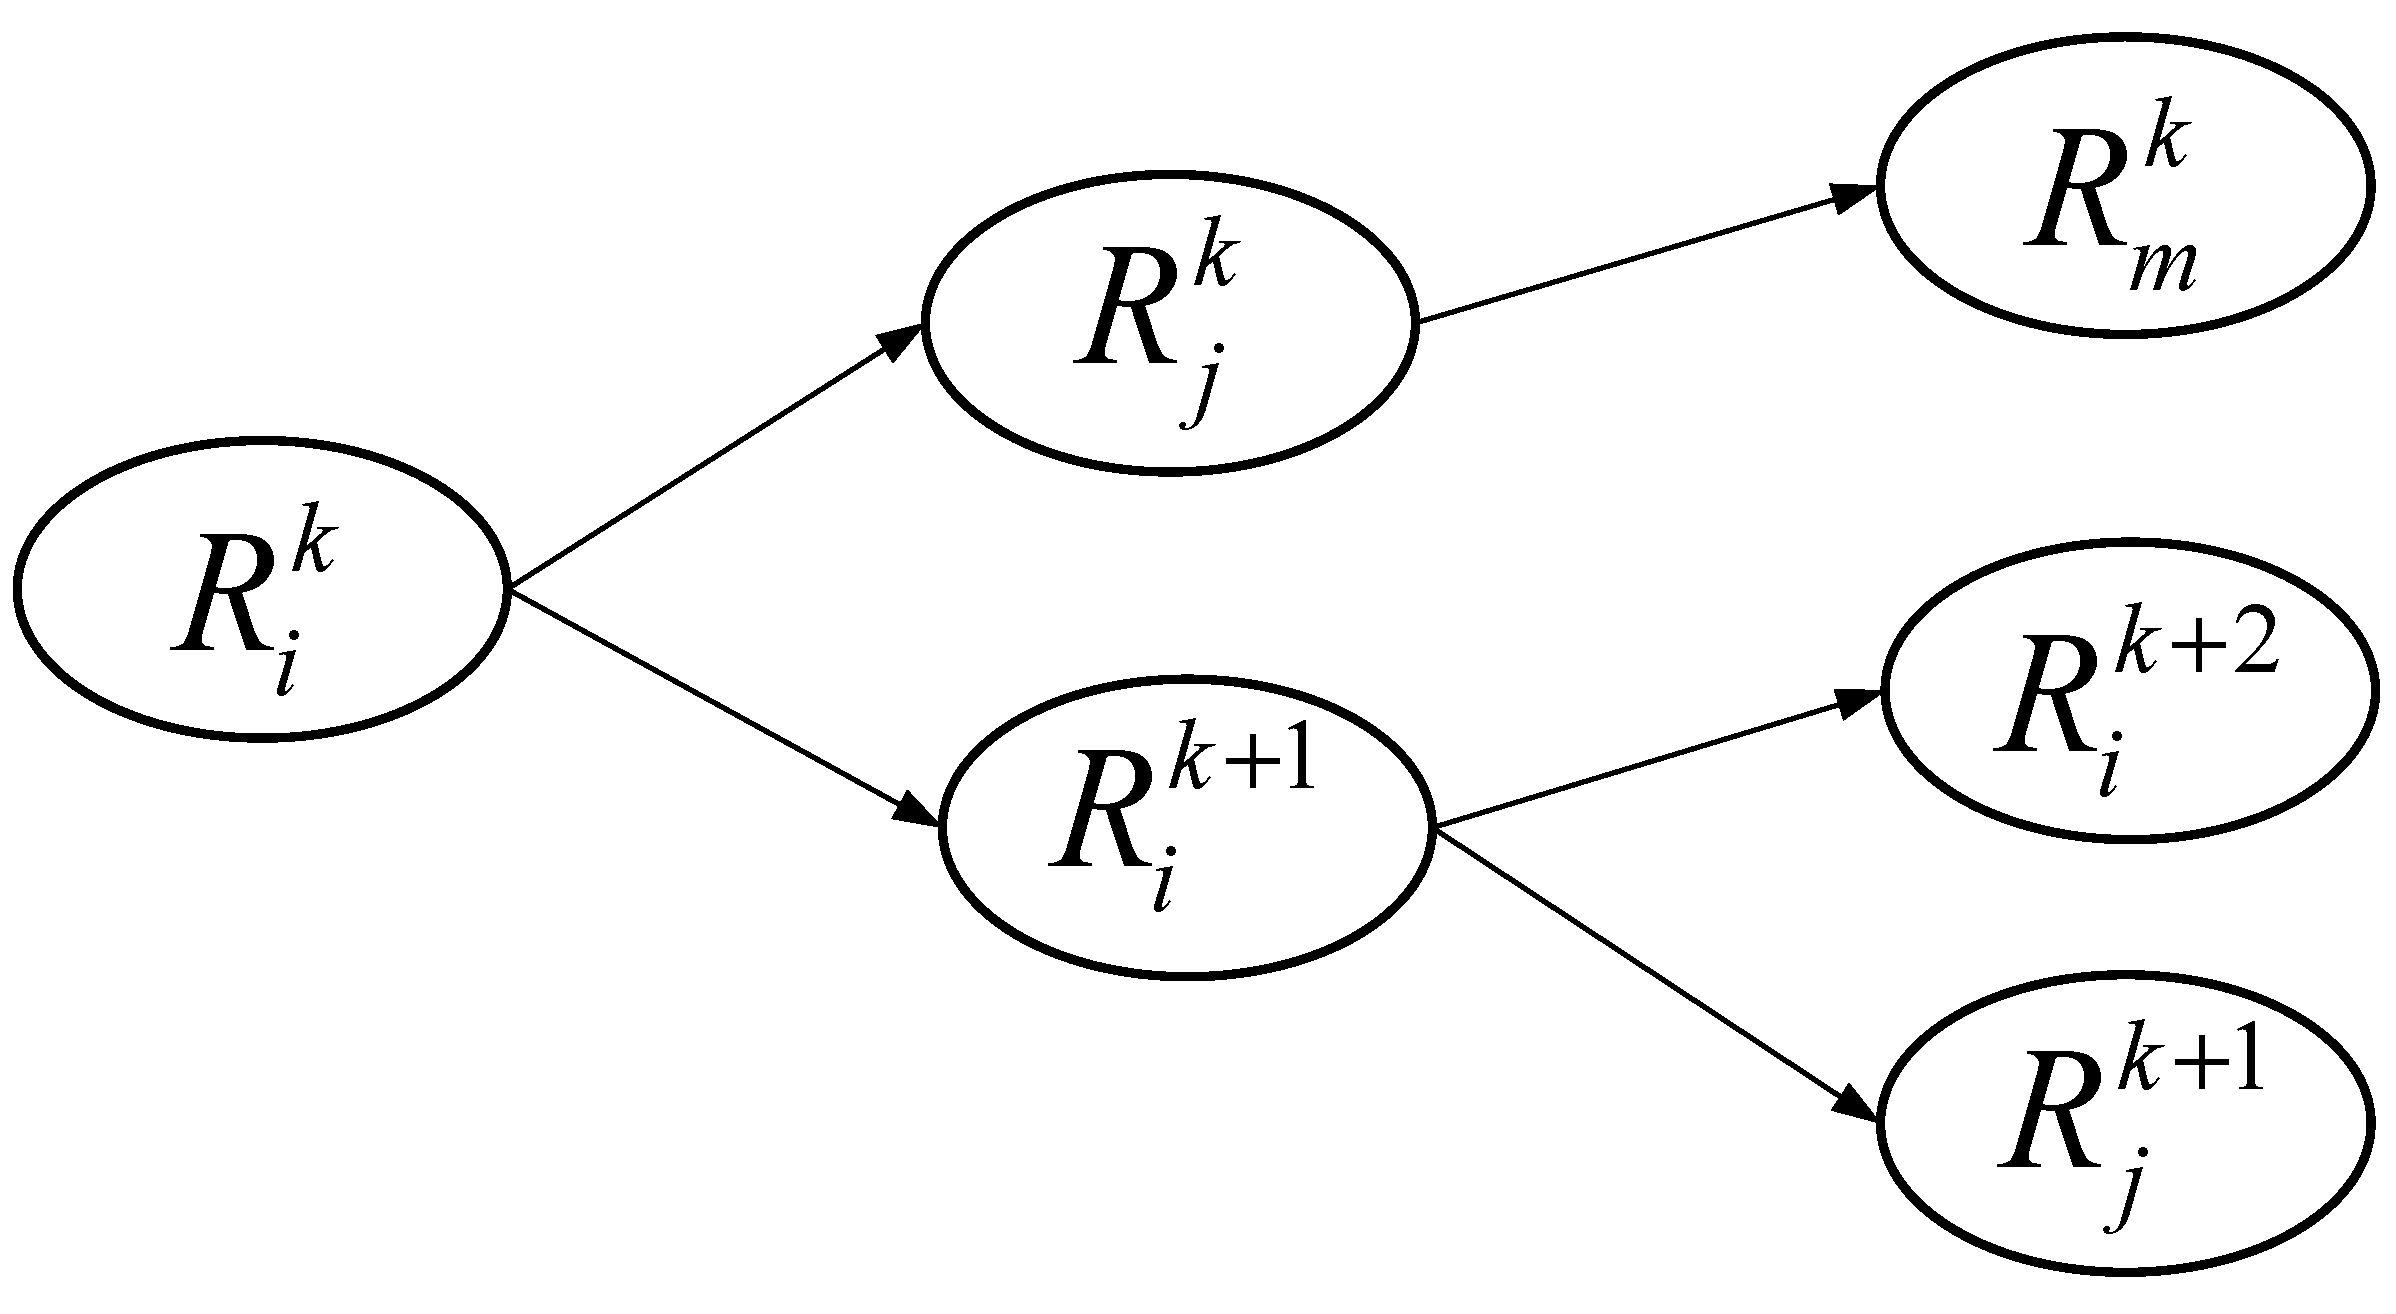
Figure 5.
An instance of the risk contagion path of “”.
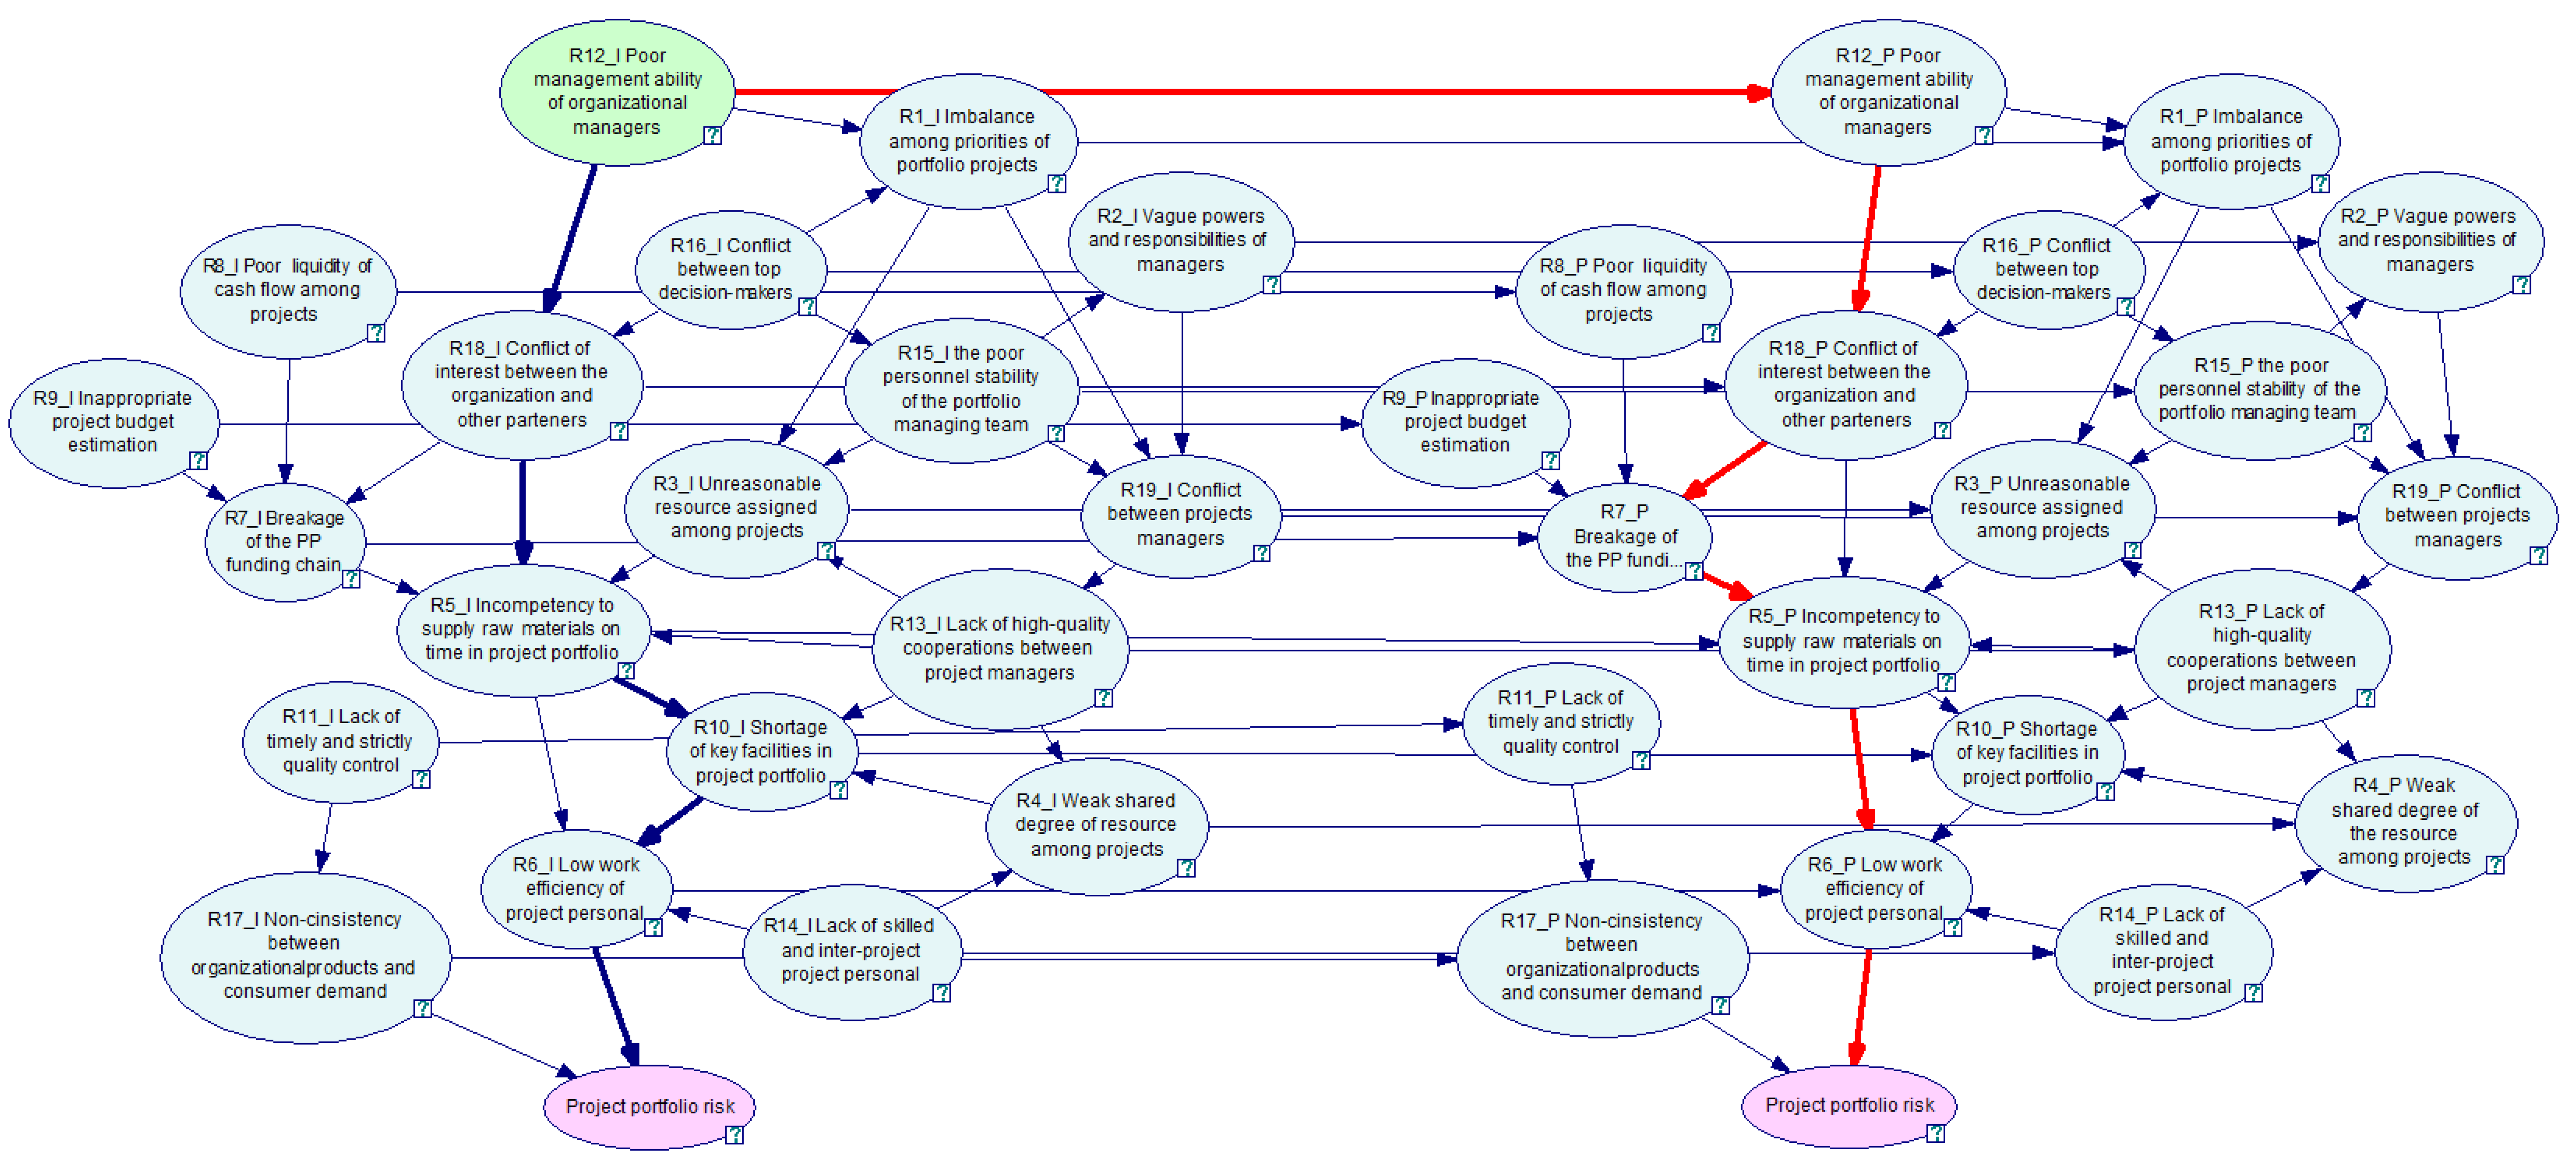
Figure 6.
Reduced effects for different budgets and stages.

Table 1.
Potential risks in PPs.
| Category | No. | Risk Factor | Description | Source |
|---|---|---|---|---|
| Organization Management | R1 | Imbalance among priorities of portfolio projects | Projects are inaccurately prioritized in the project portfolio (PP), including the sequence of project implementation or material distribution. | [40,41] |
| R2 | Vague powers and responsibilities of managers | The scope of the rights that the organization manager can exercise is not clear, and the responsibility goal to be undertaken is also not clear. | [32,42] | |
| R3 | Unreasonable resource assignment among projects | The limited resources for allocation cannot be reasonably allocated to important projects to achieve maximum benefits. | [14,43] | |
| R4 | Weak shared degree of the resource among projects | The coordination and sharing degree of critical materials in the PP is low, resulting in a low material utilization rate. | [32,44] | |
| Time Management | R5 | Incompetency to supply raw materials and facilities on time in the PP | The materials needed for project execution could not be delivered on time during the implementation, resulting in delays in PP progress. | [45,46] |
| R6 | Low work efficiency of PP personnel | Project workers are work-inefficient due to a lack of technical skills or conflicts with organizational culture, which affects the progress of the PP. | [14,44] | |
| Cost Management | R7 | Breakage of the PP funding chain | Financial problems or capital chain disruptions cannot provide adequate funding support for the smooth implementation of the PP. | [47] |
| R8 | Poor liquidity of cash flow among projects | The assets cannot be recovered in full as scheduled, and the repayment of due liabilities and new reasonable loans, and other financing needs cannot be met. | [48] | |
| R9 | Inappropriate PP budget estimation | Evaluation of the PP economic benefits is improper, and feasibility study results are inaccurate, thus affecting the subsequent management of the portfolio cost. | [44,49] | |
| Quality Management | R10 | In-qualified inspection of key facilities in the PP | Key large equipment entrance inspection, site installation, operation specifications, and other processes are unqualified. | [50] |
| R11 | Lack of timely and strict quality control | The production links of various projects in the PP lack strict control, and the quality of the project products do not meet the standards. | [14,49] | |
| Human Resource Management | R12 | Poor management ability of organizational managers | The manager is unable to manage and monitor the portfolio effectively. | [38,51] |
| R13 | Lack of high-quality cooperation between project managers | Project managers do not provide timely share information and resources to facilitate PP team collaboration. | [41,42] | |
| R14 | Lack of skilled and inter-project project personnel | Shortage of professional staff who can easily switch between projects to save time and improve project coordination. | [32] | |
| R15 | Poor stability of PP management team members | The management team is unstable: management personnel will constantly change, leading to blind or stagnant work handover. | [41] | |
| Stakeholder Management | R16 | The conflict among top decision-makers | Conflict among top decision-makers caused by their different interests will affect the correctness of organizational management decisions. | [32,41] |
| R17 | Non-consistency between organizational products and consumer demand | Organizational production cannot meet the needs of the market and users, affecting corporate performance and benefits. | [52] | |
| R18 | Conflict of interest between the organizational and external stakeholders | Conflicts between organization managers and external stakeholders such as suppliers, regulators, environmentalists, financial organizations, and the media affect the realization of strategic goals. | [32,48] | |
| R19 | The conflict between PP managers | PP managers have conflicts due to differences in interest distribution, management concepts, etc. | [41] |
Table 2.
Weight scores of different experts.
| Indicator | Classification | Score | Indicator | Classification | Score |
|---|---|---|---|---|---|
| Experience time (years) | ≥30 | 5 | Professional position | Senior academic | 5 |
| 20–29 | 4 | Junior academic | 4 | ||
| 10-–19 | 3 | Engineer | 3 | ||
| 6–9 | 2 | Technician | 2 | ||
| 2–5 | 1 | Worker | 1 | ||
| Educational level | PhD | 5 | Age (years) | ≥50 | 5 |
| Master | 4 | 40–49 | 4 | ||
| Bachelor | 3 | 30–39 | 3 | ||
| Higher national diploma | 2 | 25–29 | 2 | ||
| School-level | 1 | <25 | 1 |
Table 3.
Expert Information and Weights.
| Experts | Experience Time (Years) | Professional Position | Educational Level | Age | Weight Score | Weight |
|---|---|---|---|---|---|---|
| Expert 1 | 2–5 | Junior academic | PhD | 25–29 | 1 + 4 + 5 + 2 = 12 | 0.152 |
| Expert 2 | 6–9 | Engineer | Master | 25–29 | 2 + 3 + 4 + 2 = 11 | 0.139 |
| Expert 3 | 10–19 | Senior academic | PhD | 30–39 | 3 + 5 + 5 + 3 = 16 | 0.203 |
| Expert 4 | 10–19 | Engineer | Bachelor | 40-49 | 3 + 3 + 3 + 4 = 13 | 0.165 |
| Expert 5 | 6–9 | Junior academic | Master | 30–39 | 2 + 4 + 4 + 3 = 13 | 0.165 |
| Expert 6 | ≥30 | Technician | Bachelor | 40–49 | 5 + 2 +3 + 4 = 14 | 0.176 |
Table 4.
The notation and definitions.
| Notation | Definition |
|---|---|
| z | The risk response effect. |
| The set of risk response strategies, . | |
| The cost of implementing a risk response strategy . | |
| The direct risk response effect on risk after implementing a risk response strategy in stage k. | |
| The indirect risk response effect to other risks in the subsequent stages (m = k + 1, …. t) after implementing the response strategy deal with in stage k. | |
| The indirect risk response effect to other risks in stage k after implementing the risk response strategy deal with in stage k. | |
| The budget for implementing risk response strategies at each stage. | |
| The expected loss in stage k before implementing the risk response strategy . | |
| The risk response effect after implementing a risk response strategy in stage k. | |
| The upper bound for expected losses that can be accepted in stage k. | |
| The set of all mutually exclusive pairs of strategies. | |
| Binary integer decision variables. equals 1 if the is selected in stage k; otherwise, is equal to 0. |
Table 5.
Optimal objective function values and corresponding response plan.
| Initiation | 0 | 1 | 0 | 0 | 0 | 0 | 0 | 0 | 0 | 0 | 1 | 1 | 1 | 0 | 0 | 0 | 0 | 1 | 1 | 23.2 |
| Planning | 1 | 0 | 1 | 1 | 0 | 0 | 0 | 0 | 0 | 0 | 0 | 0 | 0 | 0 | 1 | 0 | 0 | 0 | 0 | 17.5 |
| Execution | 0 | 0 | 0 | 0 | 0 | 1 | 1 | 0 | 1 | 1 | 0 | 0 | 0 | 0 | 0 | 0 | 0 | 0 | 0 | 11.4 |
| Optimization | 0 | 0 | 0 | 0 | 0 | 0 | 0 | 0 | 0 | 0 | 0 | 0 | 0 | 1 | 0 | 0 | 1 | 0 | 0 | 3 |
| Z | 60,458.98 | |||||||||||||||||||
Publisher’s Note: MDPI stays neutral with regard to jurisdictional claims in published maps and institutional affiliations. |
© 2022 by the authors. Licensee MDPI, Basel, Switzerland. This article is an open access article distributed under the terms and conditions of the Creative Commons Attribution (CC BY) license (https://creativecommons.org/licenses/by/4.0/).
Share and Cite
MDPI and ACS Style
Zhang, B.; Bai, L.; Kang, S. Risk Response Strategies Selection over the Life Cycle of Project Portfolio. Buildings 2022, 12, 2191. https://doi.org/10.3390/buildings12122191
AMA Style
Zhang B, Bai L, Kang S. Risk Response Strategies Selection over the Life Cycle of Project Portfolio. Buildings. 2022; 12(12):2191. https://doi.org/10.3390/buildings12122191
Chicago/Turabian StyleZhang, Bingbing, Libiao Bai, and Shuyun Kang. 2022. "Risk Response Strategies Selection over the Life Cycle of Project Portfolio" Buildings 12, no. 12: 2191. https://doi.org/10.3390/buildings12122191
Note that from the first issue of 2016, this journal uses article numbers instead of page numbers. See further details here.