

Enhanced Strength, Durability, and Microstructural Attributes of Graphene Oxide-Modified Ultrafine Slag Cement Mortar
School of Civil Engineering, Vellore Institute of Technology, Vellore 632014, India
*
Author to whom correspondence should be addressed.
Buildings 2022, 12(12), 2199; https://doi.org/10.3390/buildings12122199
Submission received: 9 November 2022
/
Revised: 2 December 2022
/
Accepted: 5 December 2022
/
Published: 12 December 2022
(This article belongs to the Special Issue Development, Characterization and Evaluation of Advanced and Sustainable Cement-Based Materials)
Abstract
:The work described in this paper assays in detail the improvements in the prominent features of cement mortar cube (CMC) specimens by blending them with 53 grade ordinary Portland cement (OPC), ultrafine slag (UFS), river sand, and graphene oxide (GO). These combinations were evaluated to determine which mixture best provided impressive strength attributes to the mortar. GO, in four different quantities, was explored as a blend (0.01%, 0.02%, 0.03%, and 0.04%). The combination with 10% UFS and 0.03% GO-infused CMCs exhibited improved compressive strength compared to all samples after being cured for three, seven, and twenty-eight days. The higher performance of the 10% UFS and 0.03% GO mortar cubes was further endorsed by durability and microstructural tests, such as water absorption, sorptivity, ultrasonic pulse velocity, rapid chloride permeability, electric resistivity, carbonation, FE-SEM/EDX, and XRD. From all the results, it was evident that the mortar containing 10% UFS and 0.03% GO has the best properties for shielding it from deterioration and may be employed as an augmenting structural material in the construction sector.
1. Introduction
Cement use is increasing tremendously worldwide due to the building industry’s fast expansion. The persistence of high-strength cement and concrete and their benefits to the building industry are numerous [1]. The building industry relies heavily on cementitious materials to help augment the reinforcement. Because of the gelling of other granular elements generated during hydration and hydrolysis, after aging, cementitious materials progressively reach their natural strength [2]. Additionally, the sustained aging activity enhances the mechanical characteristics and lessens the infiltration of CO2, water vapor, and potentially dangerous elements such as SO2, NOx, etc. Cement mortar (CM) offers several other qualities to the resulting coherent mass in addition to its tensile and compressive strength, such as flexural bond strength, longevity, structural congruity, etc. These characteristics result from the cement’s components reacting with water as they set and harden. Additionally, the cementitious materials create different gels connected with Ca, Si, etc., resulting in a C-S-H gel that interconnects inactive elements such as sand, pebbles, etc. However, as the cement concrete deteriorates with increased moisture levels, the adhesive bond that holds the stones to the cement mortar breaks [3,4].
Recent developments in concrete technologies that use nanomaterials as reinforcement show encouraging results for future buildings [5,6]. Researchers have tried to incorporate various modifiers to improve the performance of cement-based materials in order to overcome their flaws, which include high brittleness, ease of cracking, and poor permeability. One of the illustrative modifiers is graphene. Nanomaterials have recently been used in concrete-technology reinforcement, and the findings encourage usage in future structures. Several researchers have improved the strength of cement blocks and concrete-built structures by using various materials, from bulk to nanoscale. Nanomaterials made of carbon, such as carbon nanotubes (CNTs), graphene, graphene oxide (GO), nano-silica (nano-SiO2), nano-alumina (nano-Al2O3), nano-ferric oxide (nano-Fe2O3), and nano-titanium oxide (nano-TiO2), have garnered a lot of research interest. CNTs are a good alternative to cement fillers since they have excellent mechanical properties and can effectively replace conventional fillers [7,8,9,10,11].
Additionally, the superior aspect ratio of CNTs is reported to limit crack formation by absorbing energy [12]. Graphene is a single-atom-dense 2D substance with hexagonal sp2 hybridized carbon atoms, similar to CNTs [13]. Because of its extraordinary surface-to-volume ratio, high young’s modulus, and elevated tensile strength, graphene is a better option for improving the characteristics of cementitious composites. Graphene works better due to its planar structure and fulfills its role as an automatic filler compared to CNTs, encouraging more physical attachment to the matrix. Since graphene’s discovery, scientists have spent much time researching how cementitious composites behave when reinforced with it. According to Li et al. [14], C-S-H gel and additional hydration crystals in the aggregate are coupled with graphene during curing, resulting in a 3D structure. The motor cube’s fissures must be connected using 3D structures.
Additionally, it is claimed that the connection between the graphene and the hydrates strengthens with age, causing more remarkable mechanical behavior. e Silva et al. [15] noted an enhancement in the cement mortar’s compressive and tensile strengths when assessing the impact of graphene reinforcement in cement composites. Although graphene displays potential for refining cement mortar performance, its poor distribution in the cement composite is a significant drawback. Higher van der Waals forces trigger the aggregation of graphene, reducing its adherence to the matrix and ultimately causing failure [16,17].
In any instance, the inclusion of surfactant can alter the physical properties of the resulting dried cement mortar. By ultrasonically dispersing 1% graphene in 15% surfactant, to prevent aggregation, Du et al. [16] created a durable graphene heterogeneous mixture which decreased porosity by 37% and increased pore diameter by 30% when used as a reinforcement with cement paste. Researchers have been using GO as a reinforcement to bypass the addition of surfactants because it diffuses rapidly in water [18]. Numerous papers have extensively discussed and supported GO as a filler in cement composites. Lv et al. [19] asserted that the presence of GO promotes the growth of rod-like crystals, and oxygen groups significantly influence cement hydration and eventually lead to better mechanical strength [15].
According to Chuah et al. [17], oxidation was claimed to impact graphene’s mechanical performance, which is why GO has a lower elastic modulus and tensile strength than graphene [19]. On the other hand, Alccofine 1203 (ultrafine slag (UFS)), a recently discovered noncrystalline polymorph/amorphous SiO2 filler, comprises an incredibly fine and accurate granulated particle size. According to recent research, UFS considerably enhances the strength and durability properties, more so than other available materials [20]. In addition, UFS significantly enhances the overall performance of concrete [21].
In this case, to investigate the mechanical, durability, and microstructural impacts, we added GO to UFS-modified cement mortar specimens (CMCs) in various concentrations, such as 0.01, 0.02, 0.03, and 0.04 (%wt.) weight of the binder.
2. Materials and Methods
2.1. Materials
Ad nano Technology Ltd. provided the GO, which was processed using the modified Hummer’s process [22]. The additional ingredients employed in this investigation were the UFS (Alccofine 1203), 53 grade OPC (OPC 53), river sand, and Auramix 500 polycarboxylate-based Superplasticizer. The specific gravity of the UFS was 2.86. OPC (53 grade), with a fineness of 3.3%, a specific gravity of 3.15, and a standard consistency of 32% that has been processed through a 90 µ sieve, was used. Before usage, river sand was washed in water to eliminate residual content after passing through a 2.36 mm screen. As a result, a specific gravity of 2.45 and a water absorption of 3.73% were found in the river sand. Figure 1 depicts the particle size distribution of UFS, OPC 53, and river sand.
2.2. CM-UFS-GO Mix Composition
Detailed experimental work, with the total number of specimens cast, curing days, and size of the specimen, is given in Table 1. All the specimens were cast and cured in portable water, as displayed in Figure 2a,b, with distinct combinations with definite quantities of CM and UFS and varying dosages of GO. That is, the UFS was 10% by weight of the total combination, and the GO was 0.01%, 0.02%, 0.03%, and 0.04% by weight of the binder, as shown in Table 2. The optimum proportion of cement replacement by UFS (10%) was selected from compressive strength values of different cement replacements (5%, 10%, 15%, and 20%). The combinations were labeled as: CM1 for CM + UFS 10%, CM2 for CM + UFS 10% + 0.01%GO, CM3 for CM + UFS 10% + 0.02%GO, CM4 for CM + UFS 10% + 0.03%GO, and CM5 for CM + UFS 10% + 0.04%GO. The water-to-cement ratio was 0.485, and the cement-to-sand ratio was 2.75, per ASTM C109 [23]. In addition, 1% superplasticizers were used (by weight of the binder) [24].
2.3. Compression Strength
After hydrating for 3, 7, and 28 days, the average compressive strength (3 specimens for each mix) for all the 45 CMCs of 5 different mixes were evaluated for their strength enhancement using a compression-testing machine (3000 kN capacity and loading rate of 0.57 kN/s). This test was conducted as per ASTM C109 [23]. The mortar cubes were removed from the curing tank after the curing period. Once within the compression testing machine, the force was steadily increased until the CMCs started to fail [25].
2.4. Field-Emission Scanning Electron Microscope (FE-SEM) and Energy-Dispersive X-ray Spectroscopy (EDX)
Employing a Thermo Fisher (Waltham, MA, USA) FEI QUANTA 250 FEG field-emission scanning electron microscope (FE-SEM) and energy-dispersive X-ray spectroscopy (EDX), the cement bonding properties and morphological aspects with UFS when supplemented with GO at 28 days were examined. FE-SEM, with a superior resolution (1.2 nm), a chemical-element arrangement by EDX, and the microstructure of the CMCs, was evaluated [26].
2.5. X-ray Diffraction Analysis (XRD)
2.6. Water Absorption
The pores in the CMCs affect the capillary action’s ability to absorb water. After 3, 7, and 28 days of hydration, the amount of water absorbed was calculated for the CMCs. The test was carried out per ASTM C 642 [28]. The CMCs were dried in a hot-air oven at 110 °C for 24 h, chilled at room temperature for 6 h, and then weighed as WD. The CMCs were then weighed as WS after being submerged in the curing tank for 48 h to reabsorb water [25]. The proportion of water absorbed by each CMC was computed using the following formula from the weight of the dry and water-cured specimens (Equation (1)).
where WD is the weight of the oven-dried sample (grams) and WS is the weight of the surface dry sample after immersion (grams).
% of Water absorption = [(WS − WD)/WD] × 100
2.7. Sorptivity
A porous substance’s propensity to absorb and transfer water through capillarity is characterized by its sorptivity (S), a material attribute. It was evaluated by casting the CMCs of 100 mm diameter and 50 mm height discs after 28 days of hydration. Concrete sorptivity can be gauged by measuring the capillary rise absorption rate on a uniform material using Equations (2a)–(2c). The I (cumulative water absorption) increased equitably with the square root of time (t). ASTM C1585–20 [29] was used to evaluate.
where S = sorptivity and t = elapsed time in seconds.
I = S√t
S = I/√t
Cumulative water absorption per unit area of the inflow surface can be calculated with the following formula:
where ΔW is the difference in weight of the specimen after the lapsed time (W2 − W1); W1 is the dry weight of the mortar specimen (g); W2 is the weight of mortar specimen after time t (g); A is the surface area of the mortar specimen across which water permeated; and d is the water density [25].
I = ∆W/Ad
2.8. Ultrasonic Pulse Velocity
The quality of CMCs can be evaluated without causing any damage using the ultrasonic pulse velocity (UPV) test after 3, 7, and 28 days [30]. If the mortar cubes are uniformly and homogeneously packed, the ultrasonic pulse waves pass through them quickly, and vice versa. Two probes were utilized to apply the electroacoustic transducer-generated pulse waves during testing. The probes were held on the reverse sides of the CMCs, with one producing an ultrasonic wave while the other detected the signal that passed through the CMCs to the other side. A digital indicator measured the pulse wave travel speed (T) across the CMC’s length of 50 mm.
Equation (3) provides the pulse velocity (V). Using this information, ASTM C597–16 [31] was used to evaluate.
where V is pulse velocity, L is distance, and T is the time taken.
V (Km/s) = L/T
2.9. Rapid Chloride Permeability Test
The rapid chloride permeability test (RCPT) was performed on circular disc samples 100 mm in diameter and 50 mm in height after 28 days of hydration. Over 6 h, a direct current voltage of 60 ± 0.1 V was tested across the faces, and the current flowing across the mortar cube was recorded every 30 min. As per ASTM C1202-22 [32], the total charge passed in Coulombs was determined using Equation (4).
where Qs is a charge passed through the sample; Qab is a charge passed through “a” mm diameter and “b” mm length; a is diameter; and b is sample length.
Qs = Qab × (95/a)2 × b/50
2.10. Carbonation
The carbonation test is used to gauge how tightly CMCs have been packed, and the CMCs were evaluated after 28 days of exposure to the elements. A pH indicator called phenolphthalein was sprayed over two separated portions, where it reacted with the cement’s unreacted lime content to cause a pink color change that can be seen. At the same time, carbonation affects the part that does not change color. A CMC that has been more tightly packed prevents CO2 from entering the inside; carbonation only occurs on the surface’s edge. Less carbonation and compaction prevent corrosive media from penetrating deeper and protect reinforced steel rods from corrosion [30].
2.11. Electric Resistivity
The microstructural characteristics, such as pore size distribution and interconnection design, significantly impact how long the structure will last. Lower permeability is the result of a finer pore network with fewer connections. On the other hand, a porous microstructure with more connections leads to higher permeability and, generally, less durability. The main goal of most electrical-resistivity methods is to measure the conductive qualities of the concrete microstructure. Electrical resistivity can generally be defined as the capacity to tolerate the ion transfer caused by an electrical field. The size and degree of pore interconnectivity can be evaluated using resistivity measurements.
A material’s inherent resistivity property is unaffected by the sample’s shape. The link between resistivity (ρ) and resistance is shown in Equation (5).
where R is the resistance and k is a geometrical component, whose value relies on the sample size, shape, and distance from the testing device’s probes [25,30].
ρ = k·R
3. Results and Discussion
The creation of C-S-H gel (3CaO2SiO24H2O) and CH-(Ca(OH)2) occurs when OPC is hydrated, and the presence of UFS boosts compressive strength [26]. The interaction between GO and cement in a very alkaline solution is caused by oxygen functional groups, such as hydroxyl, carboxyl, and epoxy [33]. The interaction of GO with cement depends on the number of oxygen functional groups on its surface [34]. Portlandite (CH) decomposes in a less alkaline environment, releasing CO2, H2O, and CO to produce the calcium carbonate (CaCO3) polymorph. Amorphous silica gel production is influenced by the amount of GO added to the mixture. Figure 3 shows how well GO and the UFS-CM blend interacts [35].
Figure 4 and Figure 5 show the commercial UFS, 53 grade OPC, and GO used in this investigation, and include the XRD and SEM results. These results are used to draw analytical conclusions about the study materials [22,24,30].
3.1. Compressive Strength of CM-UFS-GO
The average compressive strength (CS) was evaluated for all 45 CMCs prepared under different combos of UFS and GO (Figure 6). The results projected that CM4 displayed higher CS during all the testing times, i.e., at 3, 7, and 28 days. By the 3rd, 7th, and 28th days, the CS for the best combinations of CM4 were 63.60 N/mm2, 70.53 N/mm2, and 89.87 N/mm2, respectively (Table 3). The increased strength could be due to a change in pore structure driven by a better quantum of hydration. The standard deviation (SD) and coefficient of variance (CoV) showed reliability between the CS and the mix. The values of the SD and CoV for CM4 showed significantly less deviation from the average CS, indicating that adding GO in a small fraction (up to 0.03%) was beneficial, and further concentrations of GO were detrimental.
The GO acts as a filler and seals the spaces while providing nucleation sites for developing crystalline products due to hydration [36]. These characteristics work in the CMCs for high compressive strength. It has been established in the literature that GO could slow the spread of cracks in cement blends. Therefore, the strength improvement could be the product of pore structural changes brought on by improved hydration levels and the linking and crack-blocking ability of GO in CMCs to mitigate or prevent cement template flaws [37,38]. A small amount of GO is required to improve the performance of mortar cubes with 10% UFS. Given that the compressive strength impacted contrarywise correlated to the percentage of voids in CMCs, an increase in the quantum of voids inevitably results in a reduction in compressive strength. Hence, the extended concentration of GO from 0.03% to 0.04% resulted in a more significant percentage of aggregated GO, which makes it incapable of supporting the hydration of gels and ineffectively fills the gaps in the CMCs [39,40].
3.2. FE-SEM and EDX of CM-UFS-GO
The distribution of GO at various percentages with 10% UFS in the CMCs is shown in Figure 7b–e. According to SEM (Figure 7a), 10% UFS resulted in significant C-S-H gel creation, a solid, thick matrix encompassing few holes and microcracks, and a minimal Ca/Si ratio, all of which were consistent with the outcomes of Indukuri and Nerella [25,41]. The GO-enforced CMCs included adequate hydration-yielded grains which adhered to their surface compared to the control CMC, i.e., CM1, suggesting that adding GO may slightly hasten hydration. Flower-like polyhedron crystals grew on the material surface of GO-fortified UFS-CM (Figure 7b–e). Oxygen-containing functional groups influenced cement hydration (SO3-, -OH-, and -COOH) and, at GO concentrations of 0.02% and 0.03%, dense growth of flower-like polyhedron crystals was noted [42,43]. Crystallization on CMCs is evidence of effective GO dissipation in the UFS-CM composite, which contributes to increased strength [44].
The EDX spectra of the GO-reinforced UFS-CM are displayed in Figure 8 after 28 days of hydration. The presence of the elements that were present in the samples was measured using EDX analysis. The component atomic weight% by weight, as determined by EDX analysis, is shown in Table 4. Wollastonite/metasilicate (CaSiO3), a naturally occurring mineral formed when silica and water interact to produce C-S-H [45], was present in the CMCs reinforced with GO. The most crucial phase of cement hydration is the creation of the C-S-H gel, which describes the characteristics of transforming weak fibrous crystals into intense coherent networks [46].
The information in Table 4 reveals that SiO2 has the most notable value among all the combinations, next to wollastonite and CaCO3. As the metasilicate content increases, cement composites become more robust and rigid [47]. EDX is used to identify the remnants of the dominant components in the hydrated-cement matrix. Figure 8 shows the peak intensities of the four main hydrated C-S-H compound constituents: carbon (C), oxygen (O), silica (Si), and calcium (Ca). Smaller peaks and domains were seen for the intraband transitions of aluminum (Al), magnesium (Mg), chlorine (Cl), and potassium (K). Due to improved reactivity at the recommended GO dosage (0.03%), Ca peaks formed at higher concentrations in the GO-infused CMCs. The increased surface area and particle suspension caused the GO to agglomerate at higher concentrations. As indicated in Table 3, adding more GO to the combination improves the microstructure and compressive strength up to 0.03%, similar to how adding too much CaCO3 has the opposite effect of lowering it. Agglomeration results when increased specific-surface-area nanoparticles are suspended in the cement matrix at increasing doses [35,38].
3.3. XRD of CM-UFS-GO
Hydrated-material XRD phase analyses revealed compositional details. After 28 days of hydration, the CMCs were tested. The sample XRD peak spectra for the CM-UFS and CM-UFS-GO composites are shown in Figure 9. The calcite formation caused a prominent diffraction peak and, as the GO concentration increased, the peak intensity also increased. Each spectrum had a distinctive peak. The intensity of CM4 was the highest, while the intensity of CM1 in the spectrum was significantly lower. The outcomes support the conclusions made by Prabavathi et al. [30]. The hydrated-cement composite, which contains Ca2+ ions that cross-link with -C-OH-OH-Ca- on the surface of GO, is responsible for the magnitude of C-S-H. The amount of hydration products created varies as GO concentrations increase to 0.03%. Continuous cement hydration and hydration control are represented by the phases CH and C-S-H, which transport calcium. The size and configuration of the crystal phases have a considerable influence on the attributes of hardened cement. When GO is added to hydrated-cement composites to modify the microstructure, high-intensity calcite crystals perform better. Sharp peaks in projected XRD graphs suggest the crystalline phase, while broad peaks in the XRD indicate the amorphous phase. The GO-reinforced sample crystallinity revealed some sharp peaks. Peaks in XRD patterns can be noticed when GO is added. Compared to simply UFS, CM-UFS-GO has shown that GO accelerates the hydration process and helps create a dense and rich crystalline structure in the cement matrix [35,39,41].
3.4. Water Absorption
The CM-UFS inclusion with GO demonstrated outstanding resistance to water infiltration (Figure 10). The resistance to water absorption peaked at a GO addition of 0.03%. However, with a GO content increase of 0.04%, the resistance to water absorption decreased due to GO nanosheet clustering in the cement composite. However, compared to the CM-UFS, all the CM-UFS-GO displayed good resistance to water absorption, as illustrated in Figure 10.
In this study, in CM4, the water absorption was found to be at least 6.41% after 28 days of hydration compared to 7.47% in CM1. CM2 had minimal impact on limiting water absorption, almost equivalent to CM1. CM2 had a notable reduction in water absorption, but CM5 showed low performance in controlling water absorption, unlike CM3, which showed the most promising control of water absorption on all 3rd, 7th, and 28th days (4.57%, 4.74%, and 6.14%, correspondingly). Due to GO’s extensive barrier attributes, CMCs pore-structure refinement was achieved by reducing the critical pore diameter and improving the water absorption [48,49].
3.5. Water Sorptivity
Sorptivity can be termed the water absorption and passage caused by capillary action in CMCs. The capillary rise rate of water absorption can determine the durability property [50,51]. Due to the agglomeration of GO nanosheets in the cement composite, it was discovered that CM4 had the best resistance to water sorptivity. However, all GO-cement-composite mixes displayed stronger resistance to water sorptivity than CM1, as shown in Figure 11. A maximal decrease in the water sorptivity coefficient was accomplished in this study at 0.03% GO addition in the CMCs at all time intervals compared to CM1. CM1, CM2, and CM5 were not good enough to control water sorptivity, although CM2 was promising. The optimal sorptivity was found for the batch with 0.03% GO, i.e., for CM4. Indukuri and Nerella [25] reported that 0.03% GO was the best for their cement composite. In our study, CM4 showed enhanced control of water sorptivity [52,53].
3.6. Ultrasonic Pulse Velocity
After 3, 7, and 28 days of hydration, the CMCs with 10% UFS and a combination of GO levels of 0.01%, 0.02%, 0.03%, and 0.04% were put through an ultrasonic pulse velocity (UPV) test by connecting these CMCs with direct probes. The test was conducted according to the ASTM C597-16 Standard Test Method [31]. After 28 days of hydration, the CM1 had a UPV of 3928 m/s, while the sample with CM4 had the best results at 4191 m/s, although there was little difference in other samples with CM2, CM3, and CM5 (Figure 12). The creation of a dense microstructure caused by GO affected the UPV. This compactness rapidly affected the ultrasound velocity. When the pulse waves are applied to CMCs from the transmitter, they travel to the receiver more quickly. UFS helps to form aggregates with fewer cracks in the cement cubes, and CM4 is the optimum combination value to obtain better CMCs at all three hydration periods (3, 7, and 28 days). At least a minimal quantity of 0.03% GO is required to enhance the contribution of 10% UFS for optimal UPV results. Prabavathy et al. [30] achieved moderate UPV results for their CMC sample with 0.03% GO.
3.7. Rapid Chloride Permeability Test
After 28 days of water curing, all CMCs were evaluated for chloride permeability (Figure 13). The RCPT was performed according to ASTM C1202 [32]. Over six hours, a direct current voltage of 60 ± 0.1 V was applied across the two faces, and the current flowing through the CMCs was recorded every 30 min. The total charge passed in Coulombs was calculated using Equation (4).
When CM4 was compared to CM1, the chloride ion penetration was reduced by 41.42% (Table 5) because the pore diameter of CM4 was reduced, which prevented chloride ions from entering the material. A further increase in GO to 0.04% (CM5) significantly lowered this resistance, as did a corresponding reduction in performance for CM2 and CM3. Soldado et al. [54] achieved similar chloride resistance in their cement composites using fly ash and furnace slag. The standard deviation (SD) and coefficient of variance (CoV) shows reliability between the charge passed and the mix. The values of SD and CoV for CM4 shows significantly less deviation from the average charge passed indicating that the aggregation of UFS into the cement pore, CMCs with GO content of 0.03% retarded the chloride penetration.
3.8. Carbonation
When Carbon dioxide (CO2) is present, a physical-chemical phenomenon known as “carbonation” occurs in CMC specimens. Different CO2 concentrations between the inside of the specimen and the outside environment allow CO2 to diffuse via the specimen’s capillary pores. The pH is lowered by the formation of carbonic acid (confirmed by phenolphthalein solution, Figure 14), which interacts with calcium hydroxide to form calcium carbonate (CaCO3). The strength and permeability of the CMCs are affected by the CaCO3 deposition [50]. All the samples were tested after curing for 28 days. Due to GO+UFS’s occupation of the open pores of the CMCs and subsequent delay of CO2 diffusion, the carbonation rate was reduced. Analyzing the data shows that cement levels play a part in and impact the resistance to carbonation, such as capillary absorption. Despite the high degree of compactness of the CMCs, the carbonation often rose when cement was partially replaced with UFS (10%). Although the incorporation of UFS has worsened the results, the combination of UFS with 0.03% GO proved to be highly effective in reducing carbonation (0 mm).
In comparison, for CM2, CM3, and CM5, carbonation depths of 3 mm, 2 mm, and 1 mm were observed, respectively; for CM1, the carbonation depth was 4 mm, proving that GO has a role. GO aids in minimizing or completely curtailing carbonation depth. The CM4 was optimal for ultimately preventing any carbonization in the CMCs. Similar results were reported by Soldado et al. [54].
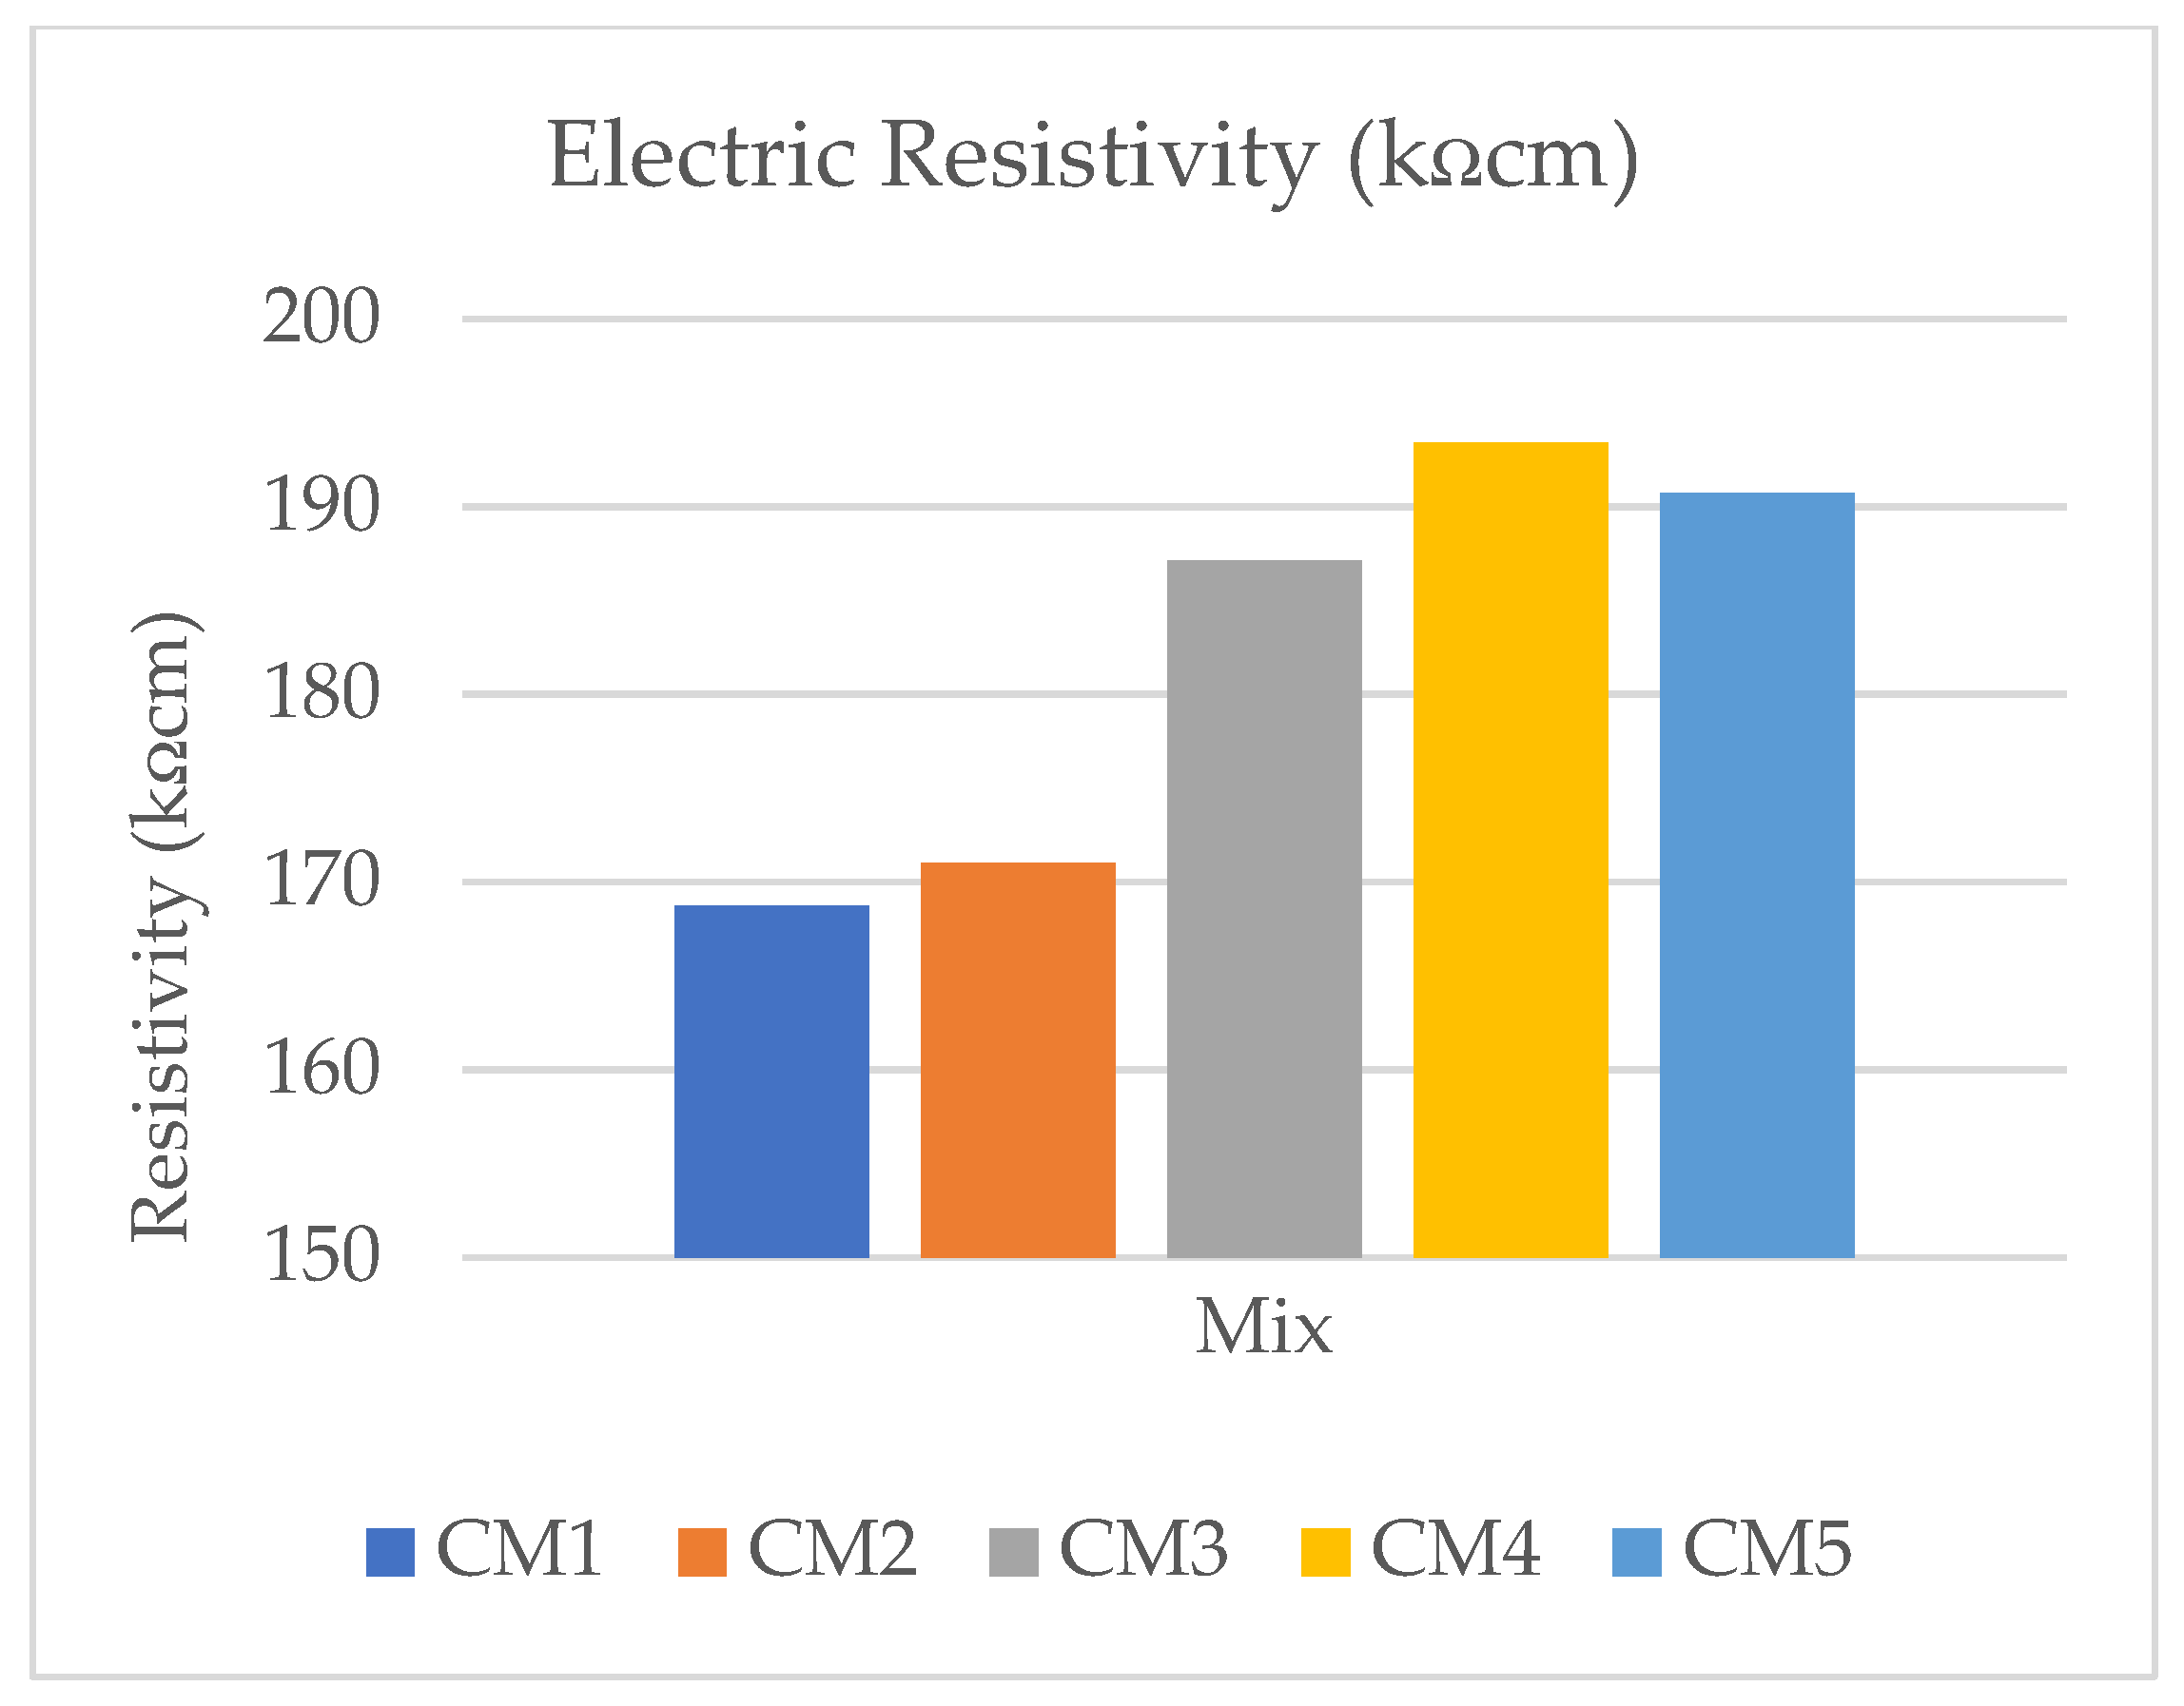
3.9. Electric Resistivity
Concrete’s physical and chemical properties, as well as fluid permeability, are related to electrical resistivity. The degree of electrical resistivity implicitly predicts chloride ion diffusion, resulting in concrete resistance to chloride ion penetration. Figure 15 projects the electrical resistivity (ρ), in kΩ-cm, of CMCs of different combinations. The results show that the CMCs with 10% UFS compared to samples with incorporated GO project a remarkable deviation of electrical resistivity, with the best resistance found for CM4. Furthermore, the combination with additions of UFS and GO proved to promote significant increases in ρ. Soldado et al. [54] published similar encouraging results, wherein additives such as fly ash improved the electric resistance of cement composites.
4. Conclusions
The current study assessed how adding 10% UFS and four different GO concentrations (ranging from 0.01% to 0.04%) altered the behavioral characteristics of CMC samples. The presence of tiny hydration product particles adhering to the surface of the GO-enforced CMCs suggests that adding GO may slightly speed up hydration. GO concentrations of 0.02%, and 0.03% caused the dense growth of polyhedron crystals that resembled flowers. Crystal growth on CMCs is evidence of effective GO dissipation in the UFS-CM composite, which contributes to increased strength. By exhibiting a few various chemical combinations in comparison to CM-UFS, CM4 had the maximum intensity. GO quickens the hydration process and aids in forming a dense and richly crystalline cement matrix, which produces a high-strength cement matrix. The addition of GO up to 0.03% proved advantageous in contrast to the CMCs with just 10% UFS. The CMCs with GO demonstrated good compressive strength, and significant results in tests of water absorption, sorptivity, UPV, carbonation, rapid chloride permeability, and electric resistivity. Due to the nanoplatelets activating micropore congestion in the CMC samples, amplified by UFS, hydrated crystals can form. This enhanced property of the CM4 is responsible for this. The behavioral characteristics of CMC samples changed due to the addition of graphene oxide, which increased compactness. The studies’ encouraging results support the optimal choice for building structures as 0.03% GO with 10% UFS in cement.
Author Contributions
The study’s inception and design involved input from all authors; J.P. oversaw the material preparation, and reviewed and edited the first draft of the manuscript; Y.S.T. collected the data, carried out the analysis and prepared the first draft of the manuscript. All authors then read and approved the final document. All authors have read and agreed to the published version of the manuscript.
Funding
The authors declare that no grant was received for conducting this study.
Institutional Review Board Statement
All procedures followed were in accordance with ethical standards.
Informed Consent Statement
Not applicable.
Data Availability Statement
The authors confirm that the data supporting the outcomes of this research are accessible within the article.
Acknowledgments
The authors thank VIT, Vellore, for providing the research facilities for carrying out this work.
Conflicts of Interest
The authors have no relevant financial or nonfinancial interests to disclose.
References
- Bhushan Jindal, B.; Jangra, P.; Garg, A. Effects of Ultra Fine Slag as Mineral Admixture on the Compressive Strength, Water Absorption and Permeability of Rice Husk Ash Based Geopolymer Concrete. Mater. Today Proc. 2020, 32, 871–877. [Google Scholar] [CrossRef]
- Pan, Z.; He, L.; Qiu, L.; Korayem, A.H.; Li, G.; Zhu, J.W.; Collins, F.; Li, D.; Duan, W.H.; Wang, M.C. Mechanical Properties and Microstructure of a Graphene Oxide–Cement Composite. Cem. Concr. Compos. 2015, 58, 140–147. [Google Scholar] [CrossRef]
- Silvestro, L.; Jean Paul Gleize, P. Effect of Carbon Nanotubes on Compressive, Flexural and Tensile Strengths of Portland Cement-Based Materials: A Systematic Literature Review. Constr. Build. Mater. 2020, 264, 120237. [Google Scholar] [CrossRef]
- Phoo-ngernkham, T.; Chindaprasirt, P.; Sata, V.; Hanjitsuwan, S.; Hatanaka, S. The Effect of Adding Nano-SiO2 and Nano-Al2O3 on Properties of High Calcium Fly Ash Geopolymer Cured at Ambient Temperature. Mater. Des. 2014, 55, 58–65. [Google Scholar] [CrossRef]
- Saleem, H.; Haneef, M.; Abbasi, H.Y. Synthesis Route of Reduced Graphene Oxide via Thermal Reduction of Chemically Exfoliated Graphene Oxide. Mater. Chem. Phys. 2018, 204, 1–7. [Google Scholar] [CrossRef]
- Ariffin, N.F.; Hussin, M.W.; Mohd Sam, A.R.; Bhutta, M.A.R.; Nur, N.H.; Mirza, J. Strength Properties and Molecular Composition of Epoxy-Modified Mortars. Constr. Build. Mater. 2015, 94, 315–322. [Google Scholar] [CrossRef] [Green Version]
- An, J.; Nam, B.H.; Alharbi, Y.; Cho, B.H.; Khawaji, M. Edge-Oxidized Graphene Oxide (EOGO) in Cement Composites: Cement Hydration and Microstructure. Compos. Part B Eng. 2019, 173, 106795. [Google Scholar] [CrossRef]
- Xiao, H.; Zhang, F.; Liu, R.; Zhang, R.; Liu, Z.; Liu, H. Effects of Pozzolanic and Non-Pozzolanic Nanomaterials on Cement-Based Materials. Constr. Build. Mater. 2019, 213, 1–9. [Google Scholar] [CrossRef]
- He, R.; Huang, X.; Zhang, J.; Geng, Y.; Guo, H. Preparation and Evaluation of Exhaust-Purifying Cement Concrete Employing Titanium Dioxide. Materials 2019, 12, 2182. [Google Scholar] [CrossRef] [Green Version]
- Sun, J.; She, X.; Tan, G.; Tanner, J.E. Modification effects of nano-SiO2 on early compressive strength and hydration characteristics of high-volume fly ash concrete. J. Mater. Civ. Eng. 2019, 31, 04019057. [Google Scholar] [CrossRef]
- da Rocha Segundo, I.G.; Dias, E.A.L.; Fernandes, F.D.P.; de Freitas, E.F.; Costa, M.F.; Carneiro, J.O. Photocatalytic Asphalt Pavement: The Physicochemical and Rheological Impact of TiO2 Nano/Microparticles and ZnO Microparticles onto the Bitumen. Road Mater. Pavement Des. 2019, 20, 1452–1467. [Google Scholar] [CrossRef] [Green Version]
- Ramezani, M.; Dehghani, A.; Sherif, M.M. Carbon Nanotube Reinforced Cementitious Composites: A Comprehensive Review. Constr. Build. Mater. 2022, 315, 125100. [Google Scholar] [CrossRef]
- Chahal, N.; Siddique, R.; Rajor, A. Influence of Bacteria on the Compressive Strength, Water Absorption and Rapid Chloride Permeability of Fly Ash Concrete. Constr. Build. Mater. 2012, 28, 351–356. [Google Scholar] [CrossRef]
- Li, X.; Liu, Y.M.; Li, W.G.; Li, C.Y.; Sanjayan, J.G.; Duan, W.H.; Li, Z. Effects of Graphene Oxide Agglomerates on Workability, Hydration, Microstructure and Compressive Strength of Cement Paste. Constr. Build. Mater. 2017, 145, 402–410. [Google Scholar] [CrossRef]
- e Silva, R.A.; de Castro Guetti, P.; da Luz, M.S.; Rouxinol, F.; Gelamo, R.V. Enhanced Properties of Cement Mortars with Multilayer Graphene Nanoparticles. Constr. Build. Mater. 2017, 149, 378–385. [Google Scholar] [CrossRef]
- Du, H.; Pang, S.D. Dispersion and Stability of Graphene Nanoplatelet in Water and Its Influence on Cement Composites. Constr. Build. Mater. 2018, 167, 403–413. [Google Scholar] [CrossRef]
- Chuah, S.; Pan, Z.; Sanjayan, J.G.; Wang, C.M.; Duan, W.H. Nano Reinforced Cement and Concrete Composites and New Perspective from Graphene Oxide. Constr. Build. Mater. 2014, 73, 113–124. [Google Scholar] [CrossRef]
- Wei, Y.; Miao, Z.; Jia, Z.; Wang, Y.; Zhou, Y.; Zhang, H.; Wei, J. Synergy of Reduced Graphene Oxide and Metal Oxides Improves the Power Factor of Thermoelectric Cement Matrix Composites. Fuller. Nanotub. Carbon Nanostruct. 2022, 30, 801–813. [Google Scholar] [CrossRef]
- Lv, S.; Liu, J.; Sun, T.; Ma, Y.; Zhou, Q. Effect of GO Nanosheets on Shapes of Cement Hydration Crystals and Their Formation Process. Constr. Build. Mater. 2014, 64, 231–239. [Google Scholar] [CrossRef]
- Saloni; Parveen; Lim, Y.Y.; Pham, T.M. Effective Utilisation of Ultrafine Slag to Improve Mechanical and Durability Properties of Recycled Aggregates Geopolymer Concrete. Clean. Eng. Technol. 2021, 5, 100330. [Google Scholar] [CrossRef]
- Horszczaruk, E.; Mijowska, E.; Kalenczuk, R.J.; Aleksandrzak, M.; Mijowska, S. Nanocomposite of Cement/Graphene Oxide—Impact on Hydration Kinetics and Young’s Modulus. Constr. Build. Mater. 2015, 78, 234–242. [Google Scholar] [CrossRef]
- Zaaba, N.I.; Foo, K.L.; Hashim, U.; Tan, S.J.; Liu, W.-W.; Voon, C.H. Synthesis of Graphene Oxide Using Modified Hummers Method: Solvent Influence. Procedia Eng. 2017, 184, 469–477. [Google Scholar] [CrossRef]
- ASTM C109/109M-16a; Standard Test Method for Compressive Strength of Hydraulic Cement Mortars (Using 2-in. or Cube Specimens). Annual Book of ASTM Standards: West Conshohocken, PA, USA, 2016; Volume 4, pp. 1–10.
- Kavyateja, B.V.; Guru Jawahar, J.; Sashidhar, C. Effectiveness of Alccofine and Fly Ash on Mechanical Properties of Ternary Blended Self Compacting Concrete. Mater. Today Proc. 2020, 33, 73–79. [Google Scholar] [CrossRef]
- Indukuri, C.S.R.; Nerella, R. Enhanced Transport Properties of Graphene Oxide Based Cement Composite Material. J. Build. Eng. 2021, 37, 102174. [Google Scholar] [CrossRef]
- Jumate, E.; Manea, D.L. Application of X-ray Diffraction (XRD) and Scanning Electron Microscopy (SEM) Methods to the Portland Cement Hydration Processes. J. Appl. Eng. Sci. 2012, 2, 35–42. [Google Scholar]
- Chintalapudi, K.; Mohan, R.; Pannem, R. Enhanced Microstructural Characteristics of Binary and Ternary Blended Cements Reinforced with Graphene Oxide. Fuller. Nanotub. Carbon Nanostruct. 2022, 30, 987–1001. [Google Scholar] [CrossRef]
- ASTMC642-21 C 642-21; Standard Test Method for Density, Absorption, and Voids in Hardened Concrete. ASTM International Standard: West Conshohocken, PA, USA, 2021; pp. 11–13. [CrossRef]
- ASTM C1585-13; Standard Test Method for Measurement of Rate of Absorption of Water by Hydraulic Cement Concretes. ASTM International Standard: West Conshohocken, PA, USA, 2013; Volume 41, pp. 1–6. [CrossRef]
- Prabavathy, S.; Jeyasubramanian, K.; Prasanth, S.; Hikku, G.S.; Robert, R.B.J. Enhancement in Behavioral Properties of Cement Mortar Cubes Admixed with Reduced Graphene Oxide. J. Build. Eng. 2020, 28, 101082. [Google Scholar] [CrossRef]
- ASTM C 597-02; Pulse Velocity Through Concrete. American Society for Testing and Materials: West Conshohocken, PA, USA, 2016; Volume 4, pp. 3–6. [CrossRef]
- ASTM C1202; Standard Test Method for Electrical Indication of Concrete’s Ability to Resist Chloride Ion Penetration. The American Society for Testing and Materials: West Conshohocken, PA, USA, 2012; pp. 1–8. [CrossRef]
- Chintalapudi, K.; Pannem, R.M.R. The Effects of Graphene Oxide Addition on Hydration Process, Crystal Shapes, and Microstructural Transformation of Ordinary Portland Cement. J. Build. Eng. 2020, 32, 101551. [Google Scholar] [CrossRef]
- Malikov, E.Y. The Effect of Polyvinyl Alcohol Functionalized Multiwall Carbon Nanotubes on the Improvement of the Compressive Strength of Concrete. Fuller. Nanotub. Carbon Nanostruct. 2020, 28, 781–785. [Google Scholar] [CrossRef]
- Yeswanth Sai, T.; Jagadeesh, P. Effect of Graphene Oxide on the Microstructure and Hydration Characteristics of Ultrafine Slag Cement Composites. Fuller. Nanotub. Carbon Nanostruct. 2022, 30, 1054–1065. [Google Scholar] [CrossRef]
- Wang, H.-Y.; Tsai, S.-L.; Hung, C.-C.; Jian, T.-Y. Research on Engineering Properties of Cement Mortar Adding Stainless Steel Reduction Slag and Pozzolanic Materials. Case Stud. Constr. Mater. 2022, 16, e01144. [Google Scholar] [CrossRef]
- Ghazanlou, S.I.; Ghazanlou, S.I.; Ashraf, W. Improvement in the Physical and Mechanical Properties of the Cement-Based Composite with the Addition of Nanostructured BN–Fe3O4 Reinforcement. Sci. Rep. 2021, 11, 19358. [Google Scholar] [CrossRef] [PubMed]
- Kai, M.F.; Zhang, L.W.; Liew, K.M. Graphene and Graphene Oxide in Calcium Silicate Hydrates: Chemical Reactions, Mechanical Behavior and Interfacial Sliding. Carbon 2019, 146, 181–193. [Google Scholar] [CrossRef]
- Singh, M.; Siddique, R. Effect of Low-Calcium Coal Bottom Ash as Fine Aggregate on Microstructure and Properties of Concrete. ACI Mater. J. 2015, 112, 693–703. [Google Scholar] [CrossRef]
- Ramezanianpour, A.A.; Motahari Karein, S.M.; Vosoughi, P.; Pilvar, A.; Isapour, S.; Moodi, F. Effects of Calcined Perlite Powder as a SCM on the Strength and Permeability of Concrete. Constr. Build. Mater. 2014, 66, 222–228. [Google Scholar] [CrossRef]
- Basquiroto de Souza, F.; Yao, X.; Lin, J.; Naseem, Z.; Tang, Z.Q.; Hu, Y.; Gao, W.; Sagoe-Crentsil, K.; Duan, W. Effective Strategies to Realize High-Performance Graphene-Reinforced Cement Composites. Constr. Build. Mater. 2022, 324, 126636. [Google Scholar] [CrossRef]
- Zhai, S.; Pang, B.; Liu, G.; Zhang, Y.; Xu, K.; She, W.; Zhang, Y. Investigation on Preparation and Multifunctionality of Reduced Graphene Oxide Cement Mortar. Constr. Build. Mater. 2021, 275, 122119. [Google Scholar] [CrossRef]
- Nguyen, H.D.; Zhang, Q.; Sagoe-Crentsil, K.; Duan, W. Graphene Oxide-Coated Sand for Improving Performance of Cement Composites. Cem. Concr. Compos. 2021, 124, 104279. [Google Scholar] [CrossRef]
- Wang, Q.; Li, S.; Pan, S.; Cui, X.; Corr, D.J.; Shah, S.P. Effect of Graphene Oxide on the Hydration and Microstructure of Fly Ash-Cement System. Constr. Build. Mater. 2019, 198, 106–119. [Google Scholar] [CrossRef]
- He, W.; Liao, G. Effects of Nano-C-S-H Seed Crystal on Early-Age Hydration Process of Portland Cement. Fuller. Nanotub. Carbon Nanostruct. 2021, 30, 365–372. [Google Scholar] [CrossRef]
- Jing, G.; Wu, J.; Lei, T.; Wang, S.; Strokova, V.; Nelyubova, V.; Wang, M.; Ye, Z. From Graphene Oxide to Reduced Graphene Oxide: Enhanced Hydration and Compressive Strength of Cement Composites. Constr. Build. Mater. 2020, 248, 118699. [Google Scholar] [CrossRef]
- Pei, C.; Ueda, T.; Zhu, J. Investigation of the Effectiveness of Graphene/Polyvinyl Alcohol on the Mechanical and Electrical Properties of Cement Composites. Mater. Struct. 2020, 53, 66. [Google Scholar] [CrossRef]
- Zhang, S.-L.; Qi, X.-Q.; Guo, S.-Y.; Ren, J.; Chen, J.-Z.; Chi, B.; Wang, X.-C. Effect of a Novel Hybrid TiO2-Graphene Composite on Enhancing Mechanical and Durability Characteristics of Alkali-Activated Slag Mortar. Constr. Build. Mater. 2021, 275, 122154. [Google Scholar] [CrossRef]
- Lu, Z.; Hou, D.; Hanif, A.; Hao, W.; Li, Z.; Sun, G. Comparative Evaluation on the Dispersion and Stability of Graphene Oxide in Water and Cement Pore Solution by Incorporating Silica Fume. Cem. Concr. Compos. 2018, 94, 33–42. [Google Scholar] [CrossRef]
- Habert, G.; Miller, S.A.; John, V.M.; Provis, J.L.; Favier, A.; Horvath, A.; Scrivener, K.L. Environmental Impacts and Decarbonization Strategies in the Cement and Concrete Industries. Nat. Rev. Earth Environ. 2020, 1, 559–573. [Google Scholar] [CrossRef]
- Mowlaei, R.; Lin, J.; Basquiroto de Souza, F.; Fouladi, A.; Habibnejad Korayem, A.; Shamsaei, E.; Duan, W. The Effects of Graphene Oxide-Silica Nanohybrids on the Workability, Hydration, and Mechanical Properties of Portland Cement Paste. Constr. Build. Mater. 2021, 266, 121016. [Google Scholar] [CrossRef]
- Hu, M.; Guo, J.; Fan, J.; Li, P.; Chen, D. Dispersion of Triethanolamine-Functionalized Graphene Oxide (TEA-GO) in Pore Solution and Its Influence on Hydration, Mechanical Behavior of Cement Composite. Constr. Build. Mater. 2019, 216, 128–136. [Google Scholar] [CrossRef]
- Wang, B.; Pang, B. Mechanical Property and Toughening Mechanism of Water Reducing Agents Modified Graphene Nanoplatelets Reinforced Cement Composites. Constr. Build. Mater. 2019, 226, 699–711. [Google Scholar] [CrossRef]
- Soldado, E.; Antunes, A.; Costa, H.; do Carmo, R.; Júlio, E. Durability of Mortar Matrices of Low-Cement Concrete with Specific Additions. Constr. Build. Mater. 2021, 309, 125060. [Google Scholar] [CrossRef]
Figure 1.
Particle Size Distribution.
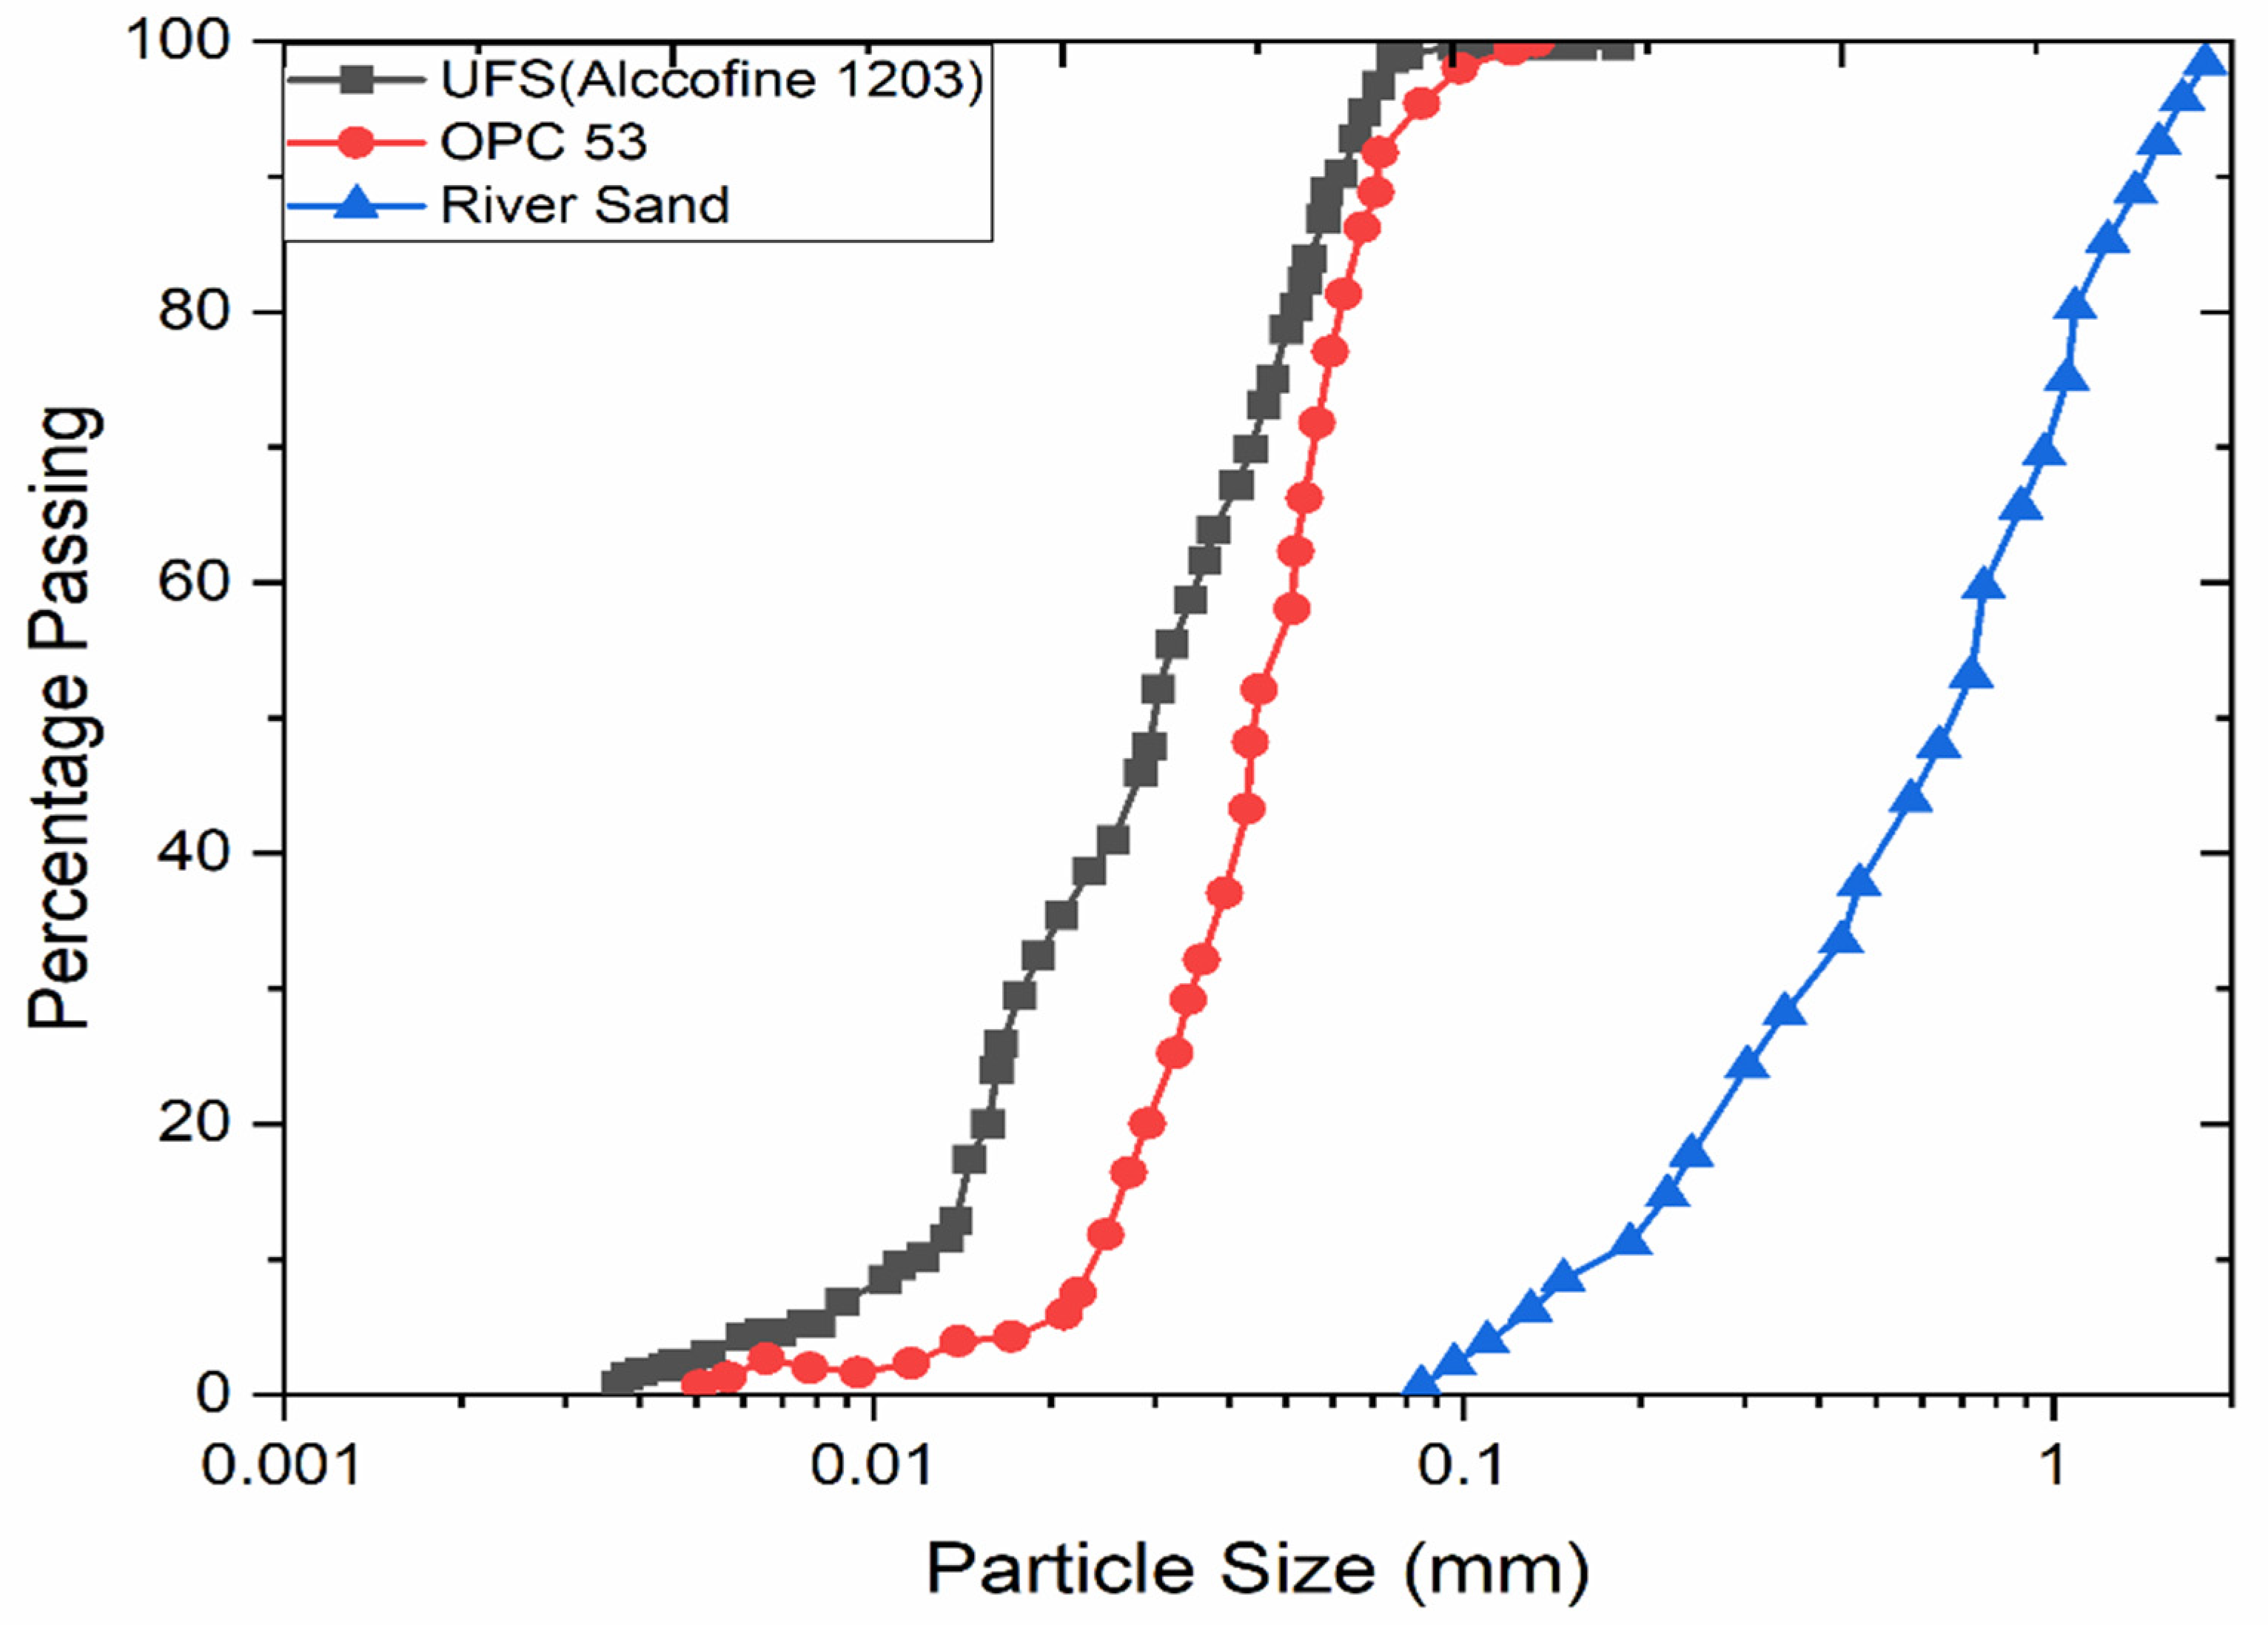
Figure 2.
(a) Mortar cube molds. (b) Mortar cylindrical discs.

Figure 3.
Schematic diagram representing hydration of OPC-UFS-GO-RS.
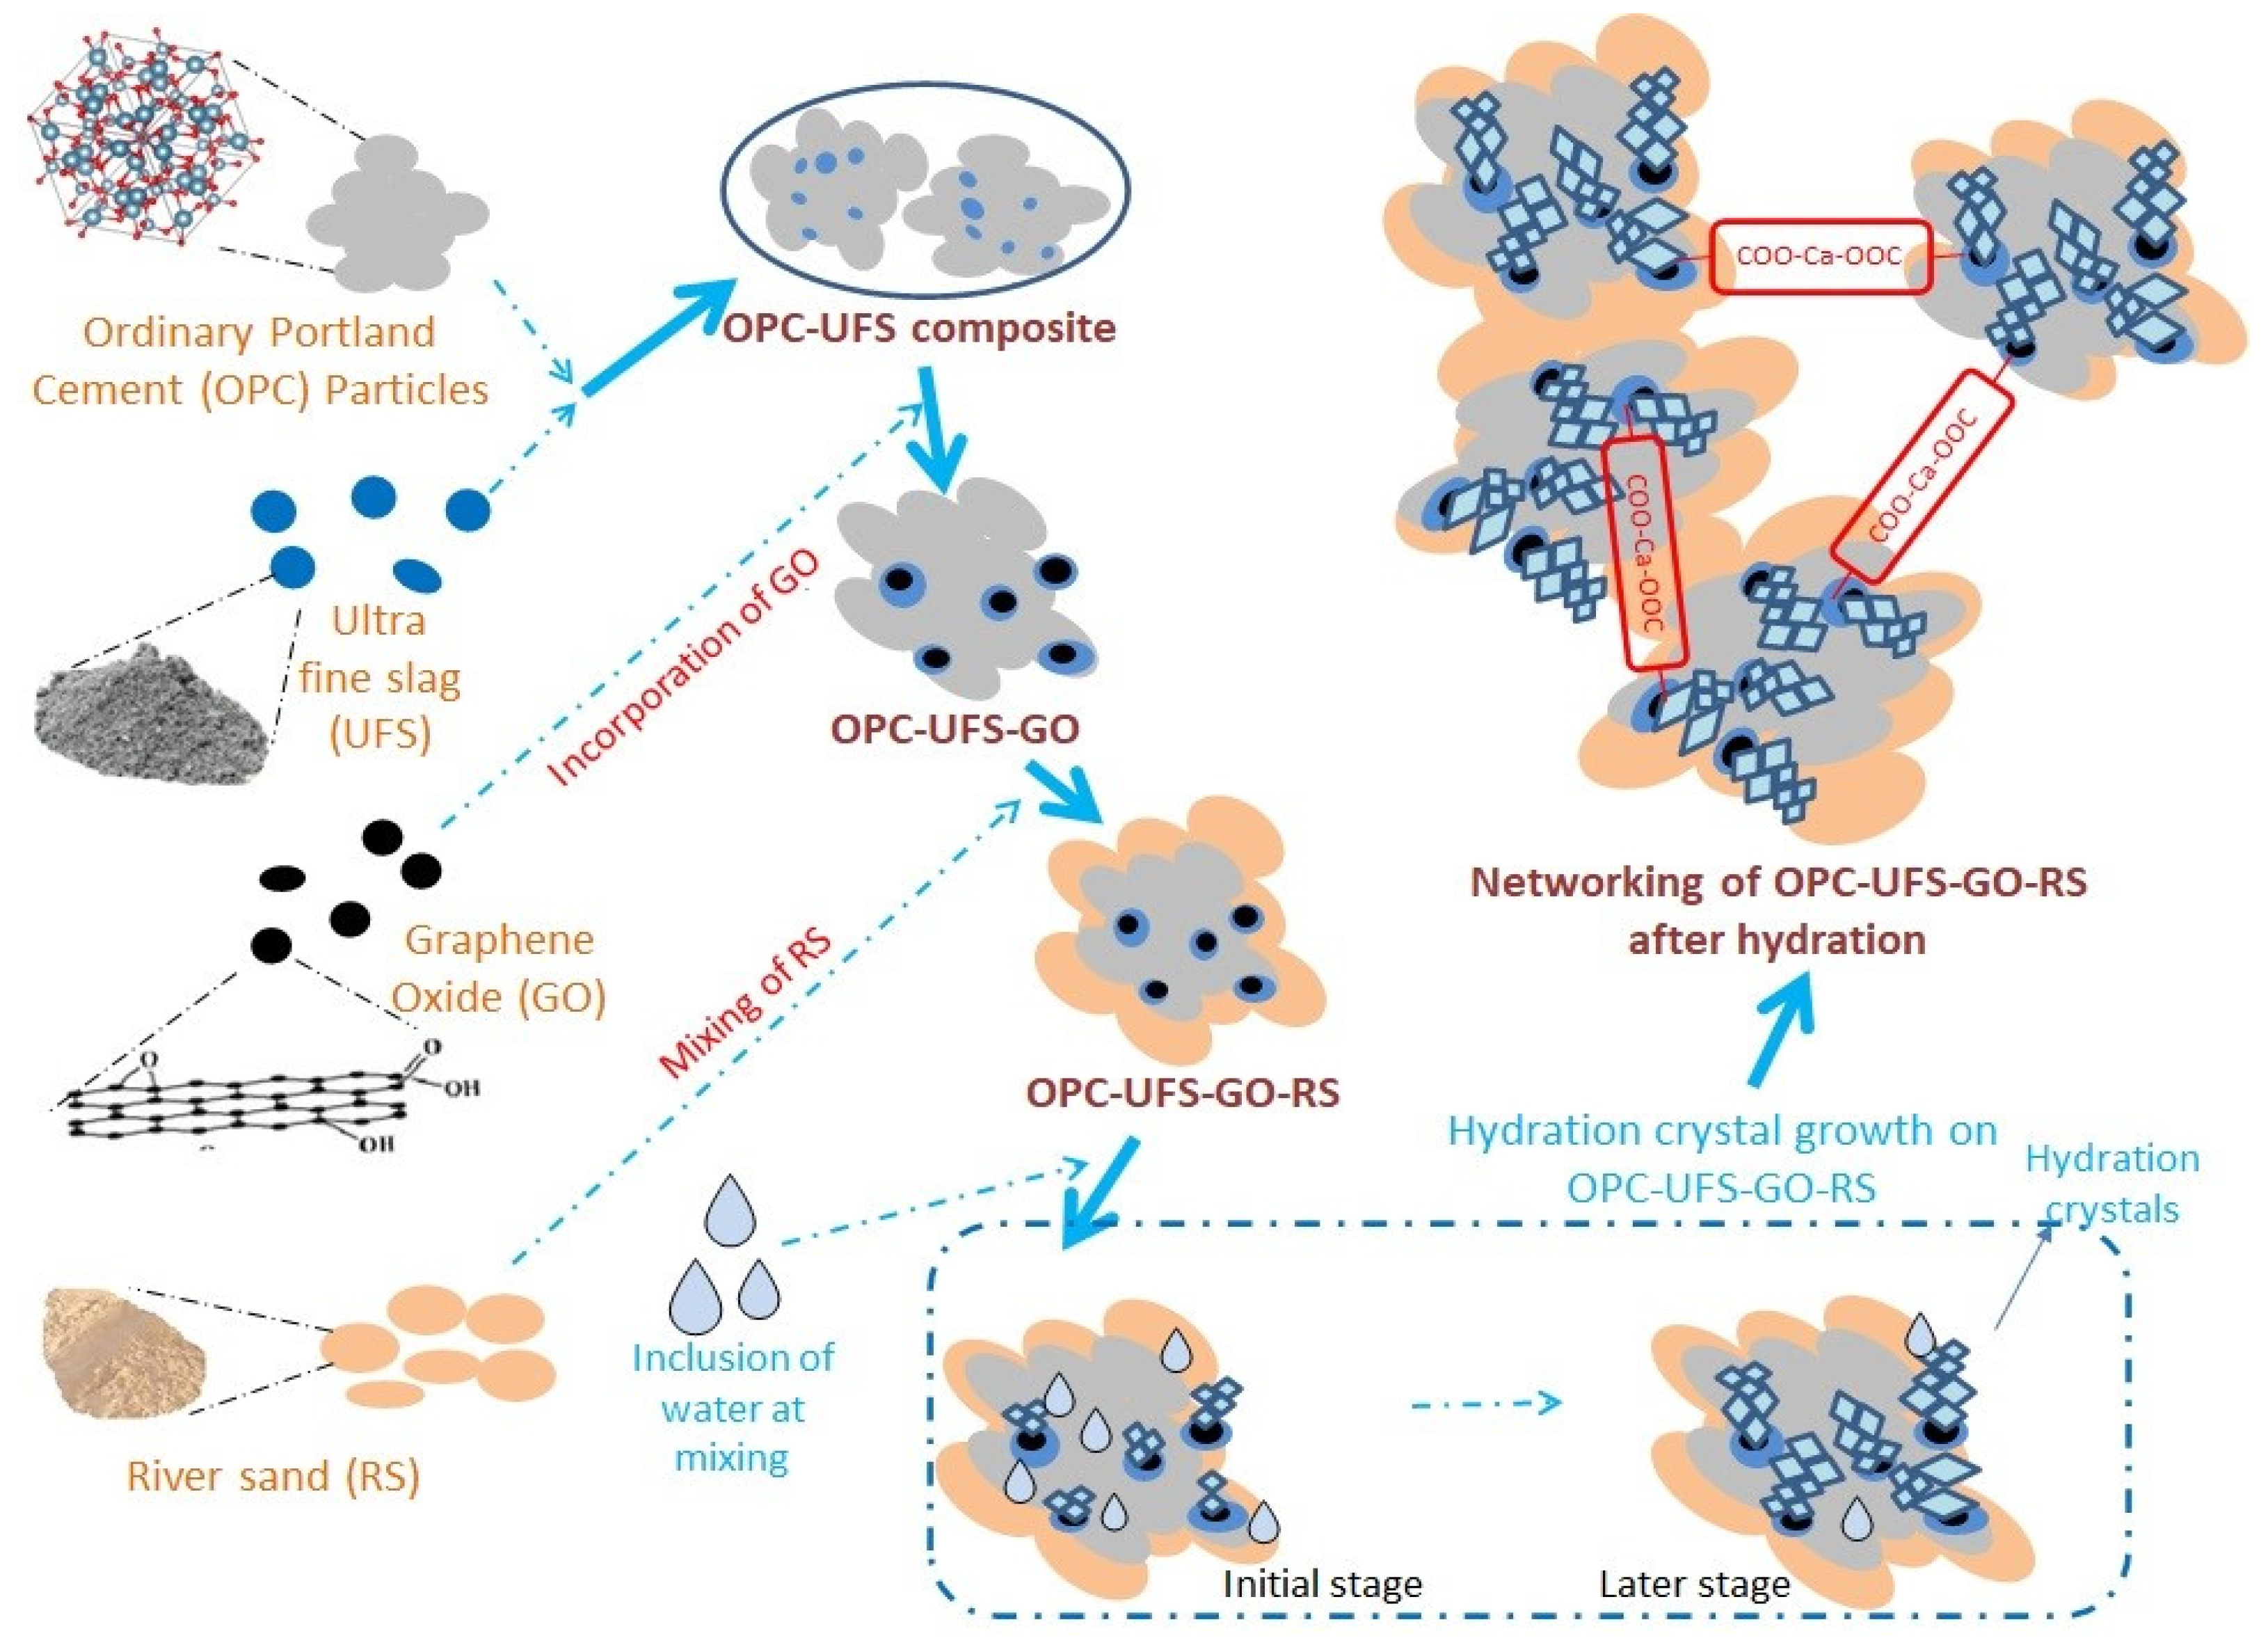
Figure 4.
XRD of 53 grade OPC and UFS (Alccofine 1203).
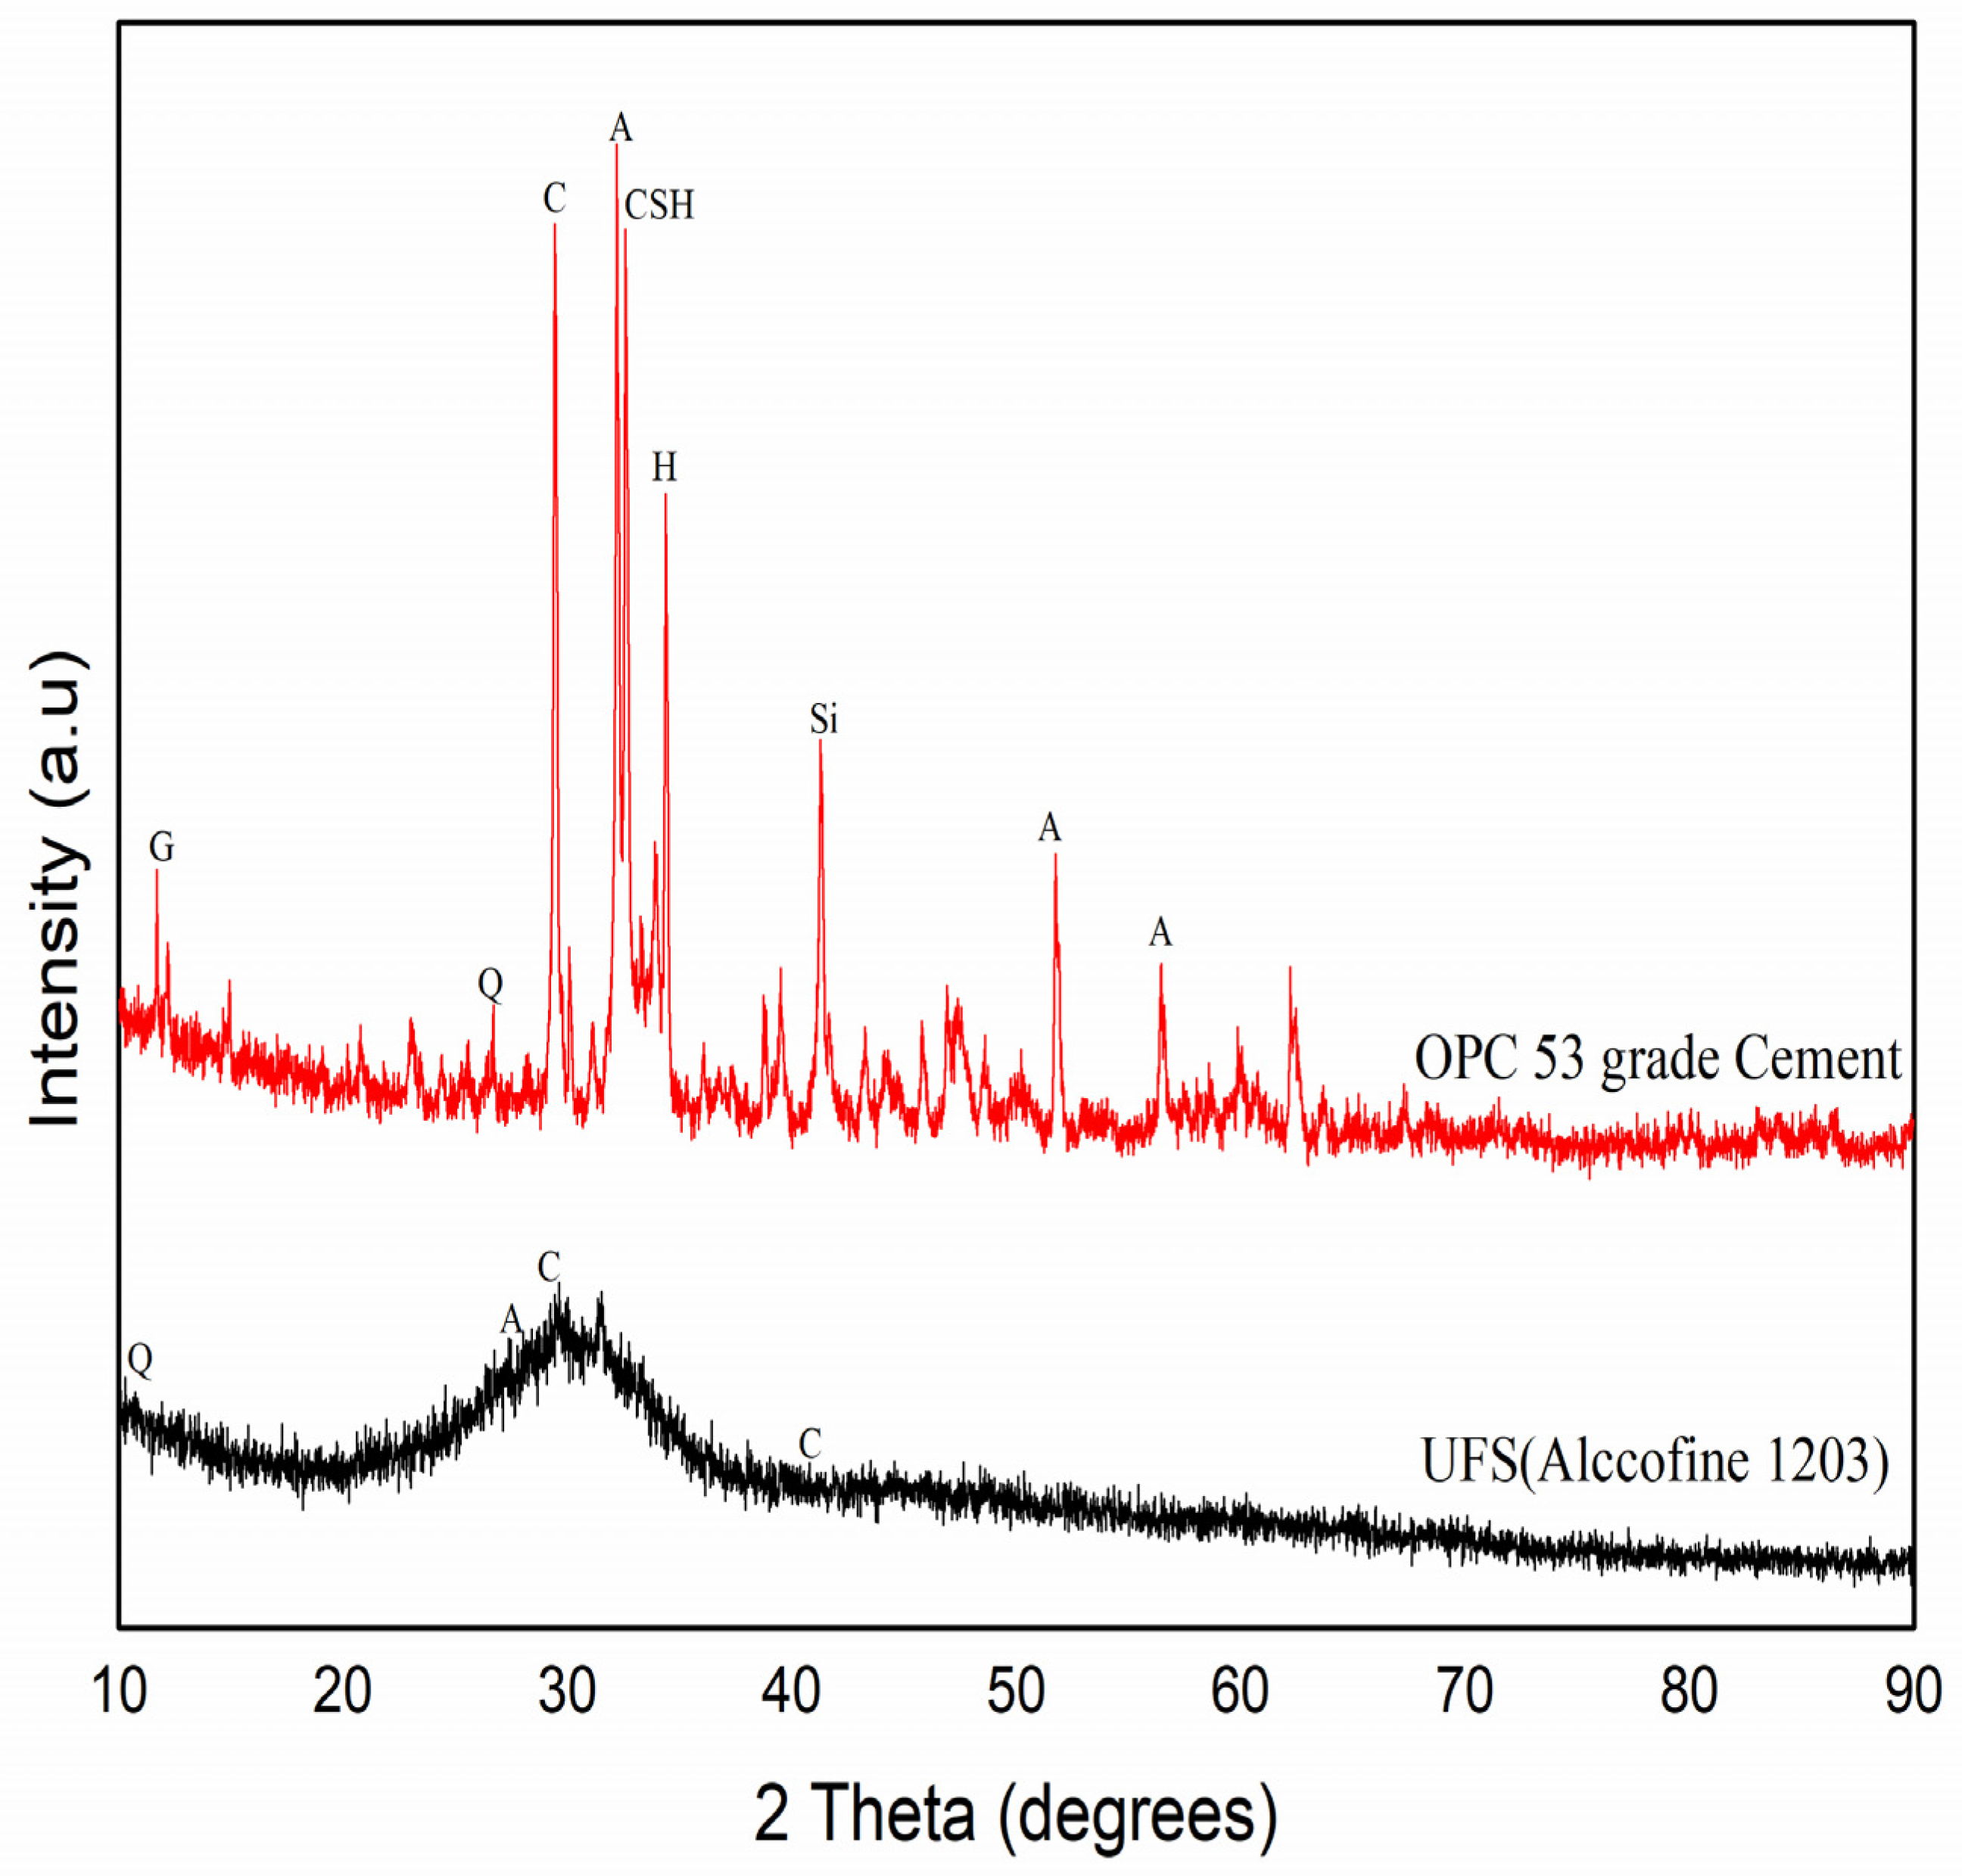
Figure 5.
SEM images of GO, 53 grade OPC, and UFS (Alccofine 1203).
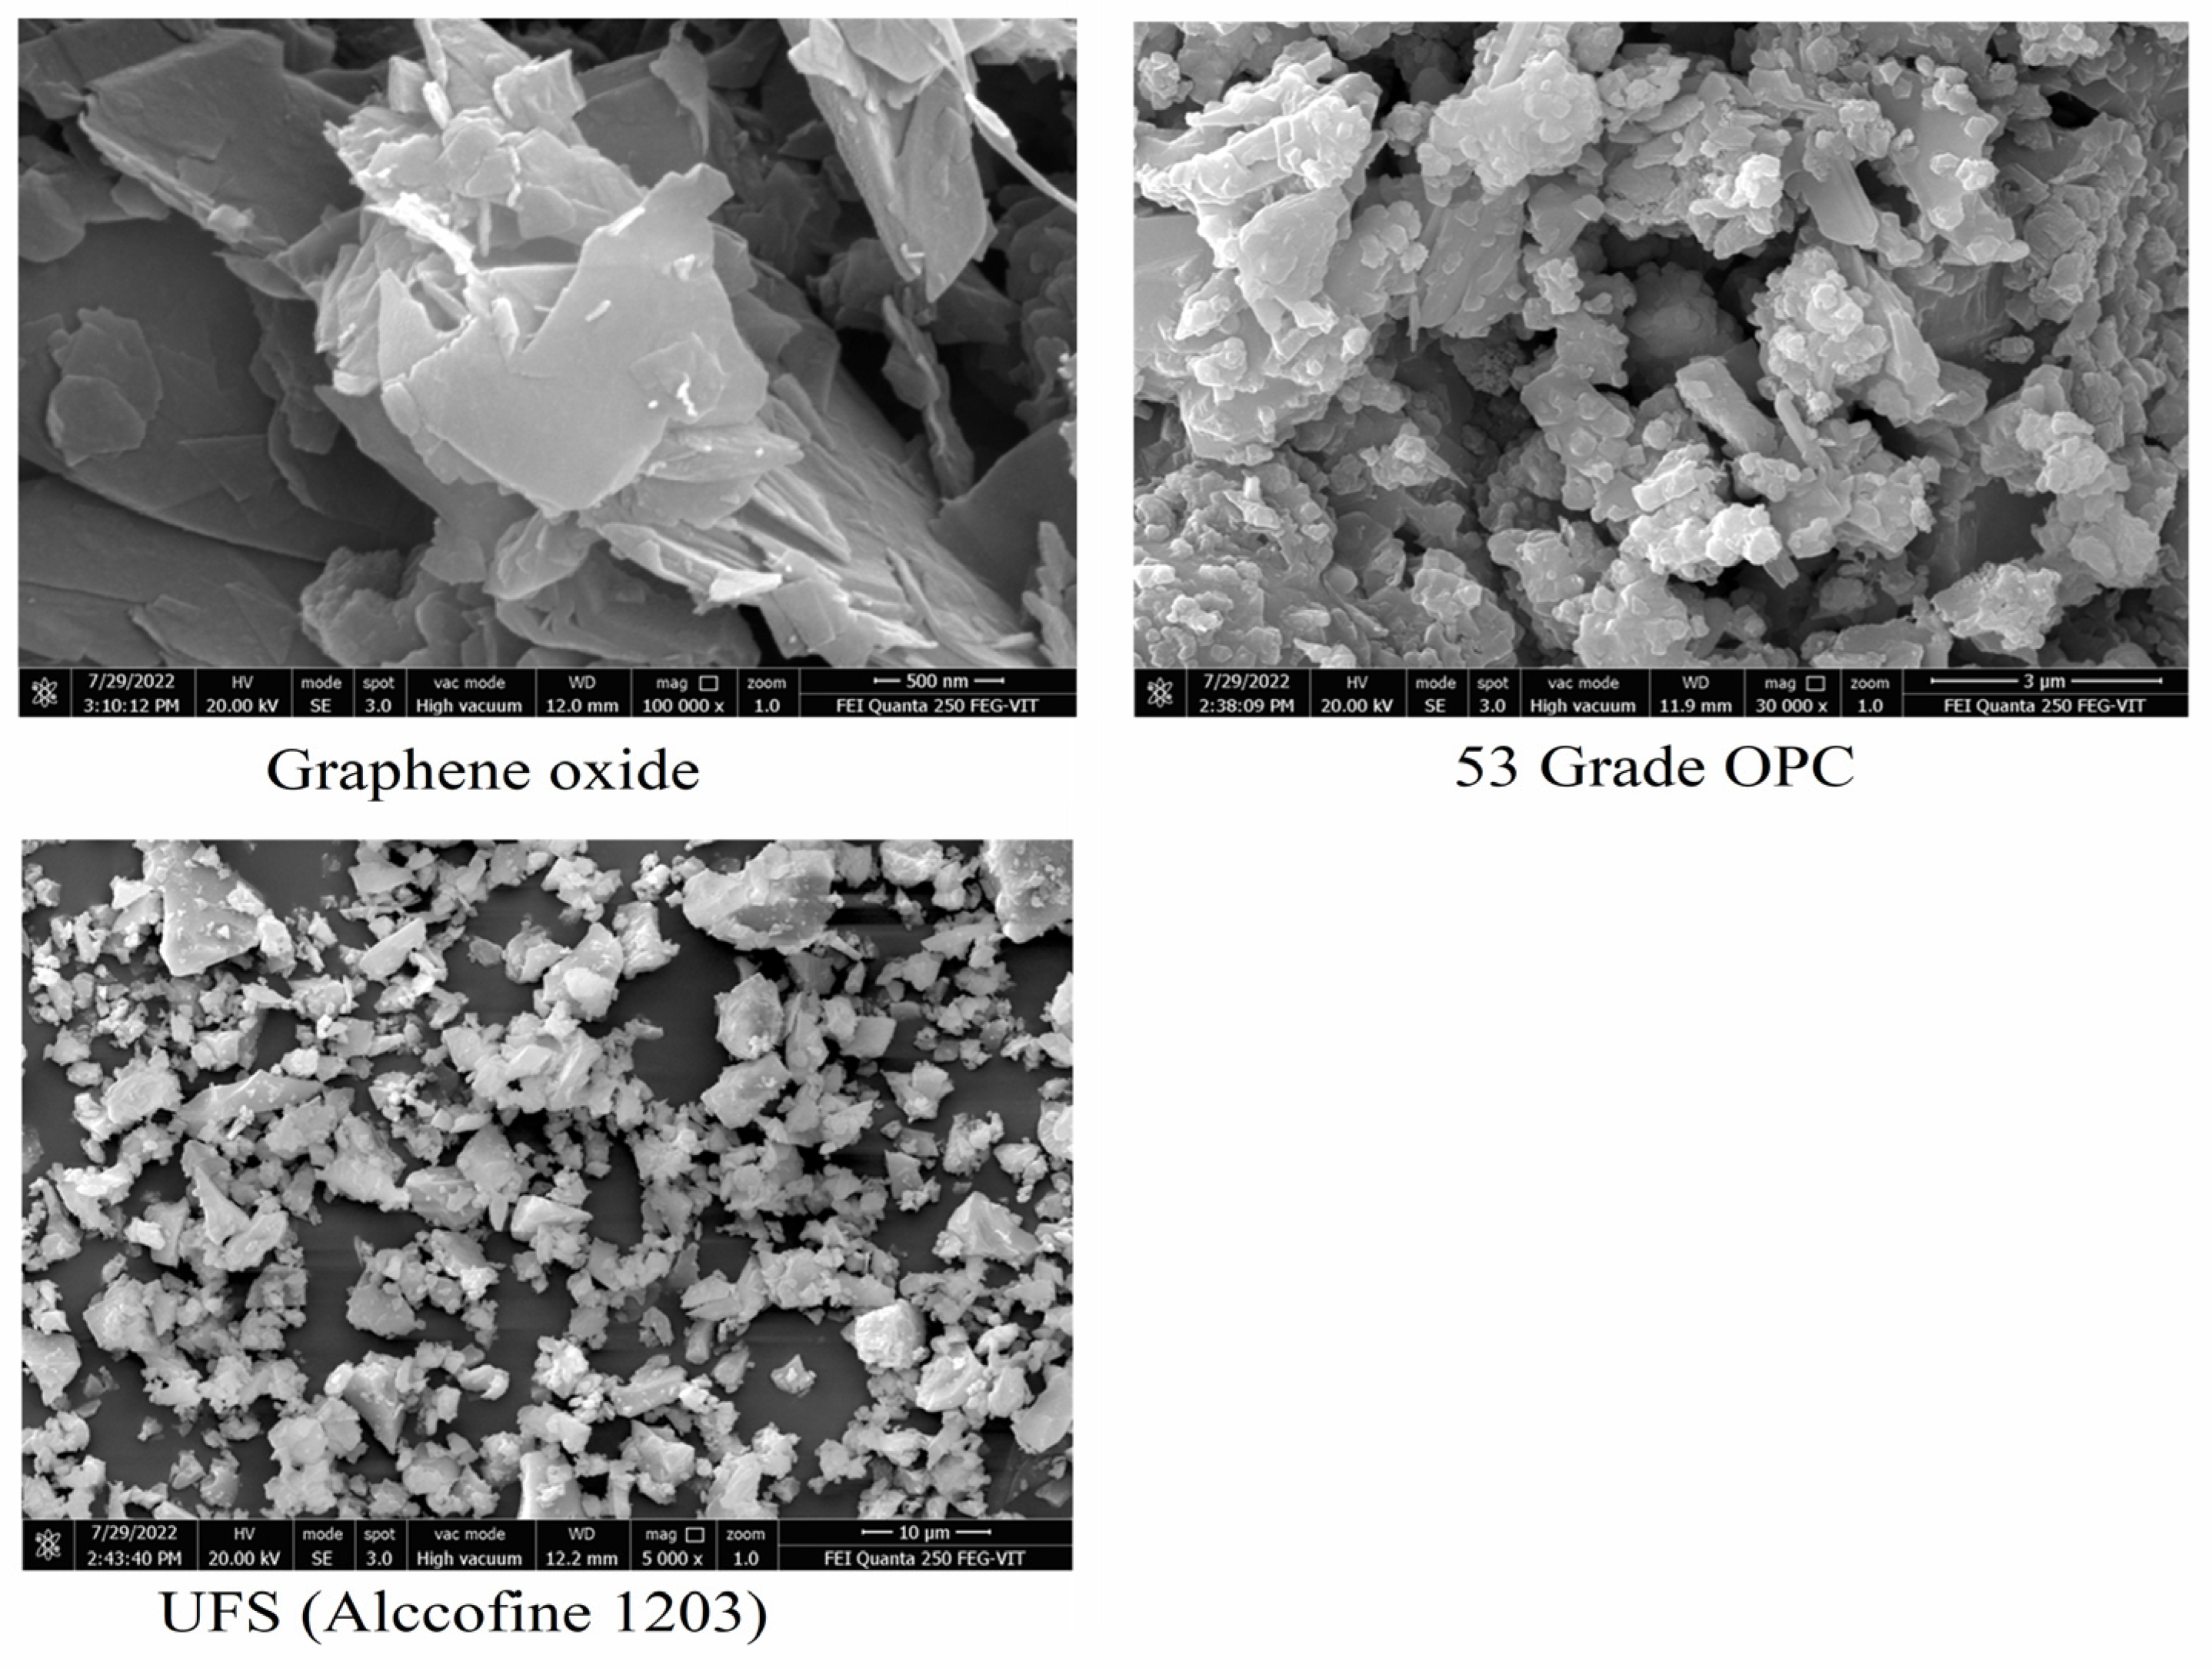
Figure 6.
Compressive strength of CM-UFS-GO.
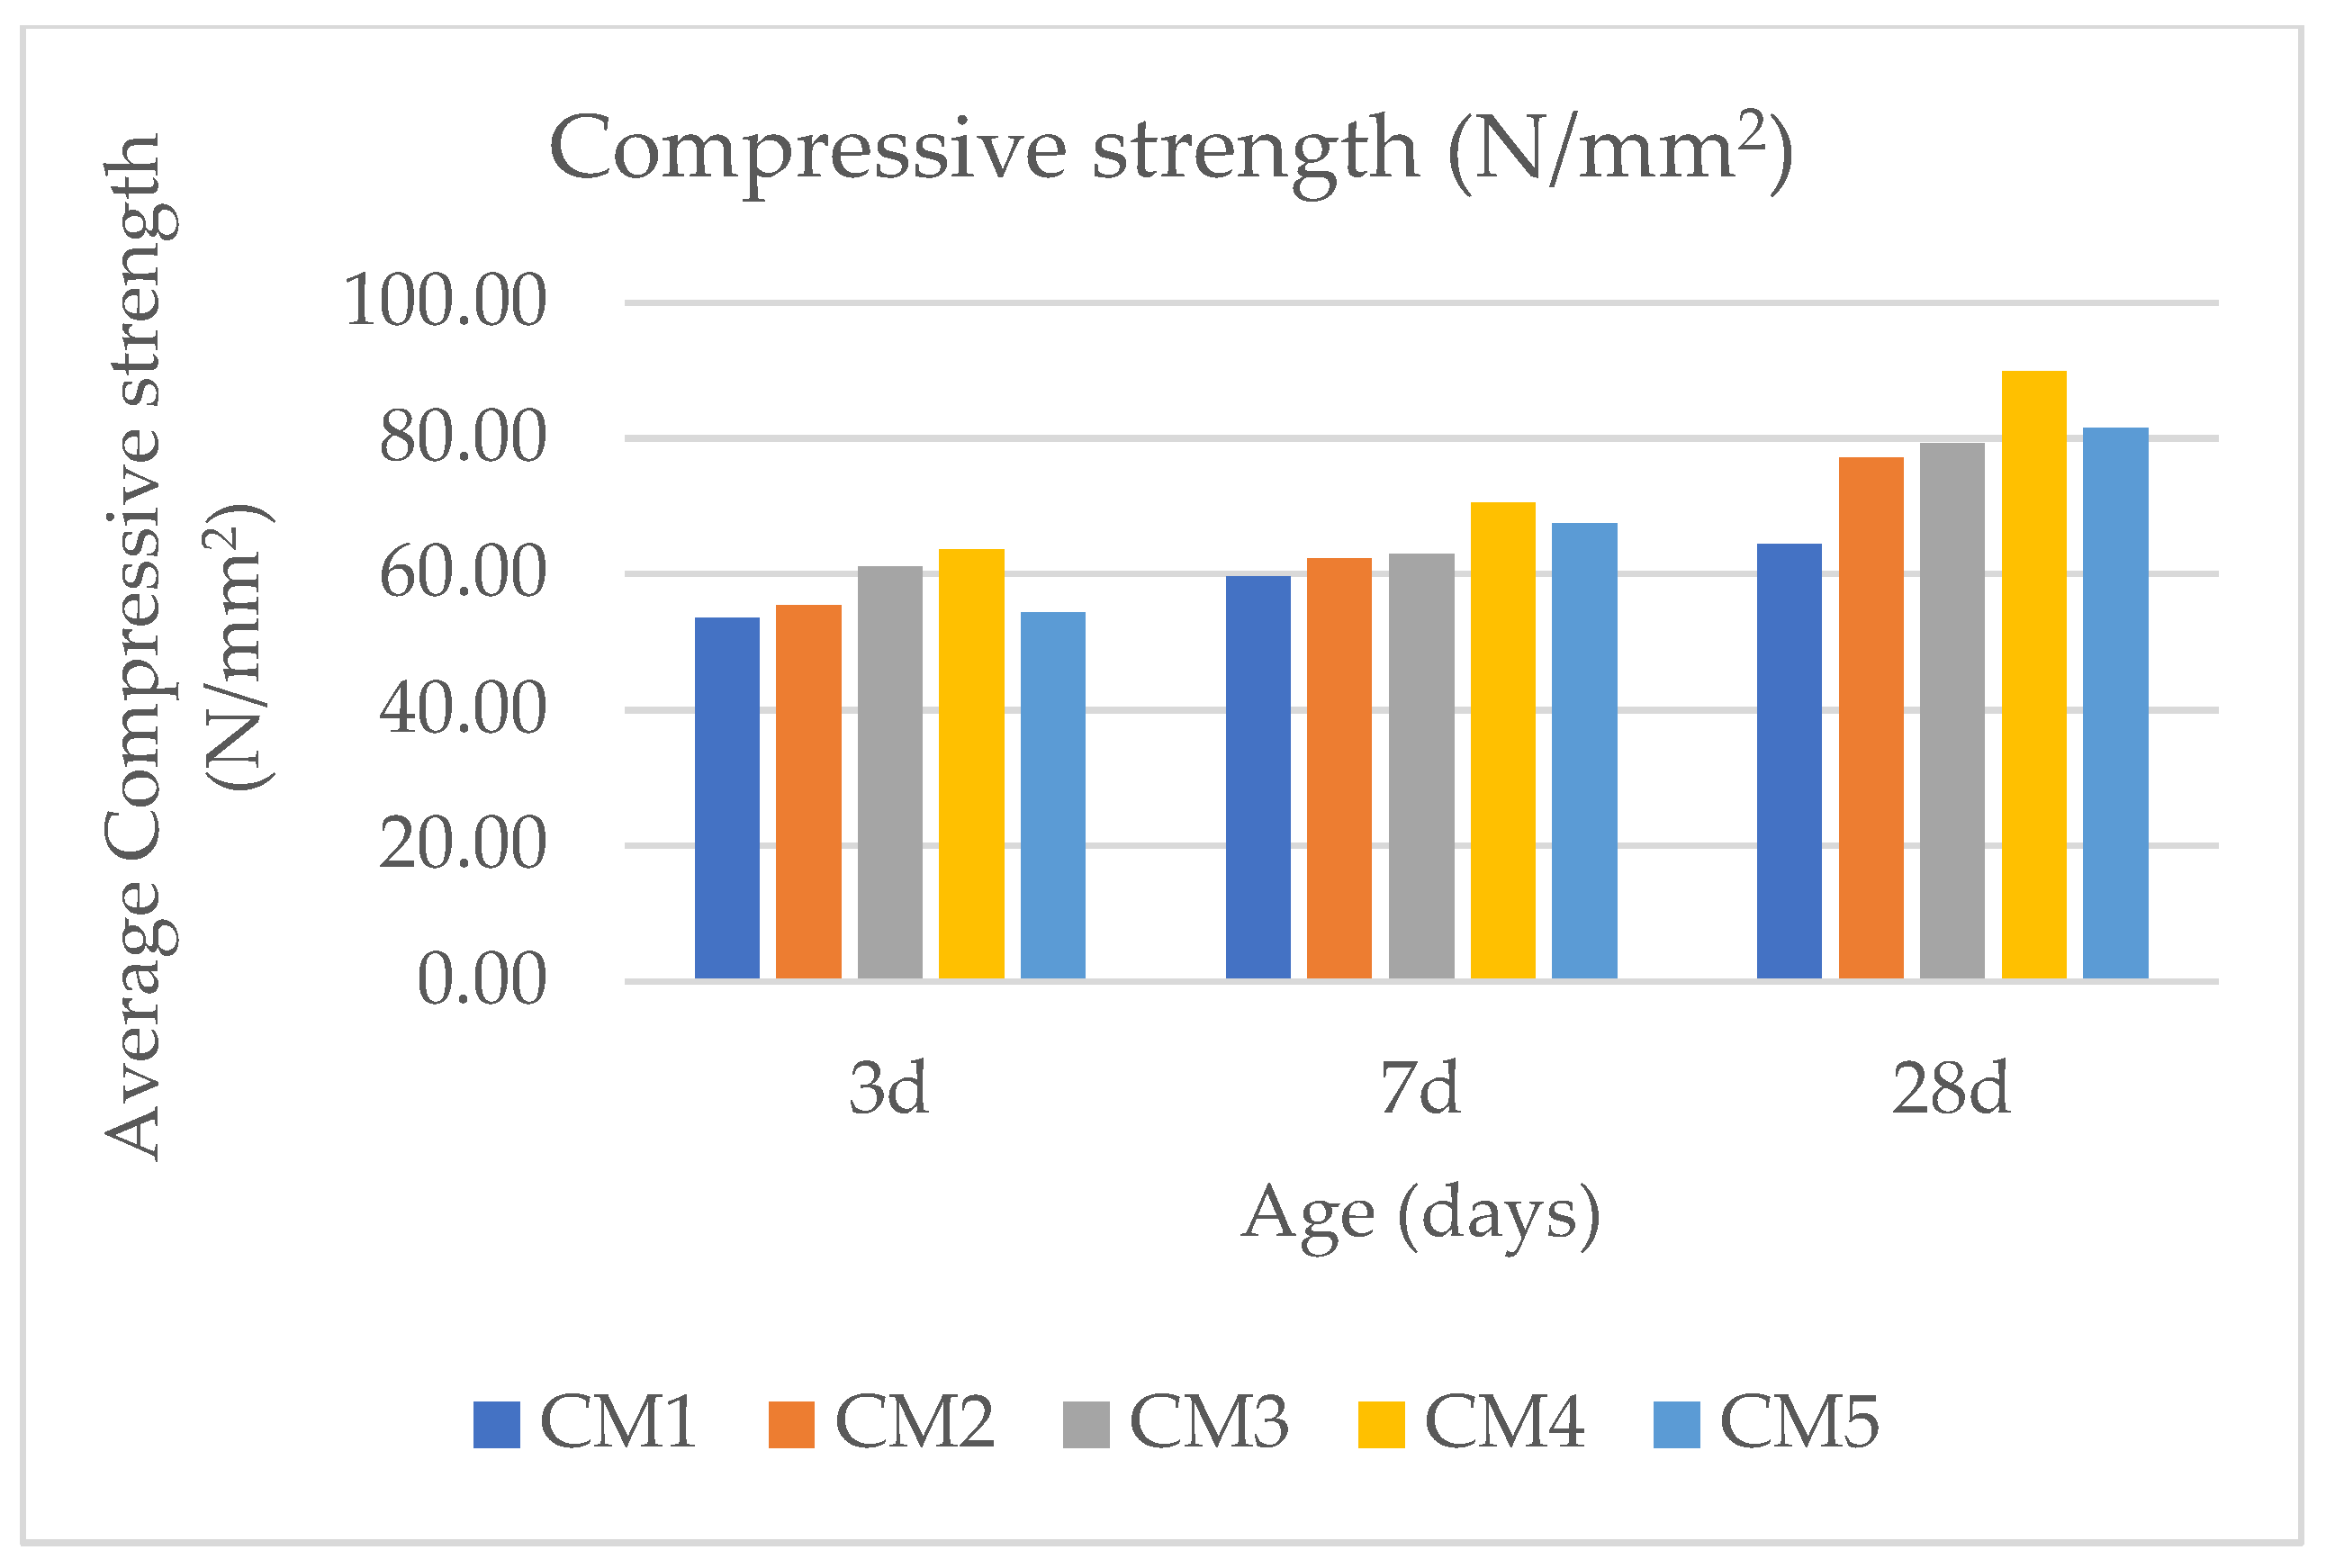
Figure 7.
SEM of CM-UFS-GO composites. (a) CM1; (b) CM2; (c) CM3; (d) CM4; and (e) CM5.
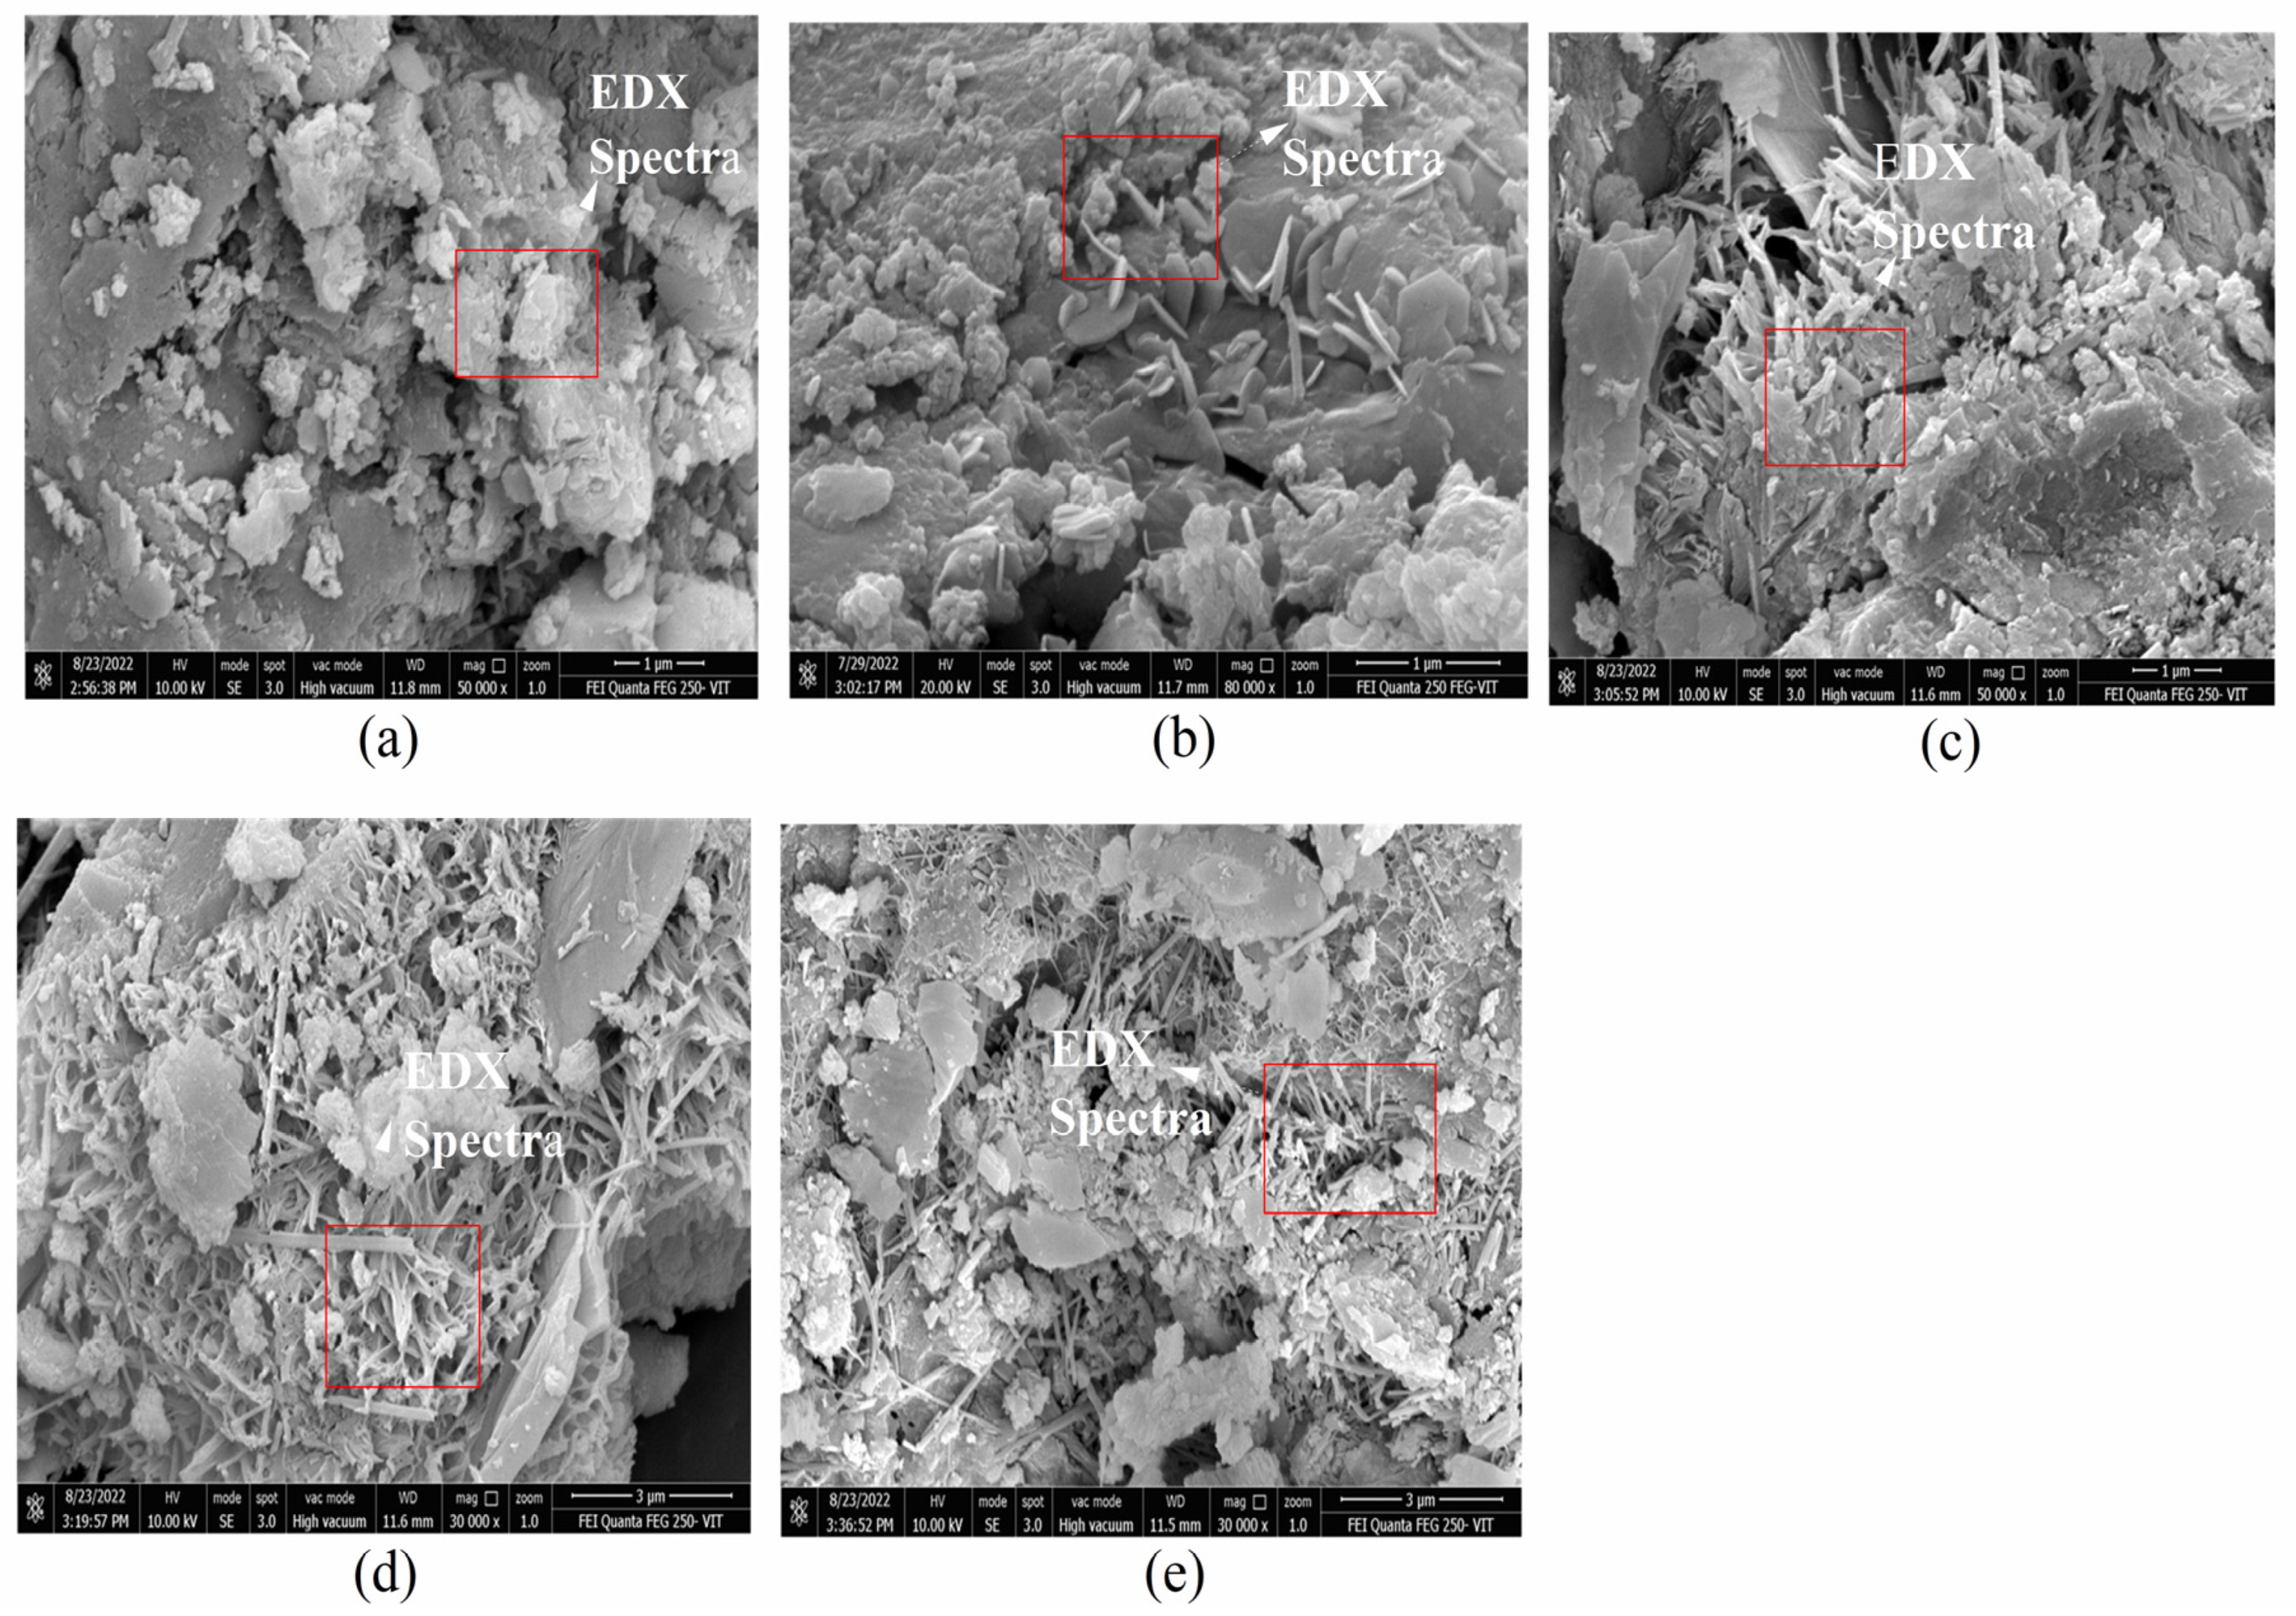
Figure 8.
EDX of CM-UFS-GO composites. (a) CM1; (b) CM2; (c) CM3; (d) CM4; and (e) CM5.
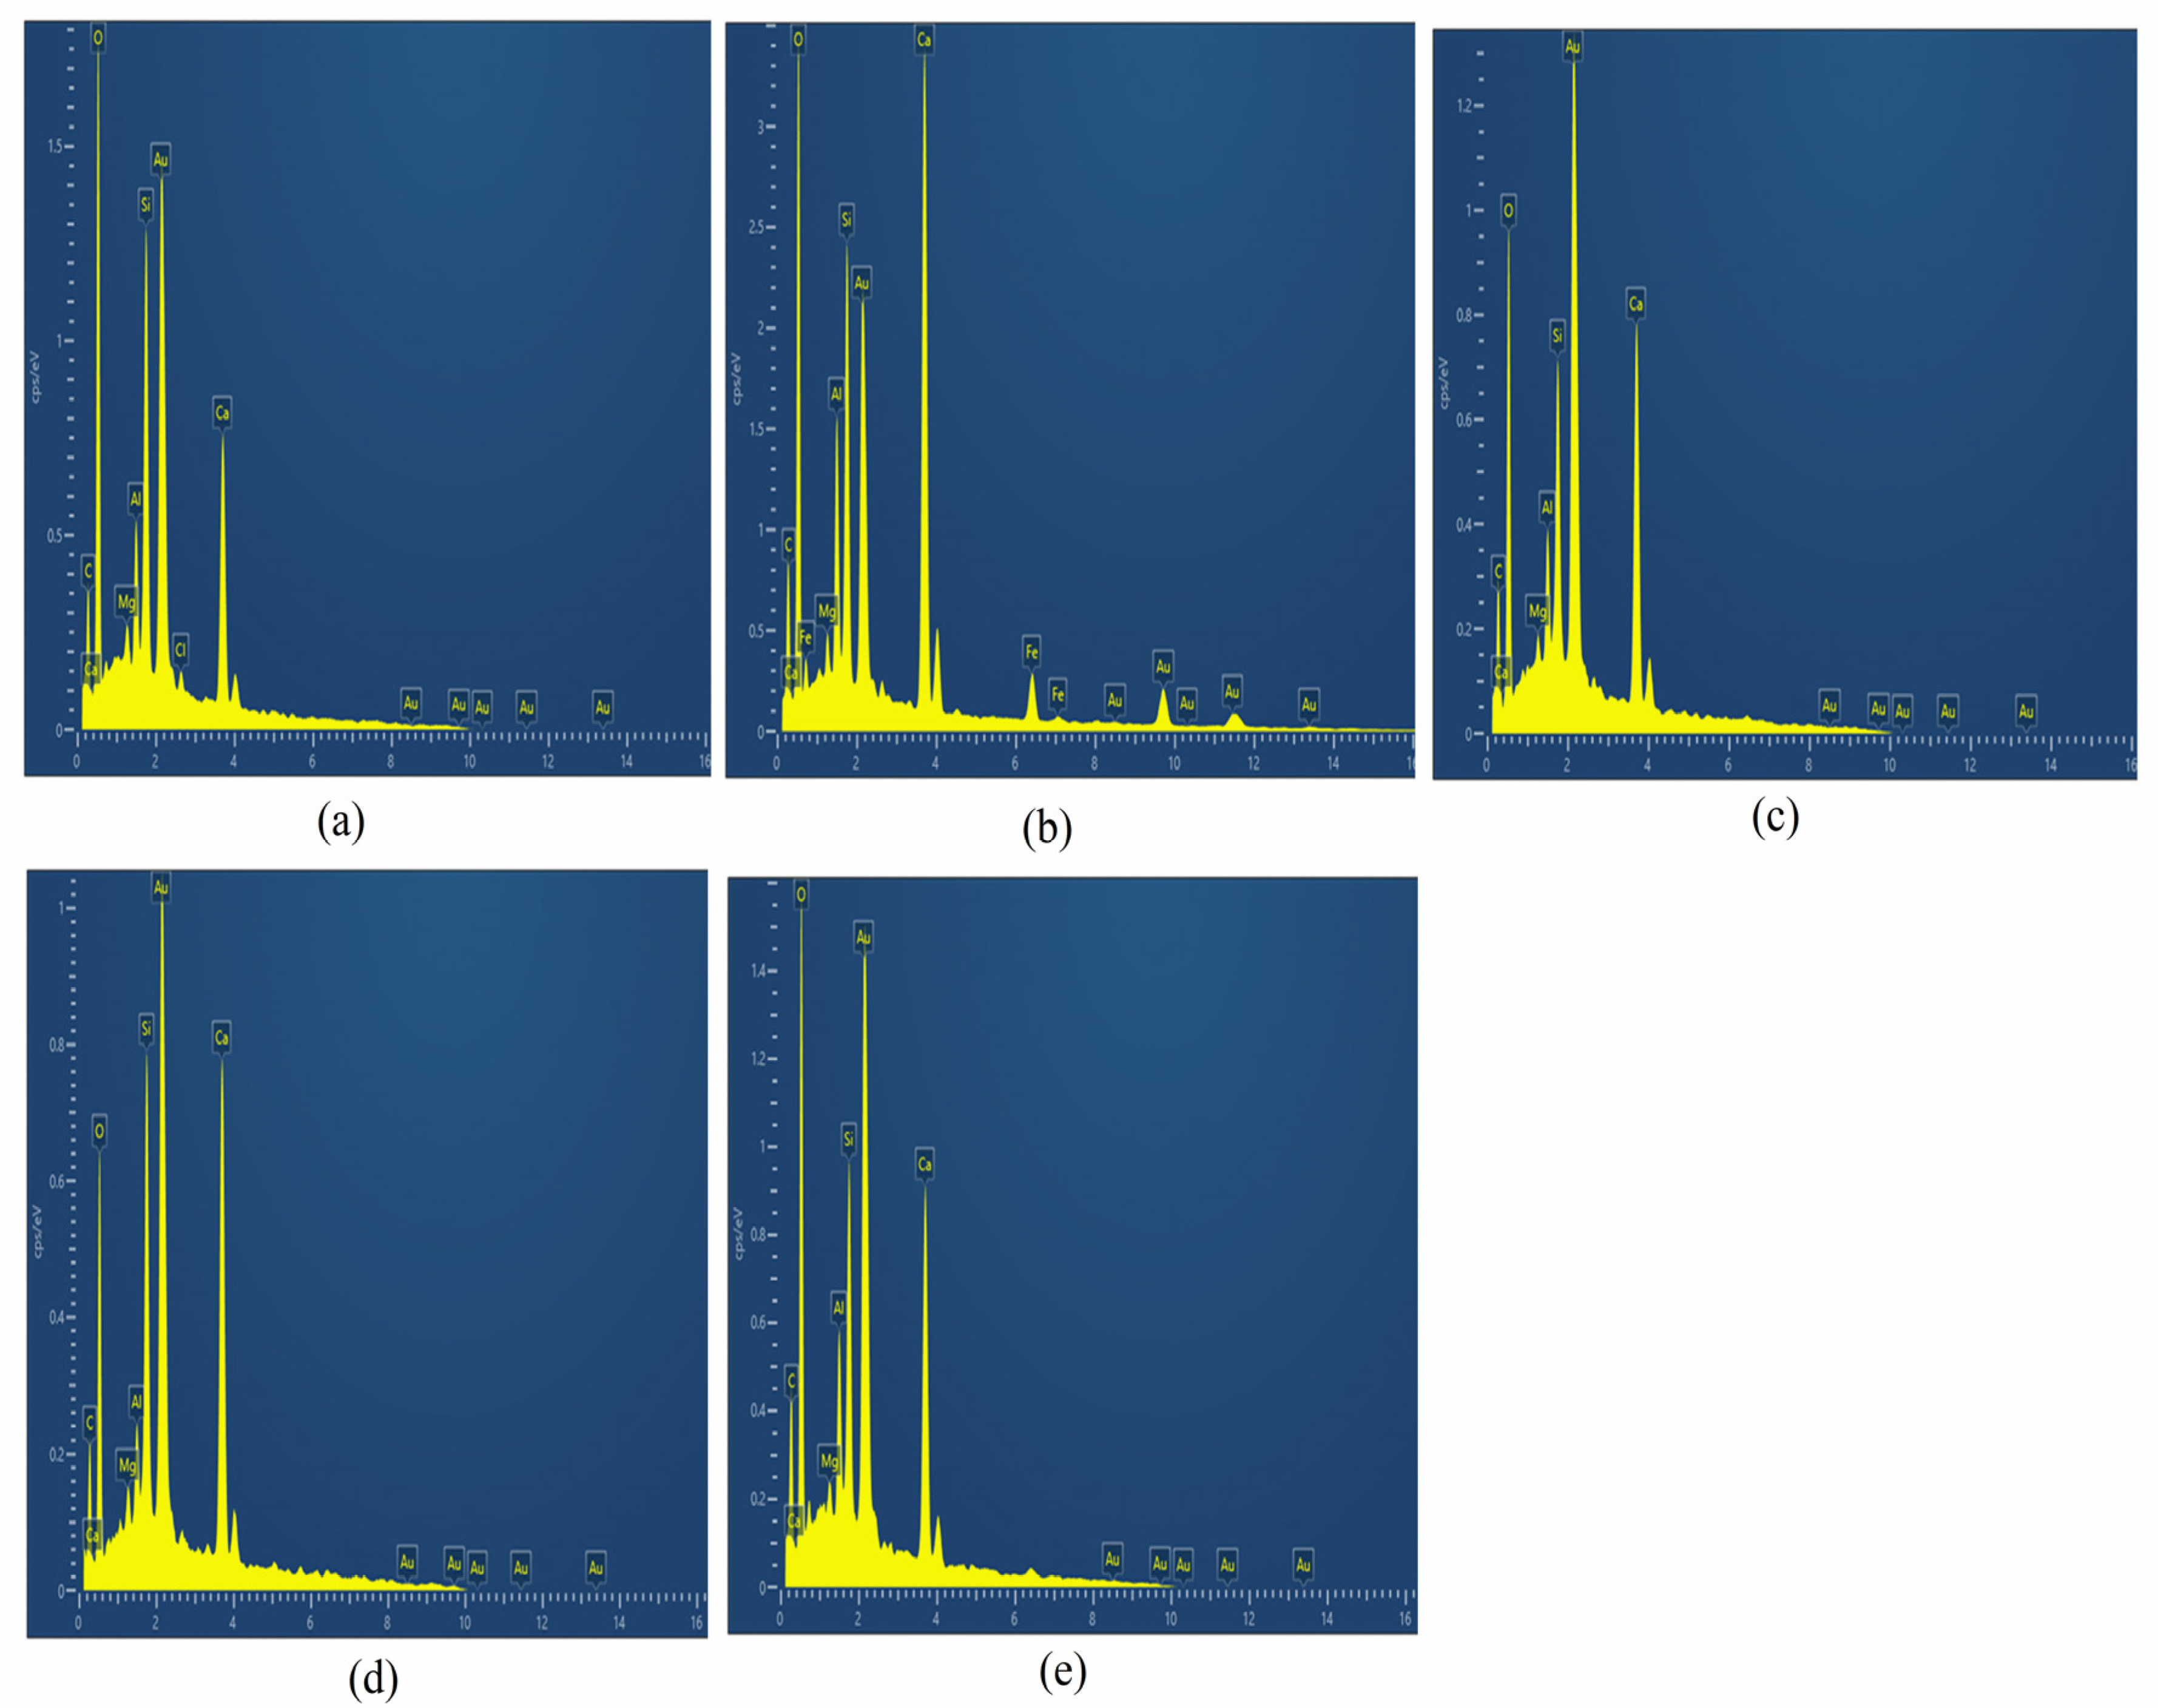
Figure 9.
XRD of CM-UFS-GO composites (P—Portlandite, Q—quartz, C—calcite, CSH—calcium silicate hydrate, Si—silicon).
Figure 9.
XRD of CM-UFS-GO composites (P—Portlandite, Q—quartz, C—calcite, CSH—calcium silicate hydrate, Si—silicon).
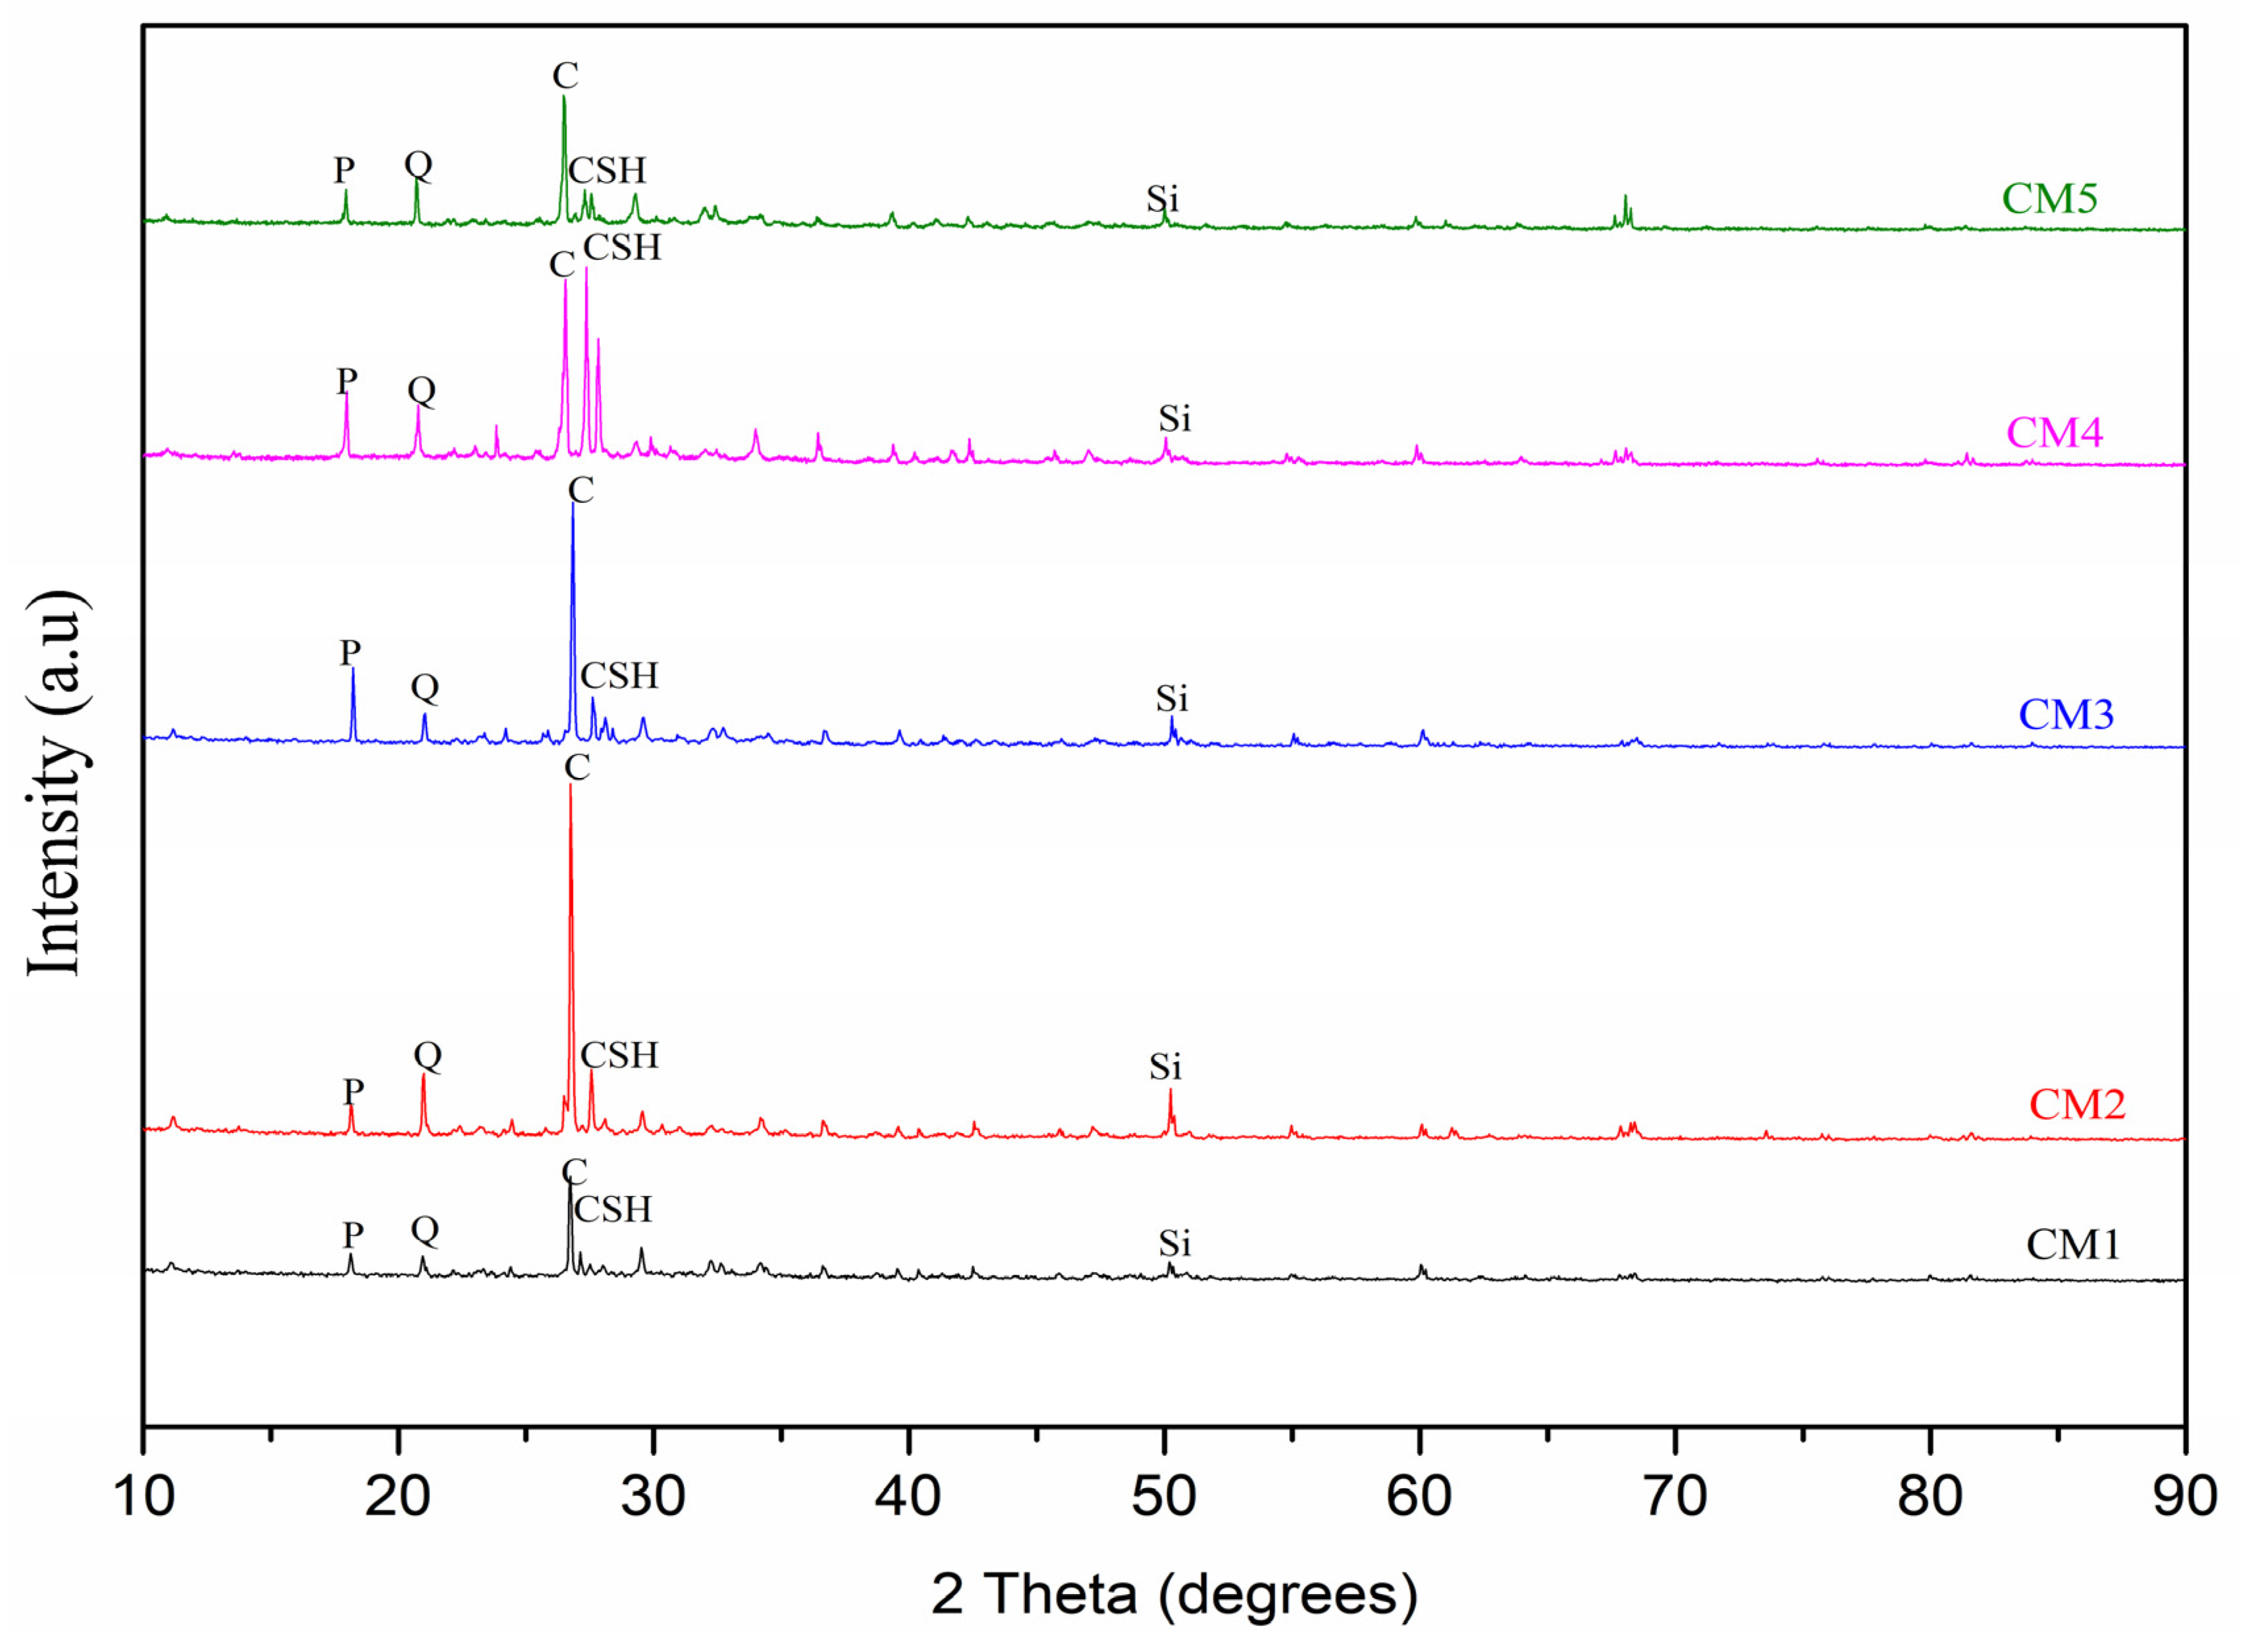
Figure 10.
Water absorption of CM-UFS-GO composites.

Figure 11.
Water Sorptivity of CM-UFS-GO composites.
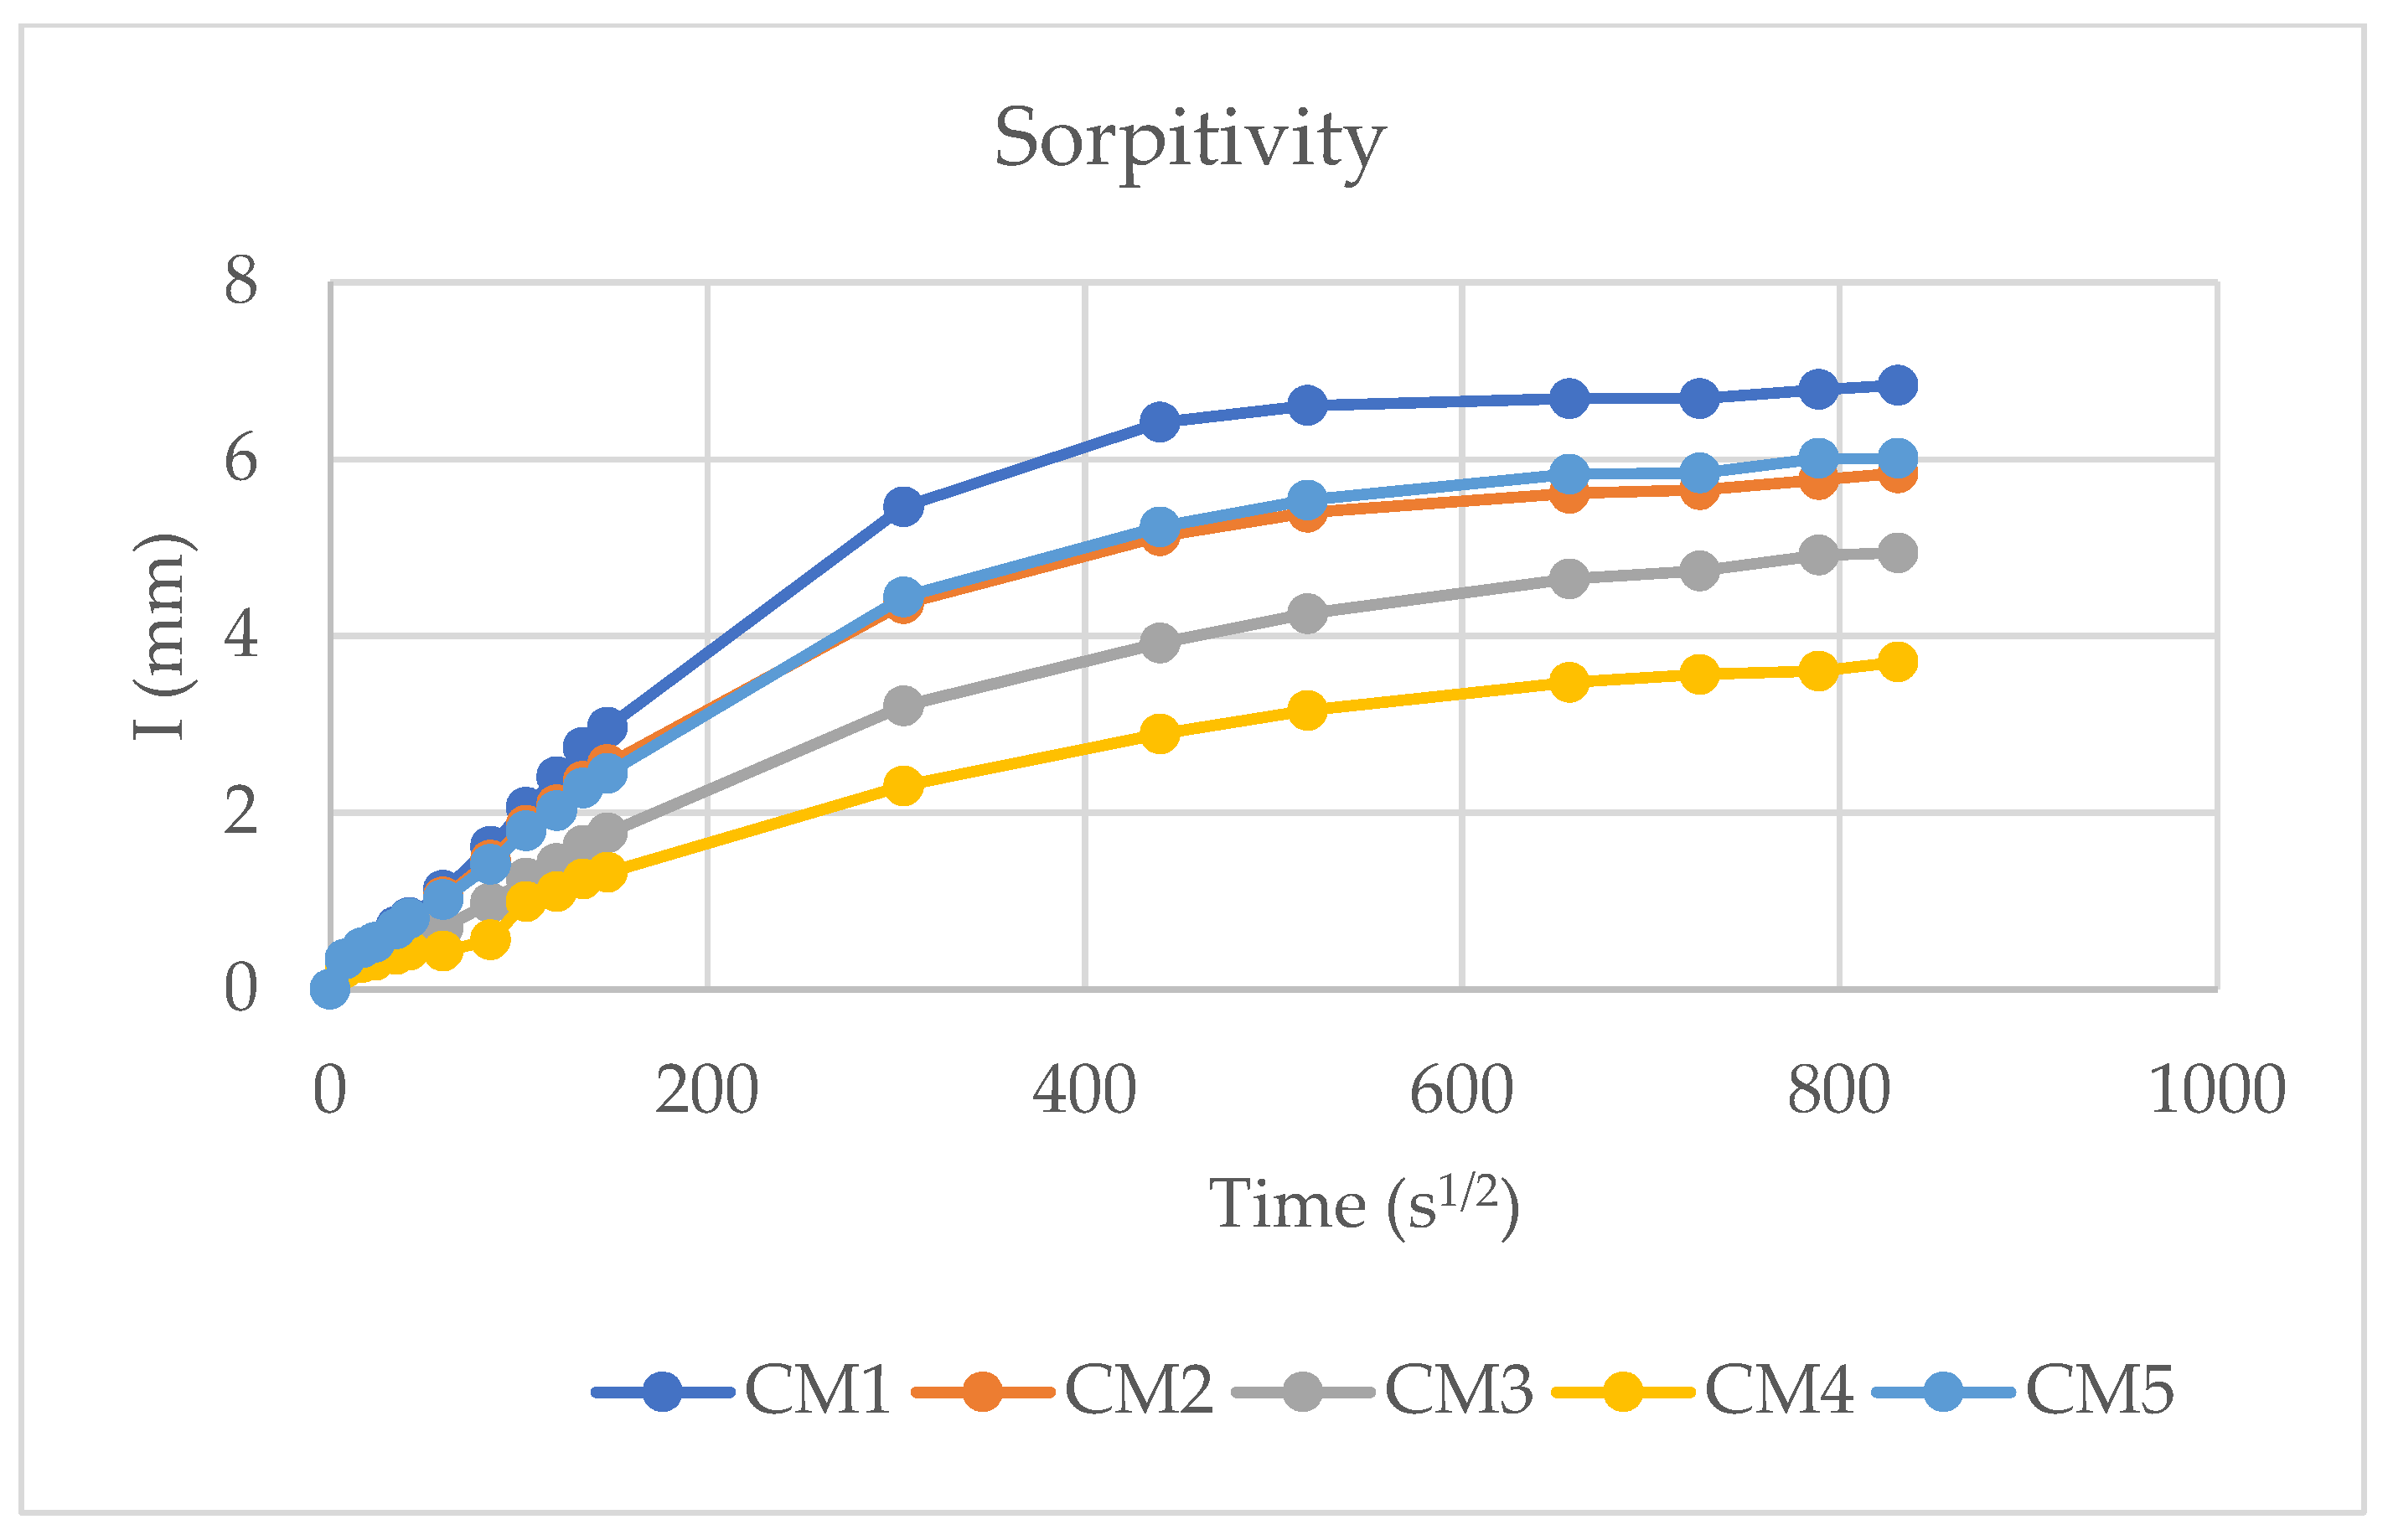
Figure 12.
Ultrasonic pulse velocity of CM-UFS-GO composites.
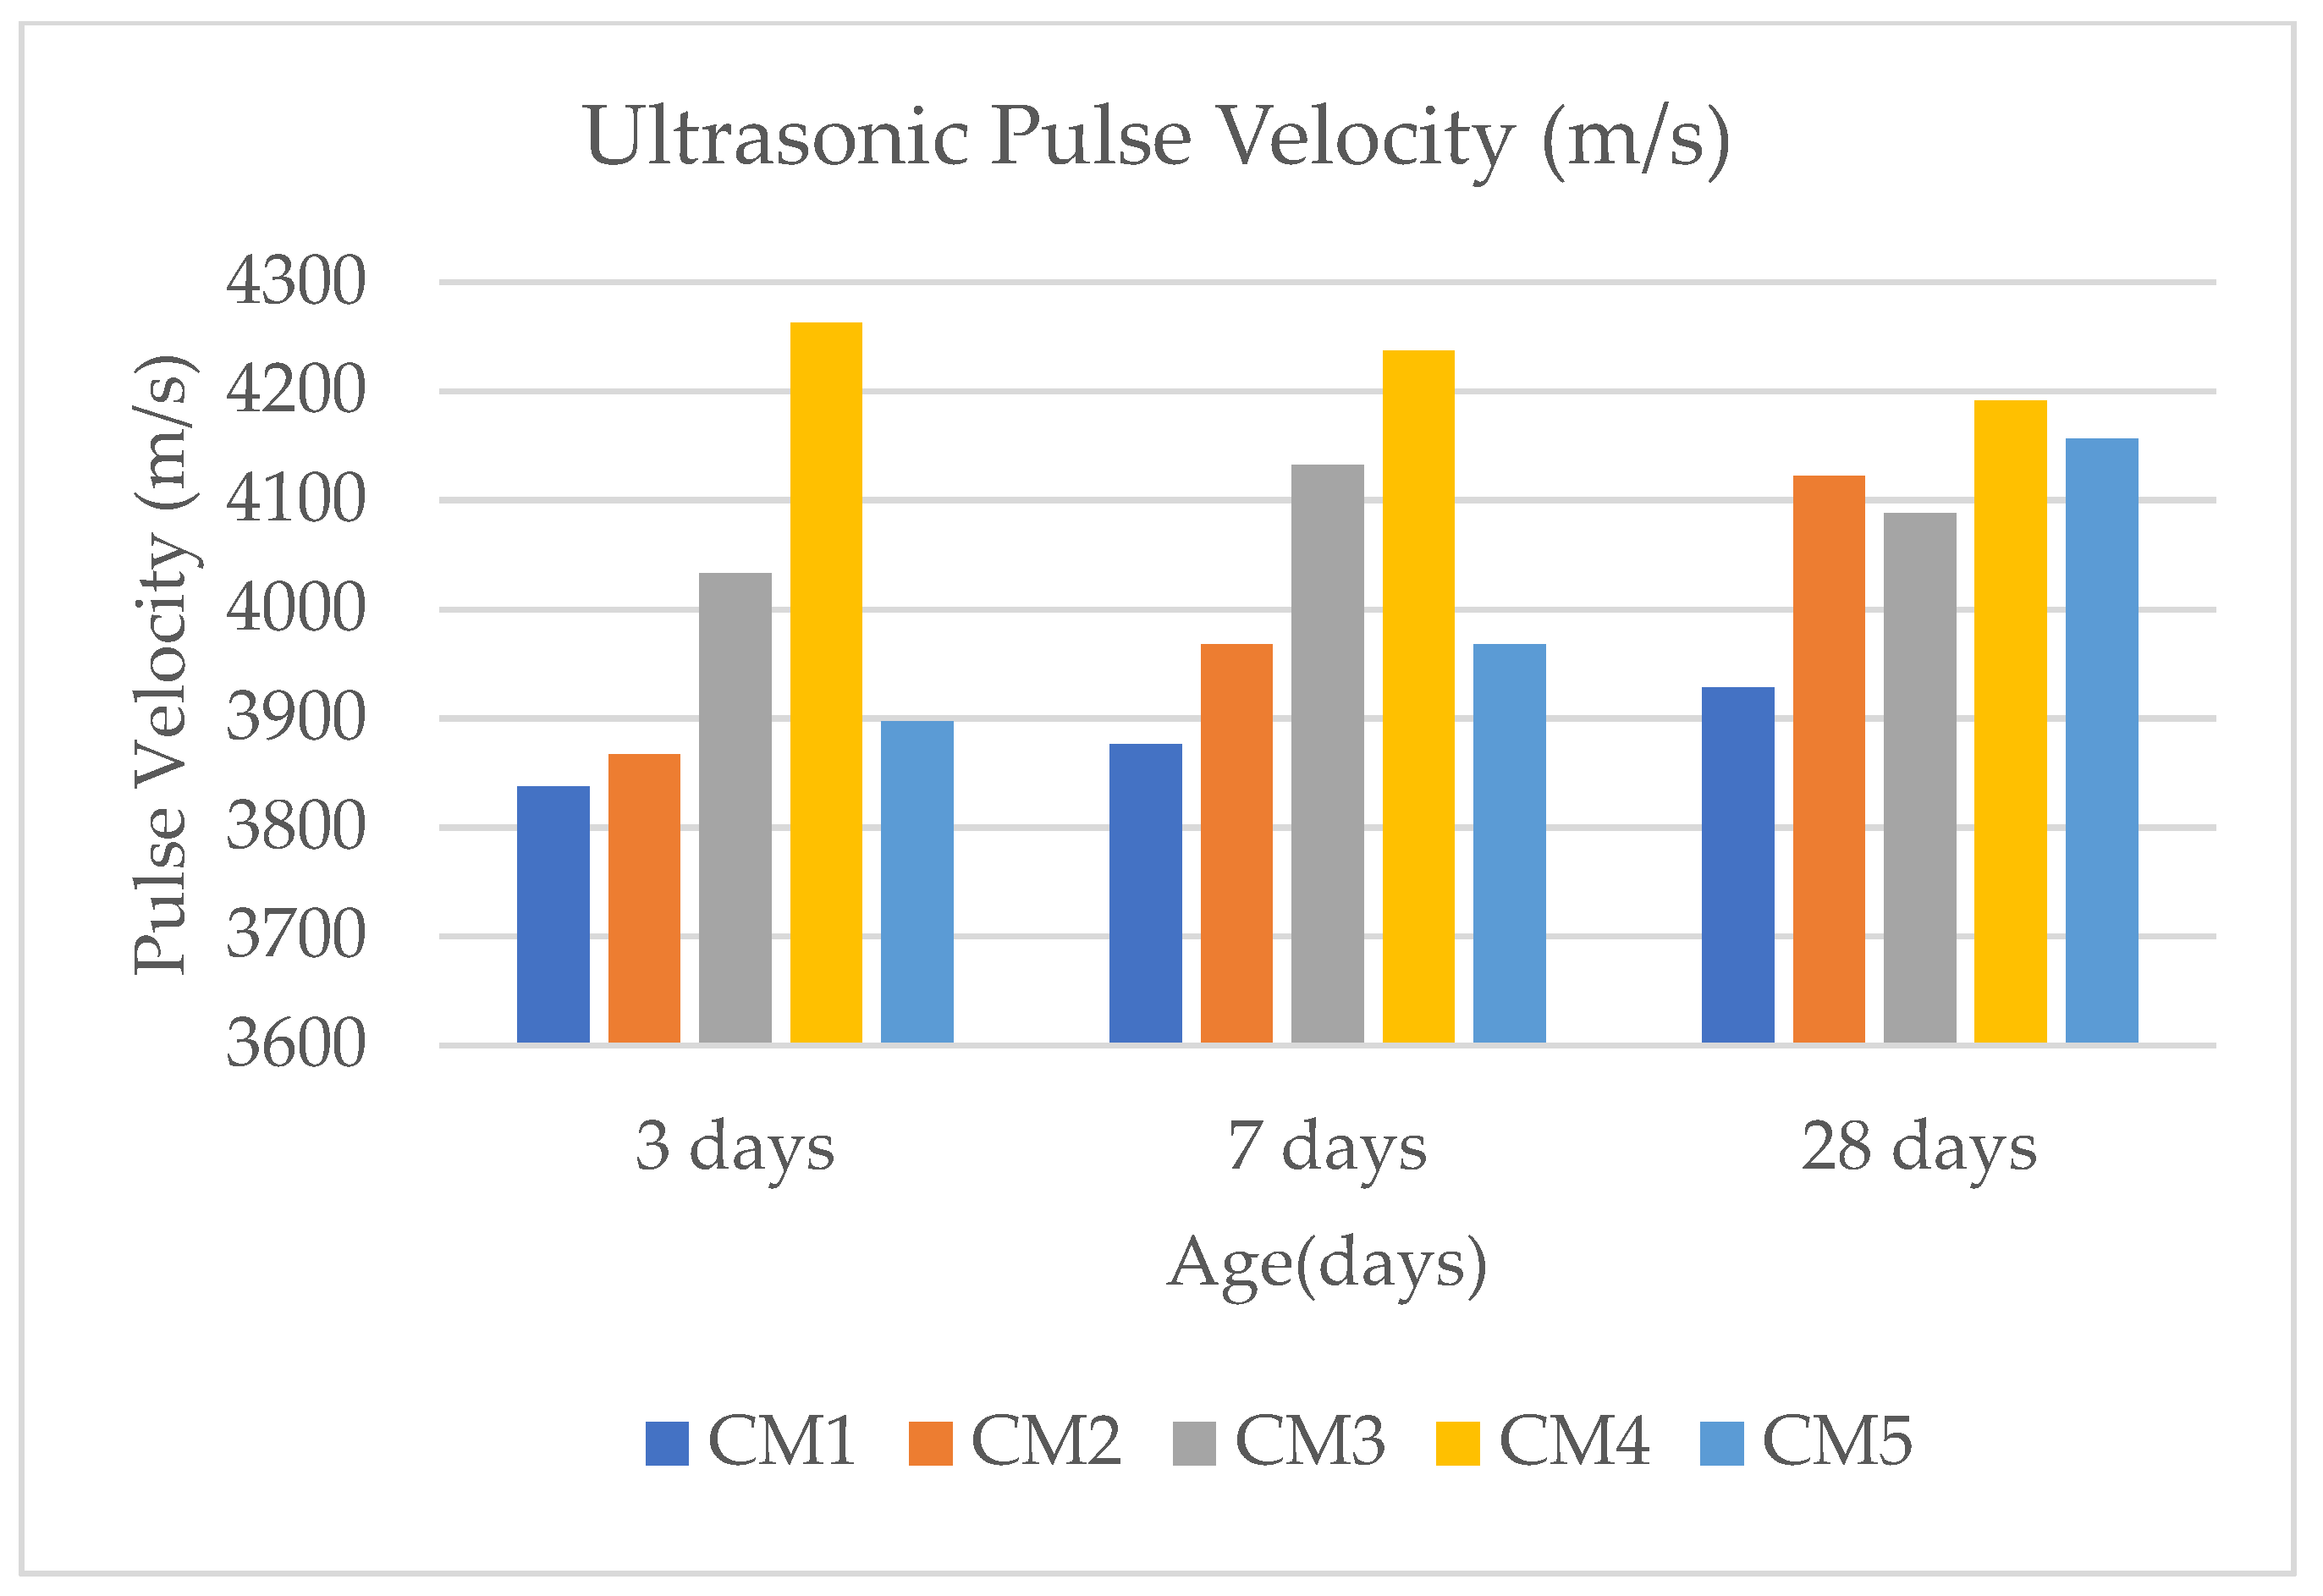
Figure 13.
Rapid chloride permeability test setup.
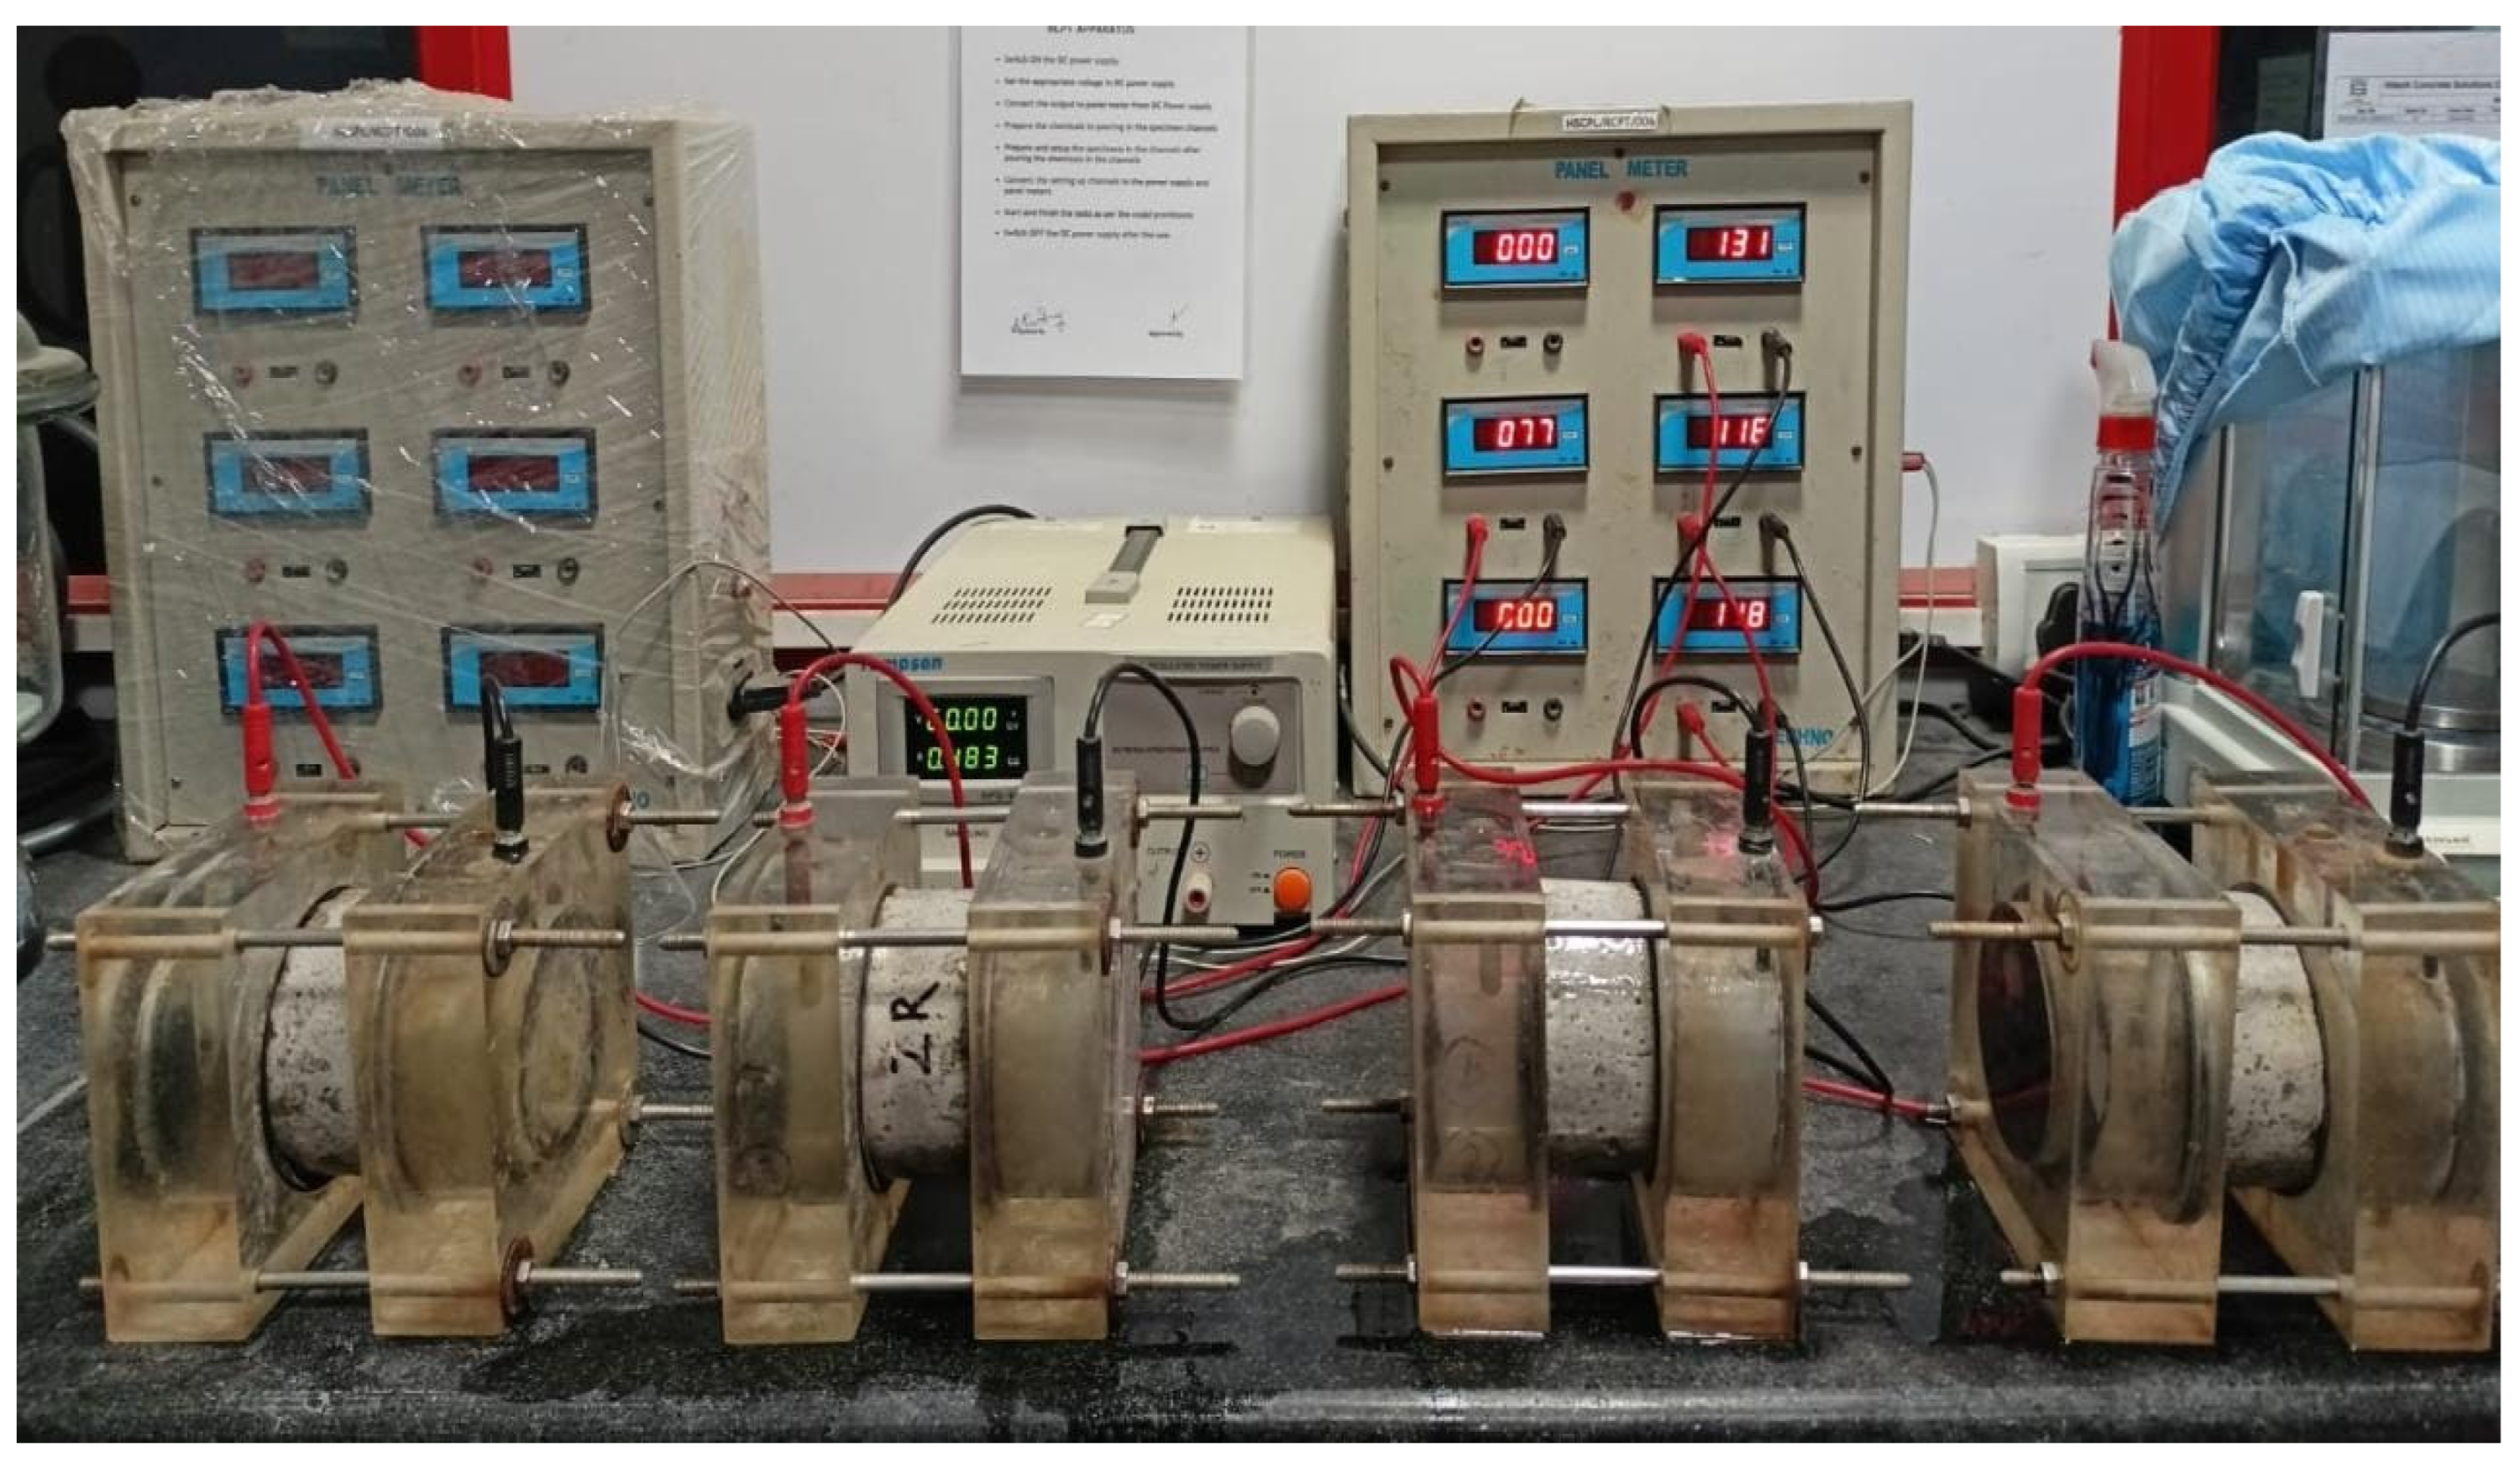
Figure 14.
Carbonation depth of CM-UFS-GO composites. (a)—CM1; (b)—CM2; (c)—CM3; (d)—CM4 and (e)—CM5.
Figure 14.
Carbonation depth of CM-UFS-GO composites. (a)—CM1; (b)—CM2; (c)—CM3; (d)—CM4 and (e)—CM5.
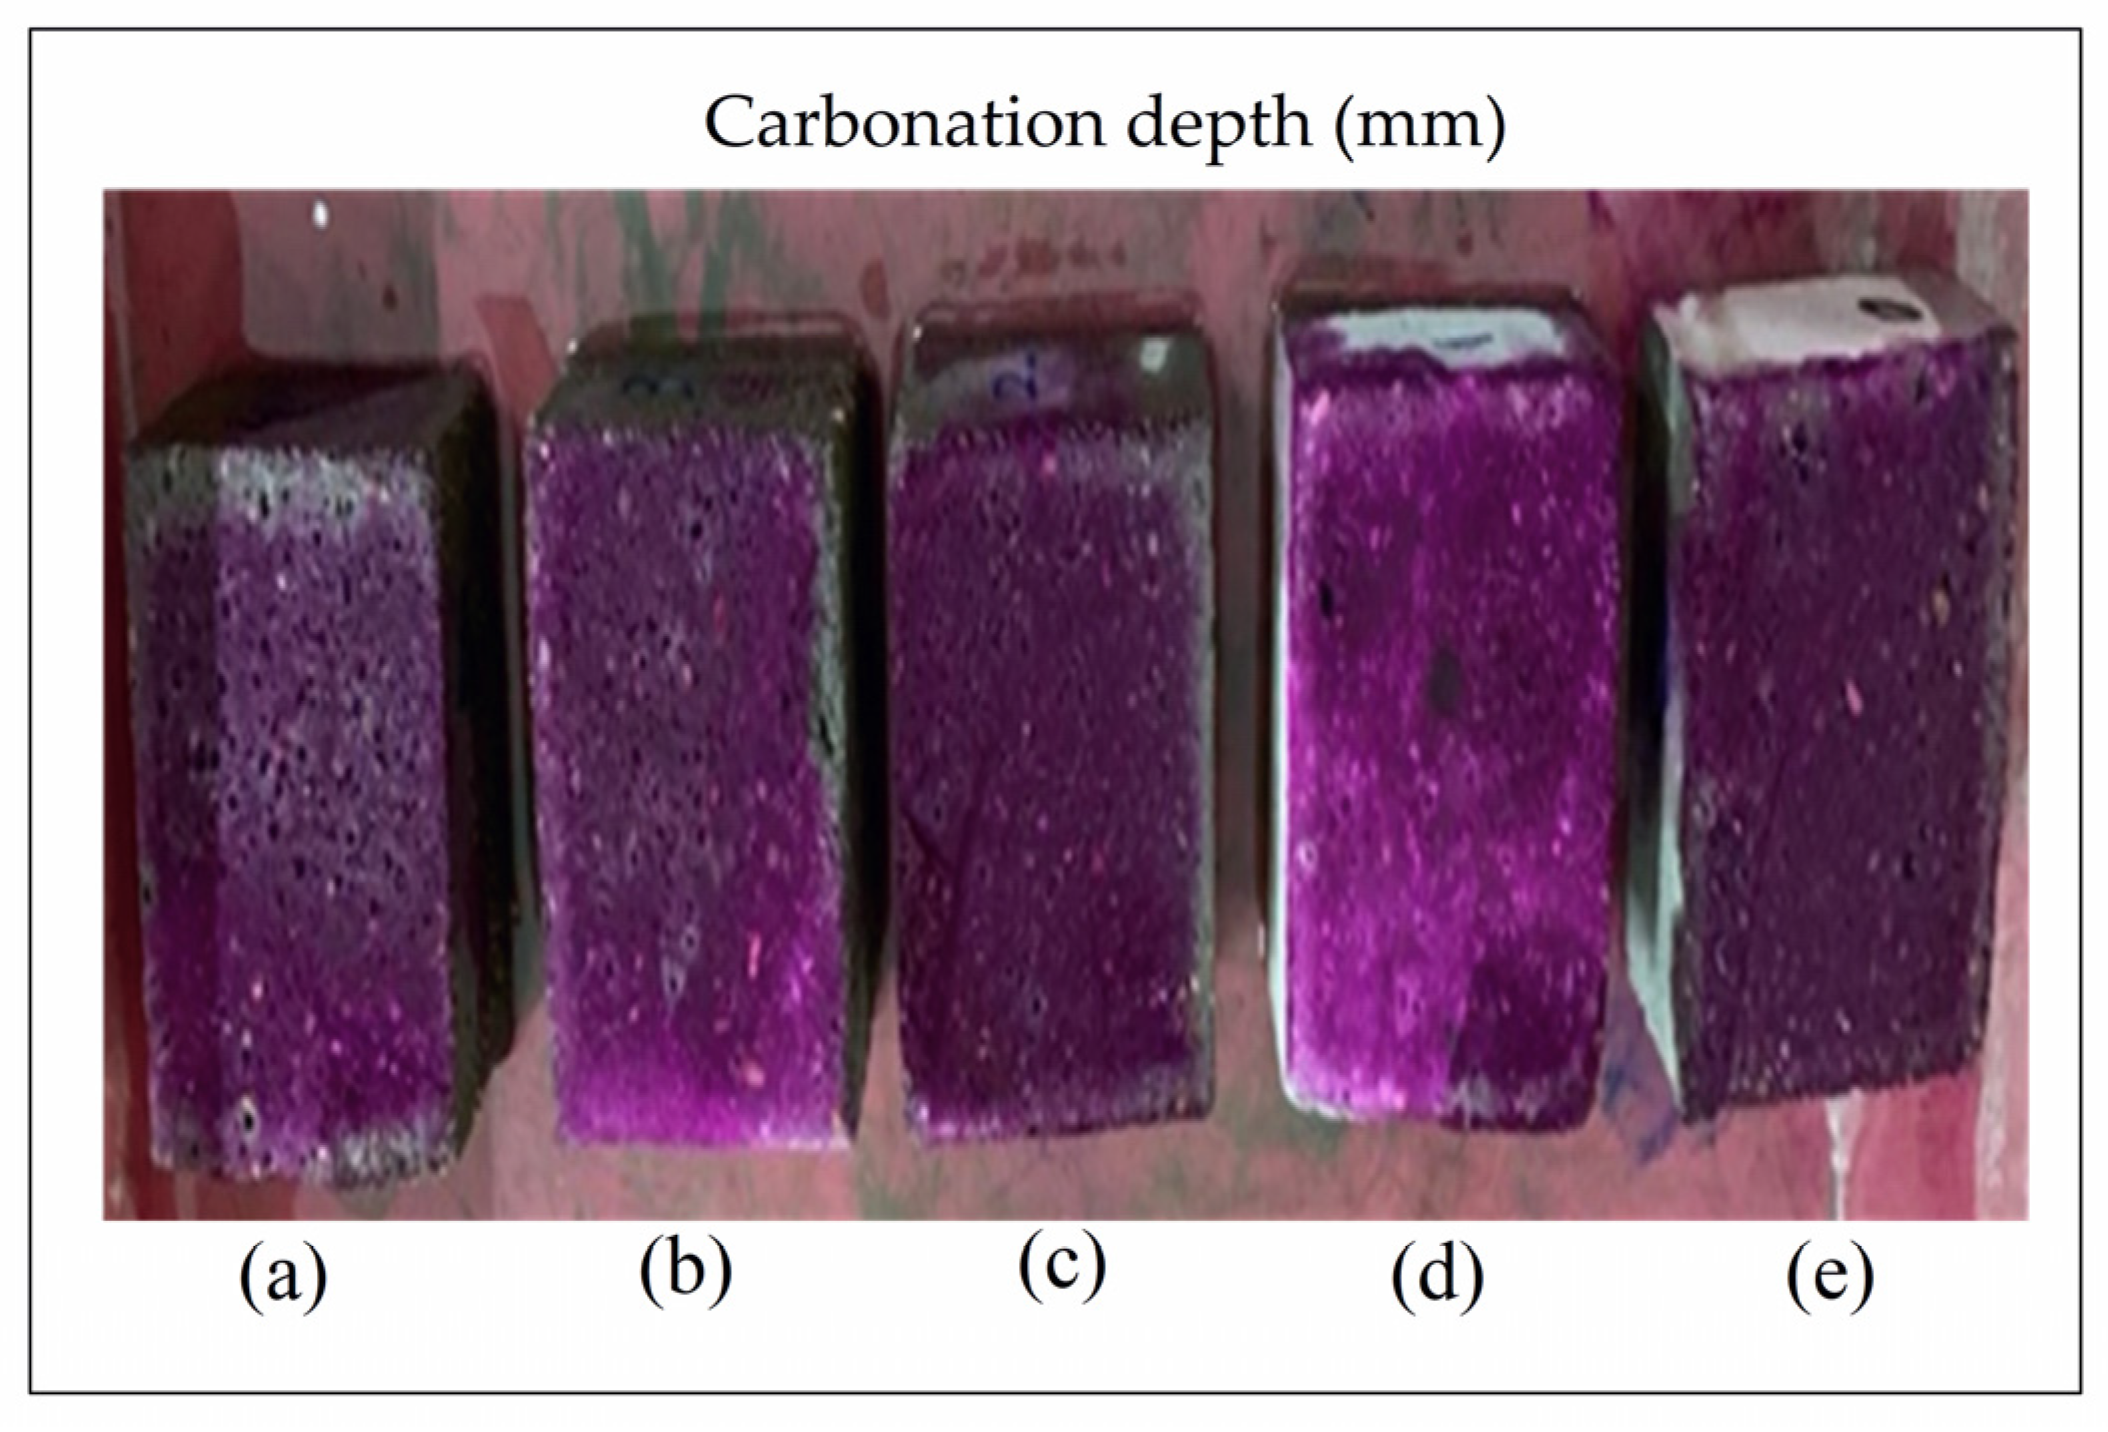
Figure 15.
Electric resistivity of CM-UFS-GO composites.

Table 1.
Details of experimentation.
| S No | Test Details | Total Number of Specimens Casted | Age (Days) | Size of Specimen |
|---|---|---|---|---|
| 1 | Compression strength (CS) | 45 | 3, 7, 28 days | Cubes of 50 mm × 50 mm × 50 mm |
| 2 | Water absorption | 15 | 3, 7, 28 days | Circular discs of diameter 100 mm and height 50 mm |
| 3 | Sorptivity | 15 | 28 days | Circular discs of diameter 100 mm and height 50 mm |
| 4 | Ultrasonic pulse velocity (UPV) | 15 | 3, 7, 28 days | Cubes of 50 mm × 50 mm × 50 mm |
| 5 | Rapid chloride permeability test (RCPT) | 15 | 28 days | Circular discs of diameter 100 mm and height 50 mm |
| 6 | Carbonation | 5 | 28 days | Cubes of 50 mm × 50 mm × 50 mm |
| 7 | Electric resistivity | 5 | 28 days | Cylinder of diameter 100 mm and height 200 mm |
Table 2.
Composition of CM-UFS-GO.
| MIX | OPC (kg·m−3) | River Sand (kg·m−3) | UFS (kg·m−3) | GO (kg·m−3) | Water (kg·m−3) | Superplasticizer Dosage (%) |
|---|---|---|---|---|---|---|
| CM1 | 599.76 | 1833.28 | 66.64 | - | 322.4 | 1 |
| CM2 | 0.066 | |||||
| CM3 | 0.132 | |||||
| CM4 | 0.199 | |||||
| CM5 | 0.266 |
Table 3.
Compressive strength of CM-UFS-GO.
| MIX | 3 Days | 7 Days | 28 Days | ||||||
|---|---|---|---|---|---|---|---|---|---|
| Avg CS (N/mm2) | SD | CoV (%) | Avg CS (N/mm2) | SD | CoV (%) | Avg CS (N/mm2) | SD | CoV (%) | |
| CM1 | 53.47 | 2.84 | 5.31 | 59.60 | 2.29 | 3.84 | 64.40 | 2.23 | 3.46 |
| CM2 | 55.33 | 1.94 | 3.51 | 62.27 | 2.00 | 3.22 | 77.07 | 1.92 | 2.49 |
| CM3 | 61.07 | 1.9 | 3.11 | 62.93 | 1.79 | 2.85 | 79.20 | 1.56 | 1.97 |
| CM4 | 63.60 | 1.26 | 1.98 | 70.53 | 1.22 | 1.73 | 89.87 | 0.42 | 0.46 |
| CM5 | 54.27 | 1.30 | 2.40 | 67.47 | 1.81 | 2.69 | 81.47 | 1.21 | 1.48 |
Table 4.
Element composition of CM-UFS-GO.
| Mix | CM1 | CM2 | CM3 | CM4 | CM5 | |||||
|---|---|---|---|---|---|---|---|---|---|---|
| Element | Weight % | Atomic % | Weight % | Atomic % | Weight % | Atomic % | Weight % | Atomic % | Weight % | Atomic % |
| C | 9.27 | 15.94 | 16.62 | 24.91 | 8.21 | 15.1 | 8.29 | 16.04 | 8.89 | 15.57 |
| O | 45.63 | 55.66 | 52.88 | 59.49 | 37.39 | 51.63 | 30.88 | 44.84 | 41.91 | 55.14 |
| Mg | 0.89 | 0.75 | 0.85 | 0.63 | 0.77 | 0.7 | 0.97 | 0.93 | 0.77 | 0.67 |
| Al | 4.01 | 3.46 | 4.06 | 2.71 | 3.63 | 2.98 | 2.08 | 1.79 | 4.4 | 3.43 |
| Si | 11.49 | 9.45 | 9.26 | 3.95 | 8.67 | 6.82 | 11.68 | 9.66 | 9.23 | 6.92 |
| Ca | 28.71 | 14.74 | 16.33 | 8.31 | 41.33 | 22.78 | 46.1 | 26.73 | 34.8 | 18.27 |
| Total (%) | 100 | 100 | 100 | 100 | 100 | |||||
Table 5.
Chloride ion penetration in CM-UFS-GO composites.
| Mix | Avg Charge Passed (Coulombs) | % Variation | SD | CoV (%) |
|---|---|---|---|---|
| CM1 | 2527.7 | - | 4.47 | 0.18 |
| CM2 | 2253.1 | 10.86 | 4.22 | 0.19 |
| CM3 | 2238.2 | 11.45 | 2.65 | 0.12 |
| CM4 | 1480.7 | 41.42 | 2.06 | 0.15 |
| CM5 | 2123.4 | 15.99 | 2.71 | 0.13 |
Publisher’s Note: MDPI stays neutral with regard to jurisdictional claims in published maps and institutional affiliations. |
© 2022 by the authors. Licensee MDPI, Basel, Switzerland. This article is an open access article distributed under the terms and conditions of the Creative Commons Attribution (CC BY) license (https://creativecommons.org/licenses/by/4.0/).
Share and Cite
MDPI and ACS Style
Tatineni, Y.S.; Putta, J. Enhanced Strength, Durability, and Microstructural Attributes of Graphene Oxide-Modified Ultrafine Slag Cement Mortar. Buildings 2022, 12, 2199. https://doi.org/10.3390/buildings12122199
AMA Style
Tatineni YS, Putta J. Enhanced Strength, Durability, and Microstructural Attributes of Graphene Oxide-Modified Ultrafine Slag Cement Mortar. Buildings. 2022; 12(12):2199. https://doi.org/10.3390/buildings12122199
Chicago/Turabian StyleTatineni, Yeswanth Sai, and Jagadeesh Putta. 2022. "Enhanced Strength, Durability, and Microstructural Attributes of Graphene Oxide-Modified Ultrafine Slag Cement Mortar" Buildings 12, no. 12: 2199. https://doi.org/10.3390/buildings12122199
Note that from the first issue of 2016, this journal uses article numbers instead of page numbers. See further details here.