
An Analysis of Risk Factors for Emergencies in the Taipei Dome Complex

Criminal Justice Department, Ming Chuan University, Taipei 111013, Taiwan
*
Author to whom correspondence should be addressed.
Buildings 2022, 12(4), 403; https://doi.org/10.3390/buildings12040403
Submission received: 17 February 2022
/
Revised: 16 March 2022
/
Accepted: 23 March 2022
/
Published: 25 March 2022
(This article belongs to the Special Issue Innovative Circular Building Design and Construction)
Abstract
:(1) Background: The Taipei Dome Complex is a composite park with a baseball dome, a shopping mall, restaurants, cinemas, and an office building. Sustainable cities and communities is one of the Sustainable Development Goals of the United Nations. Since it constitutes urban infrastructure, the sports park’s disaster risk management must be discussed. (2) Methods: This study focused on equipment safety, traffic, staffing, potential public risks, security management, and disaster events using an analytic hierarchy process (AHP) to determine the emergency risk factors. (3) Results: The top 14 risk factors for the Taipei Dome Complex’s tolerable risk probability account for almost 70% reliability (a moderate safety); they include insufficient fire facilities, fire, terrorist attack, earthquake, unclear escape or fire facilities signage, shortcomings in evacuation guidance, insufficient police resources, insufficient firefighting resources, MRT emergency, shortcomings in a moving line, hypoxia, insufficient medical personnel, a lack of staff training, and insufficient broadcast facilities. (4) Conclusions: Among the top 14 risk factors, security management ranks first, with a ratio of 80% (4/5), disaster events rank second, with a ratio of 75% (3/4), and staffing ranks third, with a ratio of 60% (3/5).
1. Introduction
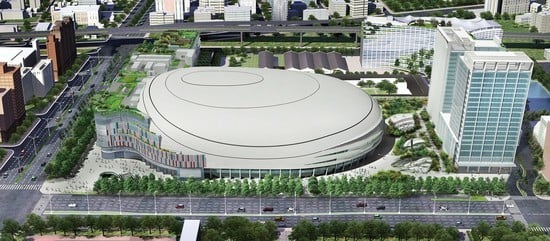
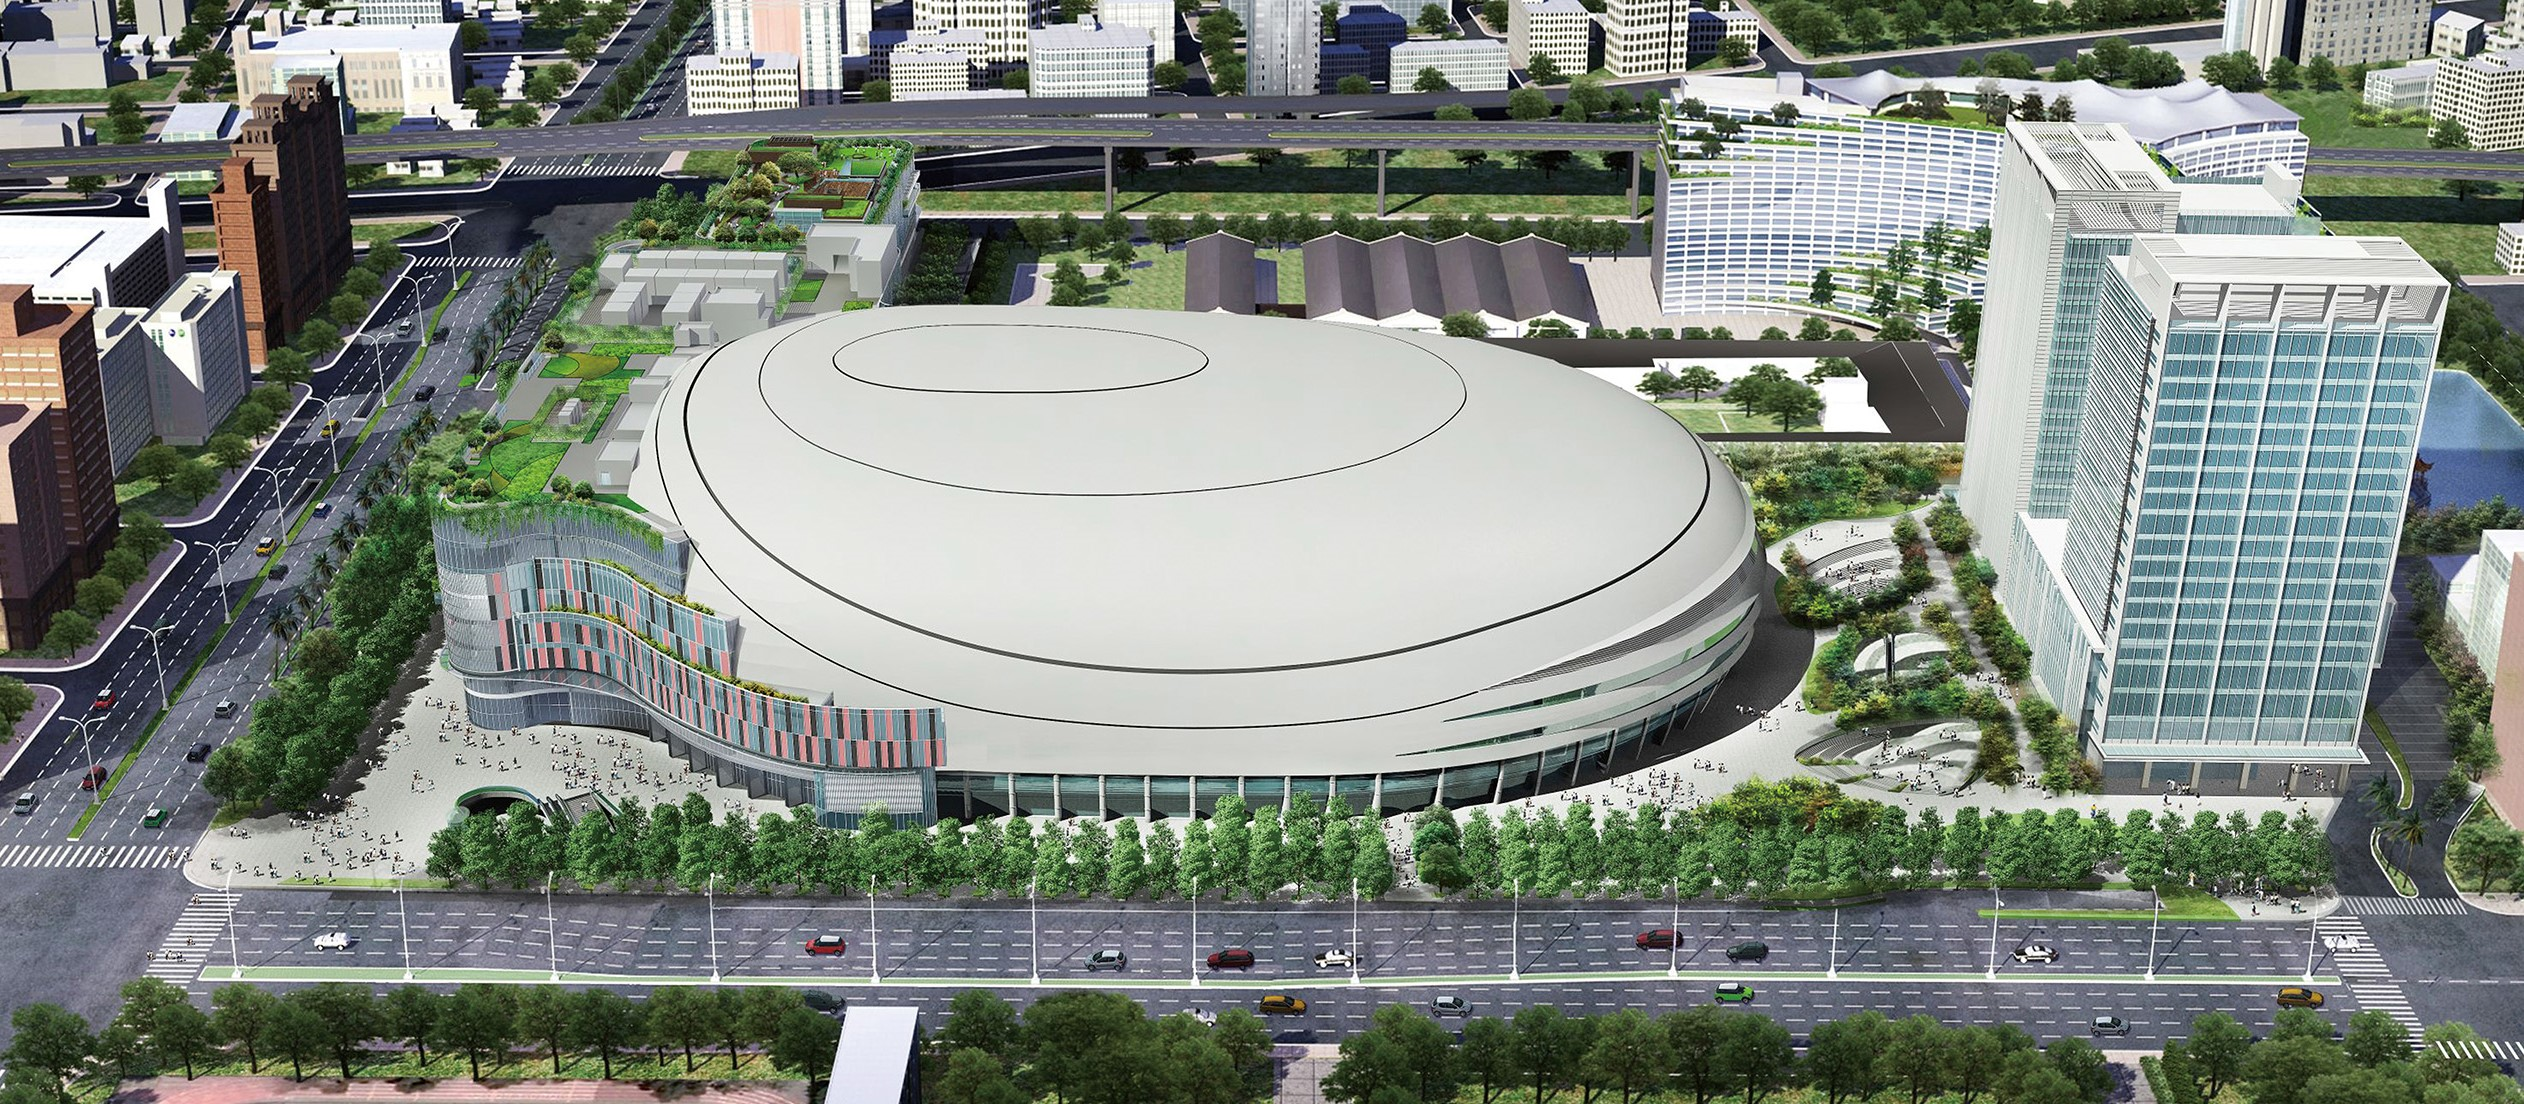
The Taipei Dome Complex is located on the site of the Songshan Tobacco Factory (some areas have been designated as the Songshan Cultural and Creative Park), and is an urban development park that is under construction in Xinyi District, Taipei City, Taiwan. The Taipei Dome Complex is opposite the Sun Yat-Sen Memorial Hall and close to Taipei City Hall, Songshan Cultural and Creative Park, Cathay General Hospital, Zhongxiao Dunhua MRT Station, and City Hall MRT Station (shown in Figure 1 [1]). The Taipei City Government has used the build–operate–transfer (BOT) model to assign the construction and operation of the Taipei Dome Complex to the Farglory Dome Company, which is the largest BOT investment project in Taipei in the past 20 years, costing USD 1.3 billion to construct. The site is a composite park whose main part is a multifunctional dome. It also contains structures such as a shopping mall, restaurants, cinemas, and an office building (shown in Figure 2 [2]). The multifunctional dome meets the standards for an international baseball stadium, so professional baseball tournaments and other sports events can be held there.
On 15 April 2013, at 2:50 p.m. Eastern Time, a terrorist bomb was detonated during the Boston Marathon in Copley Square, Boston, Massachusetts, U.S.A. Two homemade bombs were detonated in the spectator area near the finish line and a sports equipment store, and caused 3 deaths and 183 injuries. On 13 November 2015, a series of terrorist attacks occurred in Paris and neighboring suburbs. Three suicide bombers exploded devices near the Stade de France, followed by bomb attacks and mass shootings in cafes, restaurants, and theaters. The terrorist attack resulted in the deaths of 127 people from 26 countries, as well as more than 300 slight or serious injuries. On 21 August 2017, Taipei, Taiwan hosted the Universiade, and thousands of people protested. Smoke bombs were thrown and the police were attacked, so athletes could not enter the arena.
In the future (2022), a maximum number of 59,833 people will be allowed to enter the Taipei Dome Complex [3]. If an incident that is similar to the Paris terrorist attack occurs, the consequences will be disastrous. This study determines the risk factors for emergencies at the Taipei Dome Complex.
1.1. Studies Involving Terrorist Attacks
1.1.1. Cases Involving Gunshot Wounds and Explosions
Legewie (2013) determined the effects of the Bali terrorist attack (2002) and the Madrid bomb attack (2004) on the perceptions of immigration in 65 regions of 9 European countries, and found that the main influencing factors were regional differences, transnational impact, and the duration of events [4]. Gates et al. (2014) studied the patients who were victims of the Boston Marathon bombing in the United States, and found that sufficient medical preparation, a quick response from support staff, short transportation times, immediate admission to the operating room, integrated nursing care, and luck increased the chance of recovery [5]. Borel et al. (2016) created a management model for patients with large-scale gunshot wounds in the Medical Trauma Center for the Paris terrorist attack (2015), and analyzed the preparation of the operating room, the number of doctors and nurses required, and the time between receiving the notification and the arrival of patients [6].
1.1.2. Study of Terrorism
Sandler (2014) studied the trends of terrorist attacks, the economic consequences of terrorism, the effectiveness of counterterrorism, the causes of terrorism, and the relationship between terrorism and democracies, and noted that future terrorist attack models should use advanced econometrics and spatial econometrics [7]. Saha et al. (2014) found that the negative impact of political instability was greater than the negative impact of terrorism in 139 countries between 1999 and 2009. Terrorism also increases tourism in countries with low and medium levels of political risk, and reduces tourism in countries with high levels of political risk [8]. Holgersson et al. (2016) used Sweden as the subject for a study, and found that providing management training related to terrorism and personal protective equipment increases emergency management personnel’s awareness of terrorism and improves their ability to judge critical situations [9]. Sawalha (2017) garnered the opinions of citizens and studied the effects and possible risks of terrorism in Jordan, showing that the government should formulate policies to reduce terrorism [10]. Kim et al. (2020) noted that targets of terrorist attacks have changed from hardware buildings to software devices and that the mode of attack has evolved from single to multiple, and determined whether these changes affect the number of casualties[11].
1.1.3. The Effect of Technology
Oh et al. (2013) found that although the tweets posted on Twitter can be used to gather information on terrorist attacks, the credibility of such rumors is not clear. In a major crisis, the most important thing is intelligence that does not have a clearly identifiable source, and the second most important thing is personal participation. Fear has no practical advantage, but it is an important factor in the emergence of rumors [12]. Tzezana et al. (2016) showed that Internet of Things technology (IOT) has enabled criminals to engage in criminal behaviors remotely, using hacking, extortion, viruses, spyware, and other technologies to obtain private information from smart devices or to control the device, or to gain economic benefit [13]. Roberts (2019) studied cases such as remotely controlling a car to cause an accident and hacking into a fire alarm system to aid an attack, whereby cyberattacks are a precursor to physical attacks [14].
1.2. Studies That Are Related to Gymnasiums and Stadiums
1.2.1. Risk Detection, Risk Management, and Risk Perception
Lopez-Fernandez et al. (2016) proposed a method to detect risks for Spanish football stadiums, and studied the mandatory safety measures that stadiums took to determine the degree of risk management. The study conducted inspections of six football stadiums, and found that none of the stadiums implemented 100% of the mandatory safety measures [15]. Faraji et al. (2018) found that infrastructure has the greatest impact on security, followed by the personnel management and the control of games. The design and technical specification of sports venues affect the level of safety, and using proper management methods during a game minimizes the risk of riots [16]. Alkhadim et al. (2018) showed that FIST (force, information, space, and time) are the main factors in crowd disasters, and identified a significant relationship between FIST and the perceived security in a large crowded interior space [17].
1.2.2. Evacuation and Guidance of Crowds
Dickie (2015) used a specific research system to show that clarifying the number, location, and width of the evacuation exits decreases the evacuation time for the crowd [18]. Tsiftsis et al. (2016) developed an electronic management system that determines crowd movement through real-time monitoring of crowds to prevent congestion at exits. Their system quickly determines the routes for movement of personnel, and identifies all possible alternative escape routes [19]. Li et al. (2020) used the London Olympics as the subject of study, and found that some types of ladders in the venue interfered with evacuation [20].
1.2.3. Culture of Stadiums
Delgado et al. (2018) investigated violent arguments and violent behaviors in the grandstand area during football matches. The negative atmosphere is mainly caused by verbal violence, which is usually accompanied by gestures [21]. Cavaiani (2020) noted that gymnasiums have become venues for debate to demonstrate and convey social justice [22].
1.2.4. Architectural Design of Stadiums
Zargar et al. (2019) noted that software plugins (e.g., Grasshopper/Rhinoceros) can be used to adjust architectural design, structural design, and evacuation routes, as well as to reduce energy consumption and calculate the best viewing angle in the auditorium [23]. Chen et al. (2019) found that omnidirectional auditoriums, two-sided auditoriums, and three-sided auditoriums have different levels of ventilation. A stadium with an omnidirectional auditorium must intake air at an angle of 75 degrees to 90 degrees, while stadiums with a two-sided auditorium must intake air at an angle of 60 degrees to 90 degrees [24]. Bianconi et al. (2020) compared various constructions to analyze gymnasium design, and noted that parametric architecture could be used to integrate new construction regulations into national and international standards [25]. Karakopru et al. (2020) found that capacity, construction cost, distance, and accessibility are the four main factors for site selection and the construction of gymnasiums [26].
1.2.5. Landscape Design for Stadiums
Bicer (2016) [27], Xu (2020) [28], and Dong et al. (2020) [29] noted that an ecological design decreases energy consumption. Ecological elements include the building structure and rainwater treatment systems. The studies included large-scale physical sites in Turkey, China, and South Korea.
These three studies found that ecological design reduces energy consumption for large-scale sports venues, and that this type of building planning model creates a circular economy.
2. Materials and Methods
2.1. The Disputes of the Subject
The Taipei Dome Complex is a compound park that is currently under development. It contains a multifunctional dome, a shopping mall, restaurants, cinemas, and office buildings. Construction was suspended by the Taipei City Government in 2016 for the following reasons:
- 1.
- The suspension was caused by political issues. The new governing political party that controlled the municipal government did not trust the construction team (Farglory Dome Company);
- 2.
- The public safety standards for the dome complied with Taiwan’s earthquake resistance regulations, criteria for flame-retardant testing, and the building coverage ratio and floor space index–floor area ratio standards of the Construction and Planning Agency. In a broad sense, meeting the building coverage ratio and floor space index–floor area ratio standards of the Construction and Planning Agency is in line with the requirements for the prevention of an urban disaster, but the Taipei municipal government uses the simulation standard for disaster prevention and mitigation for the Japan Dome as a standard. The municipal government uses “Sim Tread” (jointly developed by A&A Co., University of Waseda, and Takenaka Corporation; Japan), which is a Japanese software program that verifies fire and evacuation performance, as opposed to “EXODUS” (developed by the Fire Safety Engineering Group, University of Greenwich, London, UK) or “Simulex” (developed by the University of Edinburgh, Scotland, UK, and later transferred to the Integrated Environmental Solutions Ltd., Glasgow, Scotland, UK), which are certified by Taiwan’s central authority. Therefore, the generated report and computer simulation do not meet the official requirements. The municipal government cannot order the construction company to suspend construction based on the results of these two safety inspections;
- 3.
- The seven public safety standards that were proposed by the city government violate Article 8, Article 15, Article 22, Article 23, and Article 24 of the Constitution; Article 150 of the Civil Law; Article 19 and Article 20 of the Fire Protection Law; Article 7 of the Key Points of Fire Command and Rescue Operations Directions of Fire Departments; and Items 5 and 6 of the Taipei City Fire Precaution Zone Delimitation and Precautionary Code of Practice.
The Taipei City Government later revised the public safety examination standards for the Taipei Dome Complex and reduced the standard for the capacity of the stadium (the original plan would have accommodated 140,000 people, but this was reduced to 59,833 people [3]), and announced the resumption of construction work in August 2020.
Because of previous questions about emergency evacuation safety factors, this study determined the risk factors for possible emergencies for the Taipei Dome Complex in order to enable better control and management of safety.
2.2. Risk Assessment Indicators
The Operation Manual of Risk Management and Crisis Handling of the Executive Yuan of the Republic of China [30] classifies a site as low-danger if it can take 80–100% risk, moderate-danger if it can take 60–79% risk; and high-danger if it can take less than 59% risk (as shown in Table 1).
If the risk factors with 70% cumulative weight can be controlled, this is equivalent to 70% reliability, which can reduce the occurrence of disaster events and emergencies.
This study uses the reliability of 70% (moderate danger) as the analysis indicator based on the cost vs. the benefit. By constructing the analytic hierarchy process (AHP) model of potential emergency risk factors of the Taipei Dome Complex, we used the professional experience of experts and scholars to determine the ranking of all risk factors. In the case of limited time and funds, the priority is to control the key factors, so we thoroughly arranged the weights of the 30 risk factors, finding that they fall within a cumulative weighting of 70% as the key factors.
2.3. Analytic Hierarchy Process (AHP)
2.3.1. Introduction to the AHP
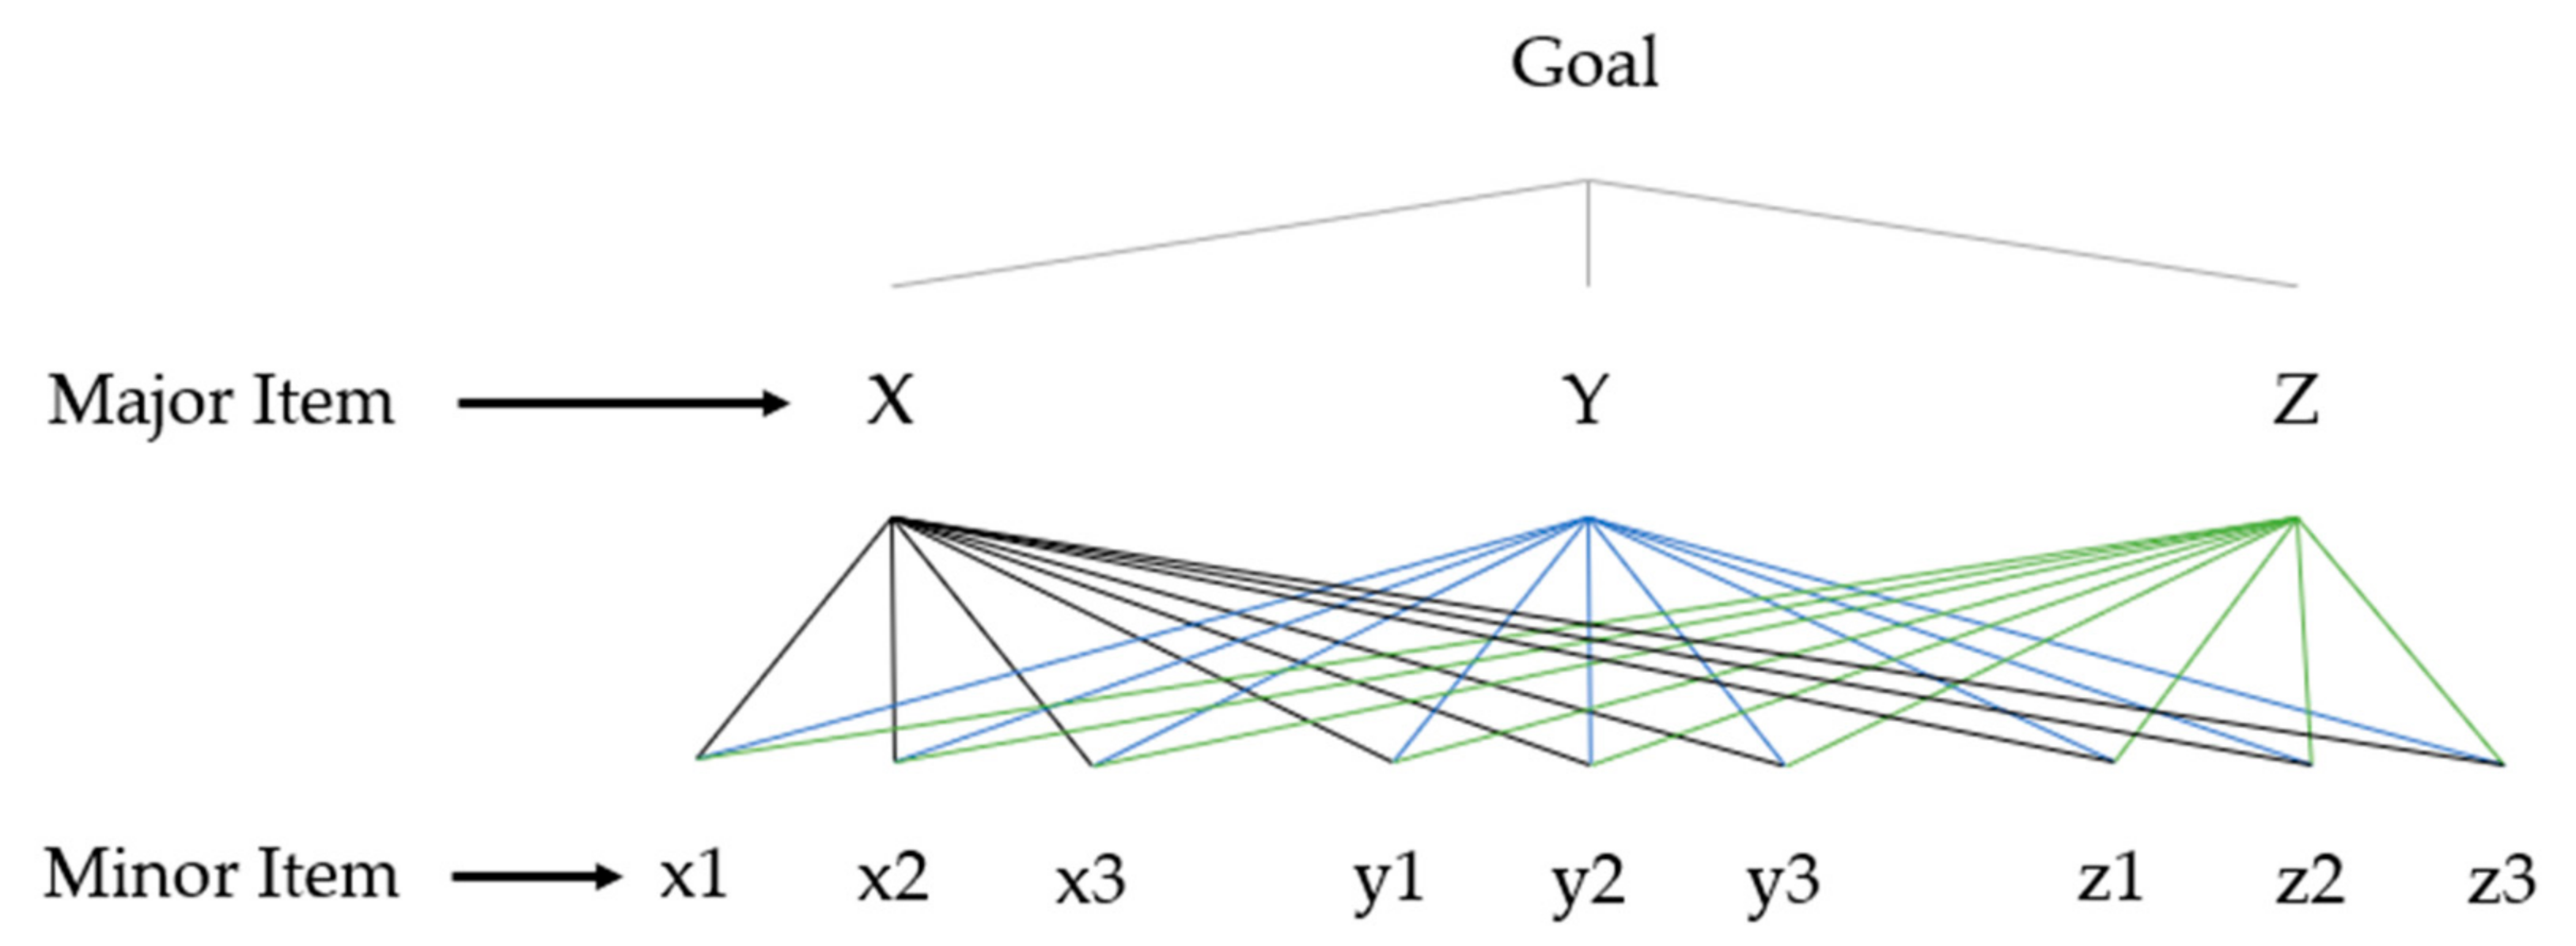
The analytic hierarchy process (AHP) is a decision-making model that was developed in 1971 by Professor Saaty of the Wharton School, University of Pennsylvania. The theory simplifies complex decision-making problems into clear hierarchical systems, integrates the opinions of scholars and decision makers through pairwise comparisons (shown in Figure 3 and Figure 4), and determines the appropriate decision based on the order of weight (shown in Table 2) [31,32].
Based on a literature review (1.1 and 1.2) and expert symposium construction, this study used emergency risk factors that included 6 major items (equipment safety, traffic, staffing, potential public risks, security management, and disaster events) and 30 minor items for the AHP model. AHP questionnaires were distributed to 25 experts from the National Security Bureau, the National Fire Agency, the National Police Agency, and safety management scholars, and 20 questionnaires were recovered. The respondents filled out the questionnaire by judging the influence of risk factors on the Taipei Dome Complex. The questionnaire also explains the impact of each factor. We inputted questionnaire results into the Expert Choice 11.0 software (shown in Figure 5 and Figure 6) [33] to calculate weighted values for factors and to verify the consistency to confirm the consistency index (C.I.) < 0.1, ensuring that the questionnaire results were valid.
2.3.2. Application of AHP
To simulate decisions to introduce innovations into air transport systems, Beauchamp-Akatova et al. (2013) combined the analytic hierarchy process (AHP) and analytic network process (ANP) models to evaluate implications for safety and operations due to commercial choices. Through simulated situations, the detection and handling of unknown risks create an integrated picture of system risks [34]. In the construction industry, Iqbal et al. (2015) showed that the most significant risks must be managed with greater effort to reduce/eliminate their effects on the project [35]. Chou et al. (2021) used the analytic hierarchy process (AHP) questionnaire to identify and rank critical risk factors to help engineers with risk management in river dredging projects [36]. Islam et al. (2017) presented a risk management framework that allows users to identify risks based on the relative importance of the migration goals, and analyzed the risks via a semi-quantitative approach to support users with cloud migration decisions [37]. In a study of urban restoration and urban sustainability, Banica et al. (2017) used an analytic hierarchy process to pre-assess the seismic vulnerability of Iasi—one of the major cities of Romania—as a prerequisite for the implementation of preventive measures [38]. To assess the effect of a natural disaster, Nowogonska (2020) used an Analytic Hierarchy Process for which the priority items were set to determine the rehabilitation requirements for buildings [39].
It can be seen that the purpose of experts’/decision makers’ use of the AHP in various fields is to identify key risks from many factors and to facilitate subsequent risk management decisions by arranging them by criticality/importance. Therefore, our research uses the AHP to “identify” the risks of emergencies that affect the reliability of the park, so that the subsequent operators can effectively allocate human resources, materials, and funds in safety management, and maintain the safety of the Taipei Dome Complex at a moderate level by managing 70% of risks [30]. It is our hope that the results of our research can be used as a reference for the management of Taipei Arena and the disaster prevention planning of the Taipei City Government.
3. Results
3.1. Factors of Minor Items of Deficiency
Based on the analysis using the Expert Choice 11.0 software, the weight analysis results for 6 major items (equipment safety, traffic, staffing, potential public risks, security management, and disaster events) and 30 minor items are as follows; risk factors that are not less than 70% of the cumulative weight are not discussed:
- 1.
- In Table 3, in terms of equipment safety, fire facilities are the highest risk factor, accounting for 42% of the risk, and are ranked first out of all of the risk factors. Insufficient broadcast facilities and poorly maintained machinery are the second highest risk factor, accounting for almost 13%. Statistics show that fire facilities are the risk factor that experts deem the most important, so fire facilities in the park must be inspected regularly;
- 2.
- As shown in Table 4, in terms of traffic, MRT emergency is the highest risk factor, accounting for 45% of the risk, and is ranked ninth out of all risk factors. The remaining factors account for about 10%~12%. The statistics show that accidents at the MRT stations near the park may affect traffic flow around the park;
- 3.
- Table 5 shows that, in terms of staffing, insufficient police is the highest risk factor, accounting for 27.7% of the risk. Insufficient firefighting is the second highest risk factor, accounting for 24.5%. Insufficient medical personnel is the third highest risk factor, accounting for 21.2%. The statistics show that in response to emergencies, in addition to the supply and maintenance of hardware equipment, the immediate dispatch of human resources is also crucial;
- 4.
- As shown in Table 6, in terms of potential public risks, hypoxia is the highest risk factor, accounting for 36% of the risk. Statistics show that the medical stations in the park must retain a specific amount of oxygen supply equipment;
- 5.
- In Table 7, in terms of security management, unclear escape or fire facilities signage is shown to be the highest risk factor, accounting for 26.9% of the risk, and ranking fifth of the overall risk factors. Shortcomings in evacuation guidance are the second highest risk factor, accounting for 23%, and ranking sixth out of all of the risk factors. Shortcomings in moving lines are the third highest risk factor, accounting for 19%, and ranking 10th out of all of the risk factors. Lack of staff training is the fourth highest risk factor, accounting for 17%, and ranking 13th out of all of the risk factors. Statistics show that security management has a significant effect on the security of the entire park, so planning must be perfect;
- 6.
- Table 8 shows that, in terms of disaster events, fire disaster events are the highest risk factor, accounting for nearly 34.5%, and ranking second out of all risk factors. Terrorist attack disaster events are the second highest risk factor, accounting for 33%, and ranking third out of all risk factors. Earthquake disaster events are the third highest risk factor, accounting for 21%, and ranking 10th out of all risk factors. The statistics show that the prevention and response measures for disaster events are very important.
3.2. Accumulated Values for Risk Factors
Figure 7 shows that the top 14 risk factors mainly involve security management (4/5), staffing (3/5), and disaster events (3/4). To improve the safety of the Taipei Dome Complex, relevant operating procedures or countermeasures should be formulated according to the 14 risk factors listed in Table 9 (insufficient fire facilities, fire, terrorist attack, earthquakes, unclear escape or fire facilities signage, shortcomings in evacuation guidance, insufficient police, insufficient firefighting, MRT emergency, shortcomings in a moving line, hypoxia, insufficient medical personnel, a lack of staff training, and insufficient broadcast facilities). The Taipei Dome Complex must also conduct training and drills for three types of disaster events (fire, terrorist attacks, and earthquakes) in order to increase the knowledge and experience of staff, significantly decrease the response time, and increase the efficiency of the response. In terms of equipment safety, there are only two factors (insufficient fire facilities and insufficient broadcast facilities) that rank in the top 14 risk factors, but the weight value for insufficient fire facilities ranks first of the overall risk factors. Therefore, equipment safety must also be prioritized for supervision.
4. Conclusions and Discussion
- 1.
- Xinyi District of Taipei City is the financial center of Taiwan, with the highest housing prices. Covering an area of 11 square kilometers, the total population is about 420,000. The Taipei Dome Complex in Xinyi District covers 0.18 square kilometers. It will eventually open to accommodate 140,000 people, with a high density of people. Costing USD 1.3 billion to construct, it is the largest BOT investment project in Taipei in the past 20 years. There are also the Taipei City Government, department stores, and Sun Yat-Sen Memorial Hall in the surrounding area. If an emergency occurs, it will cause a lot of casualties and impacts. Therefore, this study selects the Taipei Dome Complex, which has not yet opened for business, as the research target. If the Taipei City Government can make a checklist based on the risk factors we have drawn up for inspection, it will be able to control large-scale disasters, allowing citizens and tourists to have a safe environment for both software and hardware;
- 2.
- According to the provisions of the Operation Manual of Risk Management and Crisis Handling of the Executive Yuan of the Republic of China, a site is classified as a low-danger site if it can take 60–79% of the risk. This study uses 70% as the benchmark, and ranks the top 14 risk factors as insufficient fire facilities, fire, terrorist attack, earthquake, unclear escape or fire facilities signage, shortcomings in evacuation guidance, insufficient police, insufficient firefighting, MRT emergency, shortcomings in a moving line, hypoxia, insufficient medical personnel, lack of staff training, and insufficient broadcast facilities. These risk factors are the most important, and must be addressed first;
- 3.
- The results show that the weight value for disaster events is 0.246859, and ranks first. The weight value for equipment safety is 0.213415, ranking second. The weight value for security management is 0.191788, ranking third. Out of the 14 factors that are minor items, security management ranks first, with a ratio of 80% (4/5), disaster events rank second, with a ratio of 75% (3/4), and staffing ranks third, with a ratio of 60% (3/5);
- 4.
- To increase safety at the Taipei Dome Complex, the measures applied for Disneyland in Japan are relevant. In terms of plans for emergency events (e.g., fire, terrorist attack, and earthquake), subregional drills should be performed every two days, along with a large-scale drill every month, and education and training must be provided, including a manual for drills (the manual must include the SOPs for determining the severity of risks/hazards, initiating response mechanisms, reporting incidents, evacuation and emergency procedures, and reporting on-site situations). Firefighting equipment must also be tested every two weeks to ensure its safety and reliability;
- 5.
- The following plans are necessary to prevent terrorist attacks at large-scale sporting events or concerts: From two hours before activities start until one hour after activities end, tour buses and large transport vehicles must not enter the park, so as to avoid collisions with the crowd; X-ray machines must be installed at every entrance to the dome in order to detect dangerous goods; 12 h before the activities start, the computer room, disabled toilets, parking lots, and other places that are difficult to observe must be regularly monitored to prevent the use of explosives or dangerous accidents, and improved measures to identify staff members are necessary in order to prevent suspicious persons from entering the regulated area;
- 6.
- The government should designate hospitals for gunshot victims for mass emergency medical care.
Author Contributions
Conceptualization, C.-J.H.; methodology, C.-J.H.; software, C.-J.H. and T.-Y.C.; formal analysis, T.-Y.C.; resources, C.-J.H.; data curation, T.-Y.C.; writing—original draft preparation, T.-Y.C.; writing—review and editing, C.-J.H.; visualization, T.-Y.C.; supervision, C.-J.H.; project administration, C.-J.H. All authors have read and agreed to the published version of the manuscript.
Funding
This research received no external funding.
Institutional Review Board Statement
Not applicable.
Informed Consent Statement
Not applicable.
Data Availability Statement
All data, models or code that support the findings of this study are available from the corresponding author upon reasonable request.
Conflicts of Interest
The authors declare no conflict of interest.
References
- Street View of the Taipei Dome Complex, Google Maps. 2022. Available online: https://www.google.com.tw/maps/place/%E9%81%A0%E9%9B%84%E5%B7%A8%E8%9B%8B%E4%BA%8B%E6%A5%AD%E8%82%A1%E4%BB%BD%E6%9C%89%E9%99%90%E5%85%AC%E5%8F%B8/@25.041062,121.5596025,2031m/data=!3m1!1e3!4m5!3m4!1s0x3442abb89a7d8329:0x24bdcede4413a4aa!8m2!3d25.041478!4d121.5615909?hl=zh-TW (accessed on 24 January 2022).
- Taipei City Urban Design and Land Use Development Permit Review Committee, 433rd Committee Meeting Document. Available online: https://perma.cc/B3NZ-JTE2 (accessed on 24 January 2022).
- Taipei City Council Bulletin, Vol. 115, Issue 10, Page 1266. Available online: https://perma.cc/Z5VG-UNAH (accessed on 24 January 2022).
- Legewie, J. Terrorist Events and Attitudes toward Immigrants: A Natural Experiment. Am. J. Sociol. 2013, 118, 1199–1245. [Google Scholar] [CrossRef] [Green Version]
- Gates, J.D.; Arabian, S.; Biddinger, P.; Blansfield, J.; Burke, P.; Chung, S.; Fischer, J.; Friedman, F.; Gervasini, A.; Goralnick, E.; et al. The Initial Response to the Boston Marathon Bombing Lessons Learned to Prepare for the Next Disaster. Ann. Surg. 2014, 260, 960–966. [Google Scholar] [CrossRef] [PubMed] [Green Version]
- Borel, M.; Le Sache, F.; Pariente, D.; Castro, S.; Delay, M.; Bouhaddou, A.; Nion, N.; Hausfater, P.; Raux, M. Feedback on Terrorist Attacks on November 13, 2015. Mass Casualty Management in Trauma center. Ann. Fr. Med. Urgence 2016, 6, 22–30. [Google Scholar] [CrossRef] [Green Version]
- Sandler, T. The analytical study of terrorism: Taking stock. J. Peace Res. 2014, 51, 257–271. [Google Scholar] [CrossRef]
- Saha, S.; Yap, G. The Moderation Effects of Political Instability and Terrorism on Tourism Development: A Cross-Country Panel Analysis. J. Travel Res. 2014, 53, 509–521. [Google Scholar] [CrossRef]
- Holgersson, A.; Bjornstig, U.; Sahovic, D.; Saveman, B.I. Factors influencing responders’ perceptions of preparedness for terrorism. Disaster Prev. Manag. 2016, 25, 520–533. [Google Scholar] [CrossRef]
- Sawalha, I.H. A context-centred, root cause analysis of contemporary terrorism. Disaster Prev. Manag. 2017, 26, 183–202. [Google Scholar] [CrossRef]
- Kim, T.; Jeong, S.; Lee, J. Factors of Mass Casualty Terrorism. Secur. J. 2022, 35, 133–153. [Google Scholar] [CrossRef]
- Oh, O.; Agrawal, M.; Rao, H.R. Community Intelligence and Social Media Services: A Rumor Theoretic Analysis of Tweets During Social Crises. MIS Q. 2013, 37, 407–426. [Google Scholar] [CrossRef]
- Tzezana, R. Scenarios for crime and terrorist attacks using the internet of things. Eur. J. Futures Res. 2016, 4, 18. [Google Scholar] [CrossRef] [Green Version]
- Roberts, F.S. From Football to Oil Rigs: Risk Assessment for Combined Cyber and Physical Attacks. J. Benefit-Cost Anal. 2019, 10, 251–273. [Google Scholar] [CrossRef] [Green Version]
- López-Fernández, J.; García-Unanue, J.; Felipe, J.L.; Burillo, P.; Sánchez-Sánchez, J.; Gallardo, L. Analysis of obligatory measures against anthropic risks in spanish football stadiums. Sport TK-Revista Euroam. Cienc Deport. 2016, 5, 145–153. [Google Scholar] [CrossRef] [Green Version]
- Faraji, R.; Hemmatinezhad, M.; Taylor, T. Critical Factors Affecting Stadiums Security. J. Appl. Secur. Res. 2018, 13, 473–488. [Google Scholar] [CrossRef]
- Alkhadim, M.; Gidado, K.; Painting, N. Risk management: The effect of FIST on perceived safety in crowded large space buildings. Saf. Sci. 2018, 108, 29–38. [Google Scholar] [CrossRef]
- Dickie, J.F. Risks identified with temporary grandstands. Proc. Inst. Civ. Eng.-Forensic Eng. 2015, 168, 25–40. [Google Scholar] [CrossRef]
- Tsiftsis, A.; Georgoudas, I.G.; Sirakoulis, G.C. Real Data Evaluation of a Crowd Supervising System for Stadium Evacuation and Its Hardware Implementation. IEEE Syst. J. 2016, 10, 649–660. [Google Scholar] [CrossRef]
- Li, F.; Zhang, Y.F.; Zhang, H.L.; Ma, Y.Y. Modelling Multi-Exit Large-Venue Pedestrian Evacuation With Dual-Strategy Adaptive Particle Swarm Optimization. IEEE Access 2020, 8, 114554–114569. [Google Scholar] [CrossRef]
- Delgado, A.A.; Gomez, G.E.A. Manifestations of violence in the football stadium: The case of Granada Football Club. Cult. Cienc. Y Deporte 2018, 13, 231–242. [Google Scholar] [CrossRef] [Green Version]
- Cavaiani, A.C. Rhetoric, Materiality, and the Disruption of Meaning: The Stadium as a Place of Protest. Commun. Sport 2020, 8, 473–488. [Google Scholar] [CrossRef]
- Zargar, S.H.; Alaghmandan, M. CORAL: Introducing a fully computational plug-in for stadium design and optimization; a case study of finding optimal spectators’ viewing angle. Archit. Sci. Rev. 2019, 62, 160–170. [Google Scholar] [CrossRef]
- Chen, L.; Li, Y. Effects of different auditorium forms on ventilation in a football stadium. Indoor Built Environ. 2019, 29, 1070–1086. [Google Scholar] [CrossRef]
- Bianconi, F.; Filippucci, M.; Buffi, A.; Vitali, L. Morphological and visual optimization in stadium design: A digital reinterpretation of Luigi Moretti’s stadiums. Archit. Sci. Rev. 2020, 63, 194–209. [Google Scholar] [CrossRef]
- Karakopru, U.O.; Kabadurmus, O. Evaluation of Stadium Locations Using AHP and TOPSIS Methods. Eskiseh. Osman. Univ. Iibf Derg. -Eskiseh. Osman. Univ. J. Econ. Adm. Sci. 2020, 15, 1–16. [Google Scholar]
- Bicer, Z.O.P. Assessing the economic contribution of ecological architecture case study: Kayseri Kadir has stadium. Open House Int. 2016, 41, 107–111. [Google Scholar] [CrossRef]
- Xu, H.Z. Environmental Optimization Design of Rainwater Utilization System in Large Sports Venues under the Influence of Ocean Climate. J. Coast. Res. 2020, 104, 887–890. [Google Scholar] [CrossRef]
- Dong, Y.; Qin, T.; Zhou, S.; Huang, L.; Bo, R.; Guo, H.; Yin, X. Comparative Whole Building Life Cycle Assessment of Energy Saving and Carbon Reduction Performance of Reinforced Concrete and Timber Stadiums-A Case Study in China. Sustainability 2020, 12, 1566. [Google Scholar] [CrossRef] [Green Version]
- Research, Development and Evaluation Commission, Executive Yuan. Operation Manual of Risk Management and Crisis Handling of the Executive Yuan of the Republic of China; Research, Development and Evaluation Commission, Executive Yuan: Taipei, Taiwan, 2009; p. 33. [Google Scholar]
- Hsu, P.F.; Wu, C.R.; Li, Z.R. Optimizing Resource-Based Allocation for Senior Citizen Housing to Ensure a Competitive Advantage Using the Analytic Hierarchy Process. Build. Environ. 2008, 43, 90–97. [Google Scholar] [CrossRef]
- Tavares, R.M.; Tavares, J.L.; Parry-Jonesc, S.L. Parry-Jones The Use of a Mathematical Multicriteria Decision-Making Model for Selecting the Fire Origin Room. Build. Environ. 2008, 43, 2090–2100. [Google Scholar] [CrossRef]
- Thomas, L. Saaty. In Expert Choice 11.0; University of Pennsylvania: Philadelphia, PA, USA, 2020. [Google Scholar]
- Beauchamp-Akatova, E.; Curran, R. From initial risk assessments to system risk management. J. Model. Manag. 2013, 8, 262–289. [Google Scholar] [CrossRef]
- Iqbal, S.; Choudhry, R.M.; Holschemacher, K.; Ali, A.; Tamosaitiene, J. Risk management in construction projects. Technol. Econ. Dev. Econ. 2015, 21, 65–78. [Google Scholar] [CrossRef]
- Chou, J.S.; Chiu, Y.C. Identifying critical risk factors and responses of river dredging projects for knowledge management within organisation. J. Flood Risk Manag. 2021, 14, e12690. [Google Scholar] [CrossRef]
- Islam, S.; Fenz, S.; Weippl, E.; Mouratidis, H. A Risk Management Framework for Cloud Migration Decision Support. J. Risk Financ. Manag. 2017, 10, 10. [Google Scholar] [CrossRef] [Green Version]
- Banica, A.; Rosu, L.; Muntele, I.; Grozavu, A. Towards Urban Resilience: A Multi-Criteria Analysis of Seismic Vulnerability in Iasi City (Romania). Sustainability 2017, 9, 270. [Google Scholar] [CrossRef] [Green Version]
- Nowogonska, B. A Methodology for Determining the Rehabilitation Needs of Buildings. Appl. Sci. 2020, 10, 3873. [Google Scholar] [CrossRef]
Figure 1.
Geographical location.

Figure 2.
Distribution of venues.

Figure 3.
Pairwise comparison schematic diagram.

Figure 4.
Part of the AHP questionnaire for the study.

Figure 5.
Expert Choice 11.0 user interface.

Figure 6.
Expert Choice 11.0 numerical input interface.

Figure 7.
Hierarchical structure.


Table 1.
Tolerable risk level.
| Risk Level | Reliability | Tolerance |
|---|---|---|
| Low Danger | 80%~100% | Negligible |
| Moderate Danger | 60%~79% | Acceptable |
| High Danger | Below 59% | Unacceptable, Review |
Table 2.
Analytic hierarchy structure weighting schematic diagram.
| Major Item | Weighting Value of Major Item (Sum = 1) | Minor Item | Weighting Value of Minor Item (Sum = 1) | Overall Weighting Value (Sum = 1) |
|---|---|---|---|---|
| X | WX | x1 | W x1 | WX × W x1 |
| x2 | W x2 | WX × W x2 | ||
| x3 | W x3 | WX × W x3 | ||
| Y | WY | y1 | W y1 | WY × W y1 |
| y2 | W y2 | WY × W y2 | ||
| y3 | W y3 | WY × W y3 | ||
| Z | WZ | z1 | W z1 | WZ × W z1 |
| z2 | W z2 | WZ × W z2 | ||
| z3 | W z3 | WZ × W z3 |
Table 3.
Weighting values for equipment safety.
| Major Item (Aspect) | Factor of Minor Item of Deficiency | Weighting Value of Minor Item (Sum = 1) | Importance Ranking |
|---|---|---|---|
| Equipment Safety (0.213415) | Insufficient Fire Facilities | 0.422358 | 1 |
| Incomplete Barrier-Free Facilities | 0.109634 | 20 | |
| Poorly Maintained Machinery | 0.129002 | 15 | |
| Insufficient Surveillance Facilities | 0.107664 | 21 | |
| Insufficient Cyber Security | 0.101935 | 22 | |
| Insufficient Broadcast Facilities | 0.129386 | 14 |
Table 4.
Weighting values for the effects of traffic.
| Major Item (Aspect) | Factor of Minor Item of Deficiency | Weighting Value of Minor Item (Sum = 1) | Importance Ranking |
|---|---|---|---|
| Traffic (0.084573) | MRT Emergency | 0.452228 | 9 |
| Bus Emergency | 0.178444 | 26 | |
| Intercity Bus Emergency | 0.168582 | 27 | |
| Tour Bus Emergency | 0.200745 | 23 |
Table 5.
Weighting values for staffing.
| Major Item (Aspect) | Factor of Minor Item of Deficiency | Weighting Value of Minor Item (Sum = 1) | Importance Ranking |
|---|---|---|---|
| Staffing (0.158168) | Insufficient Firefighting | 0.245351 | 8 |
| Insufficient Police | 0.276512 | 7 | |
| Insufficient Security Officers | 0.098728 | 24 | |
| Insufficient Medical Personnel | 0.212398 | 12 | |
| Insufficient Staff Members | 0.167011 | 17 |
Table 6.
Weighting values for potential public risks.
| Major Item (Aspect) | Factor of Minor Item of Deficiency | Weighting Value of Minor Item (Sum = 1) | Importance Ranking |
|---|---|---|---|
| Potential Public Risks (0.105197) | Hypoxia | 0. 35898 | 11 |
| Fall Injuries | 0.102243 | 28 | |
| Lost People | 0.077539 | 29 | |
| Trampling | 0.147494 | 25 | |
| Acute Physiological Diseases | 0.253351 | 16 | |
| Lost Items | 0.060397 | 30 |
Table 7.
Weighting values for security management.
| Major Item (Aspect) | Factor of Minor Item of Deficiency | Weighting Value of Minor Item (Sum = 1) | Importance Ranking |
|---|---|---|---|
| Security Management (0.191788) | Shortcomings in a Moving Line | 0.198568 | 10 |
| Shortcomings in Evacuation Guidance | 0.233896 | 6 | |
| Unclear Escape or Fire Facilities Signage | 0.269301 | 5 | |
| Lack of Situational Exercise | 0.125533 | 19 | |
| Lack of Staff Training | 0.172702 | 13 |
Table 8.
Weighting values for the effects of disaster events.
| Major Item (Aspect) | Factor of Minor Item of Deficiency | Weighting Value of Minor Item (Sum = 1) | Importance Ranking |
|---|---|---|---|
| Disaster Events (0.246859) | Earthquake | 0.215033 | 4 |
| Fire | 0.34475 | 2 | |
| Terrorist Attack | 0.333474 | 3 | |
| Demonstration or Protest Event | 0.106744 | 18 |
Table 9.
Accumulated values for risk factors.
| Order | Risk Factor | Overall Weighting Value (Sum = 1) | Accumulated Value |
|---|---|---|---|
| 1 | Insufficient Fire Facilities | 0.090138 | 0.090138 |
| 2 | Fire | 0.085105 | 0.175243 |
| 3 | Terrorist Attack | 0.082321 | 0.257564 |
| 4 | Earthquake | 0.053083 | 0.310647 |
| 5 | Unclear Escape or Fire Facilities Signage | 0.051649 | 0.362296 |
| 6 | Shortcomings in Evacuation Guidance | 0.044859 | 0.407155 |
| 7 | Insufficient Police | 0.043735 | 0.45089 |
| 8 | Insufficient Firefighting | 0.038807 | 0.489697 |
| 9 | MRT Emergency | 0.038246 | 0.527943 |
| 10 | Shortcomings in a Moving Line | 0.038083 | 0.566026 |
| 11 | Hypoxia | 0.037763 | 0.603789 |
| 12 | Insufficient Medical Personnel | 0.033595 | 0.637384 |
| 13 | Lack of Staff Training | 0.033122 | 0.670506 |
| 14 | Insufficient Broadcast Facilities | 0.027613 | 0.698119 |
| 15 | Poorly Maintained Machinery | 0.027535 | 0.725654 |
| 16 | Acute Physiological Diseases | 0.026652 | 0.752306 |
| 17 | Insufficient Staff Members | 0.026416 | 0.778722 |
| 18 | Demonstration or Protest Event | 0.026351 | 0.805073 |
| 19 | Lack of Situational Exercise | 0.024076 | 0.829149 |
| 20 | Incomplete Barrier-Free Facilities | 0.023397 | 0.852546 |
| 21 | Insufficient Surveillance Facilities | 0.022977 | 0.875523 |
| 22 | Insufficient Cyber Security | 0.021755 | 0.897278 |
| 23 | Tour Bus Emergency | 0.016978 | 0.914256 |
| 24 | Insufficient Security Officers | 0.015616 | 0.929872 |
| 25 | Trampling | 0.015516 | 0.945388 |
| 26 | Bus Emergency | 0.015092 | 0.96048 |
| 27 | Intercity Bus Emergency | 0.014258 | 0.974738 |
| 28 | Fall Injuries | 0.010756 | 0.985494 |
| 29 | Lost People | 0.008157 | 0.993651 |
| 30 | Lost Items | 0.006353 | 1 |
Publisher’s Note: MDPI stays neutral with regard to jurisdictional claims in published maps and institutional affiliations. |
© 2022 by the authors. Licensee MDPI, Basel, Switzerland. This article is an open access article distributed under the terms and conditions of the Creative Commons Attribution (CC BY) license (https://creativecommons.org/licenses/by/4.0/).
Share and Cite
MDPI and ACS Style
Huang, C.-J.; Chiang, T.-Y. An Analysis of Risk Factors for Emergencies in the Taipei Dome Complex. Buildings 2022, 12, 403. https://doi.org/10.3390/buildings12040403
AMA Style
Huang C-J, Chiang T-Y. An Analysis of Risk Factors for Emergencies in the Taipei Dome Complex. Buildings. 2022; 12(4):403. https://doi.org/10.3390/buildings12040403
Chicago/Turabian StyleHuang, Chi-Jan, and Ting-Yi Chiang. 2022. "An Analysis of Risk Factors for Emergencies in the Taipei Dome Complex" Buildings 12, no. 4: 403. https://doi.org/10.3390/buildings12040403
Note that from the first issue of 2016, this journal uses article numbers instead of page numbers. See further details here.