Article

Flexural Behavior of Reinforced Concrete Beams under Instantaneous Loading: Effects of Recycled Ceramic as Cement and Aggregates Replacement

by
Mostafa Samadi
1,
Mohammad Hajmohammadian Baghban
2,*,
Ziyad Kubba
3,
Iman Faridmehr
4,
Nor Hasanah Abdul Shukor Lim
1,
Omrane Benjeddou
5,
Nur Farhayu Binti Ariffin
6 and
Ghasan Fahim Huseien
7,*
1
UTM Construction Research Center, Universiti Teknologi Malaysia, Skudai 81310, Malaysia
2
Department of Manufacturing and Civil Engineering, Norwegian University of Science and Technology (NTNU), 2815 Gjøvik, Norway
3
Department of Civil Engineering, College of Engineering, Al-Muthanna University, Samawa 66001, Iraq
4
Institute of Architecture and Construction, South Ural State University, 454080 Chelyabinsk, Russia
5
Department of Civil Engineering, College of Engineering, Prince Sattam bin Abdulaziz University, Alkhari 16273, Saudi Arabia
6
Faculty of Civil Engineering Technology, Universiti Malaysia Pahang, Gambang 26300, Malaysia
7
Department of the Built Environment, School of Design and Environment, National University of Singapore, Lower Kent Ridge, Singapore 117566, Singapore
*
Authors to whom correspondence should be addressed.
Buildings 2022, 12(4), 439; https://doi.org/10.3390/buildings12040439
Submission received: 7 March 2022 / Revised: 28 March 2022 / Accepted: 31 March 2022 / Published: 3 April 2022
(This article belongs to the Section Building Structures)

Abstract

:
The flexural behavior of five reinforced concrete beams containing recycled ceramic as cement and aggregate replacement subjected to a monotonic static load up to failure was studied. A full-scale, four-point load test was conducted on these beams for 28 days. The experimental results were compared with the conventional concrete as a control specimen. The cross-section and effective span of these beams were (160 × 200 mm) and 2200 mm, respectively. The data recorded during the tests were the ultimate load at failure, steel-reinforcement bar strain, the strain of concrete, cracking history, and mode of failure. The beam containing 100% recycled aggregates displayed an ultimate load of up to 99% of the control beam specimen. In addition, the first crack load was almost similar for both specimens (about 14 kN). The deflection of the beam composed of 100% of the recycled aggregates was reduced by 43% compared to the control specimen. Regardless of the recycled ceramic aggregates ratio, quantities such as service, yield, and ultimate load of the proposed beams exhibited a comparable trend. It was asserted that the ceramic wastes might be of potential use in producing high-performance concrete needed by the structural industry. It might be an effective strategy to decrease the pressure on the environment, thus reducing the amount of natural resources usage.

1. Introduction

In recent years, various issues related to the environment have encouraged researchers to utilize renewable and sustainable materials in the construction industry for cleaner and green construction [1,2,3,4]. Currently, concrete is the most consumed human-made material, with global consumption of up to 15 billion tons of natural aggregates every year [5,6]. The utilization of waste materials can help our environment by reducing the consumption of non-renewable natural resources, lessening the problems of landfills [7,8]. Conservative usage of natural resources and reducing the waste generated by the industry are among the main strategies to attain cleaner and more sustainable productions [9,10,11,12]. The utilization of industrial wastes by the construction industry is one of the alternative ways to preserve natural resources [13,14,15]. The wastes generated by construction demolition are the major contributor to the residues (approximately 75%). According to Zimbili et al. [16], ceramic is the highest among all generated construction waste materials, about 54%. The global production of tiles shows growth of approximately 5.2%, with 13.5 million m2 in 2018 from 8.6 million m2 in 2008 [17]. Medina et al. [18] stated that about 5 to 7% of the total production goes into landfill in the ceramic industry due to various technical problems. These wastes have highly resistant to biological, chemical, and physical degradation forces and have high durability performance. Therefore, the ceramic industries must find an alternative way to reuse these wastes instead of simply disposing of them [19].
Several studies [20,21,22,23] showed that ceramic materials have strong resistance against forces of biodegradation. Due to the high contents of crystalline aluminum and silica in ceramics, they are beneficial as auxiliary cement for enhancing the strength and durability performance of binders and concrete made from ceramics [24,25,26]. In spite of the recycling of some ceramic wastes by the construction sectors, the uses of the amount of generated ceramic wastes remain insignificant [23,27]. Therefore, other industries must recycle these wastes to lessen environmental concerns. As the building industries are the major users of such ceramic wastes, they can significantly contribute to surmounting ongoing environmental problems. Without any significant transformation in manufacturing and applications, the geopolymer industry can safely recycle these ceramic wastes. In addition, the cost associated with the landfill required by such wastes can be reduced, and the substitution of raw and natural constituents can thereby reduce energy usage and contribute toward conservation.
Many studies have acknowledged that the worldwide construction industries can be more sustainable if much of these industrial wastes can be efficiently reused in Ordinary Portland Cement (OPC)-free concrete and binder production [28,29,30,31]. Consequently, intensive research has been carried out to produce high-performance concrete containing recycled materials such as supplementary cementing components [32,33] and waste aggregates [34,35,36,37]. However, more studies became essential in full-scale models to utilize these recycled aggregates for structural applications. It is also essential to assess the load-deformation response of various components containing recycled aggregates.
Mukai et al. [38] utilized recycled concrete for structural applications. They prepared some reinforced concrete beams with a cross-section of 150 × 150 mm and a length of 1800 mm using the recycled aggregates at replacement levels of 15% and 30%. The results revealed an insignificant difference in the ultimate flexural capacity of the beams cast with the waste aggregates compared to the control sample. Yagashita et al. [39] used three types of wastes in the structural component as a replacement for the full aggregates. A minor reduction in the ultimate moment capacity was observed for the beams prepared with high-grade recycled aggregates. Arezoumandi et al. [40] tested full-scale reinforced concrete beams of dimensions 300 × 460 mm and 3000 mm long. The overlay of the recycled concrete aggregate-incorporated beams was shown to have a comparable flexural capacity as that of the control beam. However, these beams showed a lower cracking moment than the control specimen. Seare-Paz et al. [9] designed eight reinforced concrete beams with partial or full replacement of recycled aggregates. The cracking moments of the beams were decreased with the increasing percentage of replacement. However, the crack patterns of the conventional concrete and the one made with recycled aggregates showed analogues trend [33]. Sato et al. [6] observed an insignificant difference in the crack patterns between the traditional concretes and the reinforced ones made from recycled aggregates. More than 37 beams of a size of 150 mm × 200 mm and a span of 2800 mm were designed with recycled aggregates obtained from different sources, sizes, ages, and even the water–cement ratio. They used two methods to determine the specimens’ immediate and long-term loading.
The flexural behaviors of various recycled aggregates containing concrete beams (RACB) were tested for the service loads. The experimentally obtained results were compared with the traditional concrete, wherein the water to cement ratio (w/c) of all mixes was kept fixed, and an identical moment was applied. The RACB composed of 100% replaced aggregates showed 13% higher service deflection than the conventional specimen [41]. In addition, these RACBs displayed more considerable mid-span deflections than the control specimen, which were in the allowed range suggested by American Concrete Institute (ACI) 318 [42]. However, the studies related to the structural behavior of recycled aggregates and their uses in practical construction applications at the full-scale size models for assessing the load-deflection responses of the recycled aggregates remain deficient. To evaluate the structural application potential of these recycled aggregates, a flexural load test of the reinforced recycled concrete is necessary. Furthermore, it is important to determine the effect of fine and coarse recycled aggregates on the performance of the reinforced concrete beams.
In short, intensive studies were conducted to determine the mechanical and durability performance of the recycled aggregates incorporated in reinforced concrete beams as coarse aggregates substitute [43,44] or fine aggregates [45]. However, no study has been carried out to evaluate the effect of each parameter (recycled fine/coarse aggregates separately and their combination) on the flexural behavior of the reinforced concrete beams. In this perception, we evaluated the effects of recycled ceramic fine aggregates (RF), recycled ceramic coarse aggregates (RC), and recycled ceramic fine and coarse aggregates (RA) on the flexural performance of full-scale reinforced concrete beams.

2. Experimental Program

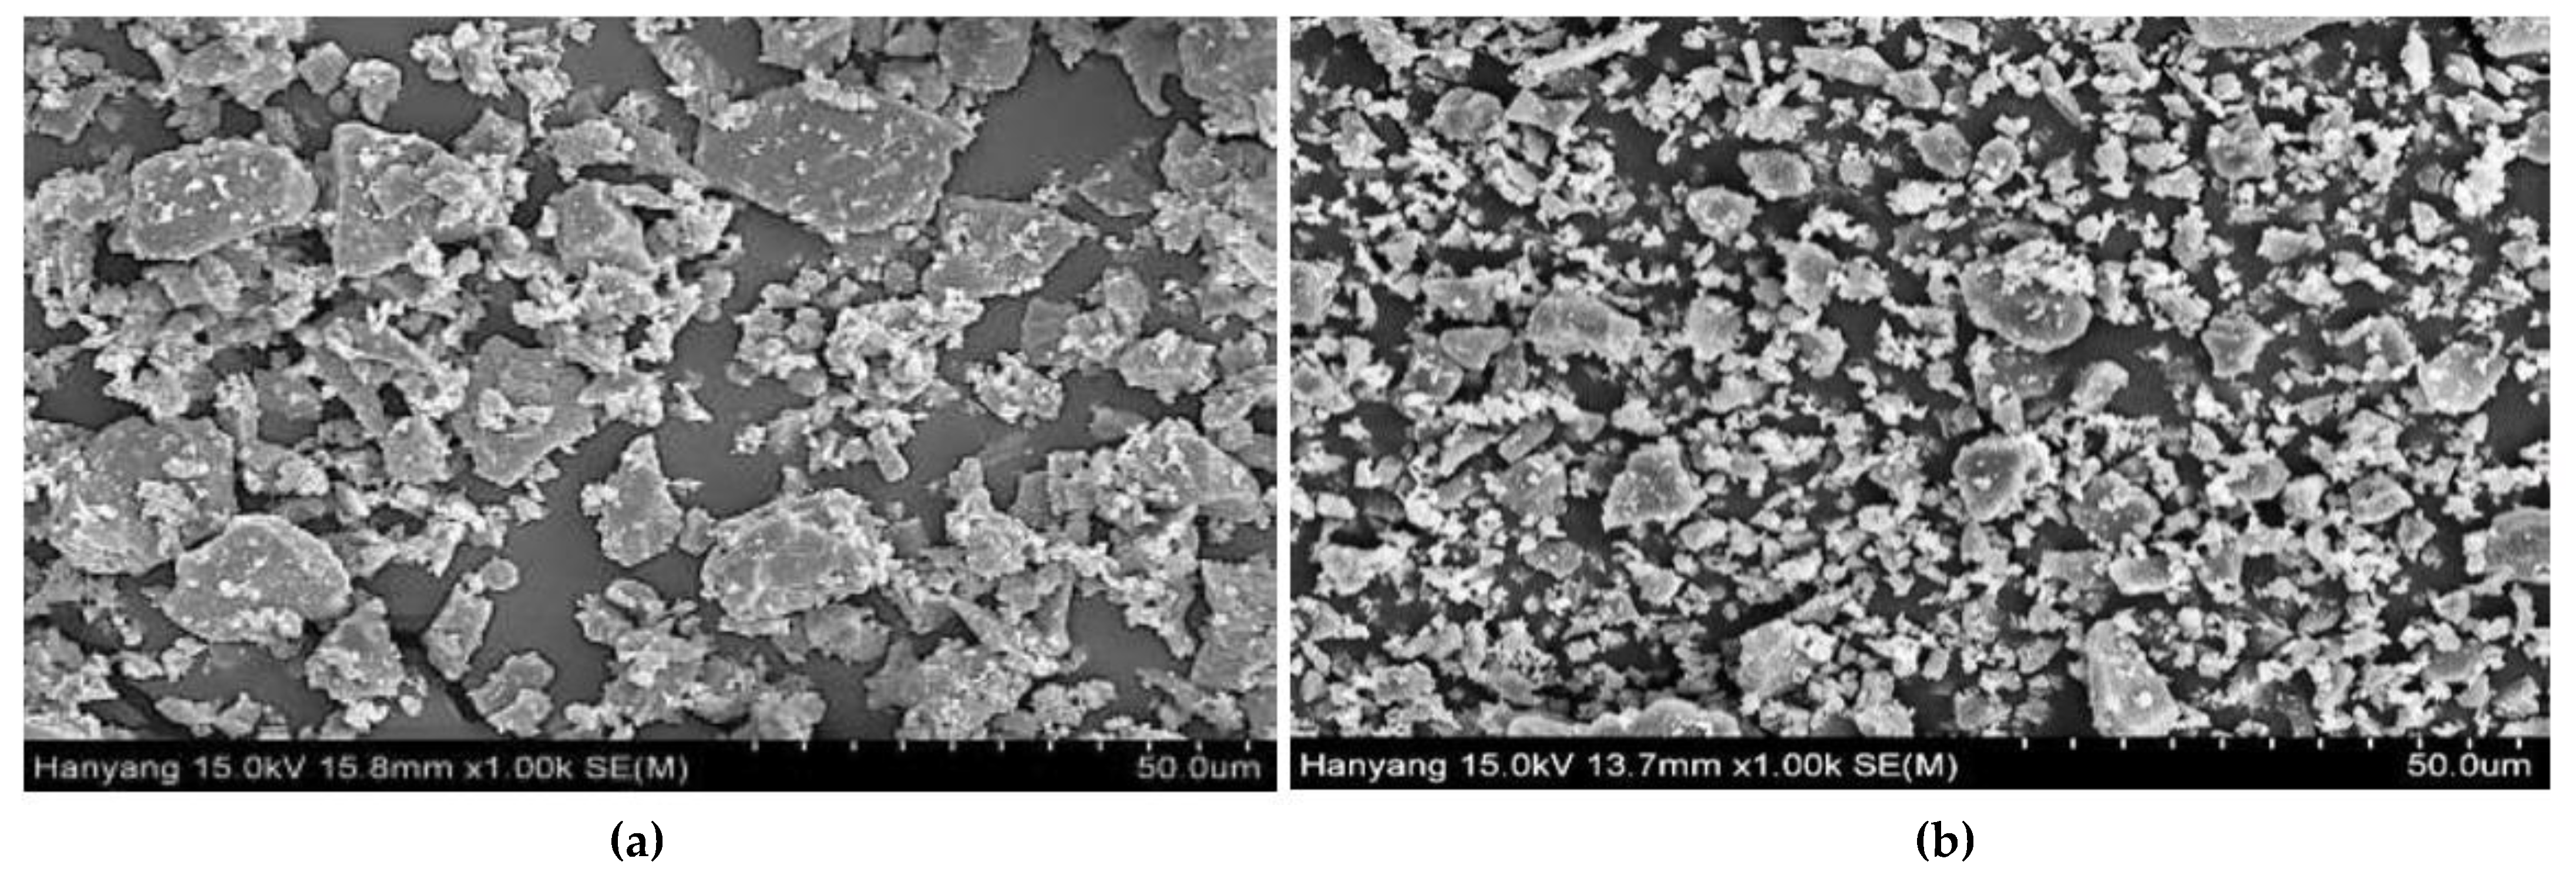
2.1. Material and Mix Proportions

In this work, OPC cement (Type I) was utilized as per the ASTM C150-15 standard, and the ceramic wastes (used as a replacement for cement and fine/coarse aggregates) were procured from a local factory (Malaysia). The obtained wastes were ground into a fine powder using a jaw crusher before being sieved according to American Society for Testing and Materials (ASTM) C33-16. The crushed ceramic wastes with particle sizes ranging from 4.75 to 10 mm were used as coarse aggregates to replace the natural coarse aggregates. The ceramic aggregates passed through a 4.75 mm sieve and were retained with a 75 μm sieve and were used as a fine aggregate replacement. About 4 kg of ceramic wastes with particles sized below 150 µm were ground using a grinder (Los Angeles abrasion machine) for approximately eight hours. The resultant waste ceramic powder (WCP) satisfied the requirement of ASTM C618-17a to be used as a pozzolanic material that contained SiO2 + Al2O3 + Fe2O3 above 70% (classified as class F pozzolan). Table 1 shows the chemical composition of the ceramic wastes and OPC. Following ASTM C33-13 recommendation, both natural fine/ceramic aggregates were improved. The maximum particle sizes of ceramic and natural coarse aggregates were 10 mm and retained on sieved No. 4.75 mm. Figure 1 displays the SEM image of OPC and ceramic powder.
Five concrete mixes were prepared wherein the first one was coded as conventional concrete (CC) that acted as a control sample (prepared without any ceramic waste). Another four mixtures were prepared with ceramic wastes as replacements for cement, fine aggregates, and coarse aggregates. The water/binder (w/b) ratio of 0.54 was constant in all mixtures. Table 2 displays the details of the mix proportions. A total of five reinforced concrete beams of the same size and reinforcement bars were designed with different concrete ingredients. The control specimen was made with OPC, river sand as fine aggregates, and crushed granite as coarse aggregates, known as CC. The second reinforced concrete beam also used OPC and fine aggregates, but ceramic wastes were used as coarse aggregates, and the beam was identified as RC. The third beam used similar ingredients as the control beam specimen, but 100% of the sand was replaced by fine ceramic aggregates (recycled fine aggregates or RF). The fourth beam contained RA and OPC as a binder, while 100% of fine and coarse aggregates were waste ceramic aggregates. The fifth beam (PC) used the same ingredient as the fourth beam, but 40% of the OPC was replaced by waste ceramic powder.

2.2. Details of Beam Specimens

A singly reinforced concrete beam was designed as an under-reinforced concrete beam according to Euro Code 2 (Table 3). Figure 2 illustrates the beams designed with a cross-section of 160 × 200 mm, an effective span of 2200 mm, and two longitude reinforcement bars with a diameter of 12 mm. The link was made with the deformed reinforcement bar with a diameter of 10 mm and spacing of 100 mm. The concrete mix proportions for casting the beams were designed according to the British Standard (BS 1881). For all beams, two reinforcement bars with a diameter of 12 mm were considered as the tensile steel bars at the bottom of specimens. Five reinforced concrete beams of the same size were designed with different ingredients.

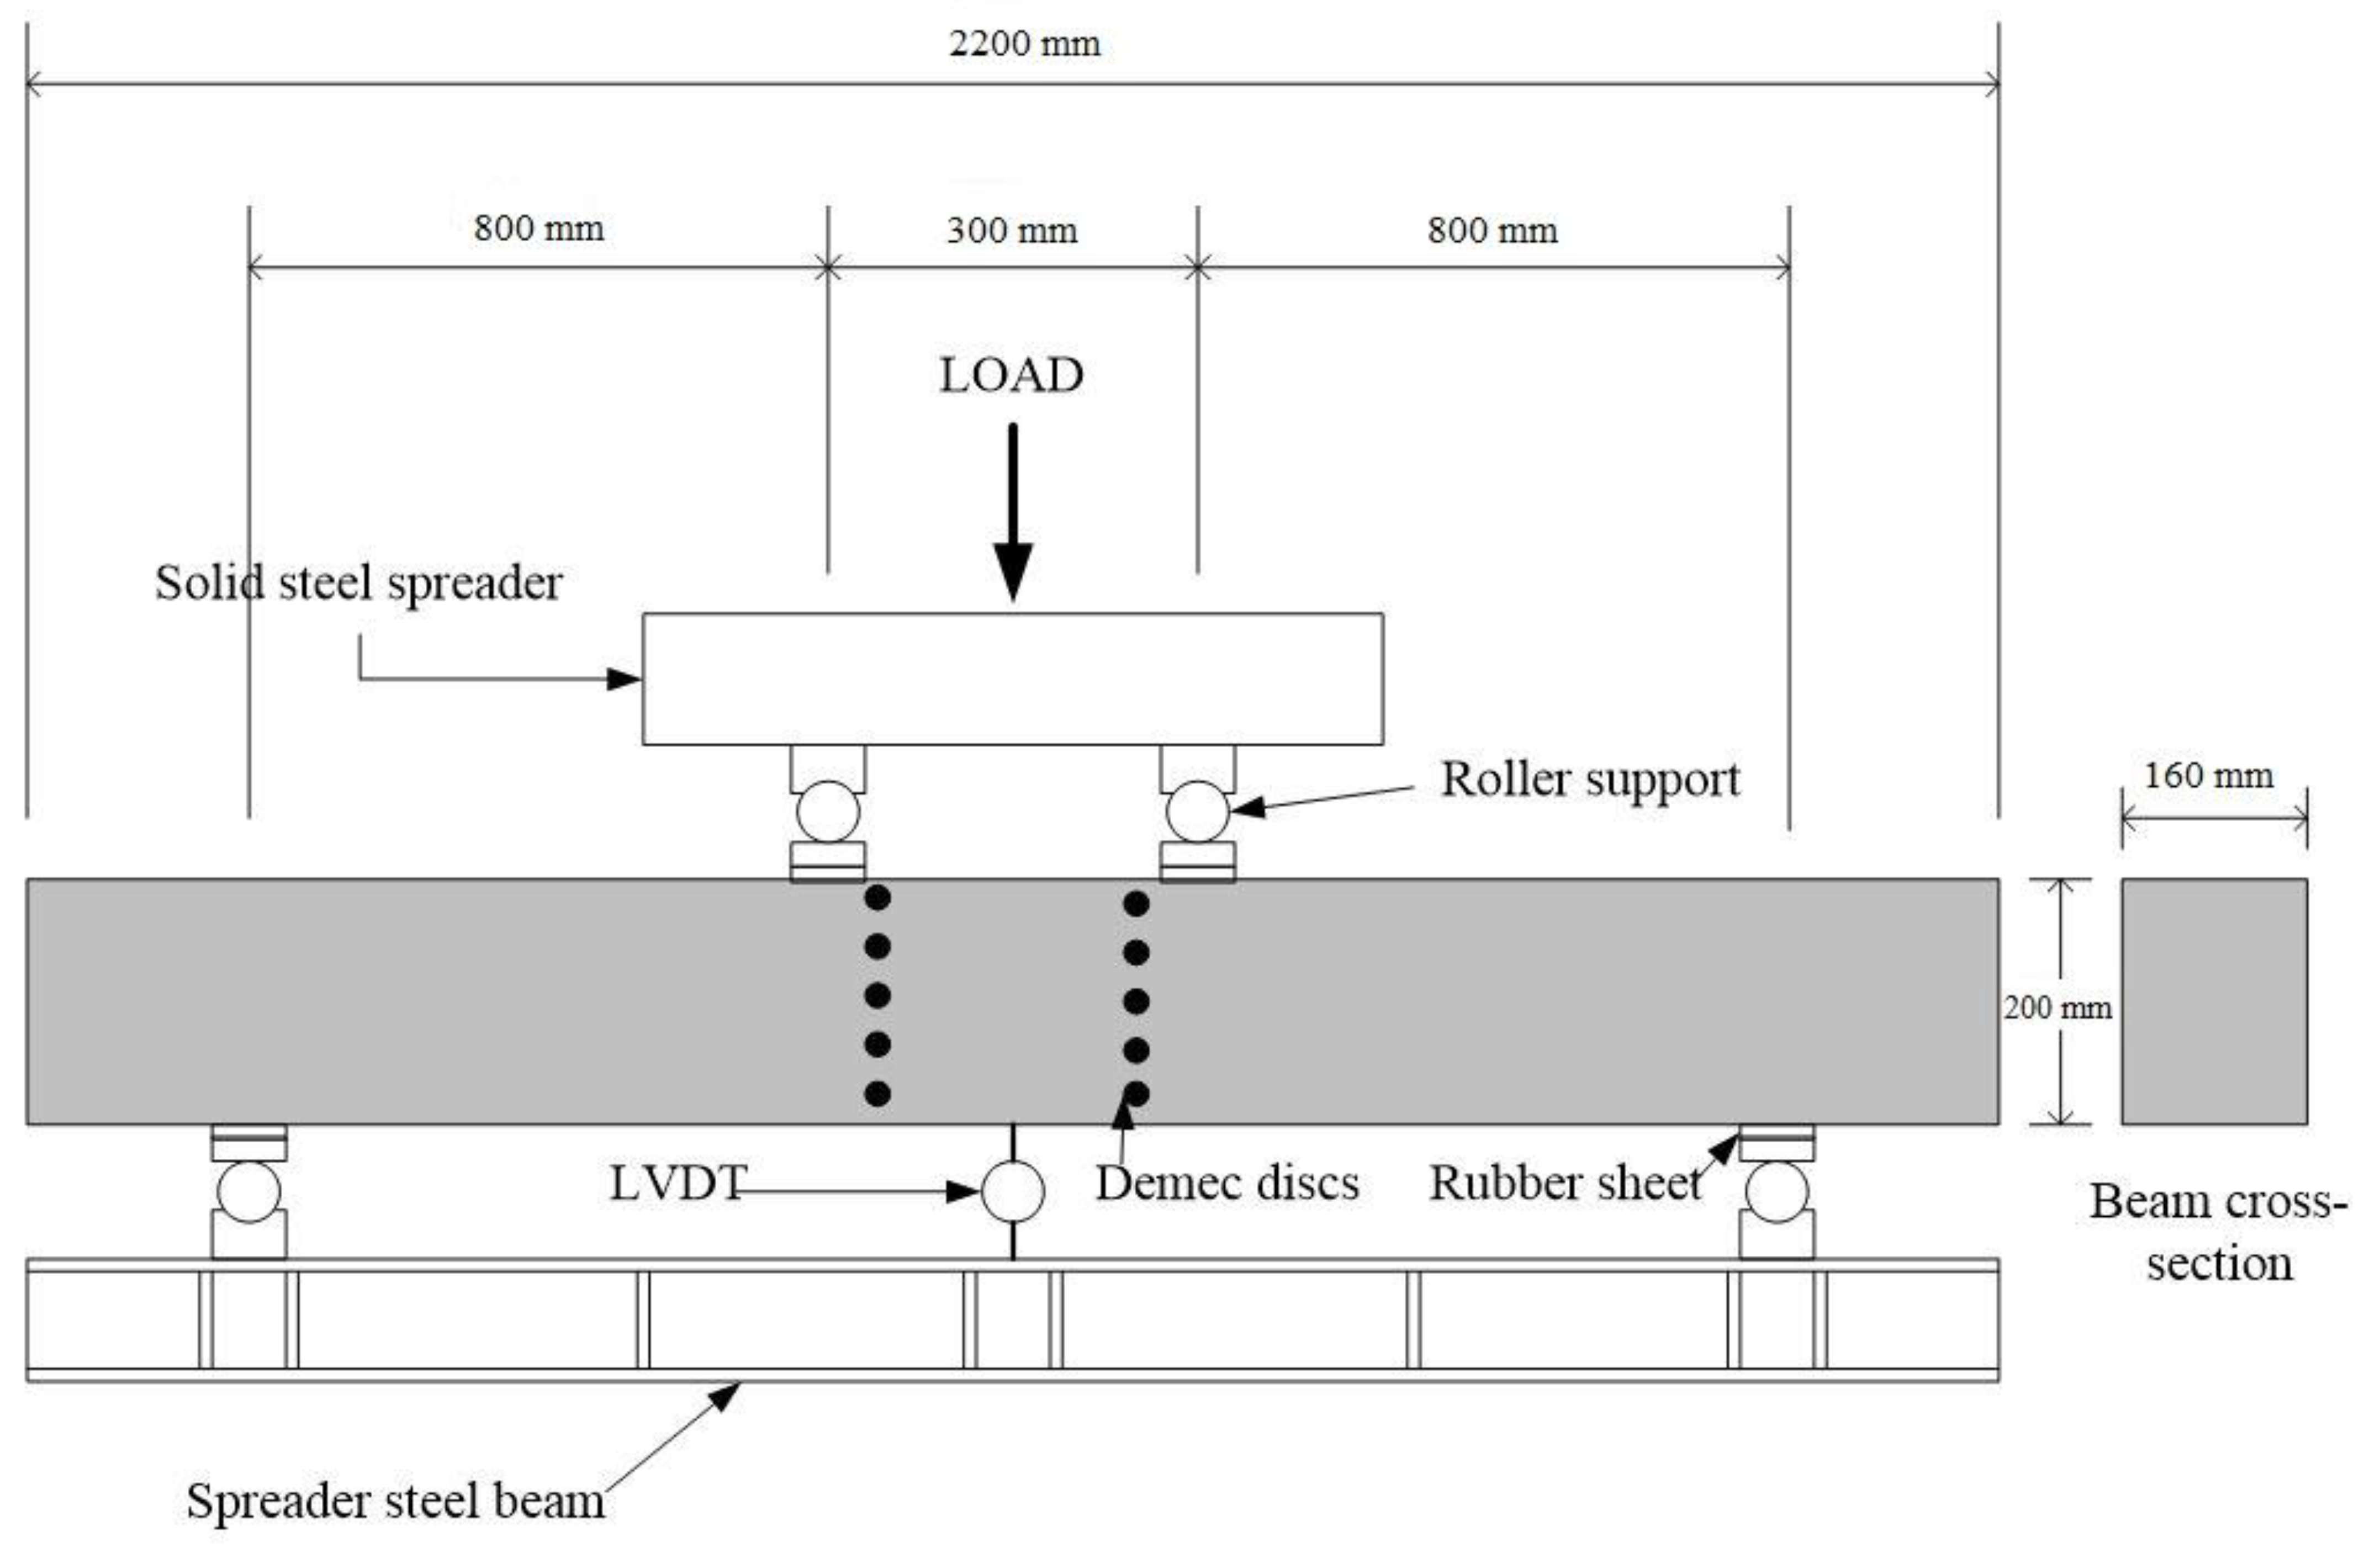
2.3. Experimental Setup of Beams for Testing

The flexural strength properties of the reinforced beams were examined under simple supported conditions and four-point load tests. This enabled the generation of a pure bending moment at the beam mid-span, yielding the highest moment and deflection. A load cell with 100 kN capacity was applied on the beams to measure the monotonic static load with the rate of 1 kN/min, wherein a manual hydraulic jack was used. The applied load was maintained for one minute to control and record the cracks’ development. This procedure continued until the failure of the beam specimens. Figure 3 shows the test arrangement of the beams. For all beams, the length of the zone subjected to the pure bending moment and full span was 300 mm and 1900 mm, respectively. This paper mainly focused on the mid-span load-deflection features of the reinforced concrete beams that were measured by a linear variable displacement transducer (LVDT). An electrical strain gauge (FLA-5-11-3L) was installed on both tensile reinforced bars at mid-span to record the strain during loading until the failure of the beam. Another electrical strain gauge (PL-60-11-3L) was installed atop the mid-span of the reinforced concrete beam to monitor the strain under load. In addition, ten DEMEC discs were attached to one side of the beam at a distance of 150 mm to record the strain development on the side of the concrete surface during loading.

3. Results and Discussion

3.1. First Crack Load and Mode of Failure of Beams

All tested beams failed under the flexure due to the generation of many cracks on the concrete in the tension region. The first crack appeared in the tension region at the mid-span of the beam in between the two-point loads. This region was under the pure moment, and the maximum tensile stress occurred at the bottom of the beam in this region. In the next step, with the increase of the load, the number of cracks increased, and the depth of cracks from the previous load kept increasing. With a further increase in load, the widths of the creaks became wider with the simultaneous formation of more vertical cracks along the length of the constant moment and upper regions.
Table 4 shows the load at which the first crack appeared on each beam and the total number of developed cracks after the failure. The first crack in the conventional concrete appeared on a load of 14 kN in the middle of effective-span of the specimen. In this specimen, the initial crack occurred at a load of 29% of the ultimate load. The depth of this crack increased with the increase of load on the specimen, and new cracks were observed to appear on both sides of the first crack. The cracks’ propagation showed their gradual spread on both sides of the first crack until the specimen was failed. In the RF and the RA beam, the first crack occurred at a load of 14 kN, comparable to the one that appeared for CC.
Furthermore, the total number of cracks in both specimens was equal. The cracks propagation in the effective span of all beams was quite similar but with a different number of total cracks before the failure. The first crack for CC, RC, RF, RA, and PC beam occurred at the applied load of 14, 10, 14, 14, and 12 kN, respectively. This difference in the load values for the occurrence of the first crack loads in different specimens can be ascribed to the unique effect of ceramic recycled aggregates on the load-bearing capacity of the beams. However, for different beams, no significant difference was observed involving the number of cracks and ultimate loads. The present findings are in good agreement with the results reported by Chio et al. [45], wherein the addition of the recycled aggregates was shown to cause an insignificant impact on the ultimate load capacity of the reinforced concrete beams.

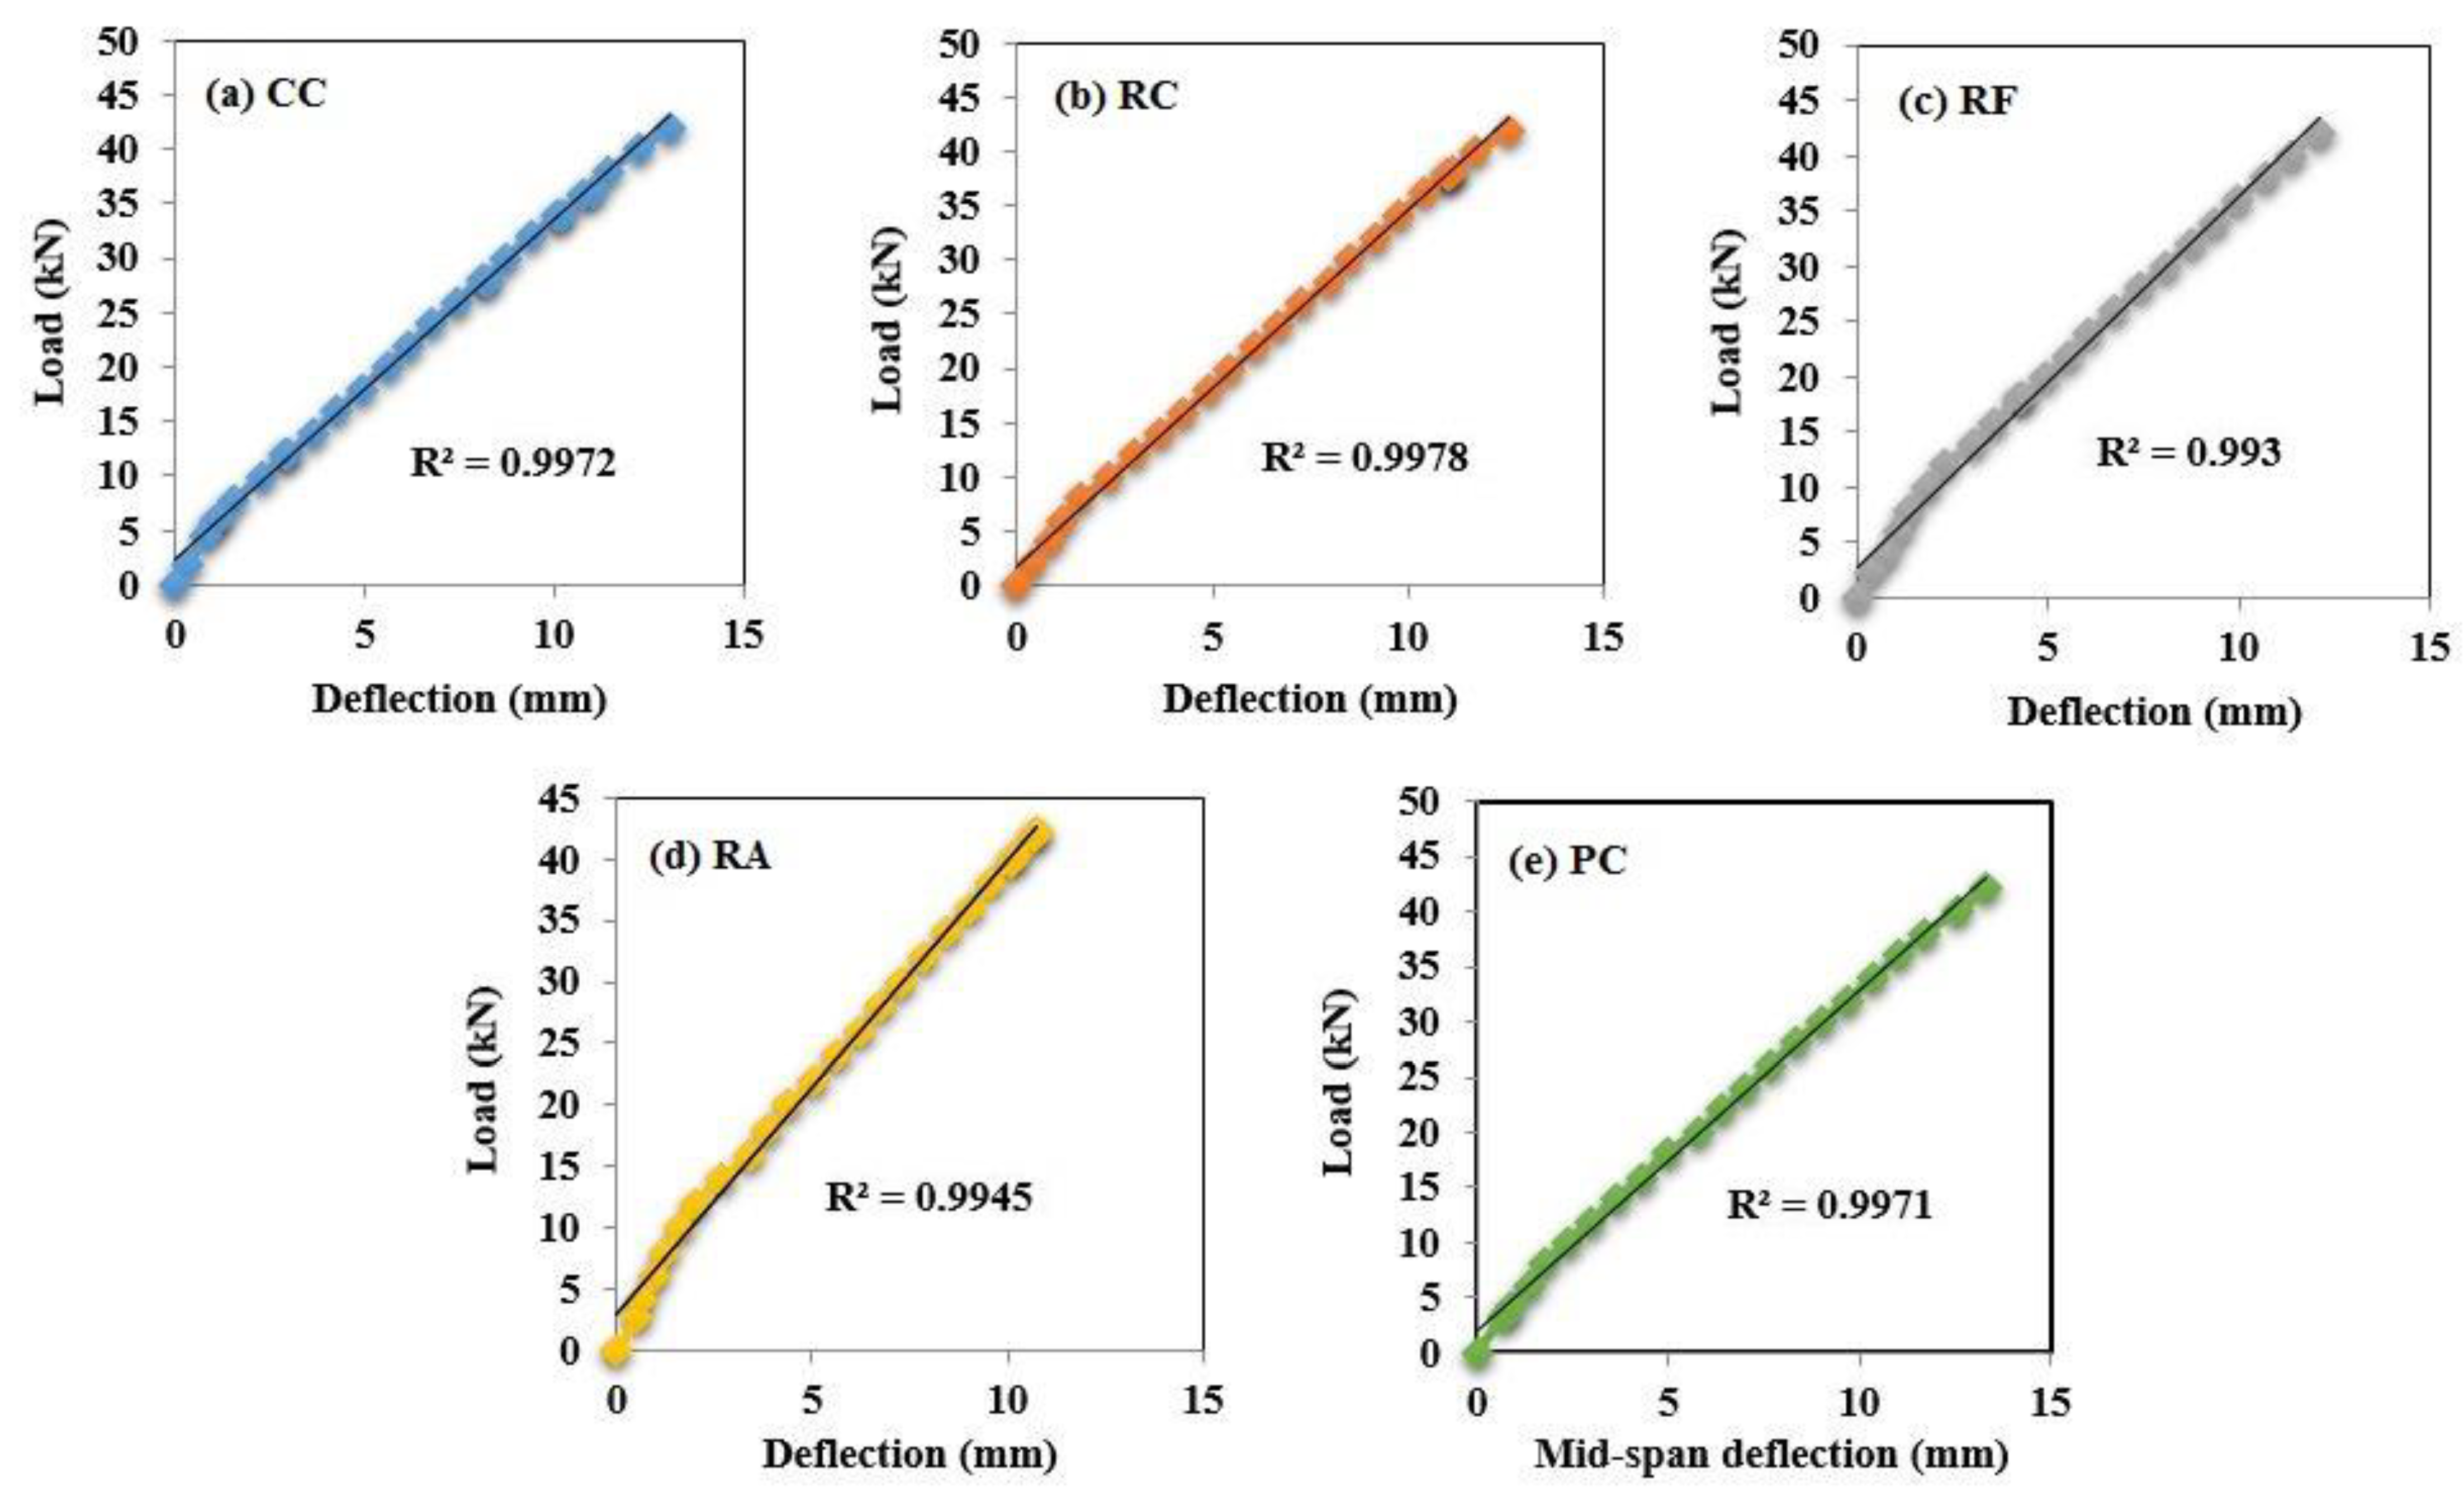
3.2. Load-Deflection Behavior (Mid-Span Deflection) of Beams

Figure 4 shows the load-deflection behavior of the beams subjected to increasing static load at a rate of 1 kN/min. First, all beams revealed a similar tendency in their load-deflection behavior [7] wherein the linear behavior indicated their identical stiffness. Nonetheless, with the increasing load, the beams began to crack and their stiffness kept on decreasing with a larger deflection. All beams showed linear deflections up to the load of 42 to 44 kN. The deflections of CC, RC, RF, RA and PC beam at a load 42 kN were found to be 13.8, 13.3, 12.1, 10.7 and 13.4 mm, respectively. Compared to other beams, the CC beam displayed the highest deflection of 28.46 mm at the mid-span for the ultimate load. Beam RA was deflected by 17.52 mm at the ultimate load. The observed improvement in the load deflection may be due to the physical characteristics of the ceramic material used to make RA, producing higher stiffness than CC. Table 5 shows the maximum deflection and ultimate load of all the beams. A comparison in the deflection values of all beams showed that the RA beam was 39% lower than CC, while both specimens achieved almost similar flexural strength capacity.
Figure 5 shows the data correlation (R2) of each tested beam. The obtained R2 value of 0.99 clearly indicated a fair consistency of data recording during the experiment.

3.3. Ultimate Flexural Capacity of Beams

Table 6 illustrates the ultimate flexural capacity of the reinforced concrete beams CC, RC, RF, RA and PC, which were recorded to be 47.6, 44.9, 45.8, 47.1 and 45.7 kN, respectively. The inclusion of the waste ceramic aggregates was found to be beneficial as a total substitution for the fine and coarse aggregates. Compared to CC, the RA beam was the best and showed the highest ultimate load of 99%. The RC beam displayed the lowest ultimate experimental load of 94% compared to the CC. The ultimate experimental load of all reinforced concrete beams containing different percentages of ceramic material was almost similar. The obtained difference in the ultimate experimental load between specimen CC and RC can be due to the flakiness of coarse ceramic aggregates that adversely affected the compressive strength (CS) and flexural strength (FS) of the proposed beams [31]. The flexural capacity of CC was the highest (21.4 kNm), and for the RC beam, it was the lowest (20.2 kNm). The flexural capacity of the RA beam was 21.2 kNm which was quite close to the CC value. The recorded small differences in the flexural capacity among different beams may be due to the physical characteristics of fine and coarse aggregates ceramic components. The values of ultimate flexural capacity (Table 6) of all beams were in the range of 20–22 kN.m, displaying their similar behavior.
A comparison of the experimental values of the ultimate moment of the capacity of different beams with the theoretical values showed some differences. These differences may be ascribed to the factors such as: (i) the difference between the actual CS (fc) of the cubical specimen and the fc value used to calculate the moment capacity of the section. The theoretical moment capacity was calculated based on the concrete grade with fc = 30 MPa; (ii) difference in the yielding point (fy) of steel-reinforced bars, which was 400 MPa according to the manufacture manual and 600 MPa according to the result of the tensile stress of the steel-reinforcement bar; (iii) other factors related to the safety specified by the codes of design.

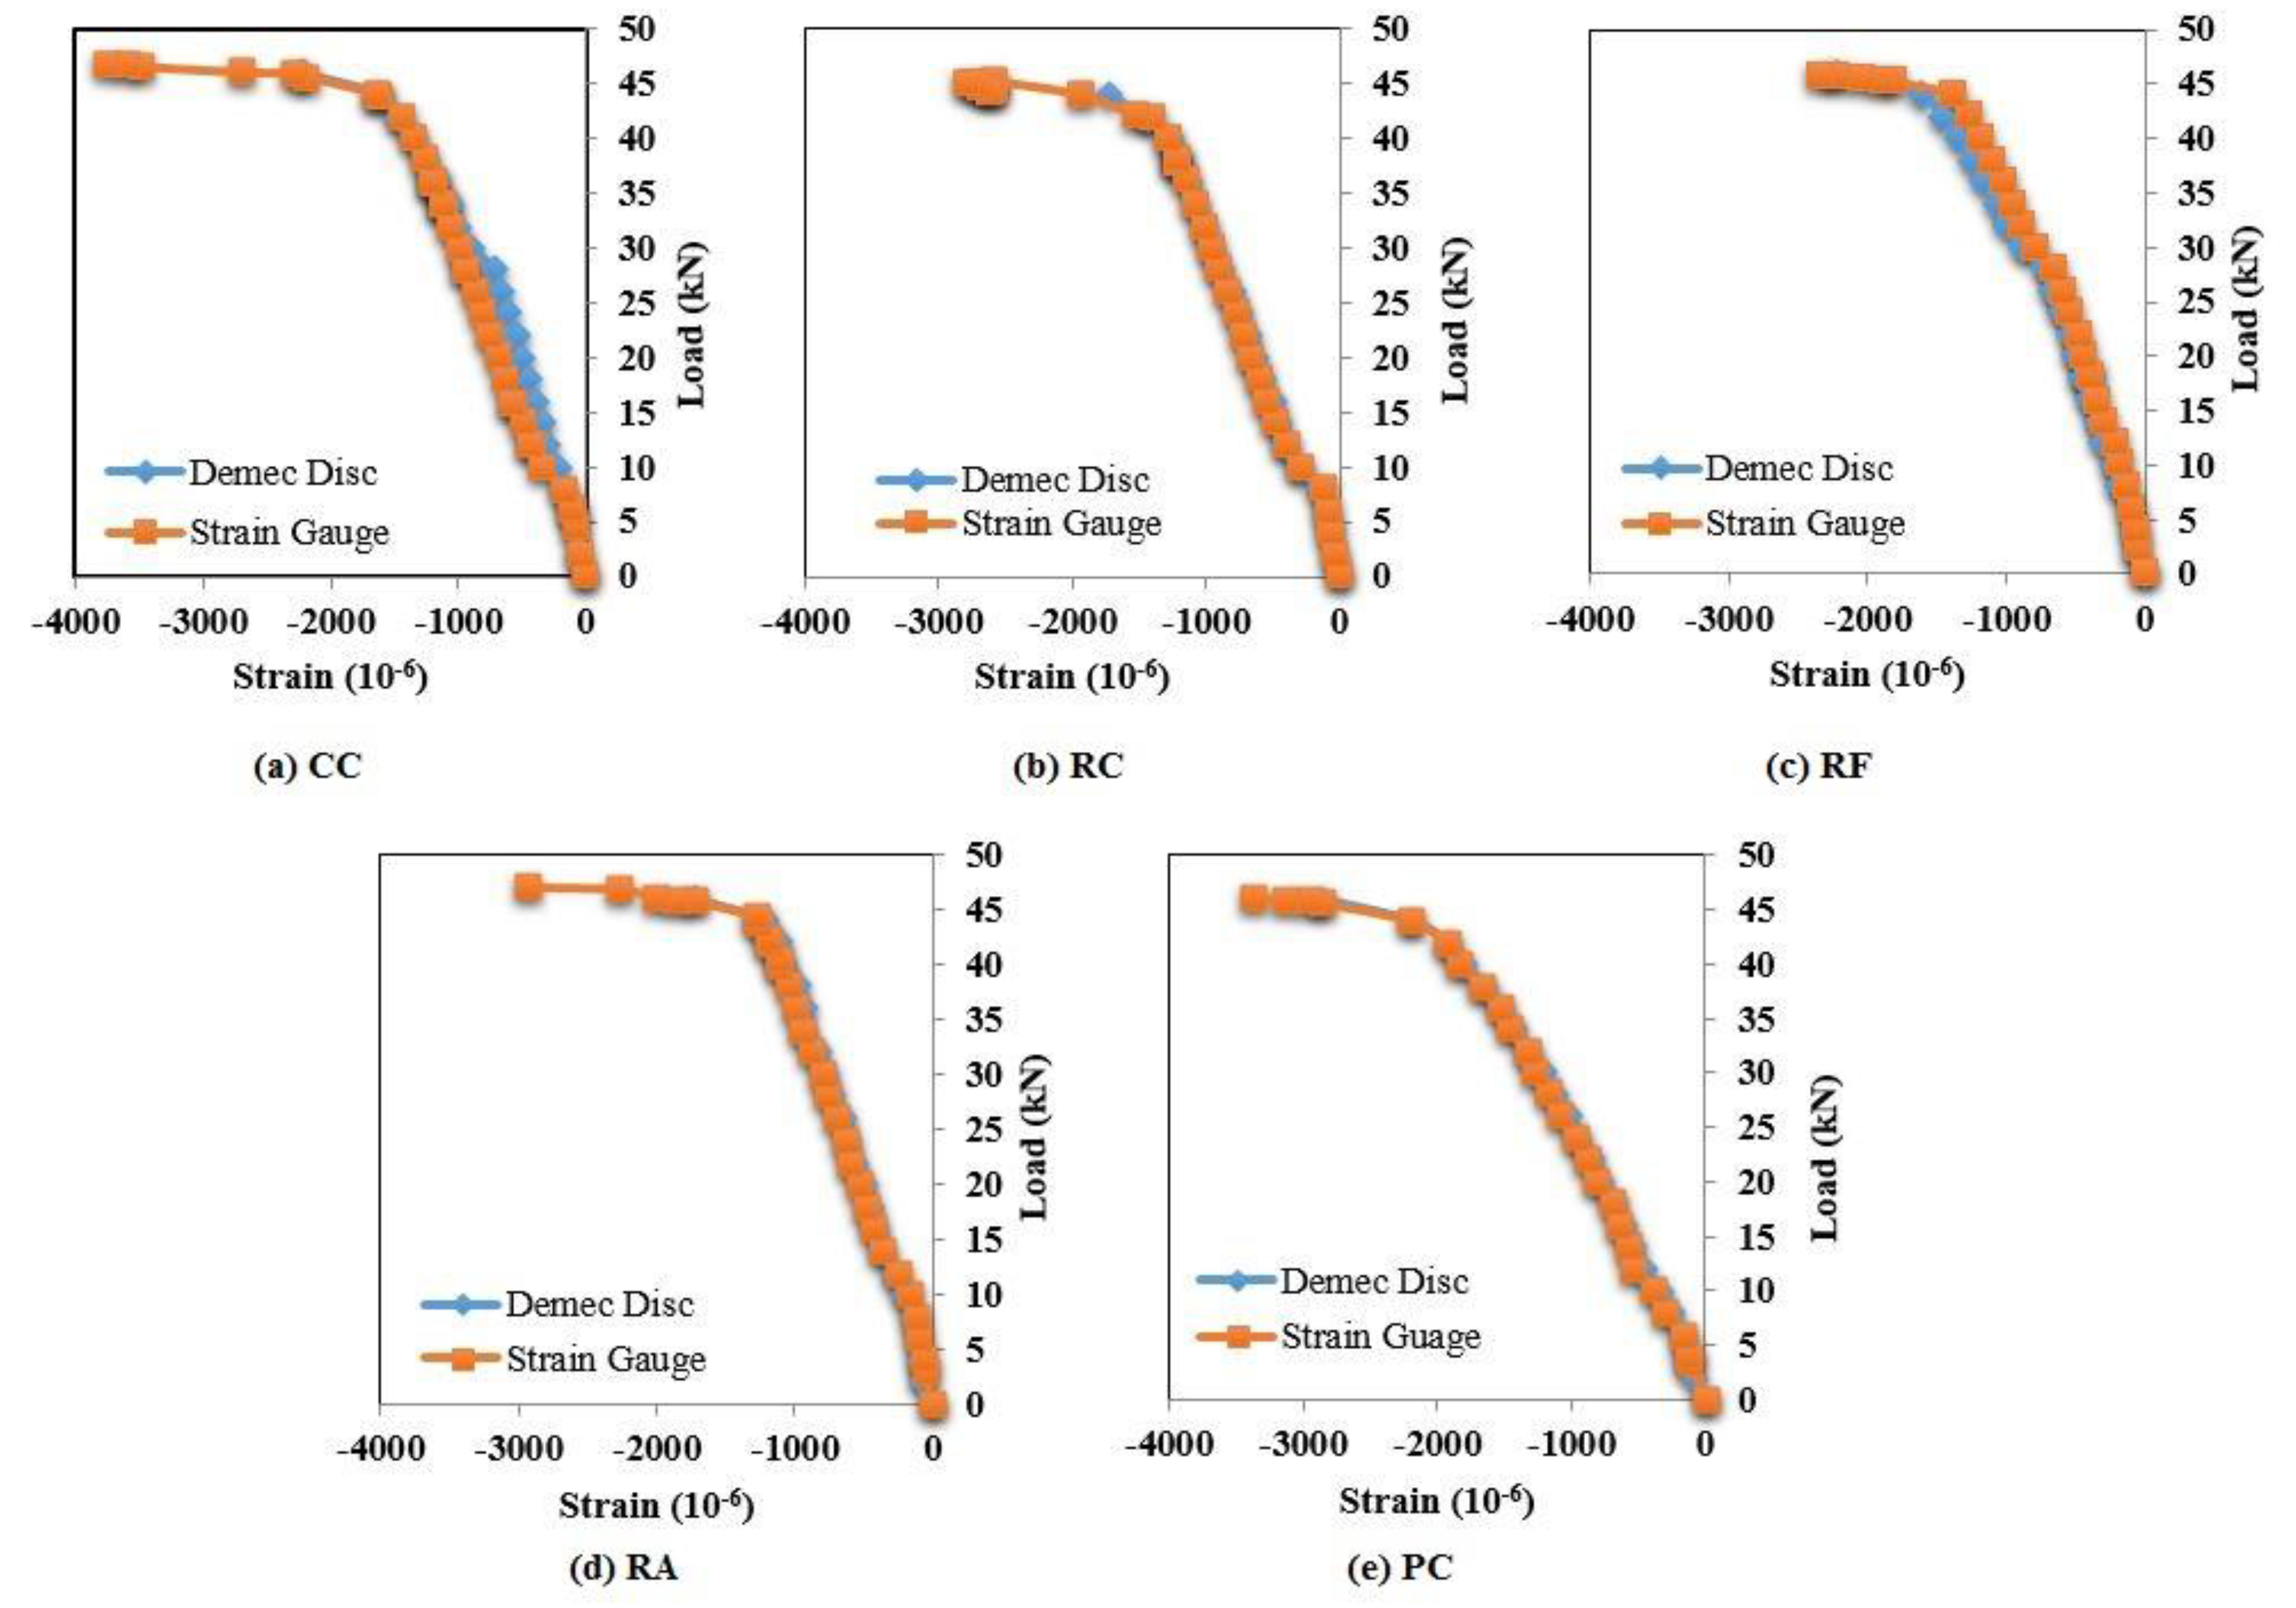
3.4. Strain of Reinforcement Bars under Applied Load

The tensile strain of the reinforcement bars was measured by the electrical strain gauges fixed to the bars and embedded in the concrete beams. Figure 6 illustrates the load–strain curve of the reinforcement specimens. The tensile strain behavior of all studied reinforcement bars was similar to the load deflection of the beams, displaying a linear (elastic) region and finally yielding elasto-plastic behavior. The tensile strain at the point of yield for beams CC, RC, RF, RA and PC were recorded to be 3739 × 10−6, 3388 × 10−6, 3727 × 10−6, 3116 × 10−6 and 3337 × 10−6, respectively. With the increase of applied load, the strain of the reinforced beams was increased until their failure in the plastic region. The values of the tensile strain of the reinforcement bar and the related load of all beams at the failure point are shown in Table 7. The ultimate tensile strain of the embedded steel-reinforced bars in the beams was affected by the nature of different concrete used in the beam. The embedded steel-reinforced RA beam showed smaller strain than other specimens, which may be due to the characteristics of waste ceramic aggregates used for its casting that enhanced the performance of the reinforced concrete. In brief, the behavior of the reinforcement bars was elastic up to the strain value in the range of 3350 × 10−6 to 3750 × 10−6. Beyond this strain, the behavior was elastoplastic, and then the reinforcement bars reached their ultimate tensile strain, failing in the plastic region.

3.5. Strain of Concrete under Applied Loads

The electrical strain gauge positioned at the concrete surface atop the beam was used to record the concrete’s compressive strength (CS) in the compression region (Figure 7). All beams except PC revealed quite similar behavior in the CS development. At 40 kN load, the strain of CC, RC, RF, RA, and PC beams were 1331 × 10−6, 1278 × 10−6, 1178 × 10−6, 1118 × 10−6 and 1821 × 10−6, respectively. The observed significant difference in the strain value between PC and other beams was due to the replacement of cement with ceramic wastes. Essentially, the pozzolanic reaction of ceramic waste powder occurred at longer curing periods (after 28 days of curing age), wherein the delay in the hydration process could cause lower early strength development of the proposed concrete [32,33]. The RA beam achieved the minimum strain compared to other specimens, which can be attributed to the synergistic improved performance of ceramic fine and coarse aggregates. The observed improved strain values of CC (1331 × 10−6) and RF (1178 × 10−6) at 40 kN can be ascribed to the physical characteristic of fine ceramic aggregates that produced better inter-locking to the binder and aggregates, yielding more stiffness and less strain in RF beam. The strain of RC beam was lower compared to CC, which was mainly due to the effect of coarse ceramic aggregates that caused more stiffness compared to the natural coarse aggregates. Conversely, the strain of RC beam was higher than RF, indicating that the fine ceramic aggregates had a significant impact on the stiffness of the beam. It was affirmed that the flakiness of the coarse ceramic aggregates was more influential than the fine ceramic aggregates. Overall, the coarse and fine ceramic aggregates inclusion in the concrete produced the best effect with significant improvement in the specimens’ stiffness. This enhancement was mainly ascribed to the better inter-locking and binding of the fine and coarse ceramic aggregates together [14].
Figure 8 shows the concretes load–strain behavior in the compression region. The data recorded using two different methods showed similar behavior, indicating the usefulness of both methods to measure the strains of the concretes. Amongst all specimens, the RA beam showed the lowest strain value of 1118 × 10−6, which may be due to the presence of nearly angular-shaped ceramic aggregates with roughened surfaces that improved the cohesion and stiffness of the recycled concrete matrix [34]. The changing slope (stiff and flat) of the curve (Figure 8) showed varying stiffness of the specimens, wherein the RA beam displayed a sharper slope than the other specimens, indicating its lower load–strain performance. In addition, the load–strain graph of PC showed a gentle slope compared to other specimens, indicating its significant strain-load performance than other specimens.

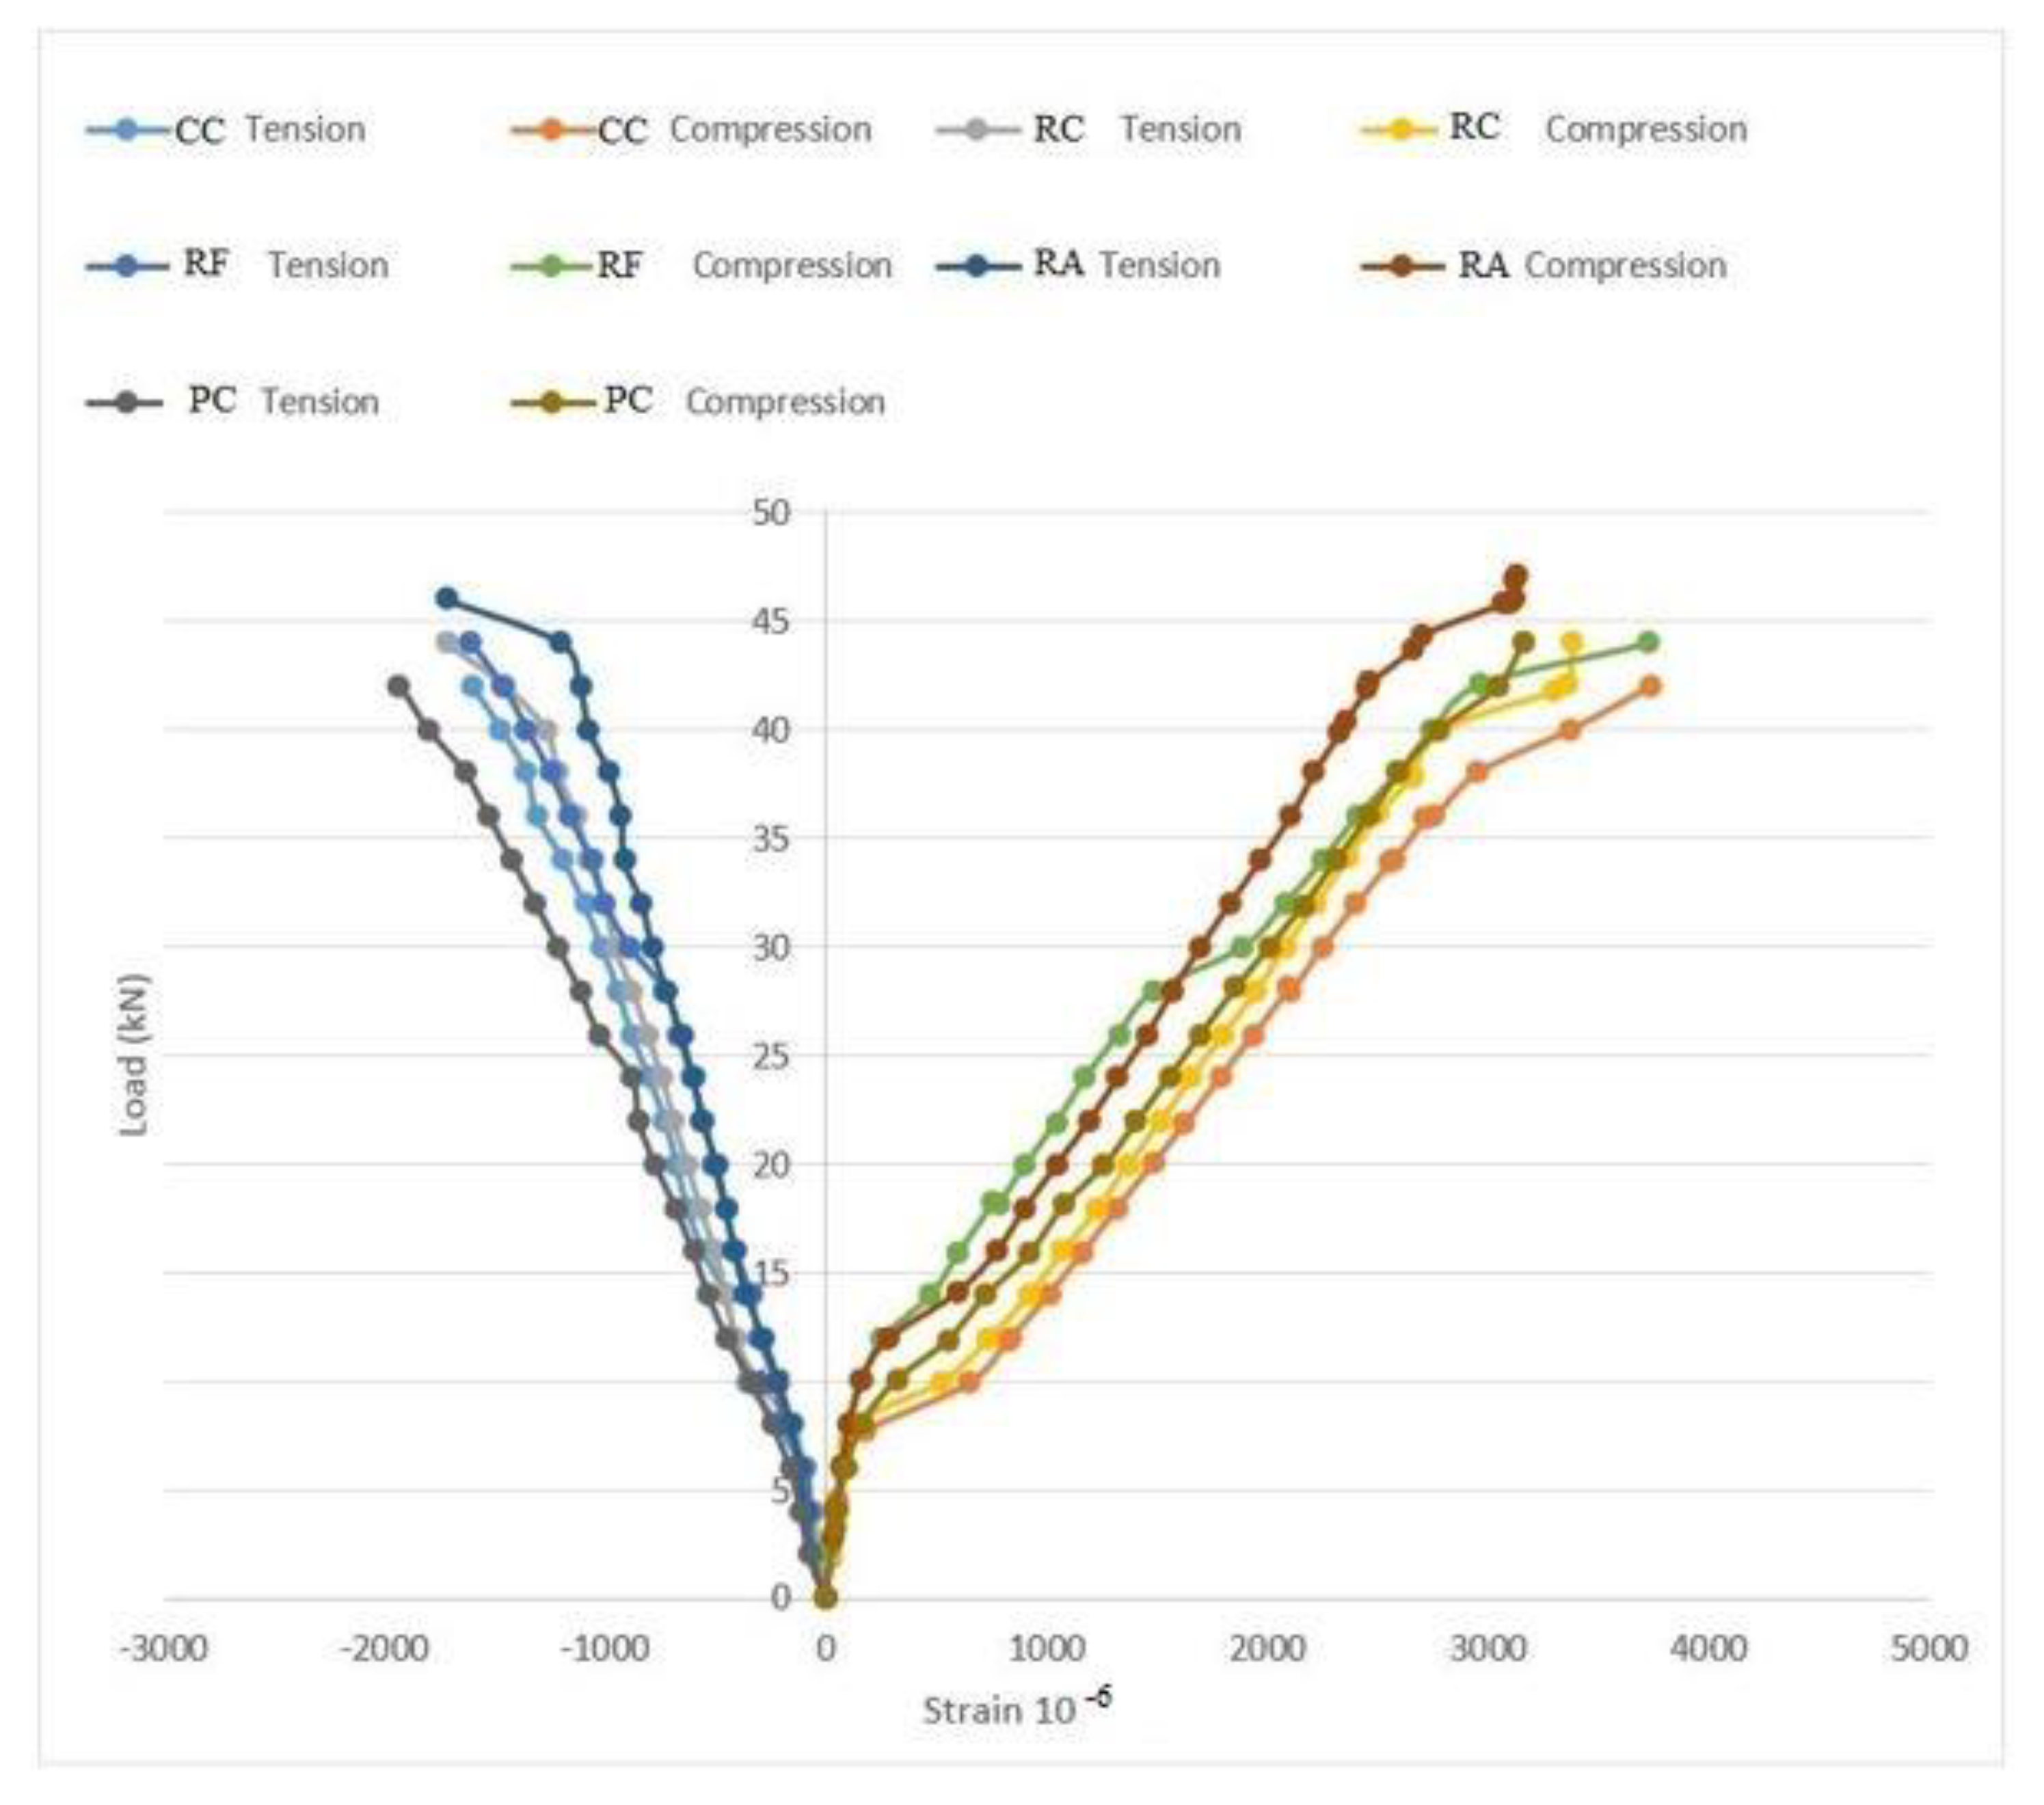
3.6. Compression and Tension of Beams

The compressive and tensile strain development of the beams was recorded by increasing the static load during the test. Figure 9 shows the strain of the specimens under the load up to their failure. The negative and positive signs indicated the CS and tensile strain (TS) of the studied specimens. The values of CS at the yield point of the beam RA, RC, RF, RA, and PC were 1600 × 10−6, 1720 × 10−6, 1607 × 10−6, 1720 × 10−6, and 1800 × 10−6, respectively. The values of TS at the yield point of the beam RA, RC, RF, RA, and PC were 3739 × 10−6, 3363 × 10−6, 3727 × 10−6, 3115 × 10−6, and 3162 × 10−6, respectively. CC beam started to yield a load of about 42 kN until the ultimate strain of the steel bars and finally failed at 47.6 kN. The mode of failure of all tested beams revealed a similar pattern with different behavior of the ultimate load, which is probably because of the characteristics of the materials used for the beam design. The stress-strain curves of different specimens showed that with the increase of load in the concrete, the strain of the steel-reinforcement bar was increased. However, the strain of the steel-reinforcement bar was more significant than the strain of concrete, which may be due to the difference in the cross-section area and elastic modulus. The CC beam showed the minimum TS of the steel-reinforcement bar, which may be due to the higher stiffness of concrete with less deflection. In addition, the RA beam was made with ceramic wastes as coarse and fine aggregates replacement that performed better than other specimens. Generally, the RF beam showed a minimum strain of steel-reinforcement bar than other beams (except RA), which was due to the usage of fine ceramic aggregates in the concrete mixes.

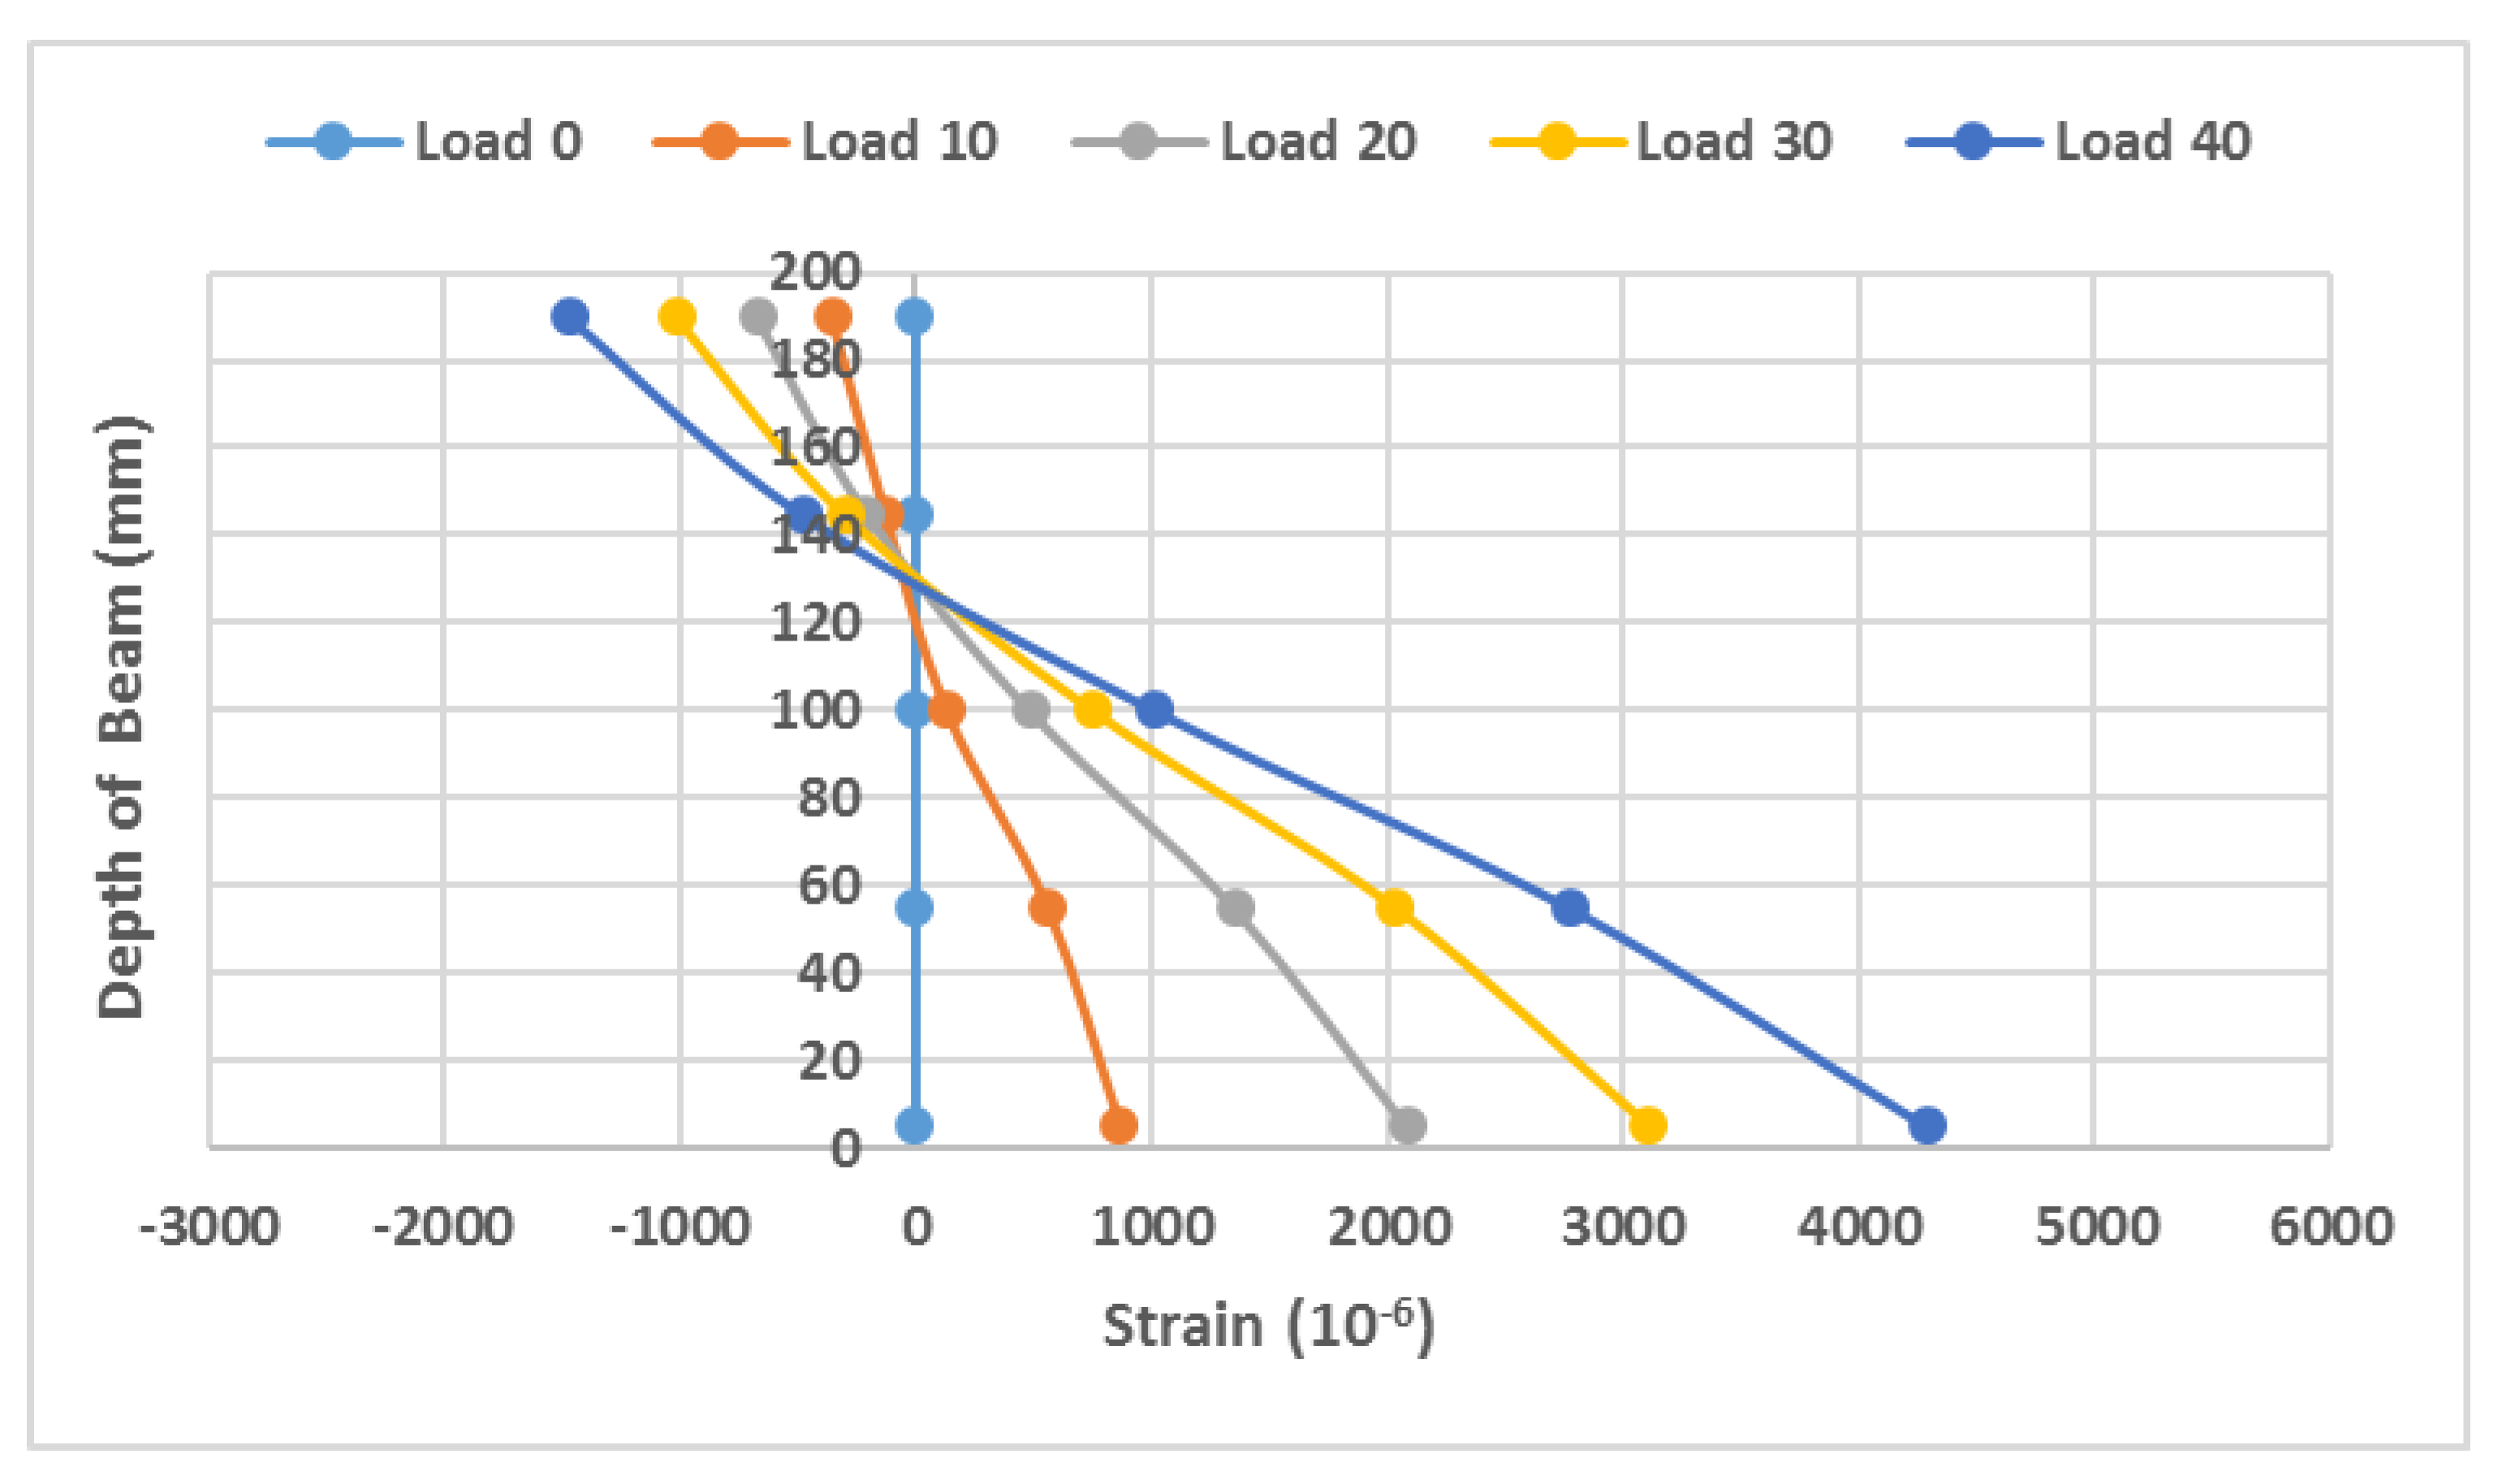
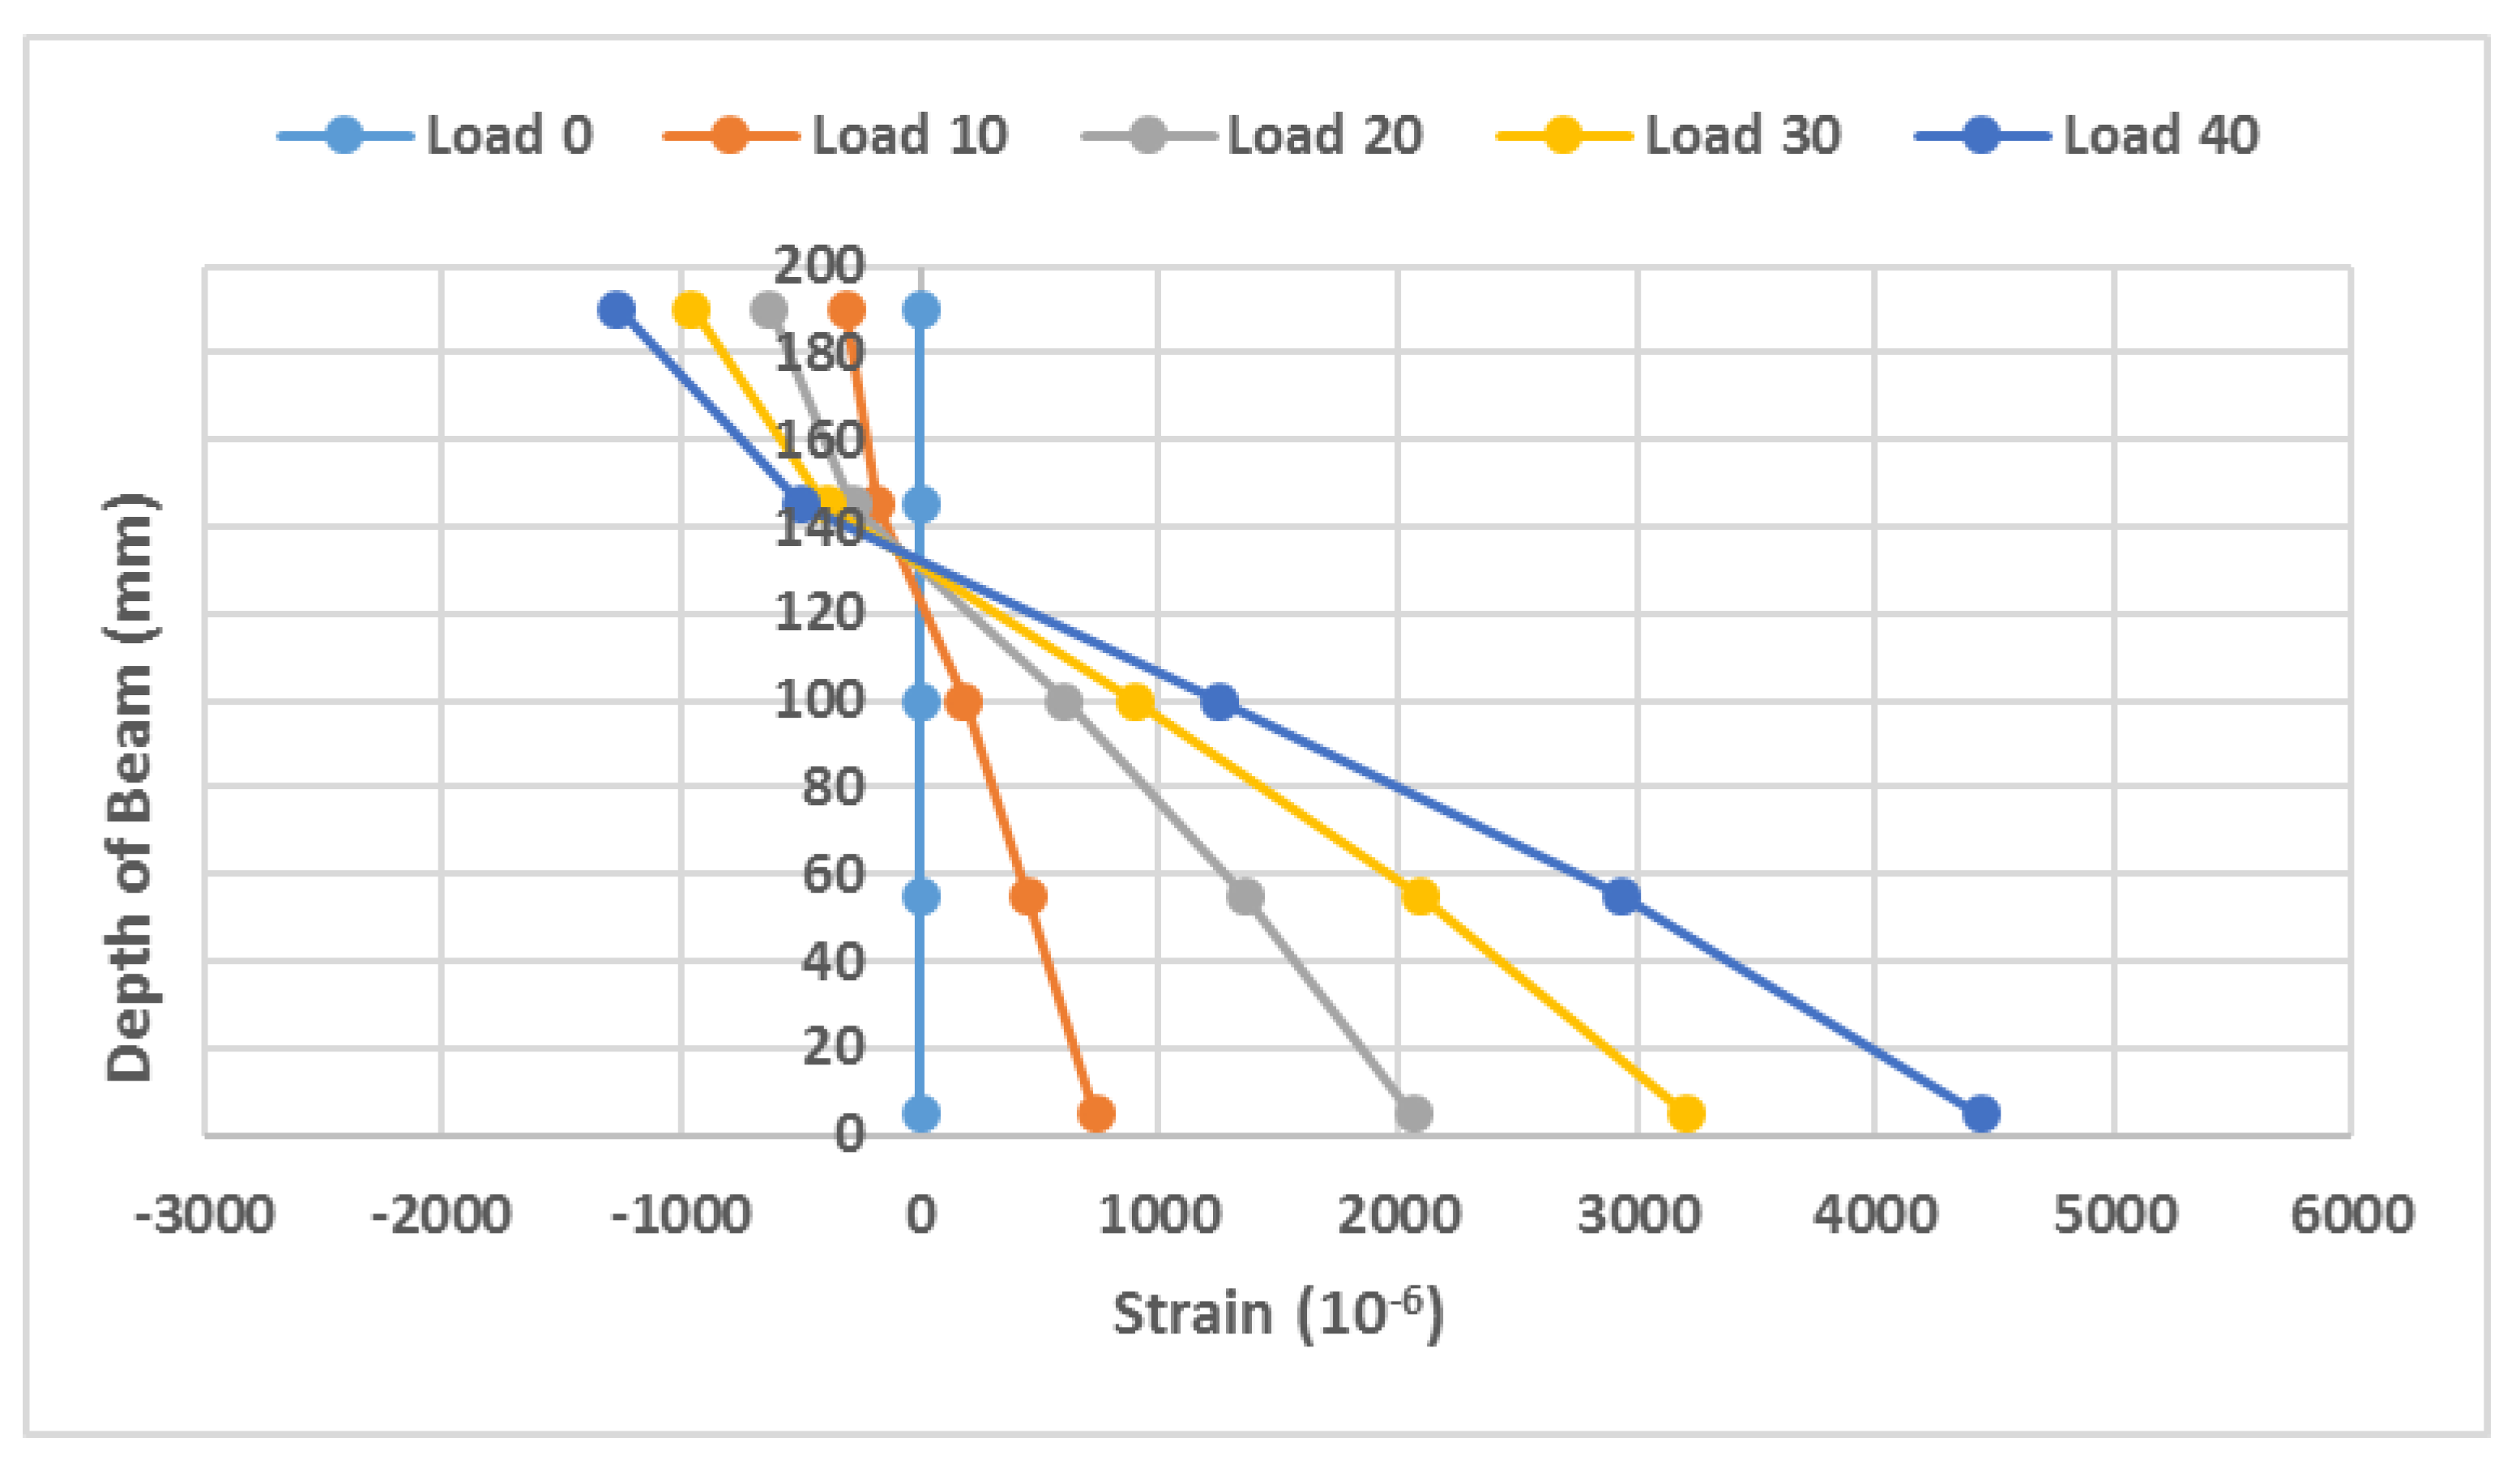
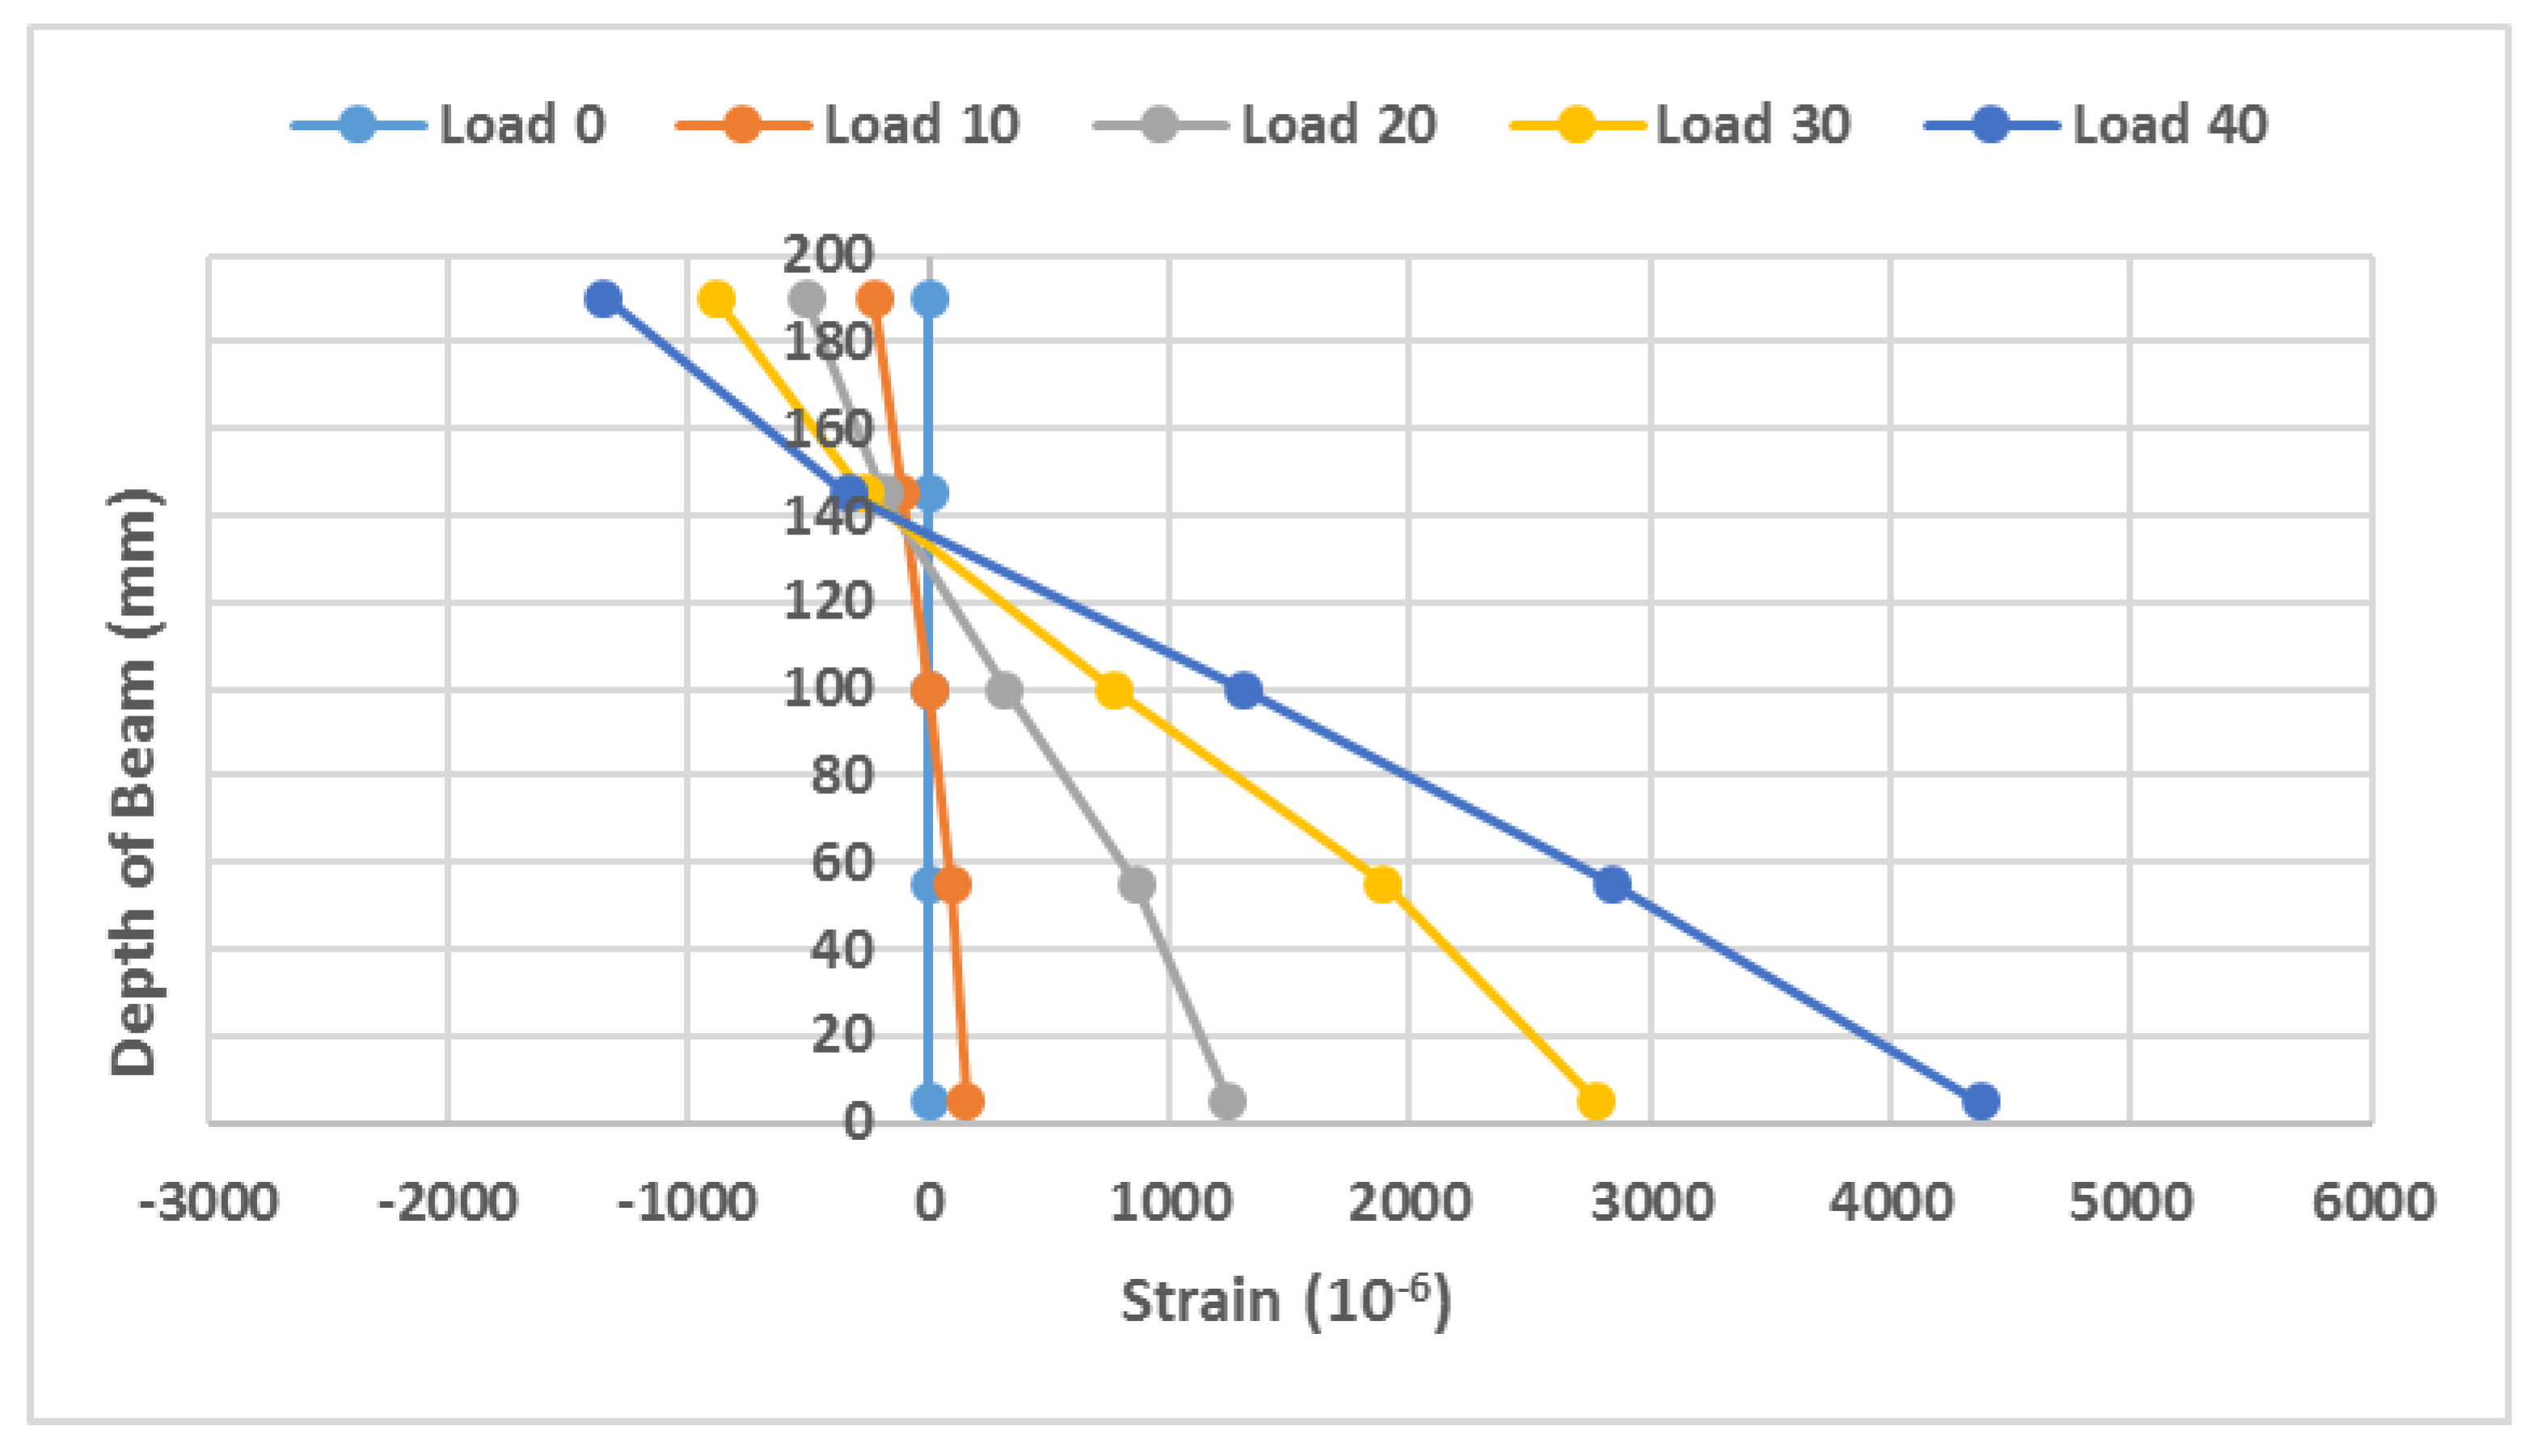
3.7. Position of Neutral Axis in Beams

Figure 10, Figure 11, Figure 12, Figure 13 and Figure 14 show the depth of the neutral axis for all beams. The neutral axis position was determined by the measured concrete strain along with the depth of the beams. Generally, with the increase of applied load, the neutral axis was shifted upward [35], which was due to the exposure of the beams under the pure positive moment. Consequently, the region under compression became narrower until the failure of the concrete in the compression region. Table 8 shows the depth of the neutral axis of all beams at the point of the appearance of the first crack and failure load. The movement of the neutral axis in specimen CC was recorded to be 26 mm.
The depth neutral measured from the top of the beam specimens.

3.8. Distribution of Crack on Beams Span

Figure 15 shows the generated cracks distribution along the beams’ span. For all beams, the first crack appeared in the mid-span of the pure moment region. In CC, three out of 16 cracks were located in the pure moment region, indicating the occurrence of 19% of the cracks in that region. The number of cracks in the pure moment region for the beam RC, RF, RA and PC were 3, 3, 2 and 4, respectively. In addition, the beam RC and PC showed 25% of crack formation in the pure moment region, while specimen RA displayed only 17% of the cracks in this region. This difference can be due to the characteristics of the ceramic materials used for designing the beams and the improved ultimate load capacity of the proposed beams. Additionally, the number of cracks in different beams varied in the range of 12 to 16. In short, it was demonstrated that by controlling the applied load, the deflection of beam specimens and the number of cracks could be adjusted.

4. Conclusions

The effects of recycled ceramic aggregates on the flexural strength behavior of the reinforced concrete and five full-scale beams were tested. The conclusions of this study can be presented as follows:
i.
The strength performance of the reinforced concrete beam made of recycled ceramic waste and conventional concrete to some extent showed a similar trend under applied stress, wherein an equal number of cracks across the length of the beam was formed. All beams failed in flexure because of the longitudinal reinforcement bar and subsequent rupture of the concrete in the compression region.
ii.
The overall performance of the reinforced concrete beams containing 100% ceramic waste as fine and coarse aggregates revealed an acceptable performance compared to the control beam. It was affirmed that ceramic wastes could be efficiently used in the production of sustainable concrete.
iii.
A comparison of the ultimate experimental load of all beams with CC showed that the RA beam achieved up to 99% of the ultimate load of the CC beam. Additionally, the first crack loads were similar for both specimens (14 kN). The total number of cracks for the CC and RA beam was 16 and 14, respectively.
iv.
The RA beam containing ceramic wastes as fine and coarse aggregates showed a reduction in the beam deflection by 43% compared to the CC beam. The RC and RF beams attained a 24% and 28% reduction in the deflection, respectively.
v.
The experimental result of the flexural capacity of all beams was quite close to the CC beam, wherein the difference between the maximum and minimum flexural capacity was only 1.21 kNm. The flexural capacity of RC was only 6% lower than the CC, indicating the potential benefits of the ceramic wastes in replacing cement and aggregates in the normal concrete.

Author Contributions

Conceptualization, M.S. and G.F.H.; methodology, M.S. and Z.K.; software, I.F.; validation, M.H.B., N.H.A.S.L. and N.F.B.A.; formal analysis, Z.K. and O.B.; investigation, M.S. and Z.K.; resources, N.H.A.S.L.; data curation, N.F.B.A.; writing—original draft preparation, M.S. and G.F.H.; writing—review and editing, Z.K. and G.F.H.; visualization, O.B. and I.F.; supervision, M.H.B.; project administration, M.S. and G.F.H.; funding acquisition, M.H.B. and N.H.A.S.L. All authors have read and agreed to the published version of the manuscript.

Funding

This research was funded by the Department of Manufacturing and Civil Engineering, Norwegian University of Science and Technology (NTNU).

Institutional Review Board Statement

Not applicable.

Informed Consent Statement

Not applicable.

Data Availability Statement

Data is contained within the article.

Acknowledgments

The authors would like to thank Universiti Teknologi Malaysia (UTM) for grant number (Q.J130000.2651.16J18), the Ministry of Higher Education, and laboratory staff for their support for completing this work.

Conflicts of Interest

The authors declare no conflict of interest.

Abbreviations

CCConventional concrete
RWCRecycled wastes ceramic
RCBsReinforced concrete beams
RFRecycled wastes ceramic as fine aggregates
RCRecycled wastes ceramic as coarse aggregates
RARecycled wastes ceramic as fine and coarse aggregates
OPCOrdinary Portland cement
LVDTslinear variable displacement transducer
w/cWater-cement ratio
w/bWater to binder ratio

References

  1. Awoyera, O.P.; Akinmusuru, J.O.; Ndambuki, J.M. Green concrete production with ceramic wastes and laterite. Constr. Build. Mater. 2016, 117, 29–36. [Google Scholar] [CrossRef]
  2. Mhaya, A.M.; Huseien, G.F.; Abidin, A.R.Z.; Ismail, M. Long-term mechanical and durable properties of waste tires rubber crumbs replaced GBFS modified concretes. Constr. Build. Mater. 2020, 256, 119505. [Google Scholar] [CrossRef]
  3. Huseien, G.F.; Sam, A.R.M.; Algaifi, H.A.; Alyousef, R. Development of a sustainable concrete incorporated with effective microorganism and fly Ash: Characteristics and modeling studies. Constr. Build. Mater. 2021, 285, 122899. [Google Scholar] [CrossRef]
  4. Mhaya, A.M.; Huseien, G.F.; Faridmehr, I.; Abidin, A.R.Z.; Alyousef, R.; Ismail, M. Evaluating mechanical properties and impact resistance of modified concrete containing ground Blast Furnace slag and discarded rubber tire crumbs. Constr. Build. Mater. 2021, 295, 123603. [Google Scholar] [CrossRef]
  5. Tošić, N.; Marinković, S.; Ignjatović, I. A database on flexural and shear strength of reinforced recycled aggregate concrete beams and comparison to Eurocode 2 predictions. Constr. Build. Mater. 2016, 127, 932–944. [Google Scholar] [CrossRef]
  6. Sato, R.; Maruyama, I.; Sogabe, T.; Sogo, M. Flexural Behavior of Reinforced Recycled Concrete Beams. J. Adv. Concr. Technol. 2007, 5, 43–61. [Google Scholar] [CrossRef]
  7. Lehner, P.; Horňáková, M. Effect of Amount of Fibre and Damage Level on Service Life of SFR Recycled Concrete in Aggressive Environment. Buildings 2021, 11, 489. [Google Scholar] [CrossRef]
  8. Algaifi, H.A.; Khan, M.I.; Shahidan, S.; Fares, G.; Abbas, Y.M.; Huseien, G.F.; Salami, B.A.; Alabduljabbar, H. Strength and Acid Resistance of Ceramic-Based Self-Compacting Alkali-Activated Concrete: Optimizing and Predicting Assessment. Materials 2021, 14, 6208. [Google Scholar] [CrossRef]
  9. Seara-Paz, S.; González-Fonteboa, B.; Martínez-Abella, F.; Carro-López, D. Long-term flexural performance of reinforced concrete beams with recycled coarse aggregates. Constr. Build. Mater. 2018, 176, 593–607. [Google Scholar] [CrossRef]
  10. Elçi, H. Utilisation of crushed floor and wall tile wastes as aggregate in concrete production. J. Clean. Prod. 2016, 112, 742–752. [Google Scholar] [CrossRef]
  11. Anderson, D.J.; Smith, S.; Au, F.T. Mechanical properties of concrete utilising waste ceramic as coarse aggregate. Constr. Build. Mater. 2016, 117, 20–28. [Google Scholar] [CrossRef]
  12. Shafigh, P.; Bin Mahmud, H.; Jumaat, M.Z.; Ahmmad, R.; Bahri, S. Structural lightweight aggregate concrete using two types of waste from the palm oil industry as aggregate. J. Clean. Prod. 2014, 80, 187–196. [Google Scholar] [CrossRef]
  13. Valdés, A.J.; Martínez, C.M.; Romero, M.I.G.; García, B.L.; Del Pozo, J.M.; Vegas, A.T. Re-use of construction and demolition residues and industrial wastes for the elaboration or recycled eco-efficient concretes. Span. J. Agric. Res. 2010, 8, 25. [Google Scholar] [CrossRef]
  14. Baeza, F.; Payá, J.; Galao, O.; Saval, J.; Garcés, P. Blending of industrial waste from different sources as partial substitution of Portland cement in pastes and mortars. Constr. Build. Mater. 2014, 66, 645–653. [Google Scholar] [CrossRef]
  15. Magbool, H.M. Utilisation of ceramic waste aggregate and its effect on Eco-friendly concrete: A review. J. Build. Eng. 2021, 47, 103815. [Google Scholar] [CrossRef]
  16. Zimbili, O.; Salim, W.; Ndambuki, M. A review on the usage of ceramic wastes in concrete production. Int. J. Civ. Environ. Struct. Constr. Archit. Eng. 2014, 8, 91–95. [Google Scholar]
  17. Samadi, M.; Huseien, G.F.; Mohammadhosseini, H.; Lee, H.S.; Lim, N.H.A.S.; Tahir, M.M.; Alyousef, R. Waste ceramic as low cost and eco-friendly materials in the production of sustainable mortars. J. Clean. Prod. 2020, 266, 121825. [Google Scholar] [CrossRef]
  18. Medina, C.; de Rojas, M.I.S.; Thomas, C.; Polanco, J.A.; Frías, M. Durability of recycled concrete made with recycled ceramic sanitary ware aggregate. Inter-indicator relationships. Constr. Build. Mater. 2016, 105, 480–486. [Google Scholar] [CrossRef]
  19. Ledesma, E.F.; Jiménez, J.R.; Ayuso, J.; Fernández, J.M.; de Brito, J. Maximum feasible use of recycled sand from construction and demolition waste for eco-mortar production—Part-I: Ceramic masonry waste. J. Clean. Prod. 2015, 87, 692–706. [Google Scholar] [CrossRef]
  20. Senthamarai, R.; Manoharan, P.D. Concrete with ceramic waste aggregate. Cem. Concr. Compos. 2005, 27, 910–913. [Google Scholar] [CrossRef]
  21. Huang, B.; Dong, Q.; Burdette, E.G. Laboratory evaluation of incorporating waste ceramic materials into Portland cement and asphaltic concrete. Constr. Build. Mater. 2009, 23, 3451–3456. [Google Scholar] [CrossRef]
  22. Senthamarai, R.; Manoharan, P.D.; Gobinath, D. Concrete made from ceramic industry waste: Durability properties. Constr. Build. Mater. 2011, 25, 2413–2419. [Google Scholar] [CrossRef]
  23. Huseien, G.F.; Sam, A.R.M.; Shah, K.W.; Mirza, J.; Tahir, M.M. Evaluation of alkali-activated mortars containing high volume waste ceramic powder and fly ash replacing GBFS. Constr. Build. Mater. 2019, 210, 78–92. [Google Scholar] [CrossRef]
  24. Samadi, M.; Hussin, M.W.; Lee, H.S.; Sam, A.R.M.; Ismail, M.; Lim, N.H.A.S.; Ariffin, N.F.; Khalid, N.H.A. Properties of mortar containing ceramic powder waste as cement replacement. J. Teknol. 2015, 77, 93–97. [Google Scholar] [CrossRef] [Green Version]
  25. Huseien, G.F.; Sam, A.R.M.; Mirza, J.; Tahir, M.M.; Asaad, M.A.; Ismail, M.; Shah, K.W. Waste ceramic powder incorporated alkali activated mortars exposed to elevated Temperatures: Performance evaluation. Constr. Build. Mater. 2018, 187, 307–317. [Google Scholar] [CrossRef]
  26. Fernandes, M.; Sousa, A.; Dias, A. Environmental Impacts and Emissions Trading-Ceramic Industry: A Case Study; Technological Centre of Ceramics and Glass, Portuguese Association of Ceramic industry: Coimbra, Portugal, 2004. (In Portuguese) [Google Scholar]
  27. Torgal, F.P.; Jalali, S. Reusing ceramic wastes in concrete. Constr. Build. Materials. 2011, 24, 832–838. [Google Scholar] [CrossRef]
  28. Limbachiya, M.; Meddah, M.S.; Ouchagour, Y. Use of recycled concrete aggregate in fly-ash concrete. Constr. Build. Mater. 2012, 27, 439–449. [Google Scholar] [CrossRef]
  29. Heidari, A.; Tavakoli, D. A study of the mechanical properties of ground ceramic powder concrete incorporating nano-SiO2 particles. Constr. Build. Mater. 2013, 38, 255–264. [Google Scholar] [CrossRef]
  30. Huseien, G.F.; Mirza, J.; Ismail, M.; Hussin, M.W.; Arrifin, M.A.M.; Hussein, A.A. The Effect of Sodium Hydroxide Molarity and Other Parameters on Water Absorption of Geopolymer Mortars. Indian J. Sci. Technol. 2016, 9, 1–9. [Google Scholar] [CrossRef]
  31. Huseien, G.F.; Mirza, J.; Ismail, M.; Ghoshal, S.; Ariffin, M.A.M. Effect of metakaolin replaced granulated blast furnace slag on fresh and early strength properties of geopolymer mortar. Ain Shams Eng. J. 2018, 9, 1557–1566. [Google Scholar] [CrossRef] [Green Version]
  32. Meyer, C. The greening of the concrete industry. Cem. Concr. Compos. 2009, 31, 601–605. [Google Scholar] [CrossRef]
  33. Naceri, A.; Hamina, M.C. Use of waste brick as a partial replacement of cement in mortar. Waste Manag. 2009, 29, 2378–2384. [Google Scholar] [CrossRef] [PubMed]
  34. Jiménez, J.R.; Ayuso, J.; López, M.; Fernández, J.M.; De Brito, J.M.C.L. Use of fine recycled aggregates from ceramic waste in masonry mortar manufacturing. Constr. Build. Mater. 2013, 40, 679–690. [Google Scholar] [CrossRef]
  35. Martín-Morales, M.; Zamorano, M.; Ruiz-Moyano, A.; Valverde-Espinosa, I. Characterization of recycled aggregates construction and demolition waste for concrete production following the Spanish Structural Concrete Code EHE-08. Constr. Build. Mater. 2011, 25, 742–748. [Google Scholar] [CrossRef]
  36. Gupta, P.K.; Khaudhair, Z.A.; Ahuja, A.K. A new method for proportioning recycled concrete. Struct. Concr. 2016, 17, 677–687. [Google Scholar] [CrossRef]
  37. Gao, D.; Zhang, L. Flexural performance and evaluation method of steel fiber reinforced recycled coarse aggregate concrete. Constr. Build. Mater. 2018, 159, 126–136. [Google Scholar] [CrossRef]
  38. Mukai, T.; Kikuchi, M. Studies on utilization of recycled concrete for structural members (Part 1, Part 2). In Summaries of Technical Papers of Annual Meeting; Architectural Institute of Japan: Tokyo, Japan, 1978. [Google Scholar]
  39. Yagishita, F. Behavior of reinforced concrete beams containing recycled coarse aggregate. In Demolition and Reuse of Concrete and Masnr; Routledge: London, UK, 1994; pp. 331–342. [Google Scholar]
  40. Arezoumandi, M.; Smith, A.; Volz, J.S.; Khayat, K.H. An experimental study on flexural strength of reinforced concrete beams with 100% recycled concrete aggregate. Eng. Struct. 2015, 88, 154–162. [Google Scholar] [CrossRef]
  41. Ignjatović, I.S.; Marinković, S.B.; Mišković, Z.M.; Savić, A. Flexural behavior of reinforced recycled aggregate concrete beams under short-term loading. Mater. Struct. 2012, 46, 1045–1059. [Google Scholar] [CrossRef]
  42. Fathifazl, G.; Razaqpur, A.; Isgor, O.; Abbas, A.; Fournier, B.; Foo, S. Shear strength of reinforced recycled concrete beams without stirrups. Mag. Concr. Res. 2009, 61, 477–490. [Google Scholar] [CrossRef]
  43. Mohammed, T.U.; Das, H.K.; Mahmood, A.H.; Rahman, N.; Awal, M. Flexural performance of RC beams made with recycled brick aggregate. Constr. Build. Mater. 2017, 134, 67–74. [Google Scholar] [CrossRef]
  44. Kang, T.H.-K.; Kim, W.; Kwak, Y.-K.; Hong, S.-G. Flexural Testing of Reinforced Concrete Beams with Recycled Concrete Aggregates. ACI Struct. J. 2014, 111, 607–616. [Google Scholar] [CrossRef]
  45. Choi, W.-C.; Yun, H.D. Long-term deflection and flexural behavior of reinforced concrete beams with recycled aggregate. Mater. Des. 2013, 51, 742–750. [Google Scholar] [CrossRef]
Figure 1. SEM of (a) OPC and (b) WCP.
Buildings 12 00439 g001
Figure 2. Details geometry of the studied beams.
Buildings 12 00439 g002
Figure 3. Arrangement of test setup of the beams.
Buildings 12 00439 g003
Figure 4. Comparison of mid-span deflection values of all beams containing ceramic wastes with CC (a) RC (b) RF (c) RA (d) PC.
Buildings 12 00439 g004
Figure 5. Load-dependent mid-span deflection of the studied beams in the linear region showing the data correlation (a) CC (b) RC (c) RF (d) RA (e) PC.
Buildings 12 00439 g005
Figure 6. Load–strain curve of the reinforcement bars used in beams (a) RC (b) RF (c) RA (d) PC.
Buildings 12 00439 g006
Figure 7. Load–strain curve of concrete in beam specimens.
Buildings 12 00439 g007
Figure 8. Load–strain behavior of the beams in the compression region (a) CC (b) RC (c) RF (d) RA (e) PC.
Buildings 12 00439 g008
Figure 9. Load against mid-span strain of the beams.
Buildings 12 00439 g009
Figure 10. Depth of neutral axis for CC.
Buildings 12 00439 g010
Figure 11. Depth of neutral axis for RC.
Buildings 12 00439 g011
Figure 12. Depth of neutral axis for specimen RF.
Buildings 12 00439 g012
Figure 13. Depth of neutral axis for RA.
Buildings 12 00439 g013
Figure 14. Depth of neutral axis for PC.
Buildings 12 00439 g014
Figure 15. Distribution of cracks in all specimens.
Buildings 12 00439 g015
Table 1. Compositions of ceramic waste powder and OPC.
Composition (%)SiO2Al2O3Fe2O3CaOK2OTiO2LOI
OPC16.404.243.5368.300.220.092.40
WCP74.1017.803.571.112.690.460.10
Table 2. Mix proportions of different concrete mixes.
Label of SpecimenOPCWCPRiver SandFine
Ceramic
Crushed GraniteCoarse
Ceramic
Water
CC4650640010000250
RC4650640001000250
RF4650064010000250
RA4650064001000250
PC280185064001000250
All the units in this table are kg/m3.
Table 3. Properties of reinforced concrete specimens.
Label of SpecimenTension Reinforcement
Bars
The Ratio of Reinforcement Bars (ρt)Shear Reinforcement
Bars
fc’ (N/mm2)
CC2 ⱷ 120.75%ⱷ 10 @ 100mm52
RC2 ⱷ 120.75%ⱷ 10 @ 100mm43.5
RF2 ⱷ 120.75%ⱷ 10 @ 100mm45.6
RA2 ⱷ 120.75%ⱷ 10 @ 100mm51.7
PC2 ⱷ 120.75%ⱷ 10 @ 100mm41.5
Table 4. Load related to the first crack and number of cracks.
Label of SpecimenA load of First Crack (kN)Deflection at First Crack(mm)Ultimate Load
(kN)
Deflection at Ultimate Load (kN)Total Number of CrackCorrelation of First Crack Load to Ultimate Load (%)
CC143.6747.628.461629
RC102.3344.921.671222
RF143.0445.820.551331
RA142.6947.117.521230
PC123.0145.717.121526
Table 5. Deflection of beam specimens.
Label of
Specimen
At First Crack LoadAt Ultimate Load
Load (kN)Deflection (mm)Load (kN)Deflection (mm)
CC143.6747.628.46
RC102.9744.921.67
RF143.0445.820.55
RA142.6947.117.52
PC123.0145.716.12
Table 6. Ultimate flexural capacity of the proposed beams.
SpecimenExperimental Ultimate Load (kN)Ultimate Moment Capacity (kN.m)Theoretical Moment Capacity (kN.m)Compared to CC
(%)
CC47.621.413100
RC44.920.21394
RF45.820.61396
RA47.121.21399
PC45.720.61396
Table 7. Tensile strain of the reinforcement bars and ultimate loads.
SpecimenFirst Crack Load (kN)Reinforcement Bar Strain (10−6)50% of Ultimate Load (kN)Reinforcement Bar Strain (10−6)Ultimate Load (kN)Reinforcement
Bar Strain (10−6)
CC14111723.80193247.65551
RC1052822.45151044.97727
RF1447822.90117645.87524
RA1459423.55132347.15316
PC1255222.35140945.75320
Table 8. Depth of neutral axis in first crack load and failure load.
SpecimenLoad at First Crack (kN)The Depth of Neutral Axis at First Crack
Load (mm)
Ultimate Load
(kN)
The Depth of
Neutral Axis at
Ultimate Load
(mm)
CC147447.661
RC107144.948
RF147345.846
RA146147.143
PC127945.761
Publisher’s Note: MDPI stays neutral with regard to jurisdictional claims in published maps and institutional affiliations.

