
Geopolymer- and Cement-Based Fabric-Reinforced Matrix Composites for Shear Strengthening of Concrete Deep Beams: Laboratory Testing and Numerical Modeling


Abstract
:1. Introduction
2. Experimental Program
2.1. Test Matrix
2.2. Test Specimens
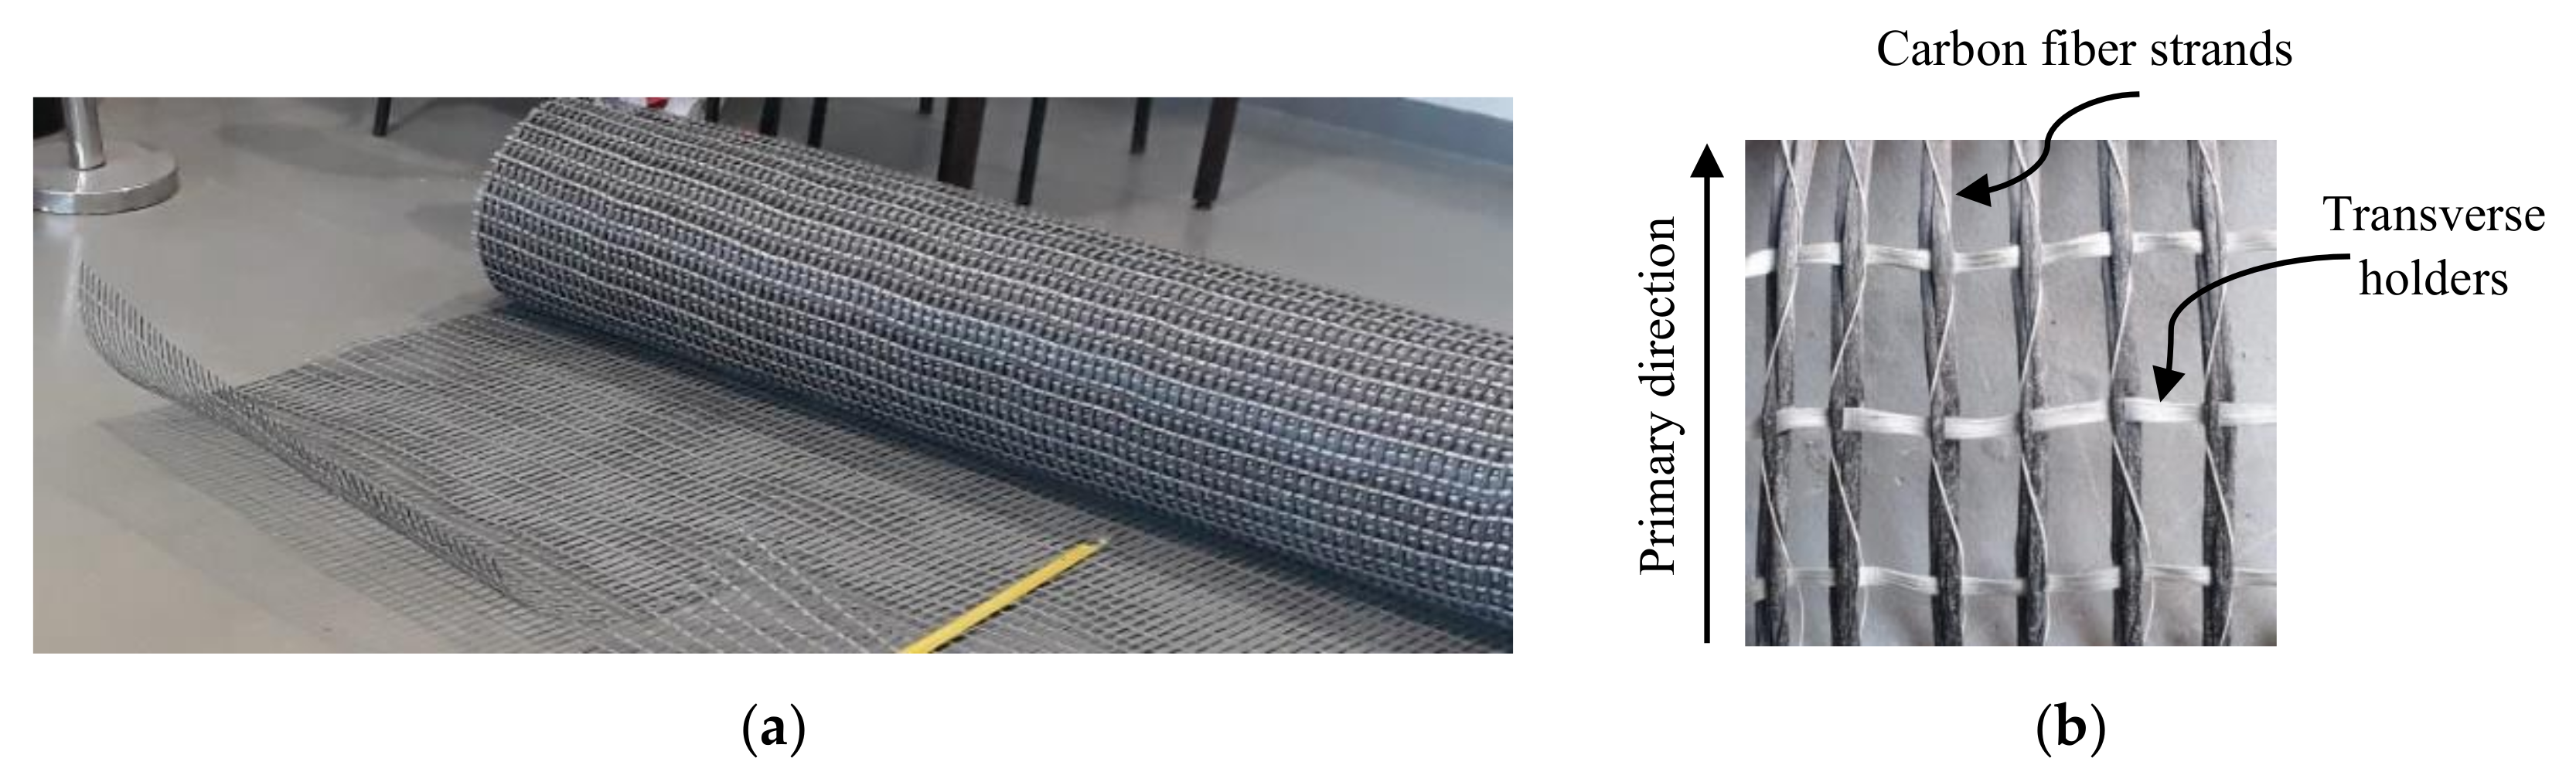
2.3. Materials
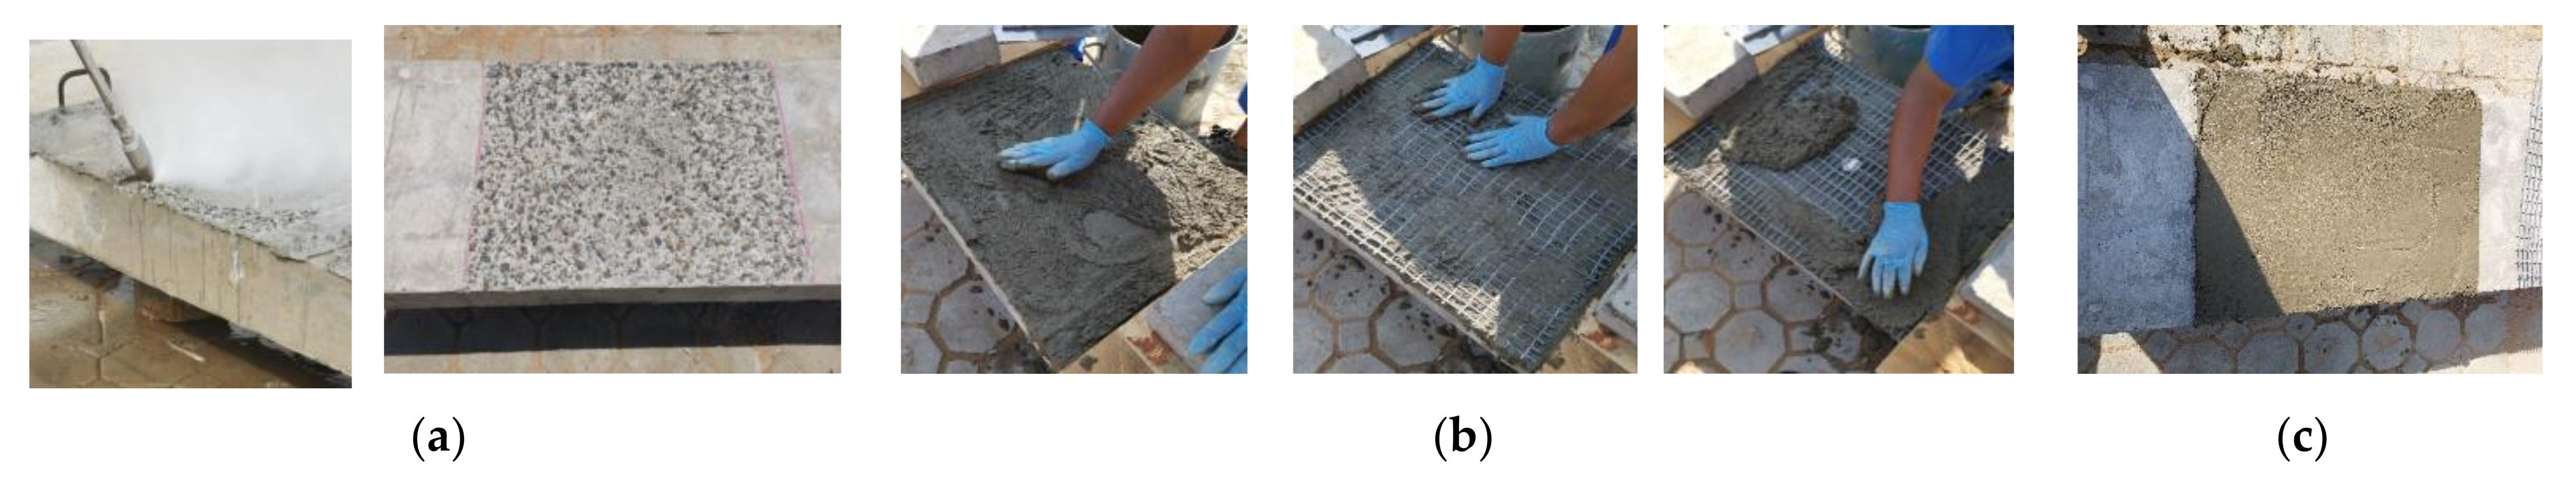
2.4. C-FRM Strengthening Methodology
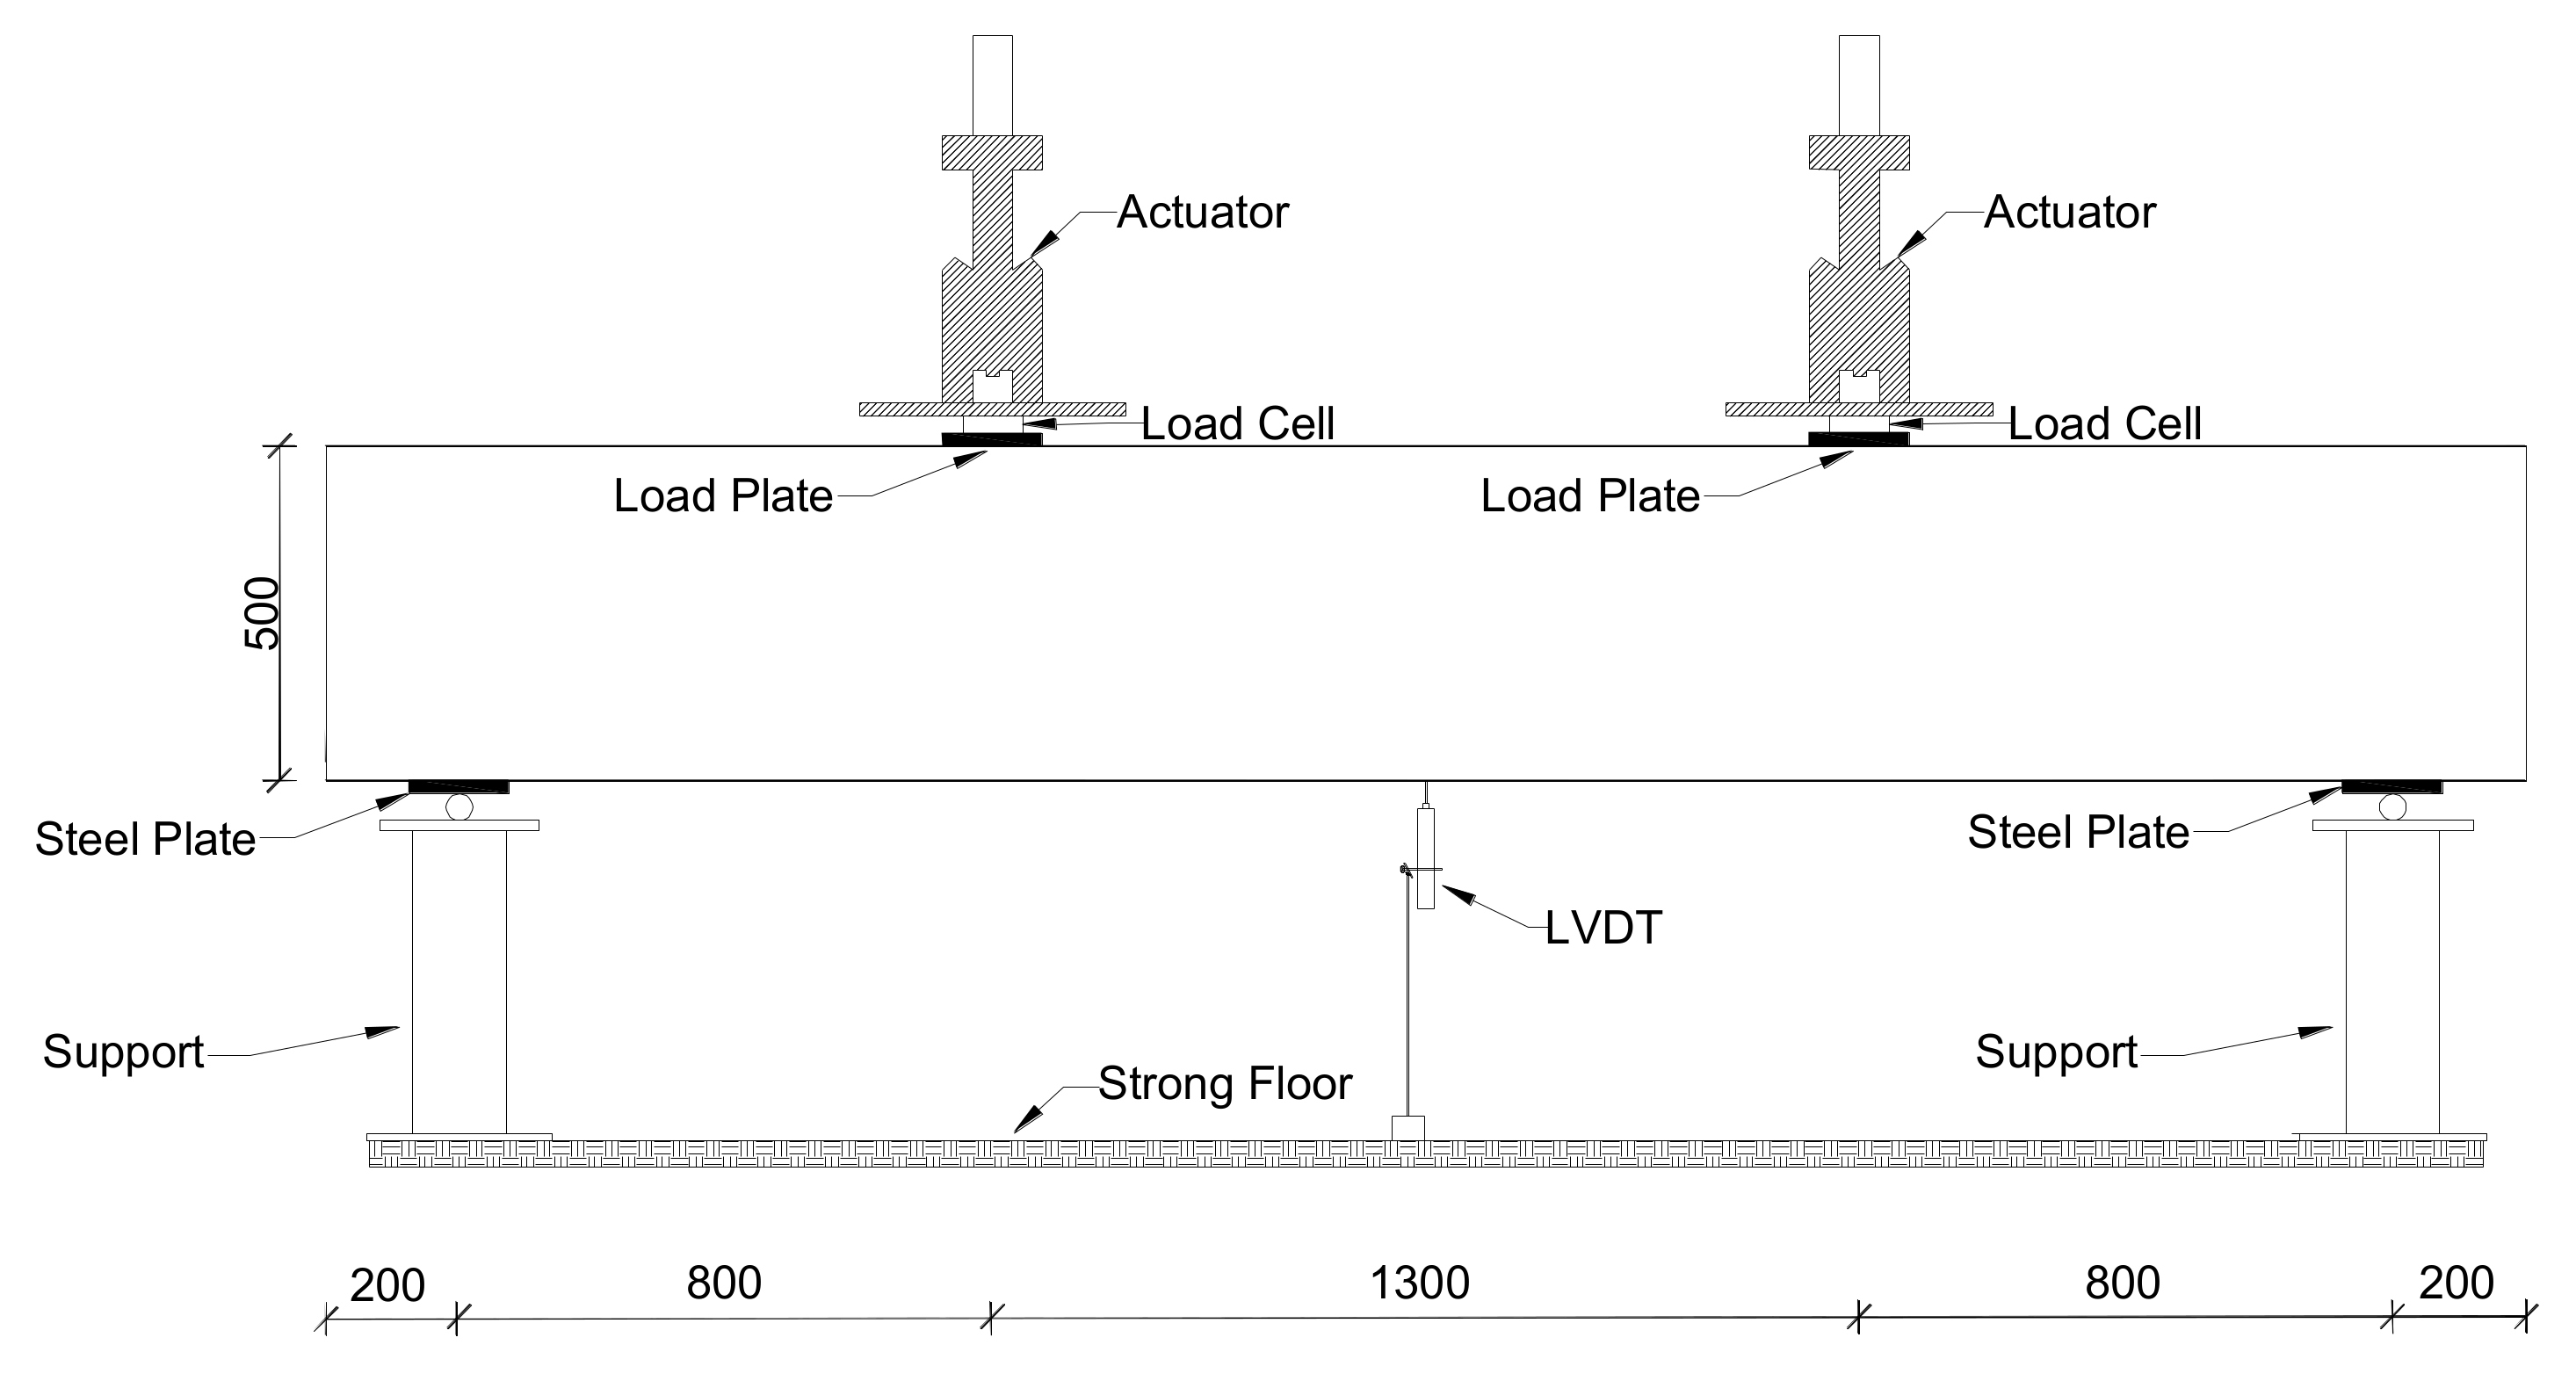
2.5. Test Set-Up and Instrumentation
3. Experimental Results
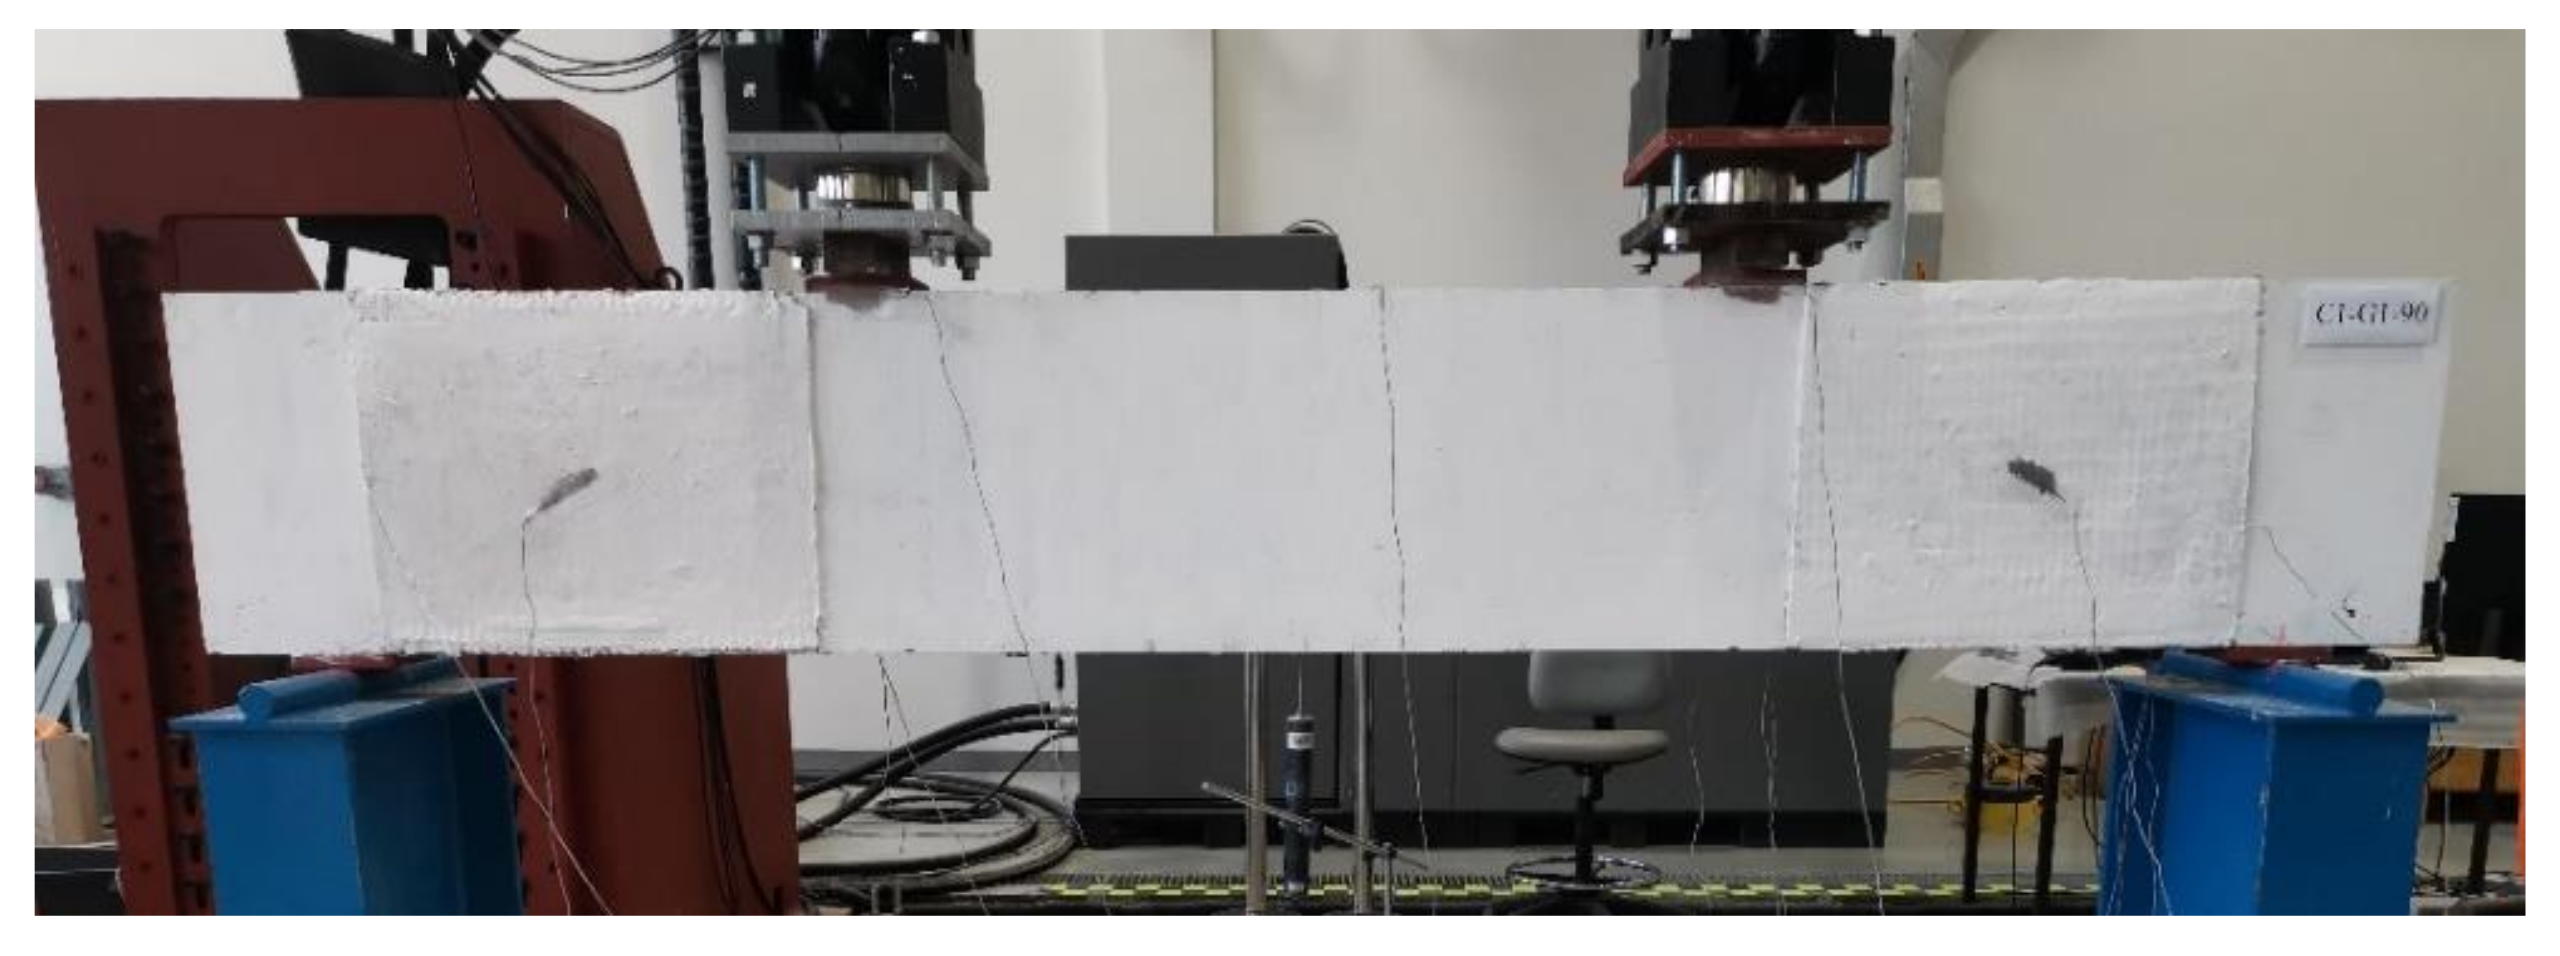
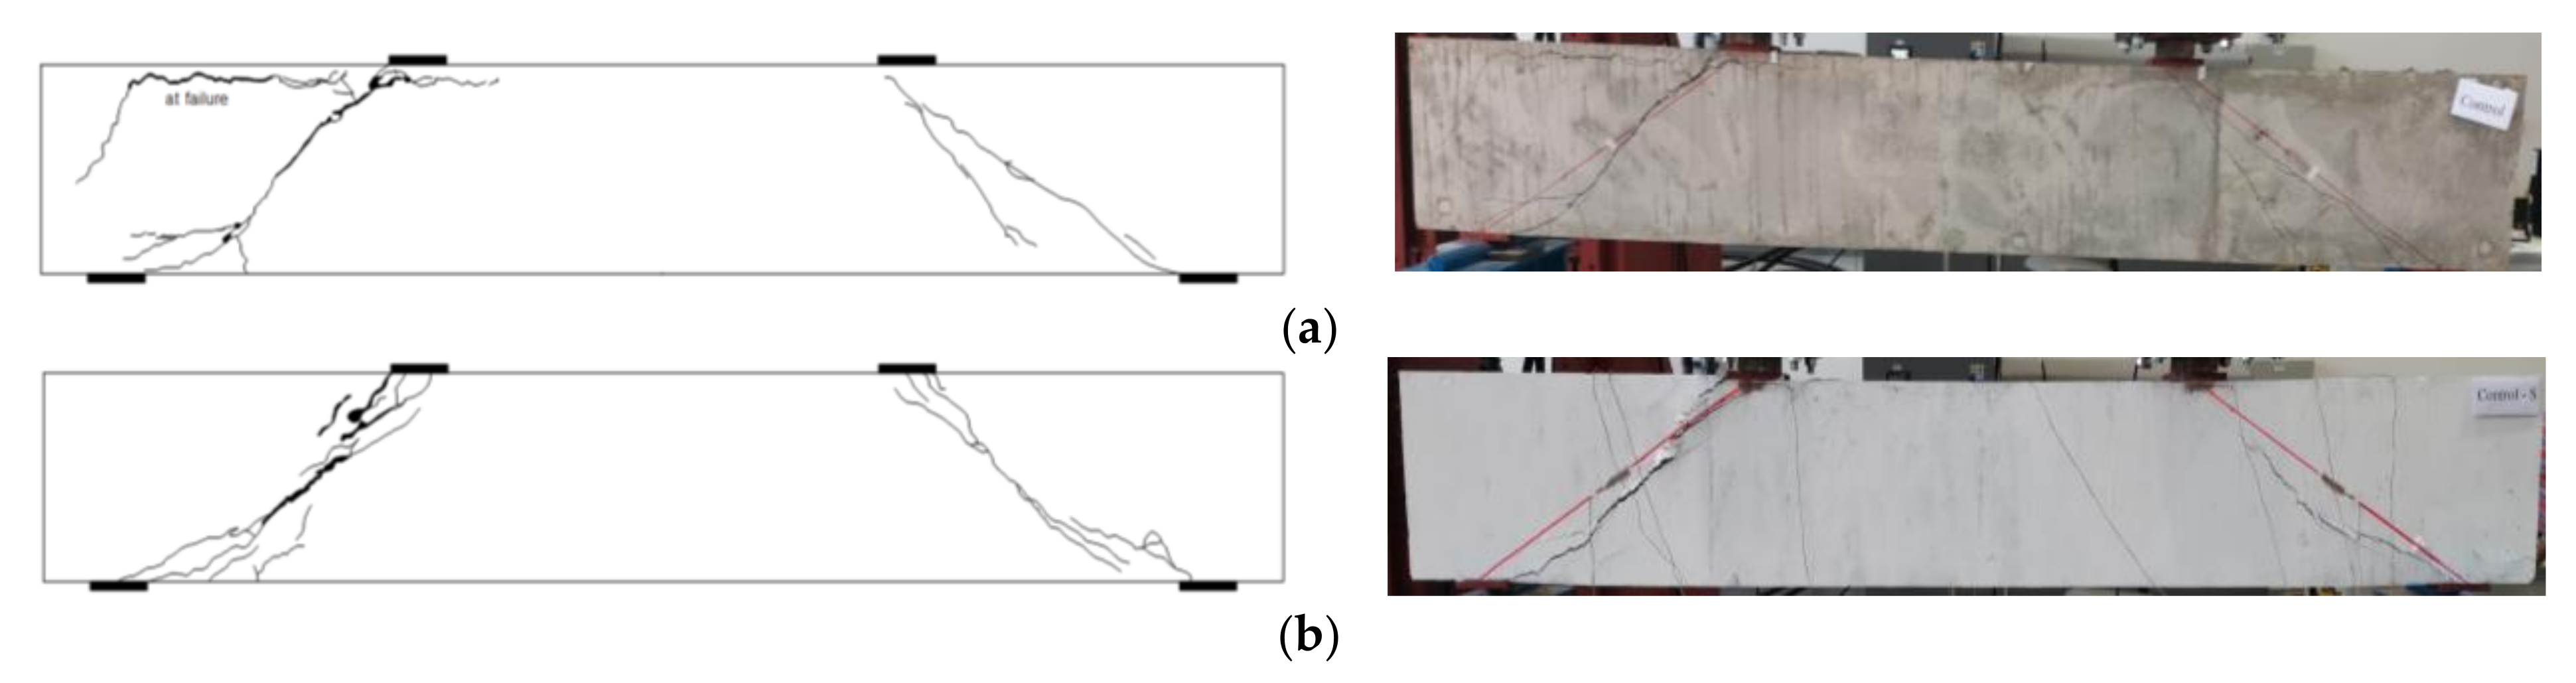
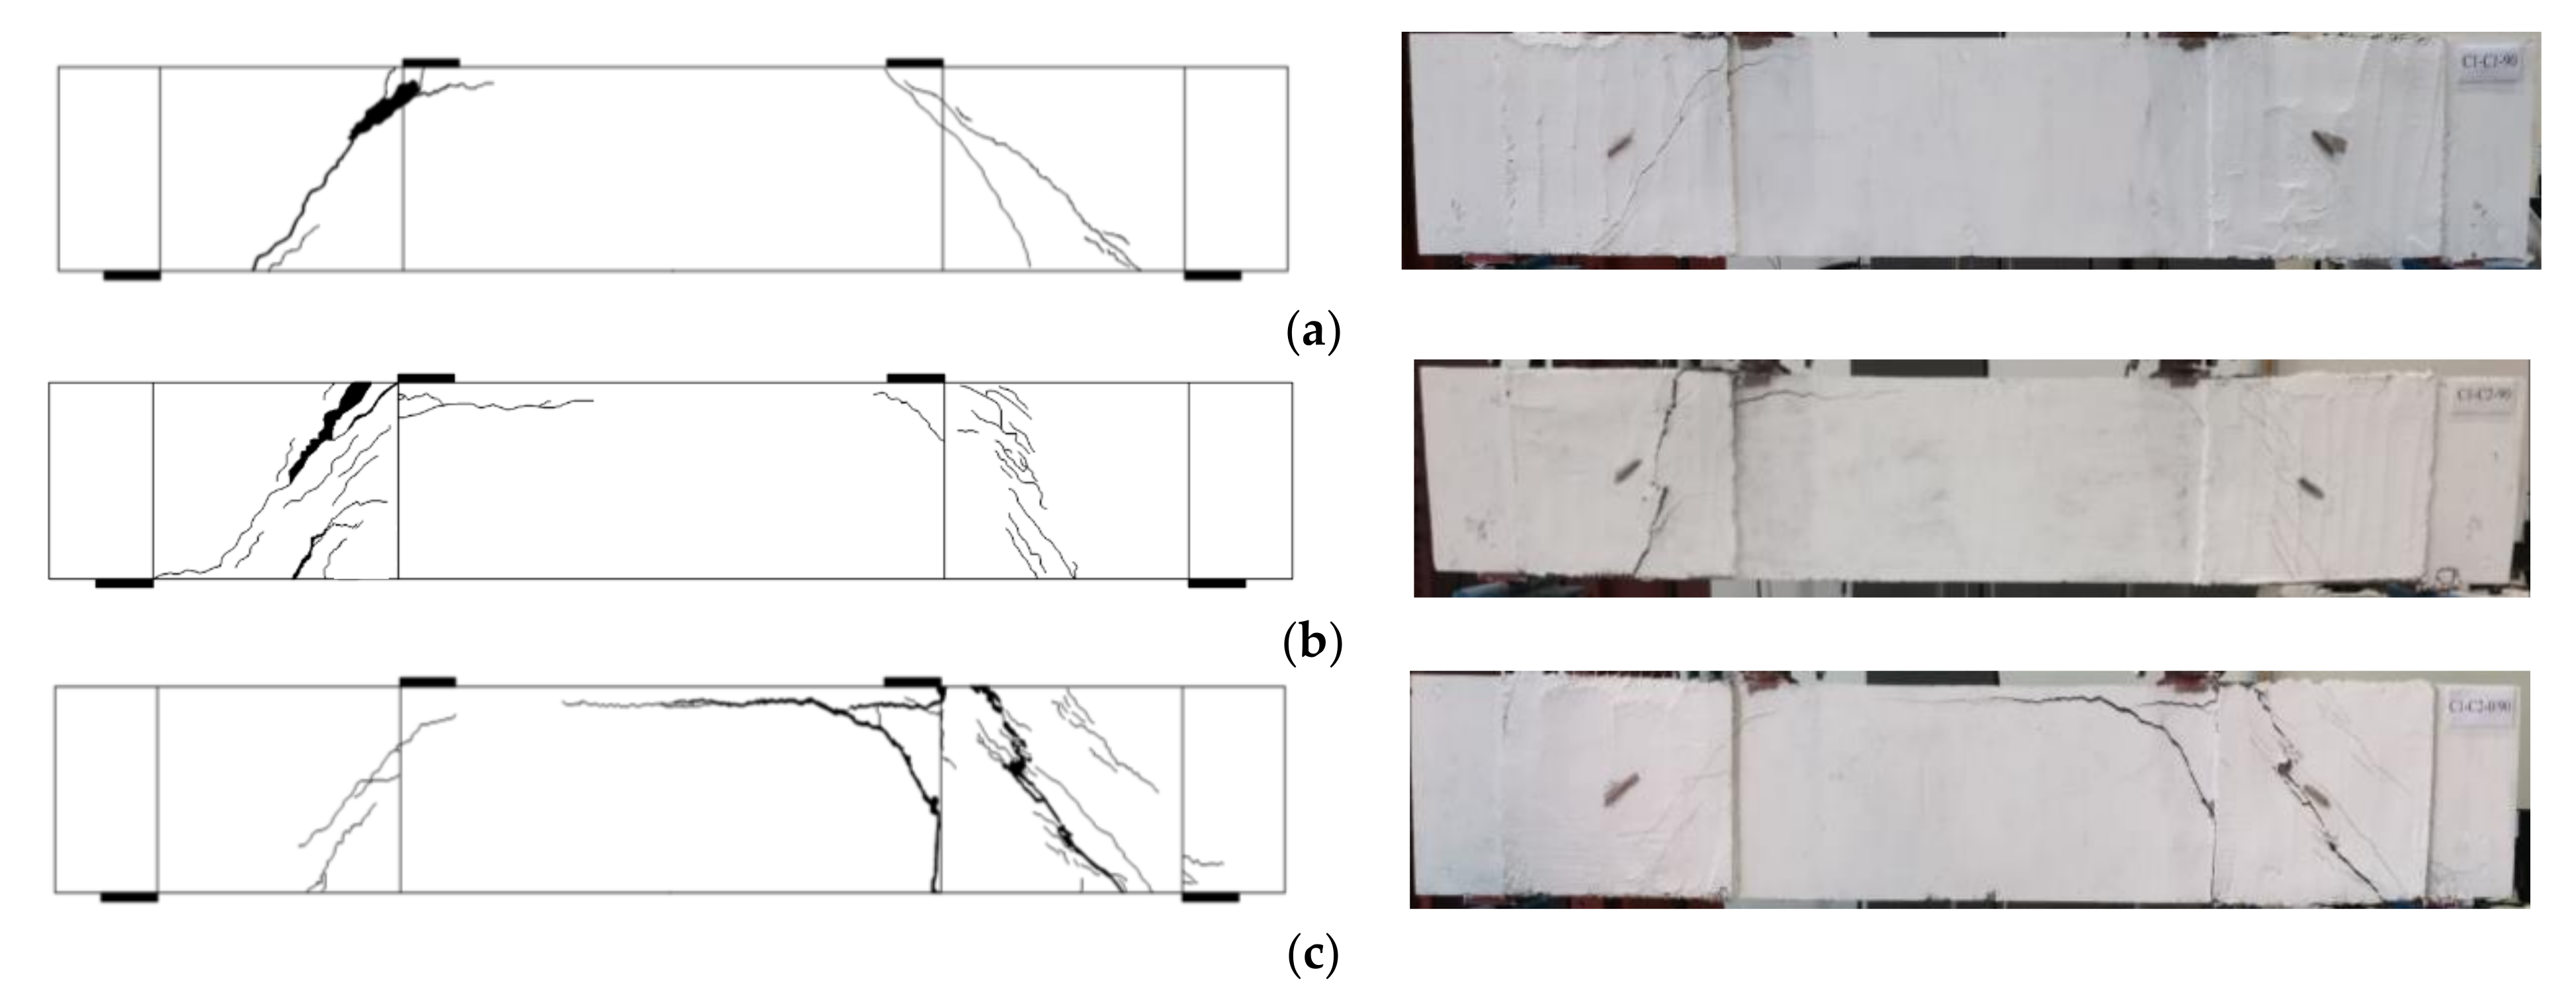
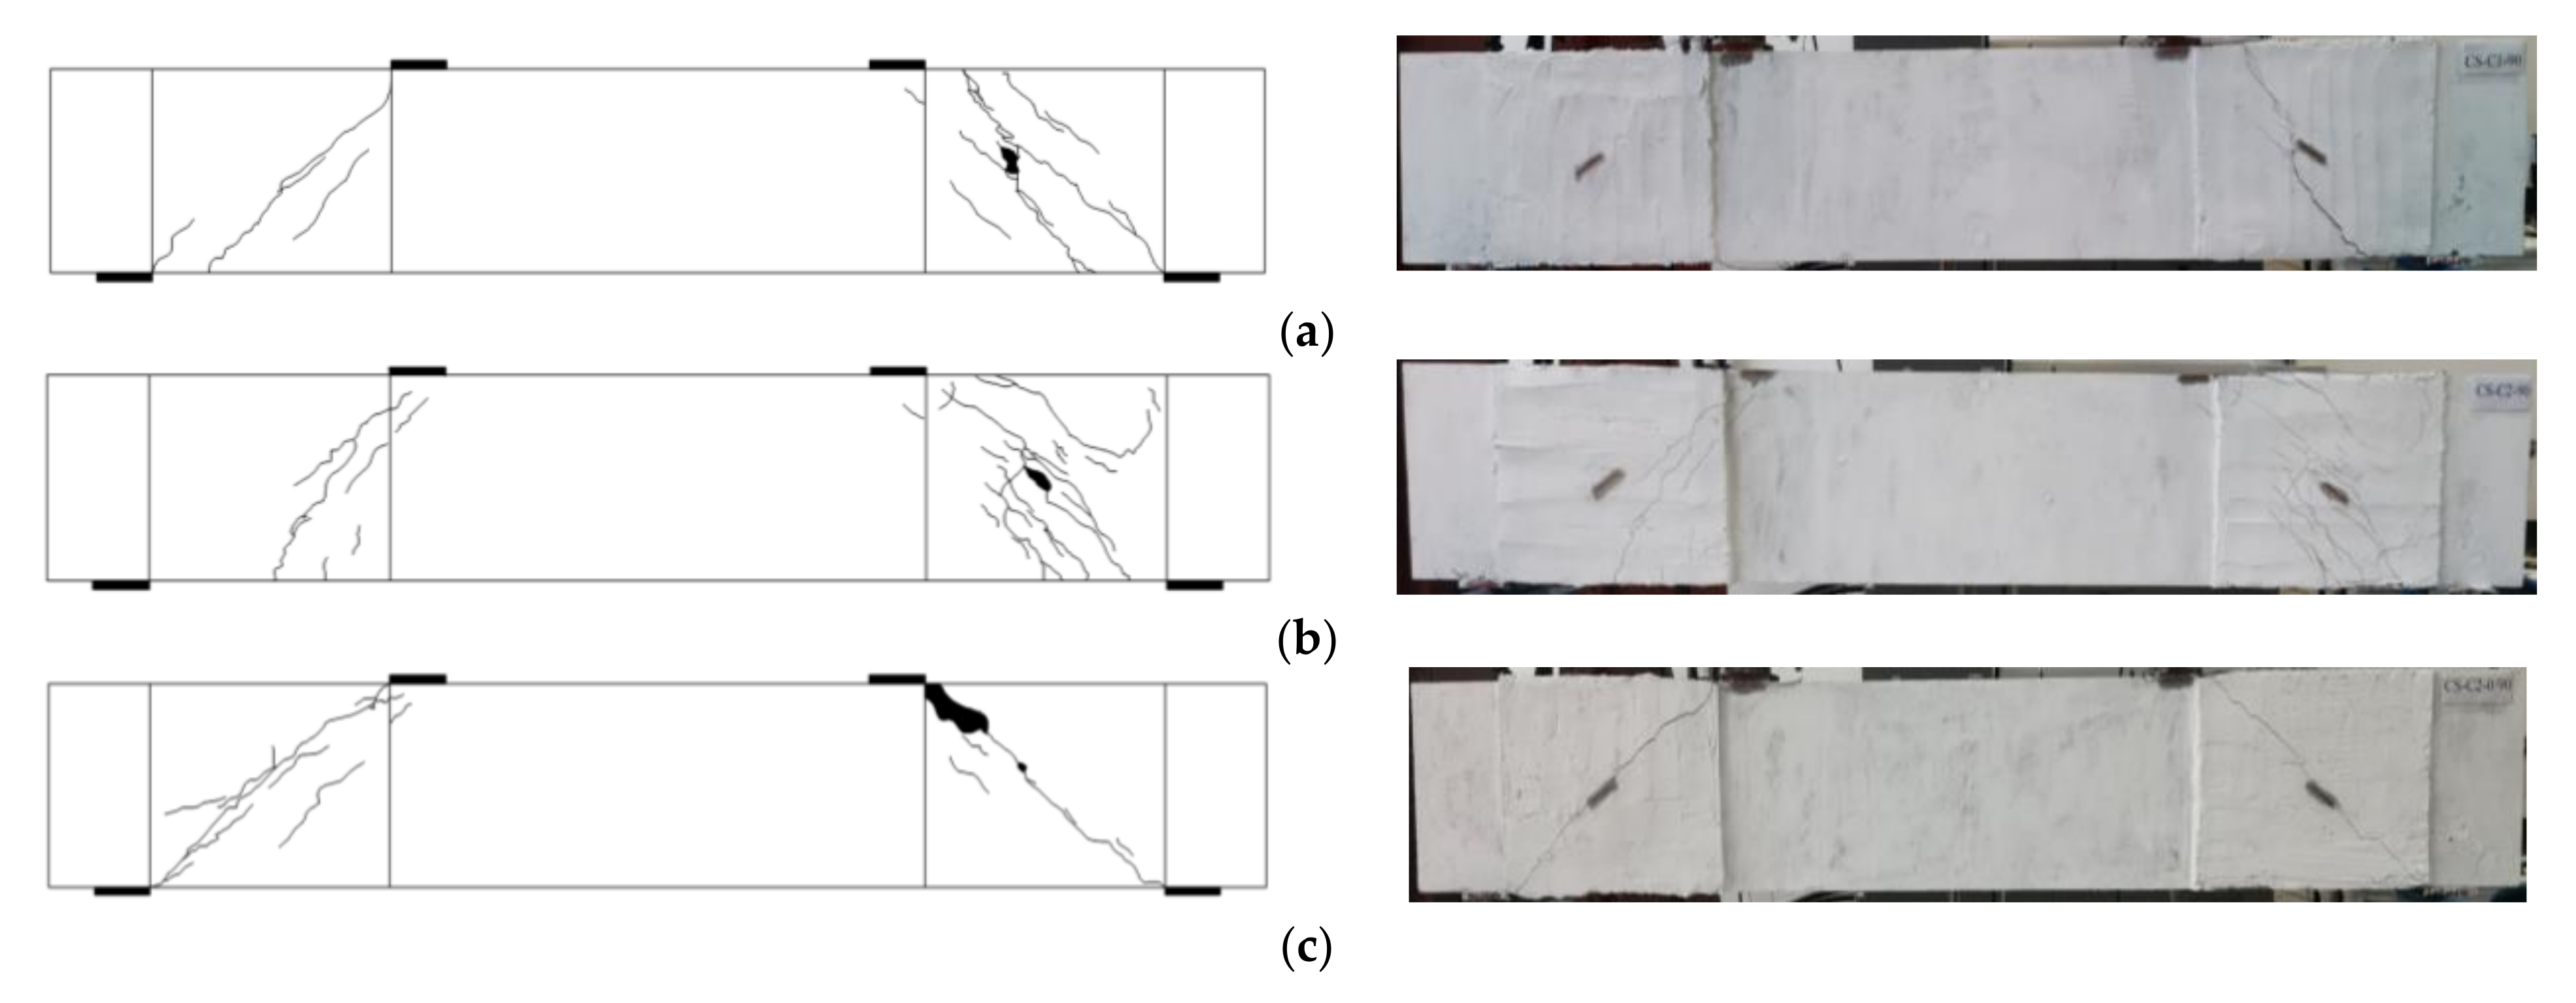
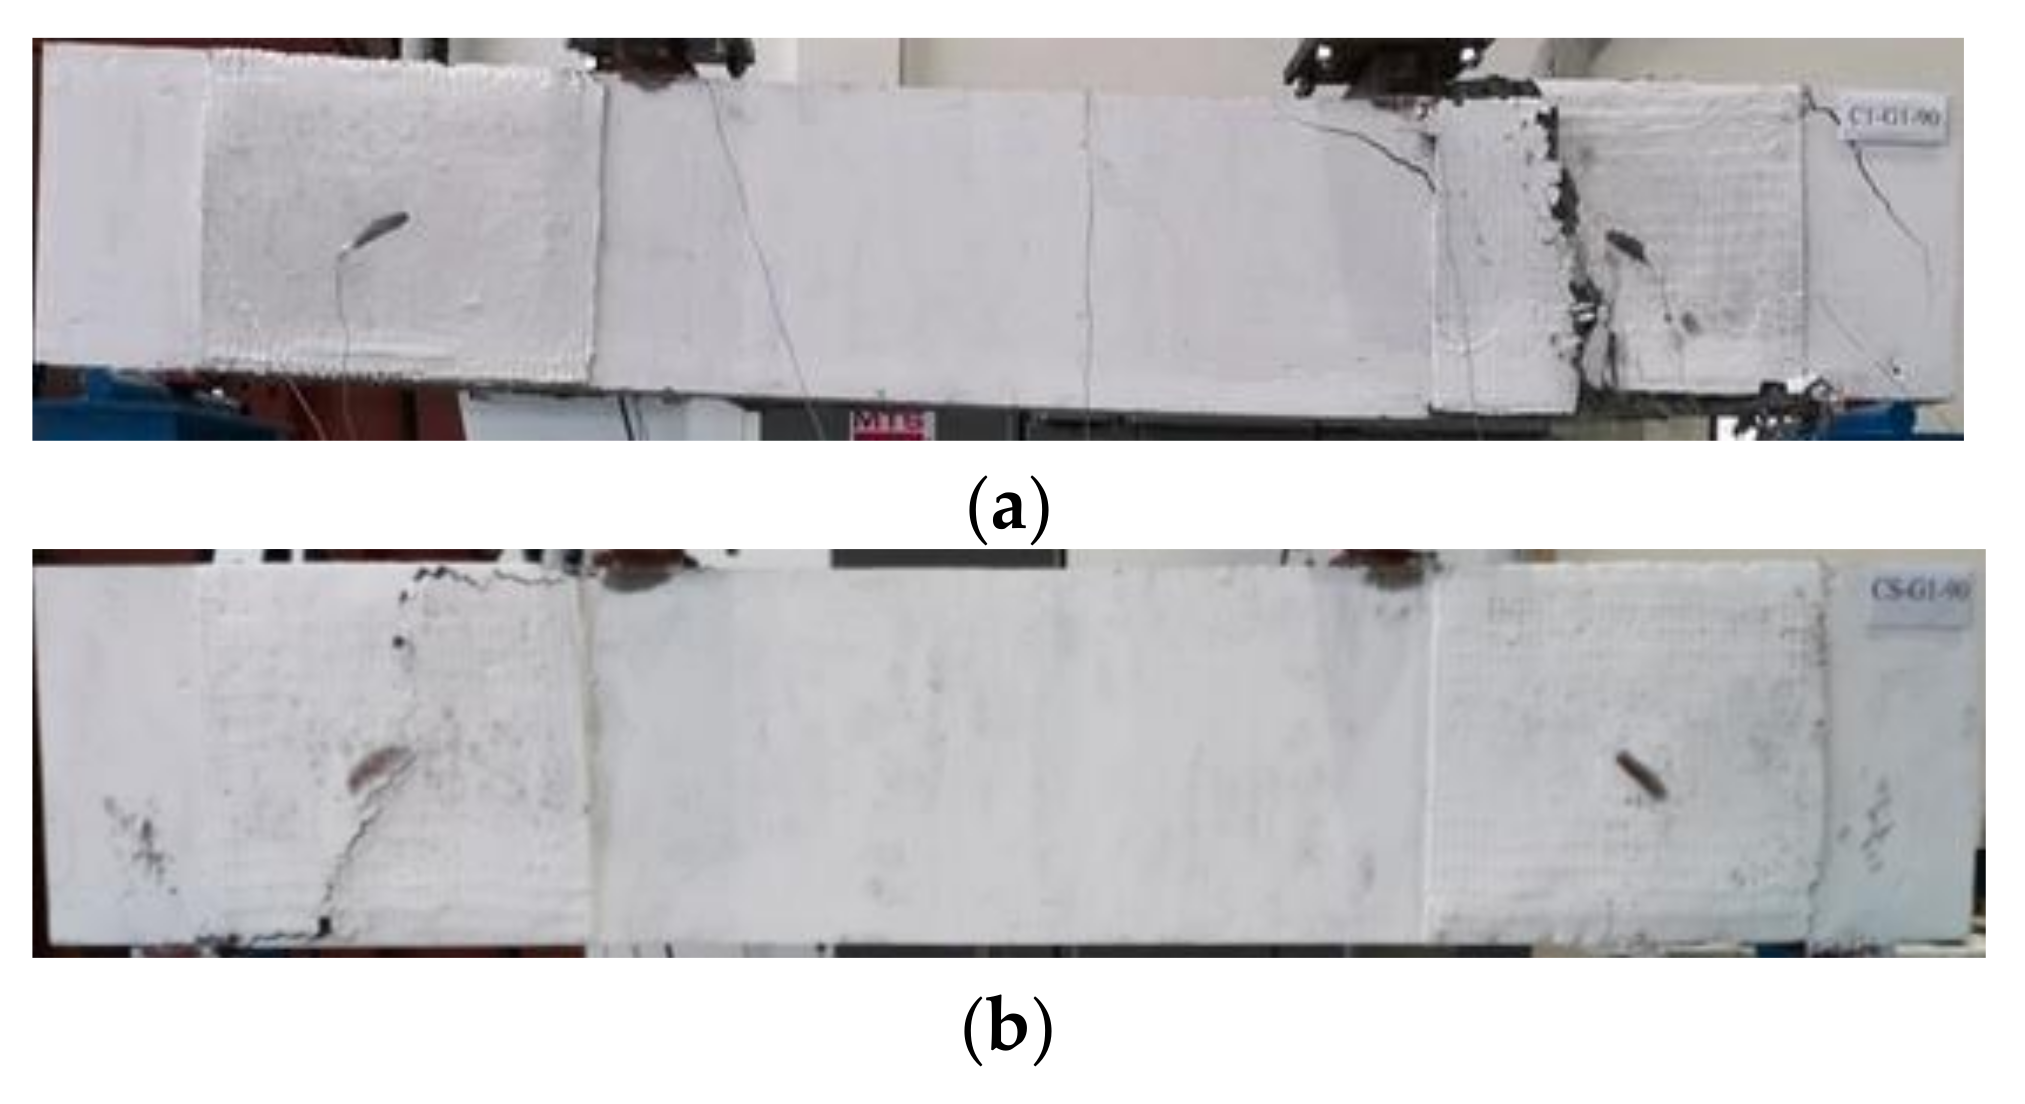
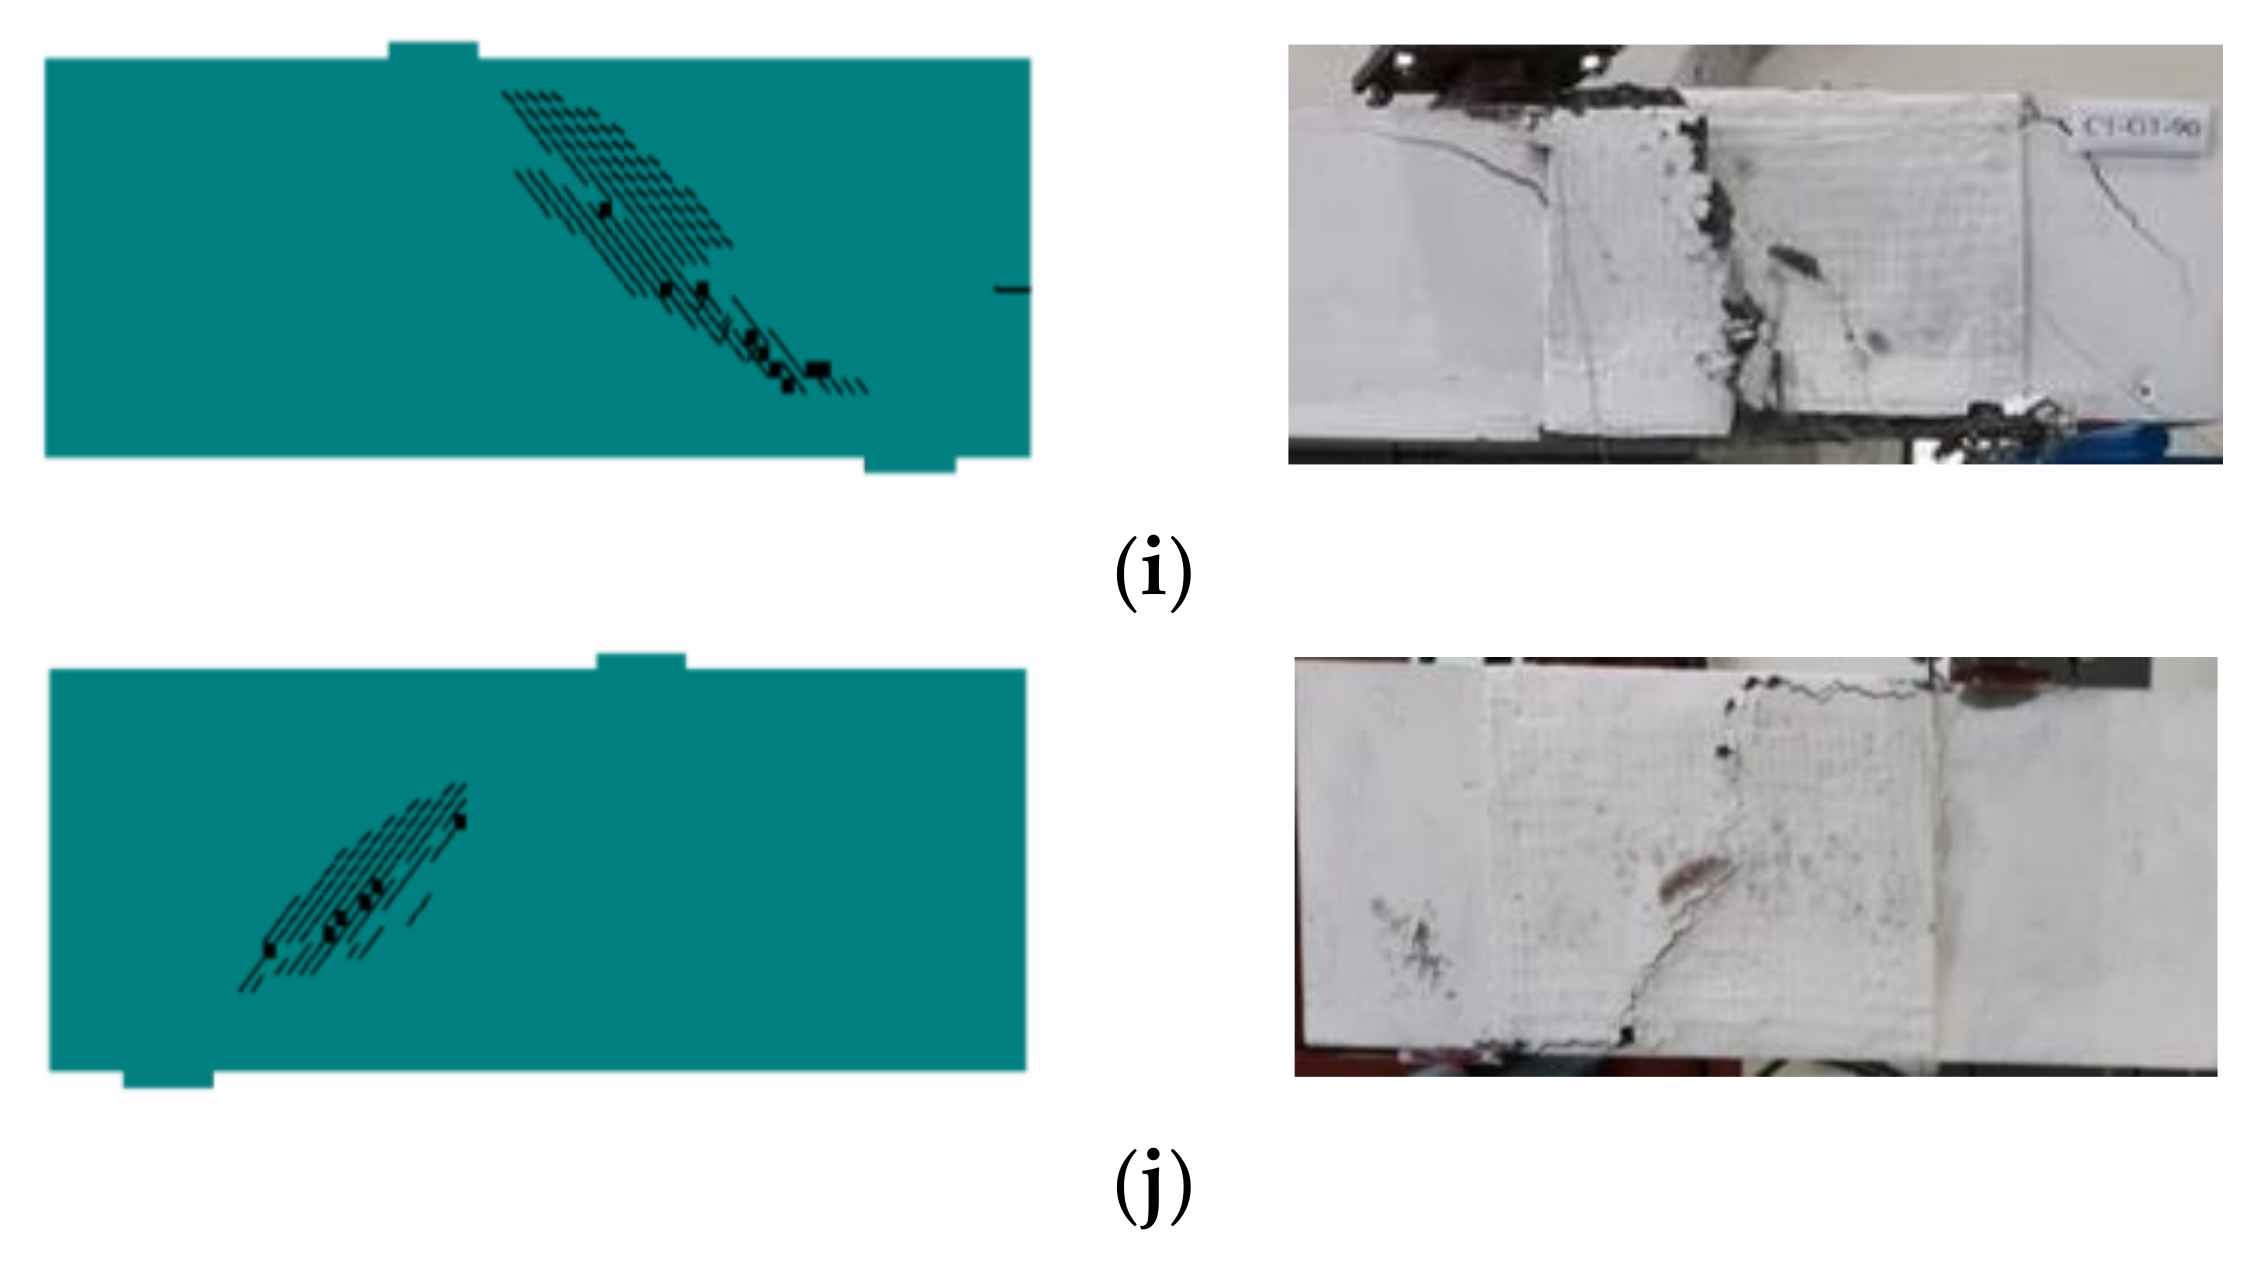
3.1. Crack Pattern and Failure Mode
3.2. Shear Load–Deflection Response
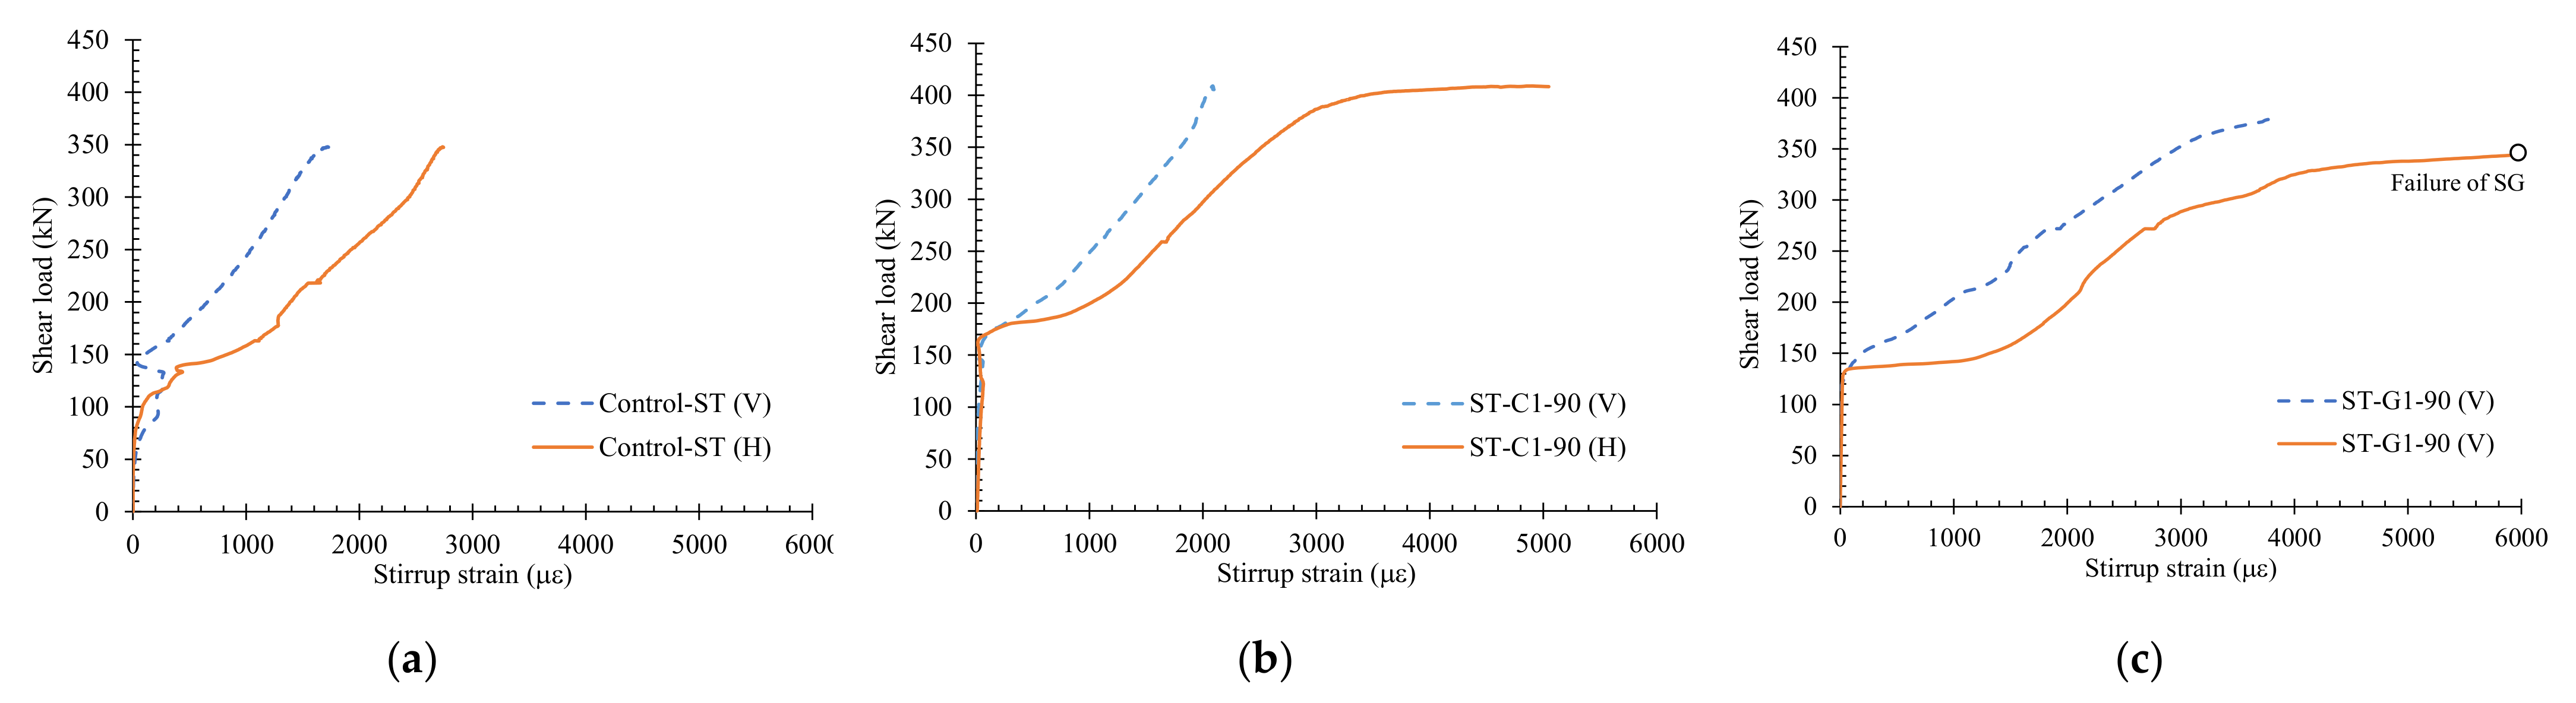
3.3. Stirrup Strains
3.4. Carbon Fabric Strains
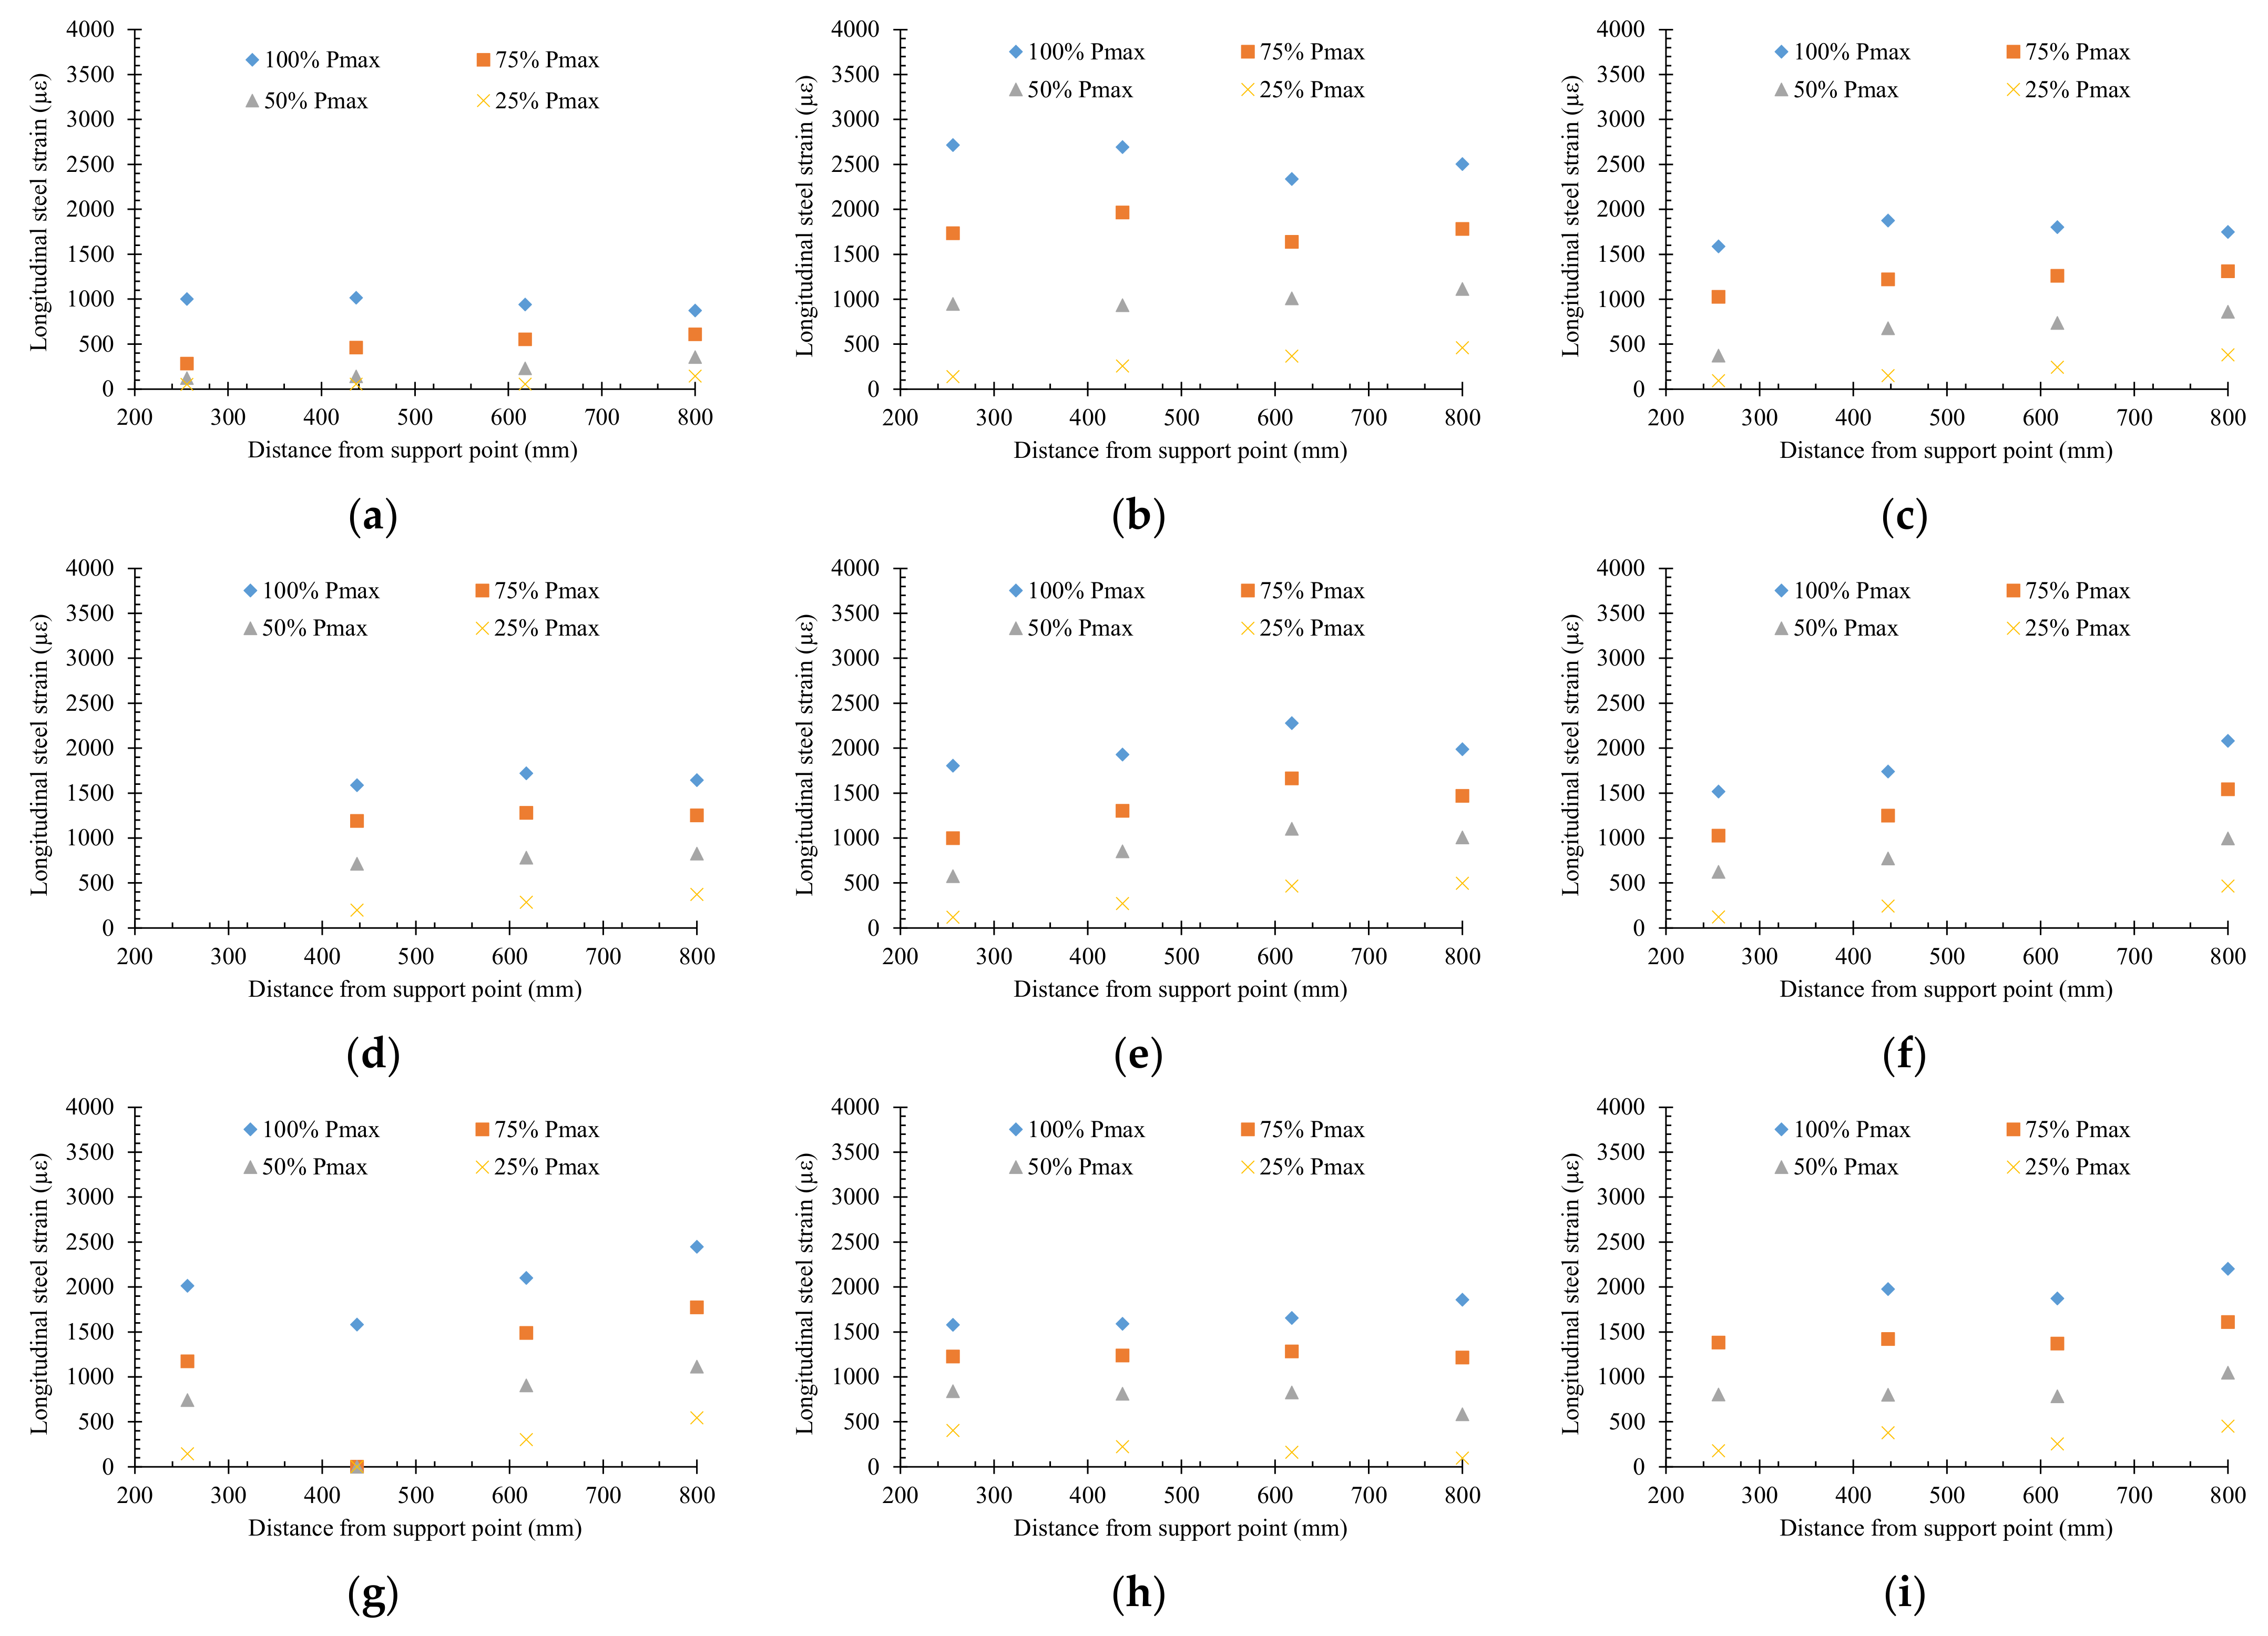
3.5. Steel Strains
4. Discussion
5. Finite Element Modeling
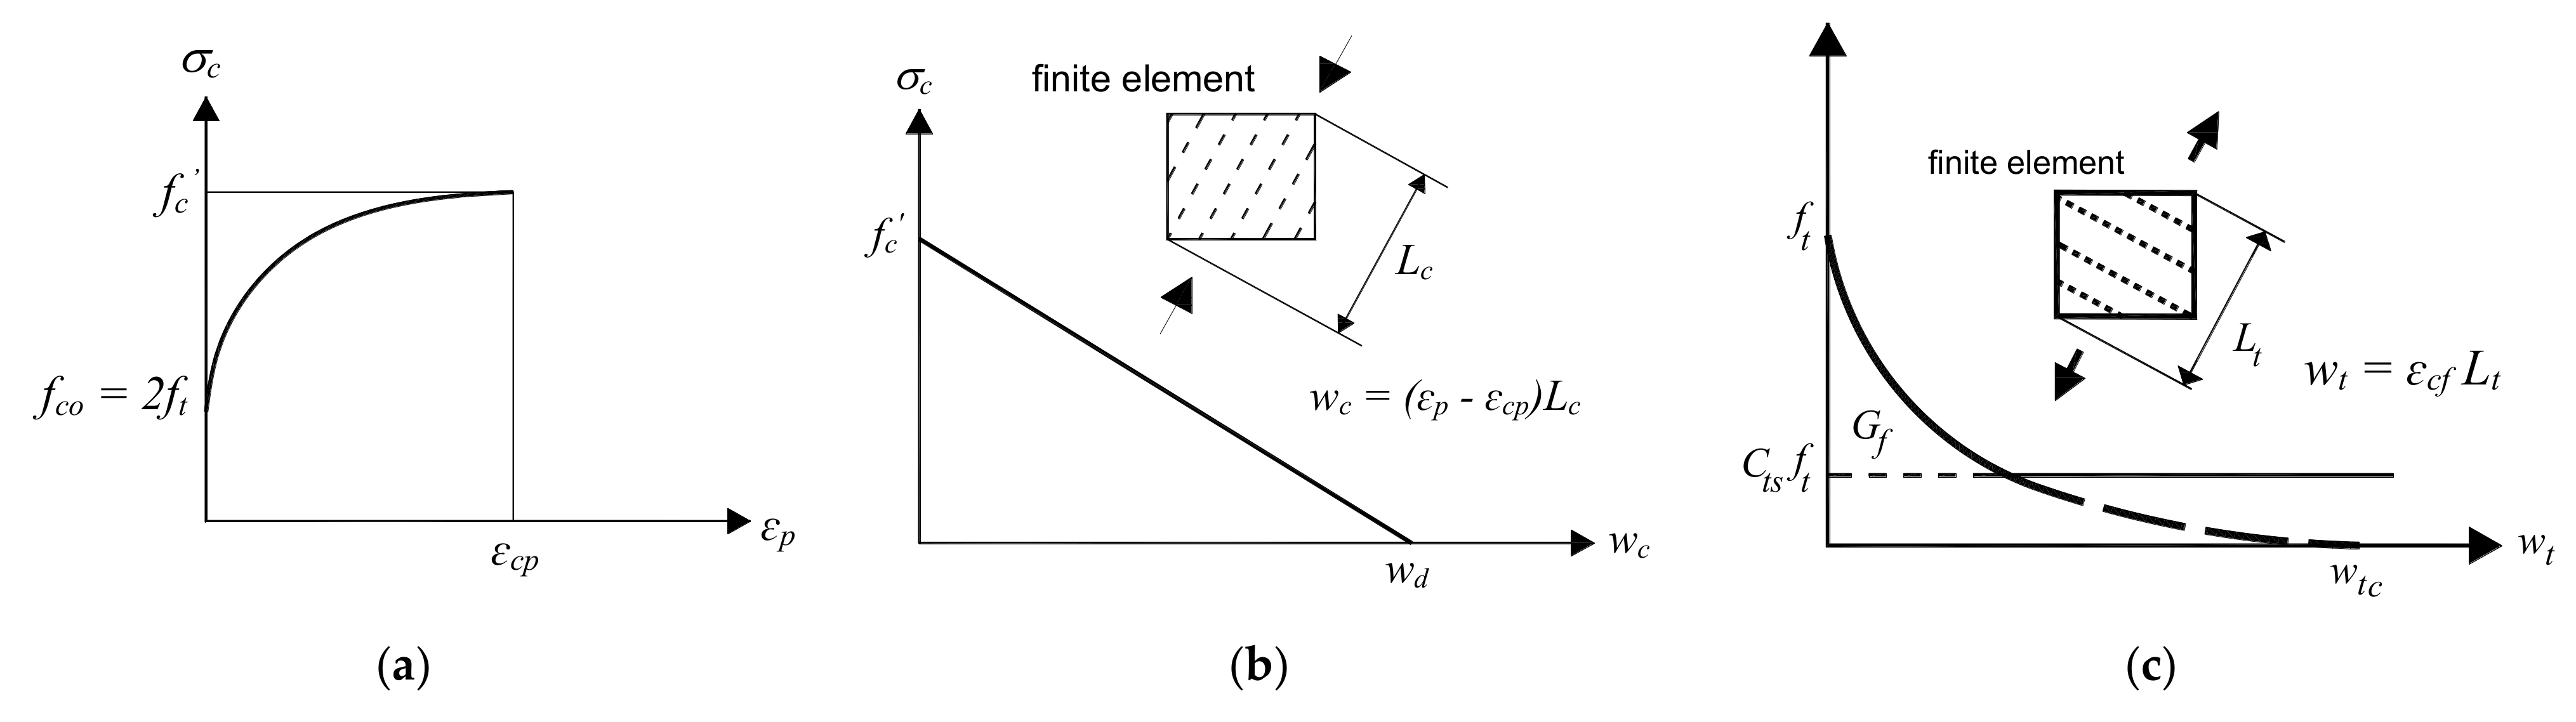
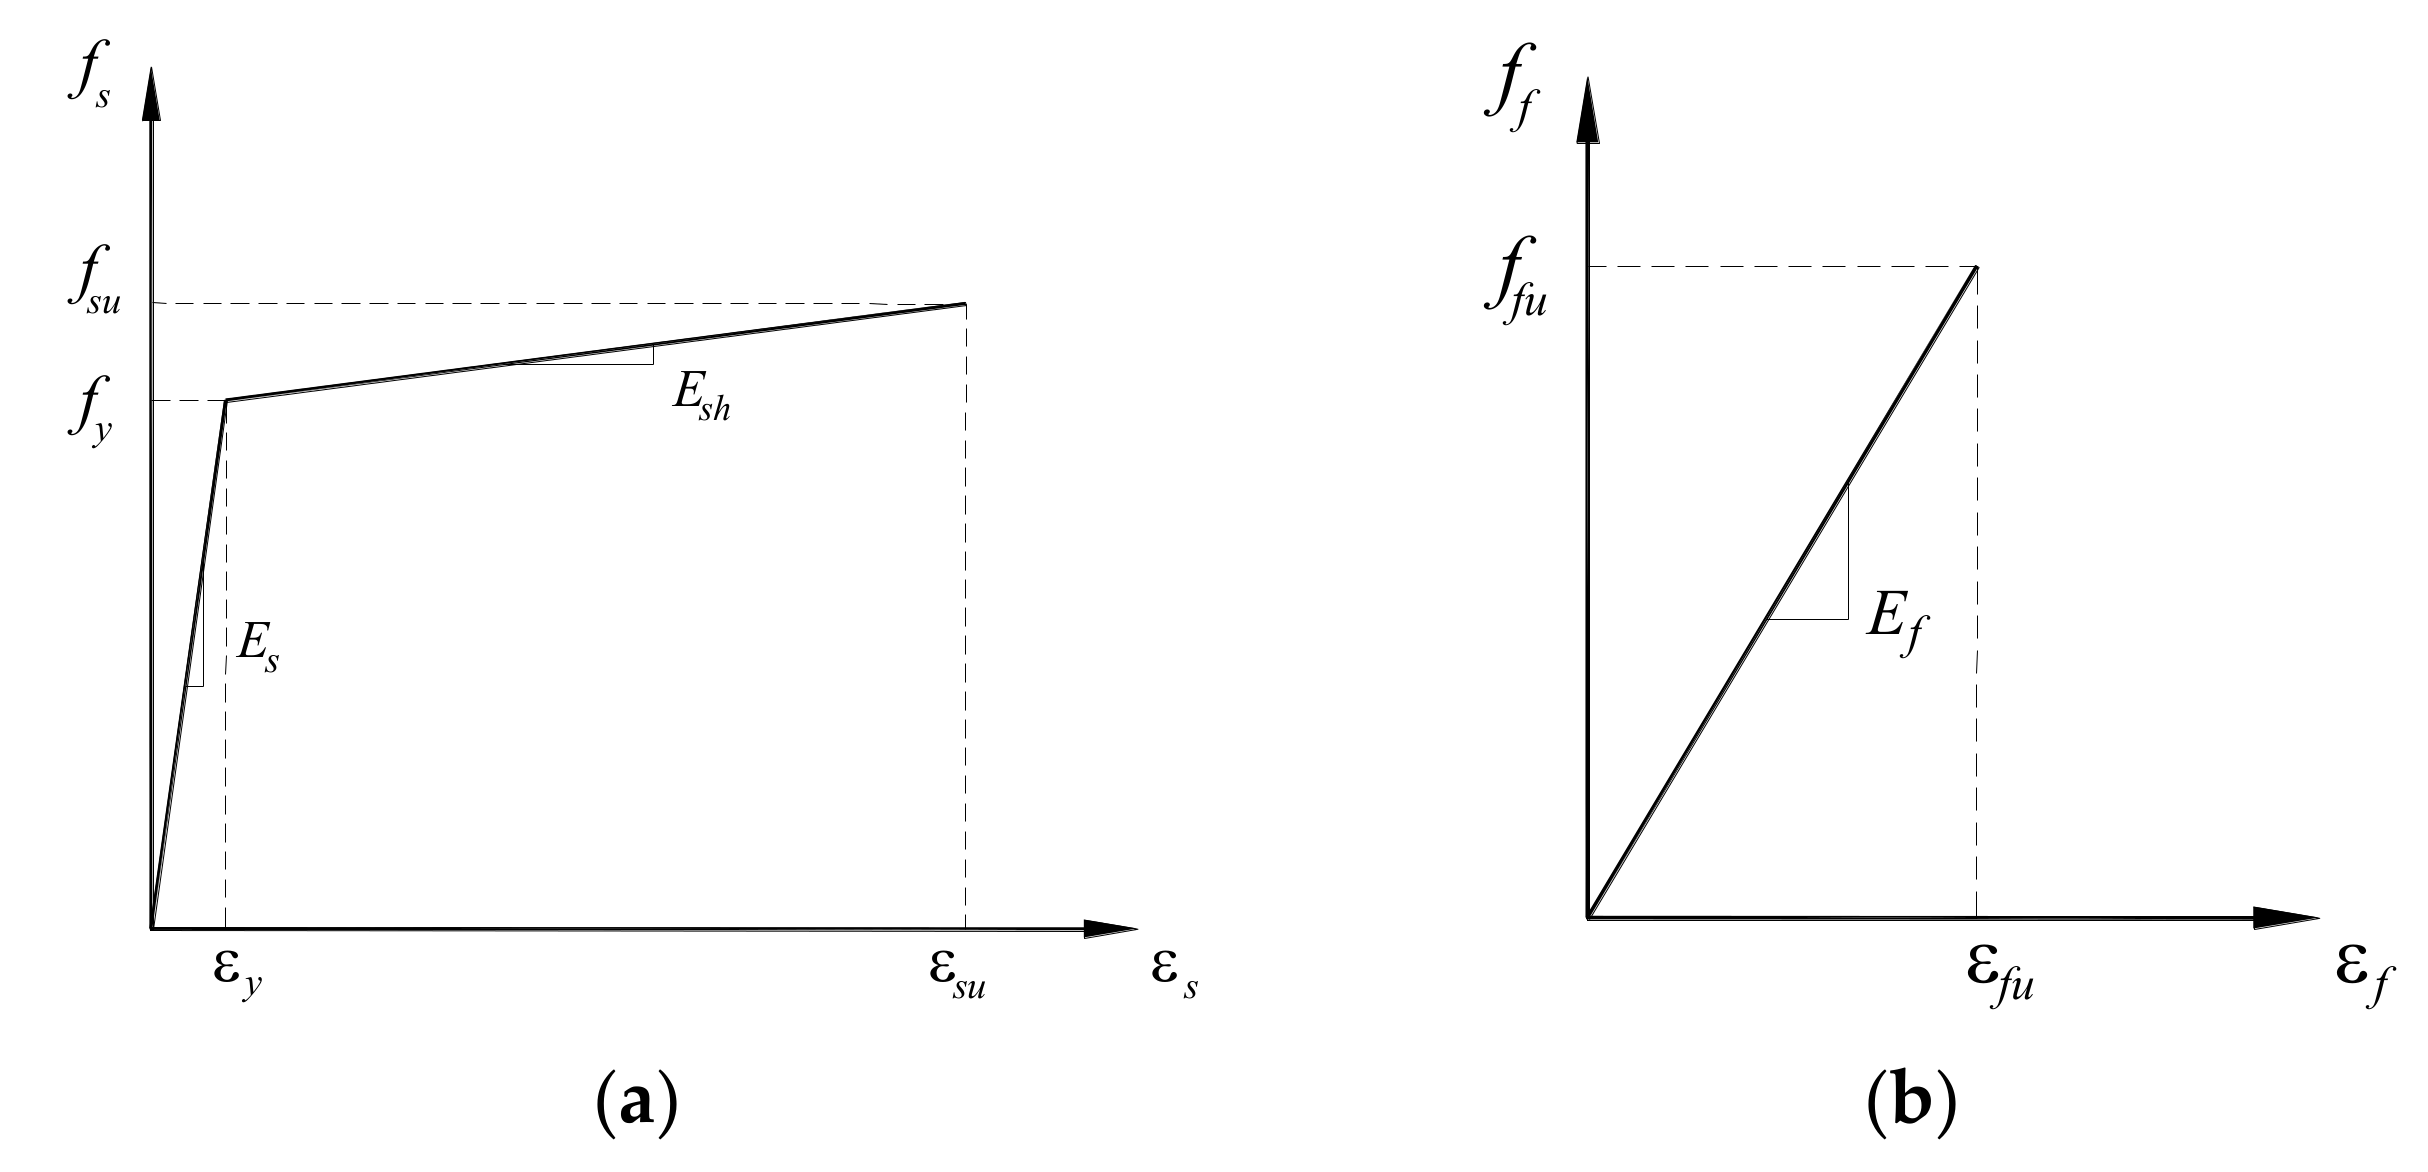
5.1. Constitutive Laws of Material
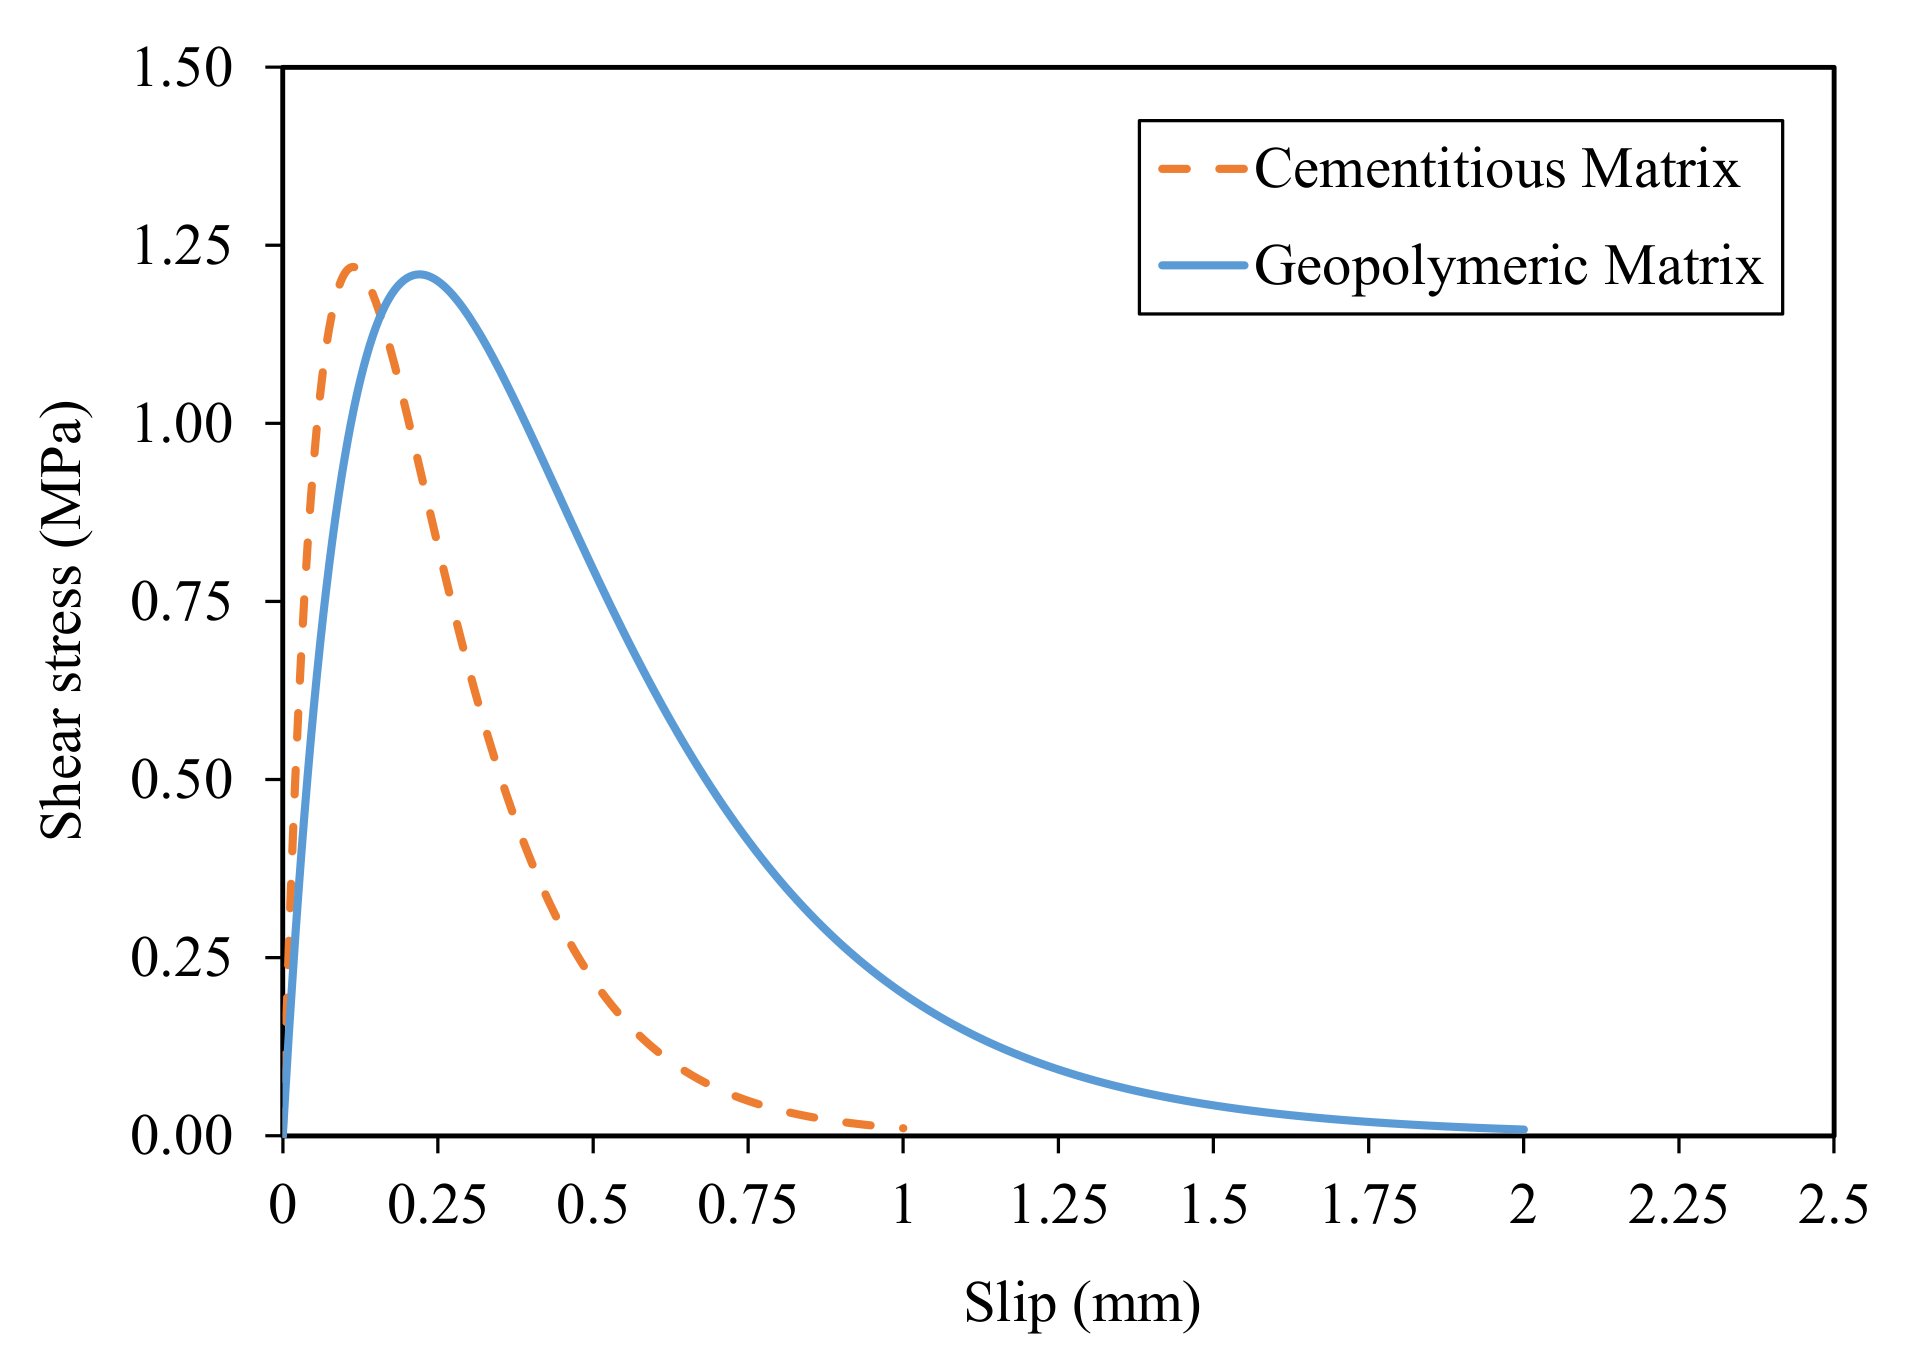
5.2. Bond–Slip Law at Fabric–Matrix Interface
5.3. Types of Element
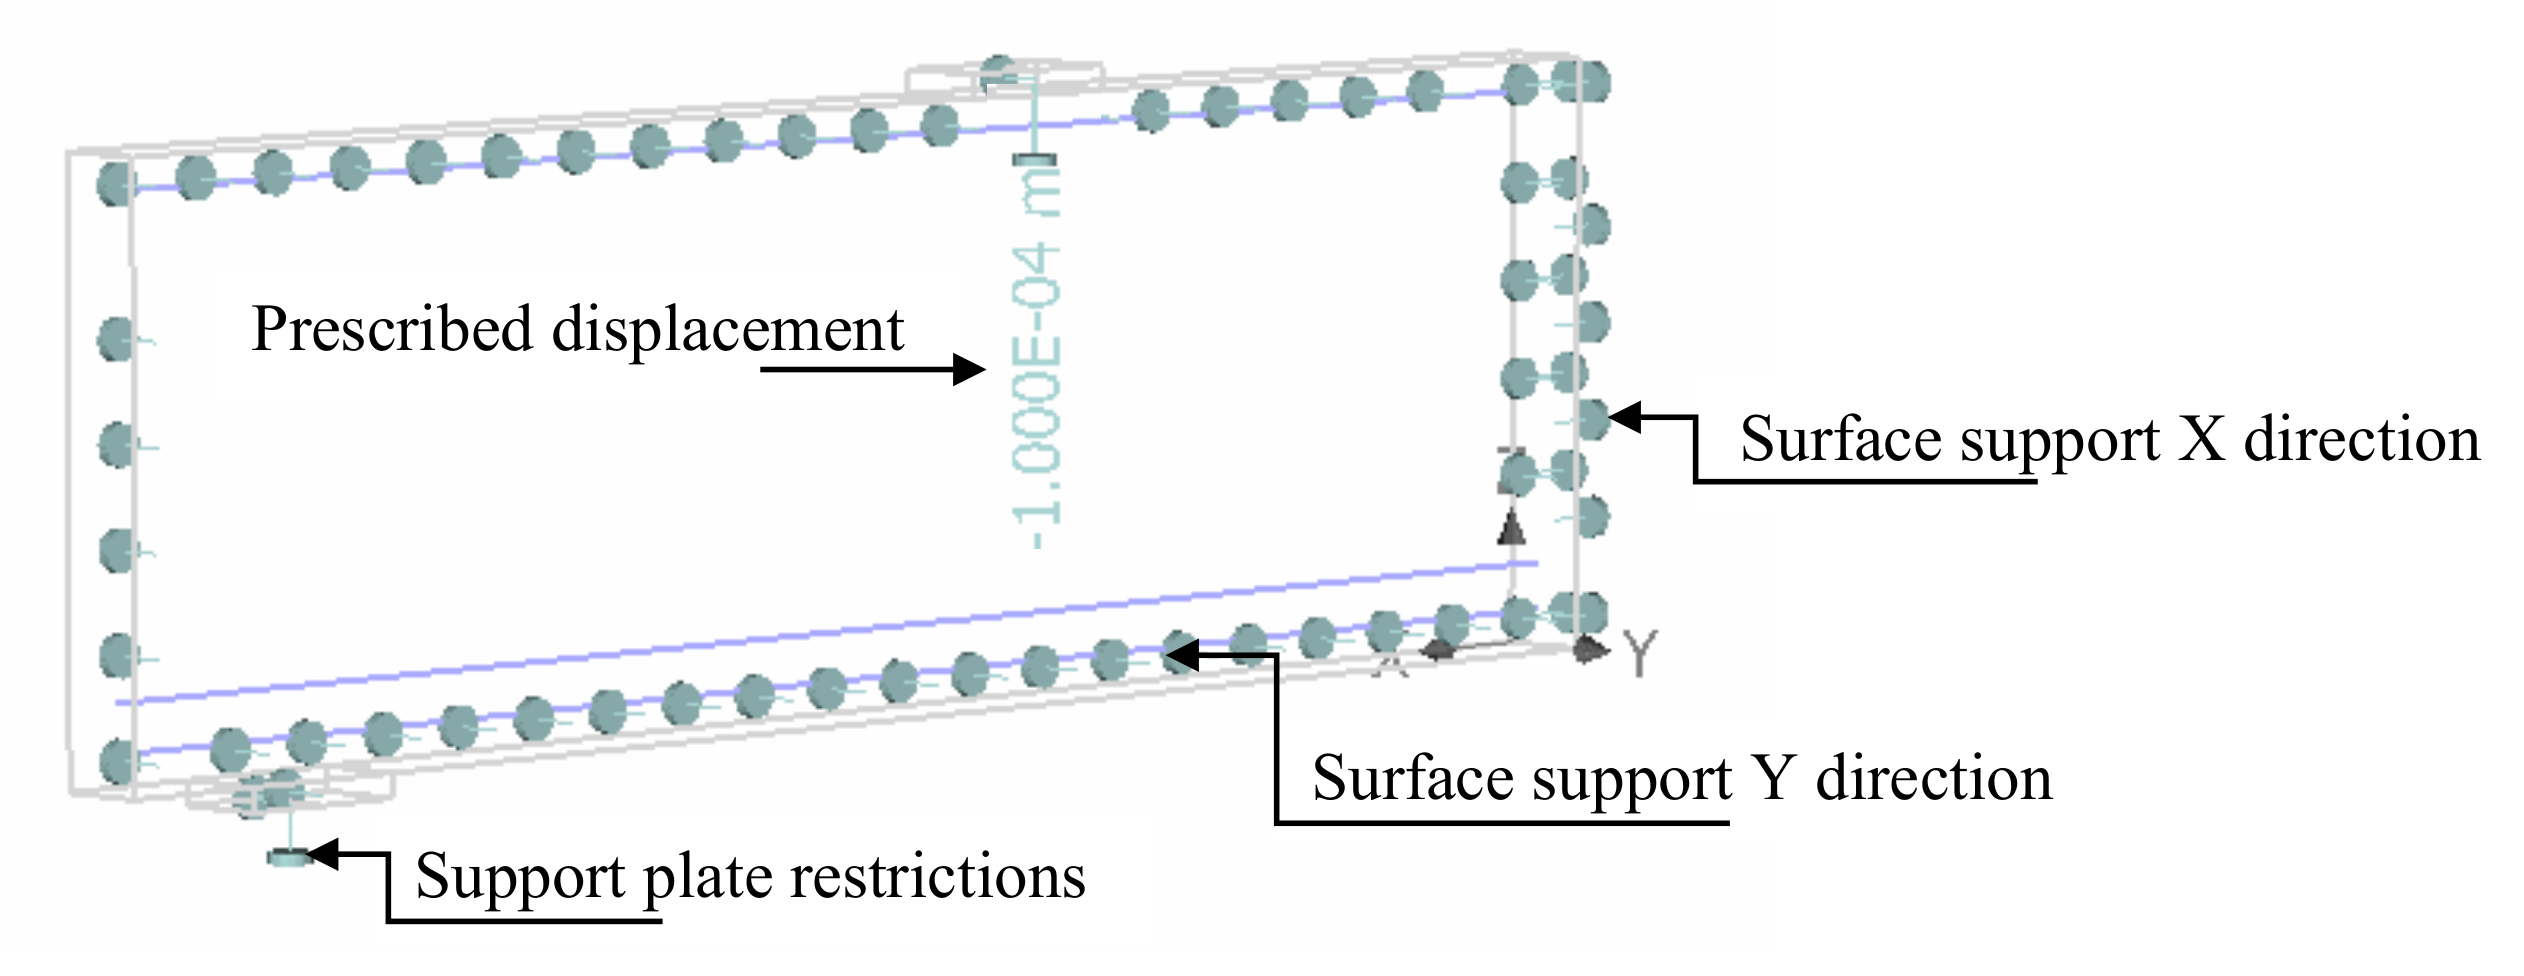
5.4. Loading and Boundary Conditions
6. Results of Finite Element Modeling
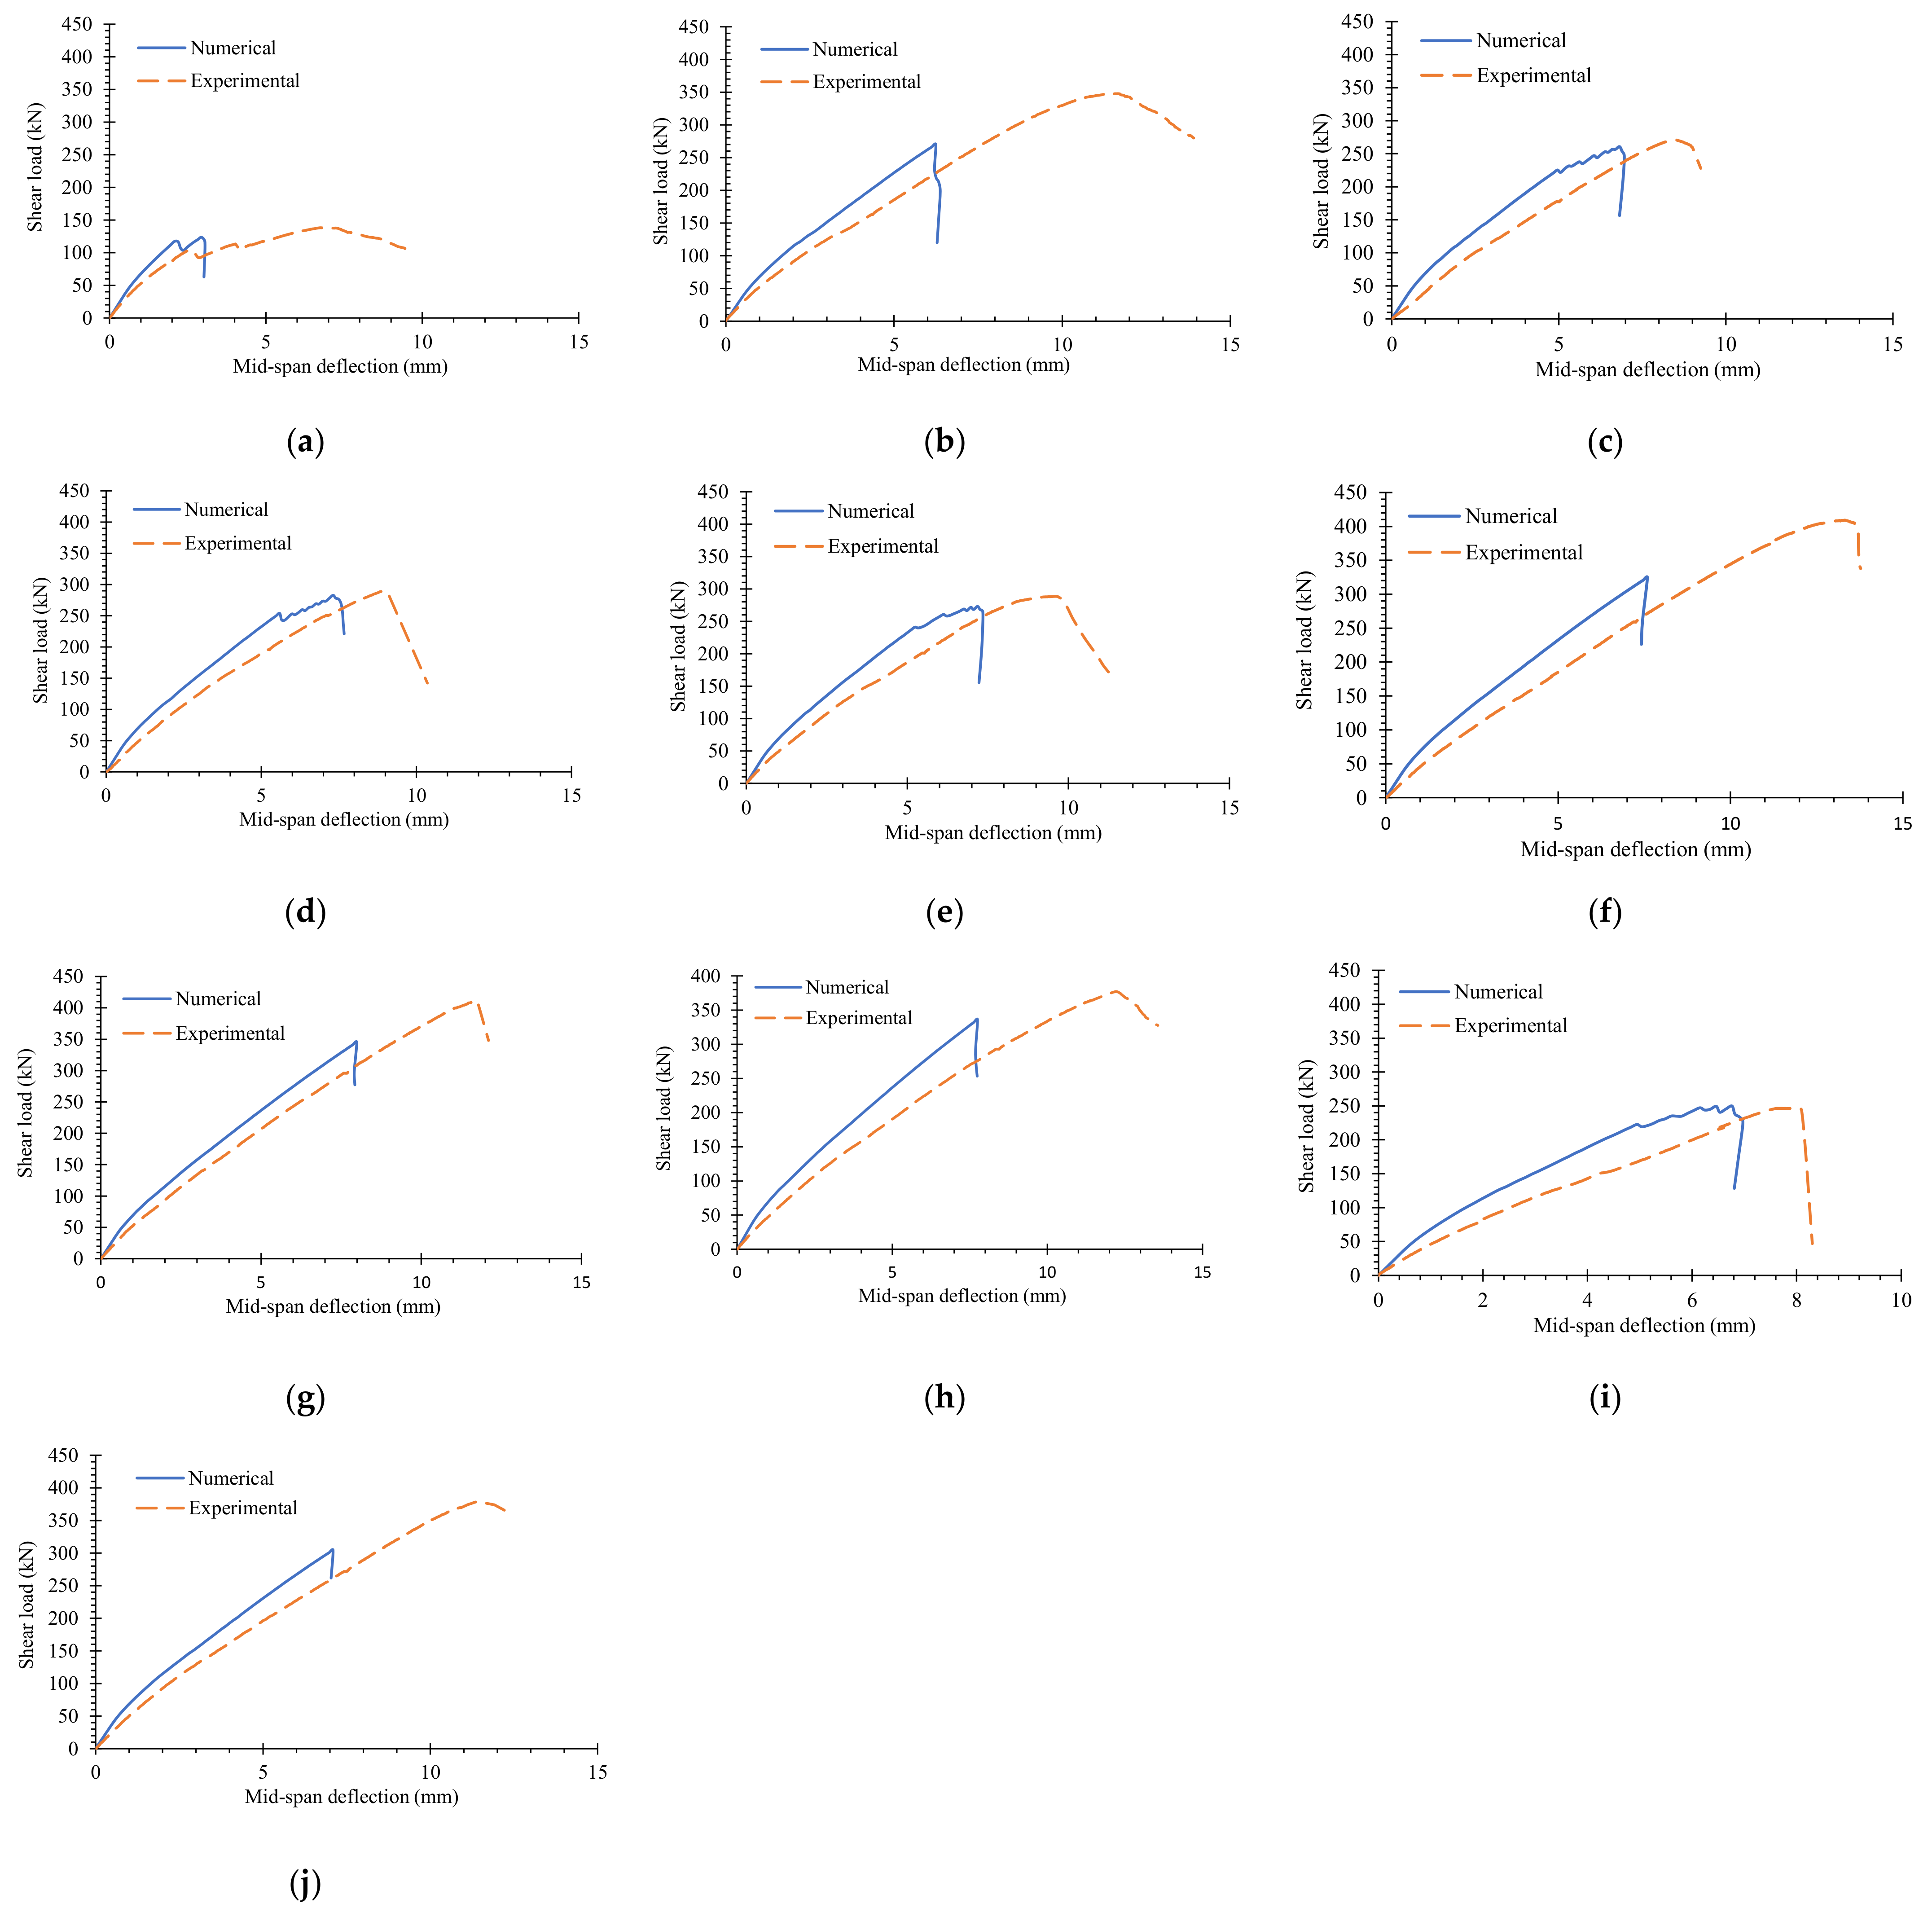
6.1. Predicted Deflection Response
6.2. Comparative Analysis between Predicted and Measured Shear Capacities
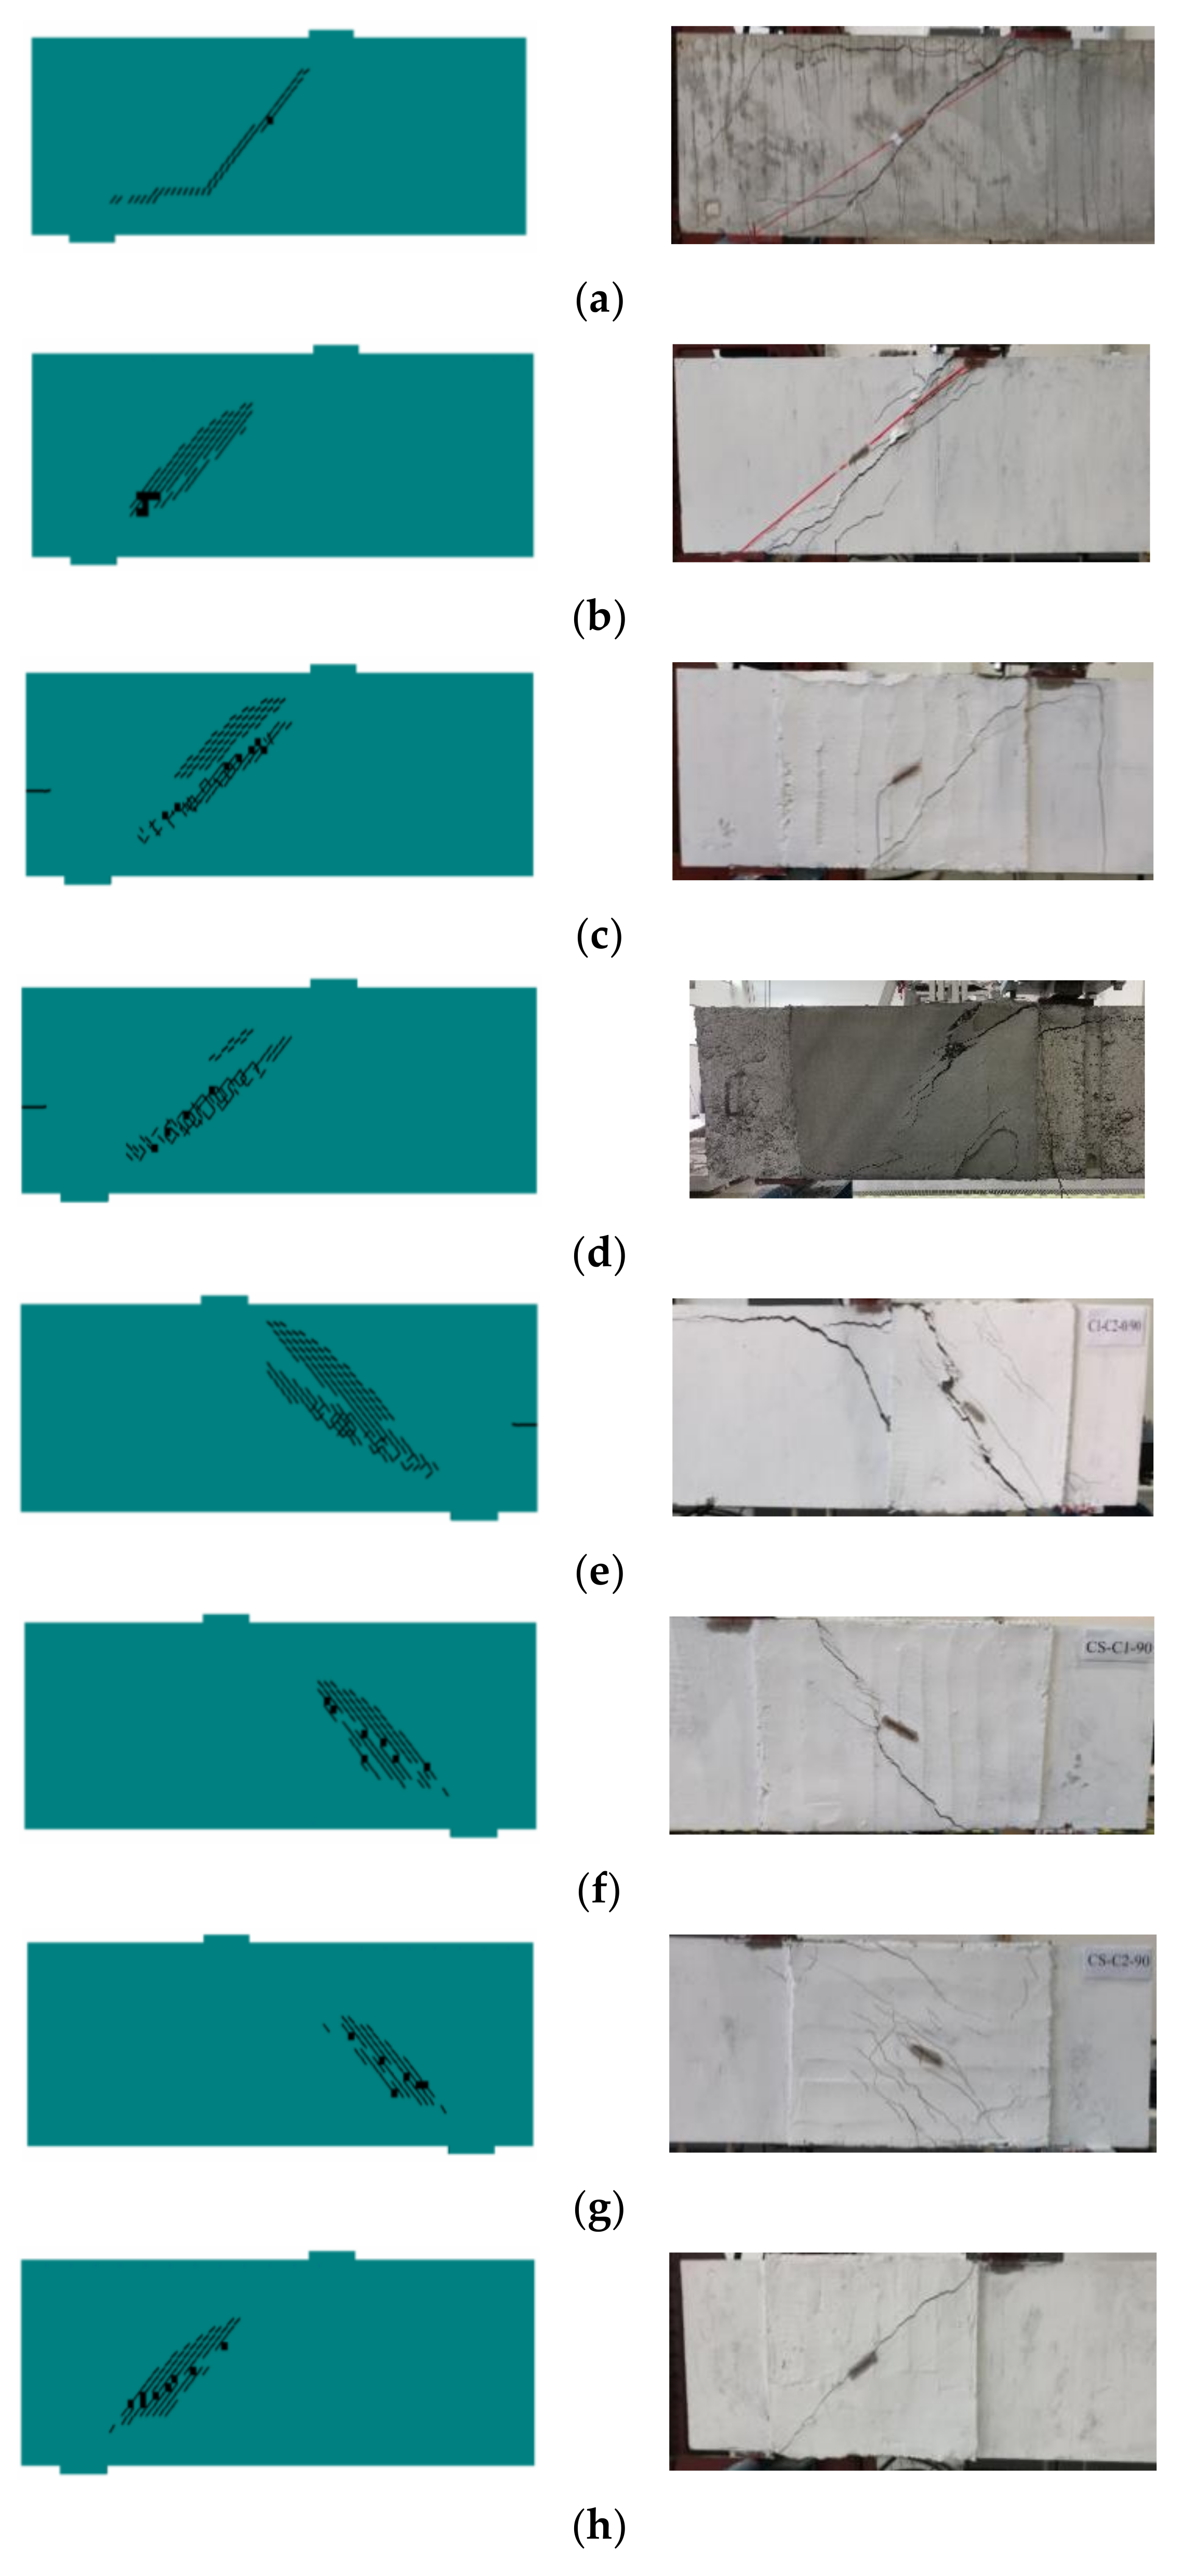
6.3. Comparative Analysis between Predicted and Observed Crack Patterns
7. Conclusions
- The control specimen without internal shear reinforcement failed shortly after the initiation of shear cracks in a shear–compression mode of failure. The unstrengthened specimen having internal shear reinforcement failed in a diagonal–compression mode of failure. All strengthened specimens failed due to crushing of the diagonal strut in the shear span (i.e., diagonal compression mode of failure). Such a mode of failure is typically reported for strengthened RC deep beam elements [1,16].
- External shear strengthening with C-FRCM played a role similar to that of the internal steel stirrups. In the absence of internal stirrups, one layer of C-FRCM increased the shear capacity approximately two-fold. The significant improvement in the shear capacity caused by C-FRCM in the absence of internal steel stirrups is in line with other data reported previously for RC beams with a/h of 1.7, where a shear strength gain in the range of 77 to 100% was recorded [17,20].
- The use of two C-FRCM layers instead of one layer or changing the angle of orientation of the second layer had a negligible effect on the shear strength gain. This conclusion is consistent with other published data, indicating that doubling the number of C-FRCM increases the shear capacity by only 21% [17].
- The shear strength gain caused by the application of C-FRCM composites was less significant in the presence of internal stirrups. One layer of C-FRCM increased the shear capacity of the specimen with internal stirrups by 18%. A further increase in the number of C-FRCM layers did not result in an additional increase in the shear capacity. Positioning the second layer of carbon fabric in the horizontal direction tended to be less effective than placing it in the vertical direction. The reduced gain in the shear capacity in the presence of internal stirrups is in line with other findings reported in the literature for RC deep beams, where a shear strength gain of 16% was reported at a/h of 1.25 [16] and an average strength gain of 19% was reported at a/h of 2 [21].
- Test results confirm the feasibility of using a cement-free geopolymeric matrix rather than the commercial cementitious mortar to develop a sustainable C-FRGM strengthening solution. One layer of C-FRGM resulted in 77 and 9% shear strength gains in the absence and presence of internal stirrups, respectively. The shear capacity of the specimens strengthened with C-FRGM (i.e., with a geopolymeric matrix) was 7 to 9% lower than that of their counterparts strengthened with C-FRCM (i.e., with a cementitious matrix). This is a new finding since no information is available in the literature on the behavior of RC deep beams strengthened in shear with geopolymer-based FRM composites. Nevertheless, the significant improvement in the shear capacity of RC deep beams due to strengthening in the absence of internal stirrups and the reduced strength gain recorded in the presence of steel stirrups are consistent with other findings published in the literature for cement-based FRM composites [16,17,18,19,20,21].
- The 3D numerical models developed in the current study are capable of predicting the nonlinear shear behavior of the tested beams with good accuracy. The inclusion of a bond–slip law at the fabric–matrix interface slightly reduced the contribution of the carbon fabrics to the shear capacity; hence, this resulted in more conservative shear strength predictions. Although the rate of increase of the midspan deflection predicted numerically was insignificantly different from that obtained from the experimental tests, the FE models tended to fail at a lower load, which resulted in a reduced deflection at failure relative to that measured experimentally. This behavior was less pronounced in the prediction of the FRM-strengthened models without internal steel stirrups. The reduced contribution of the carbon fabrics to the shear capacity due to the inclusion of the bond–slip law between the fabric and the matrix was less pronounced in the presence of internal stirrups.
Author Contributions
Funding
Institutional Review Board Statement
Informed Consent Statement
Data Availability Statement
Conflicts of Interest
References
- ACI Committee 549. Guide to Design and Construction of Externally Bonded Fabric-Reinforced and Steel-Reinforced Grout Systems for Repair and Strengthening of Concrete Structures; American Concrete Institute: Farmington Hills, MI, USA, 2020. [Google Scholar]
- Awani, O.; El-Maaddawy, T.; Ismail, N. Fabric-reinforced cementitious matrix: A promising strengthening technique for concrete structures. Constr. Build. Mater. 2017, 132, 94–111. [Google Scholar] [CrossRef]
- Koutas, L.; Tetta, Z.; Bournas, D.; Triantafillou, T. Strengthening of concrete structures with textile reinforced mortars: State-of-the-art review. J. Compos. Constr. 2019, 23, 03118001. [Google Scholar] [CrossRef]
- Al-Salloum, Y.; Elsanadedy, H.; Alsayed, S.; Iqbal, R. Experimental and numerical study for the shear strengthening of reinforced concrete beams using textile-reinforced mortar. J. Compos. Constr. 2012, 16, 74–90. [Google Scholar] [CrossRef]
- Azam, R.; Soudki, K. FRCM strengthening of shear-critical RC beams. J. Compos. Constr. 2014, 18, 04014012. [Google Scholar] [CrossRef]
- Loreto, G.; Babaeidarabad, S.; Leardini, L.; Nanni, A. RC beams shear-strengthened with fabric-reinforced-cementitious-matrix (FRCM) composite. Int. J. Adv. Struct. Eng. 2015, 7, 341–352. [Google Scholar] [CrossRef] [Green Version]
- Tetta, Z.; Koutas, L.; Bournas, D. Shear strengthening of concrete members with textile-reinforced mortar (TRM): Effect of shear span-to-depth ratio, material and amount of external reinforcement. Compos. Part B 2018, 137, 184–201. [Google Scholar] [CrossRef]
- Tetta, Z.; Koutas, L.; Bournas, D. Textile-reinforced mortar (TRM) versus fibre-reinforced polymers (FRP) in shear strengthening of concrete beams. Compos. Part B 2015, 77, 338–348. [Google Scholar] [CrossRef] [Green Version]
- Gonzalez-Libreros, G.; Sneed, L.; D’Antino, T.; Pellegrino, C. Behavior of RC beams strengthened in shear with FRP and FRCM composites. Eng. Struct. 2017, 150, 830–842. [Google Scholar] [CrossRef]
- Azam, R.; Soudki, K.; West, J.; Noël, M. Behavior of shear-critical RC beams strengthened with CFRCM. J. Compos. Constr. 2018, 22, 04017046. [Google Scholar] [CrossRef]
- Awani, O.; El-Maaddawy, T.; El Refai, A. Numerical simulation and experimental testing of concrete beams strengthened in shear with fabric-reinforced cementitious matrix. J. Compos. Constr. 2016, 20, 04016056. [Google Scholar] [CrossRef]
- Triantafillou, T.; Papanicolaou, C. Shear strengthening of reinforced concrete members with textile reinforced mortar (TRM) jackets. Mater. Struct. 2006, 39, 93–103. [Google Scholar] [CrossRef]
- Aljazaeri1, Z.; Myers, J. Strengthening of reinforced-concrete beams in shear with a fabric-reinforced cementitious matrix. J. Compos. Constr. 2017, 21, 04017041. [Google Scholar] [CrossRef]
- Trapko, T.; Urbanska, D.; Kaminski, M. Shear strengthening of reinforced concrete beams with PBO-FRCM composites. Compos. Part B 2015, 80, 63–72. [Google Scholar] [CrossRef]
- Tetta, Z.; Koutas, L.; Bournas, D. Shear strengthening of full-scale RC T-beams using textile-reinforced mortar and textile-based anchors. Compos. Part B 2016, 95, 225–239. [Google Scholar] [CrossRef]
- Azam, R.; Soudki, K.; West, J.; Noël, M. Shear strengthening of RC deep beams with cement-based composites. Eng. Struct. 2018, 172, 929–937. [Google Scholar] [CrossRef]
- Wakjira, T.; Ebead, U. Hybrid NSE/EB technique for shear strengthening of reinforced concrete beams using FRCM: Experimental study. Constr. Build. Mater. 2018, 164, 164–177. [Google Scholar] [CrossRef]
- Wakjira, T.; Ebead, U. FRCM/internal transverse shear reinforcement interaction in shear strengthened RC beams. Compos. Struct. 2018, 201, 326–339. [Google Scholar] [CrossRef]
- Wakjira, T.; Ebead, U. Internal transverse reinforcement configuration effect of EB/NSE-FRCM shear strengthening of RC deep beams. Compos. Part B 2019, 166, 758–772. [Google Scholar] [CrossRef]
- Younis, A.; Ebead, U.; Shrestha, K. Different FRCM systems for shear-strengthening of reinforced concrete beams. Constr. Build. Mater. 2017, 153, 514–526. [Google Scholar] [CrossRef]
- Marcinczak, D.; Trapko, T.; Musiał, M. Shear strengthening of reinforced concrete beams with PBO-FRCM composites with anchorage. Compos. Part B 2019, 158, 149–161. [Google Scholar] [CrossRef]
- Vasconcelos, E.; Fernandes, S.; de Aguiar, J.B.; Pacheco-Torgal, F. Concrete retrofitting using metakaolin geopolymer mortars and CFRP. Constr. Build. Mater. 2011, 25, 3213–3221. [Google Scholar] [CrossRef] [Green Version]
- Menna, C.; Asprone, D.; Ferone, C.; Colangelo, F.; Balsamo, A.; Prota, A.; Cioffi, R.; Manfredi, G. Use of geopolymers for composite external reinforcement of RC members. Compos. B Eng. 2013, 45, 1667–1676. [Google Scholar] [CrossRef]
- Bencardino, F.; Condello, A.; Ashour, A. Single-lap shear bond tests on steel reinforced geopolymeric Matrix-concrete joints. Compos. B Eng. 2017, 110, 62–71. [Google Scholar] [CrossRef] [Green Version]
- Abu Obaida, F.; El-Maaddawy, T.; El-Hassan, H. Bond behavior of carbon fabric-reinforced matrix composites: Geopolymeric matrix versus cementitious mortar. Buildings 2021, 11, 207. [Google Scholar] [CrossRef]
- ACI 318-19; Building Code Requirements for Structural Concrete—Commentary on Building Code Requirements for Structural Concrete (ACI 318R-19). American Concrete Institute (ACI): Farmington Hills, MI, USA, 2019.
- ASTM C39/C39M-20; Standard Test Method for Compressive Strength of Cylindrical Concrete Specimens. ASTM International: West Conshohocken, PA, USA, 2020.
- BS EN 12390-3; Testing Hardened Concrete—Compressive Strength of Test Specimens. British Standards: London, UK, 2009.
- ASTM C496/C496M-17; Standard Test Method for Splitting Tensile Strength of Cylindrical Concrete Specimens. ASTM International: West Conshohocken, PA, USA, 2017.
- BS 4449:2005 +A2:2009; Steel for the Reinforcement of Concrete—Weldable Reinforcing Steel–Bar, Coil and Decoiled–Product Specification. British Standards: London, UK, 2009.
- S&P—A Simpson Strong-Tie Company. S&P ARMO-Mesh Reinforcement Made from Carbon Fiber. Available online: https://www.sp-reinforcement.ch/en-CH (accessed on 10 December 2019).
- ISO–International Organization for Standardization. Available online: https://www.iso.org/home.html (accessed on 7 March 2022).
- ASTM C109/C109M-20b; Standard Test Method for Compressive Strength of Hydraulic Cement Mortars (Using 2-in. or [50 mm] Cube Specimens). ASTM International: West Conshohocken, PA, USA, 2020.
- ASTM C469/C469M-14; Standard Test Method for Static Modulus of Elasticity and Poisson’s Ratio of Concrete in Compression. ASTM International: West Conshohocken, PA, USA, 2014.
- ATENA [Computer Software]. n.d. Cervenka Consulting s.r.o., Prague, Czech Republic. Available online: https://www.cervenka.cz/products/atena/ (accessed on 7 March 2022).


| Group | Matrix Type | Prescence of Stirrups | C-FRM Layers | Angle of C-FRM | Designation |
|---|---|---|---|---|---|
| Control | - | - | - | - | Control-NS |
| √ | - | - | Control-ST | ||
| A | Cementitious | - | One layer | 90-degree | NS-C1-90 |
| Two layers | 90-degree | NS-C2-90 | |||
| Two layers | 0/90-degree | NS-C2-0/90 | |||
| B | Cementitious | √ | One layer | 90-degree | ST-C1-90 |
| Two layers | 90-degree | ST-C2-90 | |||
| Two layers | 0/90-degree | ST-C2-0/90 | |||
| C | Geopolymeric | - | One layer | 90-degree | NS-G1-90 |
| √ | One layer | 90-degree | ST-G1-90 |
| Material | OPC | Coarse Aggregates | Fine Aggregates | Water | Admixture POZZOLITH® LD10 | ||
|---|---|---|---|---|---|---|---|
| 20 mm Crushed | 10 mm Crushed | 5 mm Crushed | Dune Sand | ||||
| Weight | 300 kg | 700 kg | 350 kg | 600 kg | 350 kg | 165 L | 1.5 L |
| Property | Value |
|---|---|
| Weight per unit area (g/m2) | 281.000 |
| Tensile strength (MPa) | 4300.000 |
| Modulus of elasticity (GPa) | 240.000 |
| Elongation at break (%) | 1.800 |
| Cross-sectional area (mm2/mm) | 0.157 |
| Spacing between fabric bundles (mm) | 17.000 |
| Component (kg/m3) | ||||
|---|---|---|---|---|
| Fly Ash | Slag | Dune Sand | Sodium Silicate (SS) | Sodium Hydroxide (SH) |
| 362.5 | 362.5 | 752.0 | 285.5 | 114.0 |
| Group | Specimen | Cracking Load | Shear Capacity | Deflection Capacity | Vcr/Vmax | Strength Gain 1 (%) | Failure Mode |
|---|---|---|---|---|---|---|---|
| Vcr (kN) | Vmax (kN) | ∆peak (mm) | |||||
| Control | Control-NS | 104 | 139 | 6.8 | 0.75 | - | Shear compression |
| Control-ST | 140 | 348 | 11.7 | 0.40 | - | Strut crushing | |
| A | NS-C1-90 | 130 | 271 | 8.5 | 0.48 | 95 | Strut crushing |
| NS-C2-90 | 150 | 290 | 8.9 | 0.52 | 109 | Strut crushing | |
| NS-C2-0/90 | 160 | 288 | 9.7 | 0.56 | 107 | Strut crushing | |
| B | ST-C1-90 | 170 | 409 | 13.3 | 0.42 | 18 | Strut crushing |
| ST-C2-90 | 150 | 411 | 11.7 | 0.36 | 18 | Strut crushing | |
| ST-C2-0/90 | 150 | 377 | 12.2 | 0.40 | 8 | Strut crushing | |
| C | NS-G1-90 | 130 | 246 | 7.7 | 0.53 | 77 | Strut crushing |
| ST-G1-90 | 130 | 380 | 11.4 | 0.34 | 9 | Strut crushing |
| Parameter | Description | Value |
|---|---|---|
| fcu | Cube compressive strength | −33.50 MPa |
| f’c | Cylinder compressive strength | −26.30 MPa |
| ft | Tensile strength | 2.40 MPa |
| Ec | Elastic modulus | 2.41 × 10⁴ MPa |
| μ | Poisson’s ratio | 0.20 |
| Gf | Specific fracture energy | 6.23 × 10⁻⁵ MN/m |
| wd | Critical compressive displacement | −5.00 × 10⁻⁴ m |
| εcp | Plastic strain at compressive strength | −8.97 × 10⁻⁴ |
| Parameter | Description | Value |
|---|---|---|
| fcu | Cube compressive strength | −42.0 MPa |
| f’c | Cylinder compressive strength | −35.3 MPa |
| ft | Tensile strength | 2.40 MPa |
| Ec | Elastic modulus | 2.89 × 10⁴ MPa |
| μ | Poisson’s ratio | 0.20 |
| Gf | Specific fracture energy | 7.25 × 10⁻⁵ MN/m |
| wd | Critical compressive displacement | −5.00 × 10⁻⁴ m |
| εcp | Plastic strain at compressive strength | −1.03 × 10⁻³ |
| Parameter | Description | Value |
|---|---|---|
| fcu | Cube compressive strength | −43 MPa |
| f’c | Cylinder compressive strength | −34 MPa |
| ft | Tensile strength | 3.00 MPa |
| Ec | Elastic modulus | 0.70 × 10⁴ MPa |
| μ | Poisson’s ratio | 0.20 |
| Gf | Specific fracture energy | 7.36 × 10⁻⁵ MN/m |
| wd | Critical compressive displacement | −5.00 × 10⁻⁴ m |
| εcp | Plastic strain at compressive strength | −1.05 × 10⁻³ |
| Bond Model | τm (MPa) | sm (mm) | smax (mm) | Gf (N/mm) |
|---|---|---|---|---|
| Cementitious matrix | 1.22 | 0.11 | 1.00 | 0.40 |
| Geopolymeric matrix | 1.21 | 0.22 | 2.00 | 0.77 |
| Beam Model | Predicted Shear Capacity 1 (kN) | Ratio | |
|---|---|---|---|
| V25 | V20 | V20/V25 | |
| Control-NS | 119 | 124 | 1.04 |
| Control-ST | 288 | 270 | 0.94 |
| NS-C1-90 | 270 | 283 | 1.05 |
| NS-C2-90 | 304 | 297 | 0.98 |
| NS-C2-0/90 | 281 | 295 | 1.05 |
| ST-C1-90 | 339 | 329 | 0.97 |
| ST-C2-90 | 357 | 359 | 1.01 |
| ST-C2-0/90 | 359 | 341 | 0.95 |
| NS-G1-90 | 273 | 269 | 0.99 |
| ST-G1-90 | 323 | 313 | 0.97 |
| Average | 0.99 | ||
| Standard Deviation | 0.04 | ||
| Group | Specimen | Experimental | Numerical | VFE/VExp | ||
|---|---|---|---|---|---|---|
| Perfect Bond | With Bond–Slip Law | Perfect Bond | With Bond–Slip Law | |||
| VExp (kN) | VFE (kN) | VFE (kN) | ||||
| Control | Control-NS | 139 | 124 | N.A. | 0.89 | N.A. |
| Control-ST | 348 | 270 | N.A. | 0.78 | N.A. | |
| A | NS-C1-90 | 271 | 283 | 261 | 1.04 | 0.96 |
| NS-C2-90 | 290 | 297 | 283 | 1.02 | 0.98 | |
| NS-C2-0/90 | 288 | 295 | 273 | 1.02 | 0.95 | |
| B | ST-C1-90 | 409 | 329 | 325 | 0.80 | 0.79 |
| ST-C2-90 | 411 | 359 | 345 | 0.87 | 0.84 | |
| ST-C2-0/90 | 377 | 341 | 336 | 0.90 | 0.89 | |
| C | NS-G1-90 | 246 | 269 | 250 | 1.09 | 1.02 |
| ST-G1-90 | 380 | 313 | 305 | 0.82 | 0.80 | |
Publisher’s Note: MDPI stays neutral with regard to jurisdictional claims in published maps and institutional affiliations. |
© 2022 by the authors. Licensee MDPI, Basel, Switzerland. This article is an open access article distributed under the terms and conditions of the Creative Commons Attribution (CC BY) license (https://creativecommons.org/licenses/by/4.0/).
Share and Cite
Khir Allah, N.; El-Maaddawy, T.; El-Hassan, H. Geopolymer- and Cement-Based Fabric-Reinforced Matrix Composites for Shear Strengthening of Concrete Deep Beams: Laboratory Testing and Numerical Modeling. Buildings 2022, 12, 448. https://doi.org/10.3390/buildings12040448
Khir Allah N, El-Maaddawy T, El-Hassan H. Geopolymer- and Cement-Based Fabric-Reinforced Matrix Composites for Shear Strengthening of Concrete Deep Beams: Laboratory Testing and Numerical Modeling. Buildings. 2022; 12(4):448. https://doi.org/10.3390/buildings12040448
Chicago/Turabian StyleKhir Allah, Nour, Tamer El-Maaddawy, and Hilal El-Hassan. 2022. "Geopolymer- and Cement-Based Fabric-Reinforced Matrix Composites for Shear Strengthening of Concrete Deep Beams: Laboratory Testing and Numerical Modeling" Buildings 12, no. 4: 448. https://doi.org/10.3390/buildings12040448