
Exploring the Nature and Impact of Client-Related Delays on Contemporary Saudi Construction Projects

1
Ministry of Education Headquarters, Airport Road, Riyadh 11148, Saudi Arabia
2
School of Built Environment and Architecture, Centre for the Integrated Delivery of the Built Environment (IDoBE), London South Bank University, London SE1 0AA, UK
3
Department of Civil Engineering, College of Engineering, Shaqra University Dawadimi, Riyadh 11911, Saudi Arabia
*
Author to whom correspondence should be addressed.
Buildings 2022, 12(7), 880; https://doi.org/10.3390/buildings12070880
Submission received: 18 February 2022
/
Revised: 24 May 2022
/
Accepted: 6 June 2022
/
Published: 22 June 2022
(This article belongs to the Topic Advances in Construction and Project Management)
Abstract
:In rapidly developing countries such as the Kingdom of Saudi Arabia (KSA), where the construction of buildings and supporting infrastructure is critical to achieving strategic developmental milestones, delays to capital projects can derail other sectors of the economy and could derail the Vision 2030 agenda. Attempts have been made over the years to explore the causes of construction project delays, including those in Saudi Arabia. Many of these studies are either outdated, narrow in scope, or tend to use only qualitative data, and not many have focused on the client-related delay factors affecting projects critical to Vision 2030. This study investigates client-related delay factors in terms of their correlation with key characteristics of recently completed construction projects in KSA. This objective necessitated the use of historical data; hence, an archival analysis was conducted for 37 projects among three different public sector ministries. The data were subjected to manual extraction, descriptive statistical analysis, and the use of established models such as schedule performance index (SPI) and cost performance index (CPI), and inferential (correlation) in Statistical Package for the Social Sciences (SPSS) using point-biserial correlation coefficient (rpb, where p > 0.05) to explore association and impact of project characteristics on themselves and on client-related causes of delay. Results revealed eight unique client-related causes of delay, with SPI values of 0.71 to 0.82, as well as CPI values ranging from 0.84 to 0.89, suggesting very poor time and cost performance across all projects, as well as the magnitude of correlation of key project characteristics (cost, duration, additional time, and additional cost) with the eight client-related causes of delay. The findings can help the client (authorities) understand and curb delays that are due to their own making, and it is recommended that such delay factors, whose likelihood are now established and whose potential impact can be measured against key project characteristics, be developed into a delay risk impact tool. International joint ventures can bring technical expertise for Vision 2030, but they cannot eliminate delays due to government practices.
1. Introduction
Building construction projects deliver significant socio-economic benefits to stakeholders, including governments, as well as industry and society stakeholders, but they are prone to delays, which negatively affect their completion and expected impact. A construction project is said to be delayed if there is a time overrun in the original schedule, meaning the project is not finalized by the original contractually agreed date [1]. Many construction projects suffer from this challenge, with consequences in the form of lost income, increased client costs, penalties for contractors, and the postponement of project handover and the utilization of the investment by end users [2]. The tendency to make claims is also an issue that contributes to delays, as shown in a study that found six major categories of claim clauses that directly lead to time overruns, including inappropriate client action, contactor’s incompetency, contractual problems, impediments caused by the client, bidding issues by the contractor, and problems due to uncontrollable project objectives [3]. In addition to the delays, such claims also have cost implications for the project. For example, in civil infrastructure projects, a study showed that factors such as ‘delays in approval/permits’ and ‘late site handover’ often led to financial compensation to the contractor, while change orders resulted in additional time [4]. These kinds of consequences have made the study of construction delays valuable and necessary.
Apart from impeding economic growth, such delays negatively affect the reputation of the industry [2], including those of emerging countries such as the Kingdom of Saudi Arabia (KSA). Faced with a fast-growing population at a time of crude oil-driven economic growth, KSA is witnessing expansive infrastructure development, including residential buildings [5] with ambitious targets such as being the world’s largest investor in sustainable buildings [6]. Such ambitions are part of the Saudi Vision 2030, which comprises urban and rural renewal projects [7] and mega projects such as building, from scratch, a smart city (NEOM) in the middle of a desert with a bridge linking it to Egypt [8]. Such grand ambitions have led to many international joint ventures (IJVs) in order to bring in the foreign expertise required to transform the Kingdom into being among the most developed countries in the world by 2030 [9]. However, from the previous decade, a study [1] found that approximately 70% of construction projects for the KSA public sector were delayed, while recently Deloitte [10,11] stated that leading up to July 2014, the combined value of delayed building construction projects in KSA was estimated at US$146 billion, which has led to development pressures in the country. This is very crucial since the Saudi Vision 2030 hinged on not only the diversification of the economy but on the modernization of the country via the delivery of critical transportation infrastructure (e.g., the new Metro Line projects in Riyadh and Jeddah); modern facilities in healthcare; education; and the urbanization of rural communities [7].
Therefore, given the increasing number of delayed construction projects in general, further investigation of this phenomenon is required due to the potential impact on the Saudi Vision 2030 goals and beyond. This ambition inspired the KSA government to collaborate with the UN Habitat via the commissioning of the ‘Future Saudi Cities Program’ led by the Ministry of Municipal and Rural Affairs (MOMRA) [7]. However, achieving this vision is questionable given that only a few construction projects are completed on schedule and within the budget [1,12,13]. Specifically, this study is motivated by the need to empower the KSA government with better knowledge and understand how its role and behavior (as a client) contributes to specific kinds of construction project delays, with the appreciation of the likelihood of these delays occurring and their correlation/impact based on project characteristics. Given the established importance of certain kinds of construction to the KSA’s development, this study has two objectives. The first objective is to understand the nature of client-related causes of delay in contemporary construction projects linked to the KSA’s Vision 2030, particularly in terms of ranking them for the purpose of grasping the scale of the problem, prioritization by the client (government), and designing appropriate mitigation measures. Moreover, it is established that construction delays will generally lead to cost overruns [1,4,12,13]; there is a need to establish the strength of the correlations (association) between the different kinds of client-related causes of delay and project characteristics (including project cost). In this regard, the second research objective seeks to statistically establish the magnitude of correlation amongst four key project variables (project cost, contract period, additional time, and additional cost) as well as how each of these variables correlates with each client-related cause of the project delay. Numerous studies have examined the factors responsible for the delays in construction projects, so this study begins by critically reviewing the common causes globally before focusing on the KSA context.
2. Literature Review
2.1. Construction Delays in Global Context
From a global perspective, attempting to investigate or classify the various causes of delay in construction projects can seem daunting because the causes of delay can seem inexhaustible in the literature. For example, a study found up to 1057 causes from 47 peer-reviewed articles and concluded that 80% of these delays can be subdivided into three main categories: issues that arise at the execution stage, issues due to project administration, and issues related to labor disputes [14]. In another study, an exhaustive catalogue of the roots of construction project delays (CPD) was carried out through a systematic review of studies spanning three decades (1985 to 2018), leading up to 97 selected studies, from which 149 causes of CPD were extracted [15]. Findings showed that inadequate scheduling is a top-ranking cause of delay for both industry and academia, but one of the key gaps identified by this study is that there is need to investigate the inter-relationship (and reciprocal impacts) between several causes of delay. This is an interesting gap that this current study expects to fill. Furthermore, this study revealed that KSA was ranked 5th in the top 10 countries with research papers in this topic, and one of its top institutions—King Fahd University of Petroleum and Minerals (KFUPM)—was ranked as the top institution with the most papers. This suggests the importance that has historically been attached to research on construction project delays in KSA [15]. A more recent review of the historical causes of delay examined 168 studies done between 1982 and 2021 and found that six major themes emerged in construction delay research: the framework for analyzing delays, a dynamic building information modelling (BIM) 4D-BIM based analysis of delays, new models for delay analysis, the selection of methods for delay analysis, critical chain management, and blockchain/smart contracts in delay management [16].
Country-specific studies of the factors behind construction delays tend to provide a more manageable list. For instance, in Morocco, the top-10 reasons for delay were ranked in decreasing order of importance as follows: delayed progress payment, deficiency in training for workers, the absence of a management plan for construction waste, an unfeasible project duration, errors leading to re-work, the overuse of subcontracting, the delayed issuance of permissions from government, inadequate planning/scheduling, and uncoordinated planning and unskilled labor [17]. A study covering 37 construction companies in Pakistan, and which ranked the sources of construction delay, placed them in this order: (1) contractor, (2) owner/client, (3) consultants, (4) materials, and (5) equipment [18]. In Oman, it was found that client-side construction project delays are caused primarily by changing the scope of works, slowness of decision making, poor communication with stakeholders, and delayed progress payments [19].
Some delays are caused by supply chain factors (e.g., designers, contractors, and labor); natural phenomena (e.g., weather); and client-related factors, which in KSA, have been found to include recurrent design changes by clients and poor execution of works by the lowest bidding contractor as inherent in the KSA tendering system for public sector projects and delays in approving contracts [20]. A study conducted by Aziz and Abdel-Hakam [21] that reviewed the factors behind delays in construction projects based on 389 questionnaire respondents in Egypt revealed up to 293 different causes, indicating the wide range of issues contributing to construction project delay. From a list of 25 potential causes of delay, a study in India found the top 5 factors included financial difficulties of contractors, the non-payment of invoices, inadequate planning and scheduling, incompetent site administration, and the high volume of client-requested changes [22]. For healthcare projects in India, six construction delay factors were identified: a delay in progress payments, a lack of experience/ability of consultants/designers, variation and change order for scope of works, decision-making delays and litigation, inadequate coordination and communication among stakeholders, and a slow approval process by government agencies [23]. According to Van et al. (2015), [24], different levels of ‘integrity’ were found to be responsible for up to 19 factors contributing to government project failures and, in particular, the design phase was plagued by a lack of planning and a lack of clarity. A comparative investigation about the factors responsible for CPD in Australia and Ghana found the following causes: inexperienced contractors (43%), weak project control (21%), and the inaccuracy of potential contractors (14%) [25]. A similar study focused on government projects [24] identified 28 delay factors categorized into 6 groups, among which the 2 most important causes were the slowness of the client (government) in decision-making and financial difficulties by the client. A study by AlKharashi and Skitmore [12] investigated the delay factors by measuring the impact of the delays and the degree to which each delay factor can be addressed in practice, including those associated with clients, contractors, and consultants, as well as those associated with materials, labor, contract, and those causes related to the relationship.
Another investigation from Pakistan by Hussain et al. [26] involved a survey of 102 stakeholders and a pilot study with 16 experts in construction, from which they tested 52 delay factors as found in the literature. By comparing their results with previous studies in eight selected Asian countries, commonalities emerged, such as funding difficulties, delayed progress payment, and projects awarded to the lowest bidder. A study aimed at discovering the most significant factors that cause project delays and cost overruns investigated case studies from three countries (Australia, Ghana, and Malaysia) and found the most influential delay factors in Australia were a lack of adequate planning and scheduling, construction methods, and reliable feedback and monitoring, while for Ghana the most significant factors were a delay in payment certificates, the underestimation of project cost, and project complexity [25]. For Malaysia, the most significant delay factors were inadequate planning by contractors, inefficient site management, and deficiencies in the experience of contractors [25]. For Uganda, the most critical causes of construction project delays as found by Alinaitwe et al. 2013 [27] include changes to the scope of the work, delayed payments, inadequate monitoring/control, soaring capital expenditure, and political uncertainty, whereas financial problems of the contractor were the most crucial factor in India [22].
Additionally, various scholars [28,29,30] have identified paper-based inefficient processes as being among the critical reasons behind project delays. Traditional project management practices involve tedious paper-based manual process such as data entry, recording of measurements, quantity take-offs, project monitoring, scheduling and cost control, and general contract documentation. According to Azhar et al. (2008), these kinds of manual-based approaches are prone to errors and could lead to project delays, whereas adopting building information modelling (BIM) could alleviate or eliminate some of these issues [31]. Similar concerns were highlighted by others such as [32], who emphasized the inefficient and error-prone ‘paper-based processes’ used in site meetings, record keeping, works inspections, and monitoring, during which project deadline pressures could result in compromised accuracy or quality, hence contributing to delays. It was also shown that for an industry that is rich in data from sources such as BIM and Internet-of-Things (IoT) sensors in its project sites, the pace of adoption of artificial intelligence (AI) and machine learning (ML) for predicting and managing delays is slow [33]. One area where digital technology can support research into construction project delays is in understanding the synergy between delay factors. One example of a study on the interdependence of delay factors was carried out using ML algorithms for accurate prediction utilized two machine learning models (i.e., decision tree and naive Bayesian classification). The results were based on training the ML model on nine sources of delay risk, including clients, contractors, consultants, design, labor, material, project, equipment, and external factors, which produced 59 delay risk factors from data drawn from 51 construction projects in Egypt. Findings suggest that the sources of delay risk are very interdependent and complex, making time overruns challenging to manage, but using ML techniques (naive Bayesian model) provides a reliable predictive model, producing the necessary associations and allowing for better decision making that is evidence-based [34].
Another important factor to be considered in delays to construction projects is attributed to a phenomenon referred to as ‘optimism bias’, which is a cognitive bias that leads a decision-maker to downplay the extent to which an adverse situation or event could affect them [35]. In the construction industry, optimism bias could occur due to either the underestimation or overestimation of the expected duration or costs of a construction project [36]. This phenomenon plays out in the form of the ‘Planning Fallacy’, where construction planners and managers exhibit optimism bias when conceptualizing and evaluating a proposed project’s duration, cost, and even benefits [37]. From many studies in the literature [38,39,40,41,42], it has been found that large infrastructure projects are often prone to such inaccurate time/cost estimates, and these have been attributed to optimism bias.
Other unique project characteristics that can result into delays include the type of building, where studies have found that healthcare projects are prone to delays for specific reasons. For instance, a US-based study on hospital construction found that such projects were often affected by changes much later in their execution phase due to clients changing end-user requirements and the fast-evolving nature of healthcare technologies, leading to disruptions and negatively affecting productivity, with obvious consequences for cost overruns [43]. The sophisticated nature of hospital projects has led to the adoption of non-traditional procurement models such as the private finance initiative (PFI) in the United Kingdom, with benefits including privately managed risks in aspects such as budget/cost controls and delay management [37,44], as well as managing over-optimistic schedules and a poorly defined scope [37]. For developing countries, it has been found that adopting the public private partnerships (PPP) model for hospital procurement can help stakeholders overcome some of the challenges associated with such complex projects. Some of the risk factors identified for PPP projects include the payment mechanism for the investors, as well as disputes, design flaws, material variations, cost overruns, and delays. The study concluded that a lack of effective risk allocation as well as a short-term view of healthcare investments are among the challenges that, when overcome, can improve the PPP delivery process [45]. However, the resilience expected from PPP procurement has not always been successful, and the UK’s National Health Service (NHS) has been moving away from such models [46].
The unique role of government as a statutory authority and as the client for construction projects is also an important to consider. In Singapore, research based on two case study hospitals showed that although project managers had prepared detailed construction programs with properly estimated activity durations and sufficient float, both projects still experienced delays due to client-based factors such as additional requirements or the changing scope of works by stakeholders, regulatory restrictions placed by the Singapore government on bringing in foreign labor, and aggregate shortage due to a foreign government’s ban on exporting aggregates [47]. Other government-related constraints that could contribute to delays in hospital projects include statutory design compliance issues, which can manifest in designs being delayed or reworked, and, in this regard, the automation of compliance checking can speed up the design process while minimizing future reworking [48]. The next section focuses on delays in the KSA context, where the issue of government/client-related delays will be examined further.
2.2. Delays in the KSA Construction Industry Context
The Saudi Vision 2030 identified the high quality of infrastructure as very important to meeting the needs of the country’s growing population, in addition to other critical projects necessary for the modernization and ‘Future Cities’ program [7]. The projects necessary to achieve this vision have been subject to delays, as shown by a number of investigations conducted on the delays in KSA over the last two decades. A recent study based on 34 construction projects in KSA investigated the relationship between productivity and construction delays and found a strong association between delay factors and productivity factors (which include inefficient labor, inefficient coordination among construction stakeholders, inadequate manpower, design errors, and awarding a contract to the lowest bidder [49]). Another study [50] focused on Saudi Arabia reported that 662 projects valued at 40 billion Saudi Riyals were found to have suffered significant delays, which is a significant amount, with the material and technical capacity of the contractor being responsible for 82% of such delays, while regulatory obstacles were responsible for 12.2% of the delays.
Given the importance attached to key construction projects of the KSA government’s Vision 2030 ambition and the ‘Future Cities Program’ [7], it is not helpful that many causes of delay are directly linked to the client, including poor communication, client interference, a delay in progress payment, slow decision-making by the client, changes to the scope of work, a shortage of funds from the client, and the bidding system [50]. These factors point to culpability on the part of the client. Although other causes were found, such as poor qualifications by skilled staff, inadequate capacity by the contractor, logistics and material delivery issues, poor design management, and low productivity, among a list of 56 factors in total [50], the prevalence of so many client-related factors is crucial to addressing delays in the Saudi context.
One study focusing on infrastructure [51] identified three groups of stakeholders that were found to be responsible for delays in Saudi public utility projects, including consultation officers, water and sewage project owners, and sewage contractors. The study found that financial difficulties (including cash flow) were the most important factor for delays, and these could be due to reasons such as delayed payments by client to contractor, inadequate planning by the contractor, and a government policy of awarding contracts to the lowest bidder, regardless of the capacity to deliver at the accepted bid price. This study found that contractors for many medium-to-large-scale projects requested additional time. For large construction projects in the Eastern Province of Saudi Arabia, Assaf and Al-Hejji [1] analyzed a group of stakeholders, which included 19 consultants, 15 owners, and 23 contractors, and deduced that change orders from the client were the only common cause of delay, while other main causes that were unique to each group of stakeholders included delayed progress payment and changing regulations (client), inadequate planning/scheduling (consultants and contractors) and poor and site management, a lack of necessary workforce, and construction accidents (contractors). From consultants’ perspective, a survey of 51 construction projects in the Northern Province of Saudi Arabia revealed that delays were caused by changes to design specifications, awarding contracts to lowest bidders, unrealistic project durations, frequent deviations from the original design, inflation in the cost of materials, shortages of manpower, low productivity, and delays between the completion of design and the commencement of works [52]. A further review of the literature revealed many studies on the causes of construction delays in KSA, as summarized in Table 1. The research methods used by these studies were often questionnaire surveys, with an analysis carried out using statistical techniques such as the frequency index, importance index, and severity index, but there were similarities in the factors identified by these studies.
3. Materials and Methods
This study is based on case studies of construction projects executed under three KSA government agencies: The Ministry of Health (MOH), the Ministry of Education (MOE), and the Ministry of Municipal and Rural Affairs (MOMORA). The rationale for choosing these government agencies is their key role in the Saudi Vision 2030 and their accessibility to sufficient historical data. In particular, it was important to access historical construction project documents (drawings, minutes of meetings, contract documents, etc.) since these would provide a more objective source of data, as opposed to questionnaire or interview data, which could be subject to inaccuracies, forgetfulness, or some other form of bias. The use of such historical data from completed and properly documented projects would help one achieve the stated objective of this study (exploring the nature and impact of delays on contemporary construction projects), and a 10-year period (2007–2017) was used since more recent projects were either inaccessible or subject to on-going disputes. This approach is helpful since the use of documentary materials is regarded as an important source of information in terms of objectivity and critical analysis since it was generated outside of the research study’s influence [57]. Additionally, the novelty and originality in such a study can be established through a validated assessment of publicly available documented evidence [58], and this reveals the point of departure between this study and similar studies done for KSA in particular. Archival data are regarded as valuable sources since they make the replicability and validation of research easier and more transparent than primary data [59], and even though the term ‘archival’ has historical implications, it can be applied to recent documents that are stored for record-keeping purposes [60].
The distinction between archival data and secondary data is important because although all historical records are essentially secondary data, archival research uses data that resulted from factual day-to-day occurrences (and are integral to the reality under investigation), whereas secondary data may be relevant but would have been collected for a different purpose [61]. In other words, archival research enables research questions that focus on past events to be answered and viewed through the lens of time, even though the nature and format of the archival records will dictate the extent/type of questions that are answerable. In this study, the archival data source from three Ministries is comprised of prequalification request documents, tender documents, contract documents (including designs), minutes of meetings, email messages, payment requests, requests for information (RFIs), change orders, and hand-over documents. Not all data were usable, and only projects that had the above kinds of documentation and for which access was granted to researchers were shortlisted. These are known constraints as it has been established that an archival research strategy can be disadvantaged by the unavailability of information, inaccessibility to information for security reasons, and the censoring of some information for confidentiality purposes [61]. The archival data used in this study was originally published by a co-author [62], with further refinement and analysis done subsequently.
Based on the objectives outlined earlier and the type of data that was available to work with, two key research questions (RQs) were identified: RQ1: which client-related delays are the most common in terms of frequency of occurrence and impact on cost overruns? and RQ2: what is the extent (magnitude) of the relationship (correlation) amongst the different projects characteristics as well as with the client-related causes of delay?
For studying delays, which often relate to cost overruns, the Project Management Institute [63] has recommended some mathematical models for quantifying variations in duration and cost for the whole project performance. The equations are used to compute different kinds of variations such as schedule performance index (SPI) (Equation (1)) and cost performance index (CPI) (Equation (2)).
Finally, statistical analysis of the archival data was done using descriptive statistics and correlation analysis/tables. The correlation was necessary for ascertaining the relative associations and impacts that project variables have on cost and delays. In this regard, a point bi-serial correlation for measuring the strength of association between two variables was used with the SPSS package [39]. This technique enables a single measure of association (R-value) to be established using the ranges of −1 (perfectly negative correlation) to +1 (perfectly positive correlation), while 0 connotes no correlation. In between these extremes, there are intermediate scales, e.g., 0.8 is not perfect but strong positive correlation, while 0.3 is a mild or weak positive correlation. Correlation is not causation, but it provides an interdependency measure, e.g., for positive correlation, as X increases Y also increases [64].
4. Results
4.1. Overview of Case Study Organisations
The summary of the archival project documents obtained for the three case study organizations—the Ministry of Health (MOH), the Ministry of Education (MOE), and the Ministry of Municipal and Rural Affairs (MOMRA)—is provided in Table 2, Table 3 and Table 4 below [62]. In total, sufficient information was collected from 37 projects across these organizations: 12 MOH projects; 14 MOE projects; and 11 MOMRA projects. The collected data were cleaned and formatted to present uniformity and establish commonalities towards ease-of-generalization analysis. Project characteristics such as name, region, size, cost, start and end dates, additional cost, and additional time were captured. Further data extracted per project include the client-related causes of delay, the consequences of such delays in terms of additional time granted to contractors, and the cost implications of such delays. This approach to formatting the archival data would enable the examination of the delay factors, including statistical analysis and sorting, and the ranking of these factors.
4.2. Analysis of Ministry of Health (MOH) Projects
The 12 MOH projects comprised of hospitals across different regions of KSA (Table 2) have an average capacity of 210 beds and were executed between the period of 2014 and 2017. A ranking of the client-related delays (Table 5) was based on the frequency of the occurrence of each delay factor from the archived documents, where ‘change order and delays in approving it’ was the top-ranking factor, followed by ‘delayed progress payment’.
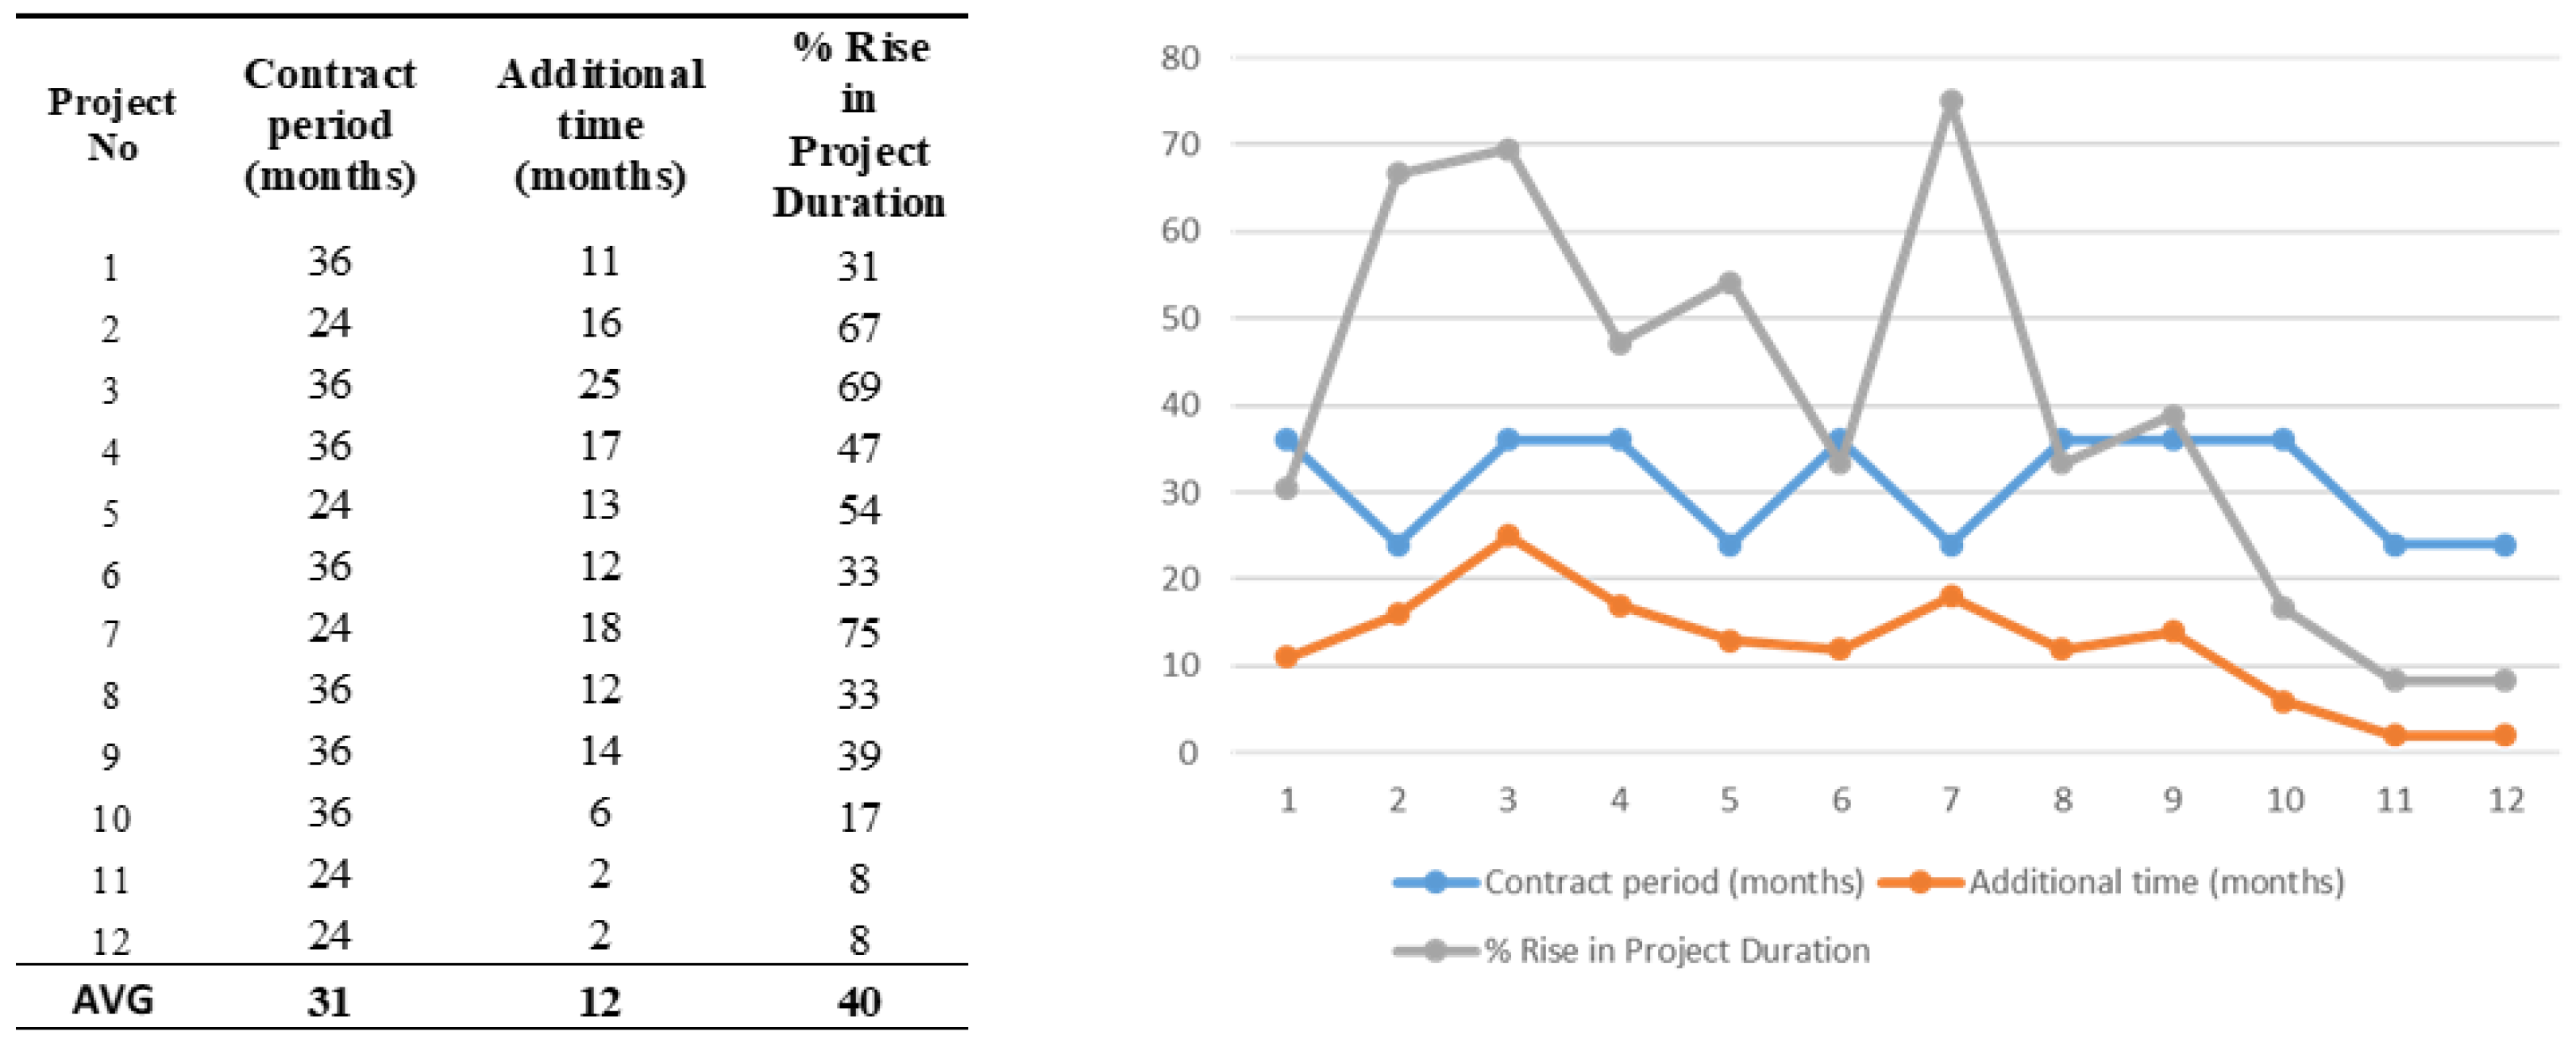
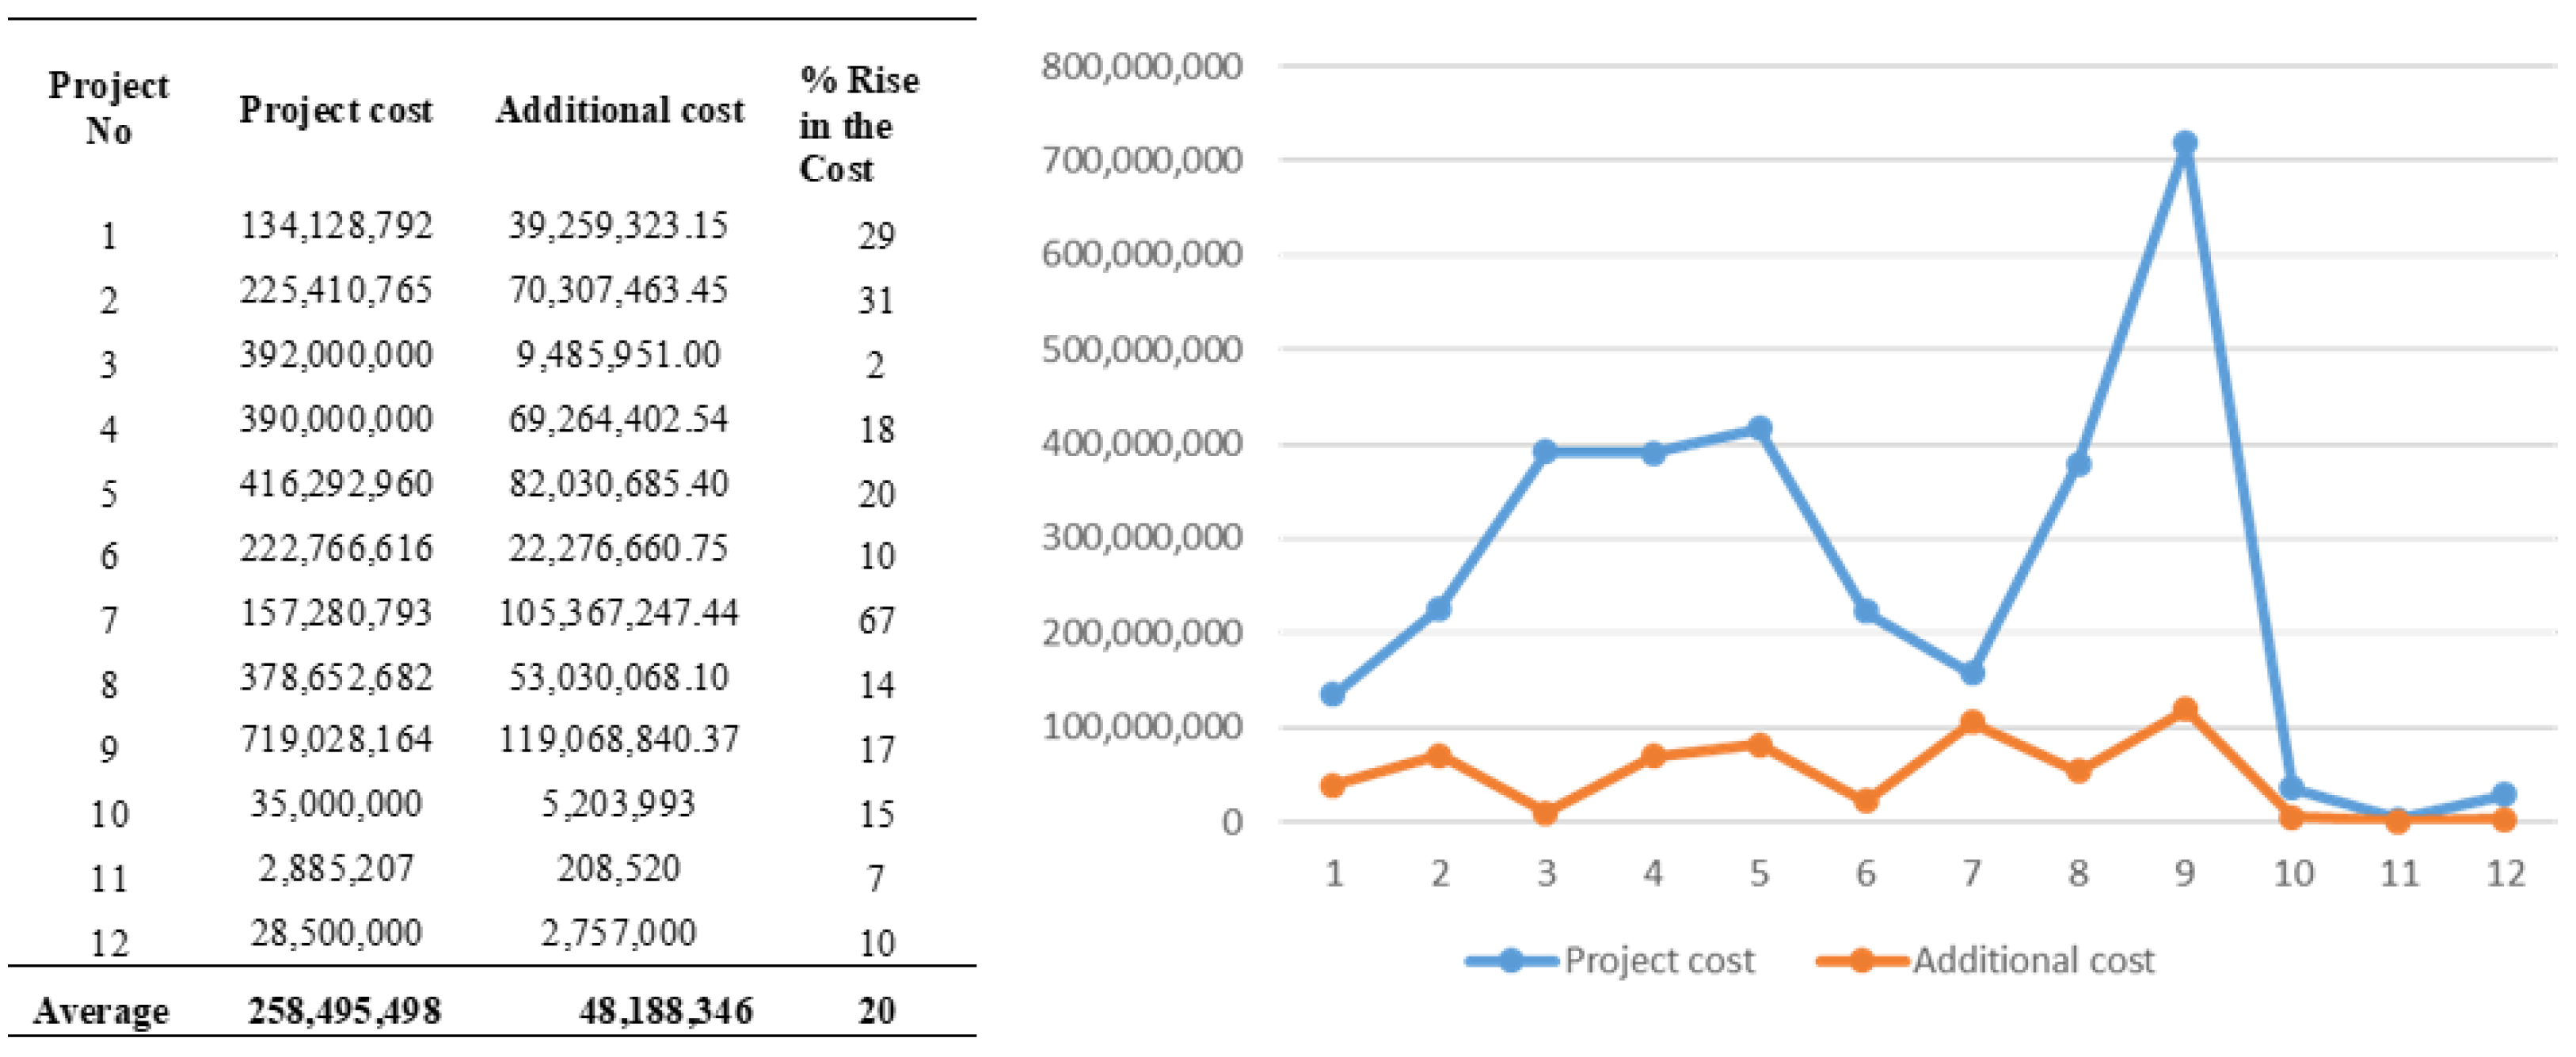
Further analysis of these 12 MOH projects showed that, on average, the additional time added to these projects was 40% (Figure 1), with the average cost of delay being 20% additional costs (Figure 2). The maximum delay was for a project for which the additional time was 75% of the original duration, and the causes of its delay were found to be a combination of many factors, including a delay in payment by client, change order and delays in approving it, ineffective scheduling and planning, and poor communication.
Evidence of optimism bias could be deduced from Project #6 and Project #7, which both represent hospitals based in Riyadh City, with a similar capacity (200 beds) and started at around the same time (June 2012) yet that exhibit significant differences in contract duration (36 and 24 months, respectively). Project #6 had an initial cost of ~SR 222 million and required 12 months additional time at a cost of ~SR 22 million, while Project #7 had an initial cost of ~SR 157 million and required additional 18 months and additional cost of ~SR 105 million. With an additional 67% cost increase, Project #7 had a significantly higher additional cost than other projects, as even Project #6 only had a 10% increase in costs. Both projects experienced three similar delay factors (out of a total of four), with the differences being ‘variations and error in design’ (Project #6) and ‘delay in progress payment’ (Project #7). It is evident that both time and cost for Project #7 were either grossly underestimated or the multiple causes of delay (leading up to 18 additional months) had a knock-on effect and accrued towards the additional costs.
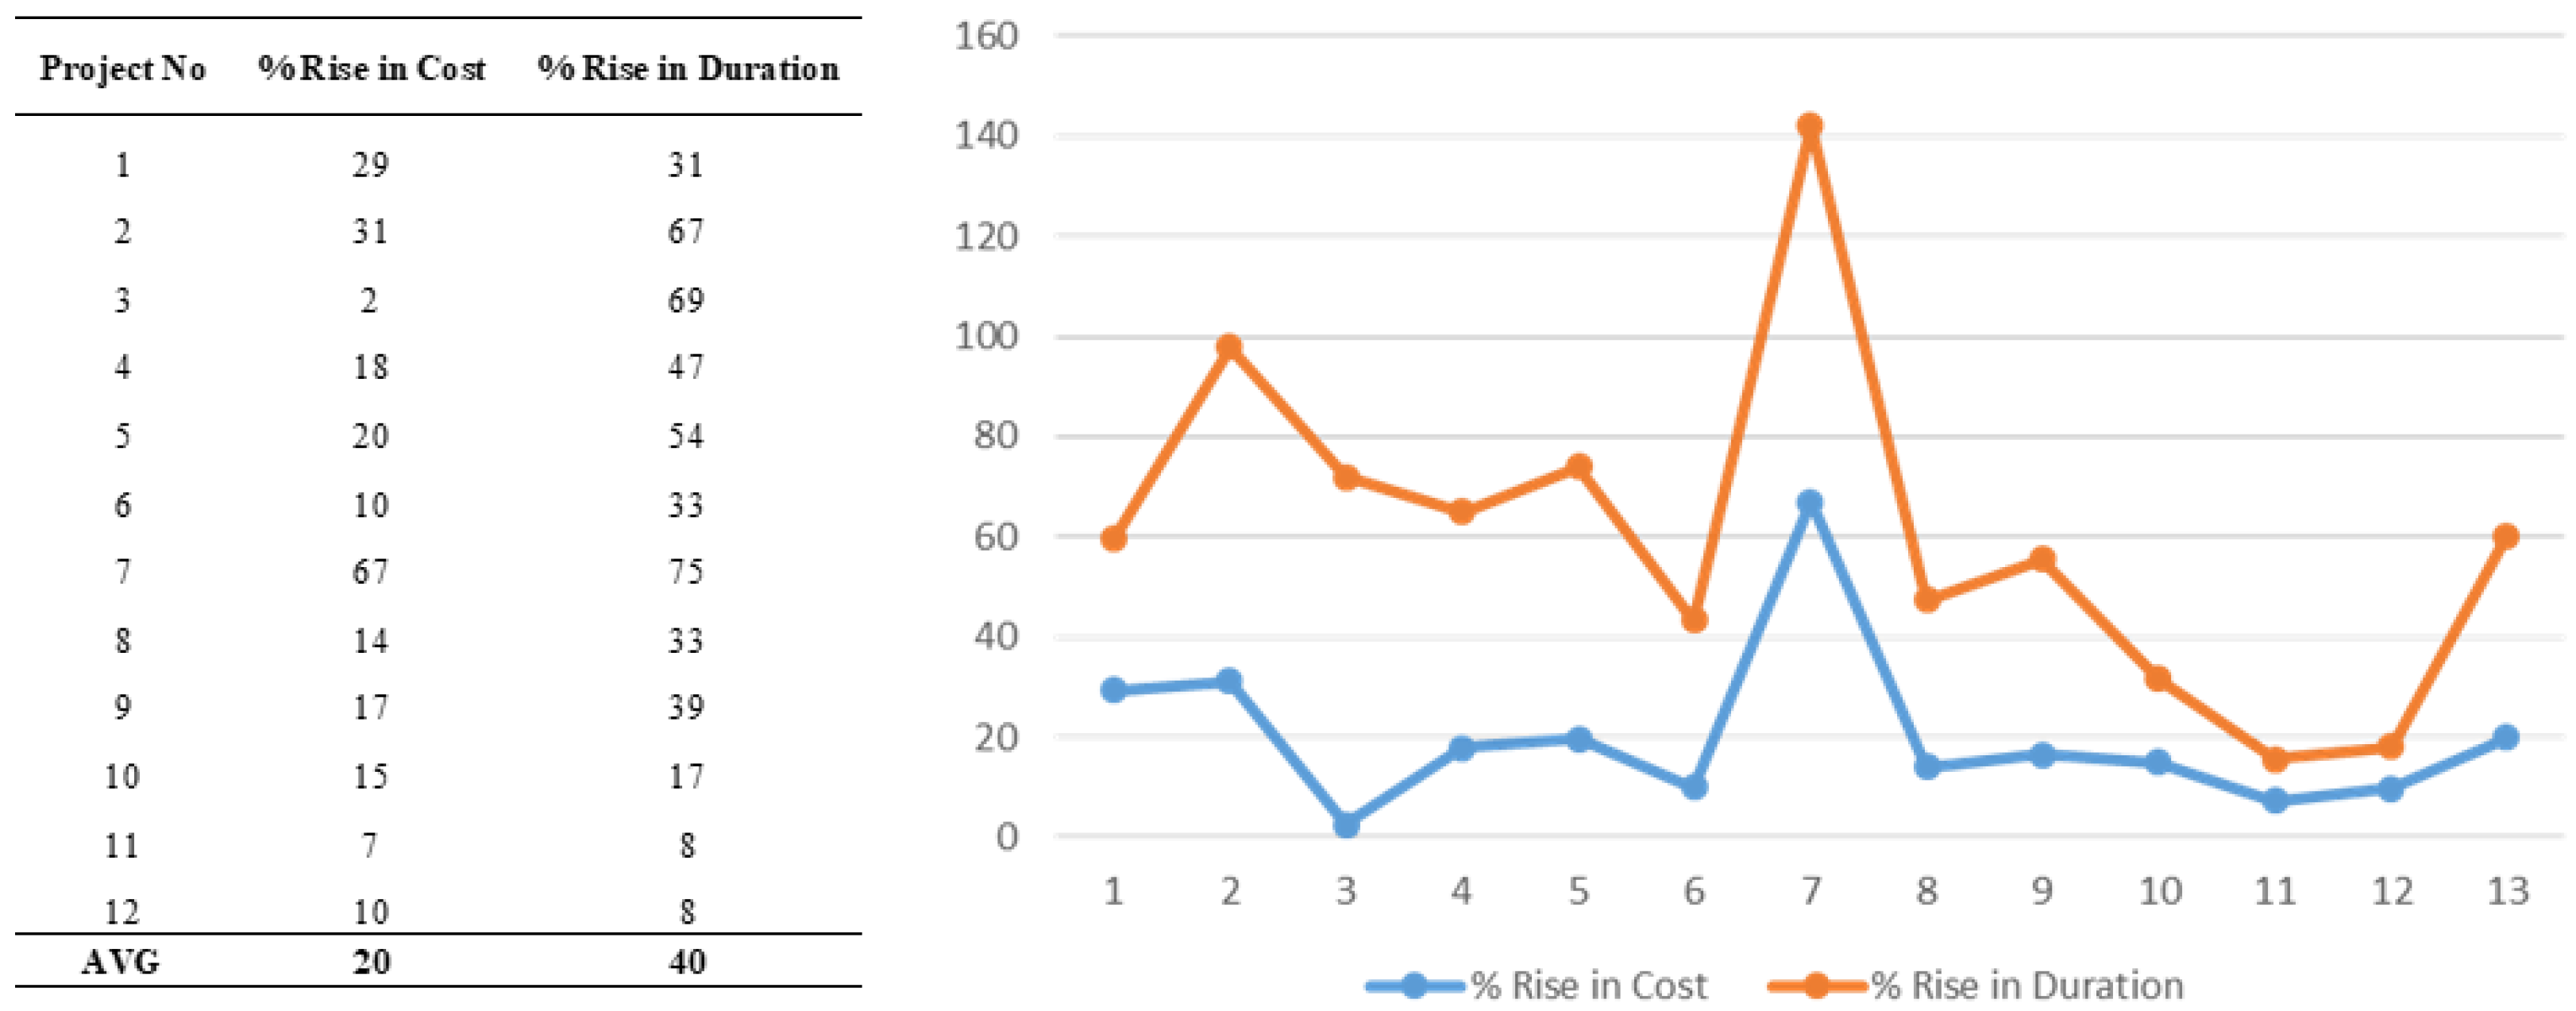
The magnitude of delays and additional costs for MOH projects can be shown to have a relationship as there appears to be a relationship between the percentage increase in project duration and the percentage increase in additional time (Figure 3). The similarity in trend is interesting because the combination of delay factors is not the same for each project. It can also be seen that Project #7 is indeed an outlier or relatively extreme in both time and cost increments. It is also evident that all projects experienced the delay factor ‘change order and delay in approving it’, and almost all projects experienced either ‘variations and errors in design’, ‘delay in progress payment’, or both (Table 2).
4.3. Analysis of Ministry of Education (MOE) Projects
For the 14 projects under MOE (Table 3), six kinds of client-related causes of delay were found (Table 6). Most of these delay factors were similar to those of the MOH projects in terms of type and ranked order, but a new cause delay (a delay in approving and amending the bill of quantity) was discovered and came in as the third most common cause of delay. This new cause of delay occurred in six of the 14 MOE projects.
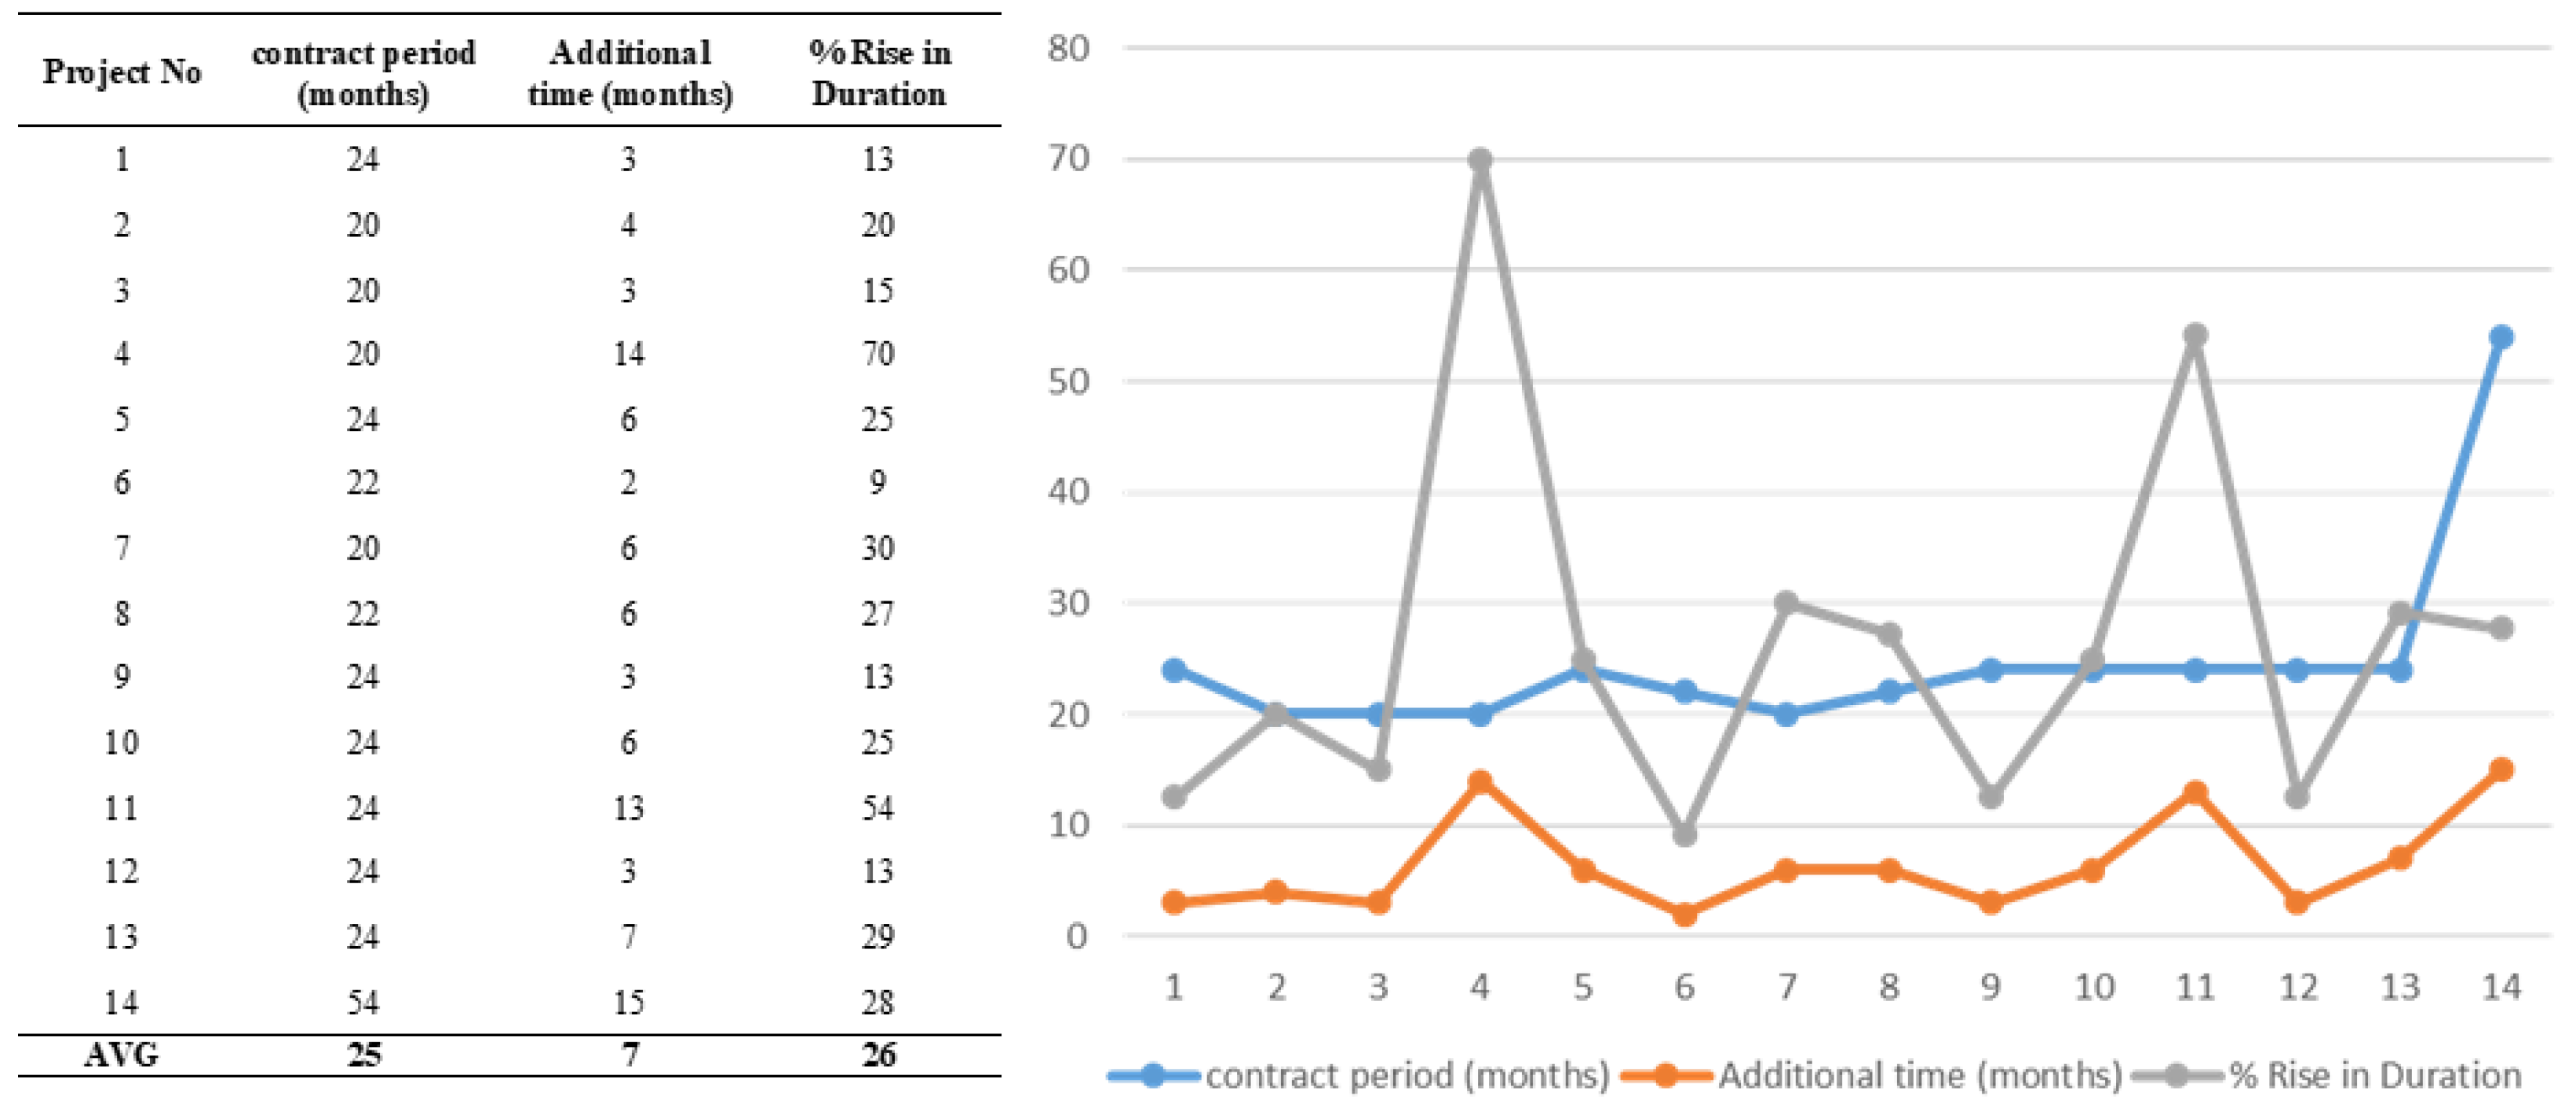
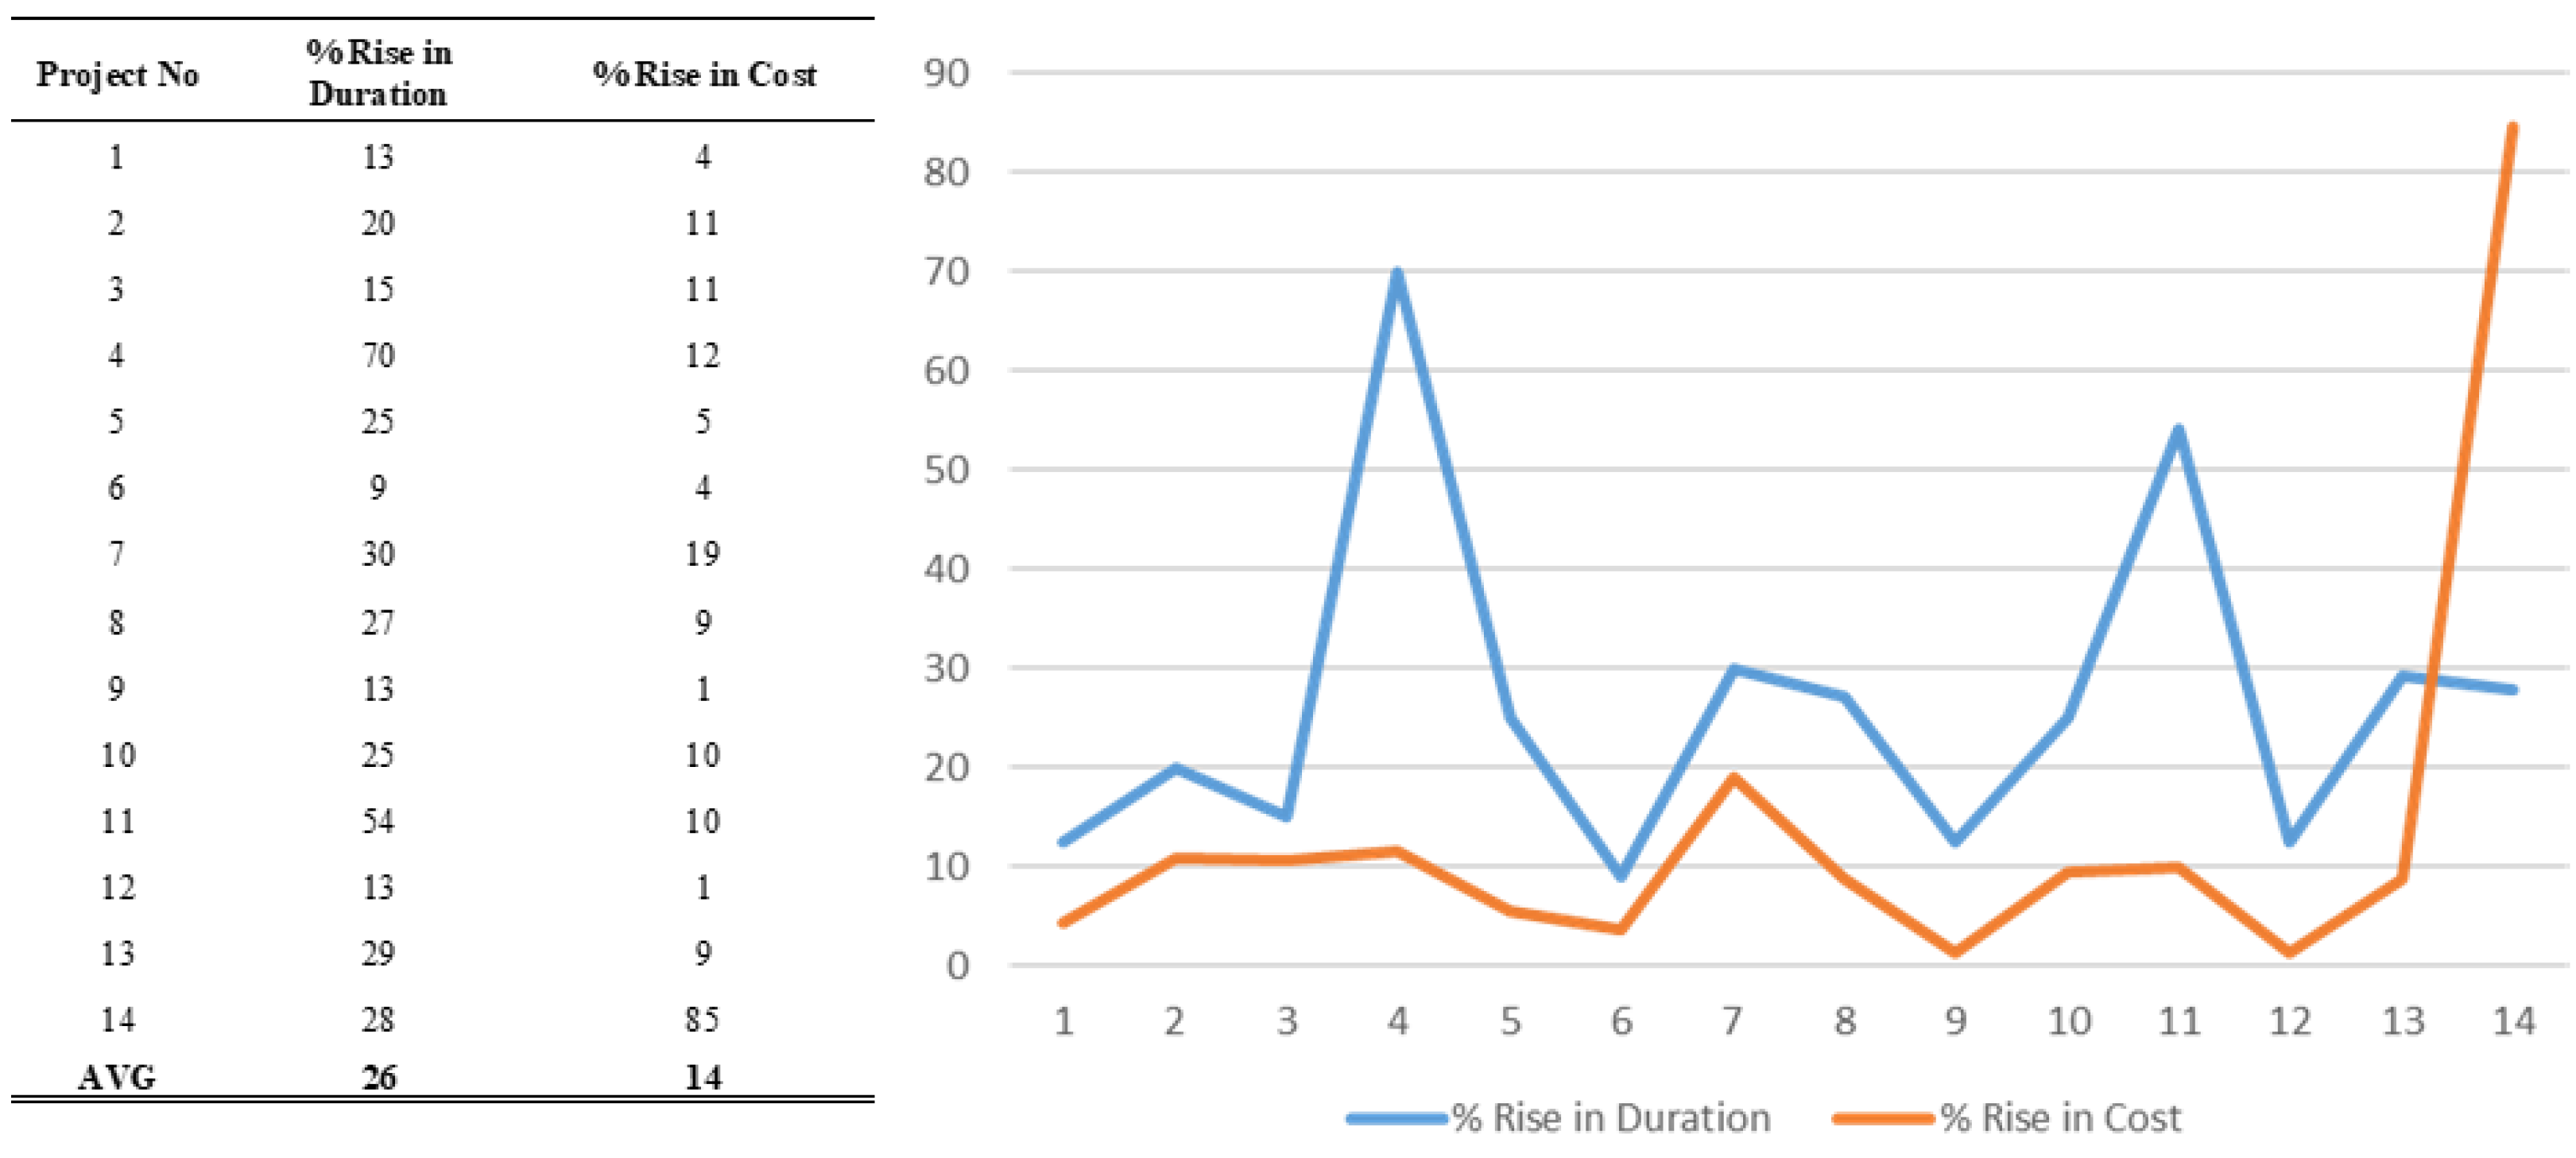
The 14 MOE projects had an average additional time of 7 months, representing a 26% average increment in duration (Figure 4). Although it was not the biggest project in cost or size, Project #4 (a 17-classroom school for 680 pupils, costing ~SR 6.4 million with 20 months duration) was found to have required the largest additional time of 14 months, representing a 70% rise in project duration. This project was also unique in having only two causal factors for its delay: ‘delay in approving the amended bill of quantities’ and ‘ineffective planning and scheduling of project’. The smallest increase in additional time was for Project #6, which had a project cost similar to Project #4 (22 classrooms for 860 pupils, costing ~SR 6.6 million and having a 22 duration of months) and had only a 9% increase in additional time (2 months). The causes of delay for this project were found to be ‘ineffective planning and scheduling’, ‘poor communication’, and ‘delay in approving the amended bill of quantities’. Setting aside the possible differences in project factors, e.g., location, and the one-year difference in contract award dates, the significant contrast in these rather similar projects is a possible indication of optimism bias. The relatively smaller Project #4 had a 12% cost overrun compared to Project #6, which had only a 4% increase in cost.
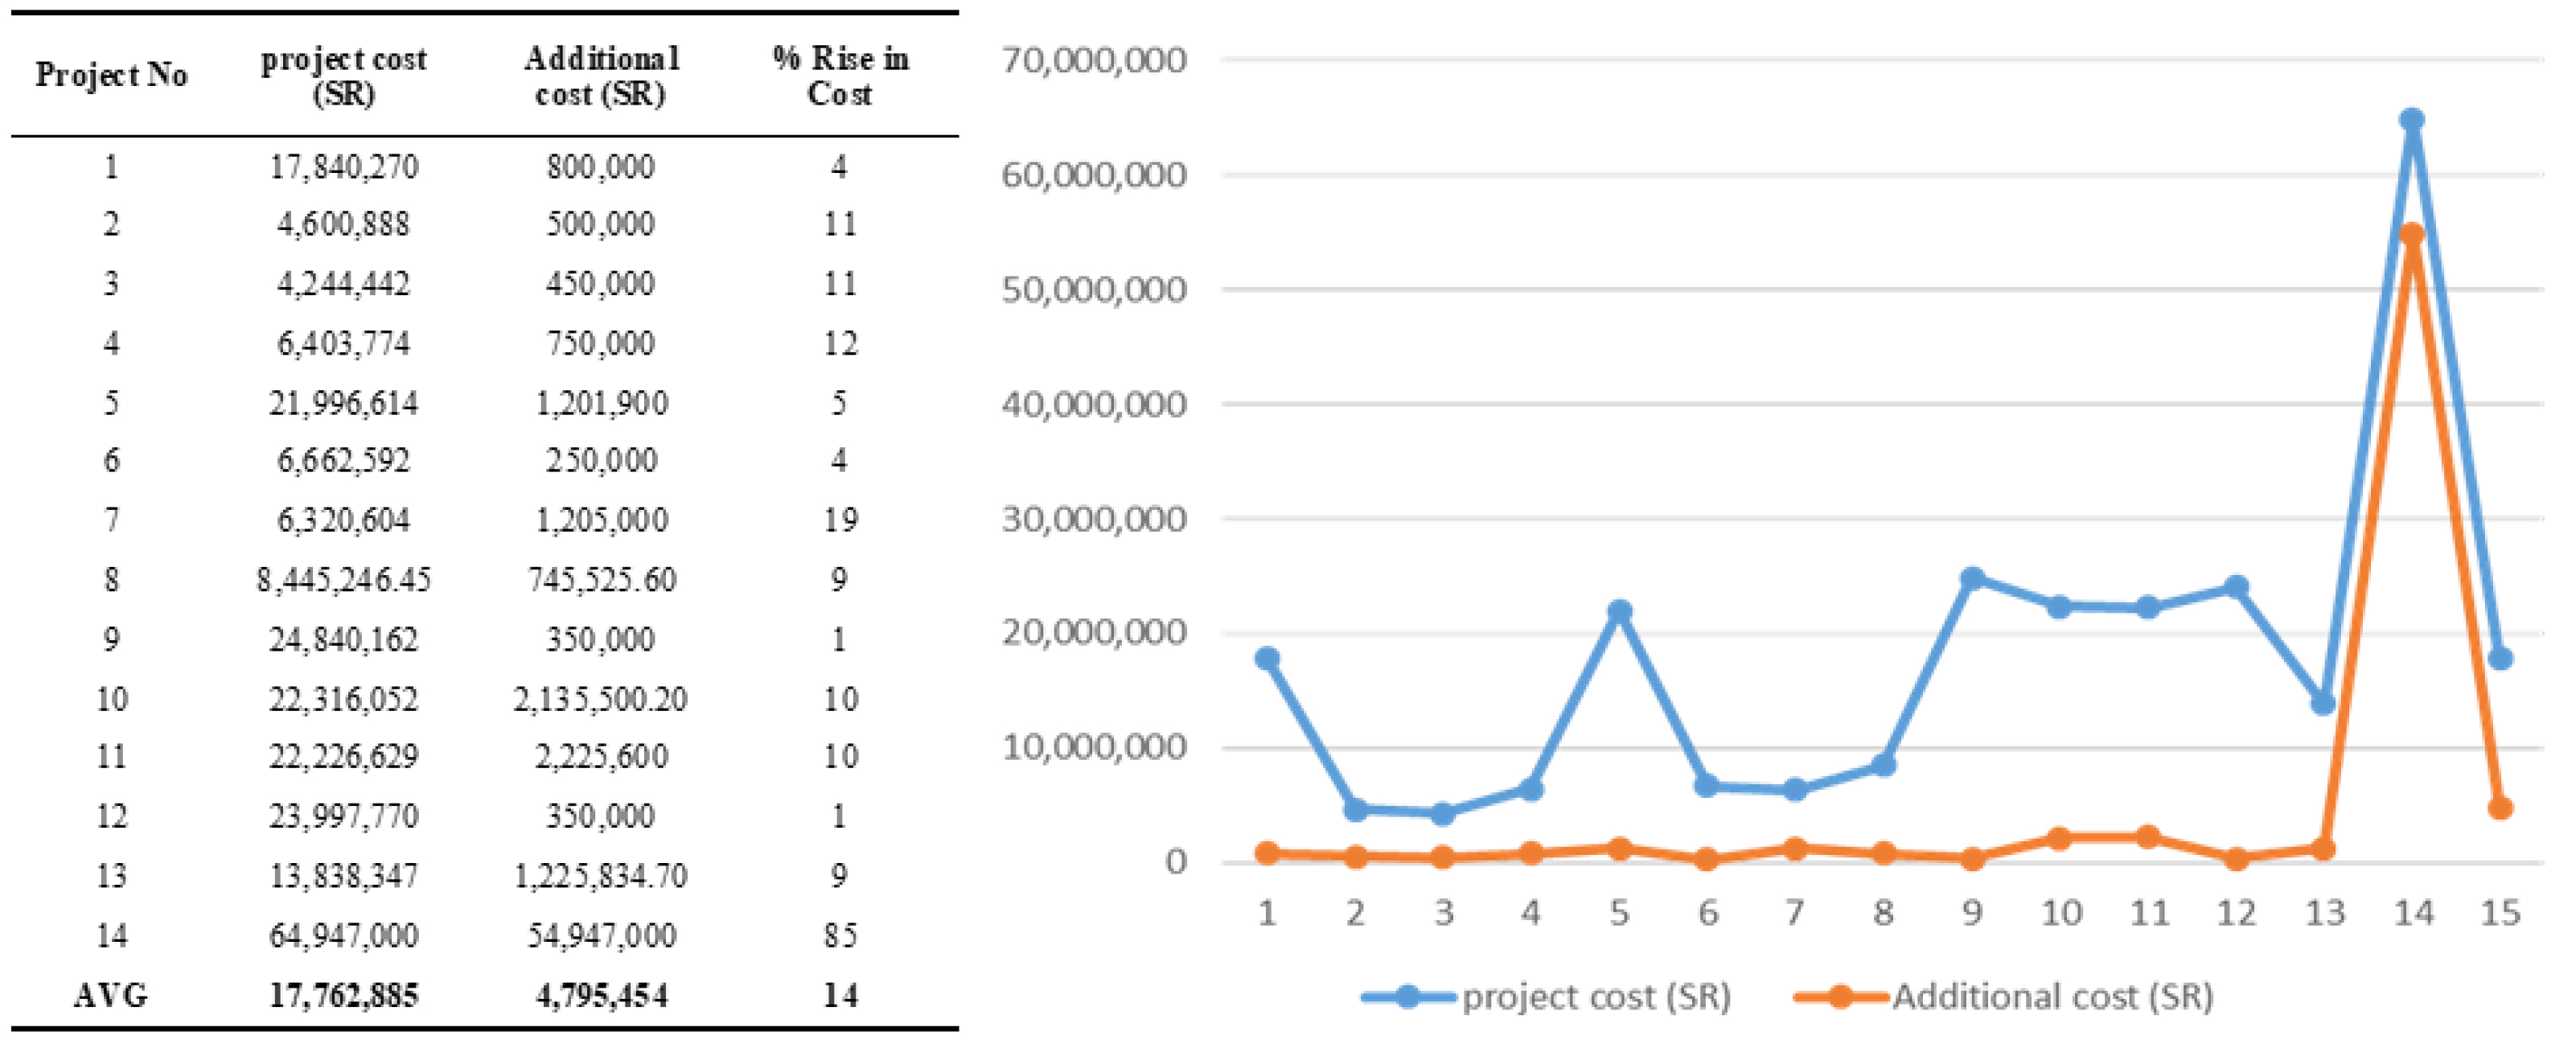
Overall, the MOE projects were on average found to have a 14% increase in cost, (Figure 5) with the largest cost overrun occurring in Project #14 (85%), in which ‘change order and delay in approving it’ and ‘poor communication between the project parties’ were the causes of delay. It was noted, however, that this project (expanding the Faculty of Dentistry) was more sophisticated than the majority (secondary schools).
There was more similarity in the pattern of percentage increments in additional time and cost (Figure 5) than in the patterns of project cost and additional cost (Figure 6), and the latter could be due to the significant variation in scope and cost of projects. Nevertheless, percentage-wise, the rise in duration correlates with an increase in cost (Figure 5), demonstrating a trend similar to what was observed previously with MOH projects. ‘change order and delay in approving it’ occurred in majority of projects, while ‘poor communication’ was a recurring theme in half of these projects.
4.4. Document Analysis for Ministry of Municipal and Rural Affairs (MOMRA)
The 11 projects analyzed for MOMRA (Table 4) are more varied in type and cost, ranging from drainage works to pavements and parks and completed between 2011 and 2018. Only five kinds of client-related delay factors were found, with the highest-ranking factor being ‘change order and delay in approving it’ occurring in nine projects. Two other causes—‘ineffective planning and scheduling of the project’ and ‘poor communication between the project parties’—occurred in seven projects (Table 7). A new delay factor appears in the MOMRA projects in the form of ‘site problems as well as delays in starting projects’.
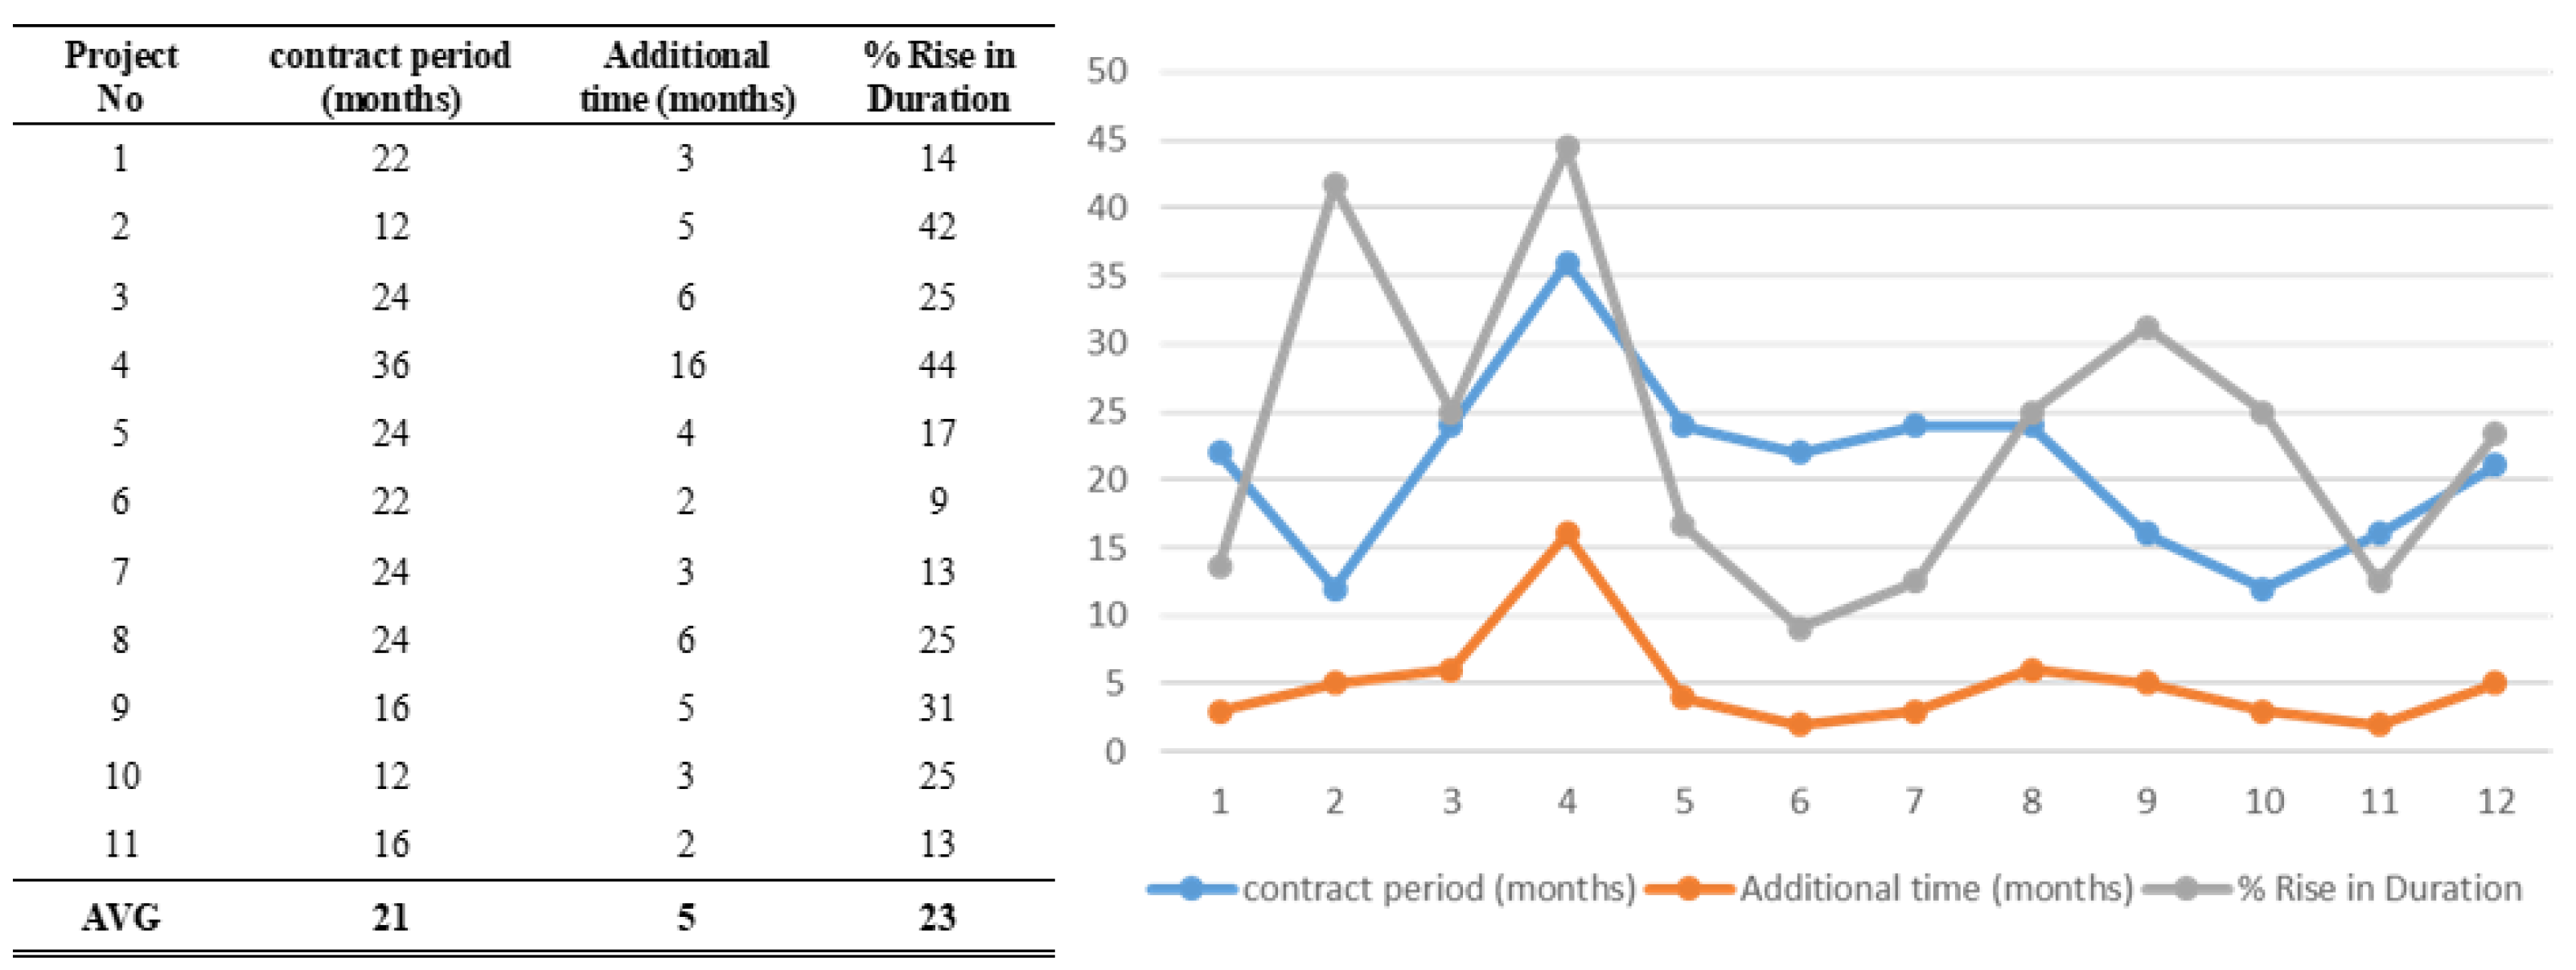
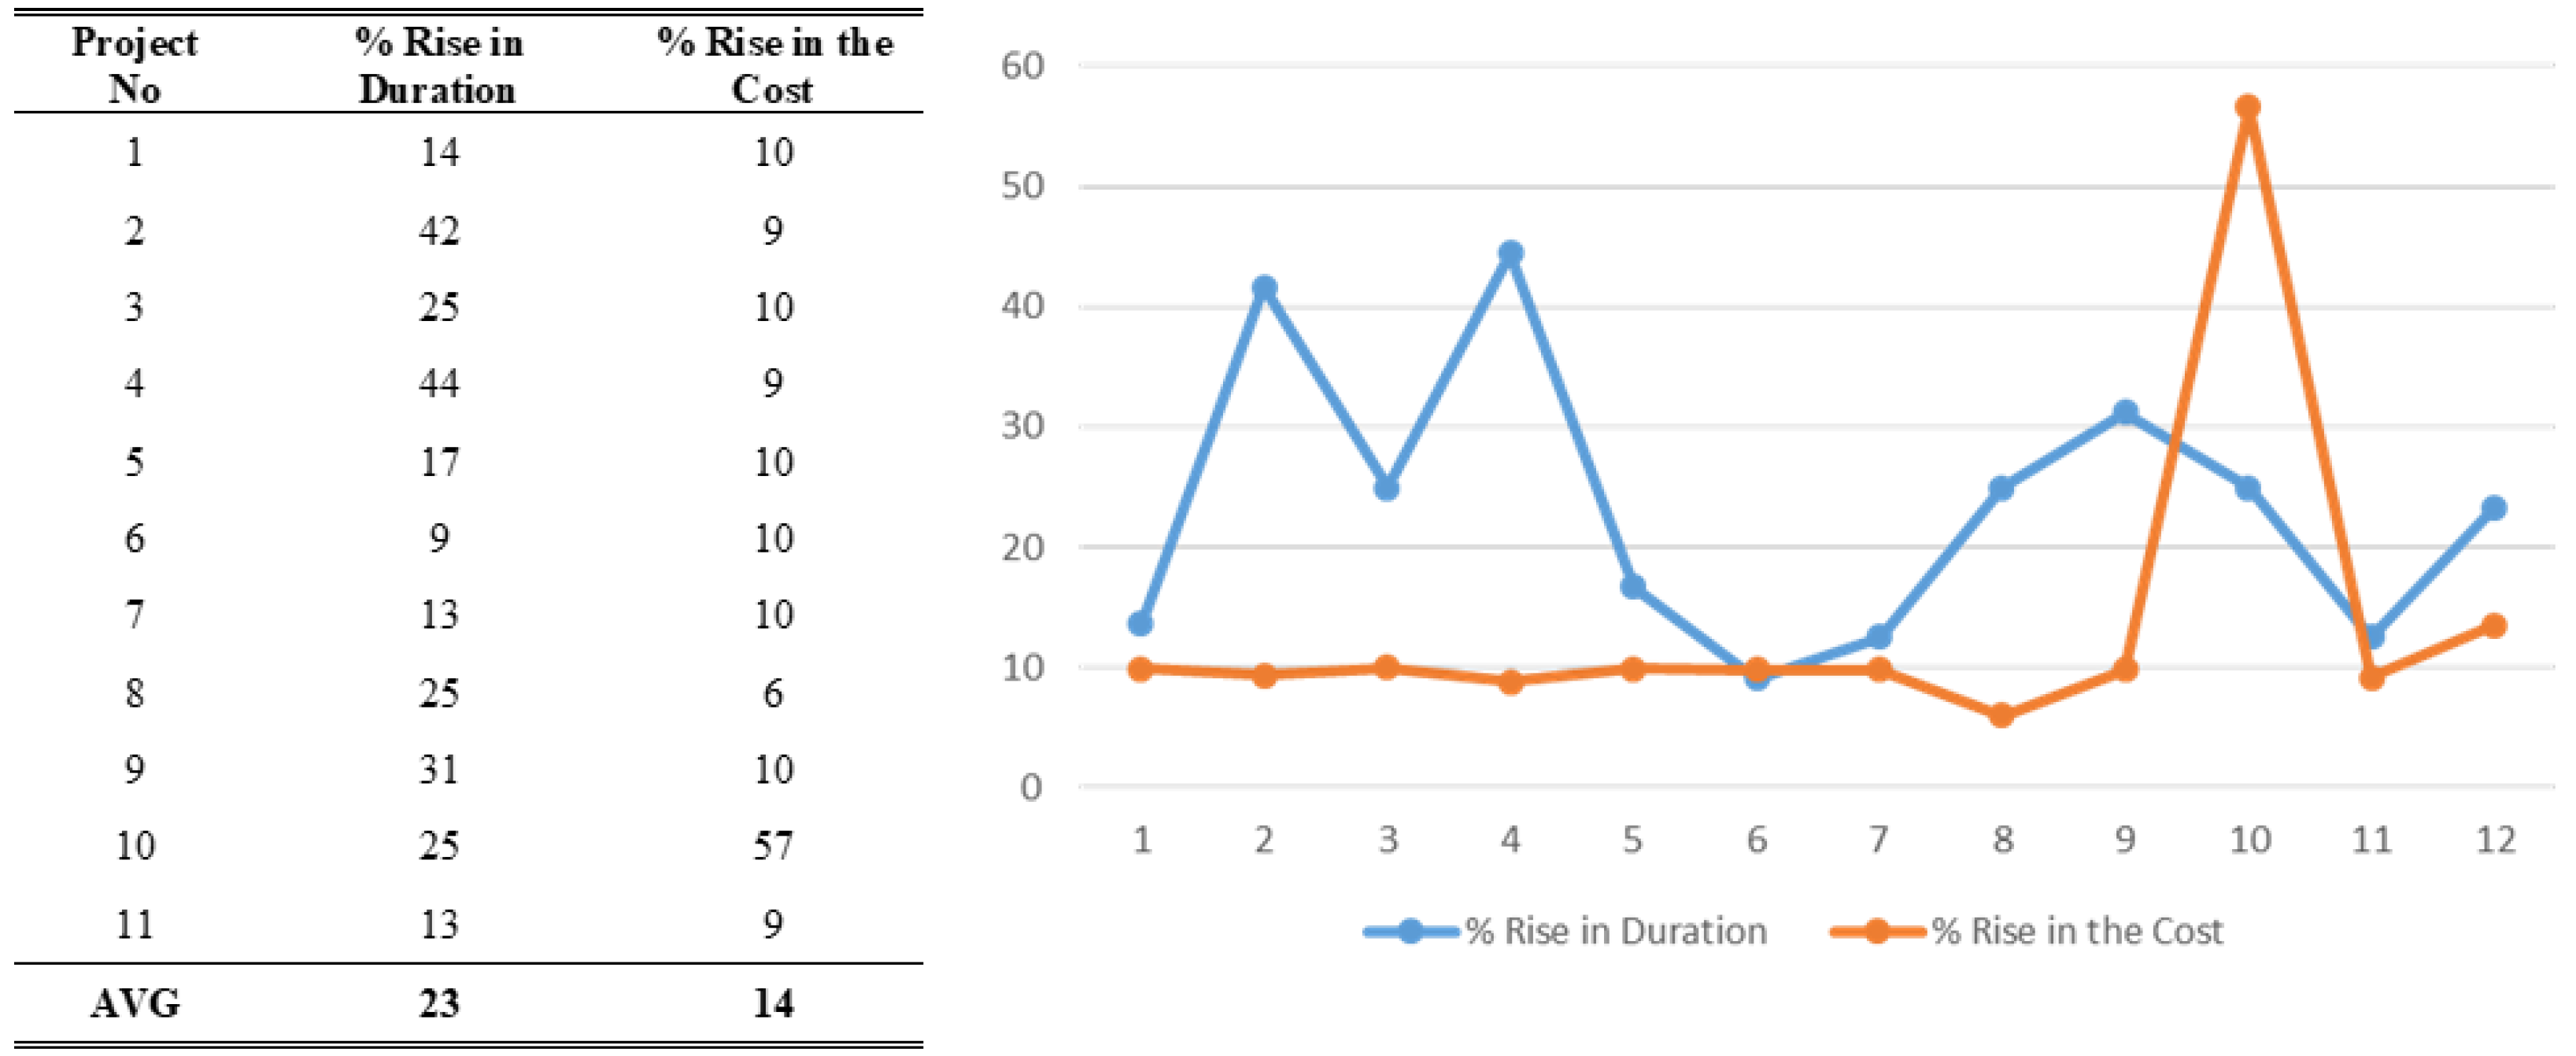
For the MOMRA projects, it was found that client-related causes of delay led to an average of 23% (5 months) of time added to projects (Figure 7). Similar to what was observed in MOH and MOE, the analysis showed a significant underestimation of project duration. The project with the largest percentage increase in duration (44%) happened to be the costliest (Project #4), requiring 16 additional months. The prime delay factors for this project were ‘site problems’, ‘delays in starting projects’, and ‘ineffective planning and scheduling of project’. Overall, a pattern could also be deduced between the contract duration and additional time (Figure 7).
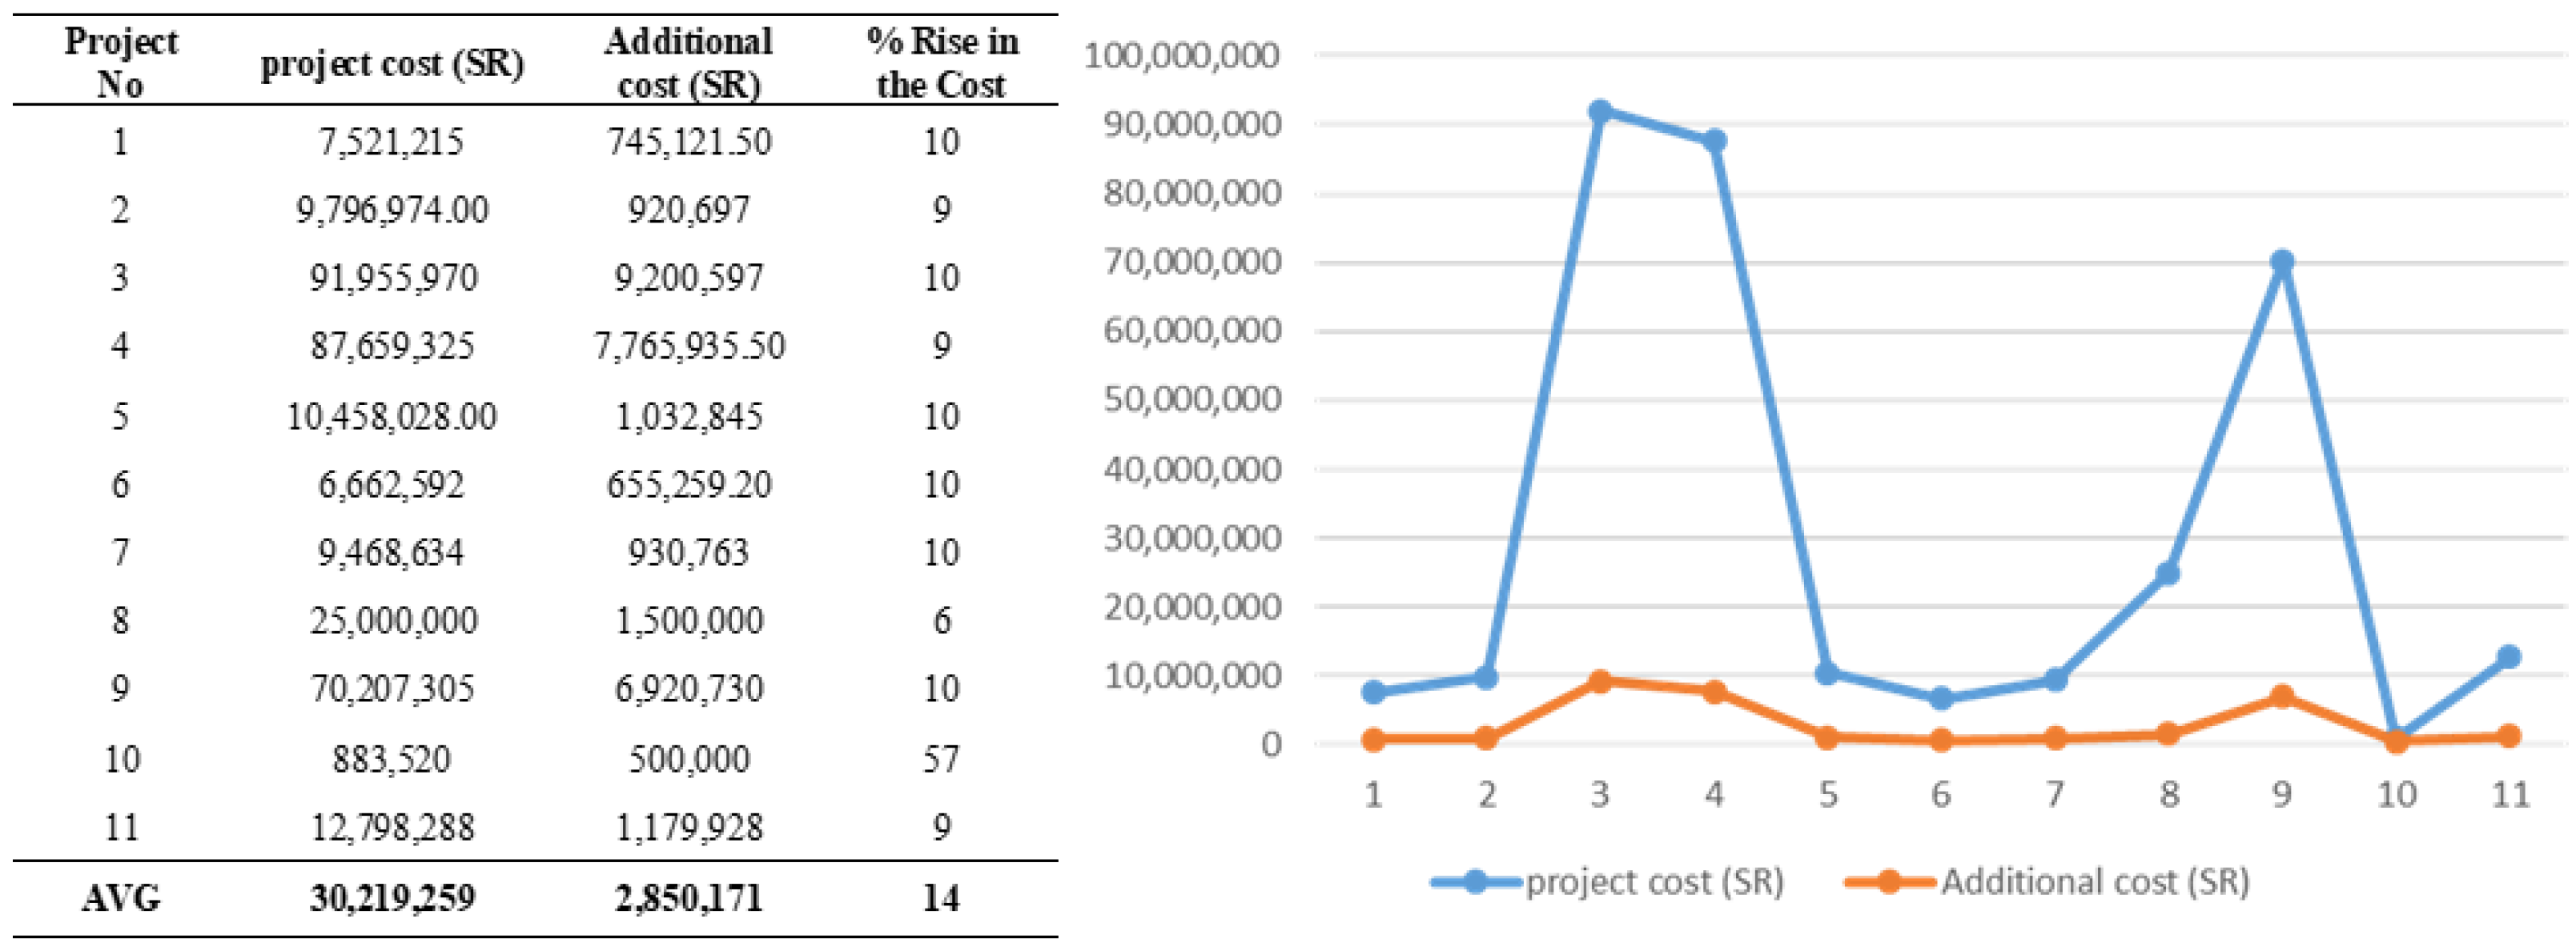
The average cost overrun for the 11 MOMRA projects is 14%, which is within the range found for MOH and MOE. However, the maximum cost overrun of 57% which occurred in Project #10 (Heritage Village), was due to two delay factors only: ‘variations and errors in design’ and ‘delay in progress payment’. Proportionately, the lowest cost overrun was for Project #8, for which saw only a 6% increase (Figure 8).
Unlike MOH and MOE, the pattern of increments in additional time and additional costs seemed irregular (Figure 9). This could be linked to the many varieties of projects executed under this Ministry (Table 4). Additionally, some projects experienced significant delays, but the associated cost overruns were low.
4.5. Combined Analysis from All Projects in Three Minsitries
When data from all 37 projects across three ministries (MOH, MOE, and MOMRA) are merged, the analysis showed a combined total of eight client-related delay factors with ‘change order and delay in approving it’ being outrightly the most frequent cause of delay occurring in 30 out of 37 projects, representing 81% of total occurrences (Table 8). The second place for the most frequent cause of delay is shared among three factors, each of which occurred in 20 projects (54%), and one of these factors is most directly associated with optimism bias, i.e., ‘ineffective planning and scheduling of project’. The least common delay factor ‘finance to complete the work by the client’ occurred only once. These results provide a unique understanding of the most important client-related causes of delay. Additionally, the frequency-derived rankings provide an objective insight into the likelihood of occurrence for each client-related delay factor.
It has been implied in the literature that there would be interdependencies, synergy, or ’domino effect’ between these delay factors when, for example, inadequate planning/scheduling by the consultants or contractor leads to poor communication among stakeholders and results in delays in progress payments. The same could be said for some variations and errors in design. Further statistical analysis carried out (as presented by correlation matrix in subsequent section) provides further insights into these synergies and the weight of each delay factor relative to others.
The schedule performance index (SPI), which deals with delays, and the cost performance index (CPI), which deals with cost overruns for the combined projects, were computed for all projects. For both SPI (Table 9) and CPI (Table 10), the ideal values should not approach 1.0, meaning that the SPI/CPI value of 0.2 is preferrable to the SPI/CPI value of 0.8. For all projects, the average SPI showed negative scheduling performance, with SPI values of 0.71 (MOH), 0.8 (MOE), and 0.82 (MOMRA). The best SPI values were found to be 0.57 (MOH), 0.59 (MOE), and 0.69 (MOMRA), which themselves are on the high side. Similarly, the average CPI of all projects was also negative, with values of 0.8, 0.92, and 0.89 for MOH, MOE, and MOMRA, respectively. The best CPI for MOH was 0.6, while for MOE and MOMRA, their best CPIs were 0.84 and 0.64, respectively, again revealing the relatively poor CPIs for all projects.
The combination of escalated/additional project duration and the high SPI values across all projects is an indication that scheduling and planning have been ineffective, reflecting a tendency to underestimate the duration of projects (optimism bias) across all ministries.
4.6. Statistical Analysis for Combined Projects (MOE, MOH, and MOMRA)
Further statistical analysis was carried out to investigate the relationships that project variables such as project cost, contract period, and additional time and cost have with client-related causes of delay. The statistical questions of interest include: do the different projects characteristics have a significant relationship with the project delay causes? how strong is the association between the client-related causes of construction project delays and (a) the size of a construction project and (b) the contract period? The results are provided below.
To assess the relationship that project variables (project cost, contract period, as well as additional time and additional cost) have among themselves and with client-related causes of delay, a correlation analysis was carried out using the point bi-serial technique of association (Table 11). Four project characteristics (project cost, contract period, additional time, and additional cost) were of interest in terms of how they correlate with each other. Based on the point-biserial correlation coefficient (rpb, where p > 0.05) analysis carried out, it was found that project cost correlated very strongly with additional time (rpb = 0.662) and additional cost (rpb = 0.805), indicating that as a project becomes costly, the likelihood of additional time and additional cost being required is high. Project cost correlated moderately with contract period (rpb = 0.481), meaning that the cost of a project is only moderately linked to its contract period. As expected, additional time correlated strongly with additional cost (rpb = 0.632). These findings as summarized in Table 11, and while the associations are not surprising, the strengths/magnitude of the correlations present interesting insights since the 37 projects are of different sizes and types.
Concerning how the project characteristics correlate with client-related causes of delay, the results revealed some insights. The first project characteristic (project cost) was found to have a significant positive correlation with two client-related causes of delay: (i) ‘variations and error in design’ (rpb = 0.420) and (ii) ‘delay in progress of payment’ (rpb = 0.464). The strength/magnitude of the relationship between the initial project cost and these two causes of delay is moderate. Therefore, it can be deduced that both causes of delay (variations and error in design, and delay in progress of payment) would moderately contribute to a delay in projects with higher initial project costs. The study did not establish any other significant relationship causes (p > 0.05) between the initial project cost and the rest of the client-related causes of delay.
The second project characteristic (contract period) did not have any significant correlation with client-related causes of delay, except ‘lack of finance by client’ had a weak positive correlation (rpb = 0.212). The third project characteristic (additional time) had a statistically significant positive relationship with two client-related delay causes: ‘variations and error in design’ (rpb = 0.396) and ‘lack of finance to complete the work’ (rpb = 0.490). The strength/magnitude of the relationship between additional time and these two causes of delay was a moderate relationship. These results suggest that variations/error in design as well as insufficient funds to complete a project by the client are significant causes of delay that have a moderate likelihood of leading to additional time in construction projects. It can also be concluded that construction projects with higher additional time tend to be delayed due to variations/error in design as well as a lack of adequate finance by the client to finish the work. The study did not establish any other significant relationship (p > 0.05) between additional time and the rest of the project delay causes.
The fourth project characteristic (additional cost) had a statistically significant moderate positive relationship with ‘only one client-related cause of delay: ‘delay in project payment’ (rpb = 0.558). In other words, when there is a delay in making payment on a project, there is a moderate likelihood that it will result in an additional cost to the project. Other causes of delay did not have a significant relationship (p > 0.05) with additional cost in construction projects.
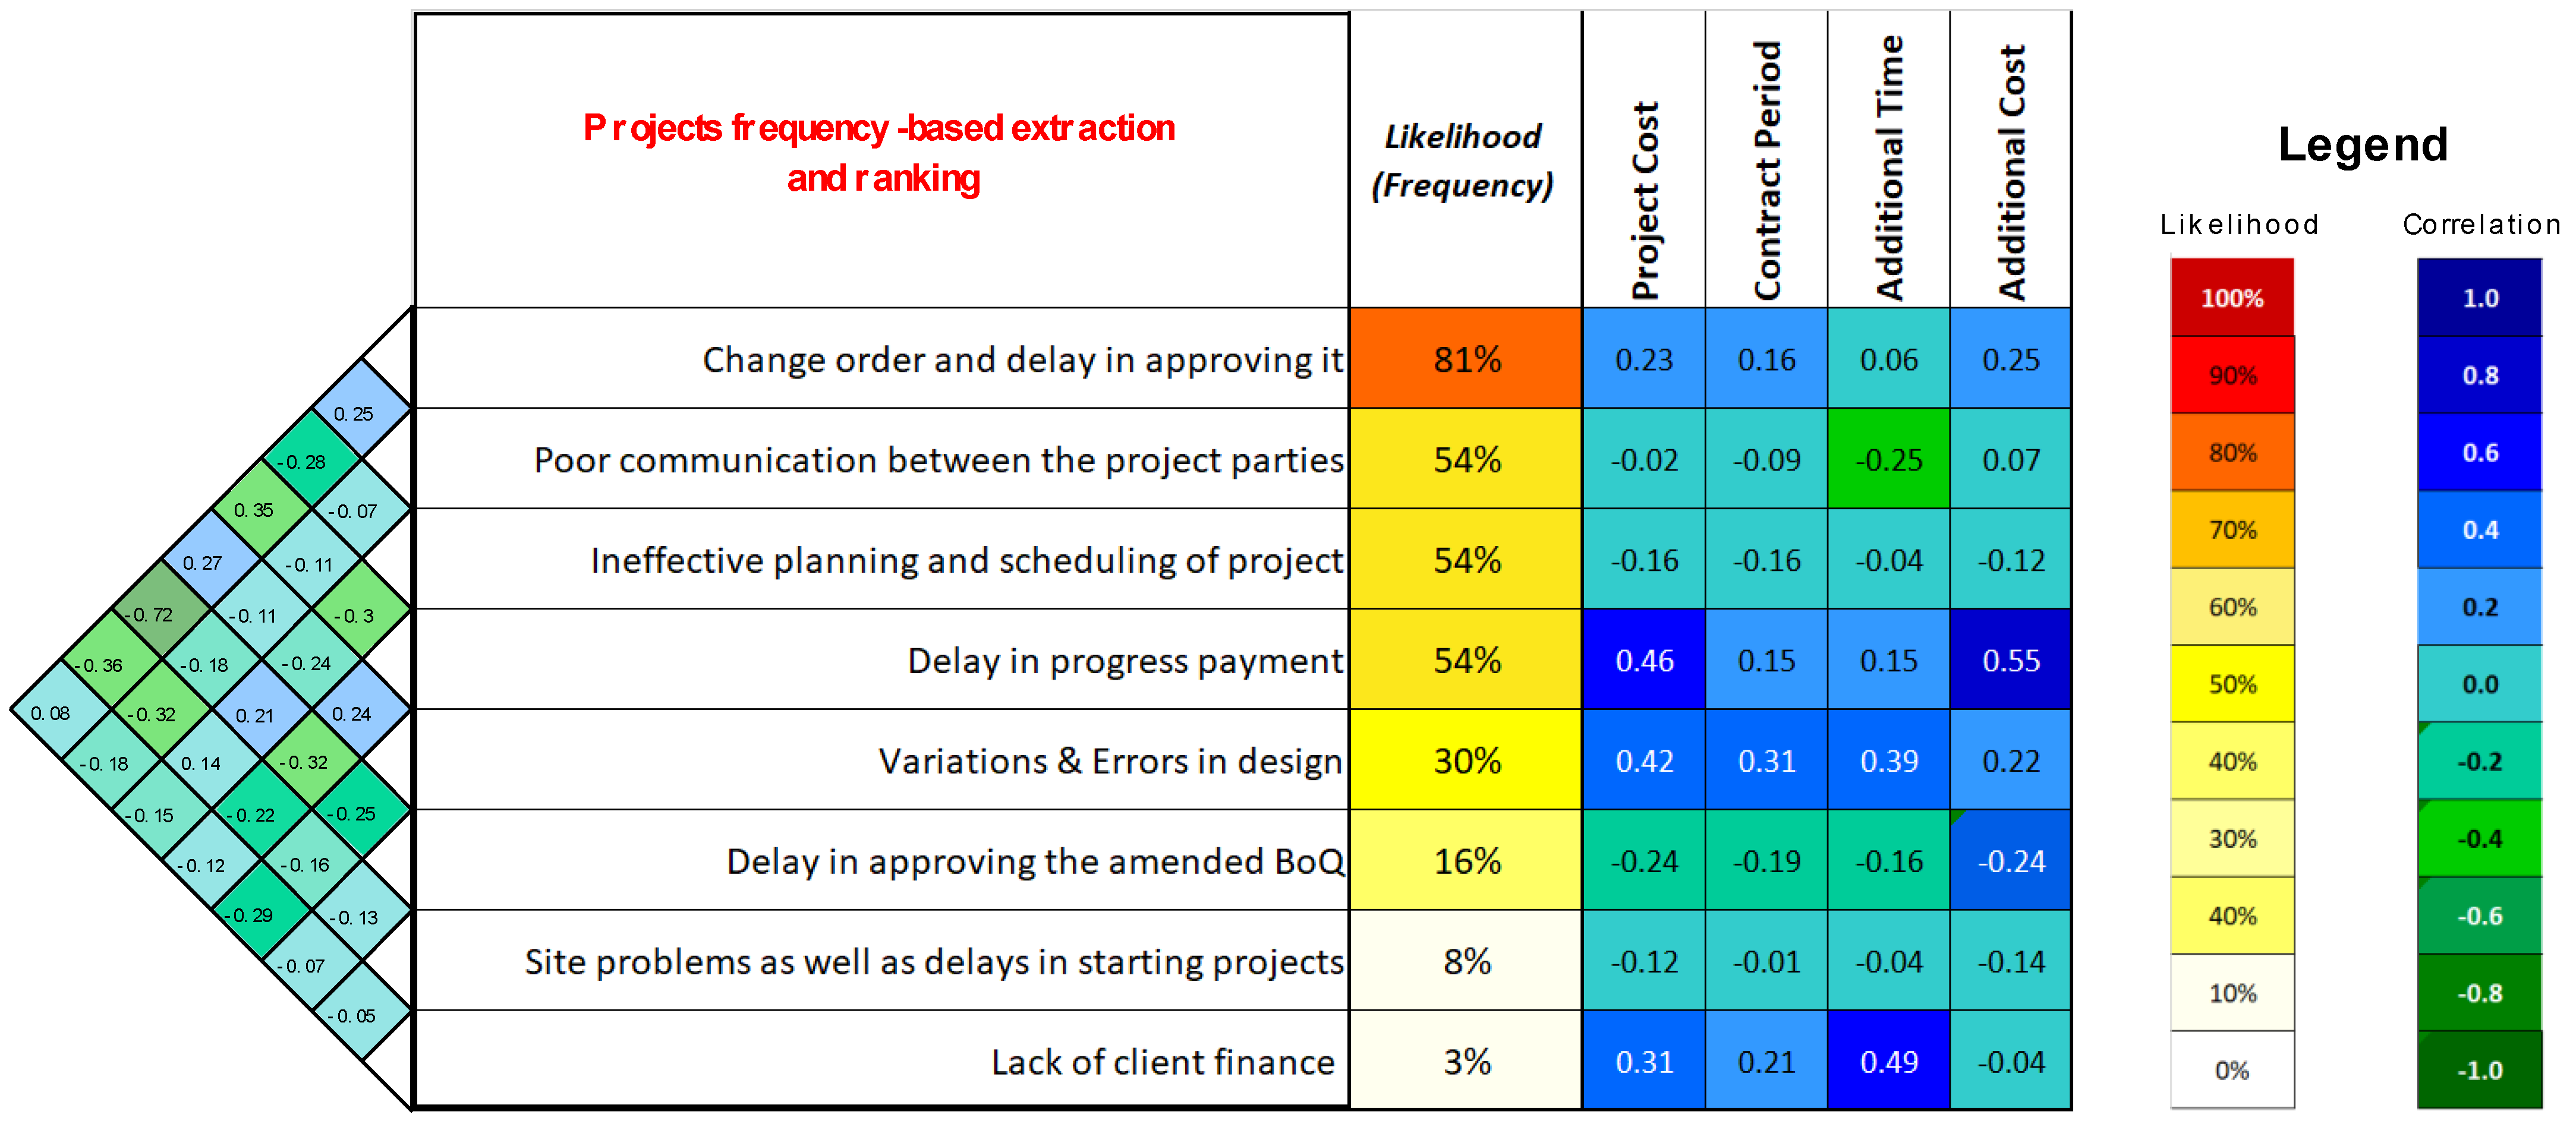
To better appreciate the consequences of these correlations, the ranking of the client-related causes of delay, which was based on the frequency of their occurrence (Table 8), was designated as ‘likelihood’ such that each cause of delay was presented in a red-yellow scale heatmap (Figure 10). Subsequently, another heatmap on a blue-green scale was used to depict the correlations between each of the four project characteristics and the causes of delay, as well as the strength of the correlation between the delay factors themselves (Figure 10). This combined heatmap matrix is insightful because it shows that for each client-related cause of delay, there is a likelihood of occurrence and a consequence (correlation) with project characteristics.
5. Discussion
Delays are common in construction projects, with many not being completed on the specified contractual date [1]. With 70% of public sector construction projects suffering delays [1], the issue has for long been of significant interest in KSA, which, according to an extensive three-decade review, ranked the country as 5th in the top 10 countries in terms of research outputs for construction delay, with a premier institution (KFUPM) being the global number 1 for outputs in this area [15]. For the KSA government, construction delays can affect the ability to deliver the Saudi Vision 2030. As found in the literature, the consequences of such delays are many, including higher capital expenditure, financial losses for the investment, and a delay in handover/utilization by end users [25,26,27]. It is in the KSA government’s interest (as client) that it endeavors to reduce/eliminate delays, especially the ones for which it is responsible (client-related), e.g., regulatory obstacles that account for 12.2% of construction project delays in KSA [50]. Therefore, in this study eight commonly recognized client-related delay factors were explored using historical data. These delays were ranked in order of frequency to reveal their likelihood of occurrence in different project types based on the archival analysis of past projects from three ministries (MOH, MOE, and MOMRA) where, across 37 construction projects, the most common (#1) delay factor was ‘Change order and delay in approving it’. This was followed by ‘poor communication between the project parties’ (#2); ‘ineffective planning and scheduling of project’ (#3); ‘delay in progress payment’ (#4); and ‘delay in the decision-making process’ (#5). Each of these causes of delay will have different kinds of associated impacts on key project characteristics. Furthermore, the synergy or correlation between these delay factors was re-affirmed by a previous study [62] that Change order could occur as a result of insufficient planning and scheduling in the early stages.
For the 37 case study projects, a significant positive correlation that was established between project cost and two causes of delay, including variations and error in design, which has been identified previously as being critical [31,32], and delay in progress payment [1,51], indicating a general level of agreement between the study and literature. A statistically significant positive relationship was also found between additional time and variations and error in design. This kind of association has not been previously explored in the literature. In quantifying the magnitude of delays, using duration variance, the schedule performance index (SPI) metric showed an average 43% increase in duration for the MOH hospital projects, with an SPI value of 0.71. The SPI value for the MOE and MOMRA projects was found to be 0.80 and 0.82, with an average increase in project duration being 27% and 23%, respectively. There were no precedence studies in literature to compare these values with, but they provide a reasonable insight into the magnitude of delays. These delays have a cost consequence, as suggested by the cost performance index (CPI), calculated as 0.84 (MOH), 0.92 (MOE) and 0.89 (MOMRA).
The hospital projects under MOH were responsible for the highest number of the top-ranked delay factor, i.e., the change order and the delay in approving it. These projects also had the highest average additional time (40%) and the highest average additional cost (20%). This makes MOH projects much riskier in terms of timely delivery and cost overruns that could be attributed to the late (and plentiful) design changes, which a previous study [43] has attributed to fast evolving and better healthcare technologies becoming available towards the end of such projects. From MOMRA data, a unique delay factor, i.e., ‘site problems as well as delays in starting projects’ appeared in three infrastructure projects: asphalting, sidewalks, and lighting for Taif and villages, in Al Taif; asphalting, pavements, and lighting municipalities, in Najran; and construction of a bridge in Wadi Adlam, in the Adlam area. This agrees with a study [4] that showed ‘late site handover’ and ‘delays in approval/permits’ as delay factors that result in financial compensation for contractors, usually after a claims process that itself leads to delays [3].
There are no peculiar delay causes associated with specific project types, but in terms of impact we produced a likelihood-magnitude matrix that showed: “change order and delay in approving it” (81% frequency); ‘delay in progress payment (54% frequency)’; ‘ variations and errors in design’ (30% frequency); and ‘lack of finance by client’ (3% frequency) as the key delay factors that have a statistically significant positive correlation with project characteristics. The only statistically significant negative correlation was found between ‘poor communication between the project parties’ and ‘additional time’ (rpb= −0.24).
Previous studies have shown the interdependence of delay factors, but such interdependence has not been well understood or managed, leading to efforts to automate and predict the inter-relationships using ML [34]. The findings from this study not only support the existence of such interdependencies, but the strength of associations was also estimated using a correlation matrix (Table 11). Additionally, based on the frequency of each client-related delay factor, a matrix was produced that achieves three purposes. First, it uses a red-yellow heatmap to illustrate the frequency (likelihood) of occurrence of all the eight delay factors. Second, the matrix shows the strength of correlation amongst the eight delay factors of concern. Third, the delay factors were correlated in terms of magnitude of impact on the four key project characteristics (Figure 10).
The presence of optimism bias [35,37] was best exemplified by two MOH hospitals (Project #6 and Project #7), which were very similar in terms of capacity, location, and start time and were also affected by similar kinds of delay factors. There were vast differences in the contract duration and initial costs, and most importantly in the additional time required for each. Without any evidence that either of these projects was more sophisticated or needed more expensive last-minute changes in scope/requirements (e.g., due to emerging healthcare technologies [43]), it could be argued that Project #6 could have been over-budgeted and under-scheduled, relative to Project #6.
6. Conclusions
Given the costly and widespread cases of construction project delays in KSA, the aim of this study was to explore client-related construction project delay factors in terms of their singular and synergistic impacts. The motivation and expected benefit is to help the government (as public sector client) to achieve its Vision 2030 goals. Using archival data from 37 public sector construction projects drawn from three government ministries, i.e., the Ministry of Health (MOH), the Ministry of Education (MOE), and the Ministry of Municipal and Rural Affairs (MOMRA) and completed within a 10-year window (2007–2017), eight client-related delay factors were commonly identified among the case study projects drawn from three different ministries. Four project characteristics (project cost, project duration, additional cost, and additional time) were used as benchmark for assessing the magnitude of each delay factor.
The archival analysis revealed that the most critical client-related delay factor occurring in almost every project with 81% frequency is ‘change order’. The next most common causes of delay that occurred in 20 out of 37 projects (54%) are ineffective planning and scheduling of a project; poor communication between the project parties; and delay in progress payment. Optimism bias was found to be prevalent in projects that suffered from ‘ineffective planning and scheduling of project’. Other causes include variations and errors in design (30%); delay in approving the amended bill of quantities (16%); site problems as well as delays in starting projects (8%); and lack of finance by a client to complete the work (3%). These frequency-derived rankings provide an objective insight into the likelihood of occurrence for each client-related delay factor. These four factors, namely, ‘change order and delay in approving it’; ‘delay in progress payment; ‘ variations and errors in design’; and ‘lack of finance by client’, were shown to have a statistically significant positive correlation with the four essential project characteristics.
These delay factors do not always act in isolation because there is synergy and knock-on effect amongst them. For instance, studies and results show that inadequate planning or scheduling is linked to issuing of change orders and can translate into payment for executed items of work made by the client. Additionally, poor communication aggravates the insufficiency of planning and scheduling, while change orders can also lead to payments by the clients being delayed. It was found that insufficient planning led to conflicts in relationships, resulting in time overruns. Such delays would then manifest in the form of financial problems for the contractor and cost overruns for the client. The calculated schedule performance index (SPI) and cost performance index (CPI) computed for all projects showed very poor time and cost performance overall, with average SPI values of 0.71 (MOH), 0.8 (MOE), and 0.82 (MOMRA) and average CPI values of 0.8, 0.92, and 0.89 for the same ministries.
In conclusion, the KSA government is embarking on an ambitious modernization via the ‘Saudi Vision 2030’ and ‘Future Cities Program’ with the aim of making the country one of the most developed by 2030 (in less than 10 years). For this ambition to be achieved, many crucial and capital-intensive buildings/infrastructures have to be put in place as quickly as possible. Delaying such projects could derail the Vision 2030 target because in spite of the government reliance on international joint ventures (IJVs) to achieve this vision, the client-related delays investigated here are not solvable simply by bringing in foreign expertise. As a result of this study’s findings and with the backing of an extensive literature review, the following recommendations are made:
- The government should prioritize the management of delay factors based on the prioritization (likelihood of occurrence) drawn from their rankings carried out in this study. Where socio-cultural or socio-economic realities differ from those of KSA, the approach used in this study can be replicated to achieve a context-based ranking to aid decision-making.
- With the correlational impact of delay factors having been measured statistically, public sector clients now have a better understanding of how each delay factor affects the essential project characteristics linked to cost and time.
- The top five delay factors found in 37 projects of this study with frequency of occurrence ranging from 30 to 81% can be addressed wholly or partially (as suggested by literature) by adopting BIM processes, which would enhance collaboration, transparency, improve design quality, and improve communication among stakeholders. While this study was not aimed at BIM, the evidence of its potential can be observed in how it can help address these top five delay factors.
- The KSA government should use the IJV partnerships created for the actualization of Vision 2030 (such as those for NEOM city) as an opportunity to establish benchmarks for timely construction project delivery for adoption across the whole industry and as a future reference.
- Further research should be supported for investigating those delay factors caused by contractors and consultants to obtain a more holistic picture. Research based on historical/archival quantitative data is encouraged as a lot of previous studies have relied on primary (experiential and opinion based) data, with little impact in terms of losses attributed to delays. In this regard, the KSA government should encourage the unhindered and uncensored access to archival data for the benefit of researchers.
- The heatmap matrix of delay factors that measures the likelihood of occurrence for each delay factor and maps it to project variables can be further developed into a ‘delay risk impact tool’.
- A longitudinal study that tracks completed construction projects and their delays would be helpful so that the eight client-related delay factors can be monitored in terms of their reduction frequency and impact. This can be achieved by supporting researchers with immediate access to completed projects’ data.
Author Contributions
Conceptualization, E.A. and Z.A.; methodology and data collection, E.A. and A.A.-O.; data analysis, E.A. and Z.A.; writing—original draft preparation, Z.A. and A.A.-O.; writing—review and editing, E.A., Z.A. and A.A.-O.; editing and correcting based on reviewers’ feedback, Z.A. and A.A.-O. All authors have read and agreed to the published version of the manuscript.
Funding
This research received no external funding.
Institutional Review Board Statement
Not applicable.
Informed Consent Statement
Not applicable.
Data Availability Statement
Research data was archival, held by various Saudi Ministries who granted access to their archives. The data is not available for public use, except as presented here.
Acknowledgments
The authors would like to thank the Ministry of Education (Saudi Arabia) and London South Bank University for supporting this research.
Conflicts of Interest
The authors declare no conflict of interest.
References
- Assaf, S.; Al-Hejji, S. Causes of delay in large construction projects. Int. J. Constr. Proj. Manag. 2006, 24, 349–357. [Google Scholar] [CrossRef]
- Callahan, M.T.; Bramble, B.B. Discovery in Construction Litigation, 1st ed.; Lexis Nexis Matthew Bender & Co.: Charlottesville, VA, USA, 2003. [Google Scholar]
- Do, S.T.; Nguyen, V.T.; Tran, C.N.; Aung, Z.M. Identifying and evaluating the key claim causes leading to construction delays. Int. J. Constr. Manag. 2022, 1–13. [Google Scholar] [CrossRef]
- Ahuja, A.K.; Gaurav, A. Factors Affecting Delays in Infrastructure Construction Projects. In Recent Advancements in Civil Engineering; Springer: Singapore, 2022; pp. 97–110. [Google Scholar]
- Dawood, N.; Vukovic, V. Energy efficiency in residential buildings in the Kingdom of Saudi Arabia. In Building Information Modelling, Building Performance, Design and Smart Construction; Springer: Cham, Switzerland, 2017; pp. 129–143. [Google Scholar]
- Balabel, A.; Alwetaishi, M. Towards Sustainable Residential Buildings in Saudi Arabia according to the Conceptual Framework of “Mostadam” Rating System and Vision 2030. Sustainability 2021, 13, 793. [Google Scholar] [CrossRef]
- UN High-Level Political Forum 2018. Kingdom of Saudi Arabia Vision 2030, towards Saudi Arabia’s Sustainable Tomorrow—First Voluntary National Review 2018(1439). Presented at the UN High-Level Political Forum 2018 (Transformation towards sustainable and resilient societies), New York, NY, USA, 9–18 July 2018. [Google Scholar]
- Madakam, S.; Bhawsar, P. NEOM smart city: The city of future (the urban Oasis in Saudi desert). In Handbook of Smart Cities; Springer: Berlin/Heidelberg, Germany, 2020; pp. 1–23. [Google Scholar]
- Sodangi, M. Towards attaining efficient joint ventures in international construction: The case of Saudi Arabia. Eng. Constr. Archit. Manag. 2022. [Google Scholar] [CrossRef]
- Deloitte. Deloitte GCC Powers of Construction, 2014 Construction Sector Overview; Deloitte: London, UK, 2014. [Google Scholar]
- Deloitte. Construction 2017: A Positive Market Outlook? Construction Market Outlook; Springer: Berlin/Heidelberg, Germany, 2017. [Google Scholar]
- AlKharashi, A.; Skitmore, M. Causes of delays in Saudi Arabian public sector construction projects. Constr. Manag. Econ. 2009, 27, 3–23. [Google Scholar] [CrossRef] [Green Version]
- Emam, H.; Farrell, P.; Abdelaal, M. Causes of delay in GCC construction projects: A Critical Review. In Proceedings of the 1st International Conference on Smart, Sustainable and Healthy Cities, Abu Dhabi, United Arab Emirates, 14–16 December 2014. [Google Scholar]
- Viles, E.; Rudeli, N.C.; Santilli, A. Causes of delay in construction projects: A quantitative analysis. Eng. Constr. Archit. Manag. 2018, 27, 917–935. [Google Scholar] [CrossRef]
- Durdyev, S.; Hosseini, M.R. Causes of delays on construction projects: A comprehensive list. Int. J. Manag. Proj. Bus. 2020, 13, 20–46. [Google Scholar] [CrossRef]
- Çevikbaş, M.; Işık, Z. An overarching review on delay analyses in construction projects. Buildings 2021, 11, 109. [Google Scholar] [CrossRef]
- Bajjou, M.S.; Chafi, A. Empirical study of schedule delay in Moroccan construction projects. Int. J. Constr. Manag. 2020, 20, 783–800. [Google Scholar] [CrossRef]
- Rashid, Y. Analysis of delay factors and their effects on construction projects. Manag. Sci. Lett. 2020, 10, 1197–1204. [Google Scholar] [CrossRef]
- Amri, T.; Marey-Pérez, M. Towards a sustainable construction industry: Delays and cost overrun causes in construction projects of Oman. J. Proj. Manag. 2020, 5, 87–102. [Google Scholar] [CrossRef]
- Albogamy, A.; Scott, D.; Dawood, N. Addressing construction delays in the Kingdom of Saudi Arabia. Int. Proc. Econ. Dev. Res. 2012, 45, 148–153. [Google Scholar]
- Aziz, R.F.; Abdel-Hakam, A.A. Exploring delay causes of road construction projects in Egypt, Alex. Eng. J. 2016, 55, 1515–1539. [Google Scholar]
- Reddy, M.V.; Rao, H. Analysing the critical delay factors and delay in material supply for construction projects in India. Mater. Proc. 2022, 60, 1890–1897. [Google Scholar]
- Mittal, Y.K.; Paul, V.K.; Rostami, A.; Riley, M.; Sawhney, A. Delay factors in construction of healthcare infrastructure projects: A comparison amongst developing countries. Asian J. Civ. Eng. 2020, 21, 649–661. [Google Scholar] [CrossRef]
- Van, L.T.; Nguyen, M.S.; Nguyen, T.V. A conceptual model of delay factors affecting government construction projects. J. Eng. Appl. Sci. Technol. 2015, 5, 92–100. [Google Scholar]
- Shah, R.K. An Exploration of Causes for Delay and Cost Overruns in Construction Projects: Case Study of Australia, Malaysia & Ghana. J. Adv. Coll. Eng. Manag. 2016, 2, 41–45. [Google Scholar]
- Hussain, S.; Zhu, F.; Ali, Z.; Aslam, H.D.; Hussain, A. Critical delaying factors: Public sector building projects in Gilgit-Baltistan, Pakistan. Buildings 2018, 8, 6. [Google Scholar] [CrossRef] [Green Version]
- Alinaitwe, H.; Ruth, A.; Dan, T. Investigation into the causes of delays and cost overruns in Uganda’s public sector construction projects. J. Constr. Dev. Ctries 2013, 18, 33. [Google Scholar]
- Eastman, C.M.; Eastman, C.; Teicholz, P.; Sacks, R.; Liston, K. BIM Handbook: A Guide to Building Information Modeling for Owners, Managers, Designers, Engineers, Contractors, and Facility Managers; John Wiley & Sons: New York, NY, USA, 2011. [Google Scholar]
- Lu, Q.; Won, J.; Cheng, J.C. A financial decision-making framework for construction projects based on 5D Building Information Modeling (BIM). Int. J. Constr. Proj. Manag. 2016, 34, 3–21. [Google Scholar] [CrossRef]
- Du, J.; Zou, Z.; Shi, Y.; Zhao, D. Zero latency: Real-time synchronization of BIM data in virtual reality for collaborative decision-making. Autom. Constr. 2018, 85, 51–64. [Google Scholar] [CrossRef]
- Azhar, S.; Nadeem, A.; Mok, J.Y.; Leung, B.H. Building Information Modeling (BIM): A new paradigm for visual interactive modeling and simulation for construction projects. In Proceedings of the First International Conference on Construction in Developing Countries, Karachi, Pakistan, 4–5 August 2008; pp. 435–446. [Google Scholar]
- Ashworth, A. Cost Studies of Buildings; Prentice Hall: Harlow, UK, 2010. [Google Scholar]
- Egwim, C.N.; Alaka, H.; Toriola-Coker, L.O.; Balogun, H.; Sunmola, F. Applied artificial intelligence for predicting construction projects delay. Mach. Learn. Appl. 2021, 6, 100166. [Google Scholar] [CrossRef]
- Gondia, A.; Siam, A.; El-Dakhakhni, W.; Nassar, A.H. Machine learning algorithms for construction projects delay risk prediction. J. Constr. Eng. Manag. 2020, 146, 04019085. [Google Scholar] [CrossRef]
- Sharot, T. The optimism bias. Curr. Biol. 2011, 21, R941–R945. [Google Scholar] [CrossRef] [PubMed] [Green Version]
- Macdonald, M. Review of Large Public Procurement in the UK. HM Treas. 2002, 44, 1–83. [Google Scholar]
- Love, P.E.; Ika, L.A. Making Sense of Hospital Project (Mis) Performance: Over Budget, Late, Time and Time Again—Why? And What Can Be Done about It? Engineering 2021. [Google Scholar] [CrossRef]
- Kahneman, D. Attention and Effort; Prentice-Hall: Englewood Cliffs, NJ, USA, 1973. [Google Scholar]
- Kahneman, D.; Lovallo, D. Timid choices and bold forecasts A cognitive perspective on risk taking. Manag. Sci. 1993, 39, 17–31. [Google Scholar] [CrossRef]
- Kahneman, D. A perspective on judgment and choice: Mapping bounded rationality. Am. Psychol. 2003, 58, 697–720. [Google Scholar] [CrossRef] [Green Version]
- Flyvbjerg, B. Policy and Planning for Large Infrastructure Projects: Problems, Causes, Cures; World Bank Policy Research Working, Paper 3781; World Bank: Washington, DC, USA, 2005. [Google Scholar]
- Prater, J.; Kirytopoulos, K.; Ma, T. Optimism bias within the project management context: A systematic quantitative literature review. Int. J. Manag. Proj. Bus. 2017, 10, 370–385. [Google Scholar] [CrossRef]
- Lavikka, R.H.; Kyrö, R.; Peltokorpi, A.; Särkilahti, A. Revealing change dynamics in hospital construction projects. Eng. Constr. Archit. Manag. 2019, 26, 1946–1961. [Google Scholar] [CrossRef] [Green Version]
- Foreman-Peck, J.S. Public Private Partnerships in Britain: Interpreting Recent Experience; Cardiff Economics Working Papers No. E2021/12; Cardiff University: Cardiff, UK, 2021. [Google Scholar]
- Ozorhon, B.; Ozcan-Deniz, G.; Kir, O.D. Challenges of Public Private Partnership (PPP) Healthcare Projects: Case Study in Developing Countries. In Proceedings of the 57th Annual Associated Schools of Construction International Conference, Virtual, 5–9 April 2021; Volume 2, pp. 136–145. [Google Scholar]
- Adamou, M.; Kyriakidou, N.; Connolly, J. Evolution of public-private partnership: The UK perspective through a case study approach. Int. J. Organ. Anal. 2021, 29, 1455–1466. [Google Scholar] [CrossRef]
- Ling FY, Y.; Li, Q. Managing the Development & Construction of Public Hospital Projects. IOP Conf. Ser. Mater. Sci. Eng. 2019, 471, 022001. [Google Scholar]
- Soliman-Junior, J.; Tzortzopoulos, P.; Baldauf, J.P.; Pedo, B.; Kagioglou, M.; Formoso, C.T.; Humphreys, J. Automated compliance checking in healthcare building design. Autom. Constr. 2021, 129, 103822. [Google Scholar] [CrossRef]
- Mahamid, I. Relationship between delay and productivity in construction projects. Int. J. Adv. Appl. Sci. 2022, 9, 160–166. [Google Scholar] [CrossRef]
- Noman, A.; Bakhsh, A.; Alnajjar, N.; Attar, A. Causes of delays in public and private construction projects in Saudi Arabia. J. Constr. Manag. 2018, 54, 71–78. [Google Scholar]
- Al-Khalil, M.I.; Al-Ghafly, M.A. Delay in public utility projects in Saudi Arabia. Int. J. Proj. Manag. 1999, 17, 101–106. [Google Scholar] [CrossRef]
- Mahamid, I.; Aichouni, M. Risk Matrix for Delay Causes in Construction Projects in Saudi Arabia. Res. J. Appl. Sci. Eng. Technol. 2015, 9, 665–670. [Google Scholar] [CrossRef]
- Assaf, S.A.; Al-Khalil, M.; Al-Hazmi, M. Causes of Delay in Large Building Construction Projects. J. Manag. Eng. 1995, 11, 45–50. [Google Scholar] [CrossRef]
- Ramanathan, C.; Narayanan, S.P.; Idrus, A.B. Construction delays causing risks on time and cost—A critical review. Australas. J. Constr. Econ. Build. 2012, 12, 37–57. [Google Scholar] [CrossRef] [Green Version]
- Falqi, I.I. Delays in Project Completion: A Comparative Study of Construction Delay Factors in Saudi Arabia and the United Kingdom. Master’s Thesis, Heriot-Watt University, Edinburgh, UK, 2004. [Google Scholar]
- Albogamy, A.; Tsang, N.; Soetanto, R. Addressing crucial risk factors in the middle east construction industries: A comparative study of Saudi Arabia and Jordan. In Proceedings of the Sustainable Building Conference 2013, Coventry, UK, 3–5 July 2013; pp. 118–128. [Google Scholar]
- Jankowicz, A.D. Business Research Projects; Thomson Learning: London, UK, 1995. [Google Scholar]
- Gill, J.; Johnson, P. Research Methods for Managers, 3rd ed.; Sage Publications, Incorporated: London, UK, 2002. [Google Scholar]
- Calantone, R.; Vickery, S.K. Special topic forum on using archival and secondary data sources in supply chain management research. J. Supply Chain. Manag. 2009, 45, 68–70. [Google Scholar] [CrossRef]
- Bryman, A. Social Research Methods; Oxford University Press: Oxford, UK, 2008. [Google Scholar]
- Hakim, C. Research Design: Successful Designs for Social and Economic Research; Routledge: Abingdon-on-Thames, UK, 2000. [Google Scholar]
- Alenazi, E. Using BIM for Delay Management in Public Sector Construction Projects in KSA. Ph.D. Thesis, Loughborough University, Loughborough, UK, 2018. [Google Scholar]
- Project Management Institute. A Guide to the Project Management Body of Knowledge (PMBOK Guide); Project Management Institute: Newtown Square, PA, USA, 2017. [Google Scholar]
- IBM. IBM SPSS Advanced Statistics 28. 2022. Available online: https://www.ibm.com/docs/en/SSLVMB_28.0.0/pdf/IBM_SPSS_Advanced_Statistics.pdf (accessed on 10 February 2022).
Figure 1.
The increase in duration in the MOH projects.

Figure 2.
The increase in cost of the MOH Project.

Figure 3.
The relationship between the increase in duration and the increase in cost of the MOH Projects.
Figure 3.
The relationship between the increase in duration and the increase in cost of the MOH Projects.

Figure 4.
The increase in duration of the MOE projects.

Figure 5.
The increase in cost in the MOE projects.

Figure 6.
The relationship between an increase in duration and an increase in the cost in Saudi Riyals (SR) for MOE projects.
Figure 6.
The relationship between an increase in duration and an increase in the cost in Saudi Riyals (SR) for MOE projects.

Figure 7.
The increase in duration in the MOMRA projects.

Figure 8.
The increase in the cost in Saudi Riyals (SR) for MOMRA projects.

Figure 9.
The link between the increase in duration and the increase in cost (the MOMRA projects).

Figure 10.
The heatmap matrix for the frequency (likelihood) of delay factors and their correlation (magnitude of impact) with the project characteristics.
Figure 10.
The heatmap matrix for the frequency (likelihood) of delay factors and their correlation (magnitude of impact) with the project characteristics.


Table 1.
The top factors contributing to client-related construction delays in KSA.
| Client-Related Factors Contributing to Delay | Authors |
|---|---|
| Ineffective planning and scheduling of the project | [1,12,51,53,54,55,56] |
| Poor qualification, skills, and experience of the contractor’s staff | [1,12,51,53,54,55,56] |
| Delay in progress payment by the client | [1,12,51,55,56] |
| Changes during construction by the client | [1,12,51,56] |
| Regulatory obstactles | [1,20,50] |
| Slowness in decision-making by the client | [1,12,55] |
| Poor communication and coordination between construction parties | [1,12,49,51,55] |
| Assigning contracts to the lowest bidder without regards to qualification | [1,12,20,49,51,56] |
Table 2.
Historical project data from the Ministry of Health (MOH) [62].
Table 2.
Historical project data from the Ministry of Health (MOH) [62].
| S/N | Project Name | Region | Clinical Capacity (Beds) | Project Cost (SR) | Start Date | Contract Period (Months) | Finish Date | Additional Time (Months) | Additional Cost (SR) | Client- Related Causes of Delay ** |
|---|---|---|---|---|---|---|---|---|---|---|
| 1 | Project#1 | East Region | 100 | 134,128,792 | 4 February 2012 | 36 | 1 January 2015 | 11 | 39,259,323.15 | 1, 2, 3 |
| 2 | Project#2 | Makkah | 100 | 225,410,765 | 15 June 2012 | 24 | 25 May 2014 | 16 | 70,307,463.45 | 2, |
| 3 | Project#3 | Hail | 200 | 392,000,000 | 9 June 2012 | 36 | 1 May 2015 | 25 | 9,485,951.00 | 1, 3, 4 |
| 4 | Project#4 | Tabuk | 200 | 390,000,000 | 18 June 2012 | 36 | 16 May 2015 | 17 | 69,264,402.54 | 1, 2, 3 |
| 5 | Project#5 | Medina | 300 | 416,292,960 | 17 June 2012 | 24 | 26 May 2014 | 13 | 82,030,685.40 | 1, 2, 3, 6 |
| 6 | Project#6 | Riyadh | 200 | 222,766,616 | 25 June 2012 | 36 | 23 May 2015 | 12 | 22,276,660.75 | 1, 3, 6, 7 |
| 7 | Project#7 | Riyadh | 200 | 157,280,793 | 22 June 2012 | 24 | 31 May 2014 | 18 | 105,367,247.44 | 2, 3, 6, 7 |
| 8 | Project 8 | Jeddah | 400 | 378,652,682 | 9 September 2012 | 36 | 7 August 2015 | 12 | 53,030,068.10 | 1, 2, 3, 7 |
| 9 | Al Takhassusi Hospital | Jazan | 500 | 719,028,164 | 10 September 2012 | 36 | 8 August 2015 | 14 | 119,068,840.37 | 2, 3, 6 |
| 10 | Rmah General Hospital | Riyadh | 50 | 35,000,000 | 12 August 2013 | 36 | 27 July 2016 | 6 | 5,203,993 | 3, 7 |
| 11 | GP Kabshan | Dwadmi | GP | 2,885,207 | 4 April 2015 | 24 | 15 April 2017 | 2 | 208,520 | 1, 3, 6 |
| 12 | Halaban Hospital | Riyadh | 50 | 28,500,000 | 27 July 2015 | 24 | 26 July 2017 | 2 | 2,757,000 | 3, 6 |
** 1 = Variations and errors in design; 2 = delay in progress payment; 3 = change order and delay in approving it; 4 = lack of finance to complete the work by client; 5 = soil condition issues; 6 = poor communication between the project parties; and 7 = ineffective planning and scheduling of project.
Table 3.
Historical project data from the Ministry of Education (MOE) [62].
Table 3.
Historical project data from the Ministry of Education (MOE) [62].
| S/N | Project Name | Region | Description (Classes/Pupils) | Project Cost (SR) | Start Date | Contract Period (Months) | Finish Date | Additional Time (Months) | Additional Cost (SR) | Client- Related Causes of Delay ** |
|---|---|---|---|---|---|---|---|---|---|---|
| 1 | Primary and Sec. School Almonasiah | Jeddah | 2 * (20/600) | 17,840,270 | 18 July 2009 | 24 | 26 June 2011 | 3 | 800,000 | 2, 3 |
| 2 | Secondary school (12) | Riyadh | 20/600 | 4,600,888 | 12 July 2007 | 20 | 21 February 2009 | 4 | 500,000 | 4, 5, 6 |
| 3 | Secondary school (8) | Al Medina | 20/600 | 4,244,442 | 23 November 2008 | 20 | 8 June 2009 | 3 | 450,000 | 1, 2, 3, 4 |
| 4 | Alshifa School | Dammam | 17/680 | 6,403,774 | 23 November 2008 | 20 | 5 July 2010 | 14 | 750,000 | 5, 6 |
| 5 | Schools combined Alagrabi | Riyadh | 3 * (17/680) | 21,996,614 | 30 July 2009 | 24 | 8 July 2011 | 6 | 1,201,900 | 2, 3, 4 |
| 6 | Secondary school in Twiaq | Riyadh | 22/860 | 6,662,592 | 14 September 2009 | 22 | 26 June 2011 | 2 | 250,000 | 4, 5, 6 |
| 7 | The Office of Edu. Supervision | Al-Qassim | Medium project | 6,320,604 | 15 February 2009 | 20 | 27 September 2010 | 6 | 1,205,000 | 3, 5 |
| 8 | Al gasser secondary school | Riyadh | 22/860 | 8,445,246.00 | 29 September 2009 | 22 | 10 July 2011 | 6 | 745,525.60 | 6 |
| 9 | Schools combined alkhadeer | Tabuk | 3 *(18/540) | 24,840,162 | 7 November 2009 | 24 | 16 October 2011 | 3 | 350,000 | 2, 3, 4 |
| 10 | King A Aziz combined boys school | Riyadh | Prim., Interm. and Sec. | 22,316,052 | 21 March 2008 | 24 | 21 March 2010 | 6 | 2,135,500.20 | 5, 6 |
| 11 | Khyber Schools combined | Khyber | Prim., Interm. and Sec. | 22,226,629 | 22 December 2013 | 24 | 12 December 2015 | 13 | 2,225,600 | 1, 3 |
| 12 | Alsahafah Schools combined | Riyadh | 3*(18/540) | 23,997,770 | 22 January 2010 | 24 | 10 December 2011 | 3 | 350,000 | 3, 6 |
| 13 | Al-Artawiah combinded school | Al-Majmaah | Interm. and Secondary | 13,838,347 | 25 October 2010 | 24 | 20 October 2012 | 7 | 1,225.834.7 | 3, 4 |
| 14 | Expand Faculty (Dentistry, Female) | Riyadh | Medium project | 64.947.000 | 21 January 2007 | 54 | 18 August 2014 | 15 | 54,947,000 | 3, 4 |
** 1 = Variations and errors in design; 2 = delay in progress payment; 3 = change order and delay in approving it; 4 = poor communication between the project parties; 5 = ineffective planning and scheduling of project; and 6 = delay in approving the amended bill of quantities. * = multiplication of building capacity.
Table 4.
Historical project data from the Ministry of Municipal and Rural Affairs (MOMRA) [62].
Table 4.
Historical project data from the Ministry of Municipal and Rural Affairs (MOMRA) [62].
| S/N | Project Name | Region | Project Cost (SR) | Start Date | Contract Period (Months) | Finish Date | Additional Time (Months) | Additional Cost (SR) | Client- Related Causes of Delay ** |
|---|---|---|---|---|---|---|---|---|---|
| 1 | Municipal anti-flood and storm water drainage | Riyadh | 7.521.215 | 18 July 2009 | 22 | 26 June 2011 | 3 | 745,121.50 | 2, 3 |
| 2 | Development of Pedestrian Passage (Second Stage). | Makkah | 9,796,974.00 | 6 March 2016 | 12 | 1 February 2017 | 5 | 920,697 | 2, 3, 4 |
| 3 | Asphalting, sidewalks and lighting for Taif and villages | Al Taif | 91,955,970 | 30 October 2015 | 24 | 25 October 2017 | 6 | 9,200,597 | 1, 2, 3, 4, 6 |
| 4 | Asphalting, pavements and lighting municipalities | Najran | 87,659,325 | 17 February 2015 | 36 | 15 February 2018 | 16 | 7,765,935.50 | 4, 5, 6 |
| 5 | Municipality of Najran | Najran | 10,458,028.00 | 31 May 2016 | 24 | 22 May 2018 | 4 | 1,032.845.8 | 2, 3, 4 |
| 6 | Municipality of Rass | Al-Qassim | 6,662,592 | 14 September 2009 | 22 | 26 June 2011 | 2 | 655,259.20 | 2, 3 |
| 7 | Al-Basra Park | Al-Qassim | 9,468,634 | 30 December 2015 | 24 | 28 December 2017 | 3 | 930,763 | 2, 4, 5 |
| 8 | Prince Sultan Cultural Center | Al-Qassim | 25,000,000 | 27 January 2015 | 24 | 20 January 2017 | 6 | 1,500,000 | 1, 2, 3 |
| 9 | Development project for Southern Al-Saif Corniche | Jeddah | 70,207,305 | 1 October 2015 | 16 | 1 February 2017 | 5 | 6,920,730 | 2, 3, 4 |
| 10 | Development of the Heritage Village | Al Baha | 8,835,20 | 11 May 2014 | 12 | 21 May 2015 | 3 | 500,000 | 2, 4 |
| 11 | Building a bridge on Wadi Adlam | Adlam | 12,798,288 | 7 January 2015 | 16 | 10 June 2016 | 2 | 1,179,928 | 5, 6 |
** 1 = Variations and errors in design; 2 = delay in progress payment; 3 = change order and delay in approving it; 4 = poor communication between the project parties; 5 = ineffective planning and scheduling of project; and 6 = site problems, as well as delays in starting projects.
Table 5.
A ranking of client-related causes of delay in MOH projects [62].
Table 5.
A ranking of client-related causes of delay in MOH projects [62].
| Rank | Client-Related Causes of Delay in MOH Projects | Frequency |
|---|---|---|
| 1 | Change order and delays in approving it | 12 |
| 2 | Delayed progress payment | 7 |
| 3 | Variations and errors in design | 7 |
| 4 | Poor communication between the project parties | 6 |
| 5 | Planning and scheduling of project | 4 |
| 6 | Finance to complete the work by client | 1 |
Table 6.
A ranking of the client-related causes of delay in MOE Projects [62].
Table 6.
A ranking of the client-related causes of delay in MOE Projects [62].
| Rank | Client-Related Causes of Delay in MOE Projects | Frequency |
|---|---|---|
| 1 | Change order and delay in approving it | 9 |
| 2 | Poor communication between the project parties | 7 |
| 3 | Delay in approving the amended bill of quantities | 6 |
| 4 | Ineffective planning and scheduling of project | 5 |
| 5 | Delay in progress payment | 4 |
| 6 | Variations and errors in design | 2 |
Table 7.
A ranking of client-related causes of delay in MOMRA projects [62].
Table 7.
A ranking of client-related causes of delay in MOMRA projects [62].
| Rank | Client-Related Causes of Delay in MOMRA Projects | Frequency |
|---|---|---|
| 1 | Change order and delay in approving it; | 9 |
| 2 | Poor communication between the project parties | 7 |
| 3 | Ineffective planning and scheduling of project | 7 |
| 4 | Site problems, as well as delays in starting projects | 3 |
| 5 | Delay in progress payment | 2 |
Table 8.
The ranking of client-related causes of delay for 37 case study projects [62].
Table 8.
The ranking of client-related causes of delay for 37 case study projects [62].
| Rank | Client-Related Causes of Delay in All Projects | Frequency | Proportion |
|---|---|---|---|
| 1 | Change order and delay in approving it | 30 | 81% |
| 2 | Poor communication between the project parties | 20 | 54% |
| 3 | Ineffective planning and scheduling of project | 20 | 54% |
| 4 | Delay in progress payment | 20 | 54% |
| 5 | Variations and errors in design | 11 | 30% |
| 6 | Delay in approving the amended bill of quantities | 6 | 16% |
| 7 | Site problems as well as delays in starting projects | 3 | 8% |
| 8 | Finance to complete the work by the client | 1 | 3% |
Table 9.
A comparison of SPI for the MOH, MOE, and MOMRA projects [62].
Table 9.
A comparison of SPI for the MOH, MOE, and MOMRA projects [62].
| S/N | MOH | MOE | MOMRA | ||||||||||||
|---|---|---|---|---|---|---|---|---|---|---|---|---|---|---|---|
| Contract Period (Months) | Additional Time (Months) | Actual Duration | % Rise in Project Duration | SPI | Contract Period (Months) | Additional Time (Months) | Actual Duration | % Rise in Duration | SPI | Contract Period (Months) | Additional Time (Months) | Actual Duration | % Rise in Duration | SPI * | |
| 1 | 36 | 11 | 47 | 31 | 0.77 | 24 | 3 | 27 | 13 | 0.89 | 22 | 3 | 25 | 14 | 0.88 |
| 2 | 24 | 16 | 40 | 67 | 0.60 | 20 | 4 | 24 | 20 | 0.83 | 12 | 5 | 17 | 42 | 0.71 |
| 3 | 36 | 25 | 61 | 69 | 0.59 | 20 | 3 | 23 | 15 | 0.87 | 24 | 6 | 30 | 25 | 0.80 |
| 4 | 36 | 17 | 53 | 47 | 0.68 | 20 | 14 | 34 | 70 | 0.59 | 36 | 16 | 52 | 44 | 0.69 |
| 5 | 24 | 13 | 37 | 54 | 0.65 | 24 | 6 | 30 | 25 | 0.80 | 24 | 4 | 28 | 17 | 0.86 |
| 6 | 36 | 12 | 48 | 33 | 0.75 | 22 | 2 | 24 | 9 | 0.92 | 22 | 2 | 24 | 9 | 0.92 |
| 7 | 24 | 18 | 42 | 75 | 0.57 | 20 | 6 | 26 | 30 | 0.77 | 24 | 3 | 27 | 13 | 0.89 |
| 8 | 36 | 12 | 48 | 33 | 0.75 | 22 | 6 | 28 | 27 | 0.79 | 24 | 6 | 30 | 25 | 0.80 |
| 9 | 36 | 14 | 50 | 39 | 0.72 | 24 | 3 | 27 | 13 | 0.89 | 16 | 5 | 21 | 31 | 0.76 |
| 10 | 36 | 6 | 42 | 17 | 0.86 | 24 | 6 | 30 | 25 | 0.80 | 12 | 3 | 15 | 25 | 0.80 |
| 11 | 24 | 2 | 26 | 8 | 0.92 | 24 | 13 | 37 | 54 | 0.65 | 16 | 2 | 18 | 13 | 0.89 |
| Avg. | 32 | 13 | 45 | 43 | 0.71 | 22 | 6 | 28 | 27 | 0.80 | 21 | 5 | 26 | 23 | 0.82 |
* SPI: schedule performance index.
Table 10.
A comparison of CPI for the MOH, MOE, and MOMRA projects [62].
Table 10.
A comparison of CPI for the MOH, MOE, and MOMRA projects [62].
| MOH | MOE | MOMRA | |||||||||||||
|---|---|---|---|---|---|---|---|---|---|---|---|---|---|---|---|
| Project Cost (SR) | Additional Cost (SR) | Actual Cost of Project (SR) | % Rise in the Cost | CPI | Project Cost (SR) | Additional Cost (SR) | Actual Cost of Project (SR) | % Rise in Cost | CPI | Project Cost (SR) | Additional Cost (SR) | Actual Cost of Project (SR) | % Rise in the Cost | CPI * | |
| 1 | 134,128,792 | 39,259,323 | 173,388,115 | 29 | 0.77 | 17,840,270 | 800,000 | 18,640,270 | 4 | 0.96 | 7,521,215 | 745,121 | 8,266,337 | 10 | 0.91 |
| 2 | 225,410,765 | 70,307,463 | 295,718,228 | 31 | 0.76 | 4,600,888 | 500,000 | 5,100,888 | 11 | 0.90 | 9,796,974 | 920,697 | 10,717,671 | 9 | 0.91 |
| 3 | 392,000,000 | 9,485,951 | 401,485,951 | 2 | 0.98 | 4,244,442 | 450,000 | 4,694,442 | 11 | 0.90 | 91,955,970 | 9,200,597 | 101,156,567 | 10 | 0.91 |
| 4 | 390,000,000 | 69,264,402 | 459,264,402 | 18 | 0.85 | 6,403,774 | 750,000 | 7,153,774 | 12 | 0.90 | 87,659,325 | 7,765,935 | 95,425,261 | 9 | 0.92 |
| 5 | 416,292,960 | 82,030,685 | 498,323,645 | 20 | 0.84 | 21,996,614 | 1,201,900 | 23,198,514 | 5 | 0.95 | 10,458,028 | 1,032,845 | 11,490,873 | 10 | 0.91 |
| 6 | 222,766,616 | 22,276,660 | 245,043,276 | 10 | 0.91 | 6,662,592 | 250,000 | 6,912,592 | 4 | 0.96 | 6,662,592 | 655,259 | 7,317,851 | 10 | 0.91 |
| 7 | 157,280,793 | 105,367,247 | 262,648,040 | 67 | 0.60 | 6,320,604 | 1,205,000 | 7,525,604 | 19 | 0.84 | 9,468,634 | 930,763 | 10,399,397 | 10 | 0.91 |
| 8 | 378,652,682 | 53,030,068 | 431,682,750 | 14 | 0.88 | 8,445,246 | 745,525 | 9,190,772 | 9 | 0.92 | 25,000,000 | 1,500,000 | 26,500,000 | 6 | 0.94 |
| 9 | 719,028,164 | 119,068,840 | 838,097,004 | 17 | 0.86 | 24,840,162 | 350,000 | 25,190,162 | 1 | 0.99 | 70,207,305 | 6,920,730 | 77,128,035 | 10 | 0.91 |
| 10 | 35,000,000 | 5,203,993 | 40,203,993 | 15 | 0.87 | 22,316,052 | 2,135,500 | 24,451,552 | 10 | 0.91 | 883,520 | 500,000 | 1,383,520 | 57 | 0.64 |
| 11 | 2,885,207 | 208,520 | 3,093,727 | 7 | 0.93 | 22,226,629 | 2,225,600 | 24,452,229 | 10 | 0.91 | 12,798,288 | 1,179,928 | 13,978,216 | 9 | 0.92 |
| Avg. | 279,404,180 | 52,318,469 | 331,722,648 | 21 | 0.84 | 13,263,388 | 964,866 | 156,510,799 | 9 | 0.92 | 30,219,259 | 2,850,171 | 33,069,430 | 14 | 0.89 |
* CPI = cost performance index.
Table 11.
A correlation summary matrix for selected causes of delay (N = 37).
| 1 | 2 | 3 | 4 | 5 | 6 | 7 | 8 | 9 | 10 | 11 | 12 | ||
|---|---|---|---|---|---|---|---|---|---|---|---|---|---|
| 1 | Project cost | - | |||||||||||
| 2 | Contract period | 0.481 * | - | ||||||||||
| 3 | Additional time | 0.662 * | 0.589 * | - | |||||||||
| 4 | Additional cost | 0.805 * | 0.451 * | 0.632 * | - | ||||||||
| 5 | Variations/Error in design | 0.420 * | 0.317 | 0.396 * | 0.225 | - | |||||||
| 6 | Delay in progress of payment | 0.464 * | 0.155 | 0.241 | 0.558 * | 0.243 | - | ||||||
| 7 | Change order and delay | 0.236 | 0.168 | 0.067 | 0.248 | 0.274 | 0.356 * | - | |||||
| 8 | Lack of client finance | 0.305 | 0.212 | 0.490 * | −0.046 | 0.294 | −0.123 | 0.081 | - | ||||
| 9 | Poor communication | −0.028 | −0.09 | −0.252 | 0.078 | −0.109 | 0.111 | 0.247 | −0.181 | - | |||
| 10 | Ineffective plan/schedule | −0.161 | −0.167 | −0.048 | −0.128 | −0.241 | −0.3 | −0.275 | −0.145 | −0.071 | - | ||
| 11 | Delay in approval of BoQ | −0.24 | −0.199 | −0.16 | −0.242 | −0.249 | −0.324 | −0.724 * | −0.073 | −0.183 | 0.208 | - | |
| 12 | Site problems/delayed start | −0.117 | −0.013 | −0.048 | −0.14 | −0.168 | −0.219 | −0.362 * | −0.05 | −0.322 | 0.14 | −0.131 | - |
* p < 0.05.
Publisher’s Note: MDPI stays neutral with regard to jurisdictional claims in published maps and institutional affiliations. |
© 2022 by the authors. Licensee MDPI, Basel, Switzerland. This article is an open access article distributed under the terms and conditions of the Creative Commons Attribution (CC BY) license (https://creativecommons.org/licenses/by/4.0/).
Share and Cite
MDPI and ACS Style
Alenazi, E.; Adamu, Z.; Al-Otaibi, A. Exploring the Nature and Impact of Client-Related Delays on Contemporary Saudi Construction Projects. Buildings 2022, 12, 880. https://doi.org/10.3390/buildings12070880
AMA Style
Alenazi E, Adamu Z, Al-Otaibi A. Exploring the Nature and Impact of Client-Related Delays on Contemporary Saudi Construction Projects. Buildings. 2022; 12(7):880. https://doi.org/10.3390/buildings12070880
Chicago/Turabian StyleAlenazi, Essa, Zulfikar Adamu, and Ali Al-Otaibi. 2022. "Exploring the Nature and Impact of Client-Related Delays on Contemporary Saudi Construction Projects" Buildings 12, no. 7: 880. https://doi.org/10.3390/buildings12070880
Note that from the first issue of 2016, this journal uses article numbers instead of page numbers. See further details here.