
Sustainable Renewal of Historical Urban Areas: A Demand–Potential–Constraint Model for Identifying the Renewal Type of Residential Buildings


Department of Urban Planning, School of Architecture, Southeast University, Nanjing 210096, China
*
Author to whom correspondence should be addressed.
Buildings 2022, 12(8), 1210; https://doi.org/10.3390/buildings12081210
Submission received: 29 June 2022
/
Revised: 10 July 2022
/
Accepted: 9 August 2022
/
Published: 11 August 2022
(This article belongs to the Special Issue Innovative Circular Building Design and Construction)
Abstract
:The assessment of buildings facilitates the exploration of the viability of progressive and organic renewal, prevents the aimless and unorganized demolition of residential buildings in previous urban renewal projects, and facilitates the balancing of the preservation and sustainable development of historical urban areas. Studies have rarely examined the effect of regional factors on building renewal or differentiated the effects of historic preservation and development conditions. The fundamental function of historical urban areas in China is to provide residence. Therefore, this study developed a framework to identify the renewal type of residential buildings. The developed framework was used to construct a demand–potential–constraint model with assessment indicators related to three dimensions, namely renewal demand, development potential, and preservation constraint. Moreover, discriminant matrices were employed to divide the renewal of residential buildings into four modes and subdivide it into six types. The historical urban area of Suzhou was selected as the study site. According to the results of renewal type identification, renewal schedules and models with high referential value can be developed by urban renewal planners, which facilitates the optimization of resource allocation. The developed framework provides novel theoretical and practical insights regarding building renewal assessment in historical urban areas.
1. Introduction
The renewal of buildings is a crucial topic in urban renewal and plays an essential role in sustainable urban development. The concept of urban renewal originated from the large-scale urban relocation and reconstruction in Western countries following World War II [1,2]. Continual urbanization leads to the continual flow of population toward urban areas and changes in urban space demands. Urban renewal can be conducted to adjust the structure of urban spaces in response to these changes and address problems related to the transformation of abandoned urban spaces. Accordingly, urban renewal constitutes a key component of urban policies in multiple countries [3,4]. During urban renewal, the restoration of old buildings and improvement of relatively new buildings enhance the efficiency of land resource utilization and thereby promote the sustainable development of cities [5,6,7].
Historical urban areas are associated with cultural heritage and historical buildings; thus, the renewal of buildings in these areas is prioritized. Such areas retain their original urban structure and unique building characteristics and contain land used for residential, economic, and cultural activities [8,9]. Historical urban areas encompass living human settlements passed down from the previous generation as well as newly established settlements that have emerged through urban development. However, new settlements are constrained by the existing urban structure [10]. During urban renewal, the heterogeneity of existing buildings is affected by gentrification, market-oriented demolition and reconstruction, reconstruction projects overseen by local governments, and home renovation projects conducted by residents [11]. Under interactions among multiple internal and external factors, historical urban areas provide residential space and opportunities to engage in diverse social activities and exhibit unique building characteristics. Urban renewal and renovation improve the urban environment to cope with residents’ needs and aspirations, but the conservation of the historic environment has been ignored in this process at times [12]. Sustainable urban conservation should be guided by heritage conservation, take historical environmental characteristics into overall consideration, and balance the relationship between sustainable development and heritage conservation in urban transformation [13]. Therefore, in the renewal of buildings in such areas, large-scale demolition and aimless development should be avoided; instead, the conservation and inheritance of urban culture should be emphasized.
Establishing an inventory of existing resources and achieving the organic renewal of buildings and spaces are crucial approaches for attaining the sustainable development of historical urban areas in China. In the past four decades, rapid urban development and restoration have largely eliminated the waning and decaying image of old cities at the cost of incurring “constructive destruction” to historical urban areas. This phenomenon has caused the traditional characteristics and community culture of such areas to disappear [14]. Therefore, when renewing urban spaces, relevant authorities should consider not only the improvement of the physical space but also intangible assets such as cultural revival and function enhancement [15]. Large-scale demolition and reconstruction without clear objectives can no longer fulfill the development needs of historical urban areas in China. Under the premise of preservation, a balance should be reached between heritage conservation and urban development. Community relations and cultural characteristics should be preserved during renovation, and the situations of each urban area should be considered during urban renewal for progressively promoting organic renewal in line with local characteristics [16,17].
Assessments of and decisions related to the sustainable renewal of buildings are mostly based on the physical characteristics of the buildings, including safety, usage, convenience, comfort, utility, and health. These characteristics are considered in combination with management factors, such as emergency preparedness and financial arrangement, to perform building assessment [5,6,18,19], the results of which serve as the basis for selecting renewal strategies. Different buildings in the same region might exhibit substantial disparities. The mere consideration of building-related internal factors is insufficient; external factors such as the environment, economy, society, and culture of the region where buildings are located must be examined to ensure comprehensive renewal assessment [20,21]. In the renewal assessment of historical urban areas, their unique culture and historical value should not be overlooked. Studies have rarely explored the effects of social, economic, and cultural factors on the renewal of residential buildings in historical urban areas. The effect of socioeconomic conditions and preservation constraints on the renewal assessment of such buildings also merits further exploration. Therefore, this study adopted a potential–constraint model to perform comprehensive research on the aforementioned topics. Potential–constraint models are frequently used to assess the adequacy of building sites and involve the organic integration of socioeconomic development potential and ecological constraints [22,23,24]. In this study, the renewal demand associated with the physical characteristics of buildings constituted the foundation of renewal assessment. Regional and economic conditions were considered potential factors, and historic preservation was considered a constraint factor. Accordingly, a demand–potential–constraint model was created to assess the renewal of residential buildings in historical urban areas, identify the types of renewal, and assist with relevant decision-making processes.
2. Literature Review
Urban renewal is a primary method for restoring old buildings and improving building environments [25]. Therefore, scholars have explored various topics regarding the renewal assessment of residential buildings with respect to physical building conditions. Some countries and regions have stipulated housing quality assessment standards, such as the Housing Quality Standards of the United States, the Housing Quality Indicators of the United Kingdom, and the Housing Quality Assurance Act of Japan. The building indicators used in these standards include location, structural and fire safety, landscape and open space, accessibility, size and floor plans, environments, and maintenance and management [18,26]. In addition to implementing relevant standards, the United States and the United Kingdom conduct regular surveys on randomly selected residential buildings to analyze the living conditions and deterioration of these buildings. The survey results serve as references for prioritizing subsequent building or regional renewal projects [5,27]. Therefore, building quality assessment is a crucial foundation for building renewal assessment. Surveys on residents’ intention to relocate have indicated that compared with those living in large and new buildings, those living in small and old buildings are more willing to relocate and thus more likely to accept the demolition of their current houses [28,29]. This finding implies that physical building characteristics, such as living area per resident and building age, are vital indicators in renewal assessment research. Chinese agencies use a series of quantitative indicators for assessing housing quality. These indicators include not only the physical characteristics of residential buildings but also the environmental factors of individual residential blocks, including the living area per person, presence of facilities, and greening rate [30]. Such comprehensive factors are considered because residential building renewal projects in China are usually targeted at individual land lots instead of single buildings [31]. According to Maslow’s hierarchy of needs, basic human needs are physiological and materialistic needs, which suggests that the renewal assessment of a residential building should focus on physical factors, such as the current building condition and the environmental factors where the building is located.
An urban renewal process involves the adjustment of the urban space structure and the optimization of land resource allocation [4,5]. Thus, the scope of urban renewal research should be extended from single buildings and residential areas to large urban regions, and economic value differences due to location conditions should be considered in renewal assessment. Differences in rent are affected by location conditions [2,32], which are also key factors determining the development potential of land. Location conditions reflect the accessibility and regional competitiveness of specific locations [33]. Development projects usually prioritize land lots with proximity to urban centers, open urban spaces, an ocean or a sea, and rivers as well as those with convenient transportation because such lots can have high value [29,34,35]. In addition to location value, development efficiency is a crucial economic indicator of urban renewal. Most relevant studies have selected indicators related to land-use intensity, including building density, floor area ratio, functional integration, and input–output ratio, for urban renewal assessment [2,35,36]. In assessments that focus on land development progress, the difference in an area before and after development is mostly ignored. Development efficiency, which is usually determined by the increase in building capacity following development, is another crucial indicator of urban renewal. The calculation of this indicator is similar to that of a location quotient. Specifically, the ratio between the floor area ratio and the building density for a land lot is compared with that for a standard urban residential area to determine the development efficiency [31,37]. Development efficiency assessment enables a more precise evaluation of land value with respect to the increase in building capacity.
China began to implement legal regulations for preserving historical urban areas in the 1980s. Local governments comprehensively conserve historic sites, regional culture, and landscape by designating specific zones as historical urban areas and devising preservation plans [38,39]. In plans for cultural preservation, local characteristics are considered to delineate historical urban areas, streets, land lots, artifacts (including major historical and cultural sites protected at the national level and other non-publicly announced immovable cultural assets or historical buildings that exist at such sites), and routes. The preservation scheme involves multiple protection grades to differentiate between historical items of different importance levels [21,40,41]. Because preservation plans implemented by the Chinese government are treated as mandatory laws, they serve as the basic constraint factors in research on renewal assessment in China. The most important function of historical urban areas in China is to provide residential space [41]. Nevertheless, in the renewal of residential buildings in such areas, the preservation of history, landscape, and culture is emphasized; therefore, urban renewal in the aforementioned areas should be assessed using indicators relevant to the aforementioned aspects [42]. The constraints imposed in government preservation plans have not been fully addressed in existing renewal assessment studies because historical preservation indicators have been treated as equivalent to other indicators when conducting renewal assessment [43,44]. Consequently, buildings that merit preservation might not be identified adequately and might be mistakenly classified as buildings that require demolition. To address this problem, preservation is incorporated as an antecedent constraint in the proposed demand–potential–constraint model for rationally reflecting the mandatory nature of government preservation plans in China.
3. Materials and Methods
3.1. Study Area and Data
The historical urban area of Suzhou is located in the southern region of Jiangsu Province in China. This area has a history of over 2500 years and is considered a major historical area in China. Gusu District to which this area belongs is the first and only district in China that is designated as a state-list famous historical and culture city. Therefore, the historical urban area of Suzhou is an exemplar of cultural preservation in China. In 2020, the population of this city was 223,000. The total area of the historical urban area of Suzhou was 14.20 km2, of which 5.65 km2 was residential space. The total area occupied by residential buildings was 7.11 km2, 55.38% of which comprised Workers’ New Villages constructed after the founding of the People’s Republic of China and traditional multi-story residential buildings. Under the strict regulations imposed in the historical urban area of Suzhou to preserve the traditional landscape, numerous Suzhou-style traditional residential buildings (37.12% of all residential buildings) have been preserved; these buildings feature gable roofs, dark roof tiles, and white walls (Figure 1). Although several shanty towns and old communities in the city have been renovated, some areas still have residential buildings with poor living conditions, limited living space, and a lack of amenities (Figure 2). The poor living conditions have caused the city to lose its population, with many residents opting to relocate to new cities with more complete amenities. The vitality of the historical urban area of Suzhou has continued to decrease, which has impeded its suitable development. As a typical historical urban area in China that prioritizes preservation and imposes development constraints, the historical urban area of Suzhou highlights the common development problems faced by various historical urban areas in China [41]. Therefore, this city is a representative target for urban renewal research in China.
Regarding research precision, individual residential land lots were selected as the smallest research unit. Land, road, and building data were obtained from the preservation plan for the historical area of Suzhou, regulatory plans, and relevant research reports provided by the Suzhou Planning Bureau Gusu Branch. Point of interest data (e.g., parks, squares, transportation systems, and amenities) and public Internet of things data (e.g., greening rate) were retrieved from the Amap (Autonavi Software Inc., Beijing, China) and Anjuke platform (licensed by Shanghai Ruijia Information Technology Co., Ltd. and supported by Ruiting Network Technology (Shanghai) Co., Ltd., Shanghai, China) [45]. To correct the collected data, the research team conducted on-site surveys and measurement in Suzhou in April and September 2021, thereby improving the data reliability and accuracy. Geographic information system (GIS) is a comprehensive discipline, which combines geography and cartography, and has been widely used in different fields. It is a computer system for inputting, storing, querying, analyzing, and displaying geographic data [46,47,48]. ArcGIS software (developed by Environmental Systems Research Institute, Inc., Redlands, CA, USA) [49] was used to construct a database of the residential buildings and land renewal types in the city.
3.2. Research Framework
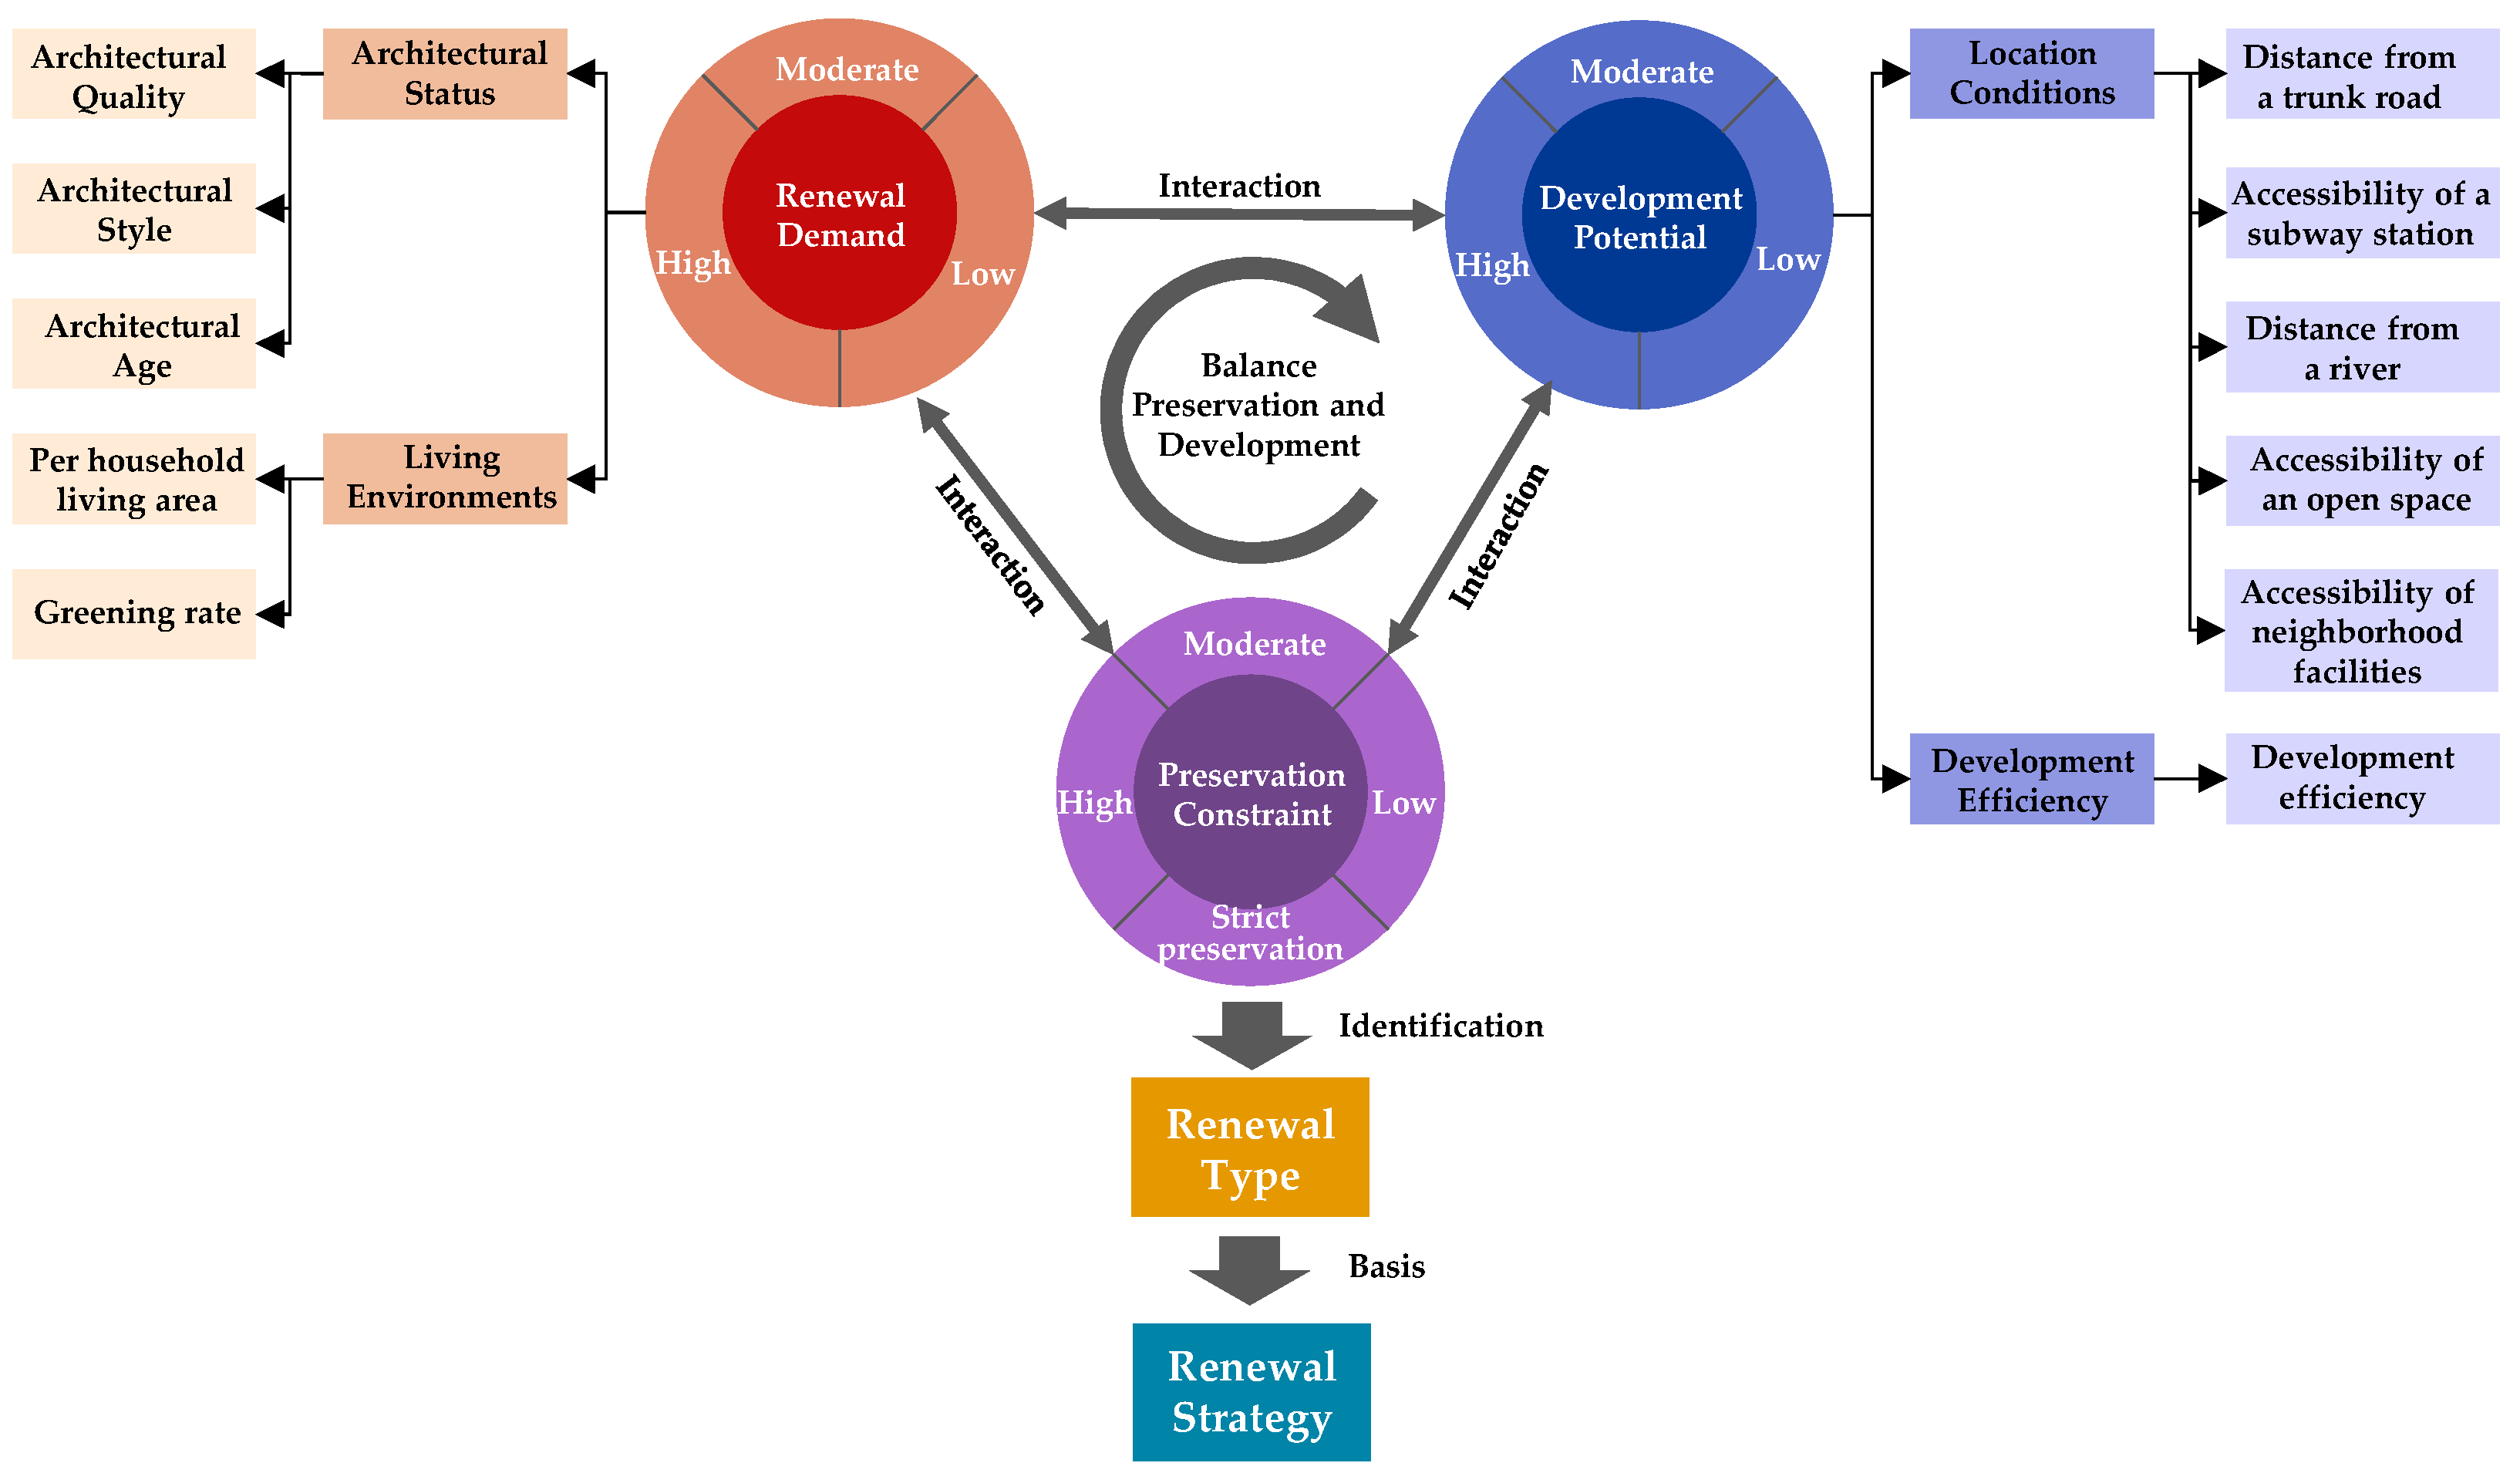
From the perspective of balancing preservation and development, a residential building renewal framework was constructed to identify renewal types (Figure 3). First, architectural status and living environment were examined to determine the renewal demand of a building and increase the specificity of renewal targets, thereby prioritizing buildings with high renewal demand. Next, location conditions and development efficiency were evaluated to determine the development potential for further refining the priority list. Finally, constraints associated with the preservation of historical locations were considered to construct a demand–potential–constraint model. Discriminant matrices were assembled to identify the renewal type and propose corresponding renewal strategies.
3.2.1. Evaluation Method of Renewal Demand
In view of the data accessibility and the overlapping effects between relevant indicators, 12 indicators under three dimensions, namely renewal demand, development potential, and preservation constraint, were selected in this study to construct the proposed model.
Renewal demand assessment was based on architectural status and living environments. Architectural status was determined using three indicators, namely architectural quality, style, and age, and was rated using a 5-point scale. The judgment of architectural quality is a comprehensive evaluation of the physical characteristics of buildings, comprising aging degree of materials, deterioration degree, and structural safety. Architectural quality scores of 1 and 5 points indicated high and poor building quality, respectively. Architectural style refers to whether a building exhibits traditional Suzhou-style architectural features. Buildings with the most noticeable traditional features were awarded 1 point, whereas those with the least noticeable traditional features were awarded 5 points. Architectural age was divided into five categories: before 1912 (founding of the Republic of China), from 1912 to 1949 (founding of the People’s Republic of China), from 1949 to 1980, from 1980 to 2000, and after 2000. The newest buildings were awarded 1 point, whereas the oldest buildings were awarded 5 points. High architectural quality, style, and age scores indicated high renewal priority. The scores of all buildings in each land lot were summed, and the total floor area was incorporated into Equation (1) to compute the land lot score. Finally, the natural breaks method in ArcGIS was adopted to divide all the land lots into five grades with respect to their score [50,51].
where denotes the score of the th land lot; denotes the total floor area of the residential building with an architectural status score of that is located in the th land lot; denotes the architectural status score, which ranges from 1 to 5; and denotes the total floor area of the land lot.
On-site surveys revealed that the city infrastructure covers all residential buildings in the city; thus, the city infrastructure was not included in the assessment framework. The living environment score was assessed using two indicators, namely per household living area and greening rate, on a 5-point scale. Per household living area indicates the indoor living condition of a residential building and was divided into five grades, namely greater than 140 m2, between 140 and 120 m2, between 120 and 90 m2, between 90 and 60 m2, and less than 60 m2. A building with a per household living area of >140 m2 was assigned 1 point, whereas a building with a per household living area of <60 m2 was assigned 5 points. Greening rate denotes the ratio of the green space area to the land-use area. This parameter was used to evaluate the outdoor environment of a residential building and was divided into three grades, namely greater than 30%, between 30% and 20%, and less than 20%, which were assigned 1, 3, and 5 points, respectively.
3.2.2. Evaluation Method of Development Potential
Development potential assessment was based on location conditions and development efficiency, each of which was rated using a 5-point scale. The three main location conditions examined in this study were transportation, ecological, and amenity conditions, which were assessed using five indicators: distance from a trunk road, distance from a river, accessibility of a subway station, accessibility of an open space, and accessibility of neighborhood facilities. A building associated with the shortest distance grade and highest accessibility grade was awarded 1 point, whereas a building associated with the longest distance grade and lowest accessibility grade was awarded 5 points. A high location condition score indicates high development potential and therefore high renewal priority.
According to the road design standard of China [52], the roads evaluated in this study were divided into arterial and secondary trunk roads. Distance from a trunk road was divided into five grades, namely less than 200 m, between 200 and 300 m, between 300 and 400 m, between 400 and 500 m, and greater than 500 m. These five grades were used in the assessment of target land lots by adopting the multiple-ring buffer analysis and spatial join methods in ArcGIS [47]. Distance from a river was incorporated using the same method and was divided into five grades, namely less than 50 m, between 50 and 100 m, between 100 and 150 m, between 150 and 200 m, and greater than 200 m.
Because the road system affects the accessibility to transportation facilities, open spaces, and other amenities, the service area analysis function of ArcGIS was used to create a road centerline network. The created network accurately presents the transportation distance in the road system and indicates the distances between target land lots and amenities [48]. According to the development standards for land neighboring the railroad system of Shanghai city [53], accessibility of a subway station was divided into five grades, namely less than 300 m, between 300 and 600 m, between 600 and 800 m, between 800 and 1000 m, and greater than 1000 m. On the basis of the conditions of Suzhou, neighboring facilities were selected for Suzhou. The selected facilities comprised elementary schools, general hospitals, and stadiums, and open spaces included parks and squares. According to the community facility construction standard of China [54], accessibility of neighboring facilities was divided into five grades, namely less than 300 m, between 300 and 500 m, between 500 and 800 m, between 800 and 1000 m, and greater than 1000 m. The spatial join method was used to incorporate the results of location condition assessment into the corresponding land lot data.
According to the urban planning standard of China, the standard indicators adopted in development efficiency refer to the floor area ratio and building density of the urban built-up area specified therein [55]. Specifically, the floor area ratio and building density of 1–3-story residential buildings were 1.2 and 43%, respectively; those of 4–6-story residential buildings were 1.6 and 32%, respectively; and those of 7–9-story residential buildings were 2.1 and 30%, respectively. Development efficiency was calculated using the following equation:
where denotes the development efficiency of the th land lot; denotes the floor area ratio of the th land lot, which is defined as the ratio between total floor area and total land-use area; denotes the building density of the ith land lot, which is defined as the ratio between building foundation area and total land-use area; and and denote the standard indicators. Land lots with a value of <1 have development potential and were divided into four grades (awarded 2–5 points) using the natural breaks method; the lower the score, the higher was the development potential. Land lots with a value of ≥1 were awarded 1 point.
3.2.3. Evaluation Method of Preservation Constraint
Because the historical urban area of Suzhou is situated on a plain, topography is not a constraint of urban renewal. Moreover, no ecological preservation zones exist at the research site. Therefore, this study only considered constraints associated with historical preservation. According to research on the classification of historical assets meriting preservation as well as relevant preservation plans implemented by the Chinese government, land lots were divided into four grades with respect to the level of preservation. Specifically, land lots with strict preservation were those covering the core preservation zones of historical monuments and streets; land lots with high preservation were those covering the regulation zones of historical streets; land lots with moderate preservation were those covering traditional residential buildings; and the remaining land lots were land lots with low preservation.
The analytic hierarchy process was used to verify the selected indicators. Experts, scholars, government personnel, and relevant practitioners familiar with the historical urban area of Suzhou or urban renewal processes were invited to form an expert panel. One round of expert assessment was performed to determine the weight of each indicator (Table 1) [35,56]. The results of renewal demand and development potential assessment were divided into three grades (high, moderate, and low) by using the natural breaks method.
3.2.4. Identification Method for Renewal Type
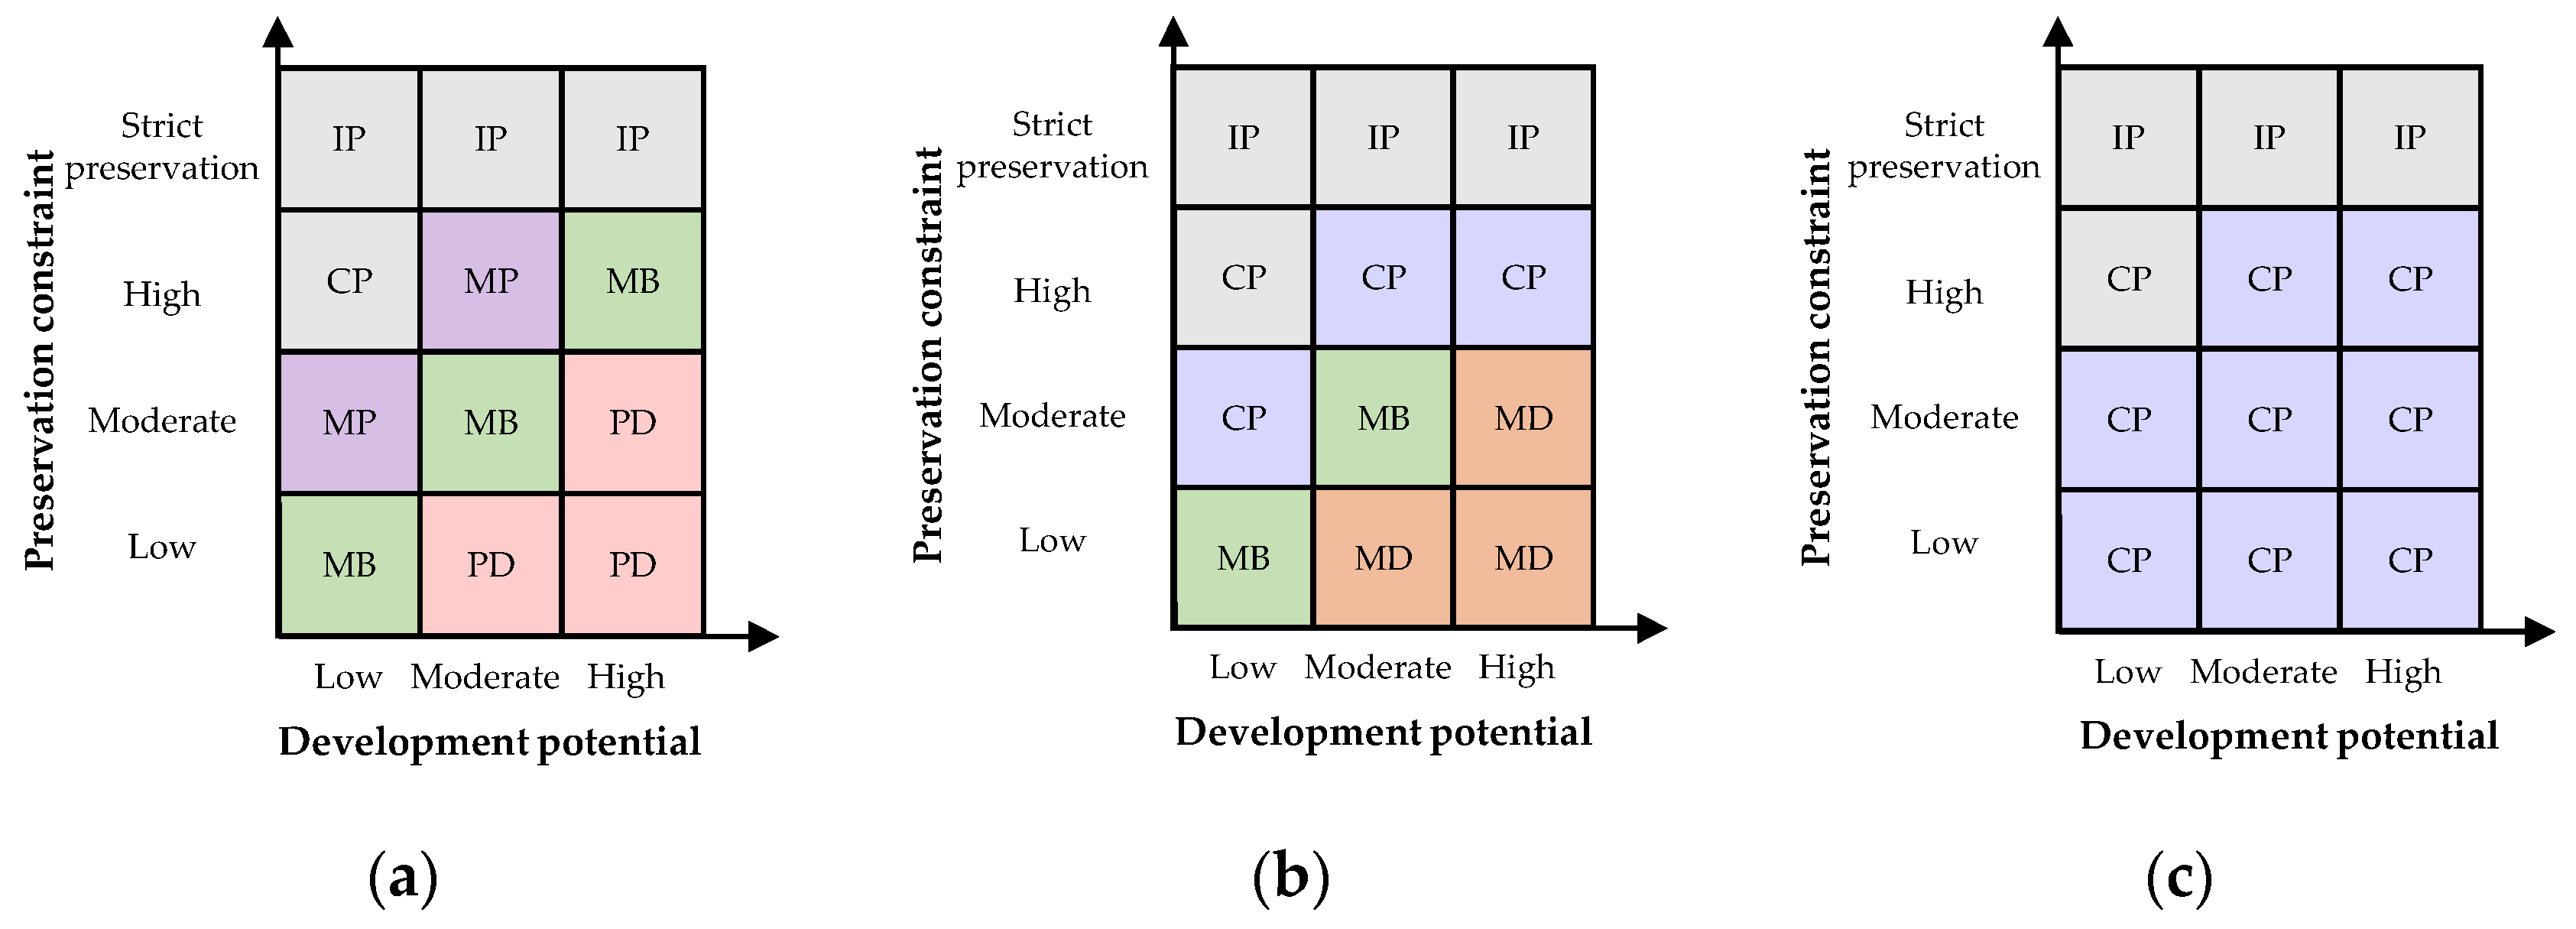
After the demand–potential–constraint model was constructed, discriminant matrices were created to present the preservation constraint and development potential grades of the land lots [22,24]. The land lots were divided into those with high, moderate, and low renewal demand. According to the differences in the preservation constraint and development potential grades, four renewal modes were established, namely priority renewal, moderate renewal, conditional renewal, and inappropriate renewal. These modes were further divided into six renewal types according to their orientation toward historical preservation or land development: inappropriate renewal with preservation orientation (IP), conditional renewal with preservation orientation (CP), moderate renewal with balanced preservation and development orientation (MB), moderate renewal with preservation orientation (MP), moderate renewal with development orientation (MD), and priority renewal with development orientation (PD) (Figure 4). Under the premise of historical preservation, the six renewal types were applied as follows to avoid large-scale demolition and reconstruction:
- Regardless of renewal demand and development potential, land lots requiring strict preservation were classified into the IP category.
- Regardless of renewal demand, land lots with high preservation constraint and low development potential were classified into the CP category.
- Under high renewal demand, land lots with low preservation constraint and moderate or high development potential and land lots with moderate preservation constraint and high development potential were classified into the PD category. Moreover, land lots with low/moderate/high preservation constraint and low/moderate/high development potential were classified into the MB category. Land lots with moderate preservation constraint and low development potential and land lots with high preservation constraint and moderate development potential were classified into the MP category.
- Under moderate renewal demand, land lots with low preservation constraint and moderate or high development potential and land lots with moderate preservation constraint and high development potential were classified into the MD category, land lots with low/moderate preservation constraint and low/moderate development potential were classified into the MB category. Land lots with moderate preservation constraint and low development potential and land lots with high preservation constraint were classified into the CP category.
- Under low renewal demand, land lots prioritizing historical preservation, except for those under strict preservation constraint, were classified into the CP category.
4. Results and Discussion
4.1. Analysis of Renewal Demand
Residential land lots with moderate renewal demand accounted for the largest residential land-use space (2.87 km2) in the historical urban area of Suzhou, and the building space was evenly distributed (Figure 5a). The residential floor area was 4.02 km2, which accounted for 56.51% of the total floor area. Residential land lots with high renewal demand were mostly concentrated in the northern region and occupied 1.77 km2 of land-use space. The residential floor area in these land lots was 2.22 km2, which accounted for 31.19% of the total floor area. Residential land lots with low renewal demand were mostly concentrated in the northern and western regions and occupied 1.01 km2 of land-use space. The residential floor area in these land lots was 0.87 km2, which accounted for 12.30% of the total floor area. Most of the residential buildings in the residential land lots with low renewal demand are villas constructed after 2000.
Land lots with high renewal demand covered most traditional residential buildings and multi-story residential buildings constructed during 1950–1980. These buildings were old and exhibited moderate-to-low architectural quality, few traditional architectural features, moderate per household living area, low greening rates, and poor living environments. Although the residential buildings in communities established during 1980–2000 exhibited few or no traditional architectural features and low per household living area, these buildings were younger than the aforementioned buildings, and their greening rate was relatively high; thus, their renewal demand was low (Figure 5b–f).
4.2. Analysis of Development Potential
In the historical urban area of Suzhou, land lots with the three development potential grades were evenly distributed and occupied nearly equal proportions of land-use space (Figure 6a). Land lots with high development potential were mostly concentrated along the trunk roads and their crossroads located in the center of the city. These land lots occupied 2.99 km2 of land-use space. The residential floor area in the aforementioned lots was 3.55 km2, which accounted for 49.90% of the total floor area. Land lots with moderate development potential occupied 1.86 km2 of land-use space. The residential floor area in these lots was 2.46 km2, which accounted for 34.56% of the total floor area. The city had relatively few land lots with low development potential, and these lots were concentrated in the northeast and northwest corners of the city. The aforementioned land lots occupied 0.84 km2 of land-use space. The residential floor area in these lots was 1.10 km2, which accounted for 15.54% of the total floor area.
Further analysis revealed that 82.80% of the residential buildings in Suzhou were within 200 m from a trunk road, which indicated that the overall transportation accessibility of the city was favorable (Figure 6b). Moreover, 72.37% of the residential buildings were within 100 m from a river, and 70.31% of the residential buildings were within 500 m from an open space; thus, the overall ecological location condition was favorable. However, land lots in the city center exhibited worse ecological location conditions than did those in peripheral areas (Figure 6d,e). Overall, 74.42% of the residential buildings were within 500 m from a neighboring facility, which indicated favorable overall accessibility of neighboring facilities (Figure 6f). Because the northern region of the city lacked transverse roads or railways, the accessibility of the northeast and northwest urban areas was low (Figure 6c). The varying strict building height restrictions imposed in the different areas of the city led to disparities in development efficiency. Land lots with low development efficiency and high development potential were concentrated in the northern urban area, where buildings had fewer floors and lower floor area ratios than did buildings in other areas (Figure 6g).
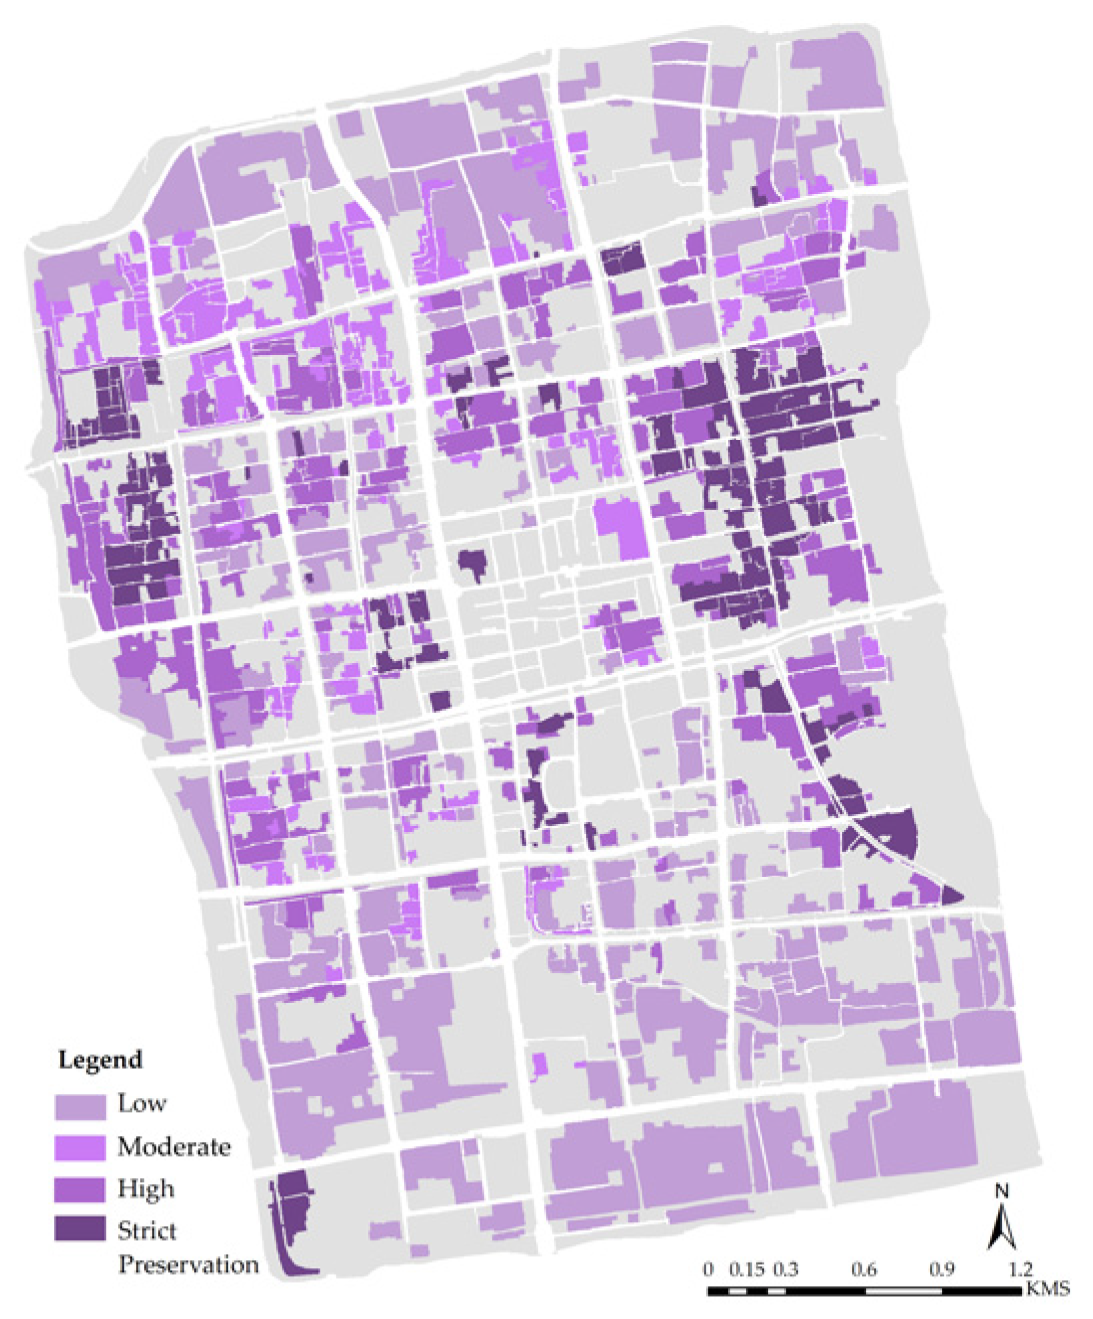
4.3. Analysis of Preservation Constraint
Residential buildings with strict preservation constraint were mostly concentrated in the eastern and northwestern regions of the city, where historical streets and zones were located (Figure 7). The total land-use space occupied by these buildings was 0.70 km2, and their residential floor area was 0.89 km2, which accounted for 12.55% of the total floor area. Residential buildings with high preservation constraint were mostly located near historical streets and zones. The total land-use space occupied by these buildings was 1.19 km2, and their residential floor area was 1.53 km2, which accounted for 21.56% of the total floor area. Residential buildings with moderate preservation constraint occupied 0.71 km2 of the land-use space, and their residential floor area was 0.83 km2, which accounted for 11.63% of the total floor area. Residential buildings with low preservation constraint were mostly located in the southern and northern regions. The total land-use space occupied by these buildings was 3.05 km2, and their residential floor area was 3.86 km2, which accounted for 54.26% of the total floor area.
4.4. Identification of Renewal Type
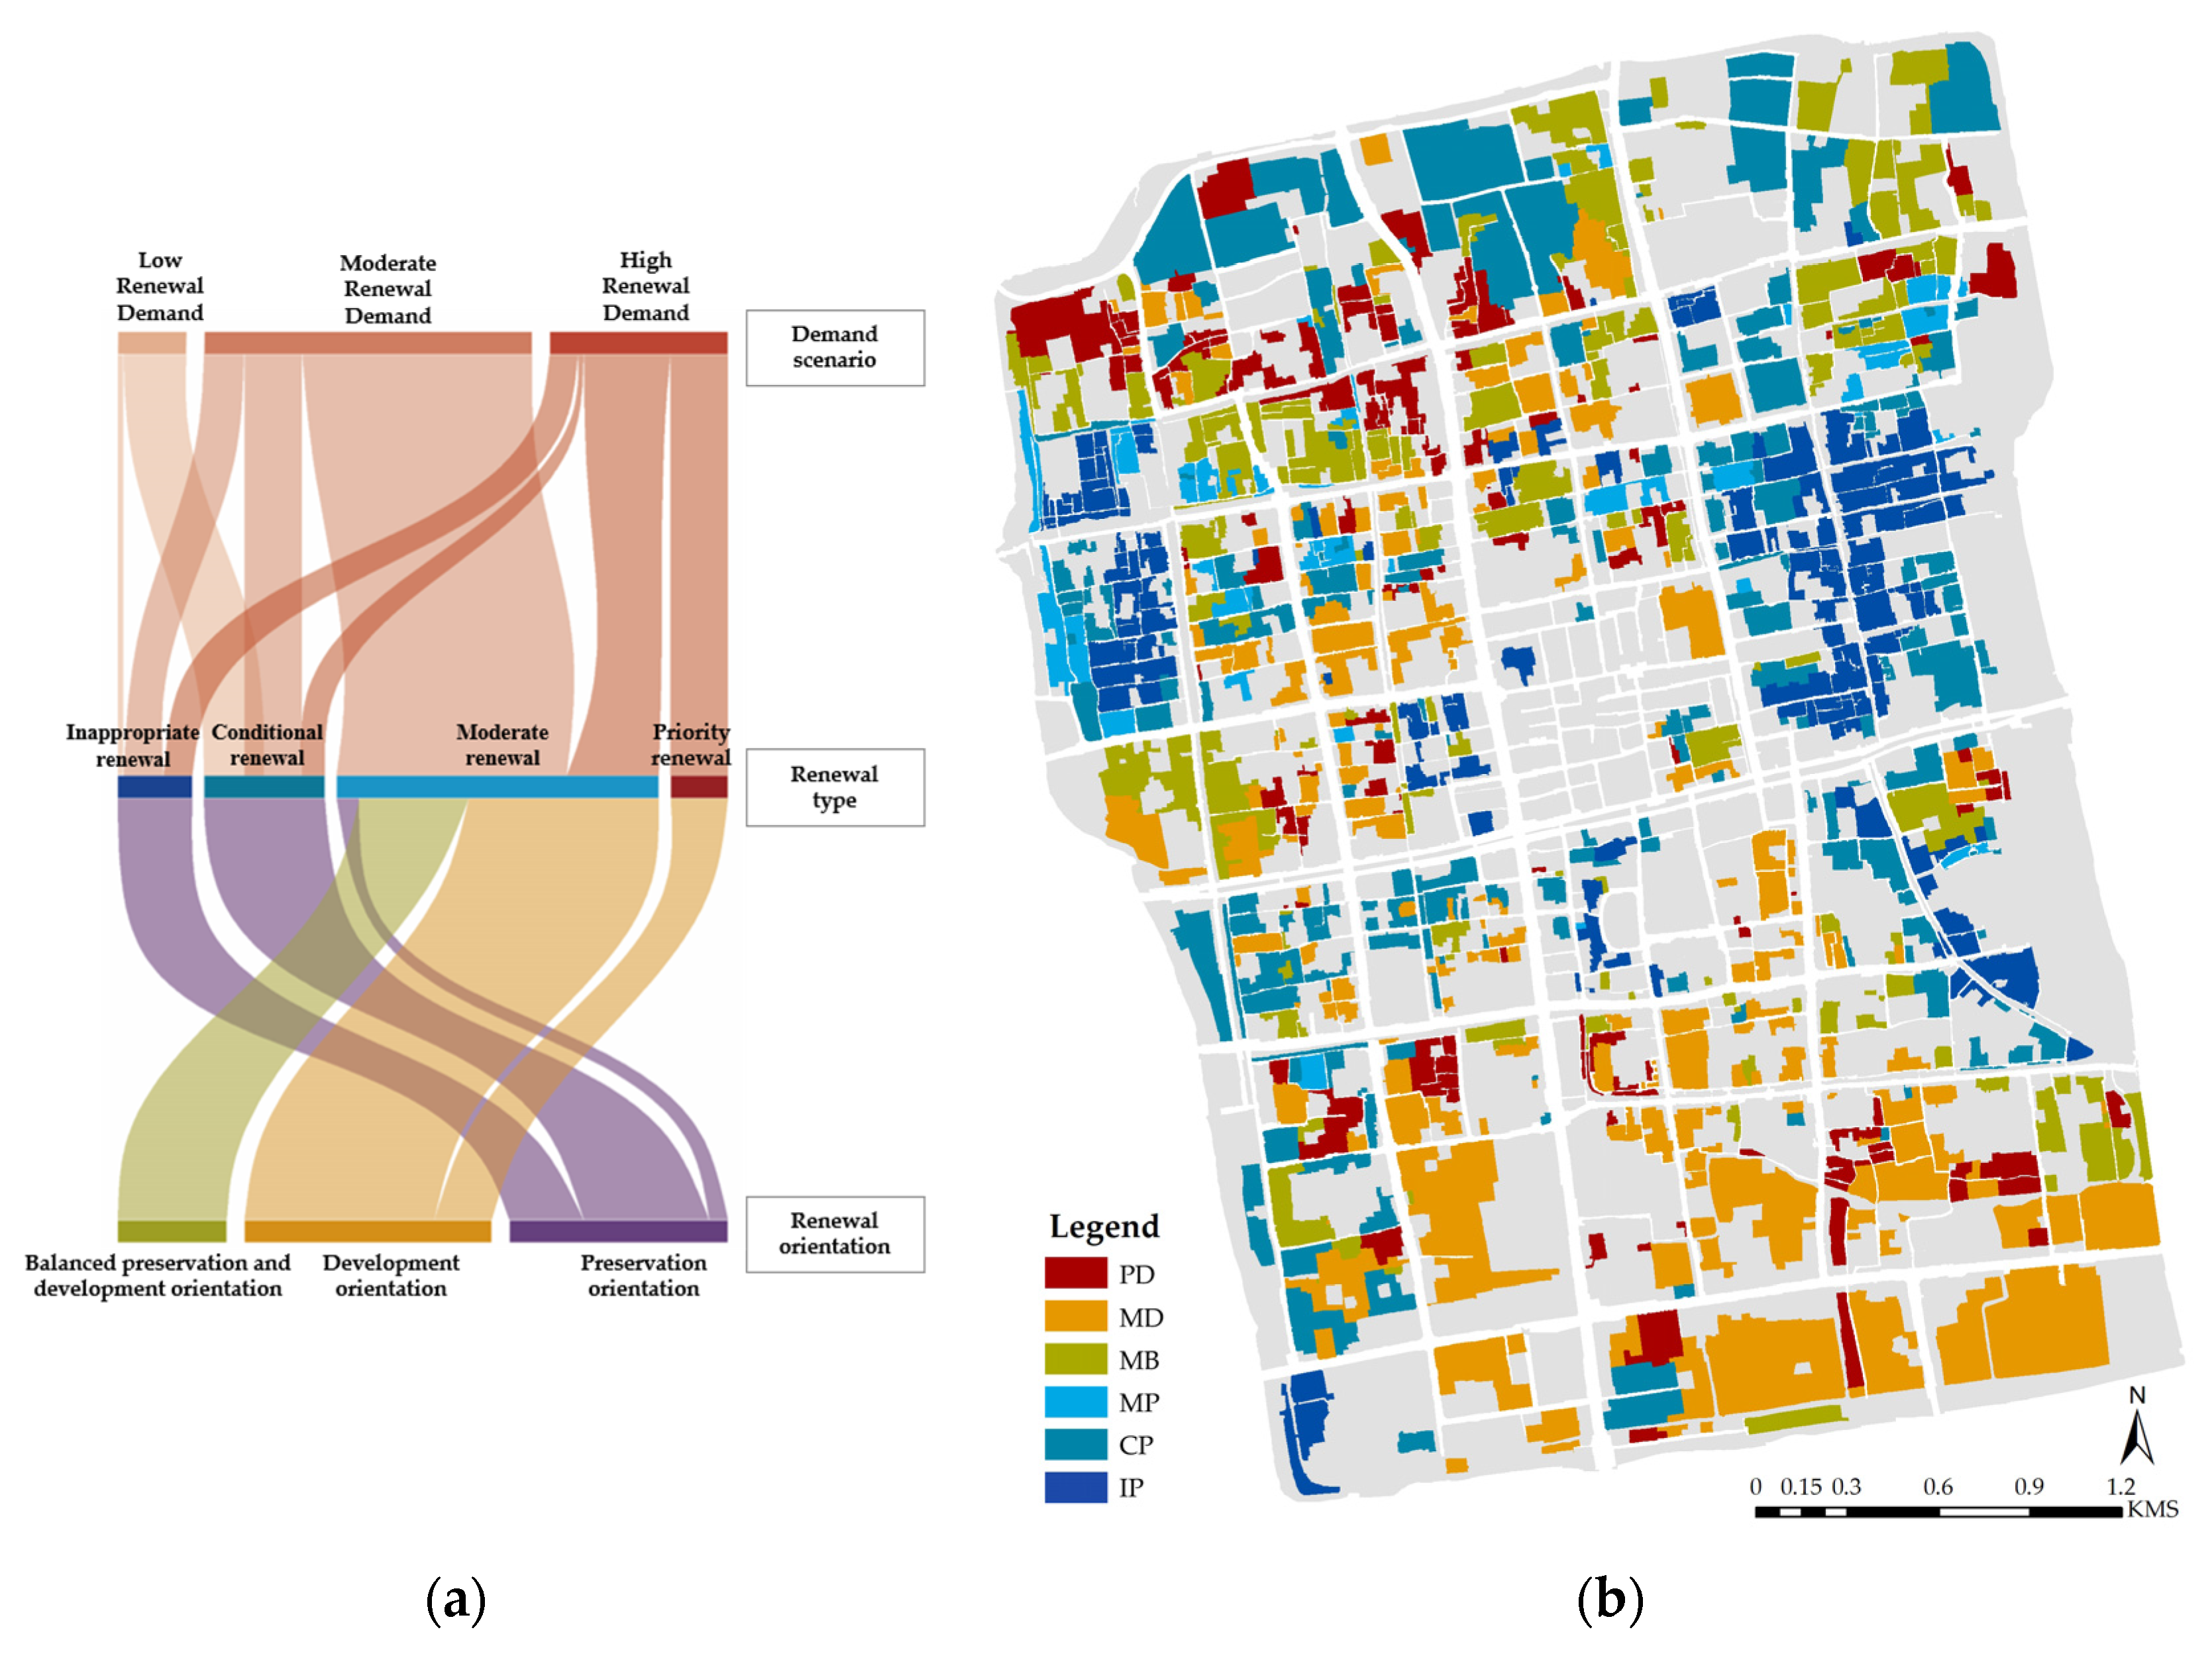
Figure 8 displays the proportions and spatial distribution of the renewal types obtained according to the discriminant matrices (Figure 4).
Few land lots were classified as PD. These lots occupied 0.55 km2 of the land-use space, and their residential area was 0.66 km2, which accounted for 9.23% of the total floor area. Figure 8 indicates that most PD land lots were scattered across the city; however, a notable concentration was observed at the main crossroad of the northern trunk road, where the development potential was high.
Land lots requiring moderate renewal accounted for the highest proportion of the land lots with different renewal types. They occupied 3.16 km2 of the land-use space, and their residential floor area was 4.09 km2. Of the land lots requiring moderate renewal, the MD type accounted for the largest floor area (37.22%), and most of the land lots in this category covered Workers’ New Villages and multi-story buildings with moderate living conditions. The MB type accounted for the second largest floor area (19.78%). The land lots in this category exhibited a balanced need for historic preservation and land development and were mostly located in the northern region of the city. The MP type accounted for the lowest floor area, and the land lots in this category were scattered across the city, occupied the smallest land-use space, and mostly constituted traditional residential buildings.
Land lots belonging to the CP category, which required conditional renewal, were mostly concentrated in areas peripheral to the zones requiring strict preservation. The land lots in this category occupied 1.25 km2 of the land-use space, and their residential floor area was 1.47 km2, which accounted for 20.68% of the total floor area. Land lots belonging to the IP category, which were unsuitable for renewal, occupied 0.70 km2 of the land-use space. Their residential floor area was 0.89 km2, which accounted for 12.55% of the total floor area.
4.5. Strategy Decision Based on Renewal Type
Of the six renewal types, PD exhibited the highest development need, whereas IP exhibited the highest preservation need. According to the varying development and preservation needs for the six renewal types, corresponding strategies can be adopted to implement demolition, reconstruction, renovation, and preservation plans.
Buildings prioritized for renewal should be demolished and reconstructed in short-term projects. PD buildings are old, exhibit poor architectural quality, and possess architectural features that do not merit historical preservation; thus, they have the lowest preservation constraint and are most suitable for demolition. Such buildings can be demolished and reconstructed individually or in batches to improve development capacity and ensure consistency among architectural styles in historical urban areas.
Buildings in the moderate renewal category should be renovated in short-term projects or demolished and reconstructed in long-term projects. MD buildings are mostly multi-story buildings with high renewal demand. They exhibit low preservation constraint and moderate development potential. Regarding renewal priority, the outdoor environment and architectural style of MD buildings with acceptable architectural quality can be improved through short-term projects. Moreover, the outdoor environment and architectural style of MD buildings with poor architectural quality and high development potential can be improved through long-term renewal projects. MB buildings are mostly traditional residential buildings that exhibit high demand for preservation and renewal. These buildings should be subjected to interior renovation to satisfy contemporary living needs. Traditional residential buildings with poor architectural quality should be renovated, and their architectural style should be adjusted to ensure consistency with other buildings in the city. MB buildings also include multi-story buildings that exhibit relatively low demand for preservation and development. The renewal priority of these buildings is lower than that of MD buildings. MP buildings are mostly traditional residential buildings that exhibit high renewal demand but low development potential and high preservation constraint. Therefore, MP buildings with poor architectural quality and inconsistent architectural styles can be demolished and reconstructed, and other MP buildings should be subjected to interior and exterior renovation.
In general, buildings in the conditional renewal and strict preservation categories should not be demolished. CP buildings mostly have high preservation constraint or low renewal demand. Their architectural styles are consistent with those of other buildings in the examined historical urban area. Therefore, these buildings should mainly be restored when required to retain the original architectural appearance and structure. IP buildings should be subjected to the strictest preservation and must not be demolished or damaged.
5. Conclusions
Historical urban areas in China are undergoing progressive and organic renewal. The renewal assessment of residential buildings in such areas provides a crucial basis for determining residence upgrade strategies and sequences. On the basis of the interactions between demand, potential, and constraint, a framework was developed in this study for identifying land lot and building renewal types in historical urban areas, and the historical urban area of Suzhou was selected as the research site for verifying the framework. The developed framework was used to integrate building and land lot data, and ArcGIS was adopted to create a residential building database. Renewal demand was assessed according to the architectural and living conditions of each building. Location conditions and development efficiency were analyzed to determine development potential. Preservation constraint was determined on the basis of governmental preservation plans and historical resource identification. Subsequently, discriminant matrices were created to identify six renewal types. The aforementioned data can be used to devise renewal plans, in which buildings with the highest development potential and renewal demand and the lowest preservation constraint are prioritized for reconstruction. In general, buildings with the lowest renewal demand should not be demolished unless necessary, and the focus should be on their restoration. During maintenance and restoration, the demolition of buildings with the strictest preservation grade should be prohibited. Buildings requiring moderate renewal should be renovated in short-term plans and then redeveloped in long-term plans if necessary. The proposed renewal strategies can effectively preserve the traditional ambiance and monuments in historical urban areas while facilitating rational and orderly redevelopment, thereby improving the living conditions in these areas and promoting sustainable urban renewal.
This study has two major research contributions. First, it improved conventional assessment frameworks by simultaneously analyzing preservation constraint, development potential, and renewal demand. The developed demand–potential–constraint model and discriminant matrices highlight the different effects of the aforementioned three dimensions on urban renewal and enable the optimization of the categorization of renewal types. Second, the optimized renewal types proposed in this study effectively correspond to the need of historical urban areas in China for small-scale progressive renewal. The developed framework enables the effective formulation of renewal sequences, helps decision makers make scientific decisions and optimize resource allocation, and exhibits favorable operability and practicality.
Although a novel approach was adopted in this study for determining strategies and sequences for the renewal of historical urban areas in China, this study has several limitations. For example, limitations in data usability and standard quantification techniques reduce the applicability of the assessment indicators in the proposed framework. Although relevant studies have indicated that per person living area and architectural quality can reflect residents’ willingness to agree to building renewal, these indicators cannot comprehensively evaluate all social factors. Future studies should investigate how the proposed framework can be optimized through the quantification of social factors. Moreover, because the assessment framework focuses on the residential environment assessment at the land lot scale, it lacks consideration of the indoor environment of the building. The quantitative evaluation of building energy consumption, environmental comfort, and air quality indicators both indoor and outdoor also needs further research. In addition, this study only considered historical preservation as the renewal constraint and did not include ecological constraints in the developed framework because the research site is located on a plain without ecological preservation zones or topographic constraints. Future research should incorporate unique ecological constraints to increase the generalizability of the developed framework for all historical urban areas in China.
Author Contributions
Conceptualization, M.W.; Data curation, M.W. and J.Y.; Formal analysis, M.W.; Methodology, M.W.; Writing—original draft, M.W.; Writing—review and editing, J.Y. All authors have read and agreed to the published version of the manuscript.
Funding
This research was funded by the China National Key R&D Program “Green Livable Technical Innovation for Villages and Towns” Special Project: “Research on the Protection and Renovation Planning Technology of Characteristic Villages and Towns”, grant number 2019YFD1100701.
Institutional Review Board Statement
Not applicable.
Informed Consent Statement
Not applicable.
Data Availability Statement
Not applicable.
Conflicts of Interest
The authors declare no conflict of interest.
References
- Carmon, N. Three generations of urban renewal policies: Analysis and policy implications. Geoforum 1999, 30, 145–158. [Google Scholar] [CrossRef]
- Lai, Y.; Tang, B.; Chen, X.; Zheng, X. Spatial determinants of land redevelopment in the urban renewal processes in shenzhen, china. Land Use Policy 2021, 103, 105330. [Google Scholar] [CrossRef]
- Couch, C. Urban Renewal: Theory and Practice; Macmillan International Higher Education: London, UK, 1990. [Google Scholar]
- Zheng, H.W.; Shen, G.Q.; Wang, H. A review of recent studies on sustainable urban renewal. Habitat Int. 2014, 41, 272–279. [Google Scholar] [CrossRef] [Green Version]
- Ho, D.C.W.; Yau, Y.; Poon, S.W.; Liusman, E. Achieving sustainable urban renewal in Hong Kong: Strategy for dilapidation assessment of high rises. J. Urban Plann. Dev. 2012, 138, 153–165. [Google Scholar] [CrossRef]
- Armstrong, G.; Soebarto, V.; Zuo, J. Vacancy visual analytics method: Evaluating adaptive reuse as an urban regeneration strategy through understanding vacancy. Cities 2021, 115, 103220. [Google Scholar] [CrossRef]
- Lucchi, E.; Delera, A.C. Enhancing the historic public social housing through a user-centered design-driven approach. Buildings 2020, 10, 159. [Google Scholar] [CrossRef]
- Mehanna, W.A.E.-H.; Mehanna, W.A.E.-H. Urban renewal for traditional commercial streets at the historical centers of cities. Alex. Eng. J. 2019, 58, 1127–1143. [Google Scholar] [CrossRef]
- Wang, M.; Yang, J.; Hsu, W.-L.; Zhang, C.; Liu, H.-L. Service facilities in heritage tourism: Identification and planning based on space syntax. Information 2021, 12, 504. [Google Scholar] [CrossRef]
- Hernández, A.A.S.; Léon, M.T.; Mireles, M.H. Where are going to definitions historical centers in latinoamerican? Territory, city and heritage. Procedia-Soc. Behav. Sci. 2016, 225, 27–33. [Google Scholar] [CrossRef] [Green Version]
- Kovács, Z.; Wiessner, R.; Zischner, R. Urban renewal in the inner city of budapest: Gentrification from a post-socialist perspective. Urban Stud. 2013, 50, 22–38. [Google Scholar] [CrossRef]
- Cities, H.I. Urban settlements. In Historic Urban Environment Conservation Challenges and Priorities for Action; Experts Meeting (12–14 March 2009); The Getty Conservation Institute: Los Angeles, CA, USA, 2010; Available online: https://www.getty.edu/conservation/our_projects/field_projects/historic/experts_mtg_mar09.pdf (accessed on 9 July 2022).
- Lucchi, E.; Buda, A. Urban green rating systems: Insights for balancing sustainable principles and heritage conservation for neighbourhood and cities renovation planning. Renew. Sustain. Energy Rev. 2022, 161, 112324. [Google Scholar] [CrossRef]
- Zhang, G. Historical and cultural preservation needs to guard against “constructive destruction”. People’s Trib. 2016, 31, 214–215. [Google Scholar] [CrossRef]
- Si, N.; Zhu, Y.; Yin, J. Impact of urban renewal mode on commercial housing price under inventory development: An empirical analysis in shenzhen. Acta Sci. Natur. Univ. Pekinensis 2020, 56, 959–965. [Google Scholar] [CrossRef]
- Li, B.; Ma, J. Analysis on the innovation path of organic renewal under the background of inventory planning. Archit. Cult. 2019, 3, 75–76. Available online: https://www.cnki.com.cn/Article/CJFDTotal-JZYW201903022.htm (accessed on 20 March 2022).
- Shan, J. From “large-scale transformation of dilapidated houses” to “gradual and organic renewal”. Cult. Relics 2006, 7, 26–40. [Google Scholar] [CrossRef]
- Juan, Y.-K.; Kim, J.H.; Roper, K.; Castro-Lacouture, D. Ga-based decision support system for housing condition assessment and refurbishment strategies. Autom. Constr. 2009, 18, 394–401. [Google Scholar] [CrossRef]
- Kuwahara, R.; Kim, H.; Sato, H. Evaluation of zero-energy building and use of renewable energy in renovated buildings: A case study in japan. Buildings 2022, 12, 561. [Google Scholar] [CrossRef]
- Xu, K.; Shen, G.Q.; Liu, G.; Martek, I. Demolition of existing buildings in urban renewal projects: A decision support system in the china context. Sustainability 2019, 11, 491. [Google Scholar] [CrossRef] [Green Version]
- Hong, Y.; Chen, F. Evaluating the adaptive reuse potential of buildings in conservation areas. Facilities 2017, 35, 202–219. [Google Scholar] [CrossRef]
- Kong, F.; Yin, H.; Jiang, F.; Chen, J. Potential impacts of urban sprawl on the thermal environment in the nanjing metropolitan area based on the sleuth and wrf models. In Jinan Forum on Geography and Ecological Sustainability Guangzhou, China; SpringerNature: Cham, Switzerland, 2017; pp. 215–239. [Google Scholar]
- Yin, H.-W.; Kong, F.-H.; Luo, Z.-D.; Yan, W.-J.; Sun, C.-F.; Xu, F. Suitability assessment of construction land in the central and southern parts of hebei province, china based on potential-limitation model. Chin. J. Appl. Ecol. 2013, 24, 2274–2280. [Google Scholar] [CrossRef]
- Zhang, C.; Fu, H.; Zhang, X.; Qian, Z. Suitablity regionalization for exploitation of urban constructive land based on ecological constraints and development potential. Bull. Soil Water Conserv. 2017, 37, 174–181. [Google Scholar] [CrossRef]
- Bae, W.; Kim, U.; Lee, J. Evaluation of the criteria for designating maintenance districts in low-rise residential areas: Urban renewal projects in seoul. Sustainability 2019, 11, 5876. [Google Scholar] [CrossRef] [Green Version]
- Harrison, A. Housing Quality Indicators; Better Homes in the Next Millennium; Hong Kong Housing Authority: Hong Kong, China, 1999. Available online: https://www.housingauthority.gov.hk/mini-site/housing-conference/1999/en/events/conf/conferen/pdf/eandrew.pdf (accessed on 20 March 2022).
- English Housing Survey. Available online: https://www.gov.uk/government/collections/english-housing-survey (accessed on 20 March 2022).
- Weber, R.; Doussard, M.; Bhatta, S.D.; McGrath, D. Tearing the city down: Understanding demolition activity in gentrifying neighborhoods. J. Urban Aff. 2006, 28, 19–41. [Google Scholar] [CrossRef] [Green Version]
- Dye, R.F.; McMillen, D.P. Teardowns and land values in the chicago metropolitan area. J. Urban Econ. 2007, 61, 45–63. [Google Scholar] [CrossRef]
- Research Report on Quantitative Indicators of “Housing for Urban Family Residents”. Available online: https://mp.weixin.qq.com/s/6UCwqFNpq-EqU4-FIf6vBw? (accessed on 20 March 2022).
- Wu, W.; Shi, H.; Yang, B.; Xu, Y.; Li, Y. An analysis framework on enterprise communities’ renewalpotential of land use in the city and its application. Acta Geog. Sin. 2021, 76, 2391–2406. [Google Scholar] [CrossRef]
- Munneke, H.J.; Womack, K.S. Neighborhood renewal: The decision to renovate or tear down. Reg. Sci. Urban Eco. 2015, 54, 99–115. [Google Scholar] [CrossRef]
- Frantál, B.; Greer-Wootten, B.; Klusáček, P.; Krejčí, T.; Kunc, J.; Martinát, S. Exploring spatial patterns of urban brownfields regeneration: The case of brno, czech republic. Cities 2015, 44, 9–18. [Google Scholar] [CrossRef]
- Kaufman, D.A.; Cloutier, N.R. The impact of small brownfields and greenspaces on residential property values. J. Real Estate Finance Econ. 2006, 33, 19–30. [Google Scholar] [CrossRef]
- Wang, H.; Shen, Q.; Tang, B.-S. Gis-based framework for supporting land use planning in urban renewal: Case study in Hong Kong. J. Urban Plann. Dev. 2015, 141, 05014015. [Google Scholar] [CrossRef]
- Erb, K.-H.; Haberl, H.; Jepsen, M.R.; Kuemmerle, T.; Lindner, M.; Müller, D.; Verburg, P.H.; Reenberg, A. A conceptual framework for analysing and measuring land-use intensity. Curr. Opin. Environ. Sustain. 2013, 5, 464–470. [Google Scholar] [CrossRef] [Green Version]
- Yan, J.; Shen, Y.; Xia, F. Differentiated optimization of sustainable land use in metropolitan areas: A demarcation of functional units for land consolidation. Sustainability 2017, 9, 1356. [Google Scholar] [CrossRef] [Green Version]
- Wang, J. Problems and solutions in the protection of historical urban areas. Front. Archit. Res. 2012, 1, 40–43. [Google Scholar] [CrossRef] [Green Version]
- Qian, Z.H.U. Historic district conservation in China: Assessment and prospects. Tradit. Dwell. Settl. Rev. 2007, 19, 59–76. [Google Scholar] [CrossRef]
- Xiang, B.; DI, W. Discussion on the standard of conservation planning for historic city. City Plann. Rev. 2020, 44, 93–101. [Google Scholar] [CrossRef]
- Zhang, Q.; Yu, J.; Zhuan, J. An innovative exploration on the compilation of conservation planning for historic city: A case study of suzhou. City Plann. Rev. 2014, 38, 35–41. [Google Scholar] [CrossRef]
- Huang, Y.; Xu, J.; Zhang, W. Research on the game in the protection and renovation of traditional residential-type historic districts. City Plann. Rev. 2013, 37, 46–50. Available online: http://www.cqvip.com/qk/96009x/20139/47321653.html (accessed on 20 March 2022).
- Xu, M.; Wang, C. Research on the evaluation system of historical and cultural block renewal based on multi-source data: Taking the historical and cultural blocks of guangdong province as an example. Urban Dev. Stud. 2019, 26, 74–83. Available online: https://www.cnki.com.cn/Article/CJFDTotal-CSFY201902011.htm (accessed on 20 March 2022).
- Wang, M.; Liao, S. Investigation of Sustainable Development Mode of Buildings in Historical Site Based on Ahp and Arcgis. In Proceedings of the 2019 IEEE Eurasia Conference on Biomedical Engineering, Healthcare and Sustainability, ECBIOS 2019, Okinawa, Japan, 31 May–3 June 2019; Institute of Electrical and Electronics Engineers Inc.: Okinawa, Japan, 2019; pp. 127–129. [Google Scholar] [CrossRef]
- Anjuke. Available online: https://suzhou.anjuke.com/ (accessed on 20 March 2022).
- Hsu, W.-L.; Shen, X.; Xu, H.; Zhang, C.; Liu, H.-L.; Shiau, Y.-C. Integrated evaluations of resource and environment carrying capacity of the huaihe river ecological and economic belt in china. Land 2021, 10, 1168. [Google Scholar] [CrossRef]
- Ahmad, F.; Goparaju, L. Analysis of urban sprawl dynamics using geospatial technology in ranchi city, jharkhand, india. J. Environ. Geogr. 2016, 9, 7–13. [Google Scholar] [CrossRef] [Green Version]
- Gutiérrez, J.; García-Palomares, J.C. Distance-measure impacts on the calculation of transport service areas using gis. Environ. Plann. B Plann. Des. 2008, 35, 480–503. [Google Scholar] [CrossRef]
- ArcGIS. Available online: https://www.esri.com/en-us/arcgis/about-arcgis/overview?rsource=%2Fsoftware%2Farcgis (accessed on 20 March 2022).
- Jenks, G.F. The data model concept in statistical mapping. Int. Yearb. Cartogr. 1967, 7, 186–190. Available online: https://ci.nii.ac.jp/naid/10021899676/ (accessed on 20 March 2022).
- McMaster, R. In memoriam: George f. Jenks (1916–1996). Cartogr. Geog. Inf. Syst. 1997, 24, 56–59. [Google Scholar] [CrossRef]
- MHURD. Code for Transport Planning on Urban Road; China Planning Press: Beijing, China, 1995. [Google Scholar]
- Implementation Rules on Strengthening Plot Ratio Management and Comprehensively Promoting High-Quality Utilization of Land Resources (2020 Edition). Available online: http://xxgk.shmh.gov.cn/mhxxgkweb/html/mh_xxgk/xxgk_ghj_zhzw_zcwj_zcjd_tj/2021-02-26/Detail_103496.htm (accessed on 20 March 2022).
- Spatial Planning Guidance: Community Life Unit. Available online: http://gi.mnr.gov.cn/202106/t20210616_2657688.html (accessed on 20 March 2022).
- MHURD. Standard for Planning and Design of Urban Residential Areas; China Architecture & Building Press: Beijing, China, 2018. [Google Scholar]
- Saaty, T.L. What is the analytic hierarchy process? In Mathematical Models for Decision Support; Springer: Berlin/Heidelberg, Germany, 1988; pp. 109–121. [Google Scholar]
Figure 1.
Location and spatial distribution of the residential buildings in the Historic City of Suzhou.
Figure 1.
Location and spatial distribution of the residential buildings in the Historic City of Suzhou.

Figure 2.
Status of the residential buildings: (a) typical traditional residential buildings near the river; (b) residential building with poor internal living environment; (c) multi-story residential buildings with dirty external environment.
Figure 2.
Status of the residential buildings: (a) typical traditional residential buildings near the river; (b) residential building with poor internal living environment; (c) multi-story residential buildings with dirty external environment.

Figure 3.
Research framework of residential building renewal.

Figure 4.
Identification method for renewal type of residential buildings: (a) high renewal demand; (b) moderate renewal demand; (c) low renewal demand. Color Gray: regardless of renewal demand, land lots requiring strict preservation were classified into the IP category, and land lots with high preservation constraint and low development potential were classified into the CP category; Color purple: MP category; Color green: MB category; Color red: PD category; Color blue: CP category other than gray; Color orange: MD category.

Figure 5.
Grade distribution of each index of renewal demand: (a) renewal demand; (b) architectural quality; (c) architectural style; (d) architectural age; (e) per household living area; (f) greening rate.
Figure 5.
Grade distribution of each index of renewal demand: (a) renewal demand; (b) architectural quality; (c) architectural style; (d) architectural age; (e) per household living area; (f) greening rate.

Figure 6.
Grade distribution of each index of development potential: (a) development potential; (b) distance from a trunk road; (c) accessibility of a subway station; (d) distance from a river; (e) accessibility of an open space; (f) accessibility of neighborhood facilities; (g) development efficiency.

Figure 7.
Grade distribution of preservation constraint.

Figure 8.
Grade distribution of renewal type: (a) proportional distribution; (b) space distribution.
Figure 8.
Grade distribution of renewal type: (a) proportional distribution; (b) space distribution.


Table 1.
The assessment index system of the demand–potential–constraint model.
| Objective Layer | Dimension Layer | Weights | Index Layer | Weights | Detailed Calculated Method |
|---|---|---|---|---|---|
| Renewal demand | Architectural status | 0.70 | Architectural quality | 0.38 | Classification of construction quality |
| Architectural style | 0.29 | Classification of whether a building exhibits traditional Suzhou-style architectural features | |||
| Architectural age | 0.04 | Classification of construction time | |||
| Living environments | 0.30 | Per household living area | 0.11 | Ratio of the total residential floor area to the total number of houses in the land lot | |
| Greening rate | 0.19 | Ratio of the green space area to the land-use area in the land lot | |||
| Development potential | Location conditions | 0.78 | Distance from a trunk road | 0.17 | Distance from an arterial or a secondary trunk road |
| Accessibility of a subway station | 0.34 | Service Area of a subway station | |||
| Distance from a river | 0.03 | Distance from a river | |||
| Accessibility of an open space | 0.10 | Service Area of a park or a square | |||
| Accessibility of neighborhood facilities | 0.13 | Service Area of an elementary school, a general hospital, or a stadium | |||
| Development efficiency | 0.22 | Development efficiency | 0.22 | Ratio between the floor area ratio and the building density for a land lot divided by the standard ratio | |
| Preservation constraint | Historical preservation requirement | - | Historical preservation level | - | Grade according to the classification of historical assets meriting preservation as well as relevant preservation plans implemented |
Publisher’s Note: MDPI stays neutral with regard to jurisdictional claims in published maps and institutional affiliations. |
© 2022 by the authors. Licensee MDPI, Basel, Switzerland. This article is an open access article distributed under the terms and conditions of the Creative Commons Attribution (CC BY) license (https://creativecommons.org/licenses/by/4.0/).
Share and Cite
MDPI and ACS Style
Wang, M.; Yang, J. Sustainable Renewal of Historical Urban Areas: A Demand–Potential–Constraint Model for Identifying the Renewal Type of Residential Buildings. Buildings 2022, 12, 1210. https://doi.org/10.3390/buildings12081210
AMA Style
Wang M, Yang J. Sustainable Renewal of Historical Urban Areas: A Demand–Potential–Constraint Model for Identifying the Renewal Type of Residential Buildings. Buildings. 2022; 12(8):1210. https://doi.org/10.3390/buildings12081210
Chicago/Turabian StyleWang, Min, and Jianqiang Yang. 2022. "Sustainable Renewal of Historical Urban Areas: A Demand–Potential–Constraint Model for Identifying the Renewal Type of Residential Buildings" Buildings 12, no. 8: 1210. https://doi.org/10.3390/buildings12081210
Note that from the first issue of 2016, this journal uses article numbers instead of page numbers. See further details here.