
An Air Conditioning Design Strategy of the Stepped Hall Based on Building Performance Simulation


Department of Architecture, National Cheng Kung University, Tainan 701, Taiwan
*
Author to whom correspondence should be addressed.
Buildings 2022, 12(8), 1269; https://doi.org/10.3390/buildings12081269
Submission received: 12 July 2022
/
Revised: 13 August 2022
/
Accepted: 17 August 2022
/
Published: 19 August 2022
(This article belongs to the Special Issue Building Performance Simulation)
Abstract
:This study proposed an improved air conditioning design strategy based on building performance simulation for a stepped hall. The air velocity and air change rate of the case were measured on-site, which were compared with the simulation data to verify the reliability of the building simulation model. Then, the fully mixing ventilation scheme and the design schemes proposed in this study were simulated. Finally, the building simulation results were summarized to confirm the applicability of the air conditioning design strategy. The building performance results showed that the air distribution performance index (ADPI) value was 76.95% in the original case. Nevertheless, the effective draft temperature (EDT) in the middle seat area exceeded the standard value, indicating that a local cold shock would occur. Moreover, its scale for ventilation efficiency (SVE6) in the residential area was 2.54. However, the SVE6s in the other schemes were between 0.89 and 0.92. It means that the proposed schemes only needed to take one-third of the time to exhaust air. These three indicators’ visualization results can analyze the advantages and disadvantages of each scheme. Therefore, the improved building performance simulation strategy could inspect the design effect and give suggestions quickly for air conditioning design.
1. Introduction
1.1. Background and Literature Review
In the past decades, building performance simulation has become a promising method in dealing with complex building problems [1,2]. Computational fluid dynamics (CFD) has been widely used in the numerical study of indoor air conditioning effects [3]. Moreover, proper design of the heating, ventilation, and air conditioning (HVAC) system can ensure a comfortable indoor environment [4,5]. For example, the audience in the stepped lecture hall needs good air quality and thermal comfort to obtain better audio-visual or learning effects. However, when designing the air conditioning system for such buildings, the design schedule is often urgent, and the budget is not large [6]. The geometric shape of the stepped space is different from that of the general rectangle, and the air volume increases from the high to the low level [7]. If the geometric characteristics are ignored in establishing the simulation model and air conditioning load calculation, the air outlets will be uniformly distributed in the ceiling in a general checkerboard arrangement [8]. The stepped geometric characteristics are also not treated separately in the air quality specification and air conditioning design manual [9]. Therefore, it can be combined with building performance simulation in the design stage to avoid uncomfortable air conditioning effects and energy waste [10].
In practice, the air conditioning system in the design stage only refers to the minimum ventilation volume and the upper limit of pollutant concentration in the specifications [11]. However, the different air change rates at different locations due to building height differences are not considered. Moreover, the air quality standards for the general hall are not applicable. Although the Federation of European Heating, Ventilation, and Air conditioning Associations (REHVA) published the air conditioning design manual applicable to stepped space, it still cannot complete an excellent environmental design due to the compact design schedule and short cost [12]. Generally, the air conditioning system of medium-sized stepped halls is fully mixed. However, for large space volumes, it is necessary to consider the particular geometry of stepped space. Because the air quality specification takes the air exchange rate as the measurement standard, it is easy to consider the improvement of the air exchange rate when the air quality is poor [13]. In this way, the impact of increased air output and air velocity on indoor comfort is ignored. Temperature stratification is quite significant in large spaces, which could cause a waste of energy and cannot ensure indoor comfort [14]. Especially in the stepped space, the residential area of the rear seat area is close to the air outlet on the ceiling, which is prone to cold shock and causes personal discomfort [15].
Furthermore, CFD has become a convenient tool for building performance simulations for studying the airflow in ventilated rooms [16]. Ho et al. [17] applied CFD simulation to compare the thermal environment of underground and overhead systems in the office and found that these systems maintained the same comfort level under certain conditions. Heidarinejad et al. [18] applied CFD simulation to assess the impact of the return air outlet location on the predicted average local air age and the average number of votes of the underground air conditioning office. The research proposed that setting the return air outlet 1.3 m above the floor could provide an acceptable thermal comfort environment. Ng et al. [19] applied response surface methodology and CFD simulation to conclude that the supply air temperature is the most critical design parameter in influencing the air distribution performance of underground offices. Moreover, the influence of exhaust diffuser locations and supply air is insignificant. Chiang et al. [20] conducted experiments in an office environment to compare the effect of diffuser location on the thermal stratification performance associated with applying these two systems. The research found that the diffuser can achieve similar performance if appropriately positioned.
In order to analyze the environmental factors related to air quality and thermal comfort and their spatial distribution, many environmental indicators were applied in the building performance simulation [19]. When considering the spatial uniformity of air velocity and temperature and its contribution to thermal comfort, the widely accepted and applied design index to quantify diffuser performance is the air distribution performance index (ADPI) [21]. Meanwhile, effective draft temperature (EDT) is the calculated temperature difference, combining the air temperature and air velocity [22]. Furthermore, ADPI is defined as the acceptable air velocity and temperature area percentage determined by measuring EDT in the total area, which has also defined the maximum acceptable velocity in the occupied area [23]. Liu et al. [24] proposed that for ceiling diffusers other than perforated and circular diffusers, the minimum set point can be decreased to less than 30% of the maximum flow rate without significantly reducing ADPI. Chen et al. [25] indicated that the window-integrated fan could significantly reduce the spread of infectious diseases and improve ventilation performance, resulting in the lowest infection probability of students sitting near the window of 11% and ADPI of 99%. Wang et al. [26] found that slightly high ADPIs could be obtained when the reversible room air conditioners were installed on the longer side of the bedroom and at a high level. Limane et al. [27] performed building performance simulations to evaluate the thermal comfort in the indoor space using EDT and the age of air. They found that comfort conditions can be achieved by varying the operating parameters of the HVAC system.
The scales for ventilation efficiency (SVEs) are the extension of the concept of ventilation efficiency [28]. Kato proposed new SVEs based on the spatial distribution of pollutant concentration and a numerical-simulation-based calculation procedure [29]. SVE 1~6 represents the average indoor concentration of pollutants, the diffusion radius of pollutants, the indoor air age, the influence range of air outlets, the influence range of exhaust outlets, and the residual lifetime of air, respectively [30]. Since SVE6 is the residual lifetime of air, which represents the time required for air to remain in the space until it is excluded and can be interpreted as the freshness of the air, it is selected as an air quality index in this study, which can be simulated by computational dynamic fluid dynamics software and presents its spatial distribution [31]. Zhang et al. [32] indicated that fluid flow and heat transport inside the cavity and the corresponding SVEs are significantly affected by the Grashof number, Reynolds number, and the spatial locations of heat sources and outlets.
1.2. Aims and Originality
This study used a stepped lecture hall as the research object. Based on the building performance simulation, several building performance indicators were applied to analyze air quality and thermal comfort in different HVAC configurations. It discussed the applicability of different air quality indicators and the effect of improving indoor air quality in such spaces. First, this study compared the differences between the air quality and thermal environment indicators in various design codes and selected the indicators that can show the environmental variation in the stepped space. Second, based on the proposed air-conditioning design strategy, this research analyzed the defects of the air-conditioning design strategy of fully mixing ventilation (FMV) in the stepped space. Finally, this study discussed several HVAC design schemes by building performance simulations to achieve the best air quality and thermal comfort in the stepped lecture hall. Therefore, the originality of this study lies in three aspects:
- The research analyzed various building performance indicators in an actual case of the stepped hall and screened the indicators applied to this type of building;
- The stepped space model was divided into different zones to study the performance of airflow, indoor air quality, and thermal comfort in different HVAC configurations.
2. Methodology
2.1. Overview
The methodology of this research can be divided into three parts. The first part compares actual measurement and simulation, in which the exhaust air exchange rate before and after the stepped lecture hall is measured to confirm that uneven air distribution exists. The air velocity in the residential area was measured to obtain the distribution and research data and then compared by the building performance simulation to confirm the reliability of the simulation model. In the second part, the improvement strategy of the air conditioning design strategy was proposed, which analyzes and compares the air quality, thermal comfort, air distribution, and other indicators. Then, it summarized the indicators that can be used to analyze the comprehensive air distribution in the air conditioning design strategy to improve the understanding of different indoor environments. The third part used the design strategy proposed in the second part to design a specific air conditioning design case. Then, it simulated and compared the original case with the improved cases, which could discuss the influence of design parameters through the results of comprehensive indices and conclude.
2.2. Field Study and Actual Measurement
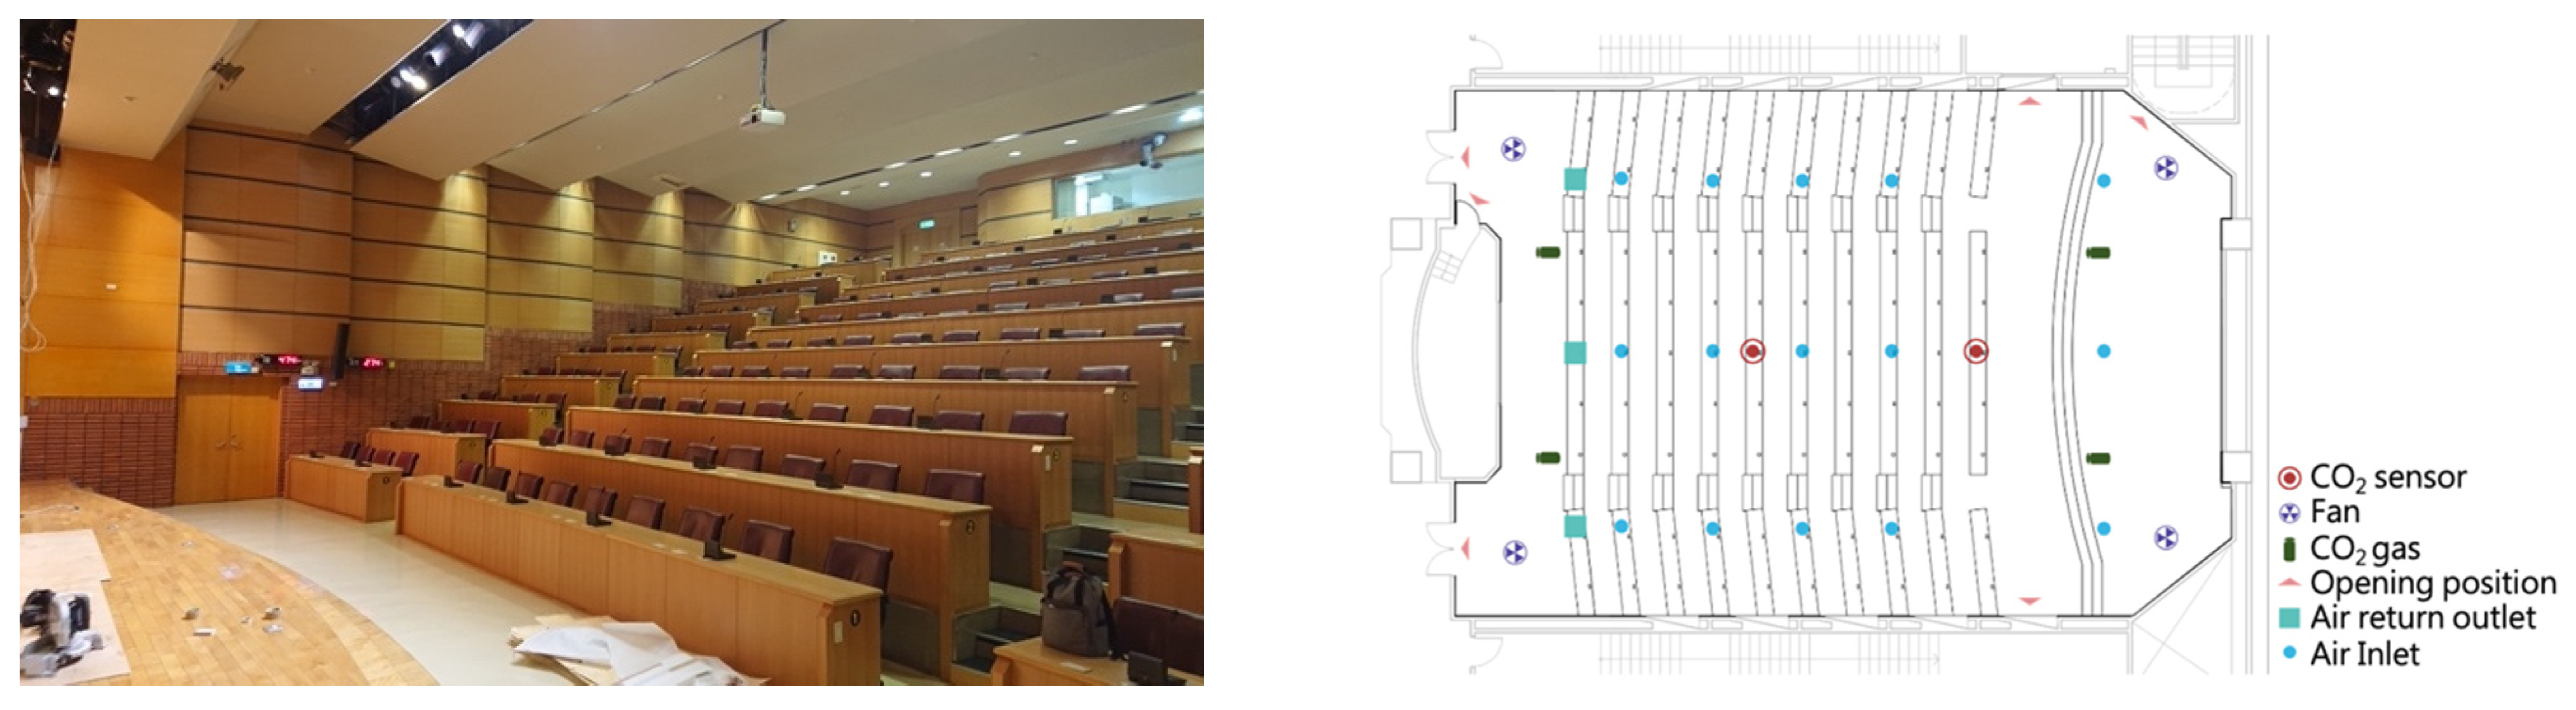
This research is based on a stepped-shaped hall at National Cheng Kung University (NCKU), Taiwan, as shown in Figure 1. Detailed information on the case building is shown in Table 1. The cube feet per minute (CFM), ft3/min, was used to evaluate the ventilation rate of the room [33]. Because the ceiling heights of the front and back rows of the stepped hall are different, the air volumes on both sides are also different. Therefore, it is speculated that the air exchange rate will change gradually, and the air quality will also be affected. Thus, the air change rate is measured to check whether the air quality distribution in the stepped space is uneven. The measured data were compared with the CFD simulation results to confirm the reliability of building performance simulation in reproducing the actual situation. At the same time, it can visualize the performance of air velocity and airflow in the stepped space and analyze the deficiencies of the existing air conditioning system.
2.2.1. Air Change Rate
Air change rate refers to the number of air changes per unit of time. It is calculated by dividing the air volume entering the room per unit time (m3/h) by the room volume (m3). If the room ventilation mode is uniform air supply or fully mixed air supply, the ventilation frequency is an index to evaluate the indoor air ventilation frequency.
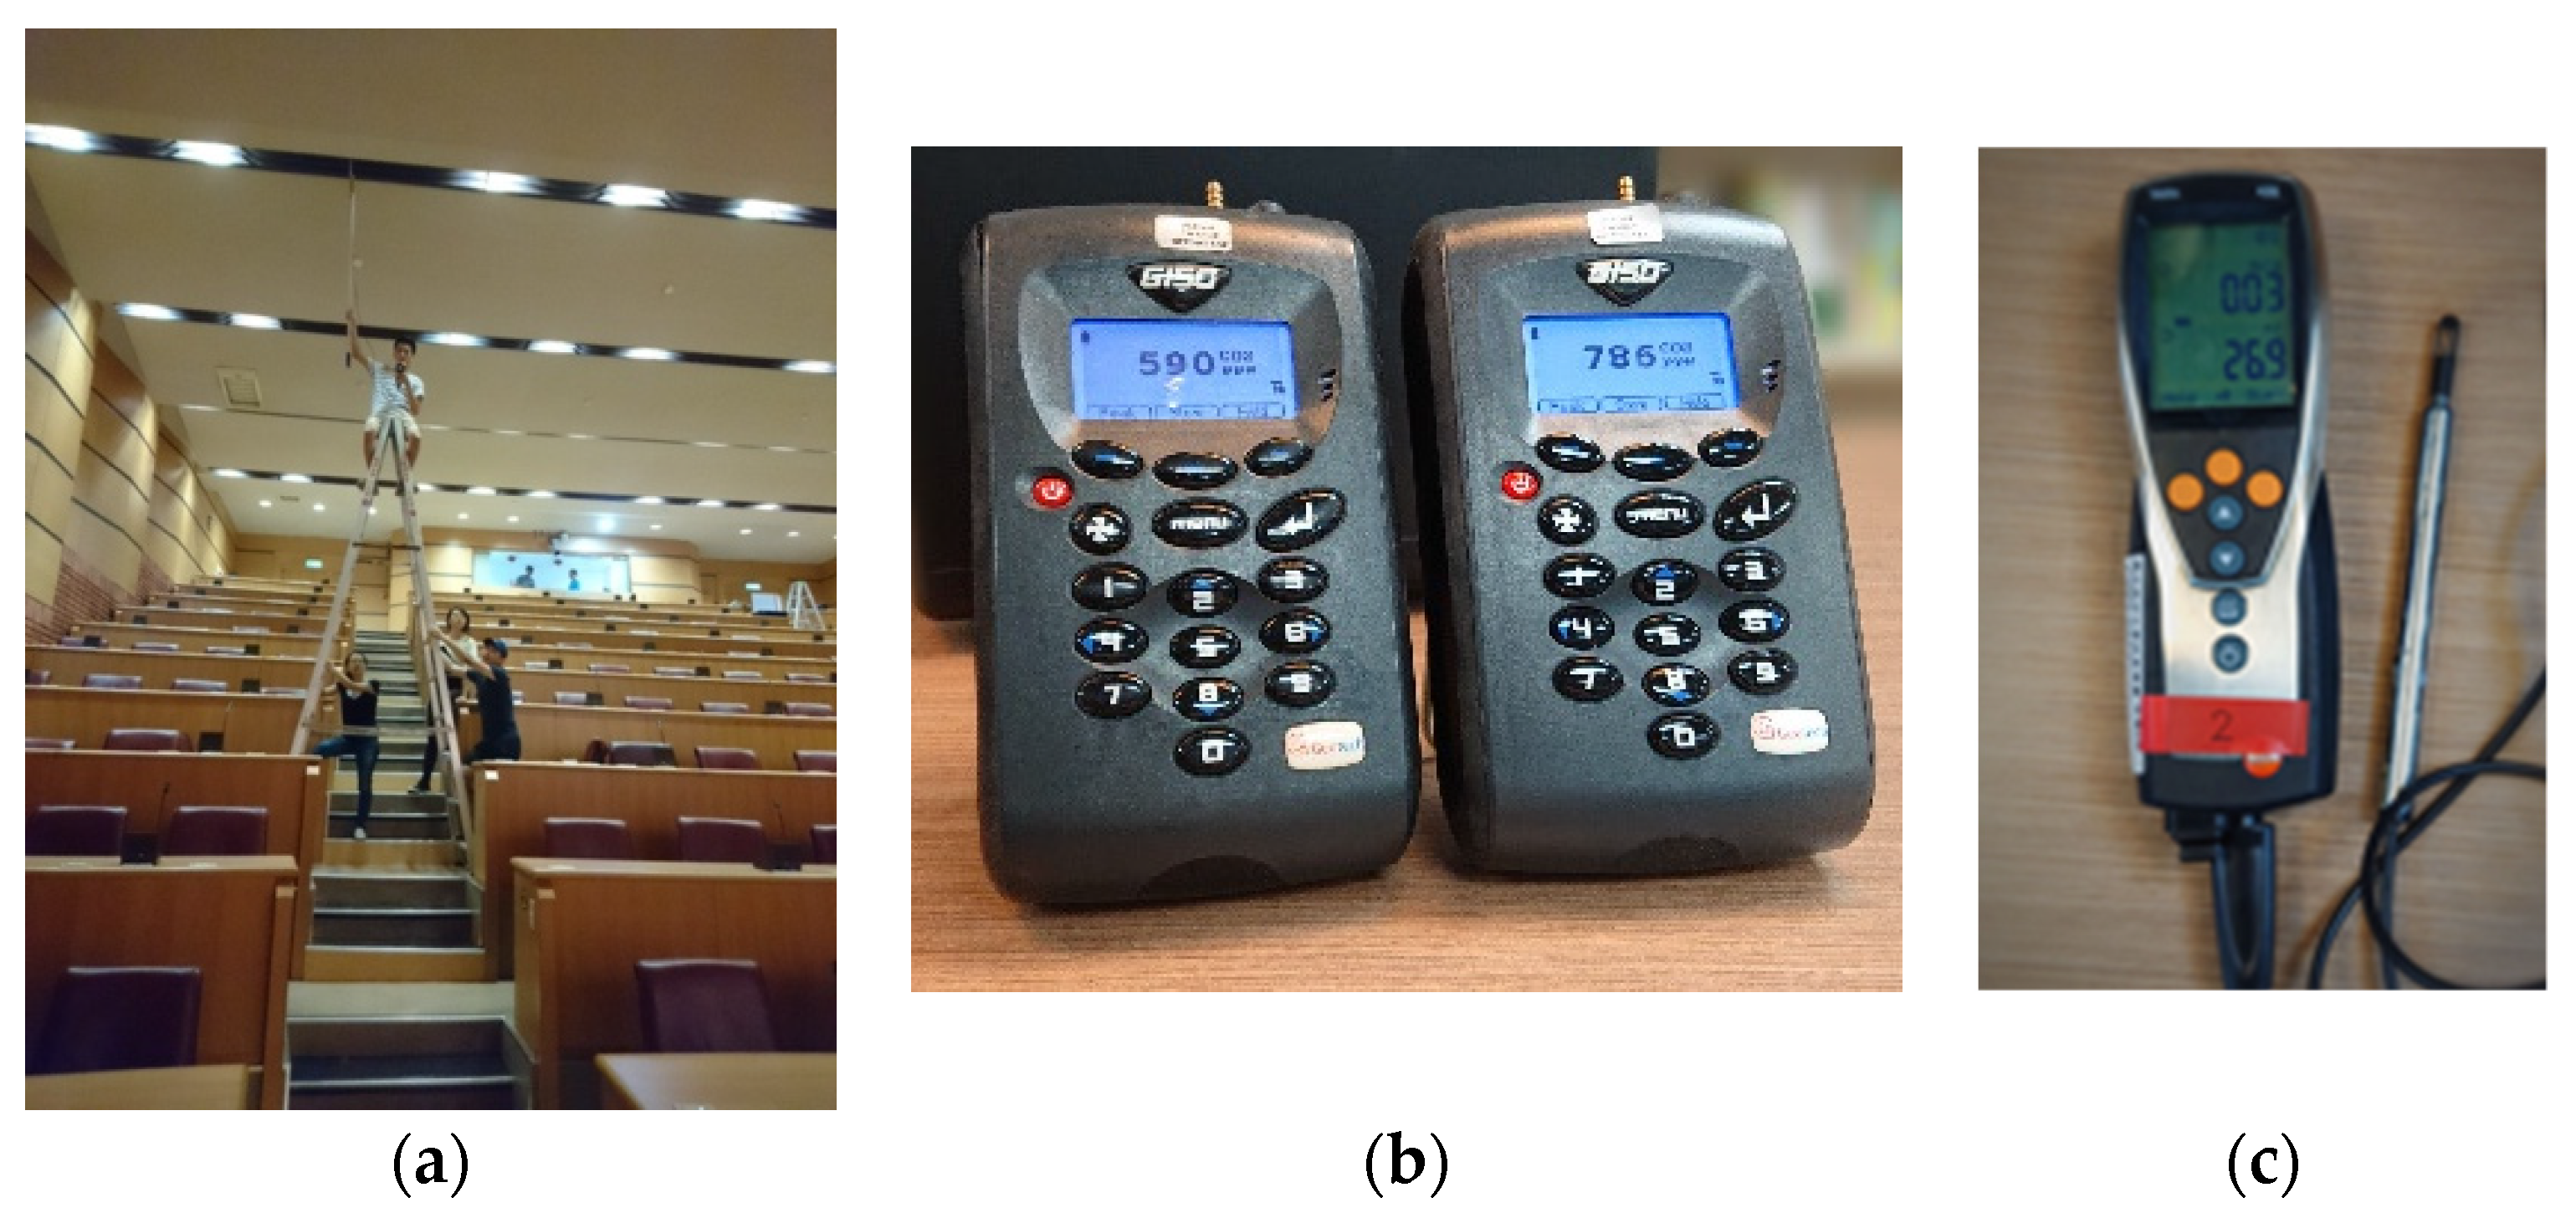
The tracer gas attenuation method of ASTM e741-00 (2006) was used to measure the air exchange rate in the rear and front seat areas [34]. CO2 was used as the tracer gas, and the measuring instrument was a Geotech G150 CO2 sensor. Its measurement accuracy reached 0.1 ppm. The measurement position was 1.2 m from the ground, the breathing height when people were sitting. The ventilation rate was obtained by calculating the logarithmic slope of the tracer gas decay curve over time [35], as shown in Equation (1).
where is the CO2 concentration of at time , ppm; is the background concentration of CO2, ppm; is the concentration of CO2 when = 0, ppm; is duration time, hr; is the air change rate, h−1.
During the measurement, the air conditioning system was turned off to fill the indoor space with tracer gas, and then a fan was used to mix the indoor air evenly. When the CO2 concentration reached 6000 ppm, the air conditioning system was turned on to discharge the tracer gas. According to the location of the points, the sensor was set 1.2 m above the ground to measure each point. In order to avoid the error caused by the unstable and unbalanced air flow when the air conditioner is turned on, the air conditioning data after stabilization were used for analysis in this study.
2.2.2. Air Velocity and Temperature
The hot wire anemometer (TESTO 435-2) was used for air velocity and temperature measurement, as shown in Figure 2. The measurement accuracy of its probe reaches 0.01 m/s and 0.1 °C. In order to study the spatial distribution of air velocity and temperature, point measurement was carried out in the residential area, and the points were evenly distributed at the breathing height of about 1.2 m when sitting. The air velocity data of the air inlet and air return outlet are necessary boundary conditions for building performance simulation. The diffusers are divided into four quadrants for measurement to increase accuracy, respectively. Based on the boundary conditions of the actual case, the simulation model was established, which could simulate the air velocity and temperature data of the residential area. Compared with the measured data, it can be used as the basis for the reliability of the building performance simulation model. The comparison between the measured data and the simulated data can increase the reliability of the simulation model.
2.3. Building Performance Simulation
2.3.1. Software Application
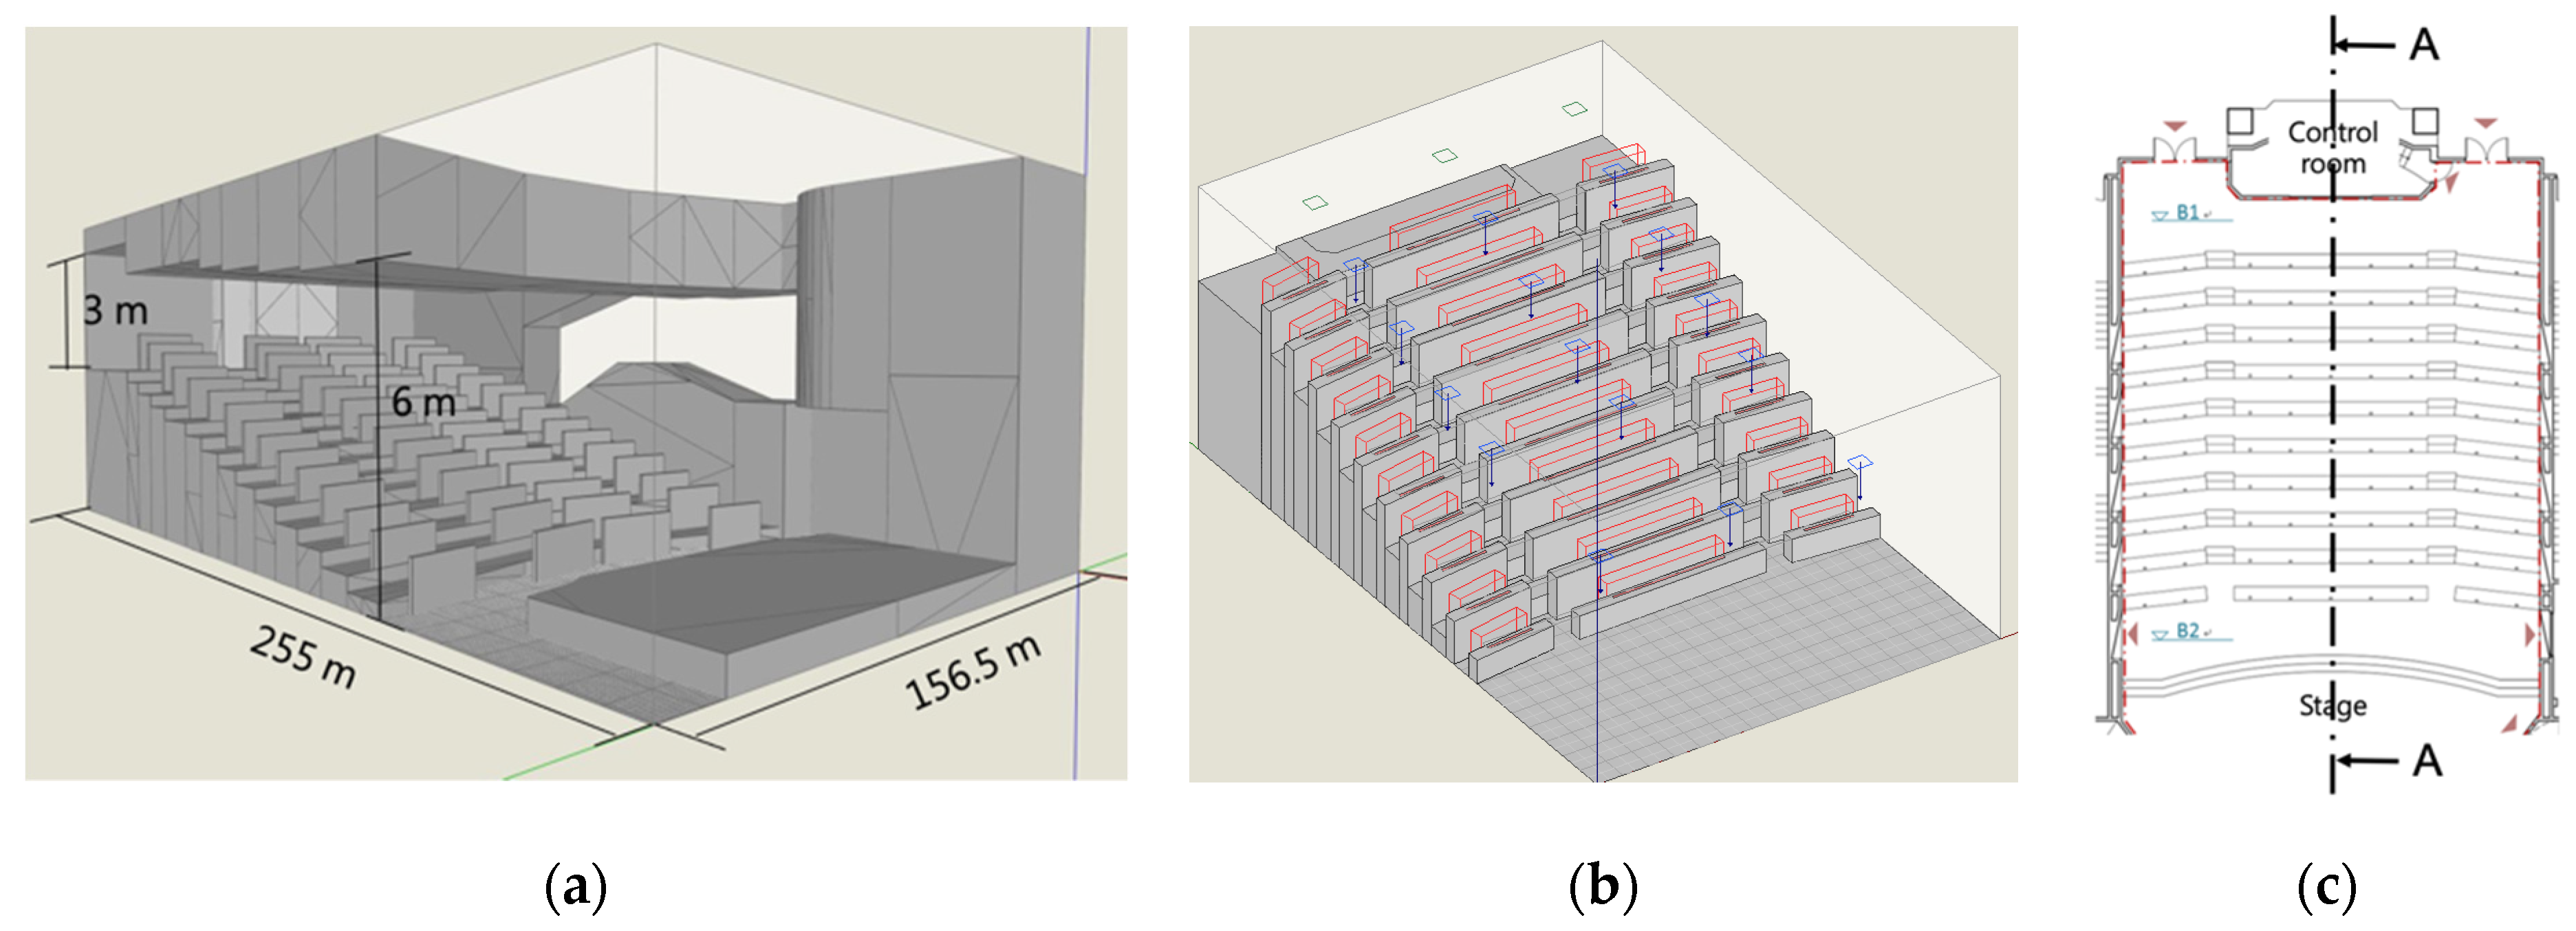
The building performance simulation software AKL FlowDesigner (Professional Edition) was applied in this study, a computational fluid thermal analysis software developed by Advanced Knowledge Laboratory Inc. in Japan [36]. It can import a variety of industry modeling tools such as Rhinoceros and SketchUp to simulate 3D models of buildings. It can visualize the design results of the case building for architects and engineers in the design stage to shorten the time of modifying the design. The building simulation model of the case building is shown in Figure 3. All profile analyses in this study are based on the location of cross-section A in Figure 3c. Then, the study compared the measured air velocity data with the simulated air velocity to confirm that the model was reliable. Finally, this research applied the air distribution index to analyze the indoor and thermal environment to explore the suitable air conditioning configuration for the case hall.
This study used the Reynolds averaged numerical simulation (RANS) [37]. RANS used the turbulence transport model to carry out statistical averaging or time averaging of the fundamental equations of the fluid. Only the average fluid was used as the analytical object, and the flow of the difference between the average and the RANS was simulated by means of approximate solutions [38]. The standard k-ε model with high Reynolds numbers in the computational simulation software FlowDesigner was used in this study [39]. The standard k-ε model was developed on the basis of a large number of experiments and analyses, which has a high Reynolds number in the software. This model can represent a wide range of situations. The turbulence length scale is a physical quantity that shows the size of large eddies containing energy in turbulence. It is usually applied to estimate the turbulence characteristics of inlets in CFD simulation. The setting factors are turbulence intensity and turbulence length scale , as shown in Equations (2)–(7).
where is the turbulent energy, m2/s2; is the average air velocity at the air inlet, m/s; is the turbulence intensity, %; is the turbulent dissipation rate, m2/s3; is the model constant, 0.09; is the root mean square of local air velocity disturbance; is the instantaneous air velocity, m/s; is the average air velocity, m/s; is the number of samples; is the turbulence length scale, m; is the hydraulic diameters, m; is the length of air inlet, m; and is the width of air inlet, m.
The grid system of this study adopts orthogonal grid points. It densifies the grid spacing before and after the location close to the pollution source, air inlet, air return outlet, seating area, and working area to obtain better flow field analysis ability and achieve good convergence conditions. Moreover, the convergence standard set in this study is that if the ratio of residual value to is not greater than 10−3, the simulation calculation result is judged to be convergent [40]. The formula of this convergence standard can be shown in Equation (8).
where the is the value used in the next iteration calculation, is the residual value, and is the reference value.
Generally speaking, the precision of the grid directly affects the analytical ability of the flow field, and the more precise grid has a better analytical ability for the flow field. However, this case is a large-scale space building, and the precise grid also requires a long computing time. Therefore, this study considers the calculation time, computer processing capacity, and the accuracy and stability of the calculation results. Based on the ability to calculate the characteristics of different air inlets and the contour of obstacles in the space, the total number of cells in each simulation case is between 40,000 and 60,000 in the whole domain in the whole domain [41,42]. Meanwhile, the grid accuracy is improved to 0.4 m per grid in the occupied zone.
2.3.2. Combinations of Air Inlets and Outlets
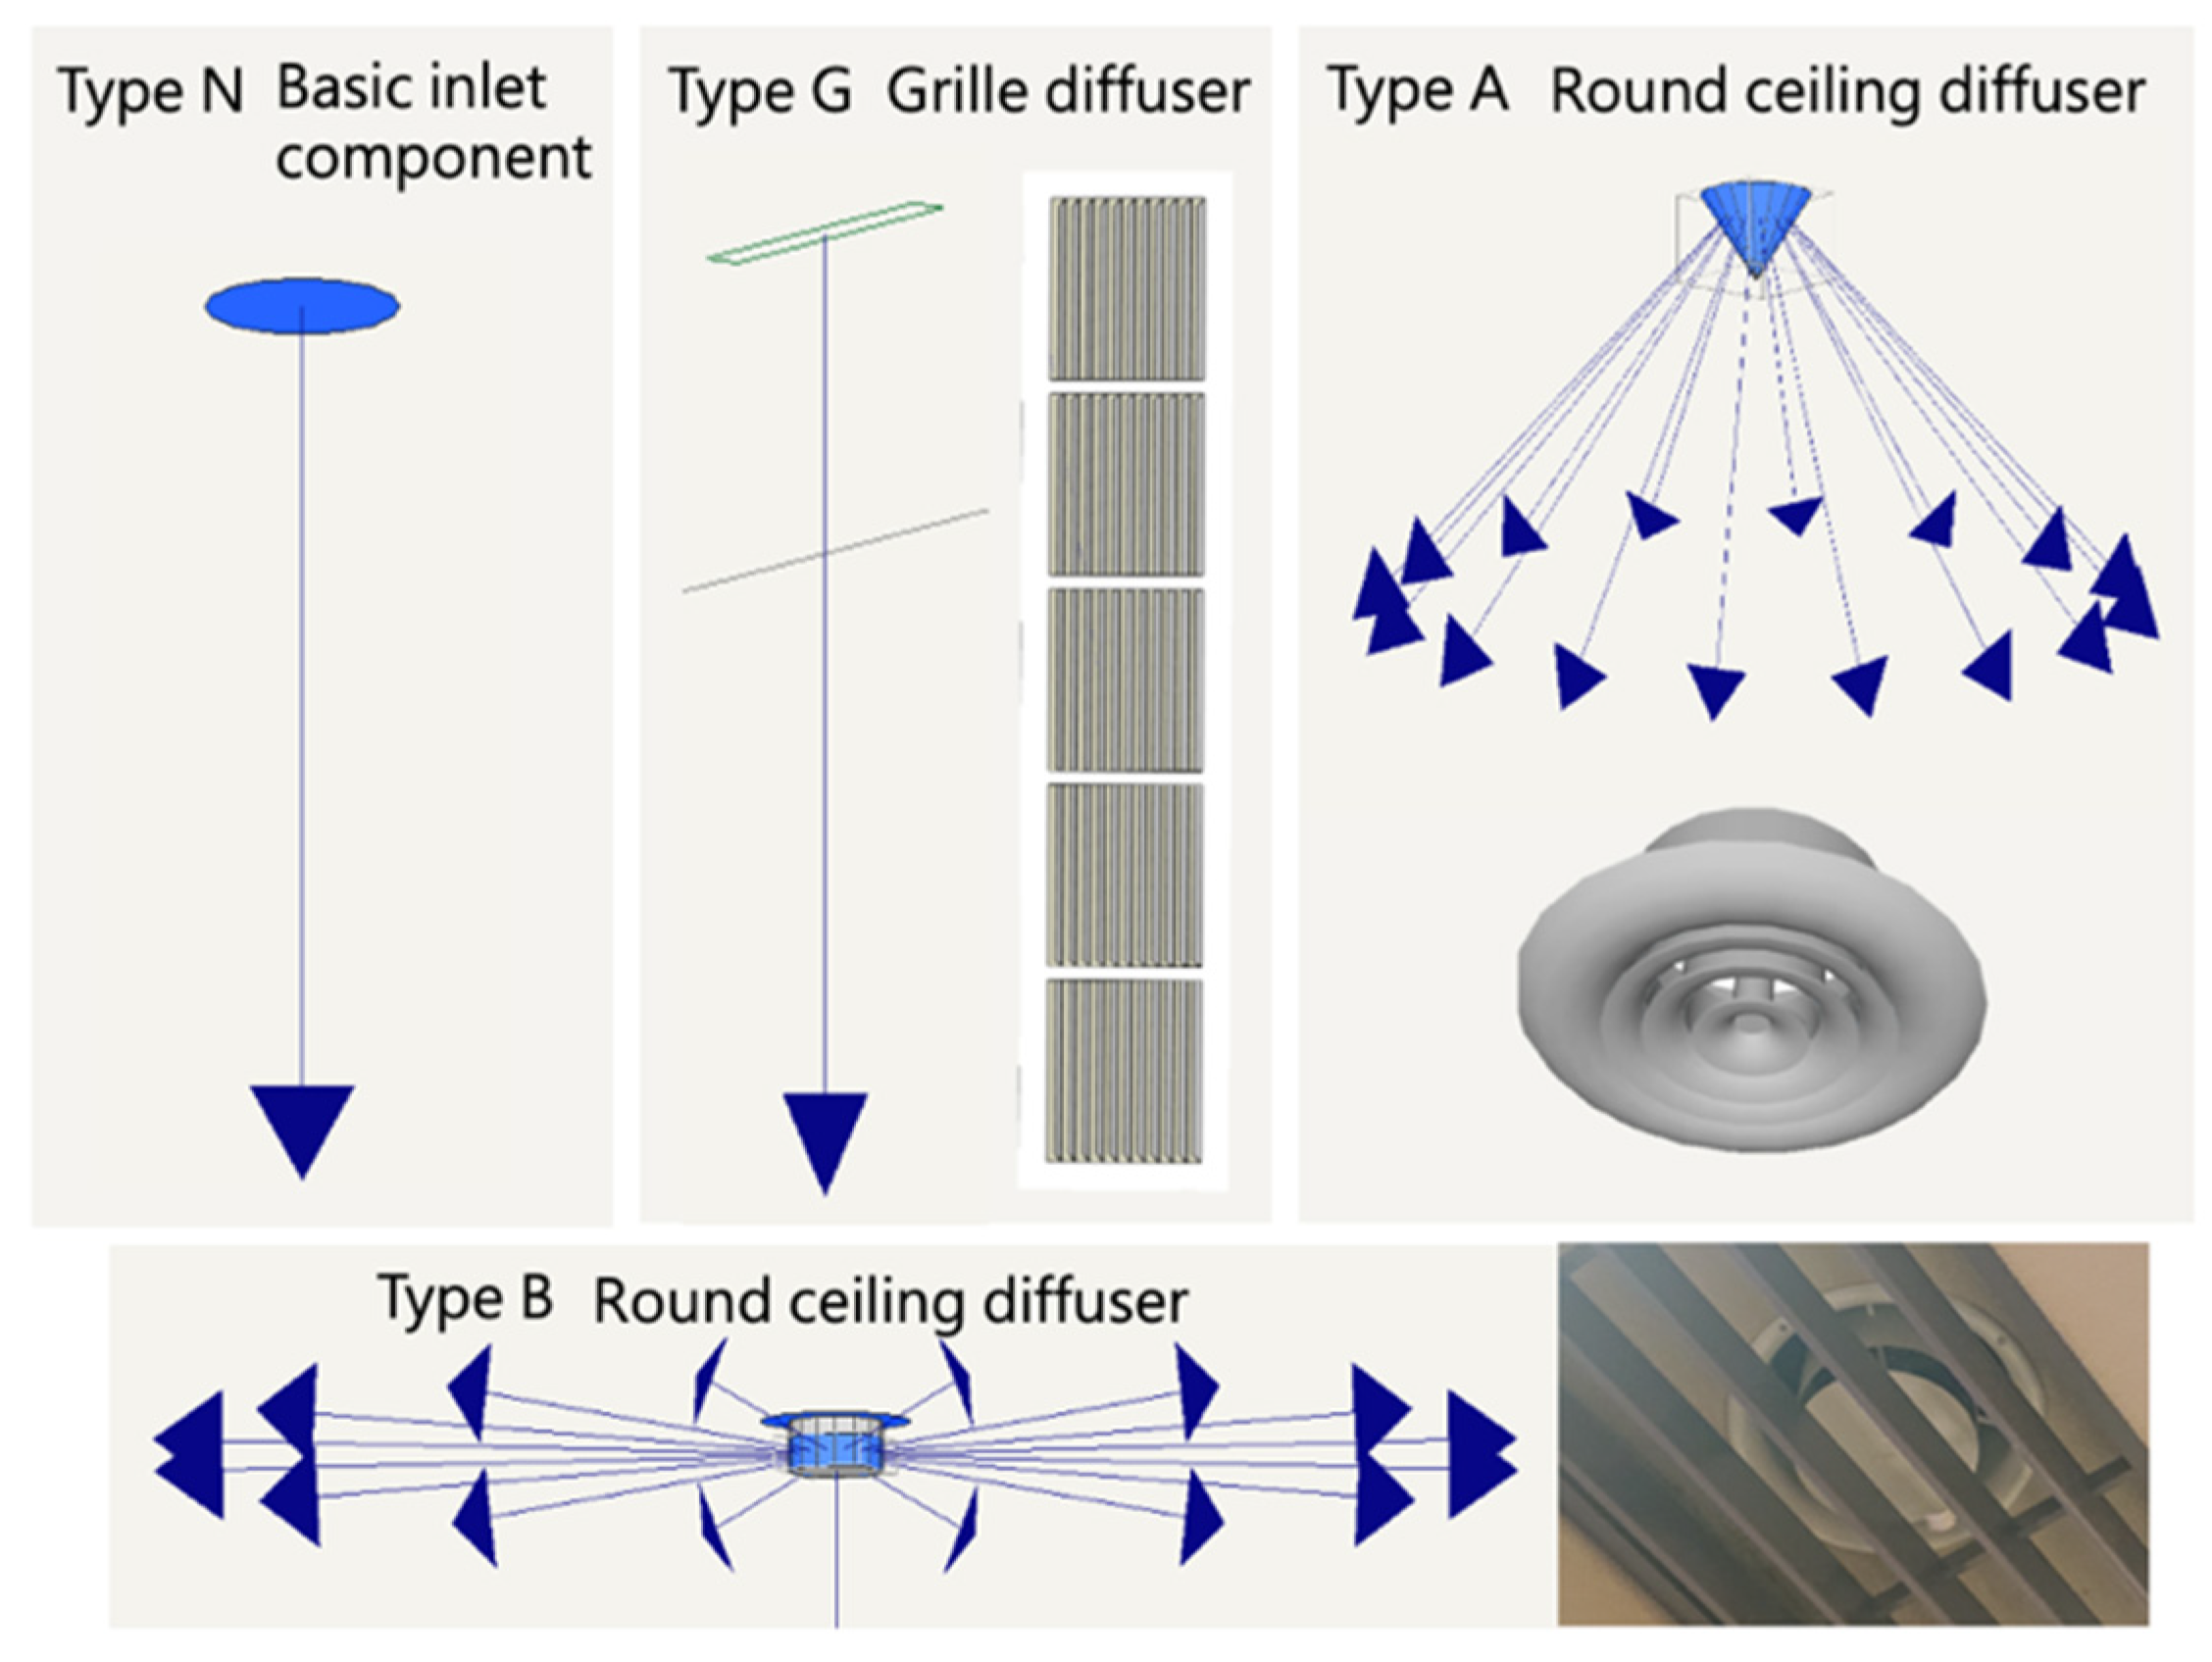
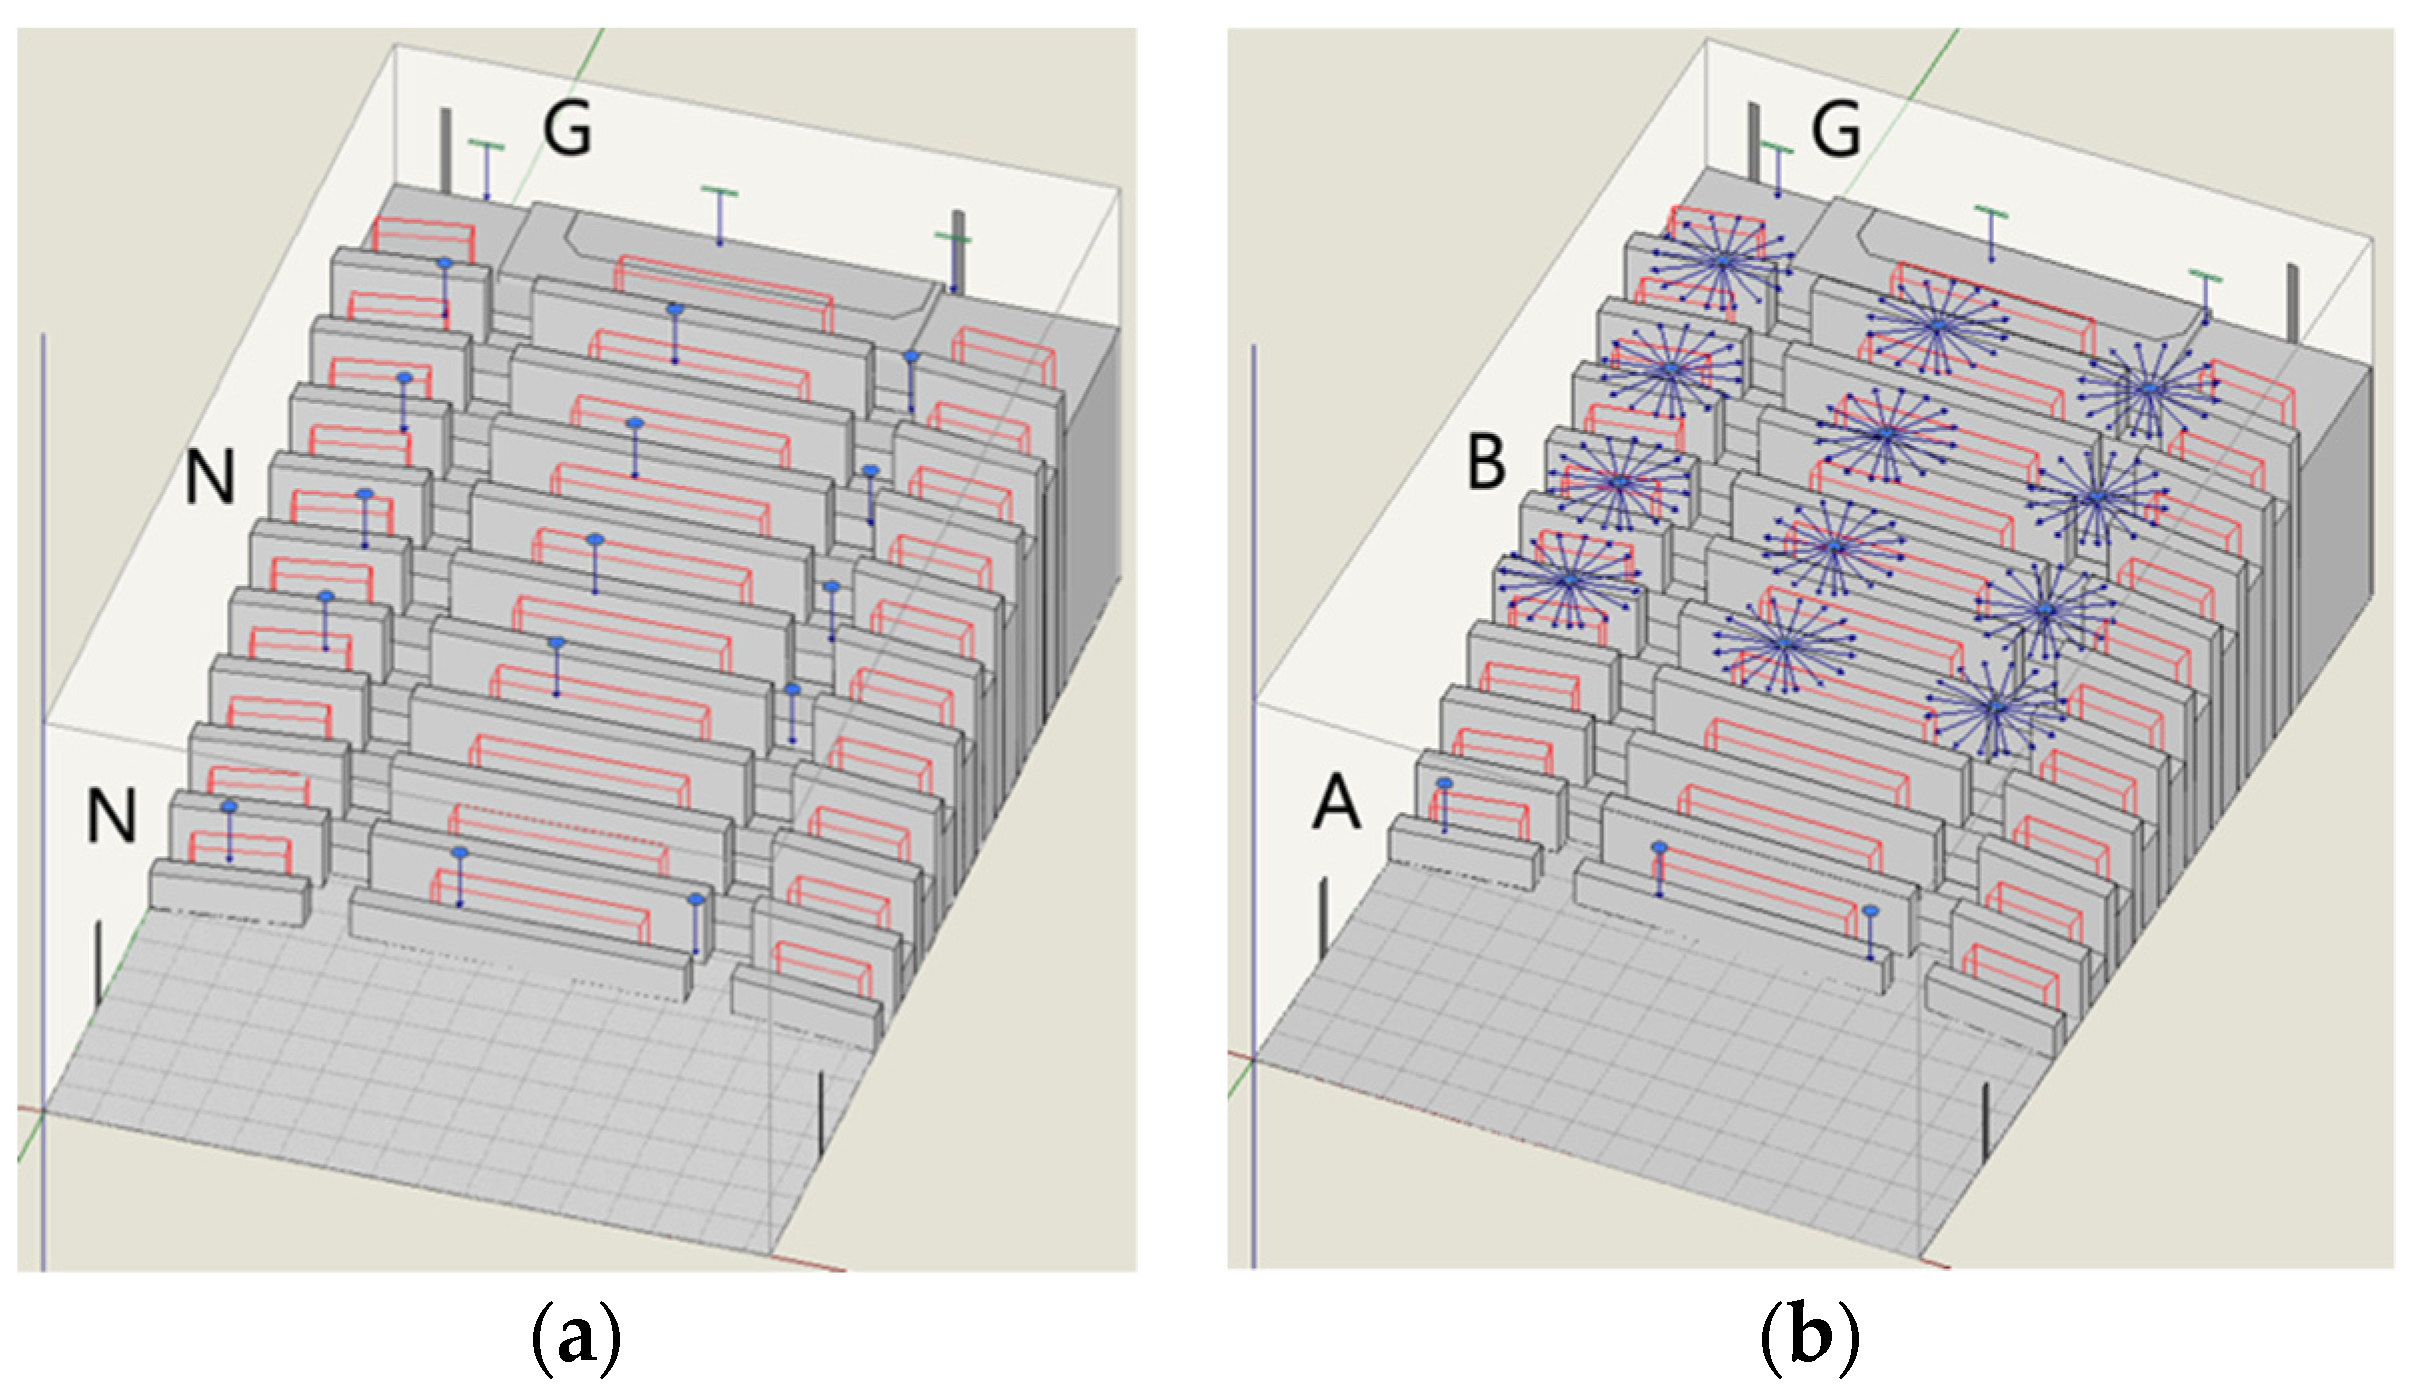
In order to make the model simulation close to the actual situation, two inlet schemes are applied for simulation. Figure 4 shows different types of air inlets in the model. Figure 5 shows the distribution of air inlets in the model. Because the model details of different air inlets significantly impact the air distribution and thermal comfort. This study used different air inlets and applied the diffuser simulation model according to the measured cases. The single-plane air inlets are applied in the first scheme, including 15 circular and 3 rectangular air inlets. On the other hand, the air inlets with the diffuser are used in the second scheme, including 3 concentric diffusers, 12 cylindrical diffusers, and 3 rectangular air inlets. The dissipation rate and other model information are set based on the measured data. Table 2 shows the boundary conditions of each scheme.
2.4. Comprehensive Assessment Index
The evaluation indexes used in this study need to reflect the air distribution, ventilation effect, and pollutant concentration of the air conditioning system. Table 3 compares air and thermal environment assessment indicators, with detailed advantages and disadvantages for selection [21,27,29,43,44]. SVEs, EDT, and ADPI were selected as evaluation indexes in this study. EDT is one of the definitions of comfortable ADPI environmental conditions. Therefore, the area with excessive air velocity can be selected as the analysis index of thermal comfort spatial distribution.
As for the thermal comfort index, when the air conditioning system can provide an environment with ADPI up to 80%, the PMV distribution range of occupants is between −0.5 and 0.5. ADPI is defined as the percentage of measurement points that meet the comfort requirements in the occupied zone (1.8 m above the ground and 0.5 m away from the wall). The temperature and air velocity data obtained from the average distribution measurement points are used as the basis for the air distribution performance of the air conditioning system. The criterion of comfort requirements is that the air velocity is less than 0.35 m/s, and EDT changes between −1.7 and 1.1 K. ASHRAE Handbook Fundamentals suggested that the air conditioning system should provide an air distribution effect with ADPI greater than 80% [45]. When EDT is positive, the temperature feels warmer, while negative values are the opposite. The calculation of EDT is shown in Equation (9):
where is the effective draft temperature, K; is local air stream dry-bulb temperature, °C; is average (set-point) room dry-bulb temperature, °C; and is the local airstream centerline velocity, m/s.
Among SVEs, SVE6 is selected to show the time required for air discharge, which could compare the ability of different air conditioning configurations to discharge fresh air. It is equivalent to presenting the efficiency of local air exchange in space as the analysis index of air quality distribution [46]. The formula of SVE6 is shown in Equation (10):
where is the instantaneous uniform diffusion concentration, kg/m3, and is the pollutant concentration at position X after inverse solution of time, kg/m3.
2.5. Air Conditioning Configuration Design Strategy
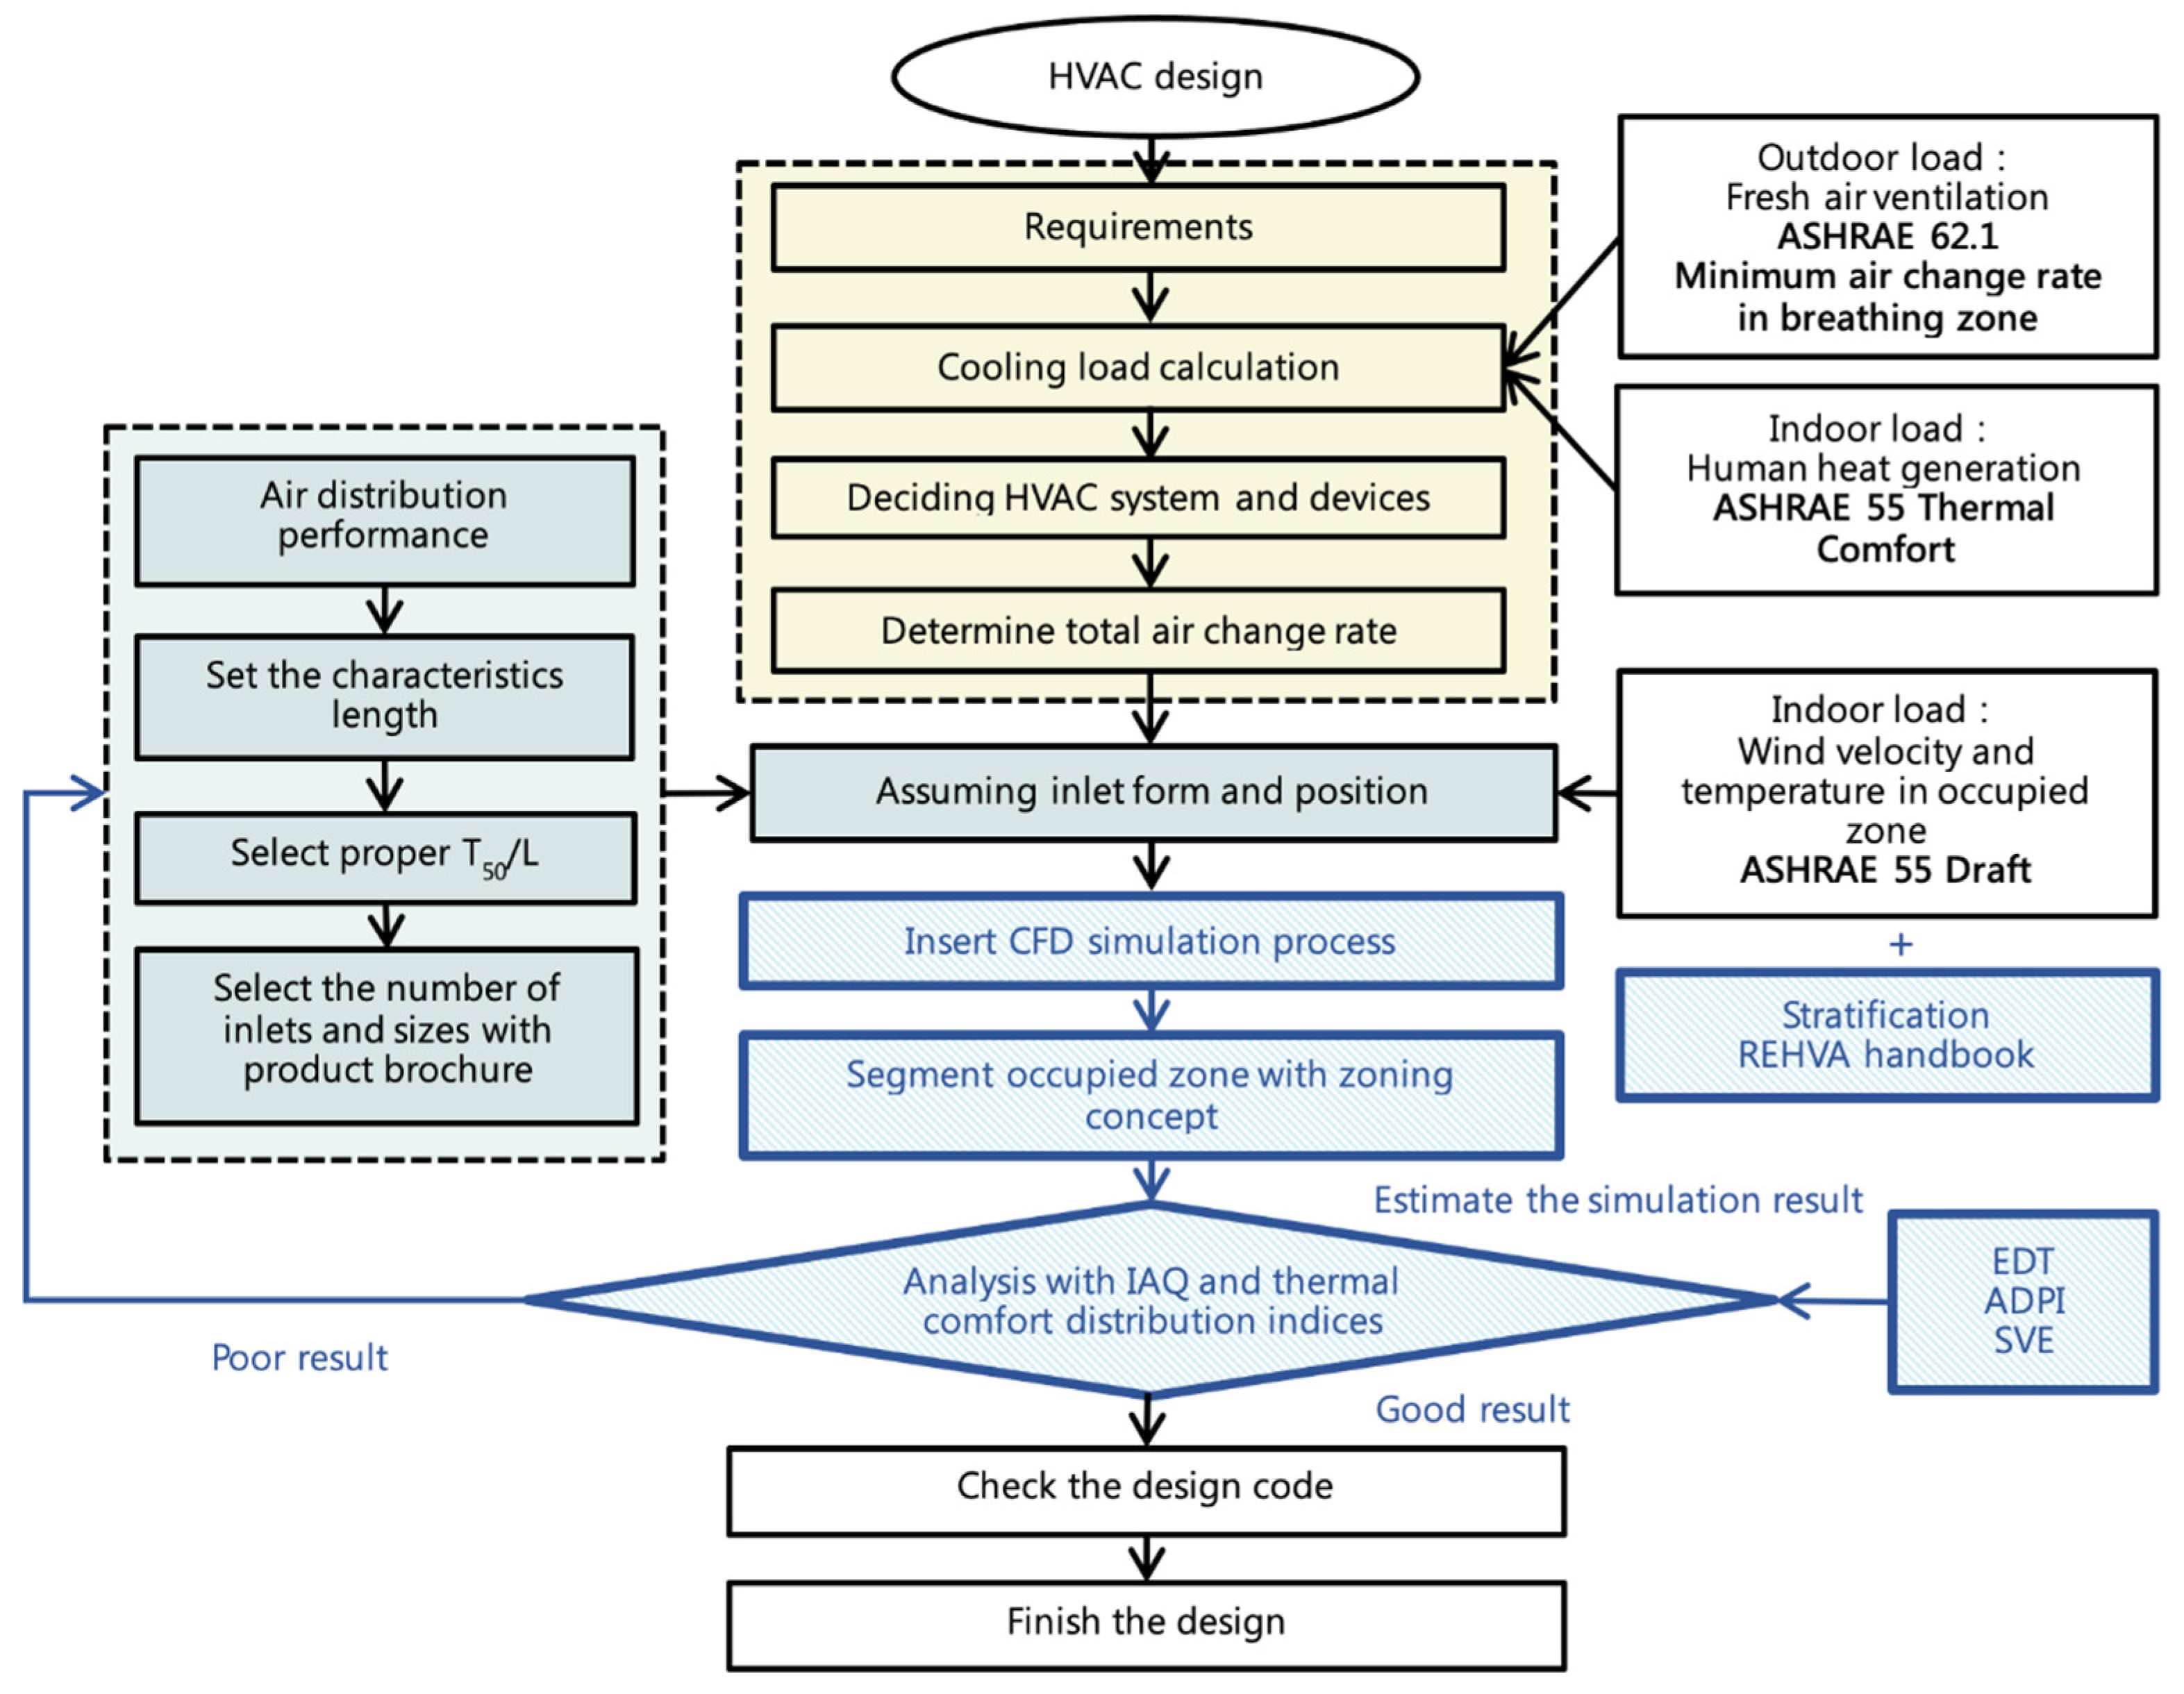
The design strategy of air conditioning configuration based on building performance simulation can be divided into six steps, as shown in Figure 6. First, it needs to calculate the total air volume demand from the essential data. Second, the diffuser type and influence range are set to obtain the diffuser’s spatial characteristic length and individual air output. Third, the researcher needs to select the proper T50/L. Fourth, it calculates the vertical falling elevation at the top of the ceiling and obtains the appropriate air velocity range. Fifth, it needs to select the diffuser that meets the air volume, air velocity, and range conditions of the manufacturer. Finally, the researcher needs to run the simulation strategy and discuss the results of each indicator. This study further refines the simulation strategy put into the current air conditioning design strategy, which is more suitable for complex spaces than other research processes [47]. The first step is to simulate the air conditioning equipment configuration assumed in the planning stage and analyze its air distribution. Then, the concept of zoning is added to the design process, and the comprehensive evaluation indexes are applied to check whether the scheme meets the air quality and comfort requirements. If the original scheme cannot meet the requirements, more schemes will be proposed to obtain the best solution for balancing the air and thermal environment conditions.
Because of the particular geometry of the stepped hall, the configuration of the air inlet and the selection of the diffuser need special consideration, so the simulation model would also be different from the general case. Therefore, a building performance simulation strategy of air conditioning design in stepped space is shown in Figure 7. The blue box is the adjustment process of this study. The internal gain of the case building includes the heat gain of indoor personnel and equipment, which may impact the airflow. For the simulation software, the volume, spatial complexity, and model precision of the stepped hall could result in a large amount of computing load. Thus, the respiratory region is simplified according to the needs of the model. When evaluating the air and thermal environment, first of all, the three evaluation indexes ADPI, EDT, and SVE are used as the presentation functions for post-processing to obtain 2D maps and 3D models for further analysis. Then, when selecting the air inlet form and establishing the model, it needs to consider whether the overall space meets the excellent standard and whether the distribution of fresh air in the residential area can achieve good results.
2.6. Verification of Strategy
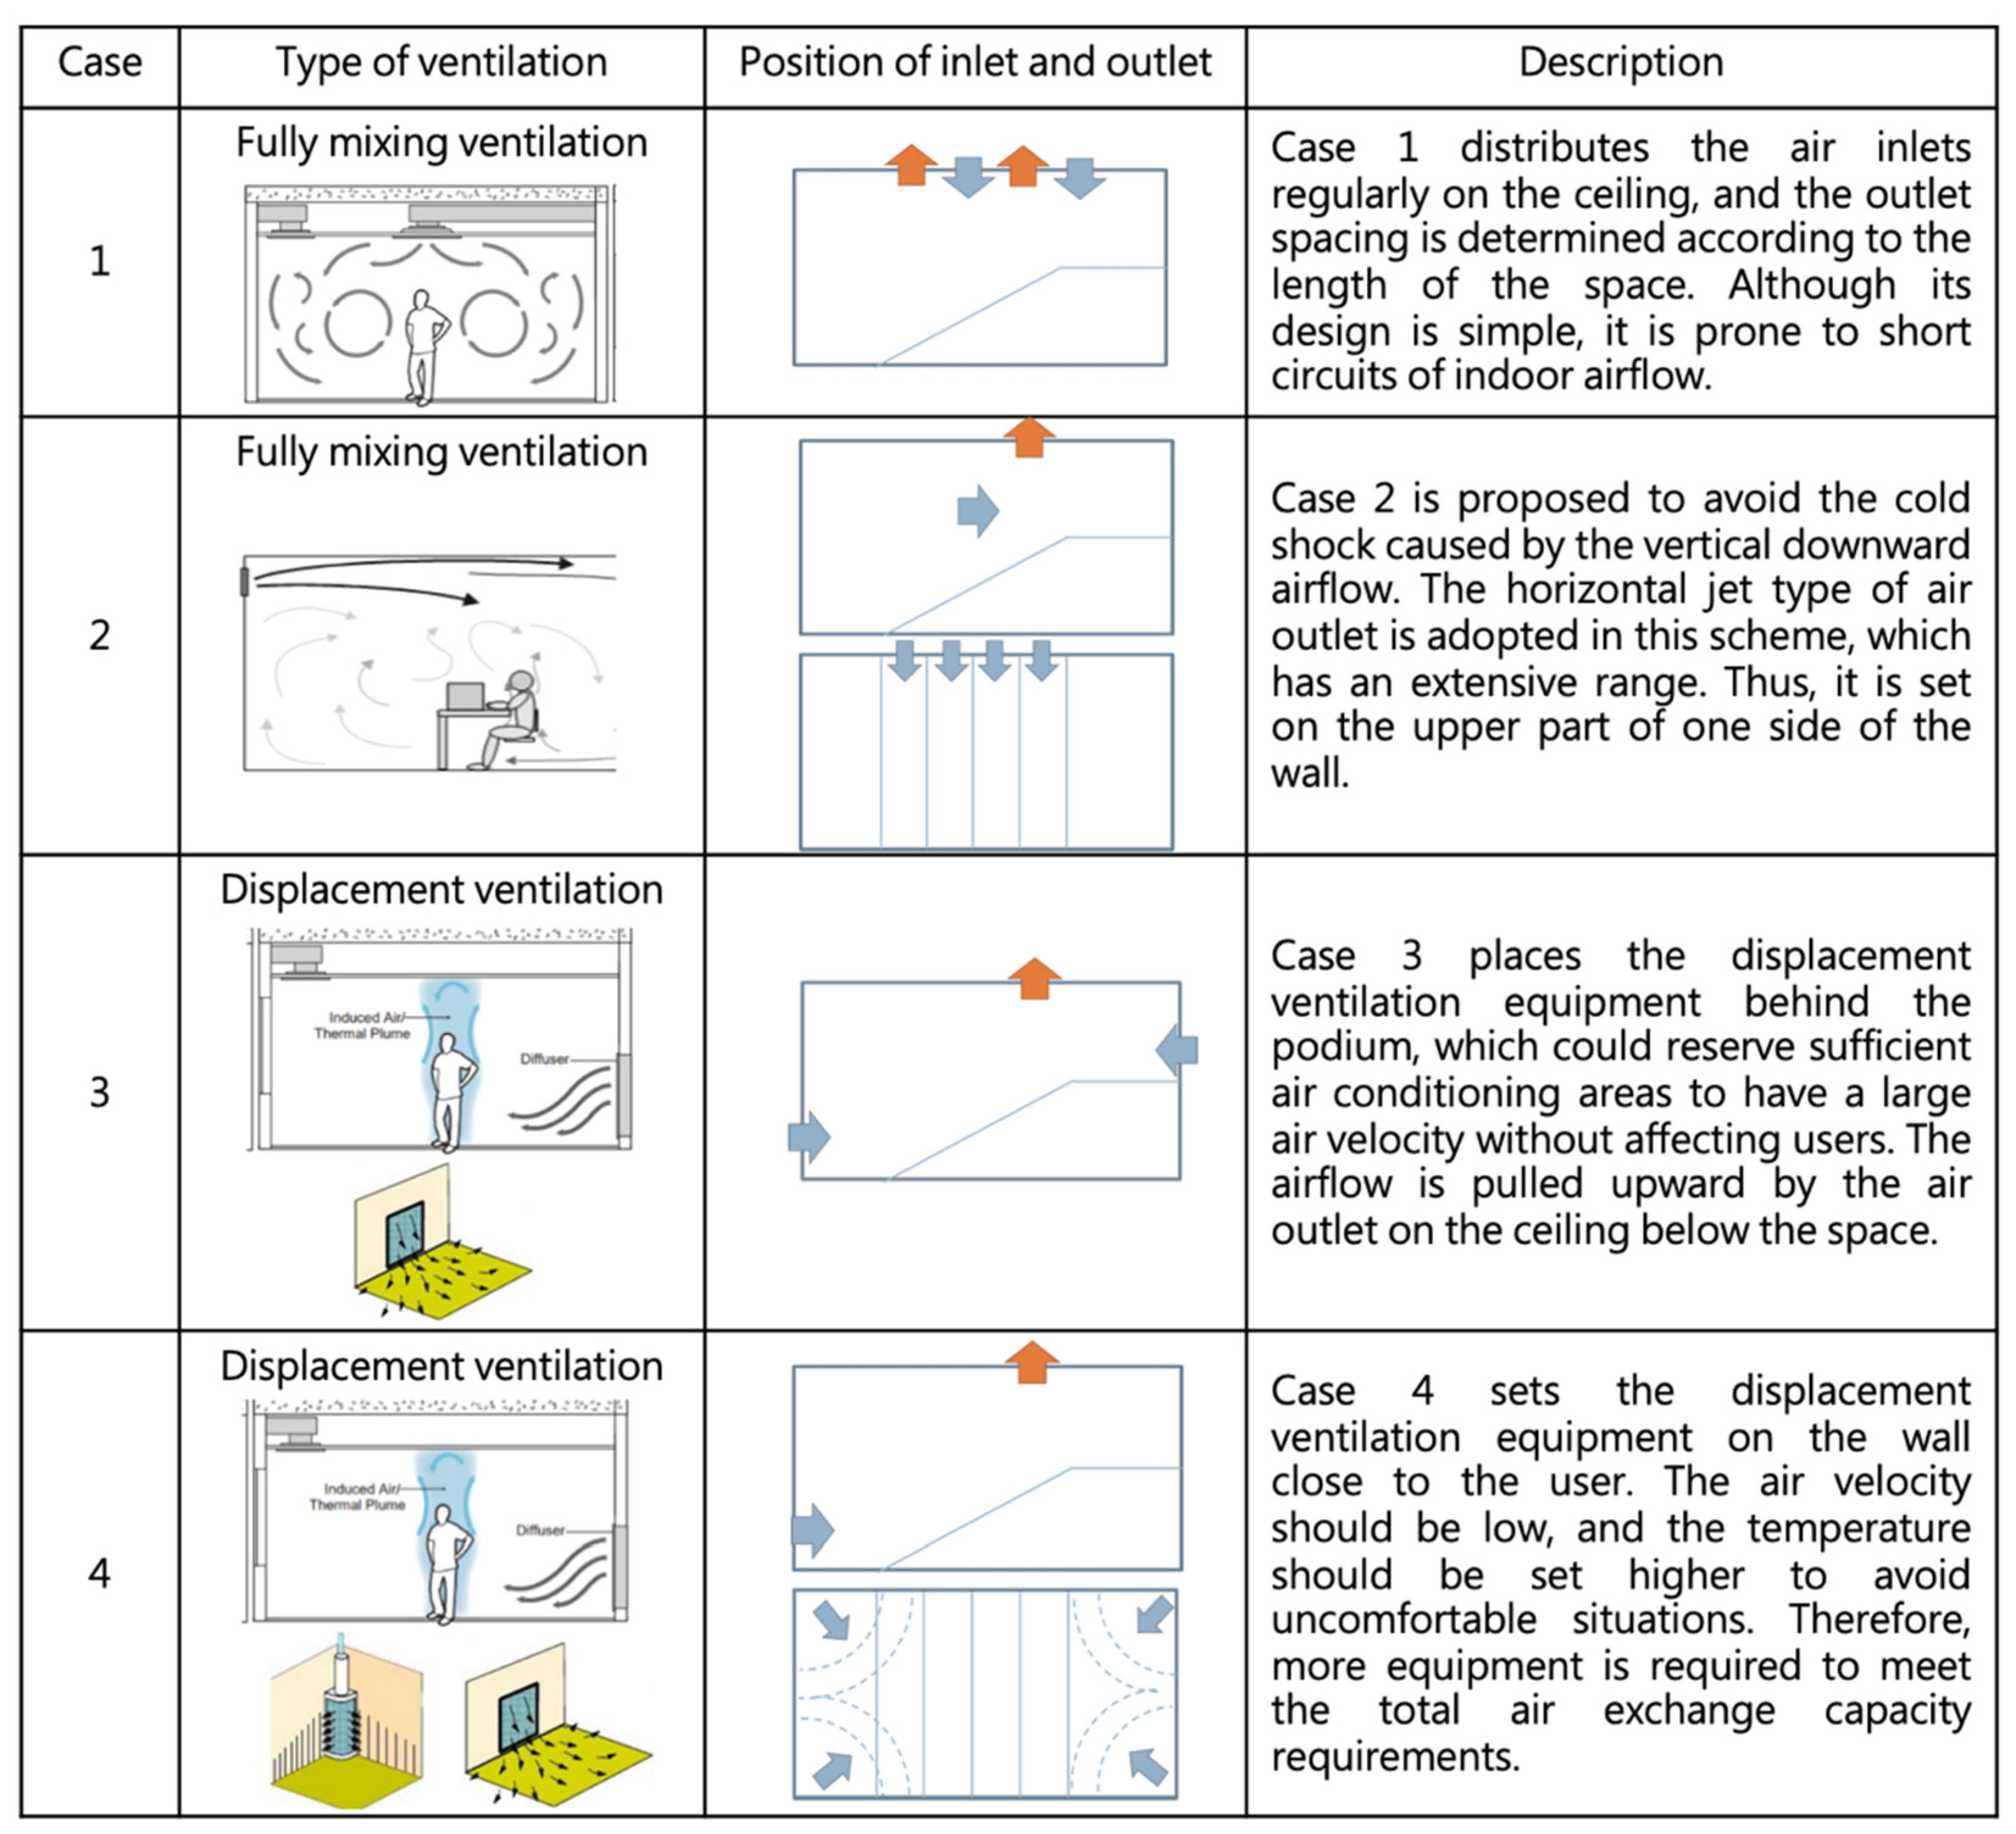
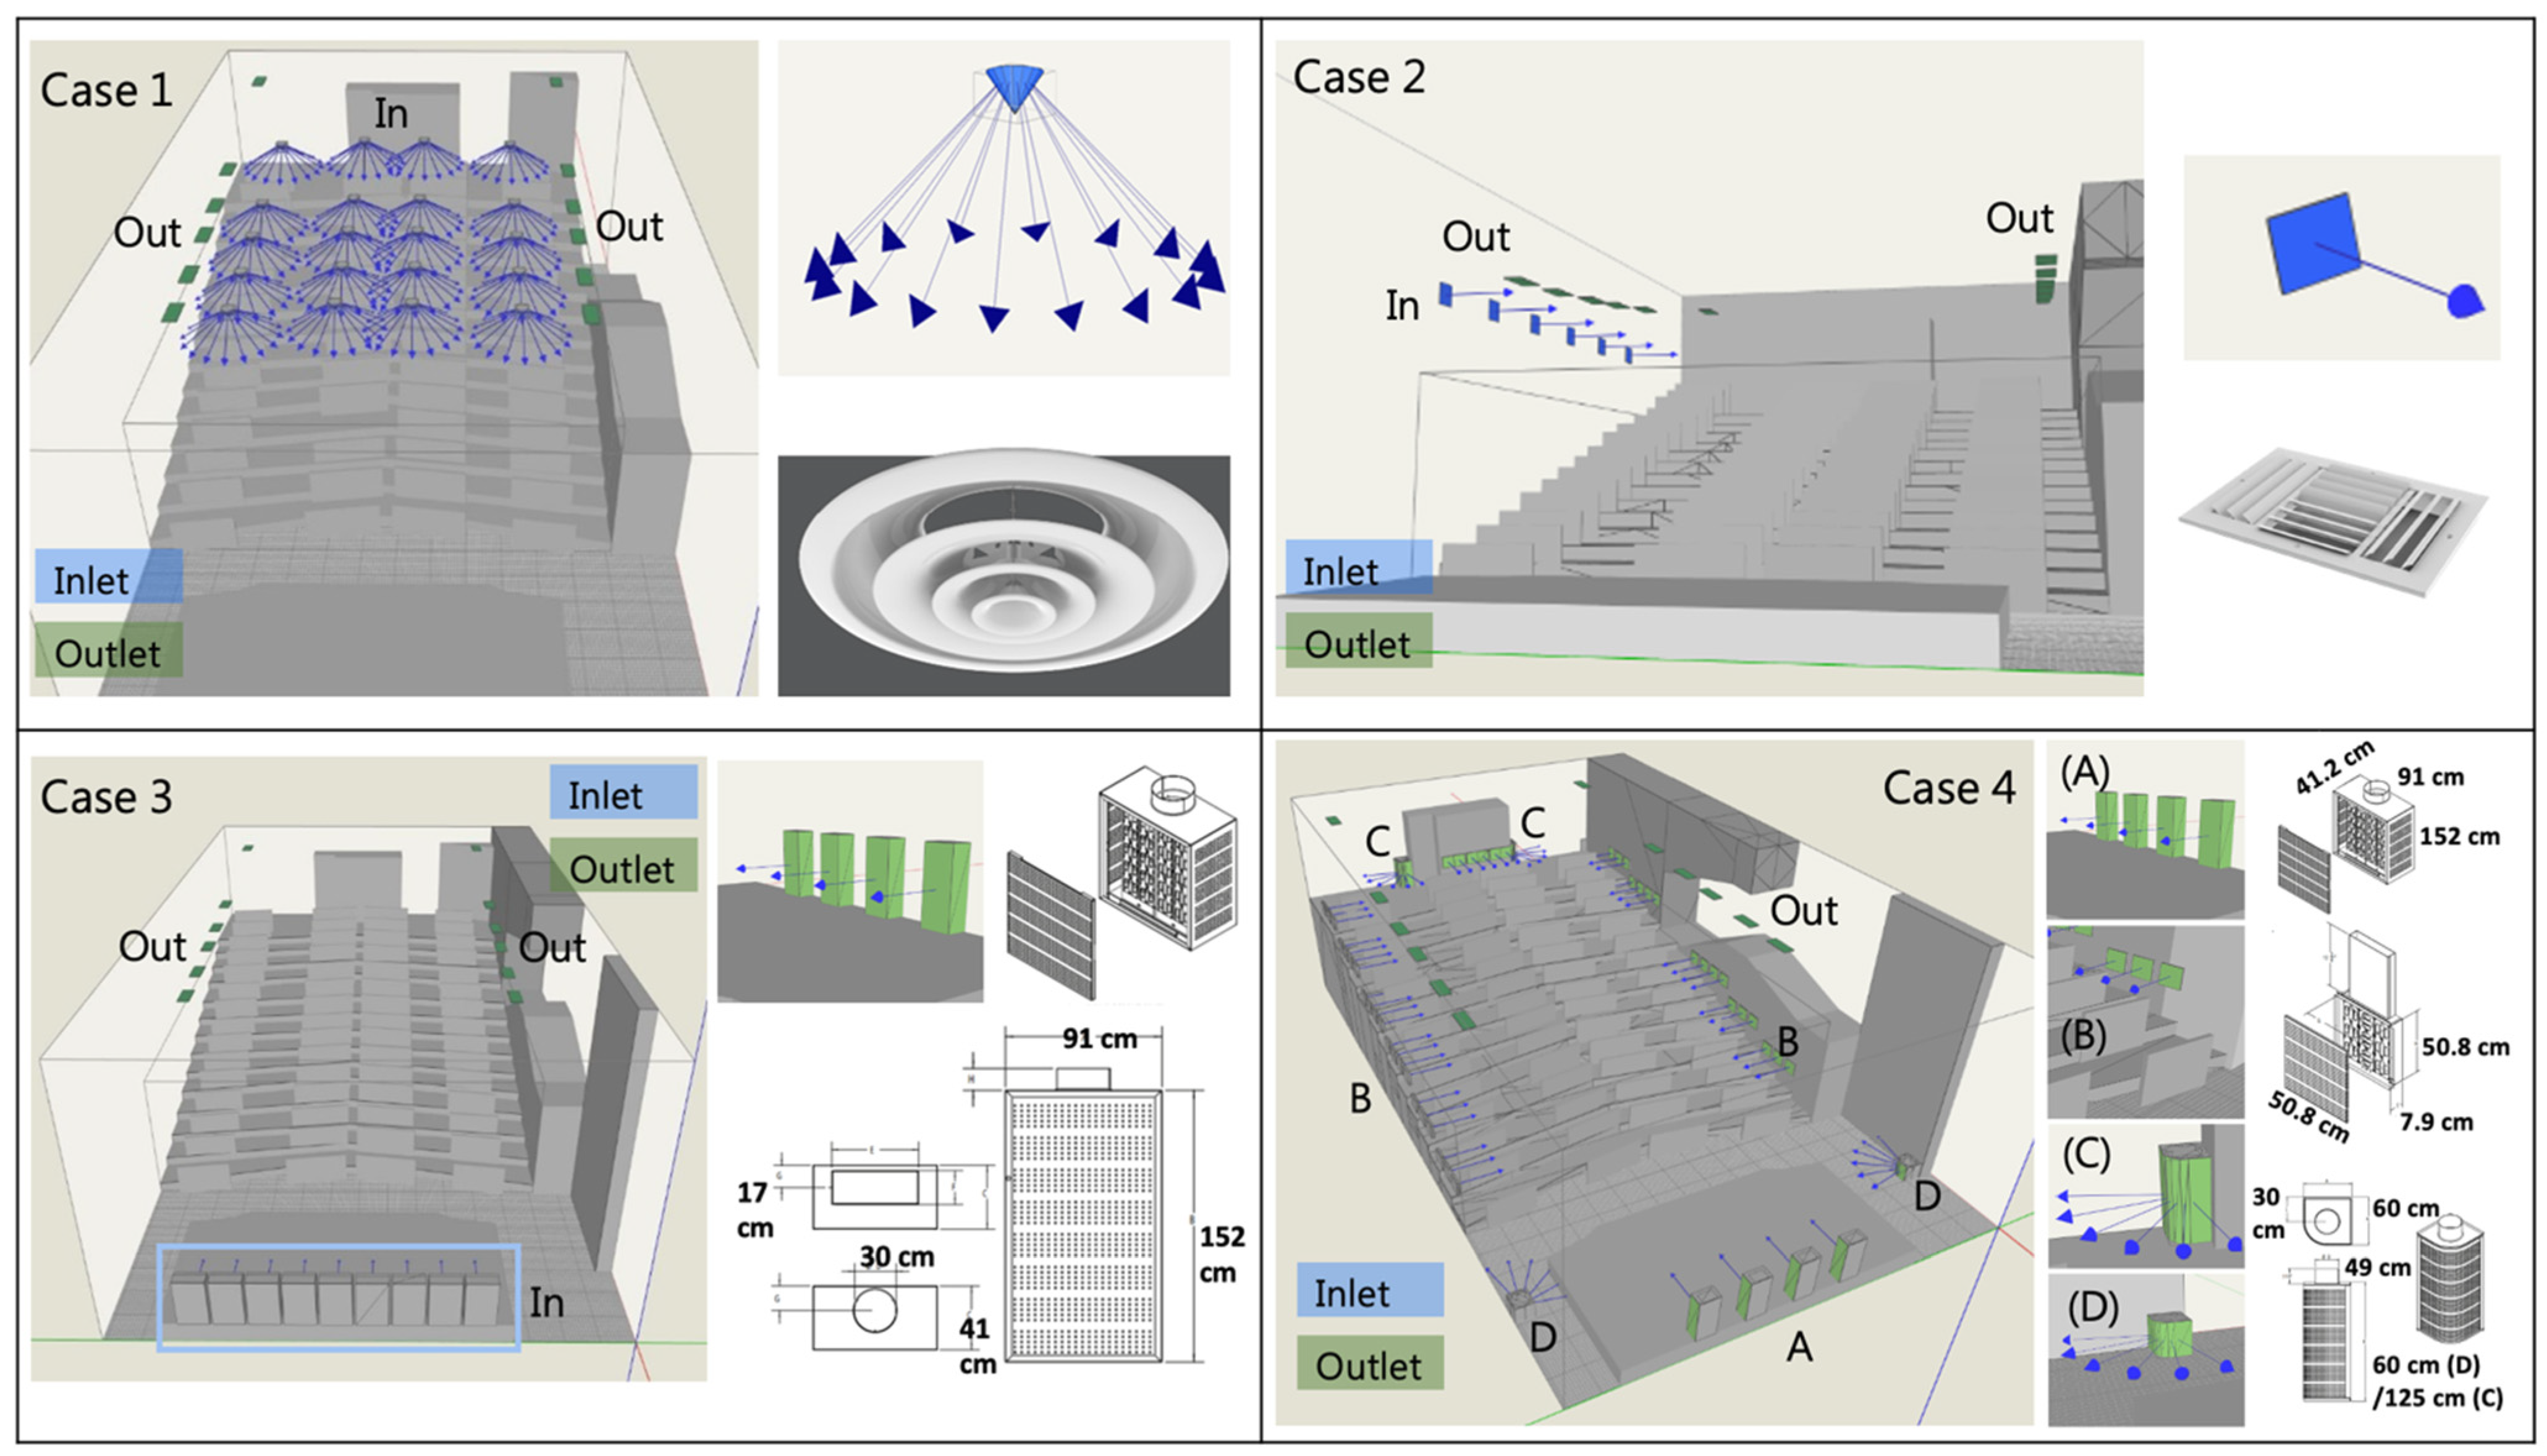
In order to verify the air conditioning design strategy, this study compared the performance of the FMV and the improved air conditioning design method [47]. In the CFD model, the researchers compared the applicability of FMV and displacement ventilation in the stepped hall and the effects of different air conditioning configurations. Case 1 was the original scheme with FMV, which was compared with other cases as the control group. Its air conditioners were uniformly distributed on the ceiling, and the configuration was not adjusted according to the space demand. Figure 8 shows the ventilation types and descriptions of the four cases [48]. Figure 9 shows the simulation model and diffuser specifications for each case.
Although different air inlet modes and configurations were set in the simulation, the air outlets were evenly distributed on the ceiling in the model, and the air conditioning load, including lighting and internal personnel heating gain, was the same. The settings of each case are shown in Table 4 and Table 5 [37,49]. The Reynolds number in the inlet of each case ranged from 9000 to 350,000. The variation range of turbulence intensity in the measurement was between 15 and 25% at the inlet. However, the air outlet at the site was old, and there was an accumulation of dust and dirt. When the turbulence intensity of the CFD model is 10%, the simulation results are closer to the actual measurement. Furthermore, in order to make the indoor cooling capacity of each case the same, the volume airflow rate of each case is the same [50]. The software fixed the constant volume airflow rate. Meanwhile, due to the different shapes of each air inlet, the air velocity and angle of blowing were different, which were the same as the actual measurement. Since the displacement ventilation only needs to ensure the air exchange rate of the breathing area, and the FMV needs to consider the air exchange rate in the whole room, the total air volume of the air inlet was 5639 CFM (9580 m3/h) and 11,250 CFM (19,114 m3/h), respectively.
3. Results and Discussion
3.1. Actual Measurement
3.1.1. Combinations of Air Inlets and Outlets
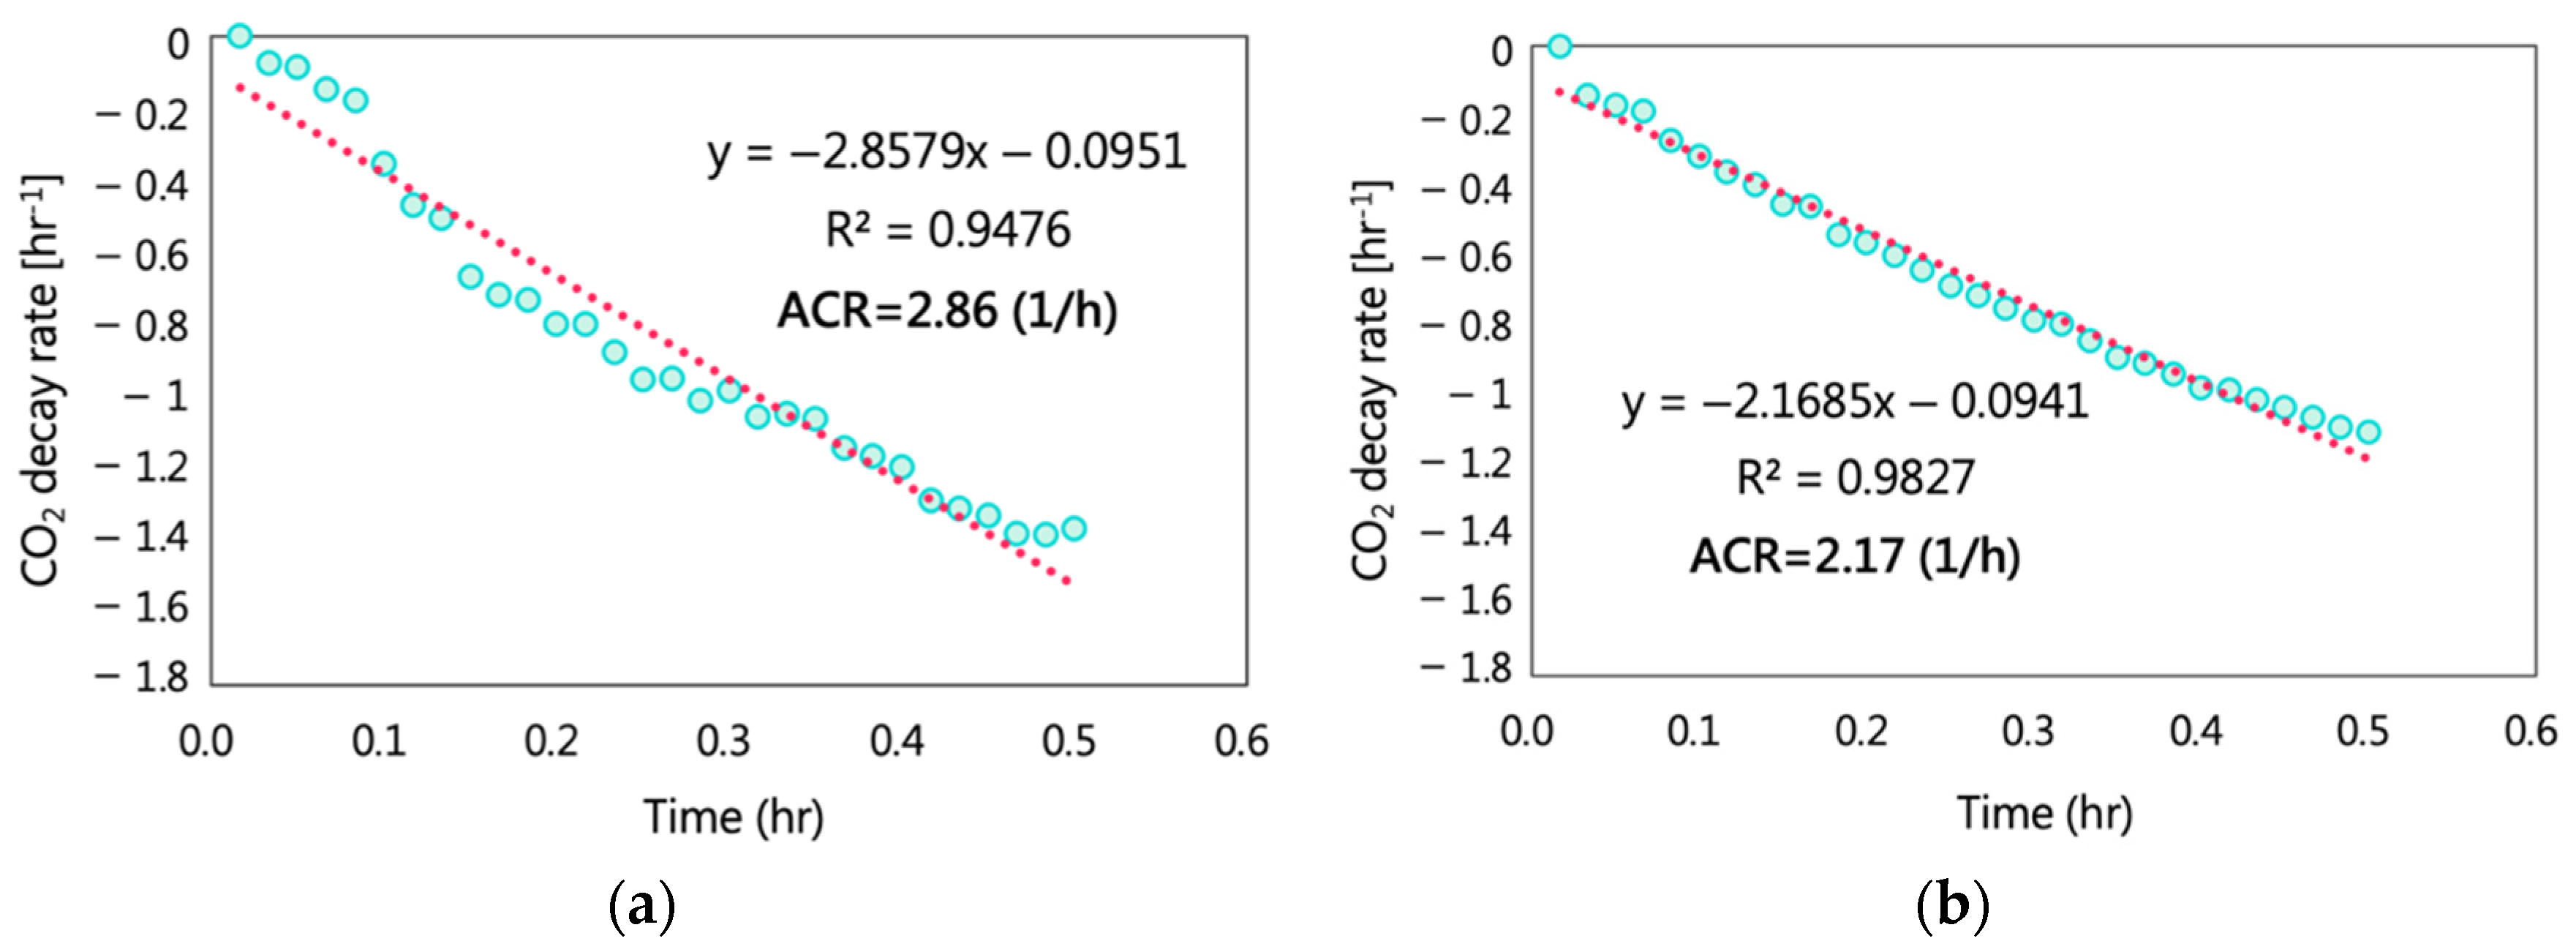
Figure 10 shows the relationship between the decay rate of CO2 concentration and time for the actual data measured in the case hall. The air change rates were calculated by Equation (1). It can be seen that the air exchange rate in the front seat area is 2.8 ACH and that in the rear seat area is 2.1 ACH. There is a gap between the air exchange rates in the front and rear rows. Therefore, it can be determined that the local air exchange rate of stepped space has different air exchange rates due to the change in floor height and air volume.
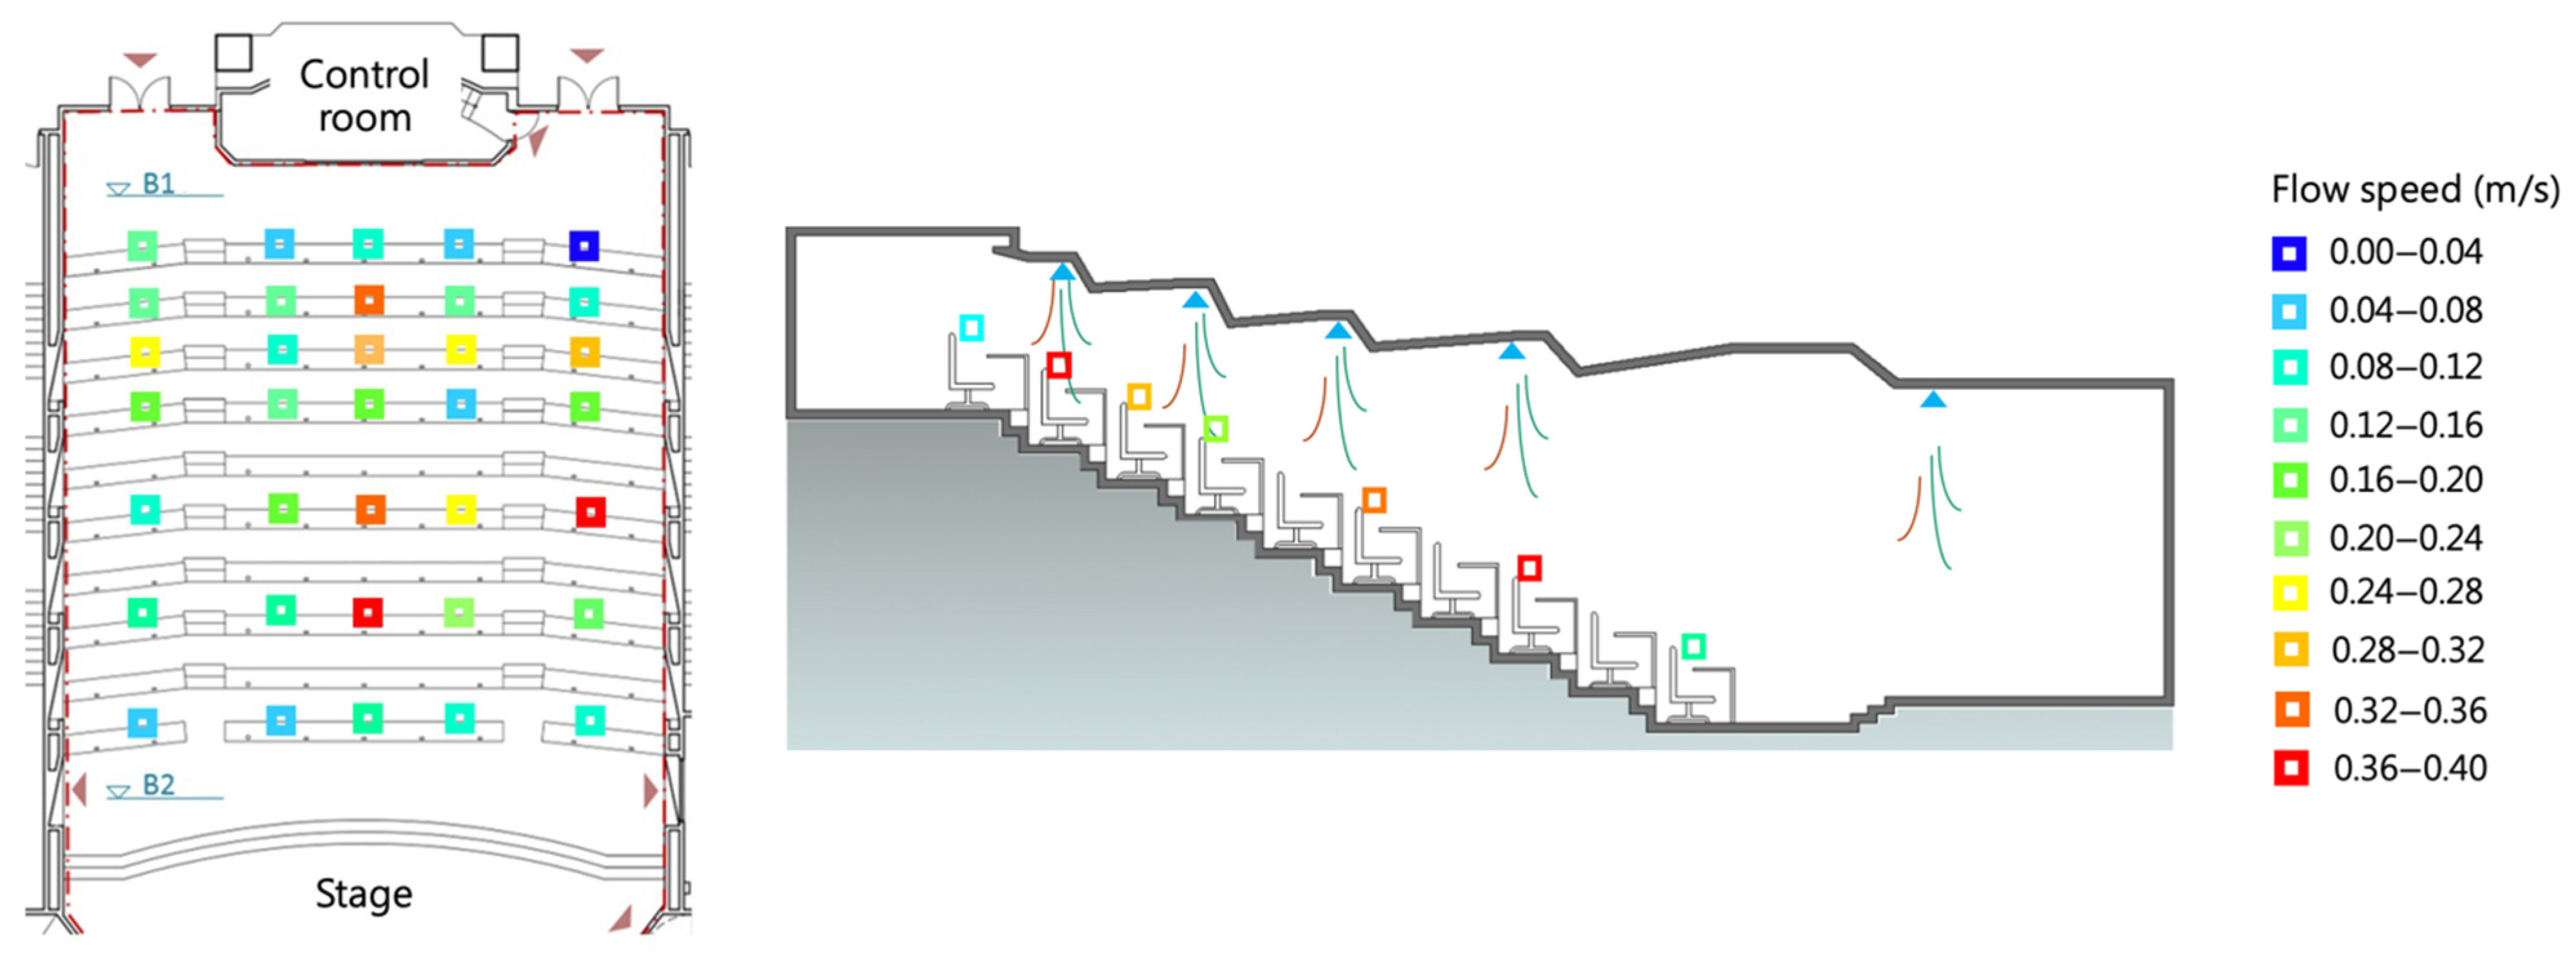
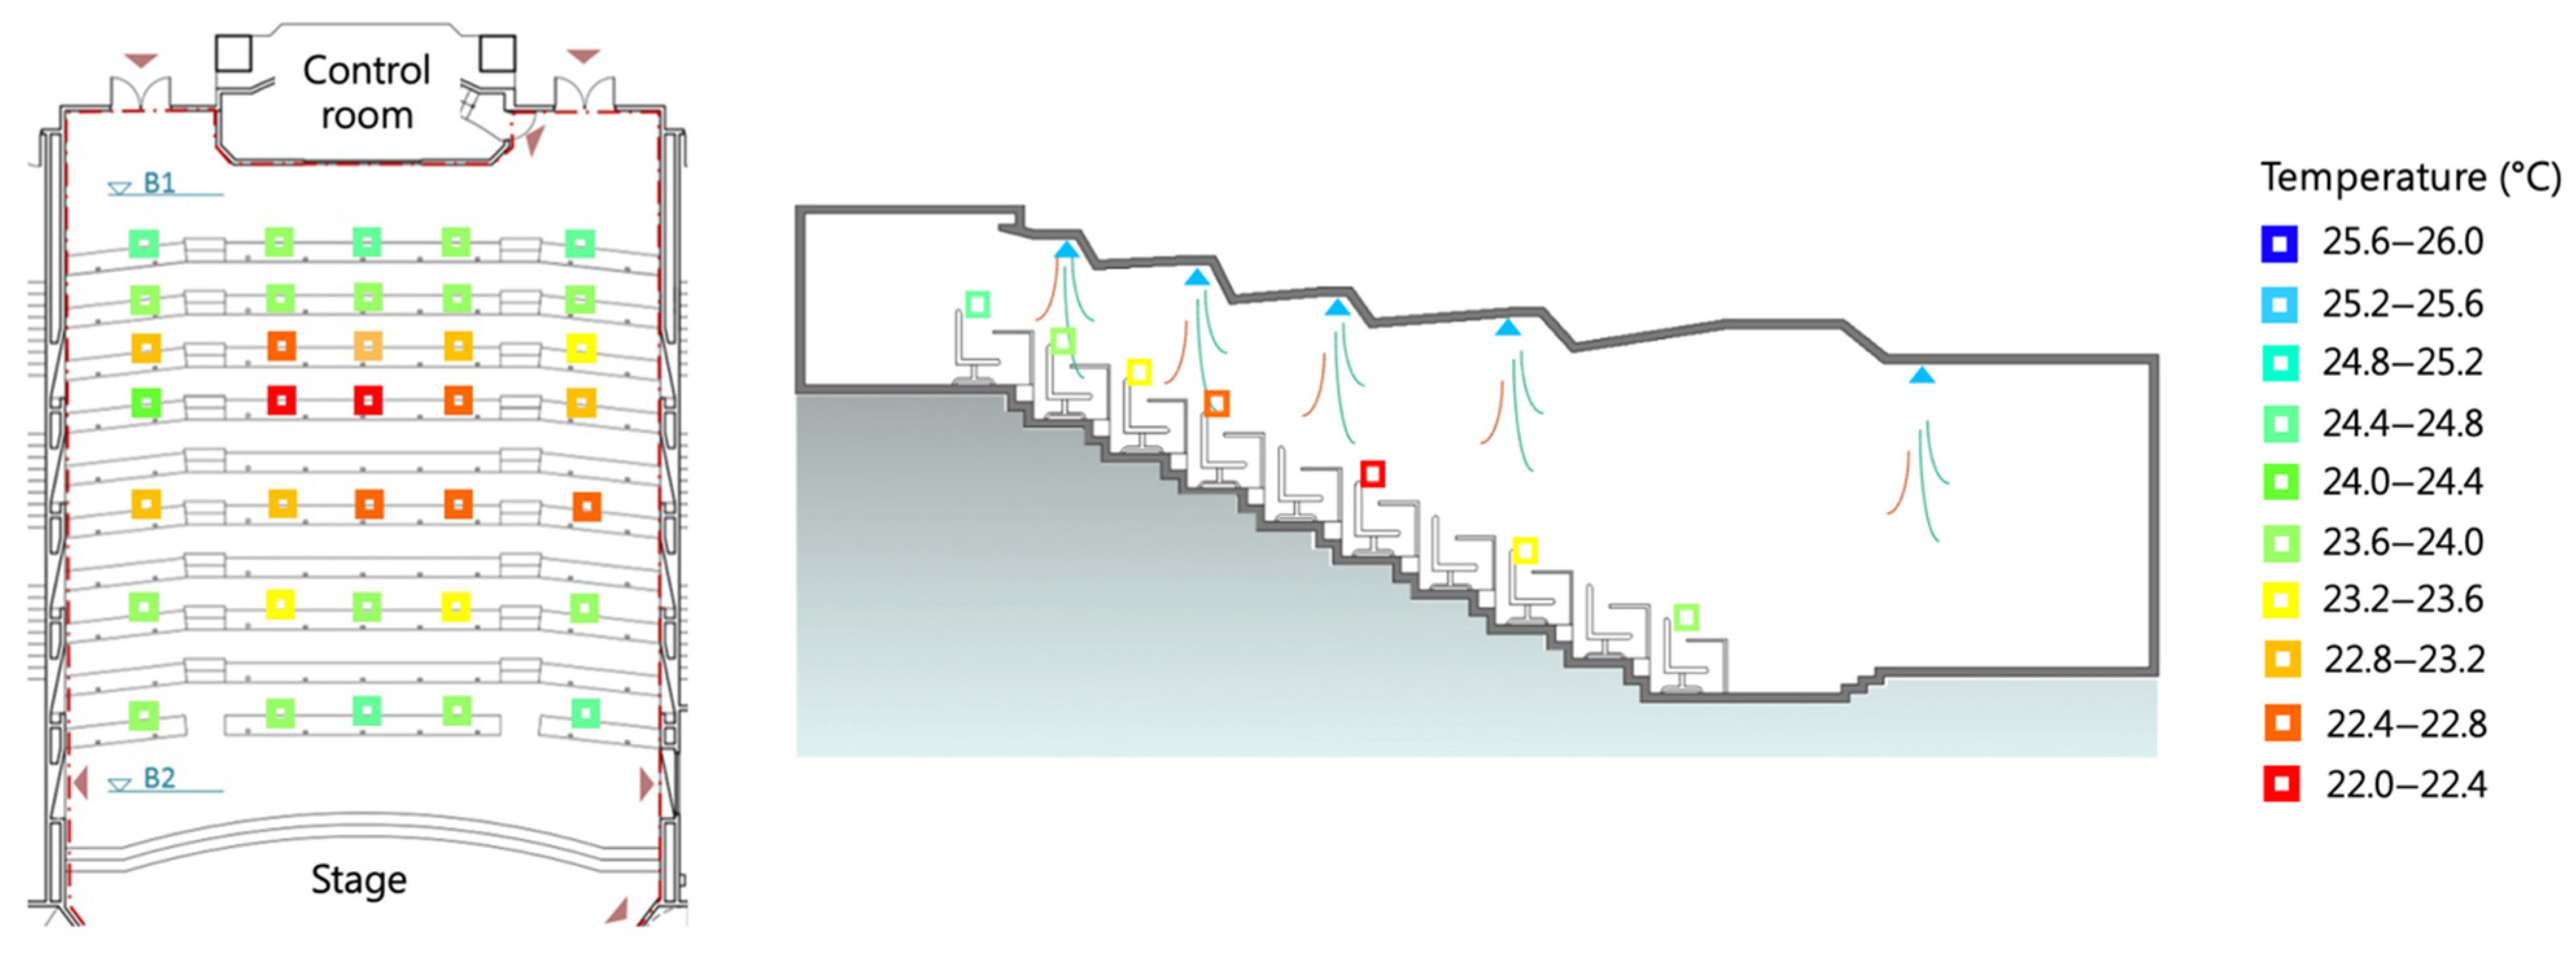
3.1.2. Air Velocity and Temperature Distribution
The results of indoor air velocity distribution and temperature distribution are shown in Figure 11 and Figure 12, respectively. It should be noted that the height difference between B1 and B2 in the figure is 3 m. It can be seen that the air velocity near the air inlet is high, which partially causes the cold shock problem. However, in some corners, the air velocity is almost zero. The profile of the case room shows that the difference in air velocity in the residential area is quite significant, which is not related to the change in ceiling height. Because the air conditioning design adjusts the air velocity according to the rule of thumb, it is not easy to cope with the particular space.
3.2. Comparison of Measured and Simulated Results
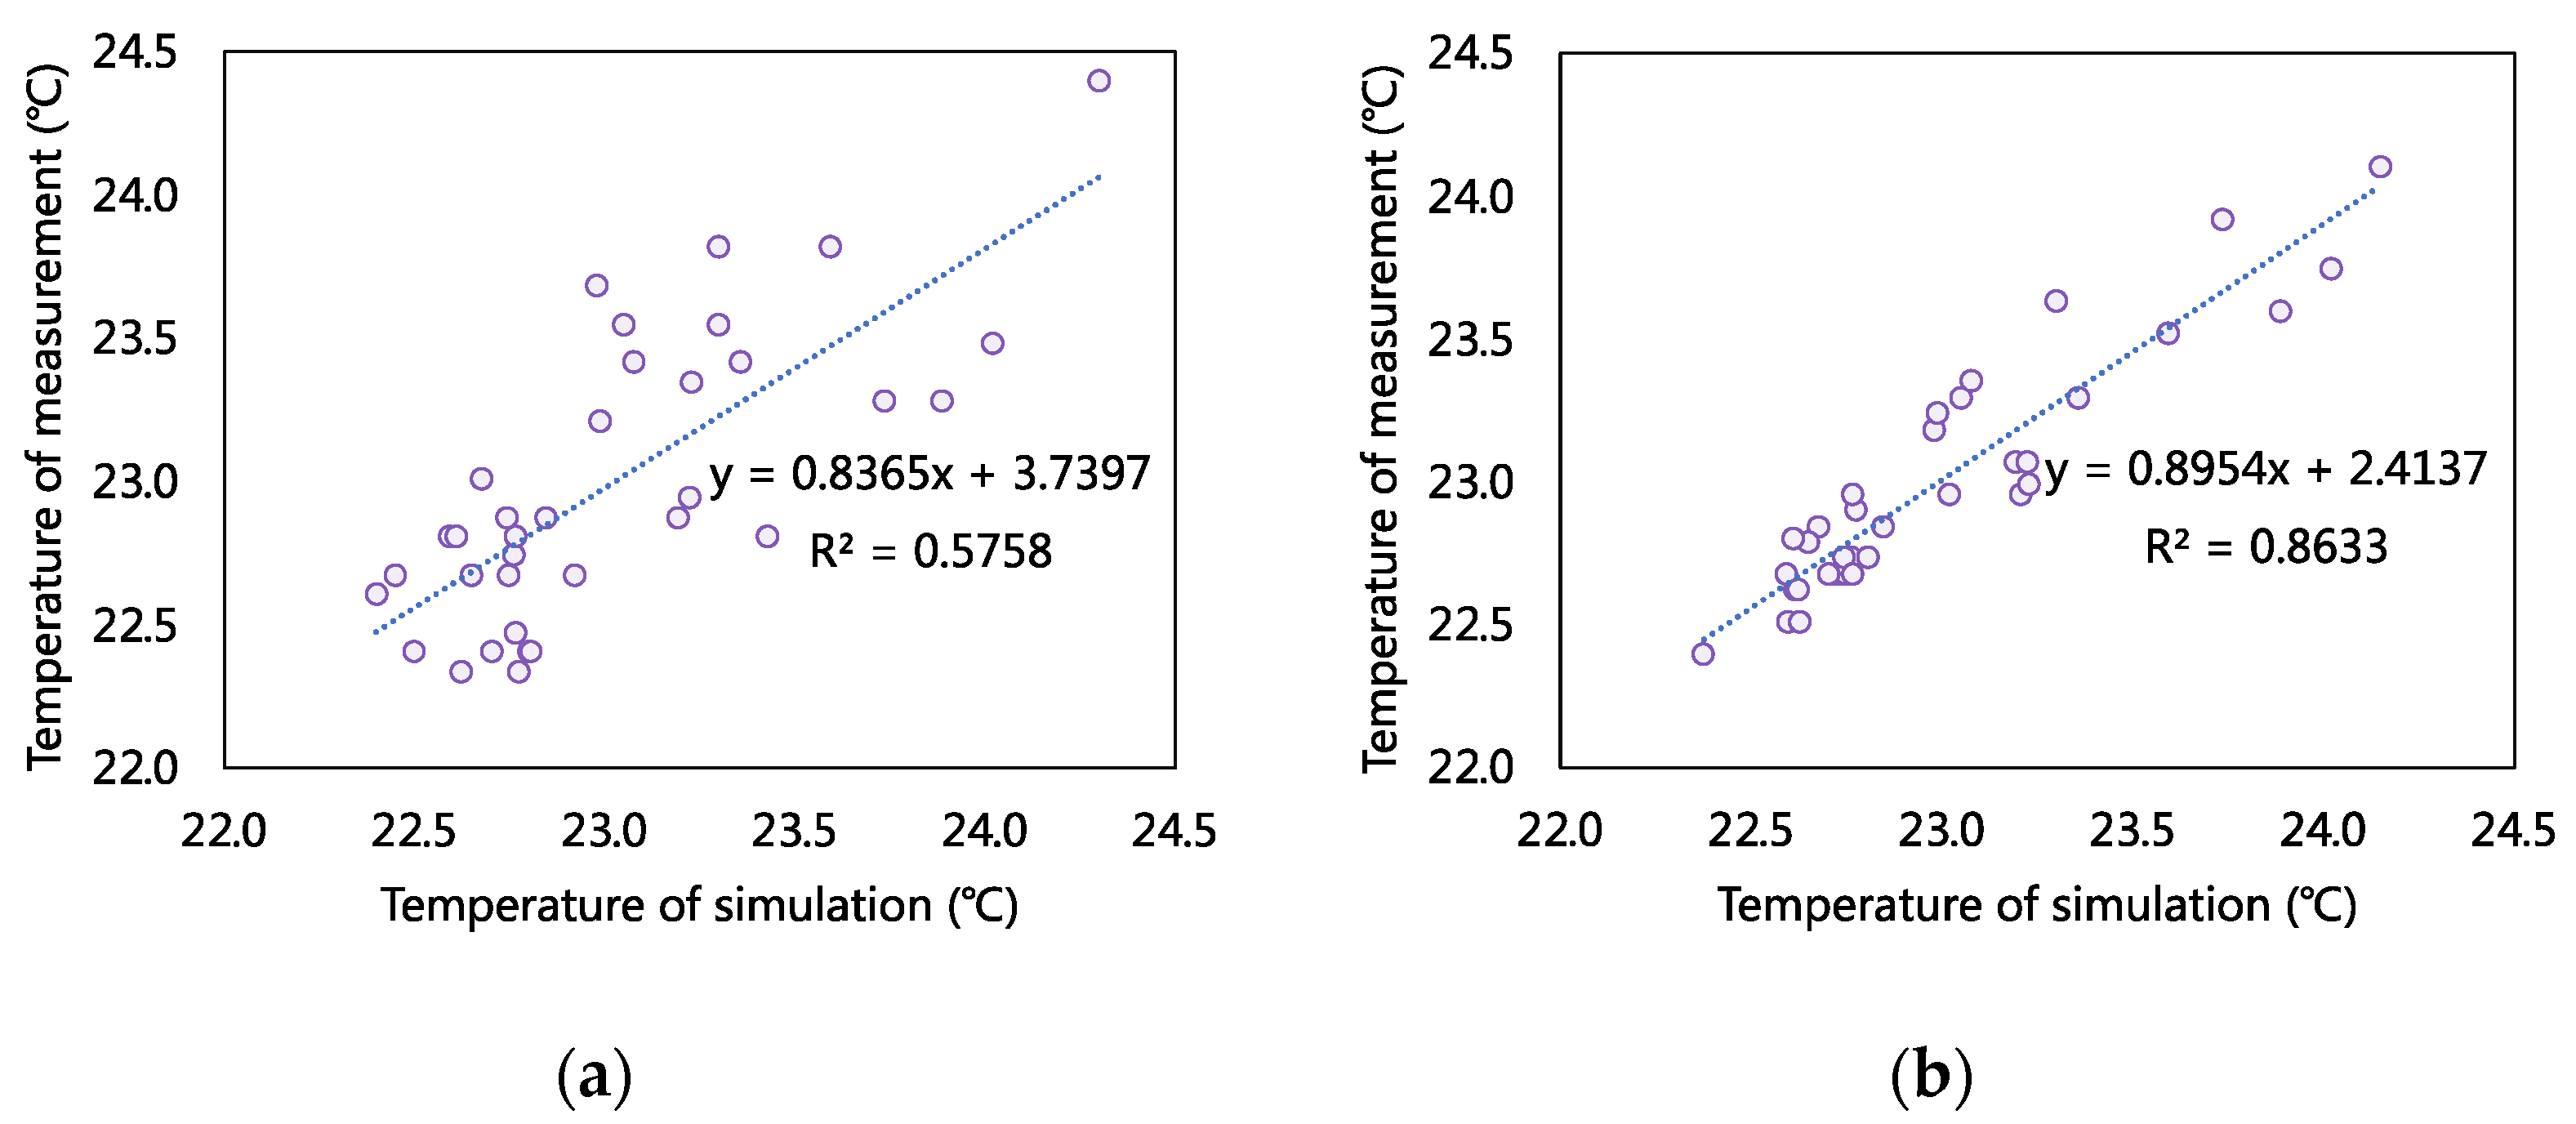
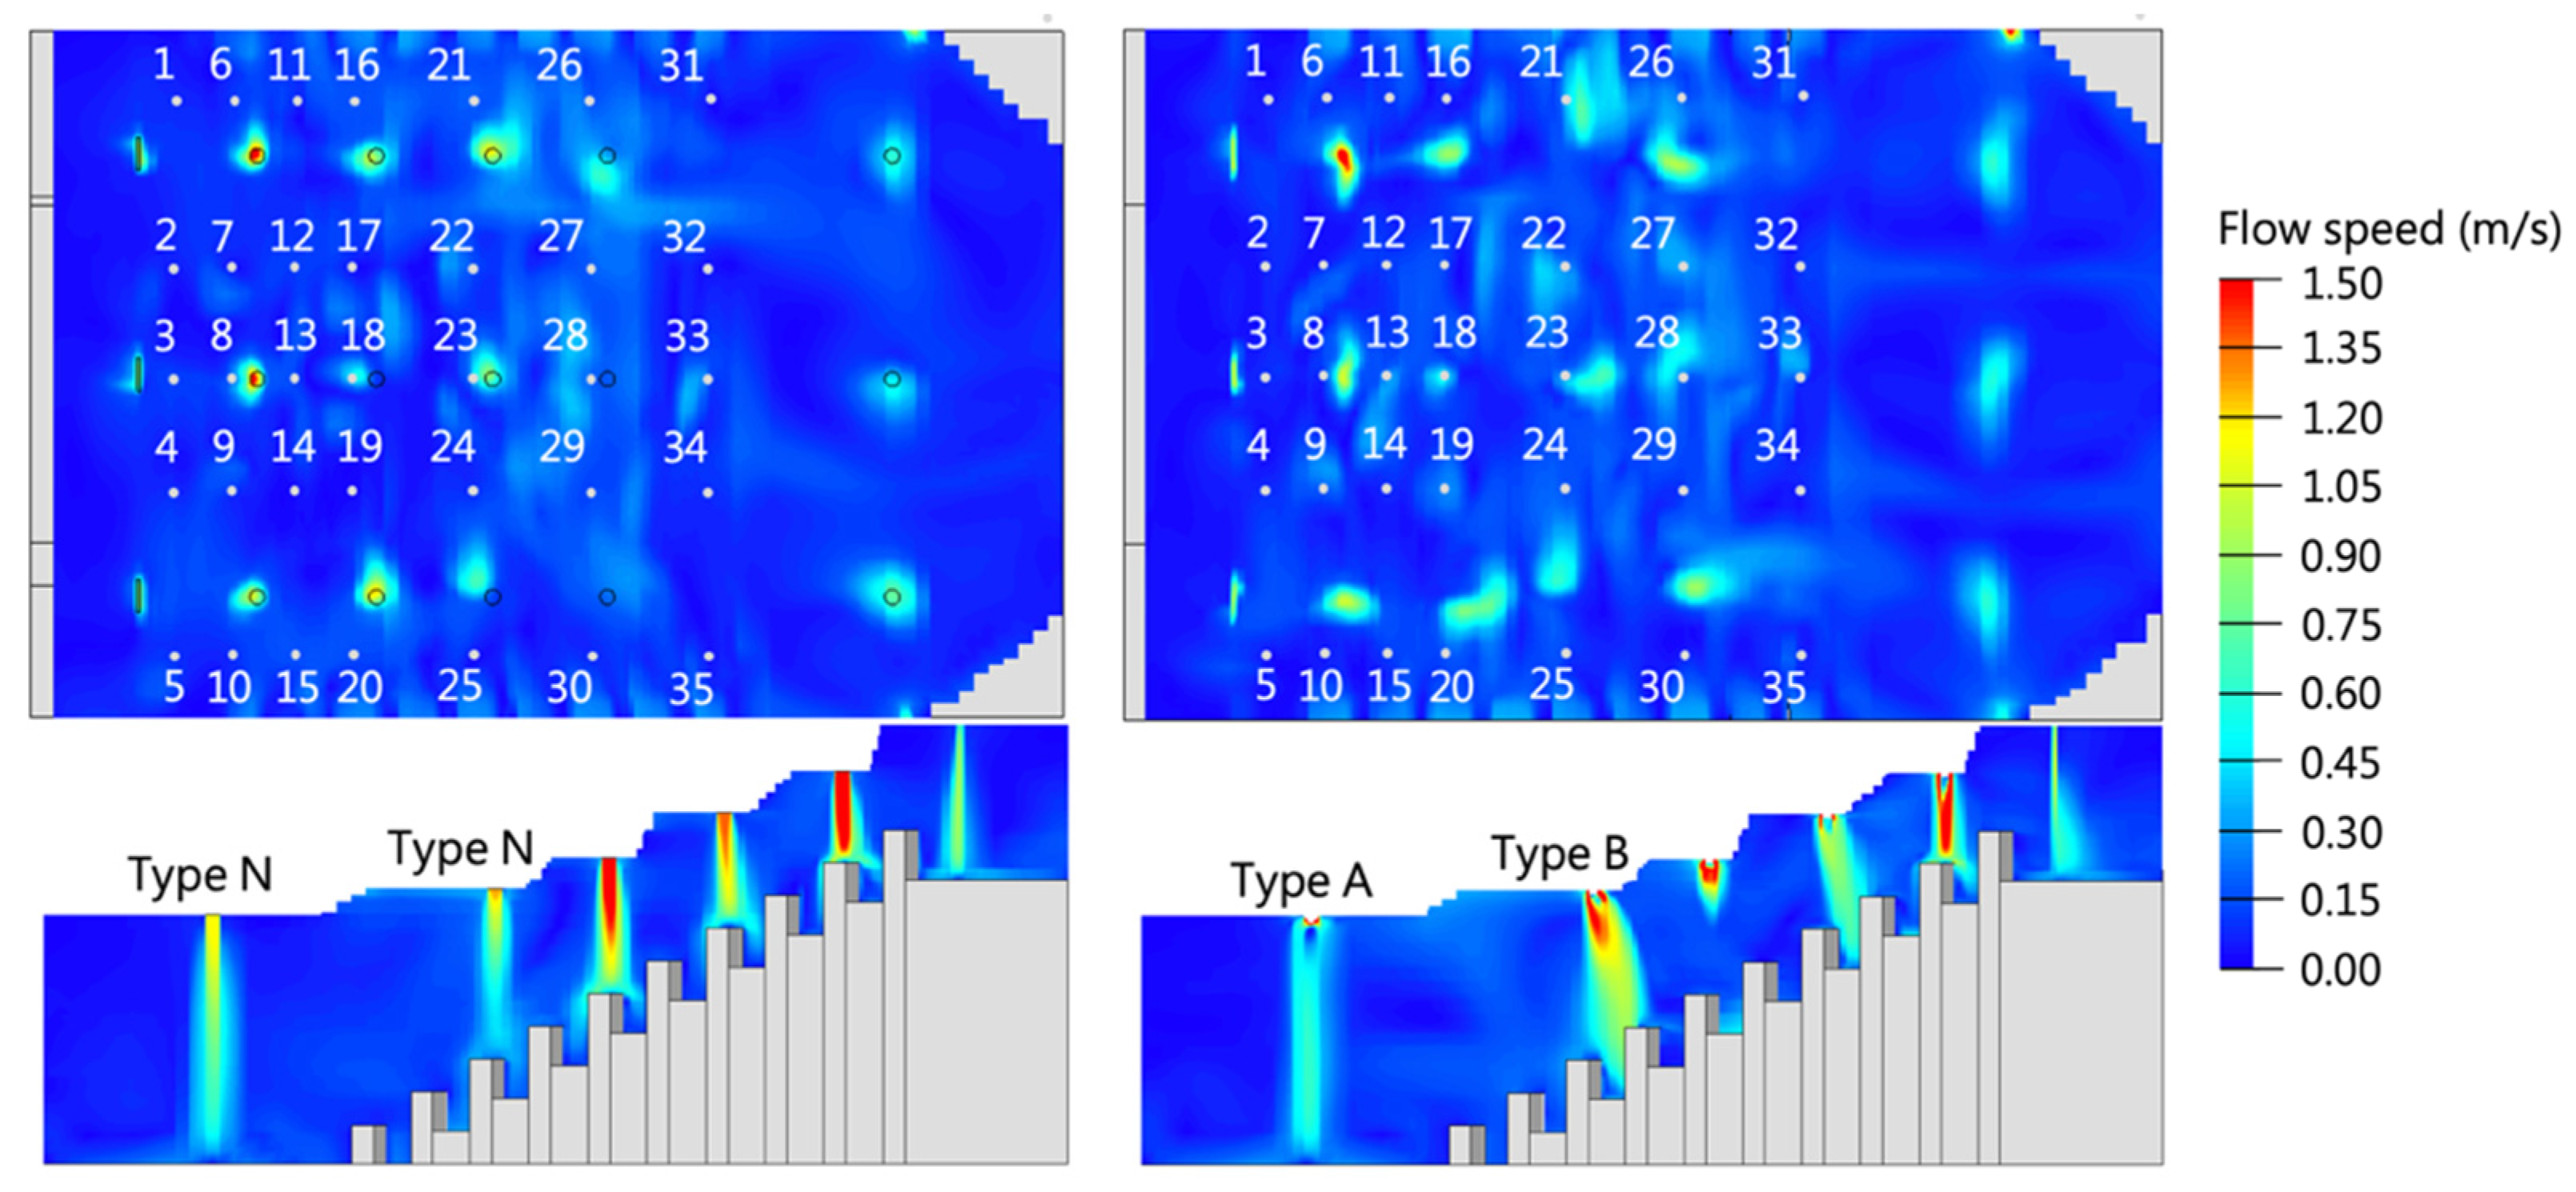
Figure 13 and Figure 14 show the comparison of measured and simulated results in air velocities and temperature. The red point is the measurement position in the space, shown in Figure 14. The actual air velocity of the case room is between 0.029 and 0.166 m/s, slightly lower than the simulated air velocity. In scheme one, the simplified air inlet is applied. The simulated airflow can flow vertically downward without obstruction so that the simulated air velocity could be easily overestimated. On the other hand, scheme two uses the conical air inlet, considering the airflow’s directionality. Although the conical bottom is the same as the actual air inlet, its fan-shaped surface area is larger than the actual air inlet area. Thus, there is also overestimated air velocity in scheme two. However, the correlation between scheme two and the actual situation is relatively high, which reaches 0.86 in the R2 value. Furthermore, the simulation of temperature also shows a similar trend. The correlation between scheme two and the actual situation is still higher than the values of scheme one. Therefore, it is confirmed that the simulation model established in this study is reliable and can reproduce the air velocity flow field of the actual space.
Figure 15 shows the air velocity distribution of two simulation schemes. The airflow in scheme one is concentrated, and the position under the air inlet is easy to cause cold shock. Meanwhile, scheme two can disperse the air flow horizontally so that the average air velocity in the residential area can be increased. At the same time, the influence of different diffuser models on the airflow can also be observed in this figure. It can be seen that the types of air inlets can directly affect the drop and diffusion distances of the air inlet.
3.3. Results of Building Performance Simulation in Each Case
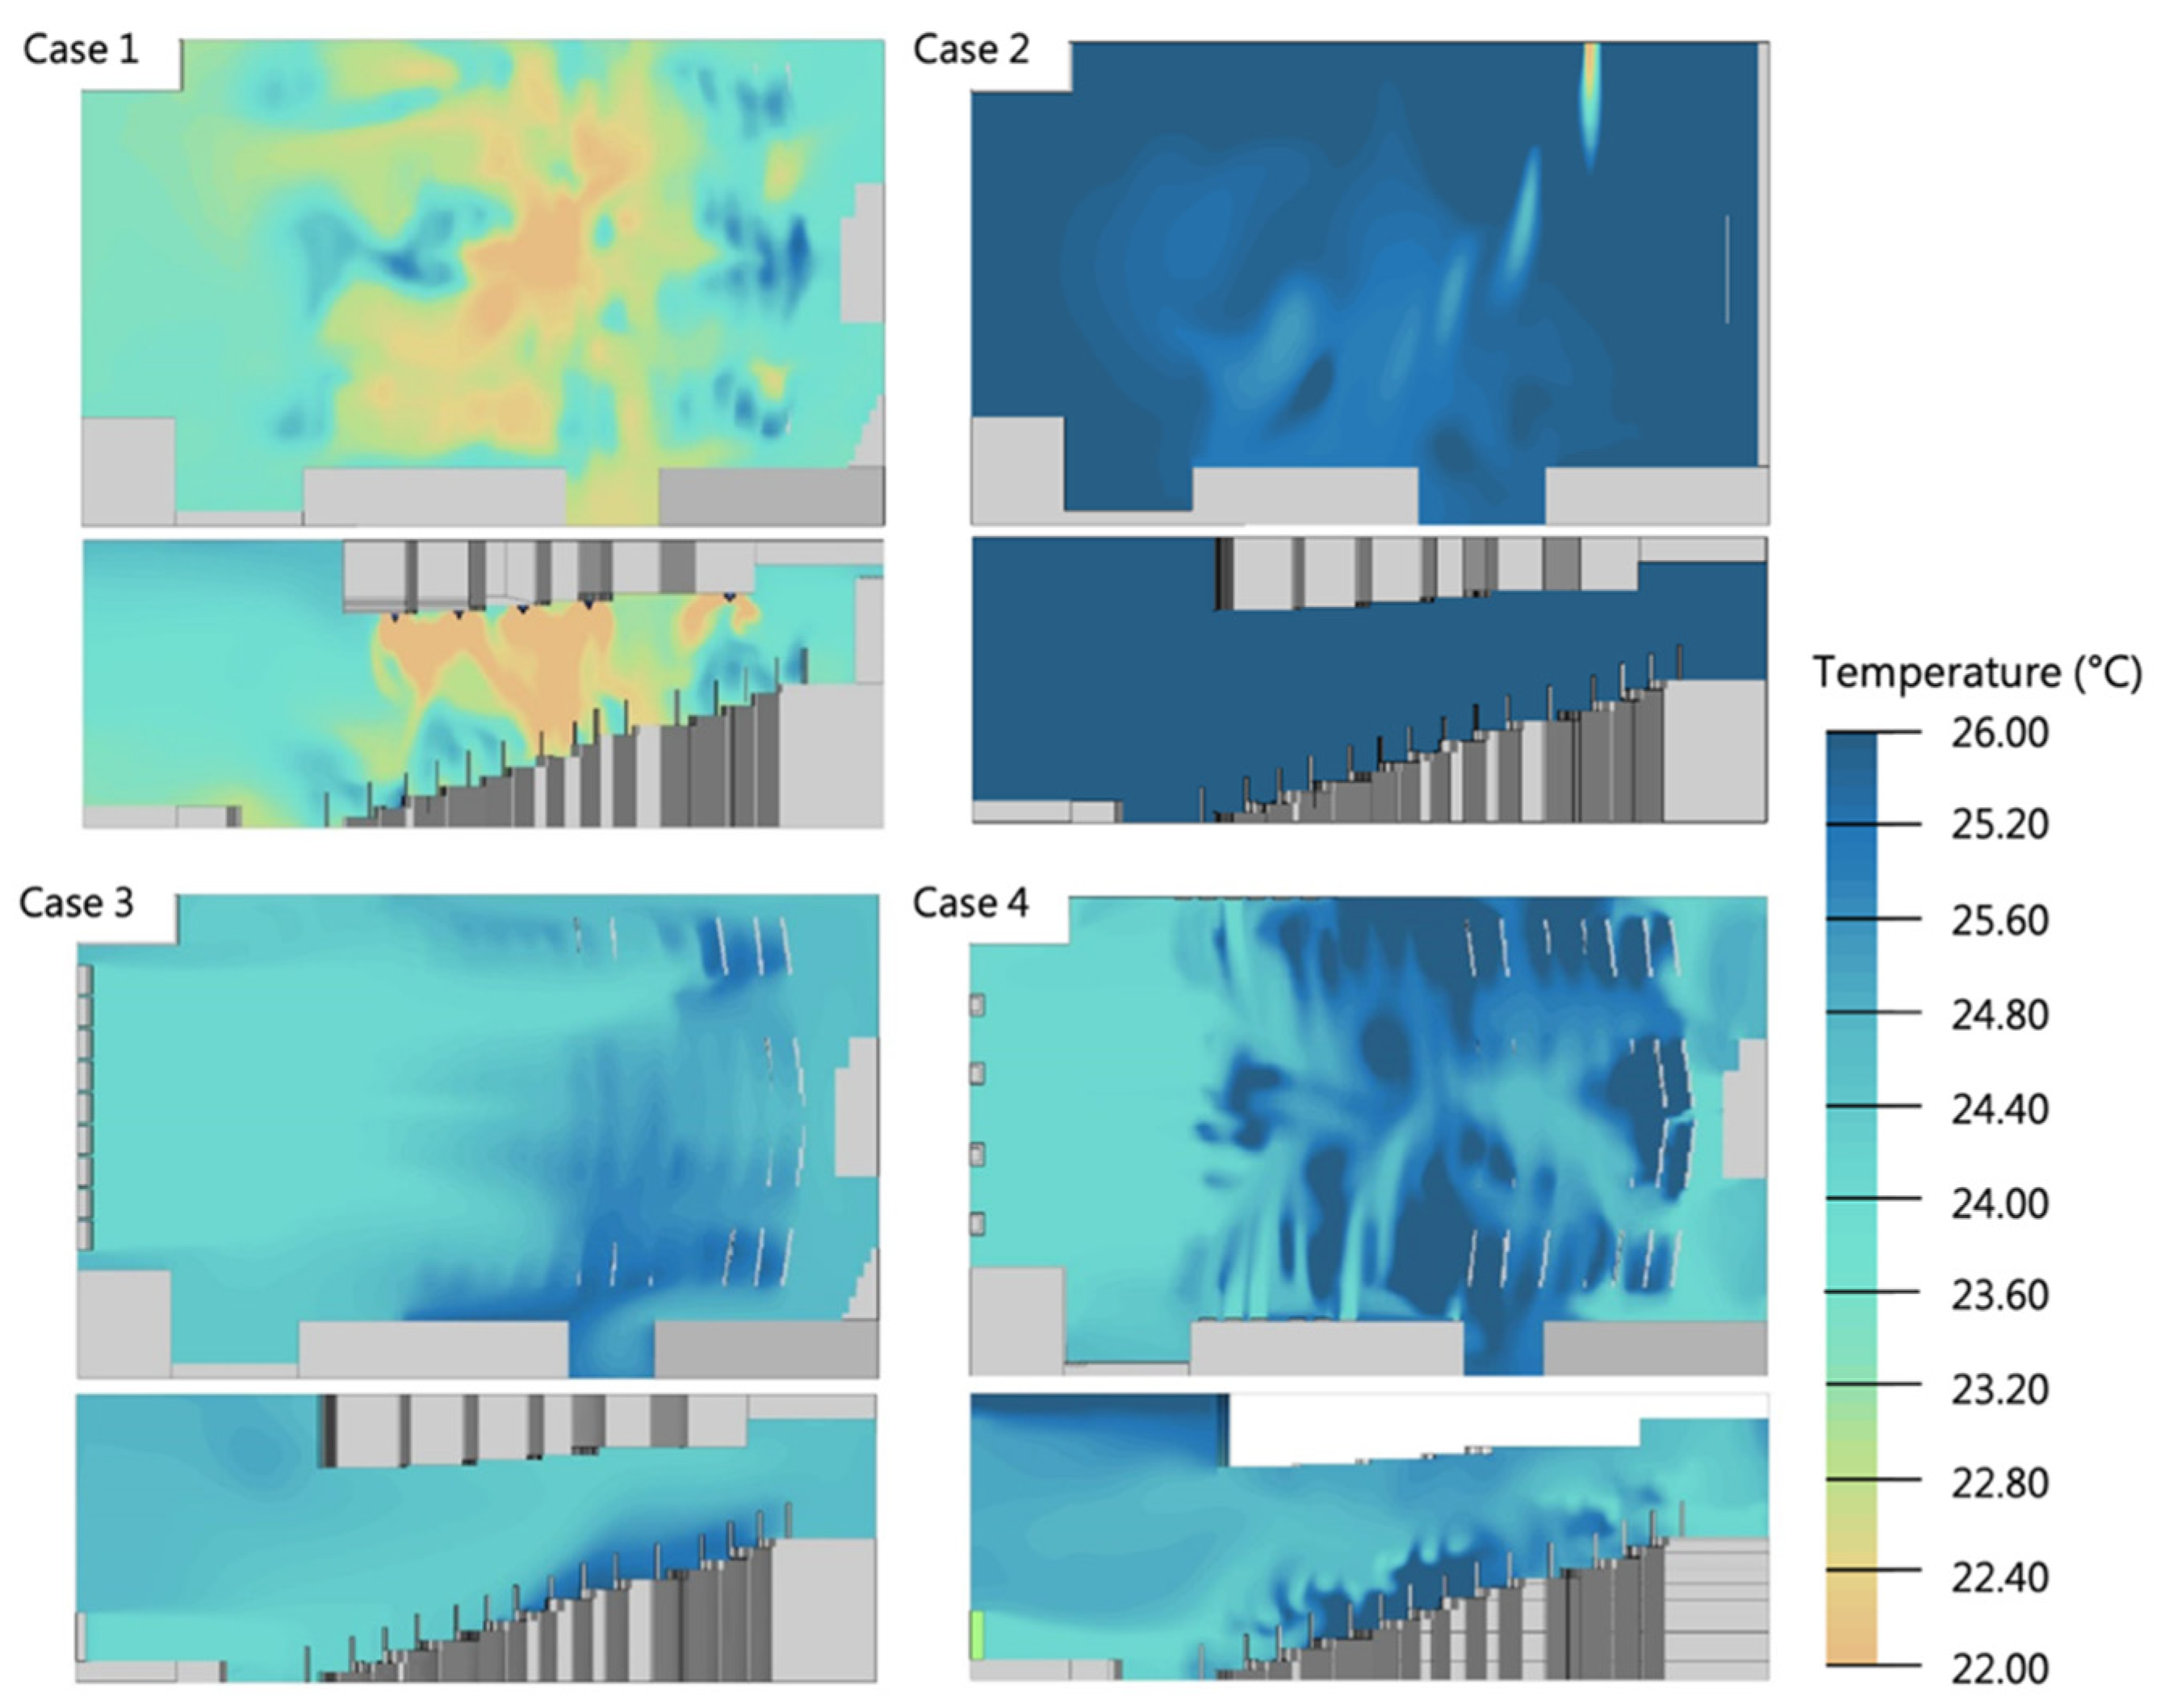
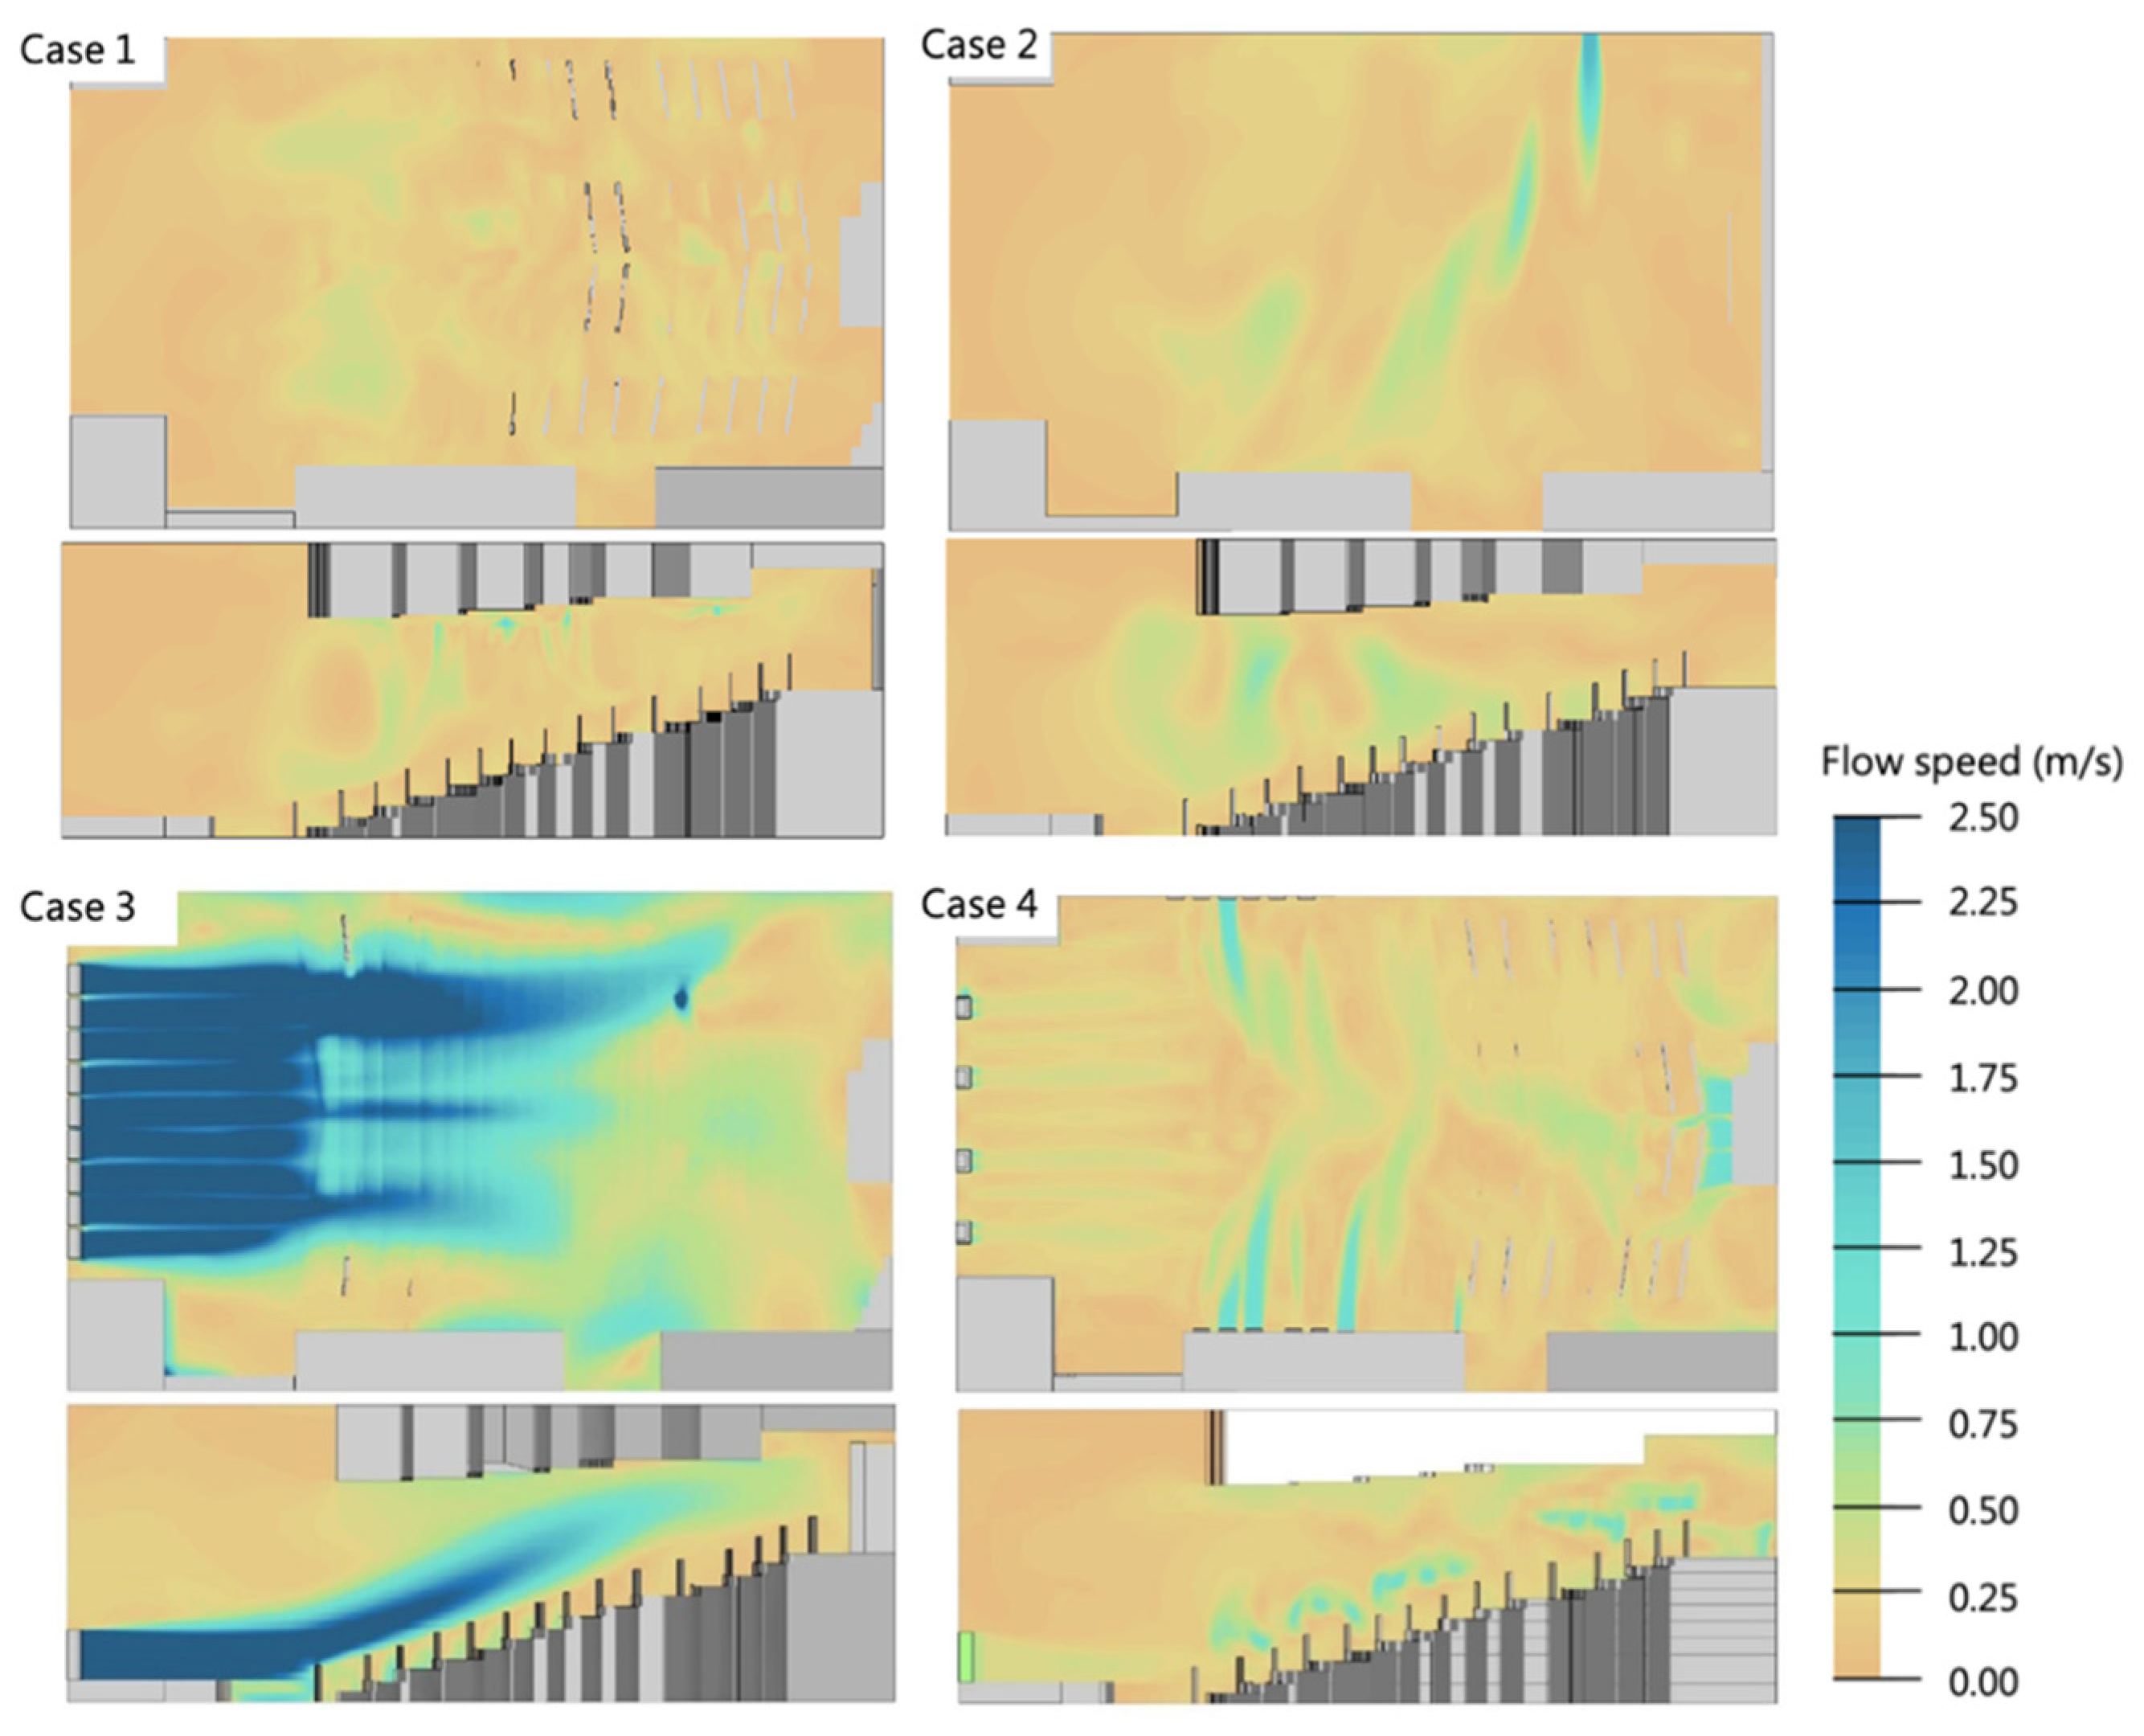
Then, the study compared the four improvement design schemes of air conditioning configuration and observed their air distribution in the simulation model. The advantages and disadvantages of each scheme were discussed based on ASHRAE and REHVA design reference standards. The simulation results are shown in Figure 16, Figure 17, Figure 18, Figure 19 and Figure 20.
3.3.1. Temperature Distribution
It can be seen from Figure 16 that the temperature distribution of case 1 is uneven, which is greatly affected by the position of the air inlet. It is necessary to use EDT to analyze whether the vertical downward airflow causes cold air. Meanwhile, it can be noted that the simulation results of case 1 are consistent with the temperature distribution results of the actual measurement in Figure 12, which could verify the effectiveness of thermal simulation. Then, although the temperature of case 2 seems high, the air velocity provided by the jet inlet to the residential area can be expected to be high. Thus, it also needs to be analyzed by EDT. In case 3, there is a noticeable difference in the temperature distribution between the front and rear rows. The temperature near the air inlet is low, while the temperature at the rear row is slightly increased, and the distribution is uniform. Therefore, it is easy to predict and control the effect of air conditioning configuration. In case 4, the location of the air inlet has an apparent cooling phenomenon. It is speculated that it is affected by thermal buoyancy, so the cooling effect near the ground below the residential area is not apparent. Nevertheless, the overcooling of the occupant’s lower limbs can be avoided.
3.3.2. Air Velocity Distribution
As shown in Figure 17, in case 1, the air velocity distribution is relatively uniform, but the value is low. The airflow dissipates horizontally at a high place without causing local cold shock. It can be speculated that if the circular diffusion is selected to make the air velocity spread around, it would not necessarily require a higher air velocity, resulting in local severe cold shock. Case 2 uses the air inlet as a horizontal jet, which can overcome the extended range of space span and cope with the particular space geometry of high ceilings. It can reduce the cold shock area compared with the vertical jet. However, due to the concentration of airflow, the air distribution is quite uneven. Thus, it is difficult to avoid the occurrence of cold shock. In case 3, to ensure a comfortable air velocity in the back row, the air velocity is set at 3 m/s in inlets, which is higher than other schemes. Therefore, the air velocity would be too large for the front row. If this case is applied to a small-scale stepped space, it will have the opportunity to adjust to the appropriate air velocity in the residential area. Case 4 uses displacement ventilation equipment with a low air velocity mode, which can be close to the air velocity in the residential area. Meanwhile, the flow dissipation is not affected by the height of seats and other obstacles, which is easy to control.
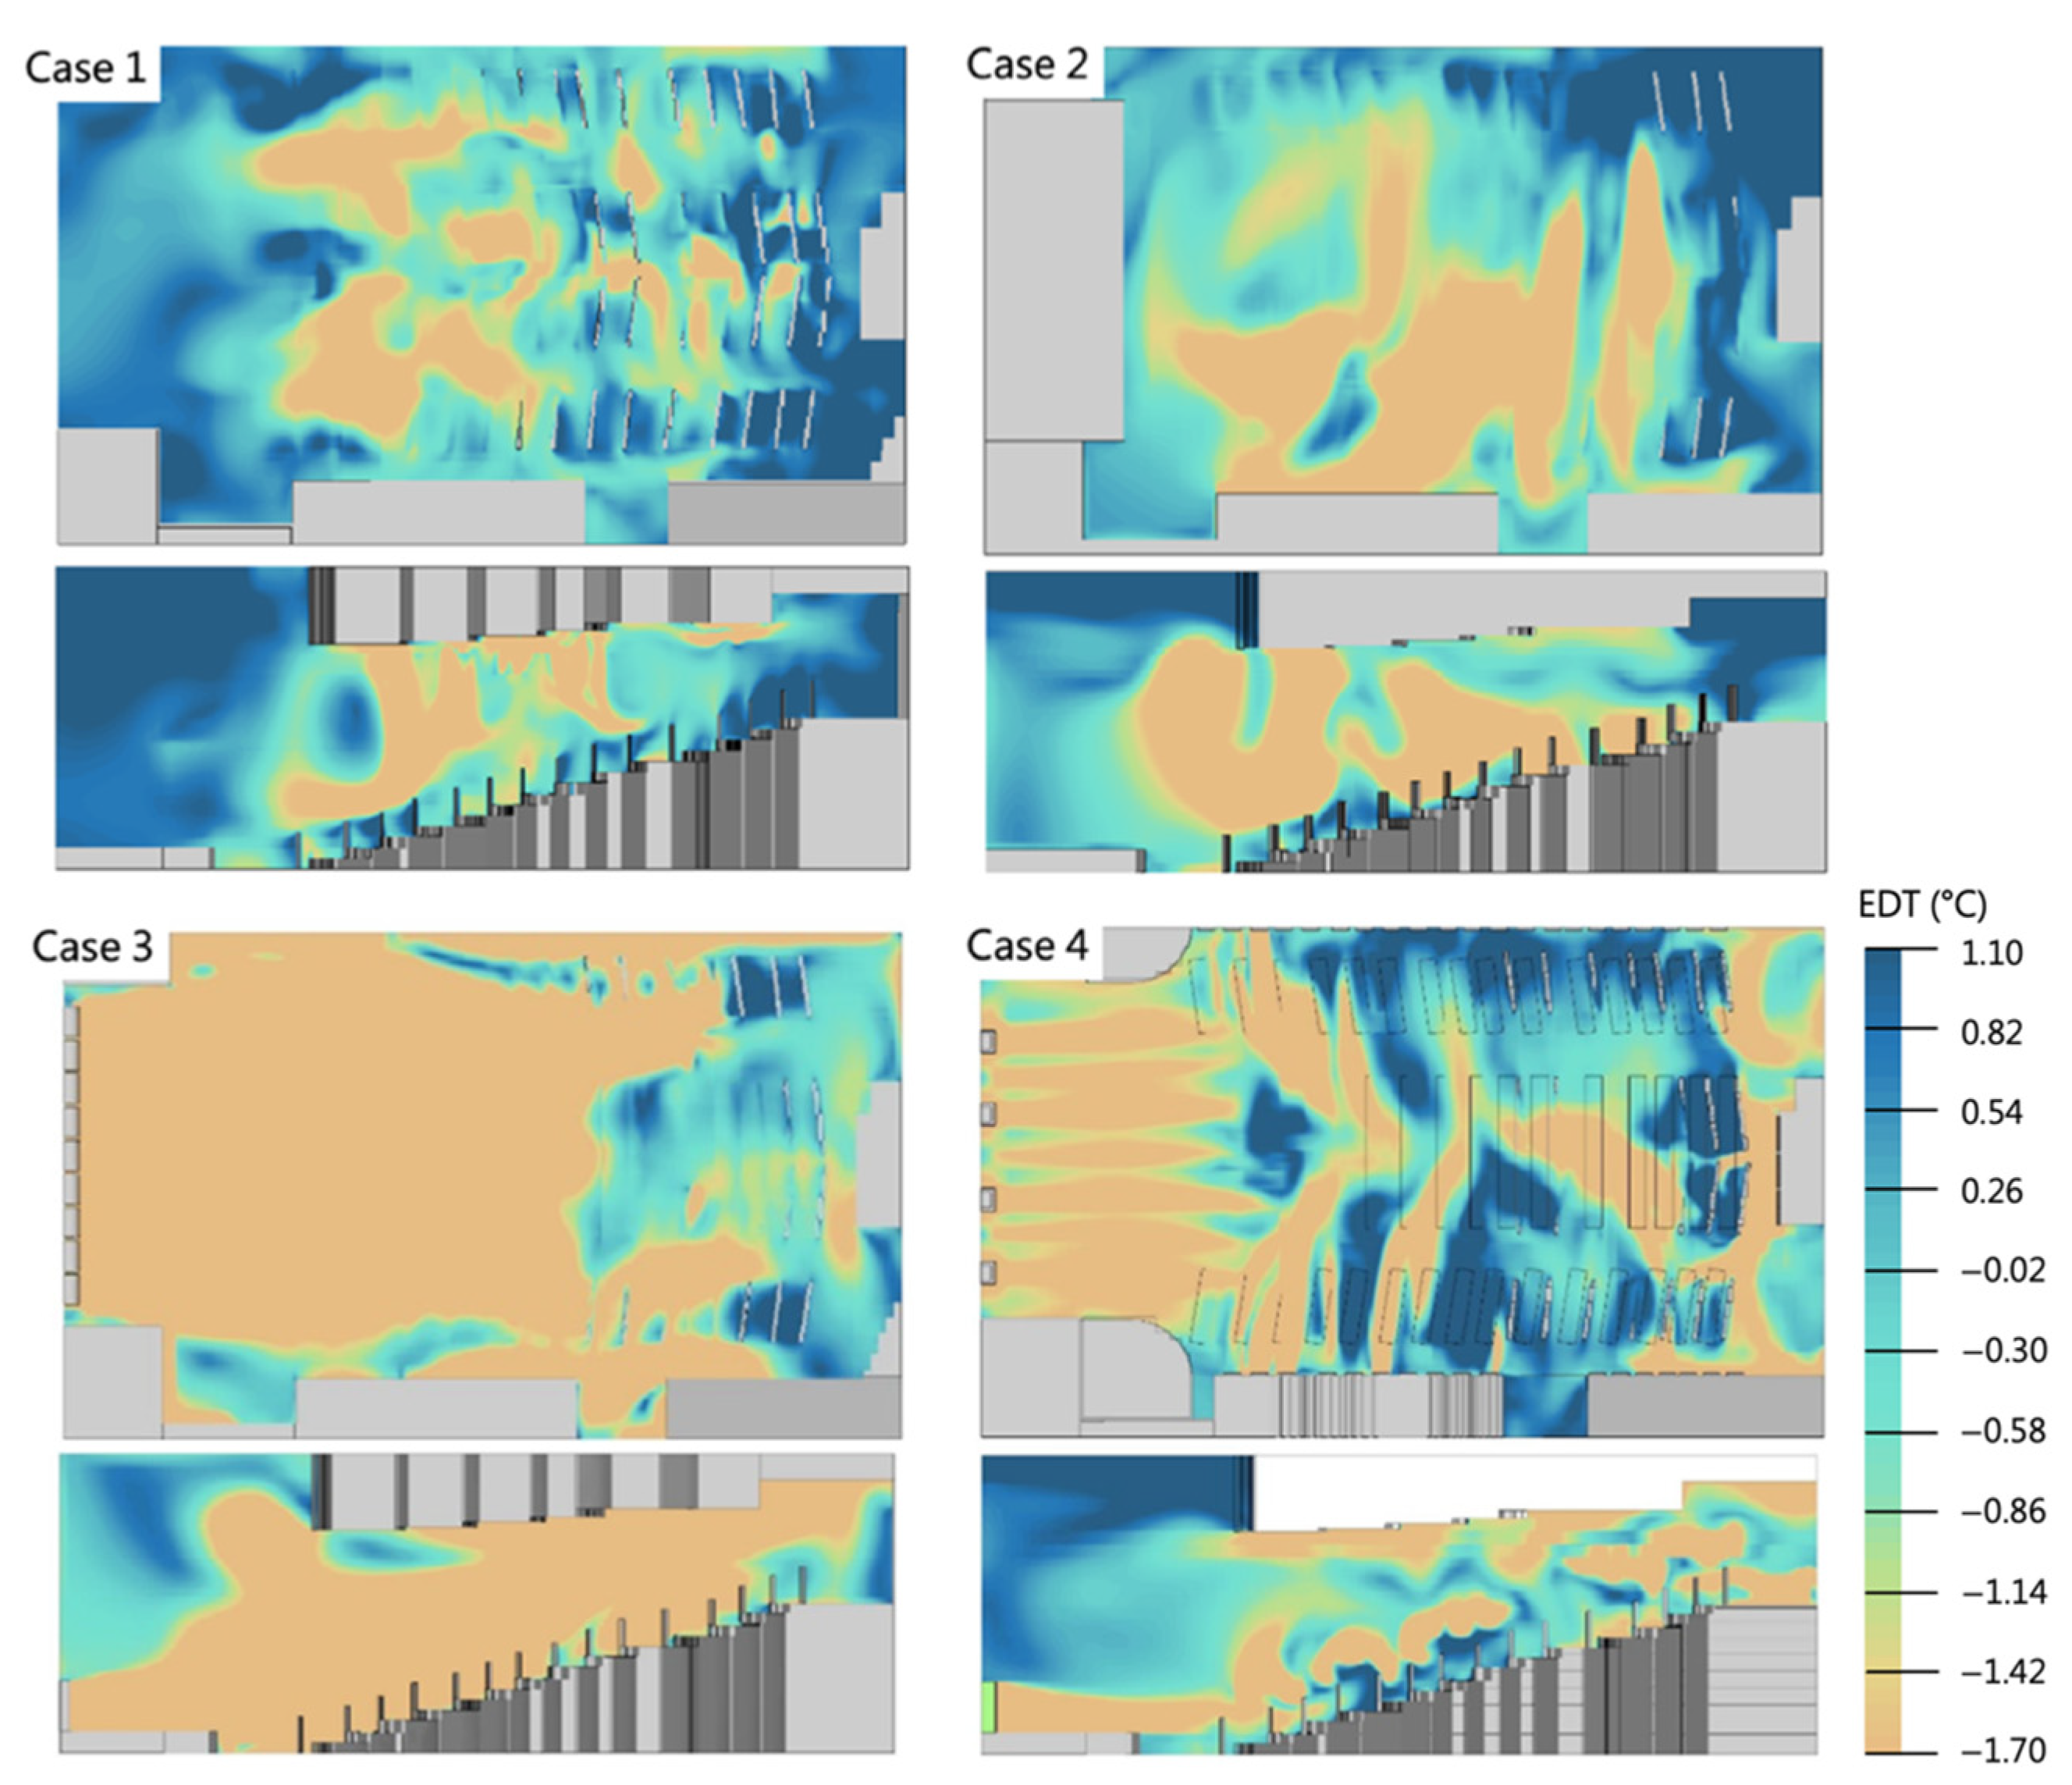
3.3.3. EDT and ADPI Distribution
Figure 18 and Figure 19 show the distribution of EDT and ADPI of each scheme. Among them, ADPI, which represents thermal comfort distribution, needs to convert the data through post-processing in FlowDesigner software. In ADPI, “0” means that EDT is not within the recommended range of −1.7~1.1, and the air velocity is higher than 0.35 m/s; “1” means that the EDT range is between −1.7 and 1.1, or the air velocity is less than 0.35 m/s, which meets one of these two conditions; “2” means that the EDT is between −1.7 and 1.1, and the air velocity is less than 0.35 m/s. Thus, when the ADPI value is 2, the temperature and air velocity distribution in the case room are more uniform, with less cold shock. At this time, the air that can provide heating and comfort is evenly distributed, which is conducive to controlling the air conditioning in the auditorium. At the same time, when the EDT in a particular area is in the comfortable range, but the ADPI is not “2”, there is a risk of cold shock. The temperature distribution in this area has the potential for comfort, but the air velocity exceeds 0.35 m/s. Then, the analysis results are fed back to the design stage. The modification direction can be clarified to enter the simulation review process of the next stage.
In case 1, EDT is within the comfort range, and the area with a high ADPI value reaches 80%. It can be seen that although EDT performs well and then raises the ADPI value, the area with air velocity exceeding 0.35 m/s accounts for a relatively high proportion. Therefore, placing the air inlet on the ceiling is still difficult to avoid the situation of high air velocity altogether. Meanwhile, in the air velocity profile, the low-temperature air flow must be sent from the ceiling to the residential area, so the energy consumption of this scheme is higher than that of other schemes. On the other hand, the EDT and ADPI of case 2 are the most uneven. Even if the average value of EDT in the residential area is within the comfort range, the temperature variation range is significant. According to the performance of ADPI, there is no place where the air velocity and temperature can reach a balanced and comfortable state. Therefore, it is not easy to adjust the temperature uniformly by using central air conditioning to make most people comfortable.
Meanwhile, in case 3, the EDT distribution is relatively uniform because the air supply direction is consistent with the exhaust direction. Although the residential area is in a supercooled state, according to the previous results, a comfortable environment can be provided with a low air velocity in a small space. The comparison between EDT and ADPI shows that ADPI presents 0 in most ranges, confirming that the air velocity and temperature provided by this air conditioning configuration do not apply to this space. At last, the performance of case 4 is the best, where the ADPI can achieve the same good distribution effect as case 1. Due to the dense seating and space of this case, it was finally decided to place the air inlet above the residential area. It can be observed from the profile that the position of the air inlet is supercooled. The airflow down to the seating area can provide a good EDT value.
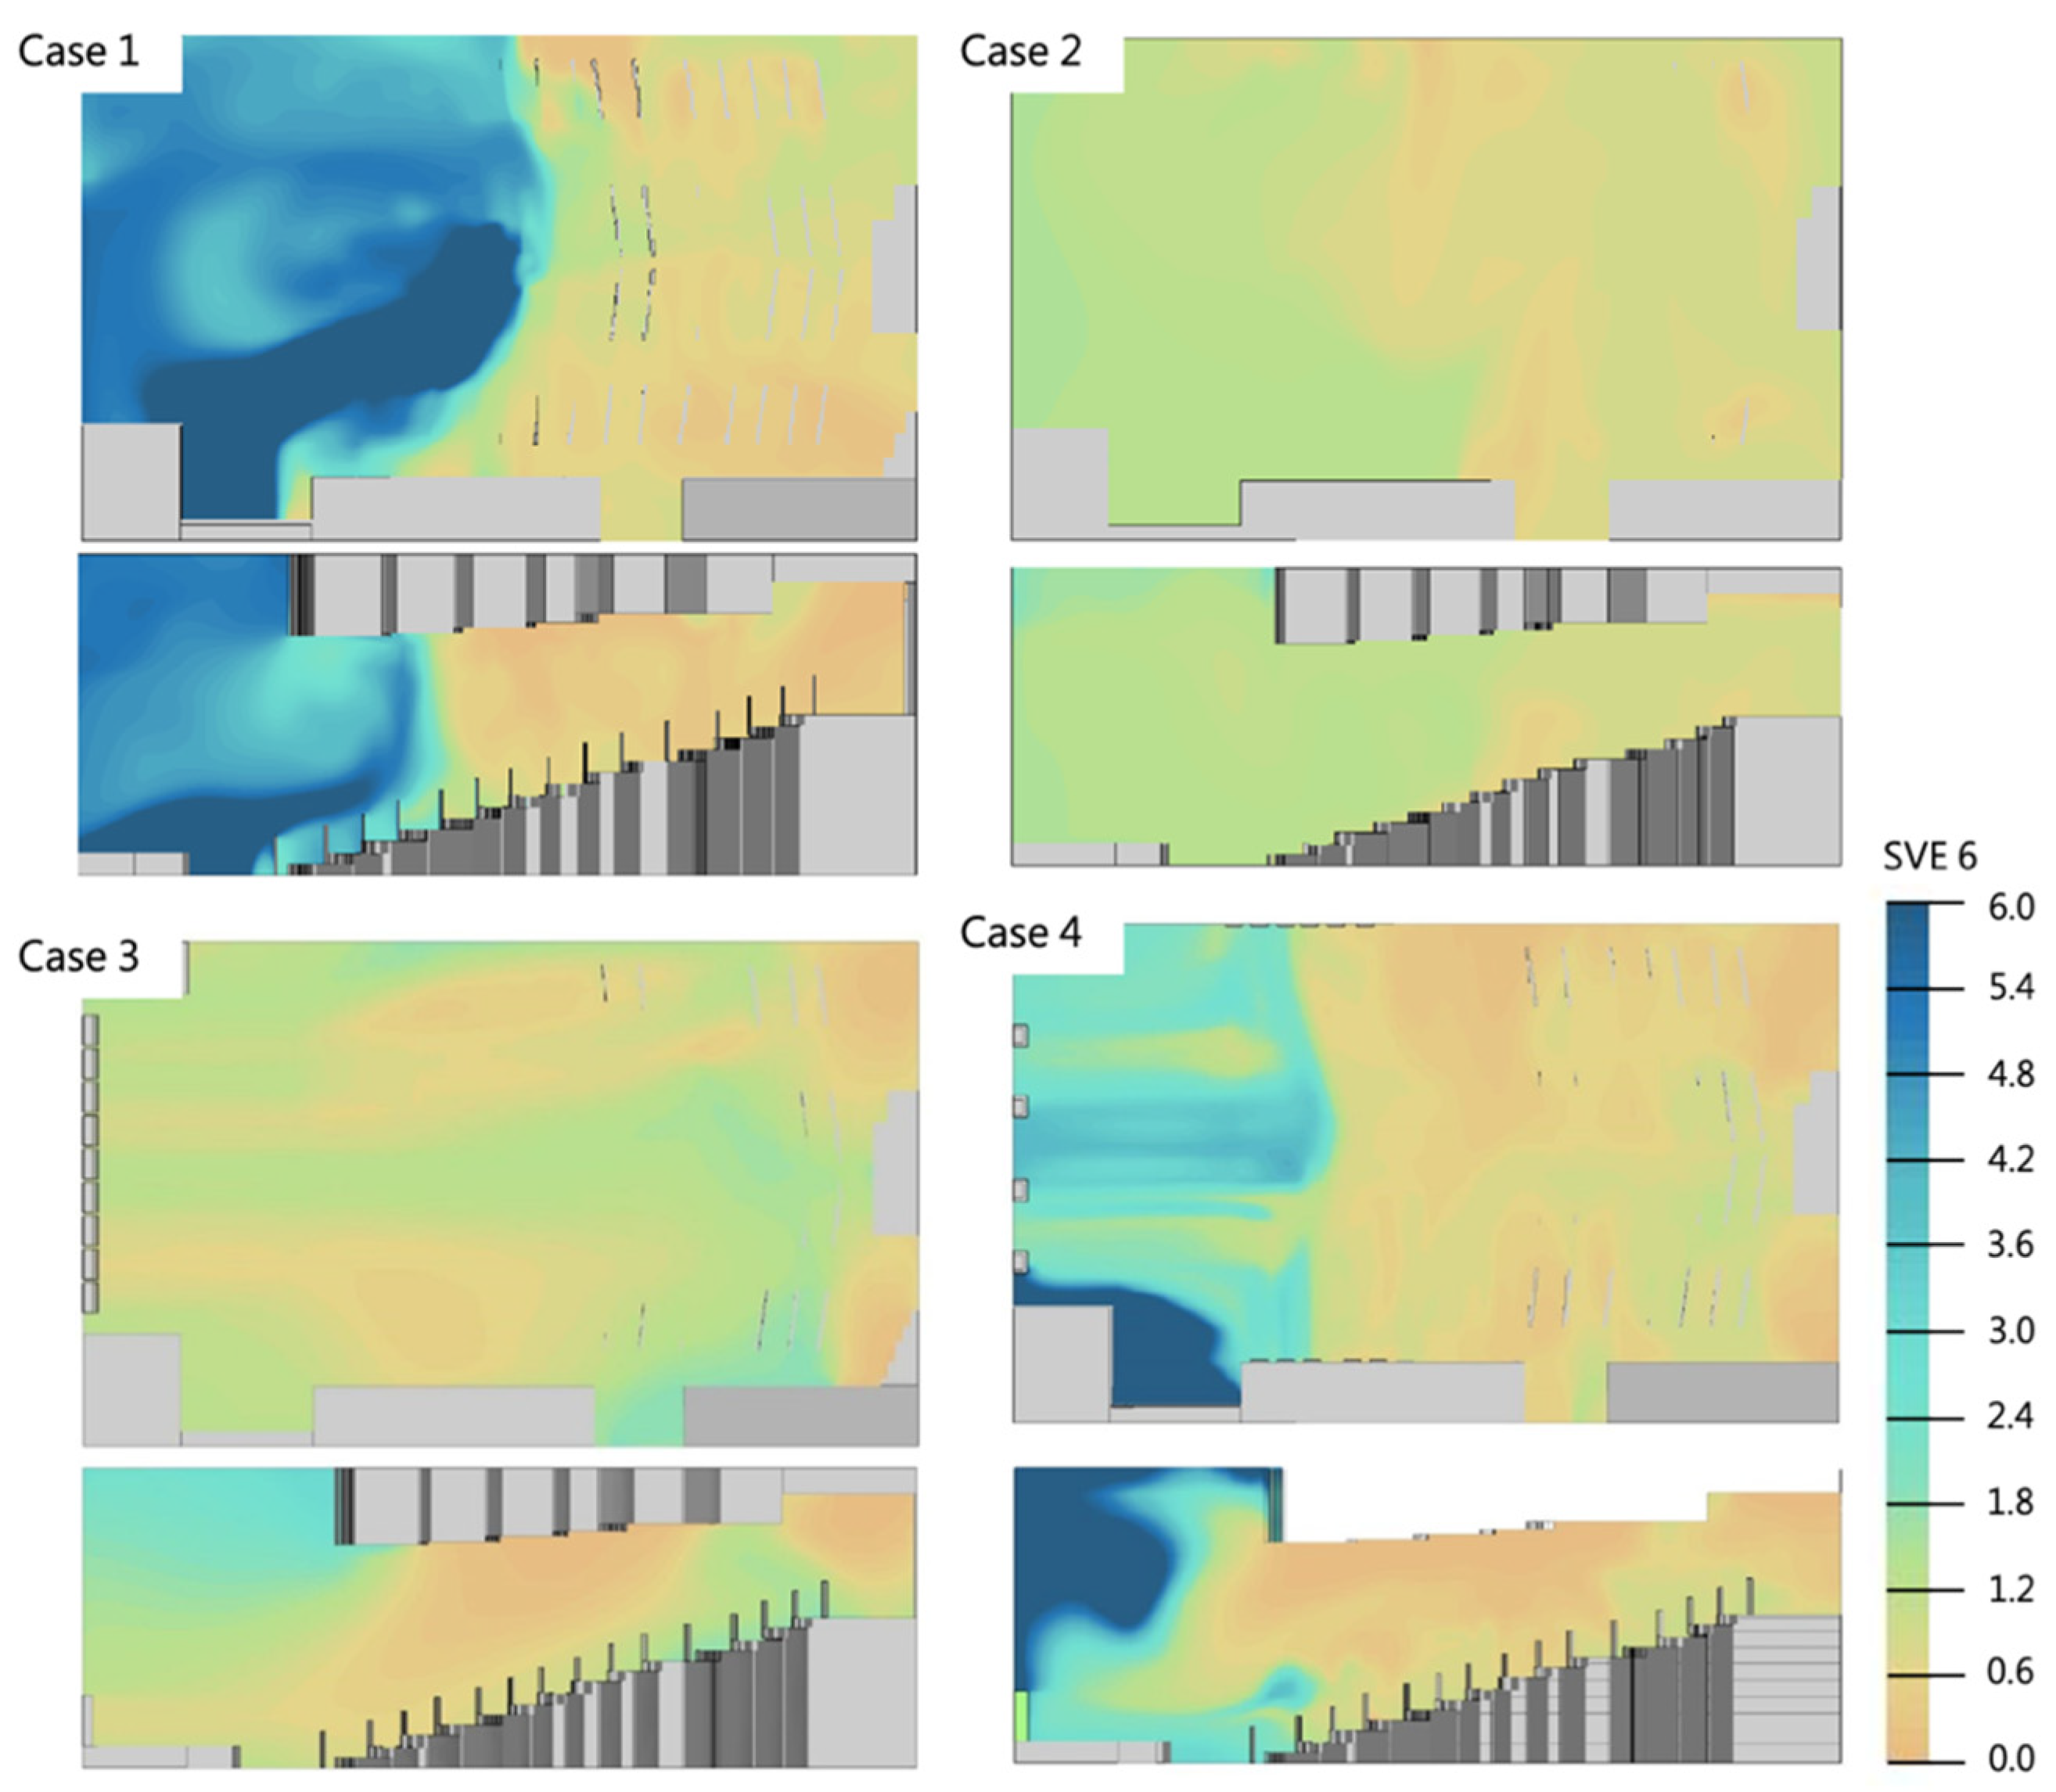
3.3.4. SVE6 Distribution
In case 1, it can be seen from Figure 20 that there are apparent differences in the distribution of SVE6. The SVE6 value is high in the area of the podium. Due to the distance from the exhaust outlet, the air in the lower position of the seating area is less fresh. The upper air inlet quickly discharges the air in the seating area. In case 2, the airflow in the whole space can be mixed due to the high air velocity. Unlike other schemes, which have apparent air retention far from the exhaust outlet, the SVE6 value of the whole room is relatively small. Therefore, the air inlet design of case 2 is helpful for air removal. Case 3 is similar to case 2. After the air comes out from the podium area, it flows to the exhaust outlet through the seating area, and the path is clear. It can be seen that the performance of removing air is good, which is easy to predict and control. Case 4 also performs well in air freshness. It has a small value of SVE6 in the range of residential areas, indicating that the air can be eliminated soon. Moreover, the airflow of this case is concentrated in the residential area, which is a highly efficient airflow treatment scheme.
3.4. Comprehensive Comparison
Table 6 compares the data of various schemes and the regional comparison of the residential area’s front, middle, and back areas according to the distance from the podium. Among them, only case 4 can provide ADPI values that exceed the recommended value by 80%, while case 1 provides 76.95%, which is also close to the recommended value. According to ASHRAE, if the EDT in the middle seat area is negative and less than 20%, this area can be considered supercooling. Therefore, in case 1, adjusting the air inlet temperature in the middle seat area could improve thermal comfort. Case 2 has a low EDT value, and it is not easy to judge why the ADPI value cannot reach good results. In the simulation, the jet air inlet causes the high air velocity in the inlet points, resulting in no problem with the average value of ADPI. It can be seen that the jet inlet is excessively concentrated in this space, which cannot give a uniform and comfortable airflow to the residential area. Thus, case 2 is not applicable.
Furthermore, in case 3, it is evident from the visual simulation results and data that the temperature in the front seat area is too low, and the air velocity is too high. EDTs are negative in case 3, and the uncomfortable EDT percentages of the front, middle, and rear seat areas are 88.5%, 58.8%, and 20.5%, respectively. The cold shock occurs if they exceed 20%. However, the rear seat area’s thermal comfort and air quality are good because the air velocity is too high. Nevertheless, the air distribution outside the excessive air velocity could reach uniform comfort. Therefore, if this air inlet configuration is set in a small space, it can provide a pretty good air environment in the residential area after adjusting the air velocity. In case 4, the air inlet is closest to the occupant and is expected to provide the most uniform air distribution in the residential area. It is the only one of the four schemes with an ADPI of more than 80%, providing good thermal comfort. However, the air quality in the front seat area is very unsatisfactory. SVE6 represents air quality and is inversely proportional to air discharge speed. The average value of SVE6 in the whole room is more than twice that of other schemes. It can be interpreted that case 4 needs twice the time to replace fresh air compared with other schemes.
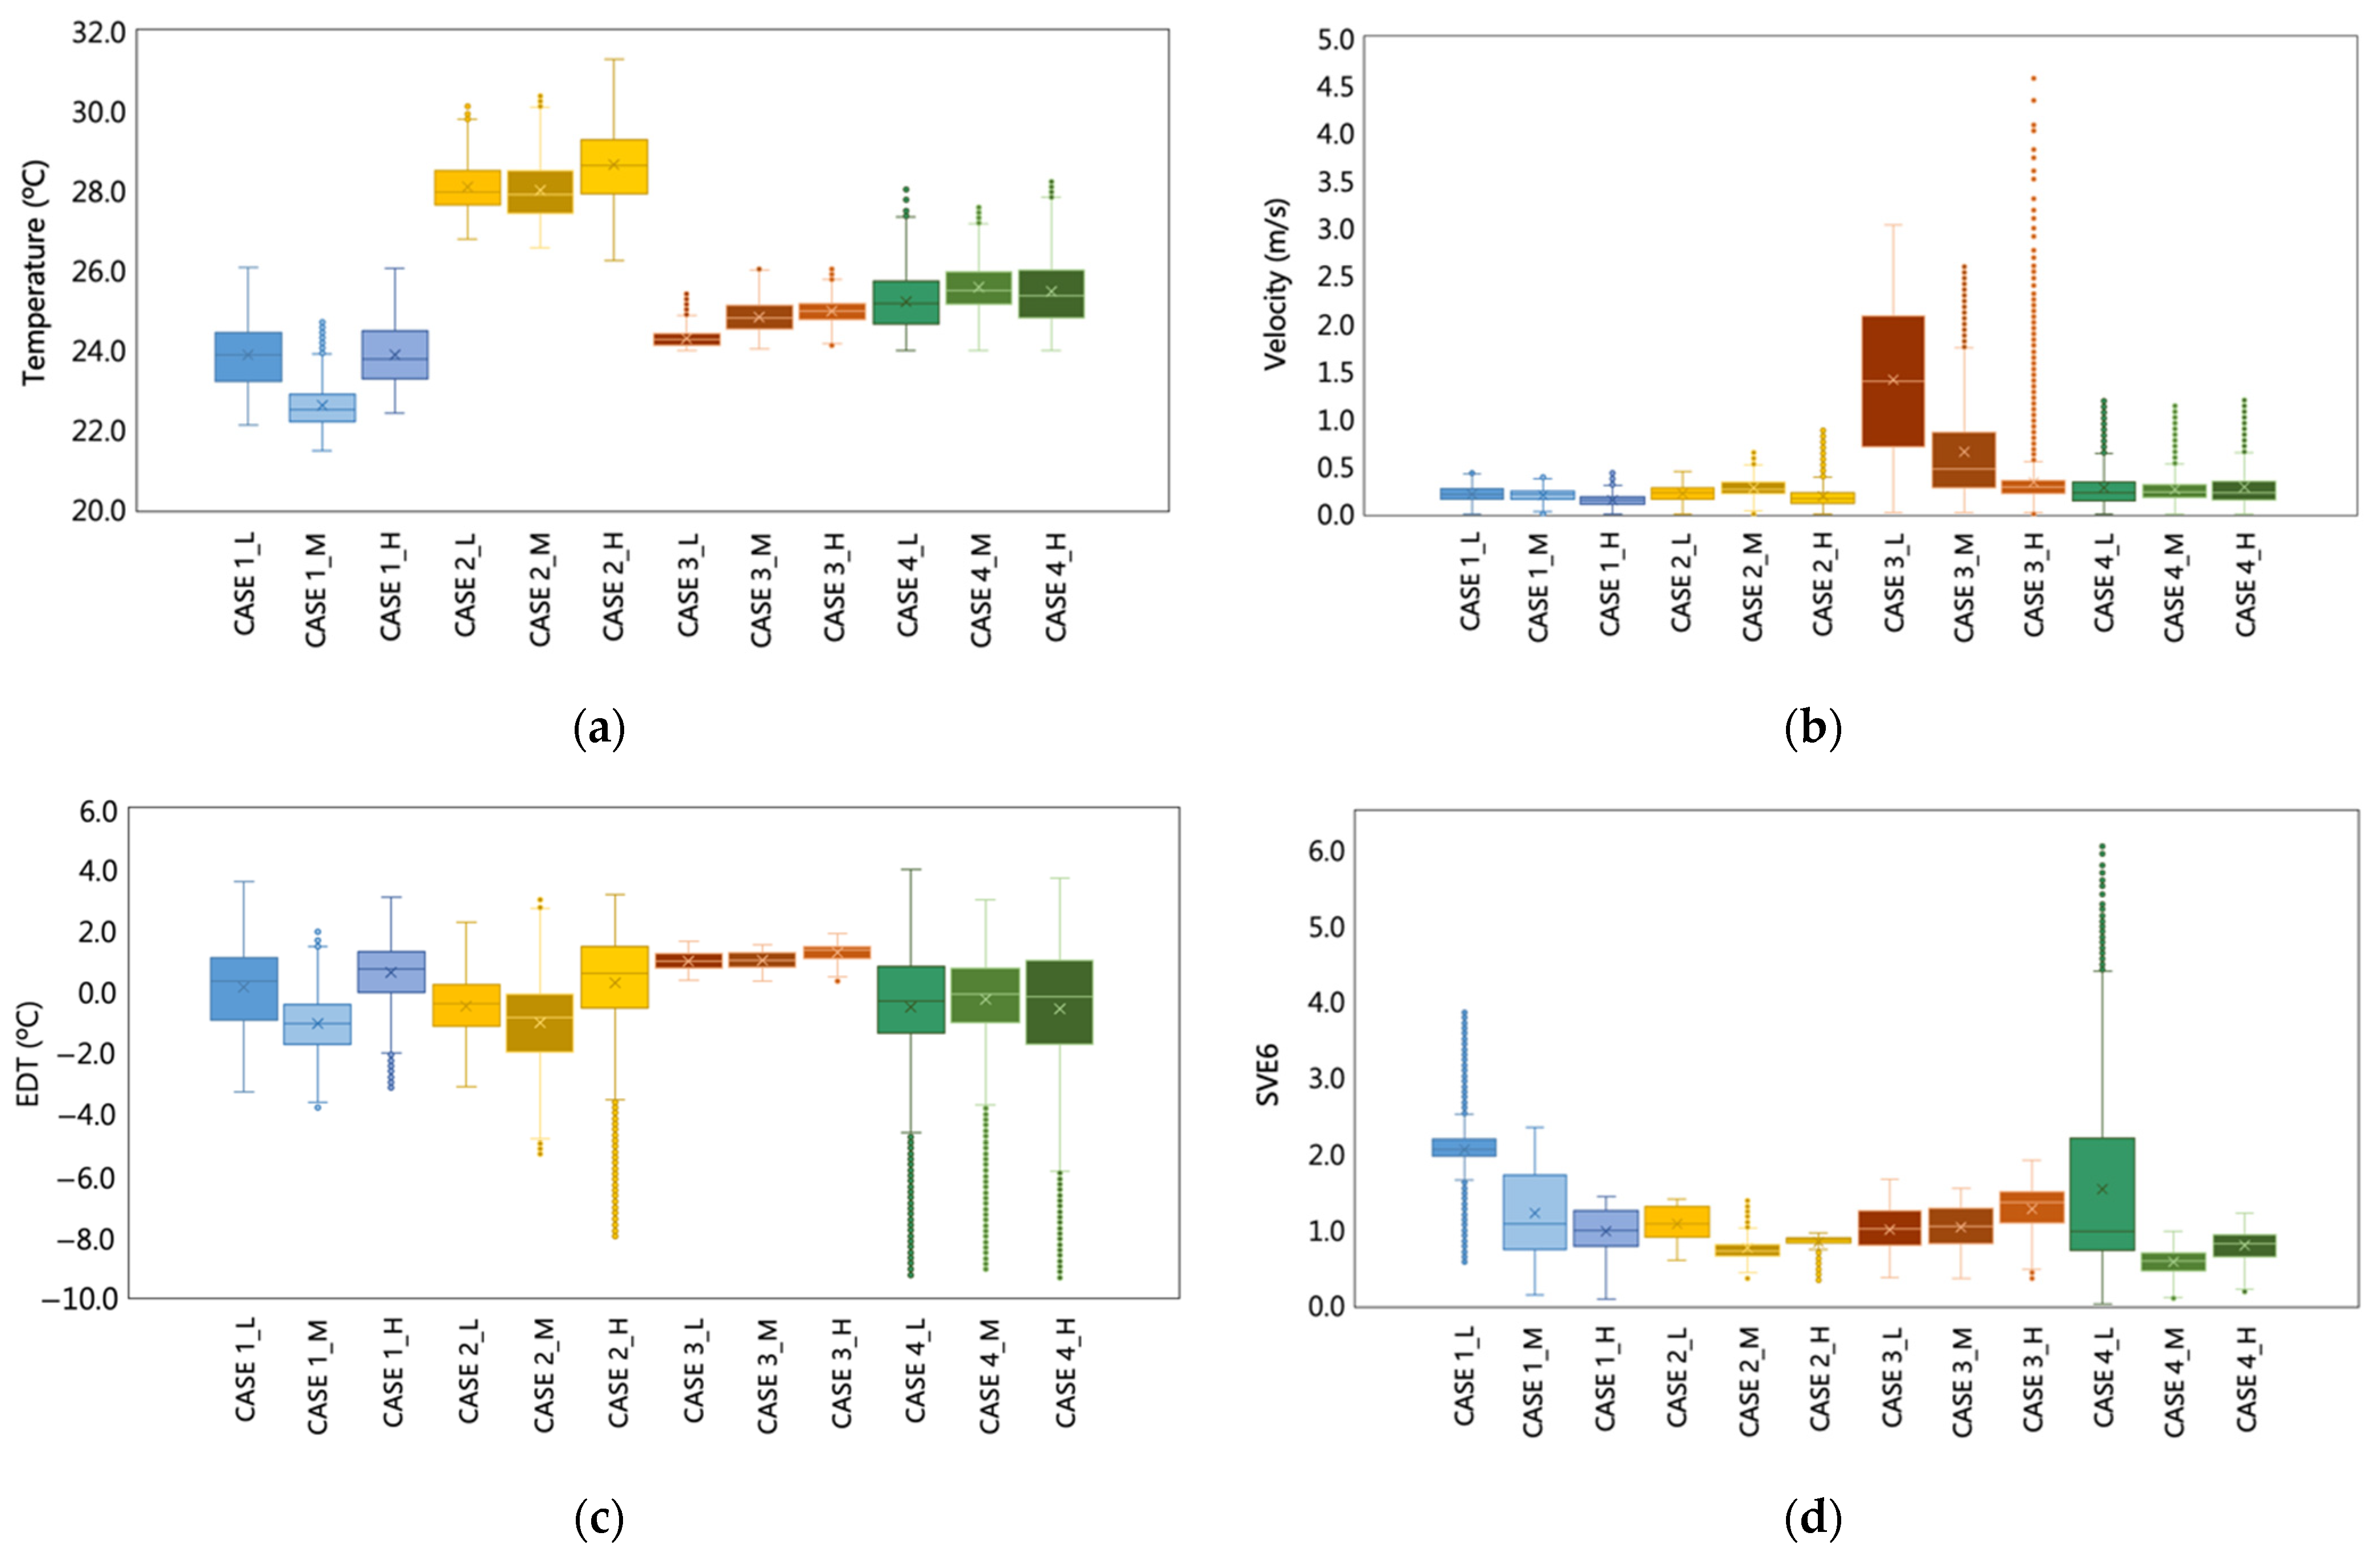
In Figure 21, the box plot diagram shows the data distribution of the front, middle, and rear seat areas of each scheme. The temperature of cases 3 and 4 increases with seat height, which is consistent with the vertical temperature stratification. However, the temperature distribution of case 1 and case 2 is relatively irregular, which is inconsistent with the ideal condition of FMV. Therefore, the temperature of the stepped space is easier to be controlled by the displacement ventilation in cases 3 and 4.
Meanwhile, except for case 3, other schemes are within the controllable range. Because the air velocity data of case 3 changes significantly in the front seat area. Most of the EDT values of case 3 are not within the comfort range. Meanwhile, most of the uncomfortable EDT data are negative, indicating that most of the area is supercooled. Regarding air quality, case 1 needs a longer time than other schemes to replace the stale air, especially in the front seat area. It is speculated that the air outlet is far away from the seating area, resulting in no adequate ventilation in the front seat area, and there is a slight airflow short circuit. Therefore, the stepped space temperature is easier to control by the displacement ventilation of cases 3 and 4.
3.5. Discussion of Scheme Results
Therefore, when case 1 wants to achieve general thermal comfort in the original scheme, the temperature needs to be lower than that of other schemes. However, when its airflow reaches the seating area, the temperature is similar to that of other schemes. Thus, the cooling efficiency of the original scheme is poor. However, due to the moderate space size, its energy consumption is lower than that of other schemes. Meanwhile, the air freshness cannot be guaranteed if the exhaust outlets are evenly arranged on the ceiling. Thus, there are some problems with the original scheme. First, the external air input is insufficient. It is recommended to increase the performance or quantity of the equipment. Second, in the FMV design method, when planning to deliver air vertically from the air inlet of the ceiling to the residential area, the air velocity should be controlled to avoid cold shock. The ADPI value still has a chance to reach 80%. Third, when the return air outlet is planned to be close to the air inlet, it is necessary to avoid short circuits. Fourth, the diffuser selection process of the original scheme is too simple for the stepped space.
The air conditioning design strategy of the improved scheme adds a review process, which takes building performance simulation as the review tool and indicators EDT, ADPI, and SVE6 as the review standards. It can quickly know the overall design effect through visual steps and then obtain the local data of the seating area from the model’s simulation results to analyze the air distribution in each area accurately. In the FMV strategy, the design effect can only be known when the inspection steps are performed after the construction is complete. This new design strategy dramatically improves the efficiency of air conditioning design.
The proposed design strategy prevents the occurrence of cold shock when selecting the form of air conditioning. When the FMV is selected, the maximum air velocity at the highest point shall be the basis for selecting inlet performance. Similarly, when displacement ventilation is selected, it is also necessary to consider the reservation of adjacent areas of air conditioning. Meanwhile, the ADPI index cannot be used alone to select the appropriate air supply form, but it can be applied to the analysis of building performance simulation results because displacement ventilation equipment does not have this value. In addition, from the performance of SVE6 in each scheme, it can be seen that the position of the exhaust outlet has a more significant impact than different air inlet modes.
4. Conclusions
This study researched the air quality and thermal comfort in a stepped hall with an improved HVAC design strategy based on the building performance simulation. It selected indicators showing the spatial distribution of indoor air quality and thermal comfort. After comparing different indicators, SVE6 was finally used to represent the air freshness in this study, which is more accurate in analyzing the air quality than the general specification. In the thermal comfort part, ADPI was used to cooperate with the diffuser selection of the air conditioning system. At the same time, areas with high air velocities can be screened out by combining ADPI and EDT indicators. Moreover, several HVAC configurations were proposed in this research.
The application of a particular stepped space in this study proves that the FMV strategy cannot meet the requirements of occupants for air and thermal environment. In this study, the cold shock range in the middle seat area exceeded 20% of the specification. Meanwhile, the selection conditions of the diffuser were relatively few, which may lead to excessive design. The simulation results show that in the original scheme, although the ADPI value is 76.95%, the SVE6 in the residential area is 2.54. In contrast, the SVE6s in the rest of the schemes are between 0.89 and 0.92, which only needs one-third of the time to exhaust air. For stepped space, the vertical descent elevation of the air inlets is more critical than the diffusion range. Thus, in the design of the air inlet, displacement ventilation also needs to be considered.
Furthermore, this study adopted the method of zoning in building performance simulation. It can analyze the value of residential areas separately and even distinguish high, middle, and low seats. After using building performance simulation for visualization, air distribution indicators such as ADPI are pretty helpful in analyzing the effect of the air conditioning system. With EDT and ADPI as post-processing, it can be screened out in advance that the air velocity setting or air supply temperature setting of this air conditioning system needs to be adjusted. Finally, this study confirmed that the proposed HAVC design strategy with building performance simulation could effectively analyze the effect of different air-conditioning design cases. Meanwhile, it could quickly present visual images for inspection and comparison, saving the time of building complex models and reducing the cost of air conditioning technicians.
In future research, this strategy should be applied in more complex cases of building performance simulation. Furthermore, more evaluation indicators in the air conditioning design strategy should be evaluated, and airflow simulation should consider both ADPI and SVE to facilitate the work of air conditioning designers.
Author Contributions
Conceptualization, Y.-S.T. and Y.-T.L.; methodology, Y.-S.T. and Y.-T.L.; software, Y.-T.L.; validation, R.C. and Y.-T.L.; formal analysis, R.C. and Y.-T.L.; investigation, Y.-T.L.; resources, Y.-S.T.; data curation, Y.-T.L.; writing—original draft preparation, R.C.; writing—review and editing, R.C.; visualization, R.C. and Y.-T.L.; supervision, Y.-S.T.; project administration, Y.-S.T.; funding acquisition, Y.-S.T. All authors have read and agreed to the published version of the manuscript.
Funding
This research was funded by the Ministry of Science and Technology, grant number 111-2221- E-006-055.
Institutional Review Board Statement
Not applicable.
Informed Consent Statement
Not applicable.
Data Availability Statement
The data presented in this study are available on request from the corresponding author.
Conflicts of Interest
The authors declare no conflict of interest.
References
- Brozovsky, J.; Radivojevic, J.; Simonsen, A. Assessing the impact of urban microclimate on building energy demand by coupling CFD and building performance simulation. J. Build. Eng. 2022, 55, 104681. [Google Scholar] [CrossRef]
- Chen, R.; Tsay, Y.-S.; Ni, S. An integrated framework for multi-objective optimization of building performance: Carbon emissions, thermal comfort, and global cost. J. Clean. Prod. 2022, 359, 131978. [Google Scholar] [CrossRef]
- Shih, Y.C.; Tamilarasan, S.; Chen, P.H.; Tsao, C.C.; Lin, C.H. Optimal thermohydraulic design of the indoor unit of a split-type air conditioner. Appl. Therm. Eng. 2022, 211, 118502. [Google Scholar] [CrossRef]
- Awbi, H.B. Ventilation and air distribution systems in buildings. Front. Mech. Eng. 2015, 1, 4. [Google Scholar] [CrossRef]
- Navaratnam, S.; Nguyen, K.; Selvaranjan, K.; Zhang, G.; Mendis, P.; Aye, L. Designing post COVID-19 buildings: Approaches for achieving healthy buildings. Buildings 2022, 12, 74. [Google Scholar] [CrossRef]
- Vakiloroaya, V.; Samali, B.; Fakhar, A.; Pishghadam, K. A review of different strategies for HVAC energy saving. Energy Convers. Manag. 2014, 77, 738–754. [Google Scholar] [CrossRef]
- Sukarno, R.; Putra, N.; Hakim, I.I.; Rachman, F.F.; Indra Mahlia, T.M. Utilizing heat pipe heat exchanger to reduce the energy consumption of airborne infection isolation hospital room HVAC system. J. Build. Eng. 2021, 35, 102116. [Google Scholar] [CrossRef]
- Heidarshenas, B.; Sina, N.; El-Shafay, A.S.; Saleem, S.; Sharifpur, M. The effect of the zigzag arrangement of lithium-ion batteries inside the air duct of an office building for heating and evaluation of the impact of the number of air outlets in different seasons of the year. J. Energy Storage 2022, 50, 104204. [Google Scholar] [CrossRef]
- Kim, J.; Hong, T.; Lee, M.; Jeong, K. Analyzing the real-time indoor environmental quality factors considering the influence of the building occupants’ behaviors and the ventilation. Build. Environ. 2019, 156, 99–109. [Google Scholar] [CrossRef]
- Jung, W.; Jazizadeh, F. Human-in-the-loop HVAC operations: A quantitative review on occupancy, comfort, and energy-efficiency dimensions. Appl. Energy 2019, 239, 1471–1508. [Google Scholar] [CrossRef]
- Ren, C.; Cao, S.J.; Haghighat, F. A practical approach for preventing dispersion of infection disease in naturally ventilated room. J. Build. Eng. 2022, 48, 103921. [Google Scholar] [CrossRef]
- Federation of European Heating Ventilation and Associations Air Conditioning (REHVA). Hygiene Requirement for Ventilation and Air Conditioning; Federation of European Heating Ventilation and Associations Air Conditioning (REHVA): Brussels, Belgium, 2007. [Google Scholar]
- Zhang, L.; Wen, J.; Li, Y.; Chen, J.; Ye, Y.; Fu, Y.; Livingood, W. A review of machine learning in building load prediction. Appl. Energy 2021, 285, 116452. [Google Scholar] [CrossRef]
- Lam, J.C.; Chan, A.L.S. CFD analysis and energy simulation of a gymnasium. Build. Environ. 2001, 36, 351–358. [Google Scholar] [CrossRef]
- American Society of Heating Refrigerating and Air-Conditioning Engineers (ASHRAE). 1999 ASHRAE Handbook: Heating, Ventilating, and Air-Conditioning Applications; American Society of Heating Refrigerating and Air-Conditioning Engineers (ASHRAE): Atlanta, GA, USA, 1999. [Google Scholar]
- Ghani, S.; Mahgoub, A.O.; Bakochristou, F.; ElBialy, E.A. Assessment of thermal comfort indices in an open air-conditioned stadium in hot and arid environment. J. Build. Eng. 2021, 40, 102378. [Google Scholar] [CrossRef]
- Ho, S.H.; Rosario, L.; Rahman, M.M. Comparison of underfloor and overhead air distribution systems in an office environment. Build. Environ. 2011, 46, 1415–1427. [Google Scholar] [CrossRef]
- Heidarinejad, G.; Fathollahzadeh, M.H.; Pasdarshahri, H. Effects of return air vent height on energy consumption, thermal comfort conditions and indoor air quality in an under floor air distribution system. Energy Build. 2015, 97, 155–161. [Google Scholar] [CrossRef]
- Ng, K.C.; Kadirgama, K.; Ng, E.Y.K. Response surface models for CFD predictions of air diffusion performance index in a displacement ventilated office. Energy Build. 2008, 40, 774–781. [Google Scholar] [CrossRef]
- Chiang, W.H.; Wang, C.Y.; Huang, J.S. Evaluation of cooling ceiling and mechanical ventilation systems on thermal comfort using CFD study in an office for subtropical region. Build. Environ. 2012, 48, 113–127. [Google Scholar] [CrossRef]
- Liu, S.; Clark, J.; Novoselac, A. Air diffusion performance index (ADPI) of overhead-air-distribution at low cooling loads. Energy Build. 2017, 134, 271–284. [Google Scholar] [CrossRef]
- Wang, J.; Hihara, E. Prediction of air coil performace under partially wet and totally wet cooling conditions using equivalent dry-bulb temperature method. Int. J. Refrig. 2003, 26, 293–301. [Google Scholar] [CrossRef]
- Ahn, J.; Choi, H.Y. Effects of supply angle on thermal environment of residential space with hybrid desiccant cooling system for multi-room control. Appl. Sci. 2020, 10, 7271. [Google Scholar] [CrossRef]
- Liu, X.; Lv, X.; Peng, Z.; Shi, C. Experimental study of airflow and pollutant dispersion in cross-ventilated multi-room buildings: Effects of source location and ventilation path. Sustain. Cities Soc. 2020, 52, 101822. [Google Scholar] [CrossRef]
- Chen, J.; Brager, G.S.; Augenbroe, G.; Song, X. Impact of outdoor air quality on the natural ventilation usage of commercial buildings in the US. Appl. Energy 2019, 235, 673–684. [Google Scholar] [CrossRef]
- Wang, X.; Liu, T.; Lee, W.L. Using revised ADPIs to identify an optimum positioning for installation of reversible room air-conditioners in bedroom for maximum thermal comfort. Build. Environ. 2021, 188, 107333. [Google Scholar] [CrossRef]
- Limane, A.; Fellouah, H.; Galanis, N. Three-dimensional OpenFOAM simulation to evaluate the thermal comfort of occupants, indoor air quality and heat losses inside an indoor swimming pool. Energy Build. 2018, 167, 49–68. [Google Scholar] [CrossRef]
- Murakami, S. New Scales for Ventilation Efficiency and Their Application Based on Numerical Simulation of Room Airflow. In Proceedings of the International Symposium on Room Air Convection and Ventilation Effectiveness, Tokyo, Japan, 22–24 July 1992; pp. 22–38. [Google Scholar]
- Kato, S.; Yang, J.H. Study on inhaled air quality in a personal air-conditioning environment using new scales of ventilation efficiency. Build. Environ. 2008, 43, 494–507. [Google Scholar] [CrossRef]
- Lim, S.Y.; Chang, H.J. Airflow management analysis to suppress data center hot spots. Build. Environ. 2021, 197, 107843. [Google Scholar] [CrossRef]
- Zhu, S.; Demokritou, P.; Spengler, J. Experimental and numerical investigation of micro-environmental conditions in public transportation buses. Build. Environ. 2010, 45, 2077–2088. [Google Scholar] [CrossRef]
- Zhang, D.D.; Zhong, H.Y.; Liu, D.; Zhao, F.Y.; Li, Y.; Wang, H.Q. Multi-objective-oriented removal of airborne pollutants from a slot-ventilated enclosure subjected to mechanical and multi component buoyancy flows. Appl. Math. Model. 2018, 60, 333–353. [Google Scholar] [CrossRef]
- Liu, R.; Wen, J.; Waring, M.S. Improving airflow measurement accuracy in VAV terminal units using flow conditioners. Build. Environ. 2014, 71, 81–94. [Google Scholar] [CrossRef]
- Lei, B.; He, B.; Zhao, Z.; Xu, G.; Wu, B. A method for identifying the fire status through ventilation systems using tracer gas for improved rescue effectiveness in roadway drivage of coal mines. Process. Saf. Environ. Prot. 2021, 151, 151–157. [Google Scholar] [CrossRef]
- Afonso, C. Tracer gas technique for measurement of air infiltration and natural ventilation: Case studies and new devices for measurement of mechanical air ventilation in ducts. Int. J. Low Carbon Technol. 2013, 10, 188–204. [Google Scholar] [CrossRef]
- Hu, Y.; Peng, Y.; Gao, Z.; Xu, F. Application of CFD plug-ins integrated into urban and building design platforms for performance simulations: A literature review. Front. Archit. Res. 2022; in press. [Google Scholar] [CrossRef]
- Chen, Q.; Srebric, J. Application of CFD tools for indoor and outdoor environment design. Int. J. Archit. Sci. 2000, 1, 14–29. [Google Scholar]
- Manservisi, S.; Menghini, F. Numerical simulations of optimal control problems for the Reynolds averaged Navier-Stokes system closed with a two-equation turbulence model. Comput. Fluids 2016, 125, 130–143. [Google Scholar] [CrossRef]
- Dorri, A.; Alcani, M.; Maraj, A. Behavior of a HVAC air diffuser in different condition. In Proceedings of the International Conference on Academic Research in Engineering, Management and Information Technology (ICAREMIT 2015), Bareilly, India, 21 February 2015; Volume 4. [Google Scholar]
- Wang, Y.; Chen, H.C.; Koop, A.; Vaz, G. Verification and validation of CFD simulations for semi-submersible floating offshore wind turbine under pitch free-decay motion. Ocean Eng. 2021, 242, 109993. [Google Scholar] [CrossRef]
- Calzolari, G.; Liu, W. Deep learning to replace, improve, or aid CFD analysis in built environment applications: A review. Build. Environ. 2021, 206, 108315. [Google Scholar] [CrossRef]
- Gousseau, P.; Blocken, B.; Stathopoulos, T.; van Heijst, G.J.F. CFD simulation of near-field pollutant dispersion on a high-resolution grid: A case study by LES and RANS for a building group in downtown Montreal. Atmos. Environ. 2011, 45, 428–438. [Google Scholar] [CrossRef]
- Tian, L.; Lin, Z.; Liu, J.; Yao, T.; Wang, Q. The impact of temperature on mean local air age and thermal comfort in a stratum ventilated office. Build. Environ. 2011, 46, 501–510. [Google Scholar] [CrossRef]
- Sun, C.; Zhai, Z. The efficacy of social distance and ventilation effectiveness in preventing COVID-19 transmission. Sustain. Cities Soc. 2020, 62, 102390. [Google Scholar] [CrossRef]
- American Society of Heating Refrigerating and Air-Conditioning Engineers (ASHRAE). 2009 ASHRAE Handbook: Fundamentals; American Society of Heating Refrigerating and Air-Conditioning Engineers (ASHRAE): Atlanta, GA, USA, 2009. [Google Scholar]
- Park, J.K.; Kwon, W.D.; Kwon, H.M.; Yang, J.H. Examination of the ventilation function of a combined air-diffuser ventilation system using experiments and CFD. J. Asian Archit. Build. Eng. 2017, 16, 647–654. [Google Scholar] [CrossRef]
- Ellis, J. Indoor Air Quality in Lecture Theatres and Large Enclosed Public Spaces; University of Brighton: Brighton, UK, 2010. [Google Scholar]
- Yang, B.; Melikov, A.K.; Kabanshi, A.; Zhang, C.; Bauman, F.S.; Cao, G.; Awbi, H.; Wigö, H.; Niu, J.; Cheong, K.W.D.; et al. A review of advanced air distribution methods-theory, practice, limitations and solutions. Energy Build. 2019, 202, 109359. [Google Scholar] [CrossRef]
- Chen, Q.; Zhai, Z. The Use of CFD Tools for Indoor Environmental Design. Adv. Build. Simul. 2004, 119–140. Available online: https://www.taylorfrancis.com/chapters/edit/10.4324/9780203073674-11/use-computational-fluid-dynamics-tools-indoor-environmental-design-qingyan-yan-chen-zhiqiang-john-zhai (accessed on 1 August 2022).
- Sheng, S.; Yamanaka, T.; Kobayashi, T.; Yuan, J.; Katoh, M. Modeling of supply airflow from slot line diffuser on ceiling for CFD of thermal environment in perimeter zone. Build. Environ. 2022, 213, 108884. [Google Scholar] [CrossRef]
Figure 1.
The site photo and plan of the case building.

Figure 2.
Actual measurement in the field: (a) Air velocity measurement in the inlet; (b) Geotech G150 CO2 sensor; (c) Anemometer TESTO 435-2.
Figure 2.
Actual measurement in the field: (a) Air velocity measurement in the inlet; (b) Geotech G150 CO2 sensor; (c) Anemometer TESTO 435-2.

Figure 3.
Simulation model of the case building: (a) Size of simulation model; (b) Occupant area of model; (c) Cross section location of model.
Figure 3.
Simulation model of the case building: (a) Size of simulation model; (b) Occupant area of model; (c) Cross section location of model.

Figure 4.
Different types of air inlets in the model.

Figure 5.
Distribution of air inlets in the model: (a) Scheme one; (b) Scheme two.

Figure 6.
Improved HVAC system design strategy based on building performance simulation.

Figure 7.
Improved strategy of building performance simulation for the stepped space.

Figure 8.
Detailed information on each case.

Figure 9.
Building simulation model of each case.

Figure 10.
The relationship between decay rate of CO2 concentration and time: (a) Scheme one; (b) Scheme two.
Figure 10.
The relationship between decay rate of CO2 concentration and time: (a) Scheme one; (b) Scheme two.

Figure 11.
Air velocity distribution measurement results: plan and profile of the case room.

Figure 12.
Temperature distribution measurement results: plan and profile of the case room.

Figure 13.
Simulation results of velocity in (a) simplified diffuser model and (b) detailed diffuser model.
Figure 13.
Simulation results of velocity in (a) simplified diffuser model and (b) detailed diffuser model.

Figure 14.
Simulation results of temperature in (a) simplified diffuser model and (b) detailed diffuser model.
Figure 14.
Simulation results of temperature in (a) simplified diffuser model and (b) detailed diffuser model.

Figure 15.
Air velocity distribution of scheme one and two.

Figure 16.
Temperature distribution of each case.

Figure 17.
Air velocity distribution of each case.

Figure 18.
EDT distribution of each case.

Figure 19.
ADPI distribution of each case.

Figure 20.
SVE6 distribution of each case.

Figure 21.
Data box diagram of seats in different areas of each scheme: (a) Temperature; (b) Air velocity; (c) EDT; (d) SVE6.
Figure 21.
Data box diagram of seats in different areas of each scheme: (a) Temperature; (b) Air velocity; (c) EDT; (d) SVE6.


Table 1.
Detailed information on the case building.
| Characters | Details |
|---|---|
| Longitude and latitude | 22°59′58.9″ N, 120°13′11.3″ E |
| Building type | Multi-function conference room |
| Dimension | Length: 255 m; Width: 156.5 m; Height: 3~6 m |
| Volume | 1690 m3 |
| Capacity | 255 persons |
| Minimum room ventilation | 6 ACH (ASHRAE-FMV) |
| Minimum external air volume in respiratory area | 2255 CFM (ASHRAE-FMV) 5887 CFM (REHVA-Displacement ventilation) |
| Internal gain | Lighting: 8–15 W/m2 Calorific value of human body: 105 W/pers |
| Total air change | 11,250 CFM |
Table 2.
The boundary conditions of each scheme.
| Items | Scheme One—Single Plane Air Inlets | Scheme Two—Air Inlets with Diffuser |
|---|---|---|
| Turbulent model | High Reynolds number k-ε model | High Reynolds number k-ε model |
| Turbulent intensity | 10% | 10% |
| Turbulence length scale | 0.042 | 0.042 |
| Mesh | 2,247,696 (x = 99, y = 264, z = 86) | 2,960,2488 (x = 106, y = 274, z = 102) |
| Opening (4 sets) | 0.44 (Free in and out flow) | 0.44 (Free in and out flow) |
| Occupants number | 170 | 170 |
| Internal gain of occupants | 70 W/pers | 70 W/pers |
| Inlet type and number | N (15 sets)—0.091 m2 per set | G (3 sets)—0.059 m2 per set |
| G (3 sets)—0.059 m2 per set | A (3 sets)—0.091 m2 per set | |
| B (12 sets)—0.098 m2 per set | ||
| Air velocity (m/s) | As actual measurement | As actual measurement |
Table 3.
Air and thermal environment assessment indicators.
| Indicator | Characteristic | Indoor Air Environment | Thermal Environment | Distribution Status |
|---|---|---|---|---|
| CO2 concentration |
| √ | × | × |
| Ventilation Effectiveness (VE) |
| √ | × | × |
| Local mean age of air (LMA) |
| √ | × | √ |
| Draft Ratio |
| × | √ | × |
| Effective Draft Temperature (EDT) |
| × | √ | √ |
| Air distribution performance index (ADPI) |
| × | √ | √ |
Table 4.
The settings of inlet in each case.
| Case | Inlet Type | Inlet Area (m2) | Air velocity of Inlet (m/s) | Supply Air Temperature (°C) | Inlet Angle (°) | Inlet Number | Mesh |
|---|---|---|---|---|---|---|---|
| 1 | Circular diffuser | 0.072 | 3.5 | 19.0 | 40 | 20 | 6,432,624 (x = 528, y = 131, z = 93) |
| 2 | Jet nozzle diffuser | 0.058 | 6 | 26.0 | 90 | 6 | 4,464,096 (x = 438, y = 104, z = 98) |
| 3 | Wall displacement unit | 1.39 | 4 | 24.0 | 90 | 9 | 5,328,750 (x = 435, y = 125, z = 98) |
| 4 | (A) Wall displacement unit | 0.927 | 2.0 | 24.0 | 90 | 4 | 7,480,993 (x = 481, y = 151, z = 103) |
| (B) Wall displacement unit | 0.013 | 1.2 | 24.0 | 90 | 44 | ||
| (C) Displacement terminal | 0.744 | 2.5 | 24.0 | 90 | 2 | ||
| (D) Displacement terminal | 0.744 | 1.0 | 24.0 | 90 | 2 |
Table 5.
The settings of outlet in each case.
| Items | Value |
|---|---|
| Turbulent model | High Reynolds number k-ε model |
| Turbulent intensity | 10% |
| Turbulence length scale | 0.042 |
| Exhaust outlet | As flow rate balance (beneath the ceiling) |
| Set amount | 12 |
| Occupants number | 255 |
| Internal gain of occupants | 70 W/pers |
| Internal gain of lighting | 10 W/m2 |
Table 6.
Simulation results of each case.
| Parameters | Case 1 | Case 2 | Case 3 | Case 4 | |
|---|---|---|---|---|---|
| Temperature (°C) | Average | 21.06 | 28.31 | 24.70 | 25.44 |
| High seats | 21.59 | 28.75 | 25.00 | 25.48 | |
| Middle seats | 20.62 | 28.10 | 24.80 | 25.70 | |
| Low seats | 21.11 | 28.15 | 24.31 | 25.14 | |
| Air velocity (m/s) | Average | 0.20 | 0.22 | 0.79 | 0.28 |
| High seats | 0.17 | 0.19 | 0.32 | 0.25 | |
| Middle seats | 0.18 | 0.27 | 0.70 | 0.26 | |
| Low seats | 0.24 | 0.21 | 1.30 | 0.35 | |
| SVE6 | Average | 2.54 | 0.90 | 1.00 | 0.92 |
| High seats | 0.61 | 0.82 | 1.22 | 0.73 | |
| Middle seats | 1.40 | 0.76 | 0.90 | 0.54 | |
| Low seats | 5.60 | 1.10 | 0.91 | 1.52 | |
| EDT (°C) | Average | −0.59 | −0.33 | −4.95 * | −0.64 |
| High seats | 0.17 | 0.38 | −0.89 | −0.33 | |
| Middle seats | −0.85 | −0.93 | −4.11 * | −0.17 | |
| Low seats | −0.92 | −0.40 | −9.38 * | −1.43 | |
| ADPI (%) | Average | 76.95 * | 68.53 * | 44.45 * | 83.70 |
* Uncomfortable value: ADPI < 80%, and EDT < −1.7 or EDT > 1.1.
Publisher’s Note: MDPI stays neutral with regard to jurisdictional claims in published maps and institutional affiliations. |
© 2022 by the authors. Licensee MDPI, Basel, Switzerland. This article is an open access article distributed under the terms and conditions of the Creative Commons Attribution (CC BY) license (https://creativecommons.org/licenses/by/4.0/).
Share and Cite
MDPI and ACS Style
Chen, R.; Liu, Y.-T.; Tsay, Y.-S. An Air Conditioning Design Strategy of the Stepped Hall Based on Building Performance Simulation. Buildings 2022, 12, 1269. https://doi.org/10.3390/buildings12081269
AMA Style
Chen R, Liu Y-T, Tsay Y-S. An Air Conditioning Design Strategy of the Stepped Hall Based on Building Performance Simulation. Buildings. 2022; 12(8):1269. https://doi.org/10.3390/buildings12081269
Chicago/Turabian StyleChen, Ruijun, Yu-Tung Liu, and Yaw-Shyan Tsay. 2022. "An Air Conditioning Design Strategy of the Stepped Hall Based on Building Performance Simulation" Buildings 12, no. 8: 1269. https://doi.org/10.3390/buildings12081269
Note that from the first issue of 2016, this journal uses article numbers instead of page numbers. See further details here.