
Bearing Capacity of UHPC-Filled High-Strength Elliptical Steel Tube Composite Columns with Encased High-Strength H-Shape Steel Subjected to Eccentrical Load

Abstract
:1. Introduction
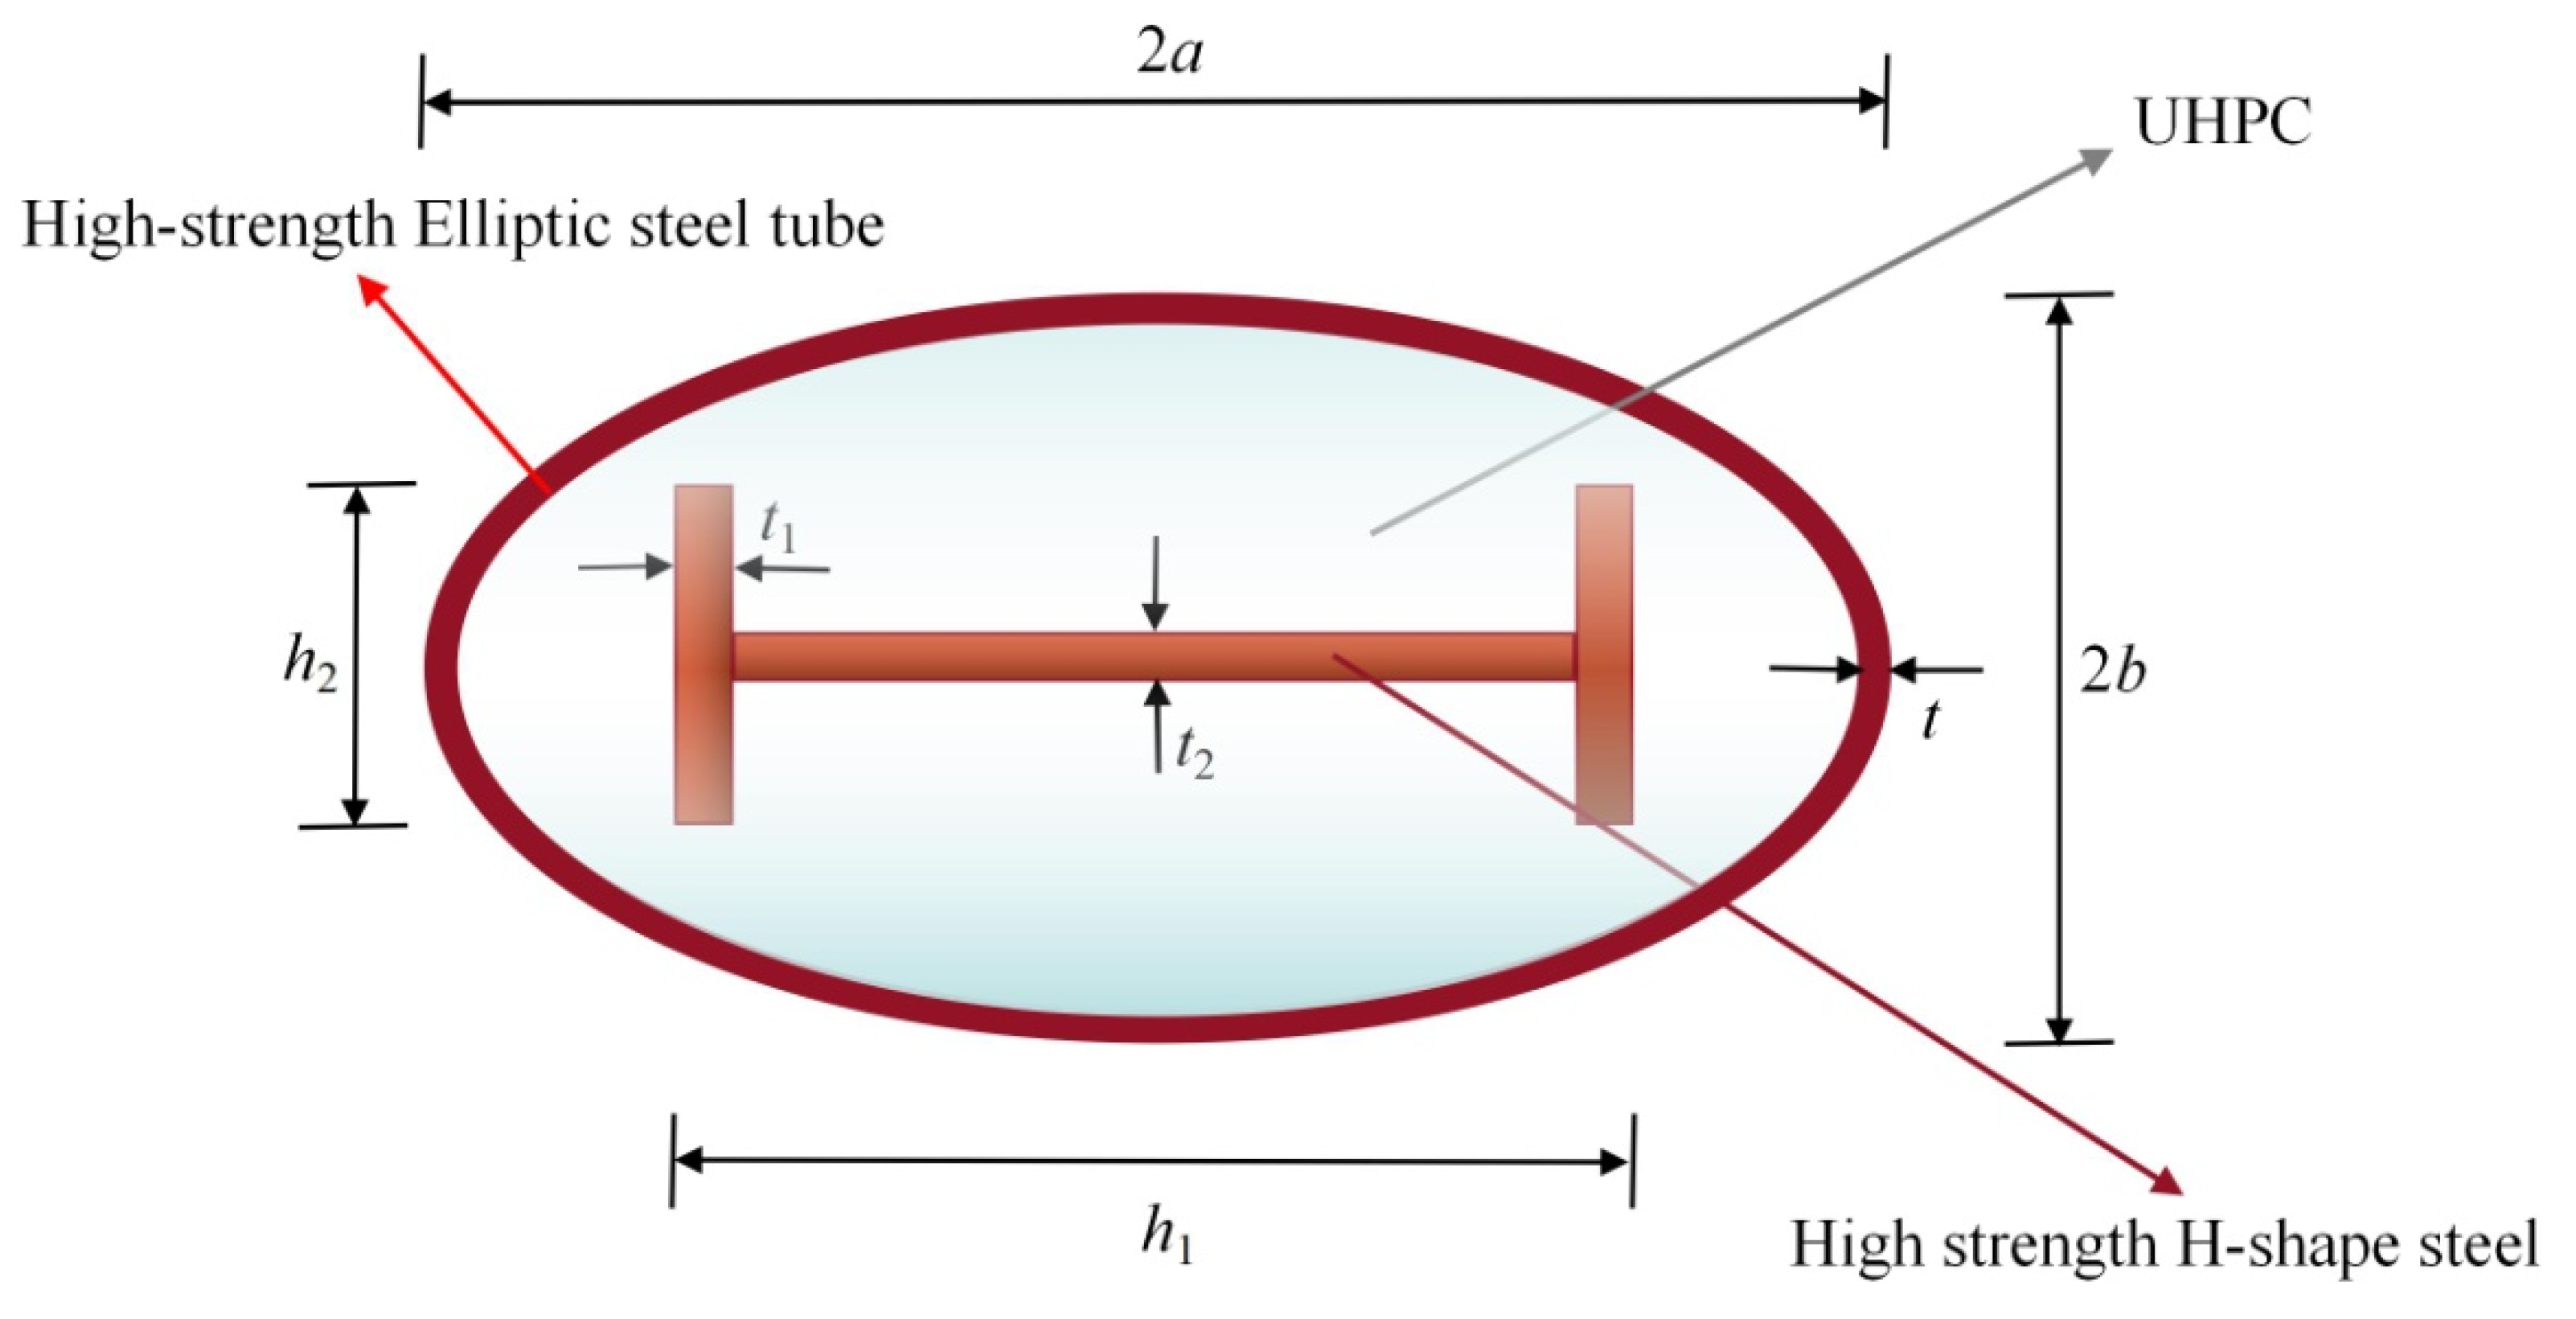
2. Specimen Design
3. FE Model
3.1. Constitutive Model for Materials
3.1.1. Steel
3.1.2. Material Modeling of Concrete
3.2. Contact Definition
3.3. Establishment of the Finite Element Model and Determination of Boundary Conditions
4. Comparison of Test Curves and Simulation Curves
5. Parameter Analysis
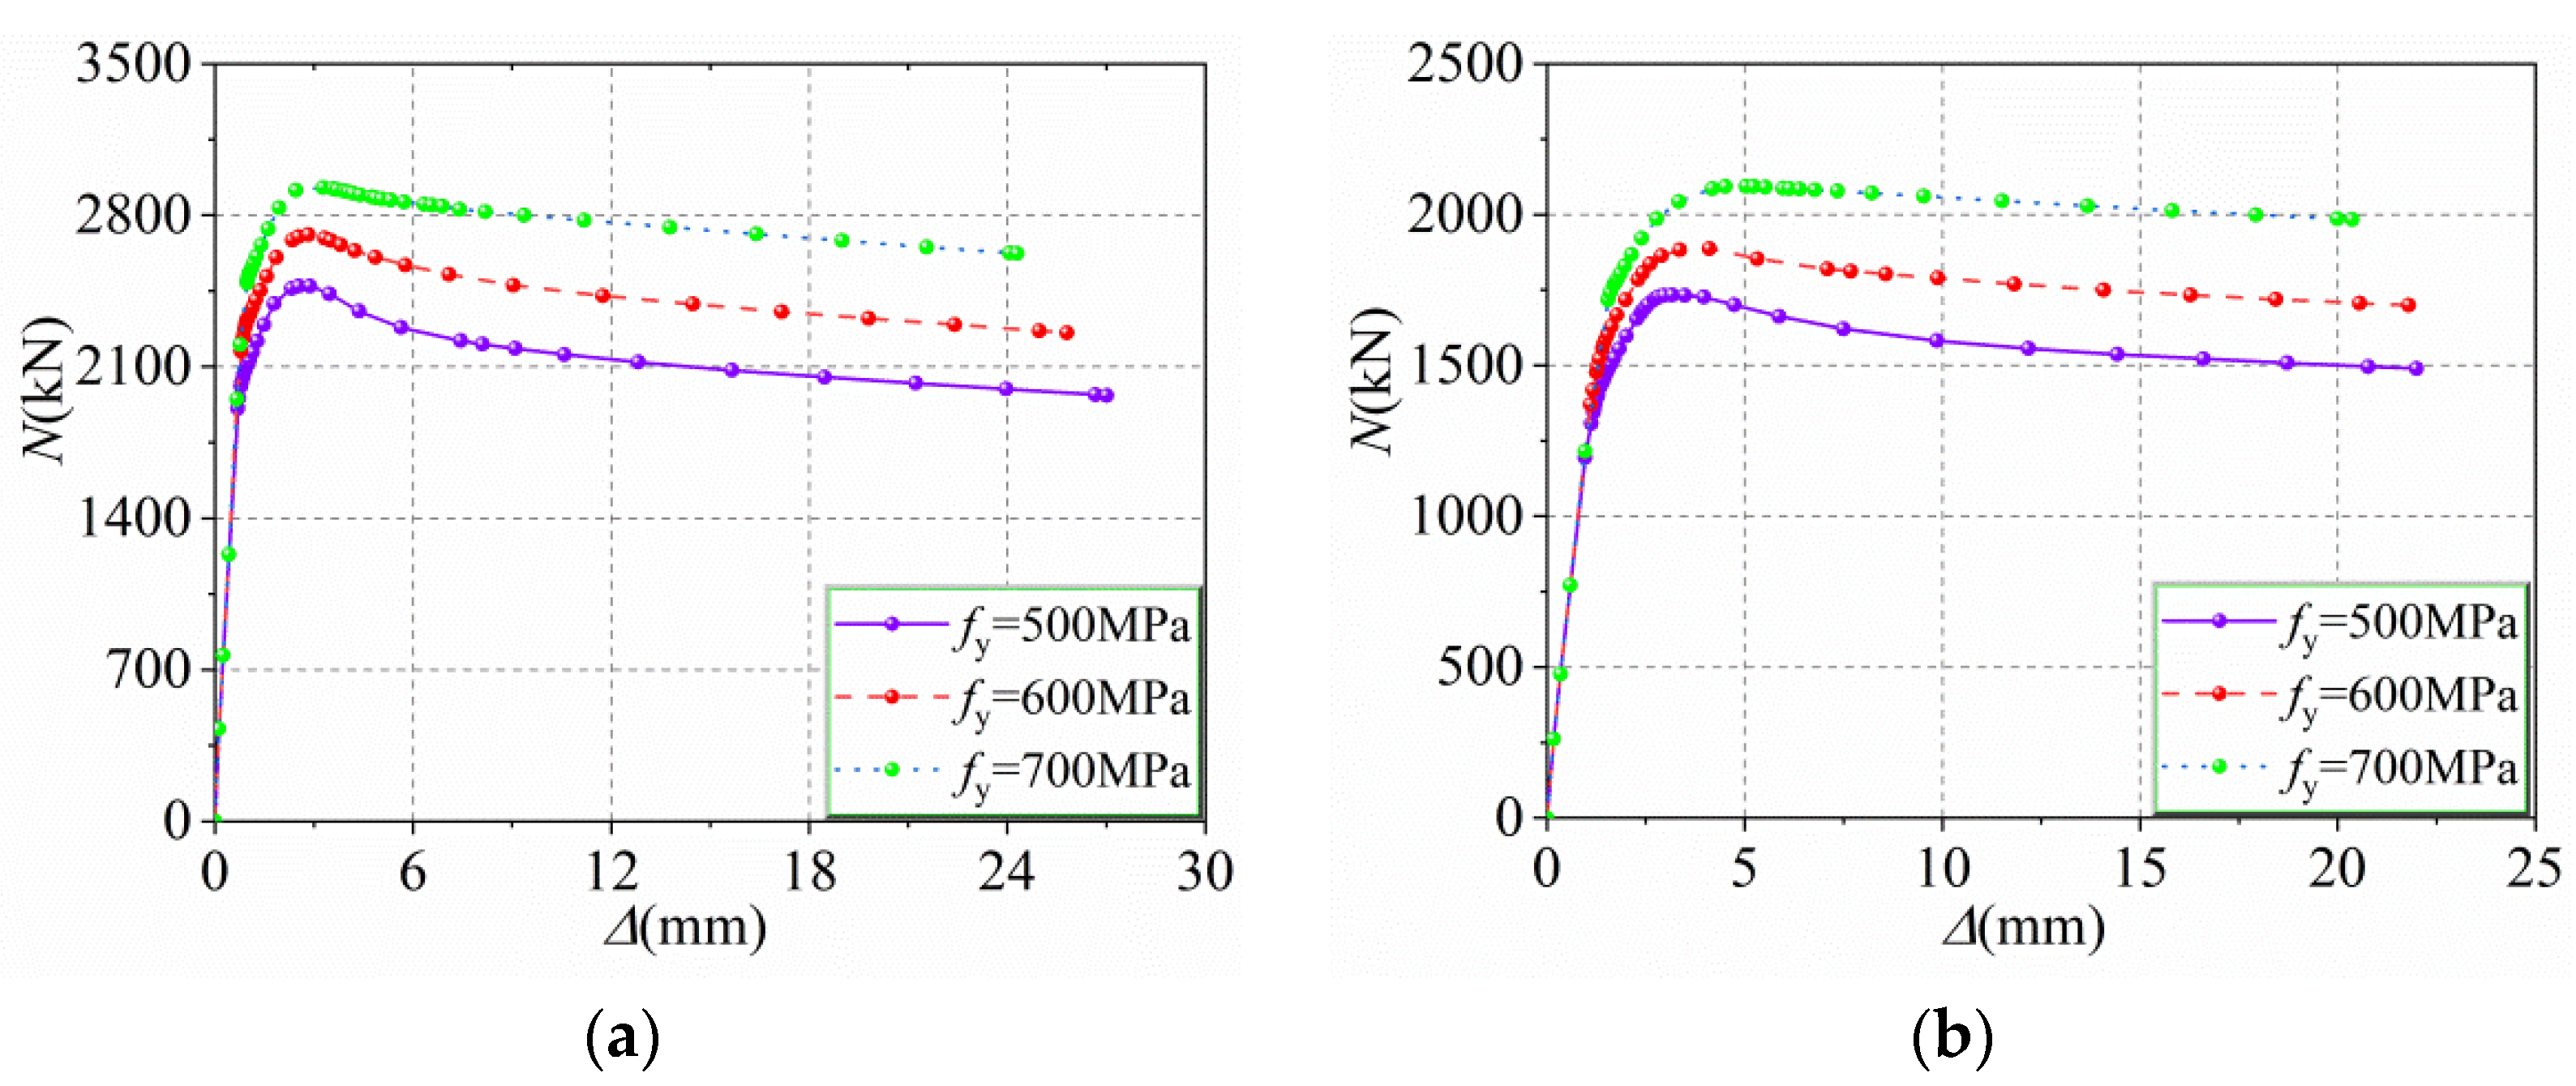
5.1. Steel Tube Yield Strength fy (from 500 to 700 MPa)
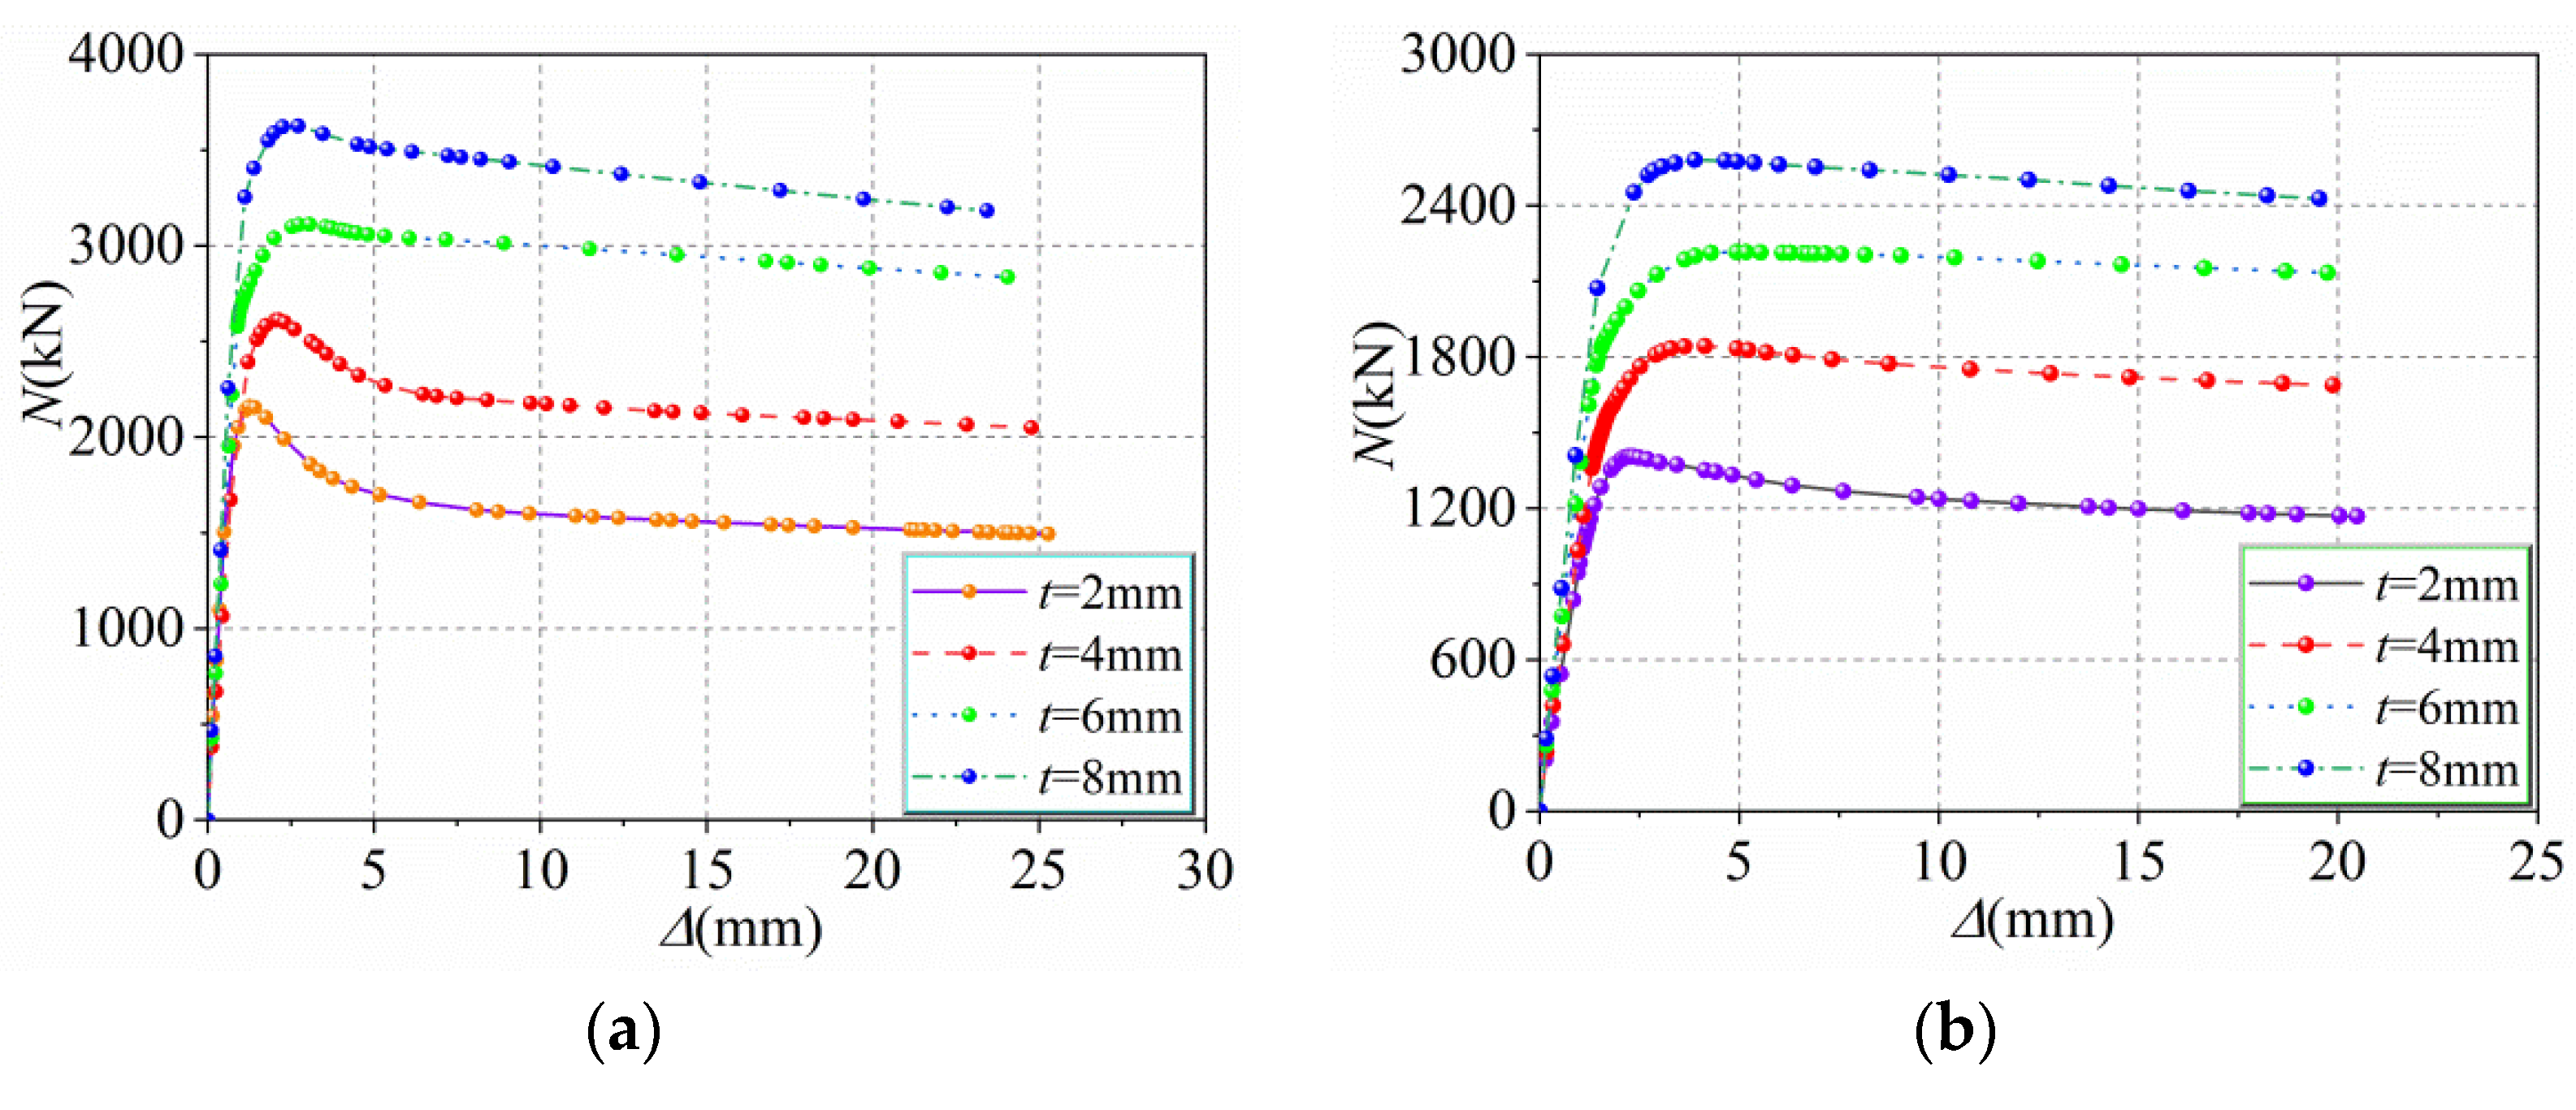
5.2. Thickness of Steel Tube t (from 2 mm to 8 mm)
5.3. Yield Strength fy1 of H-Shape Steel (from 500 to 700 MPa)
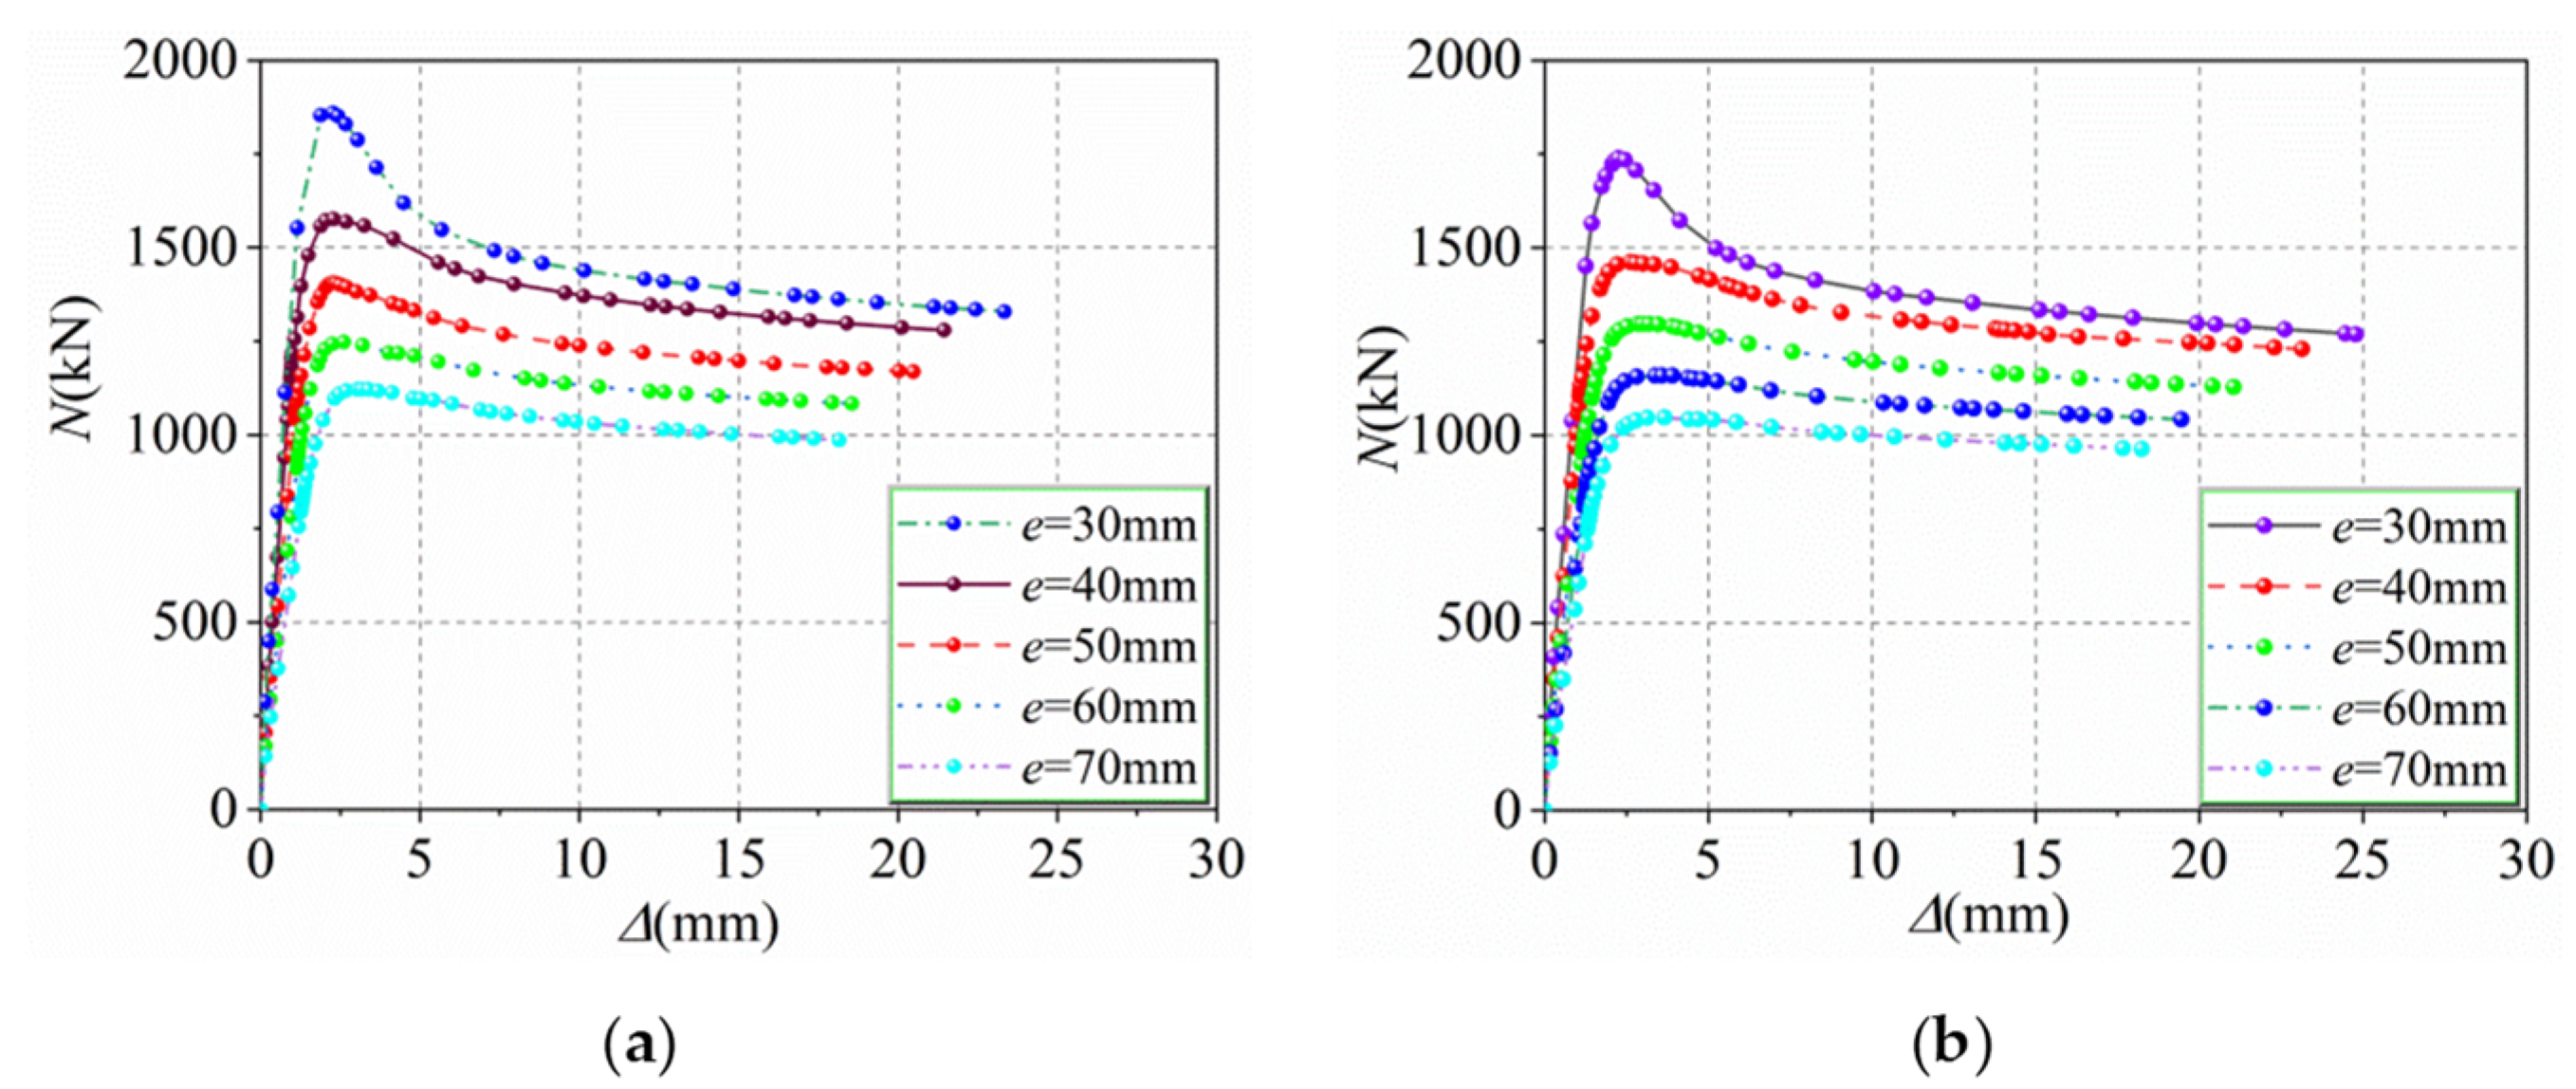
5.4. Eccentricity e (from 30 to 70 mm)
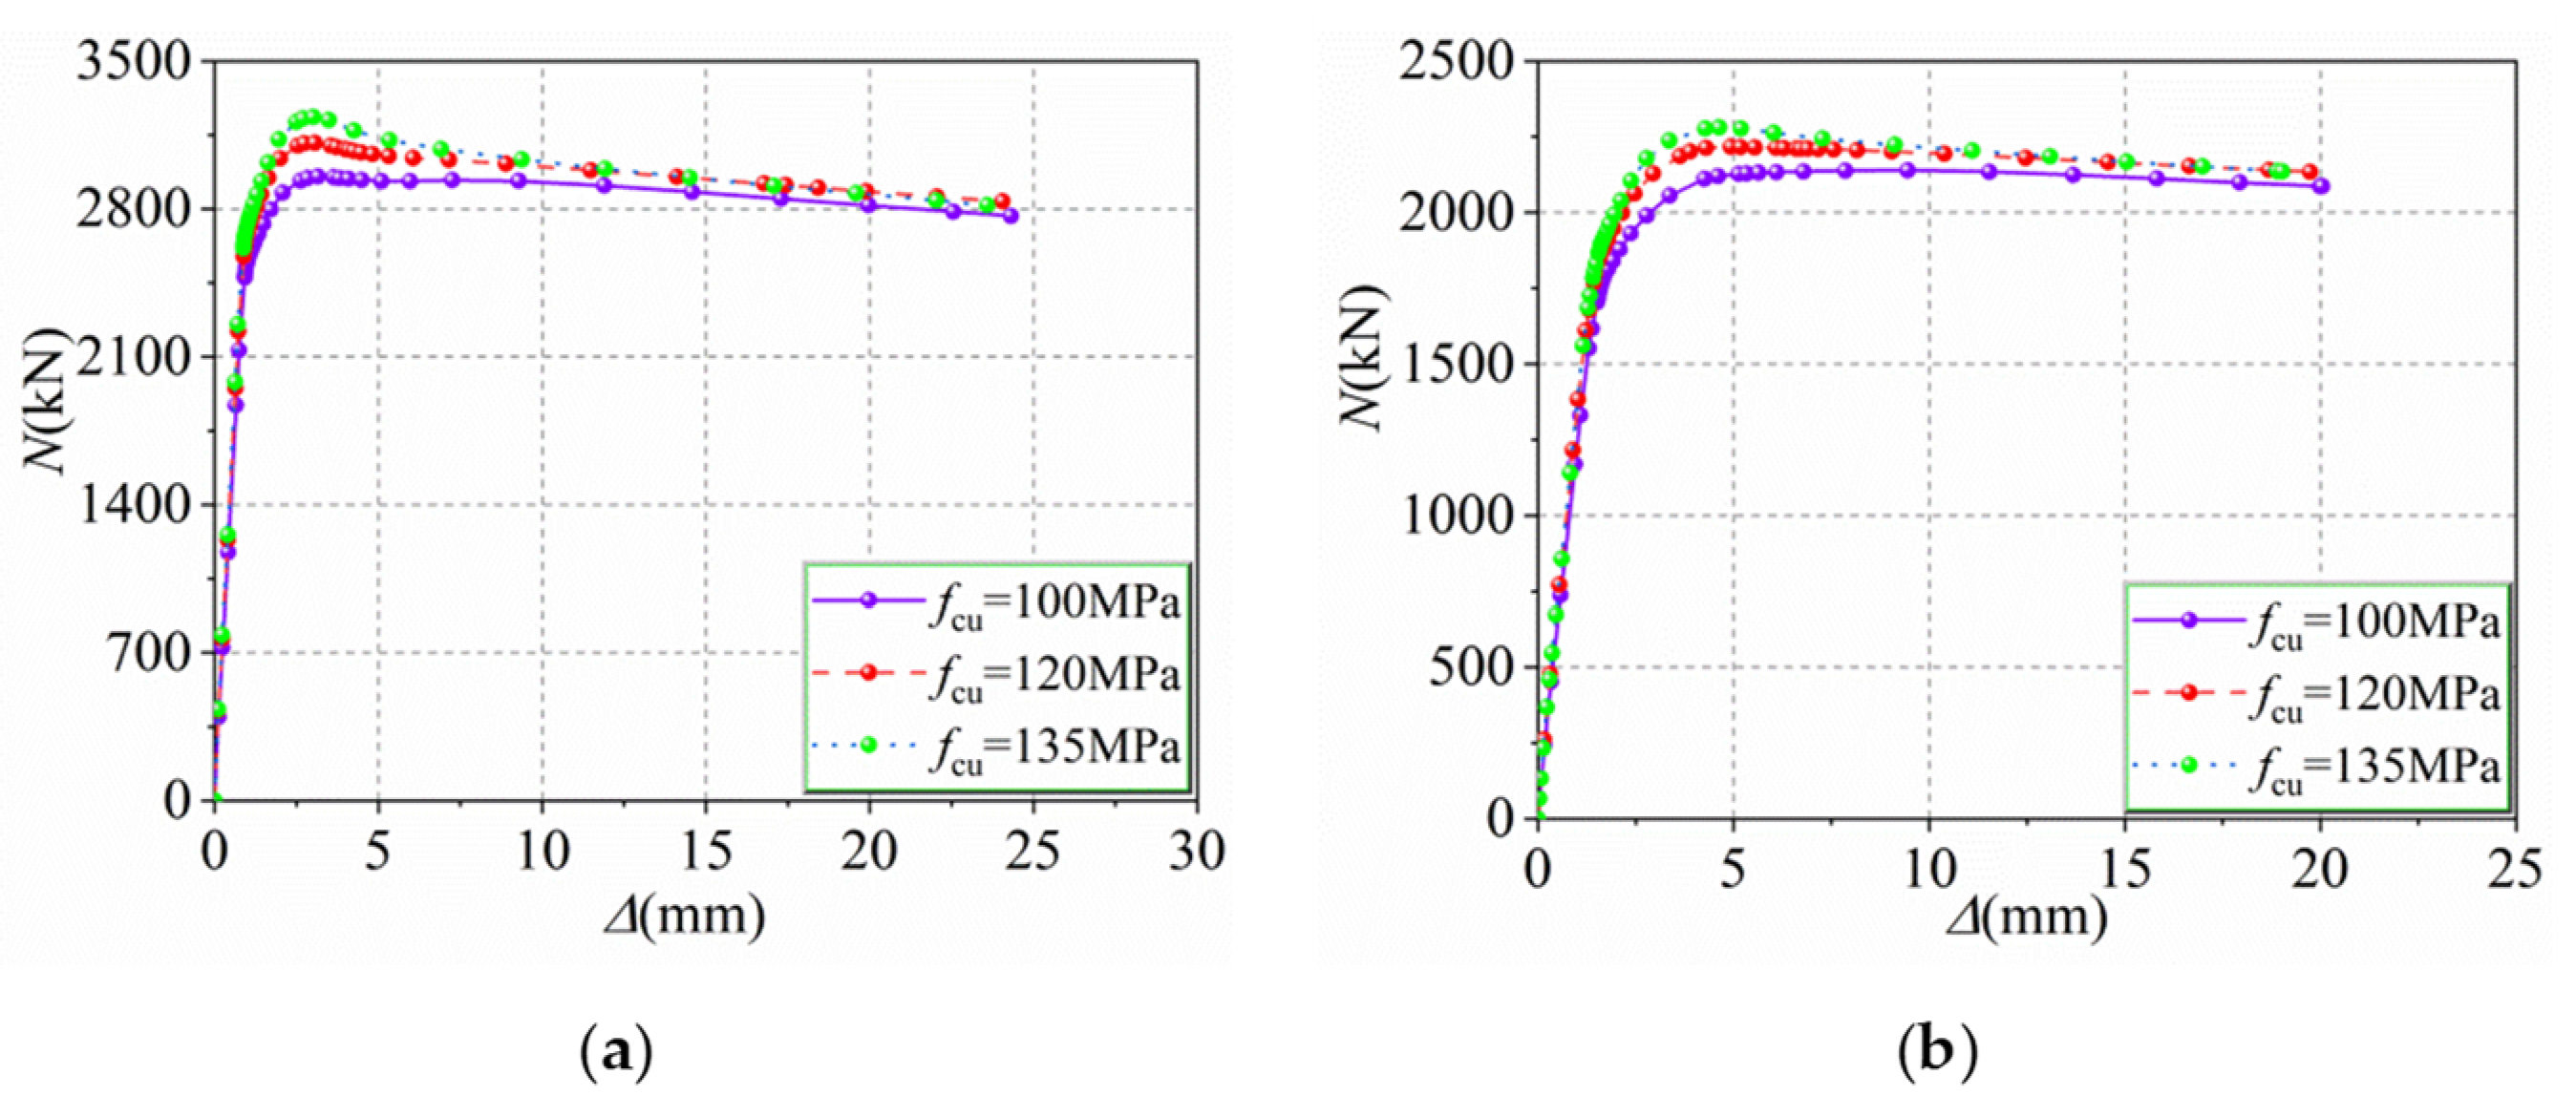
5.5. Cube Compressive Strength of Concrete fcu (from 100 to 135 MPa)
5.6. Slenderness Ratio λ (from 2 to 3)
5.7. Section Area of H-Shape Steel AHS (from 680 to 1180 mm2)
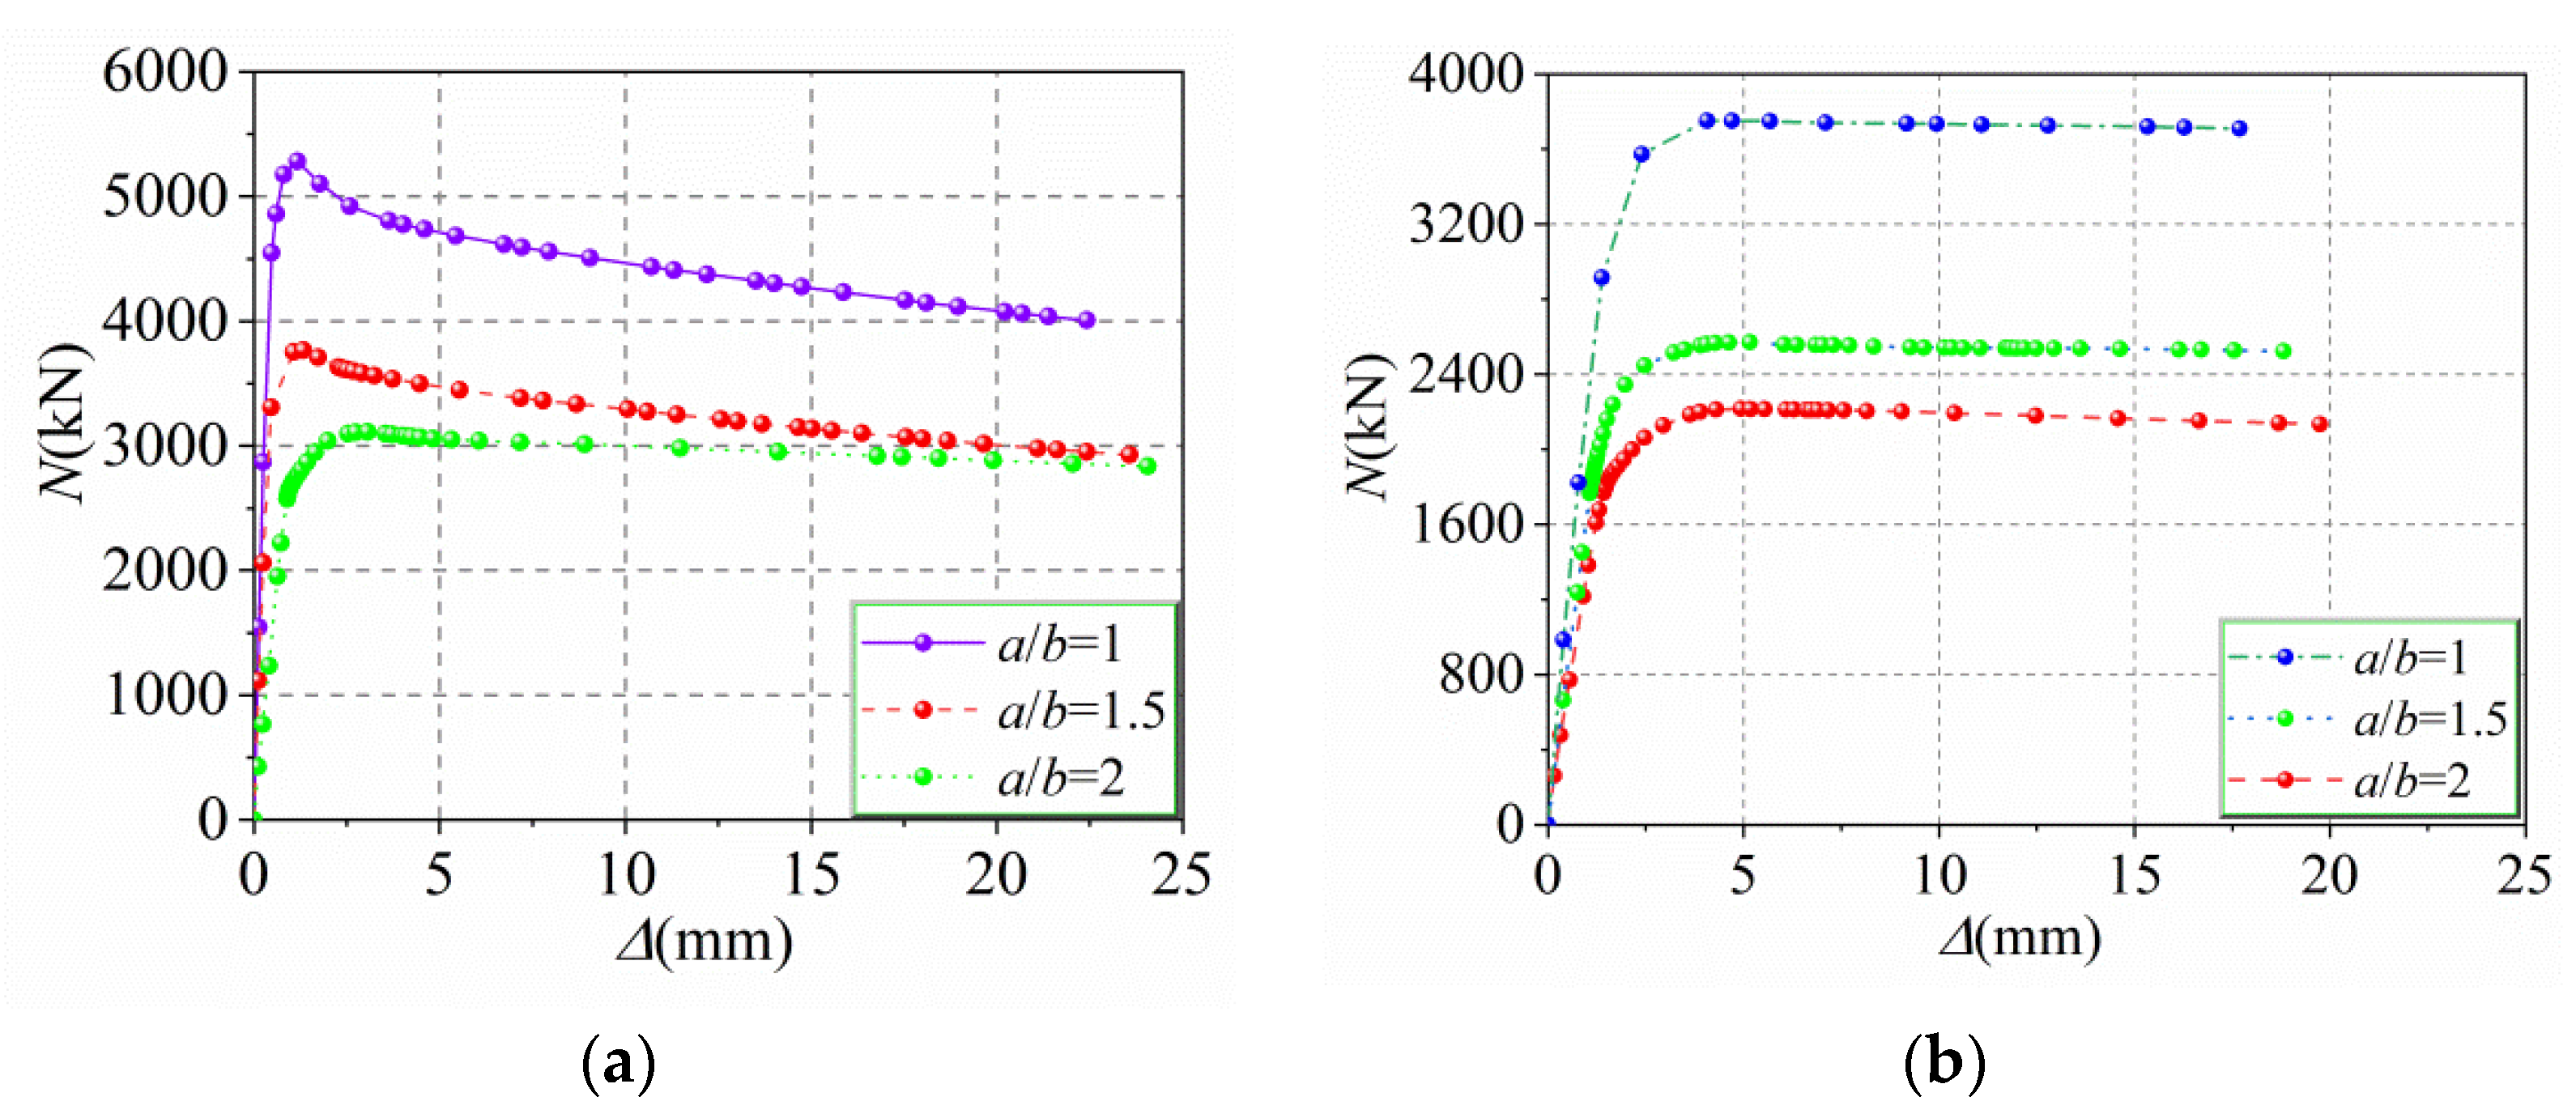
5.8. Long–Short Axis Ratio ψ (from 1 to 2)
6. Deformation Capacity of HUCFESTCs
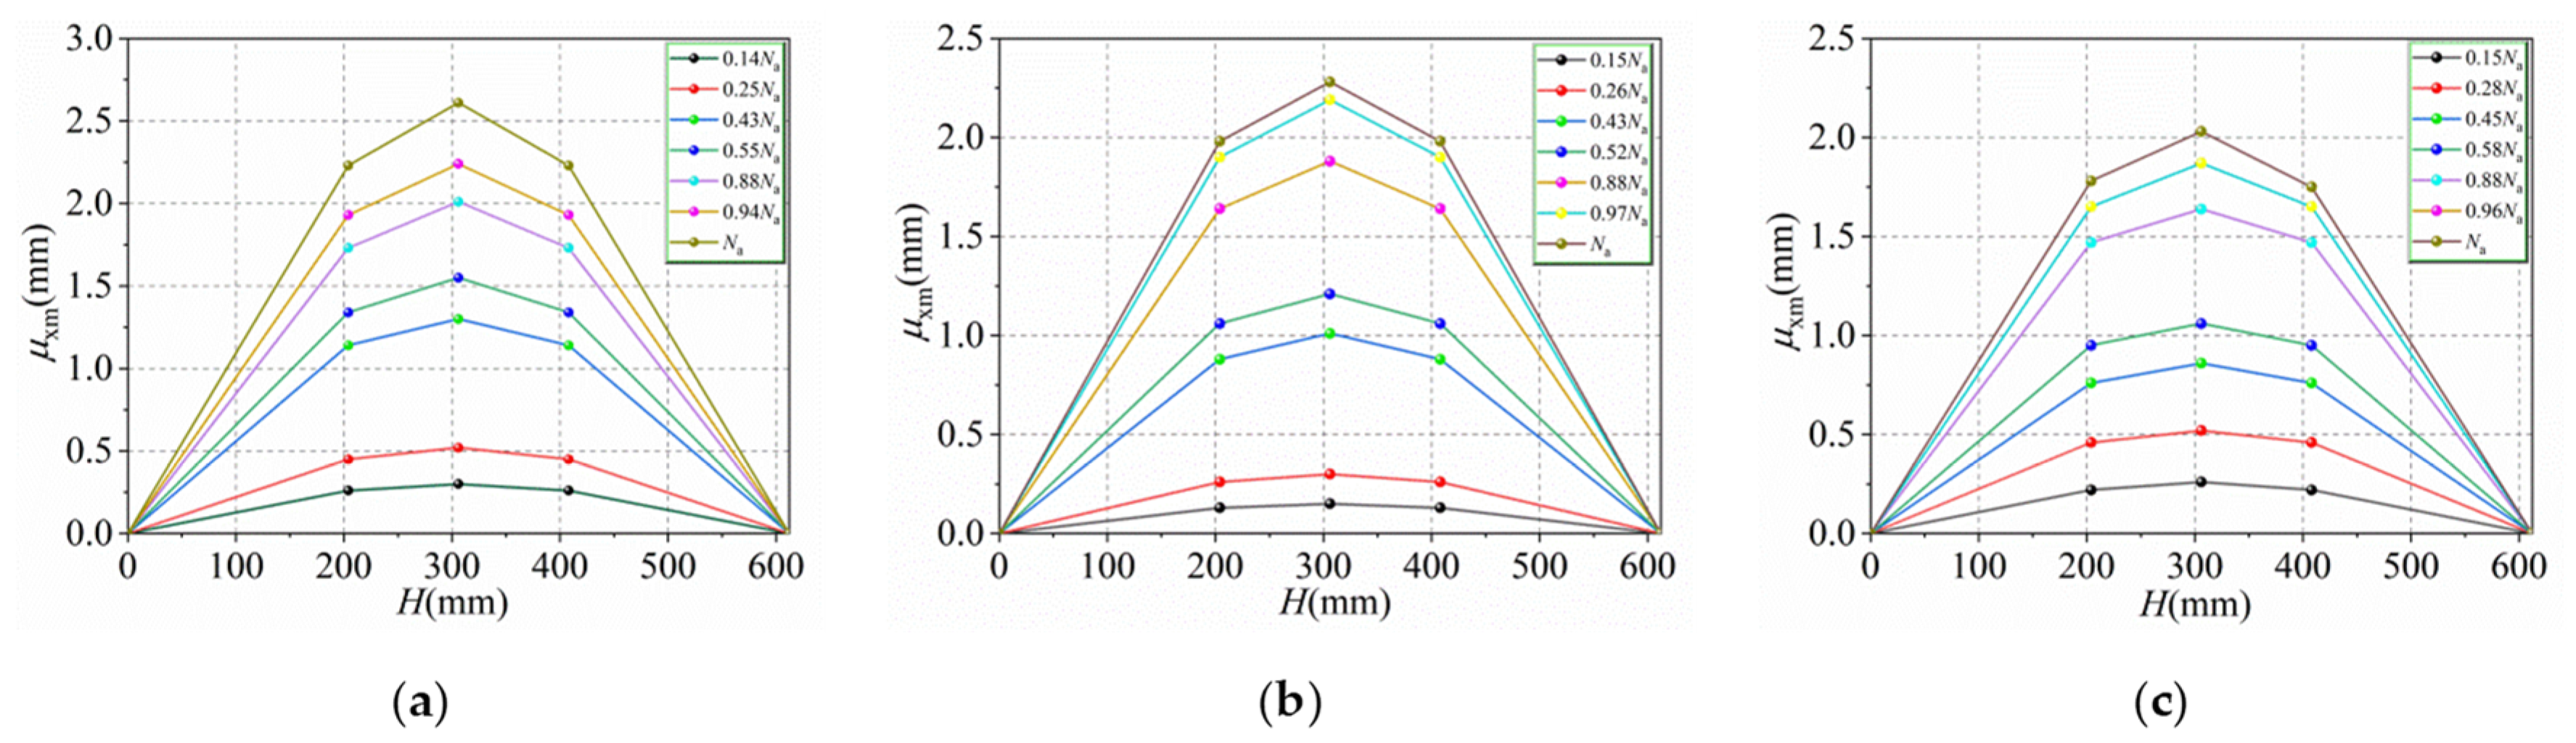
6.1. Lateral Deflection Curves of HUCFESTCs
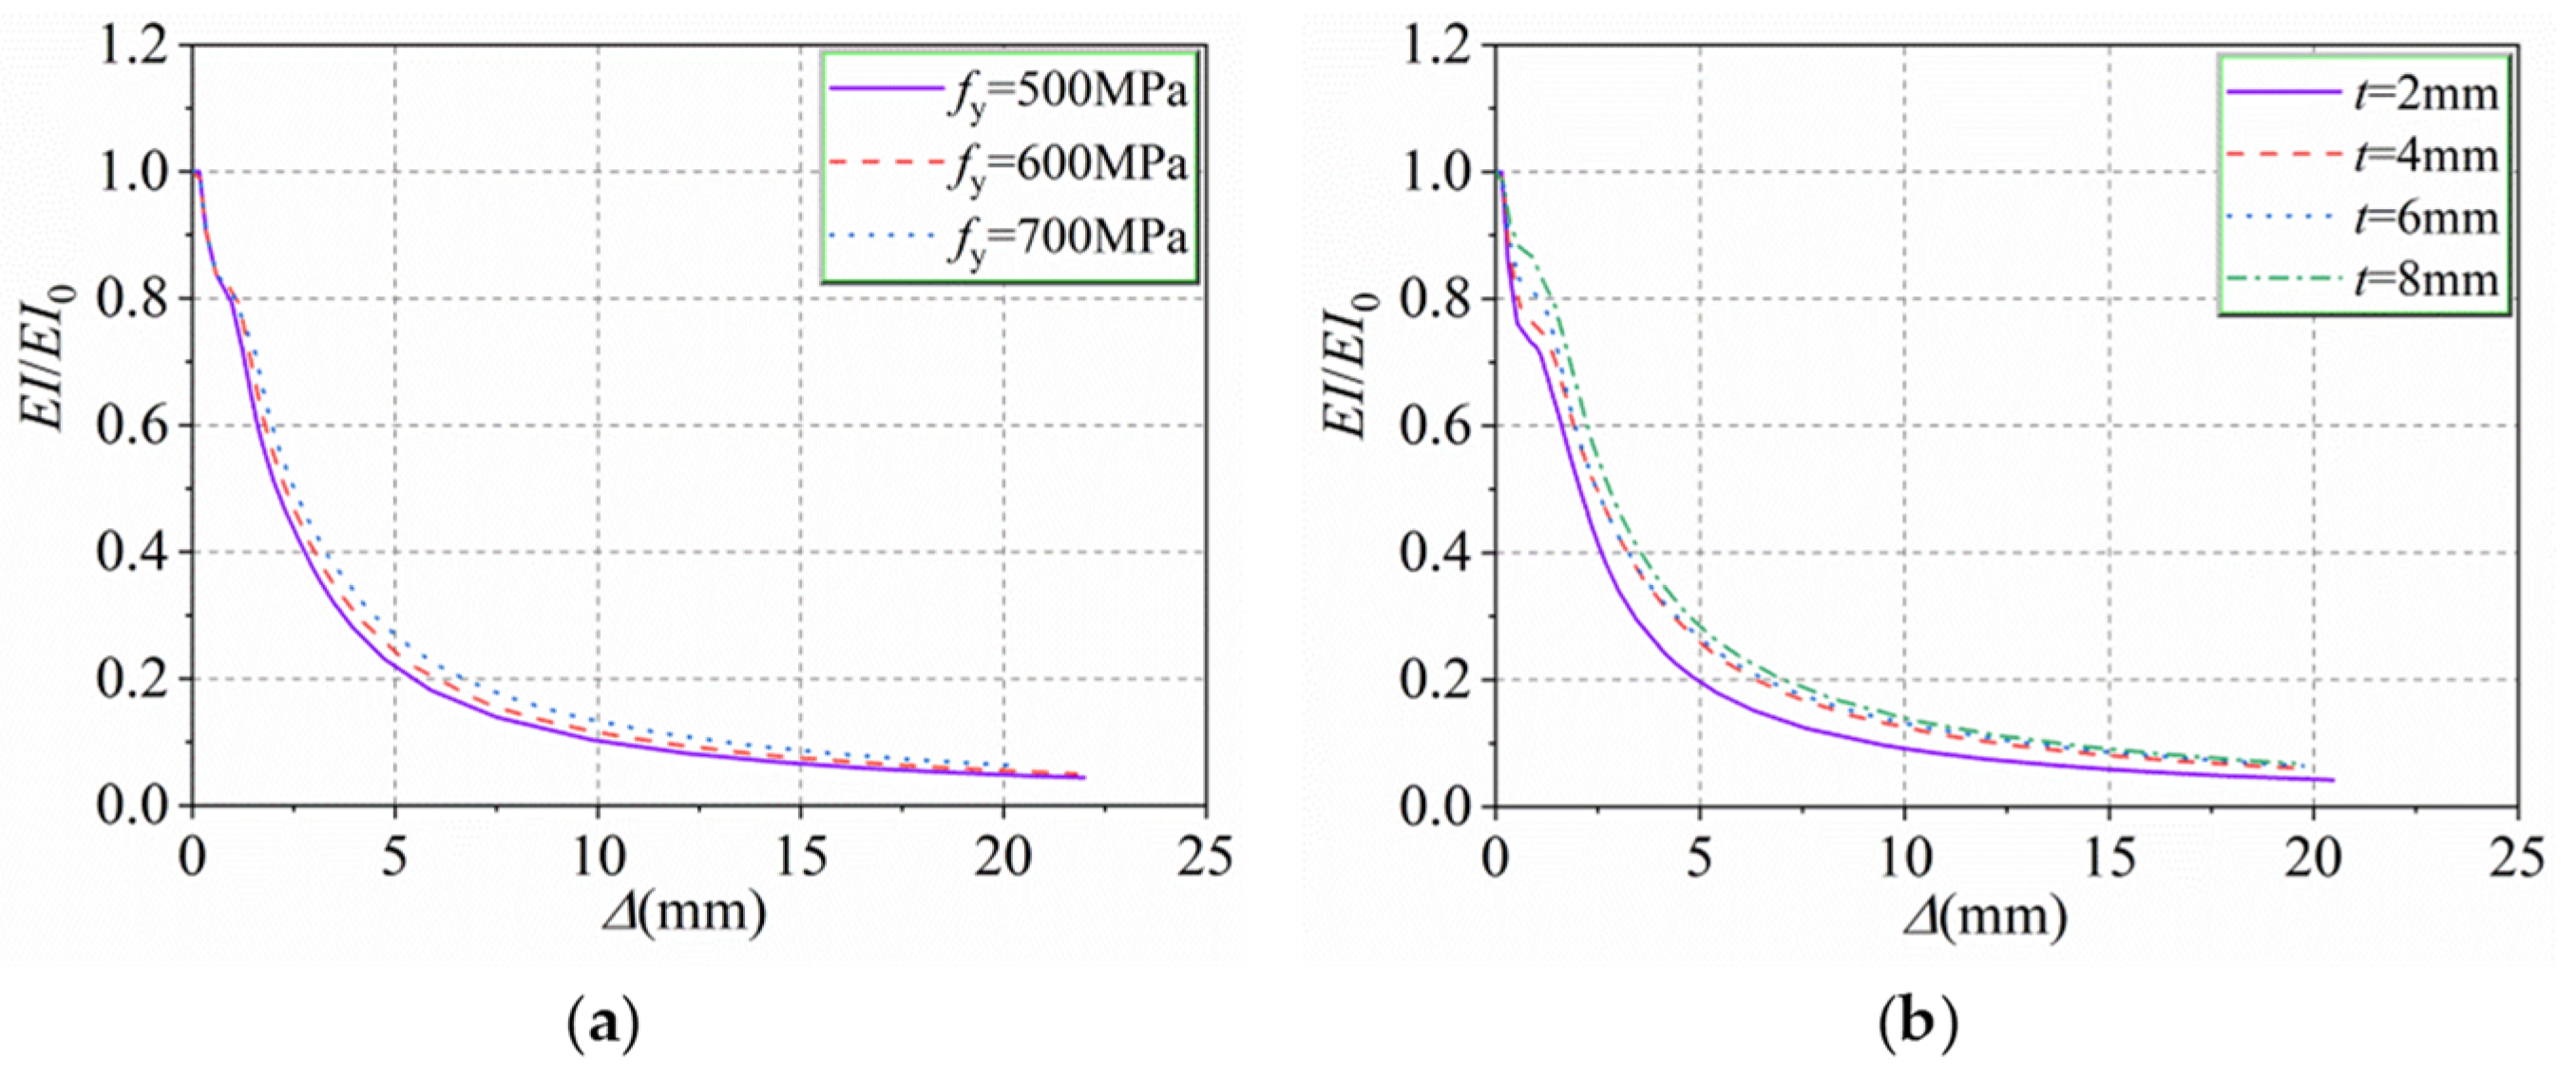
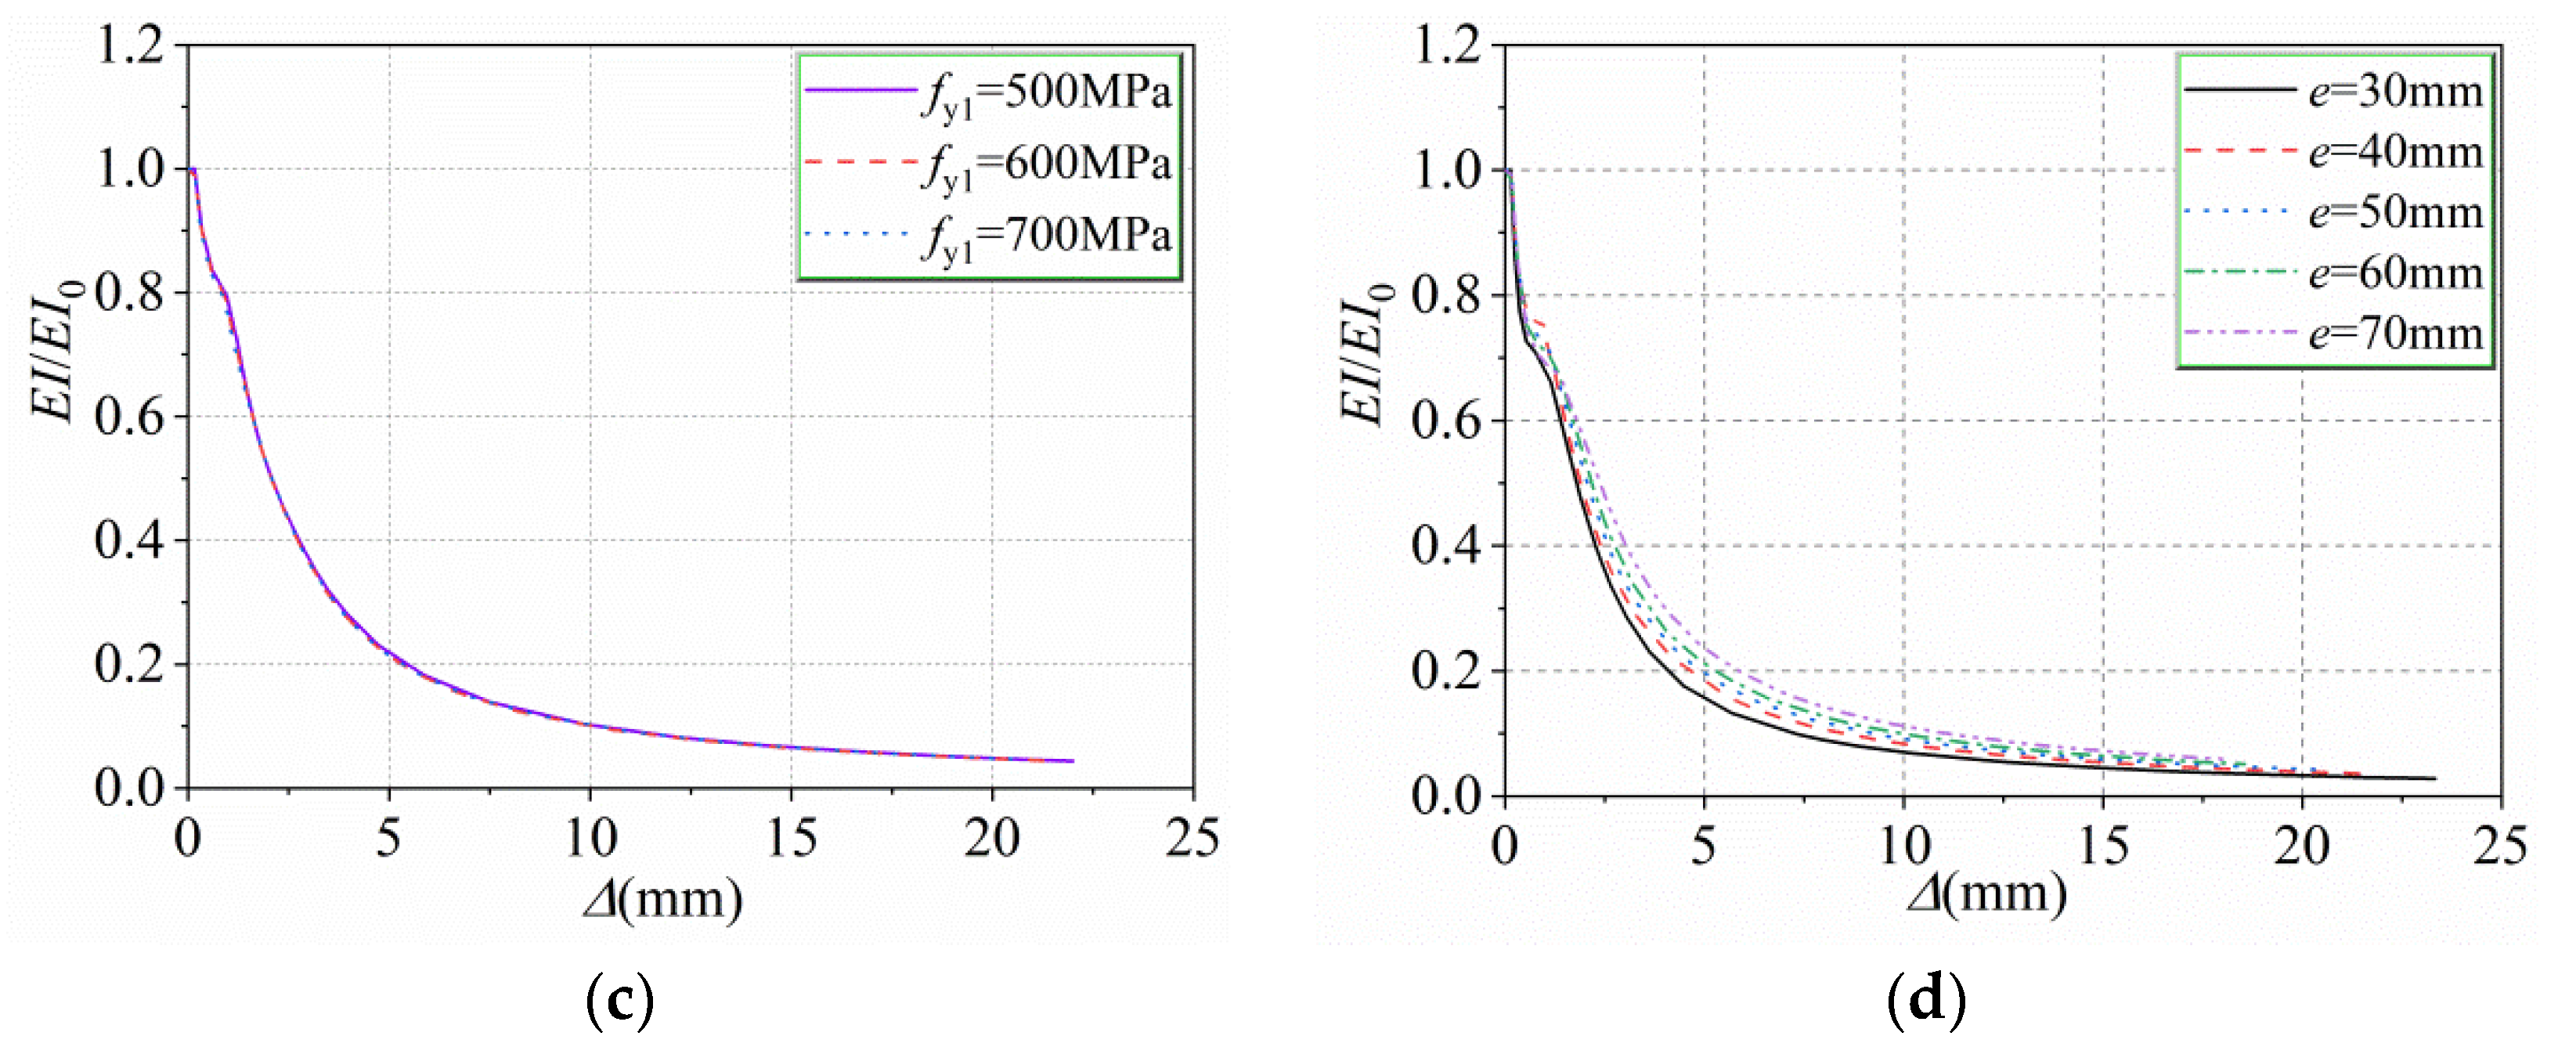
6.2. Stiffness Degradation of Specimens
6.3. Load–Strain Curves of HUCFESTCs
7. Verification of the Plane Section Assumption
8. Working Mechanism of HUCFESTCs
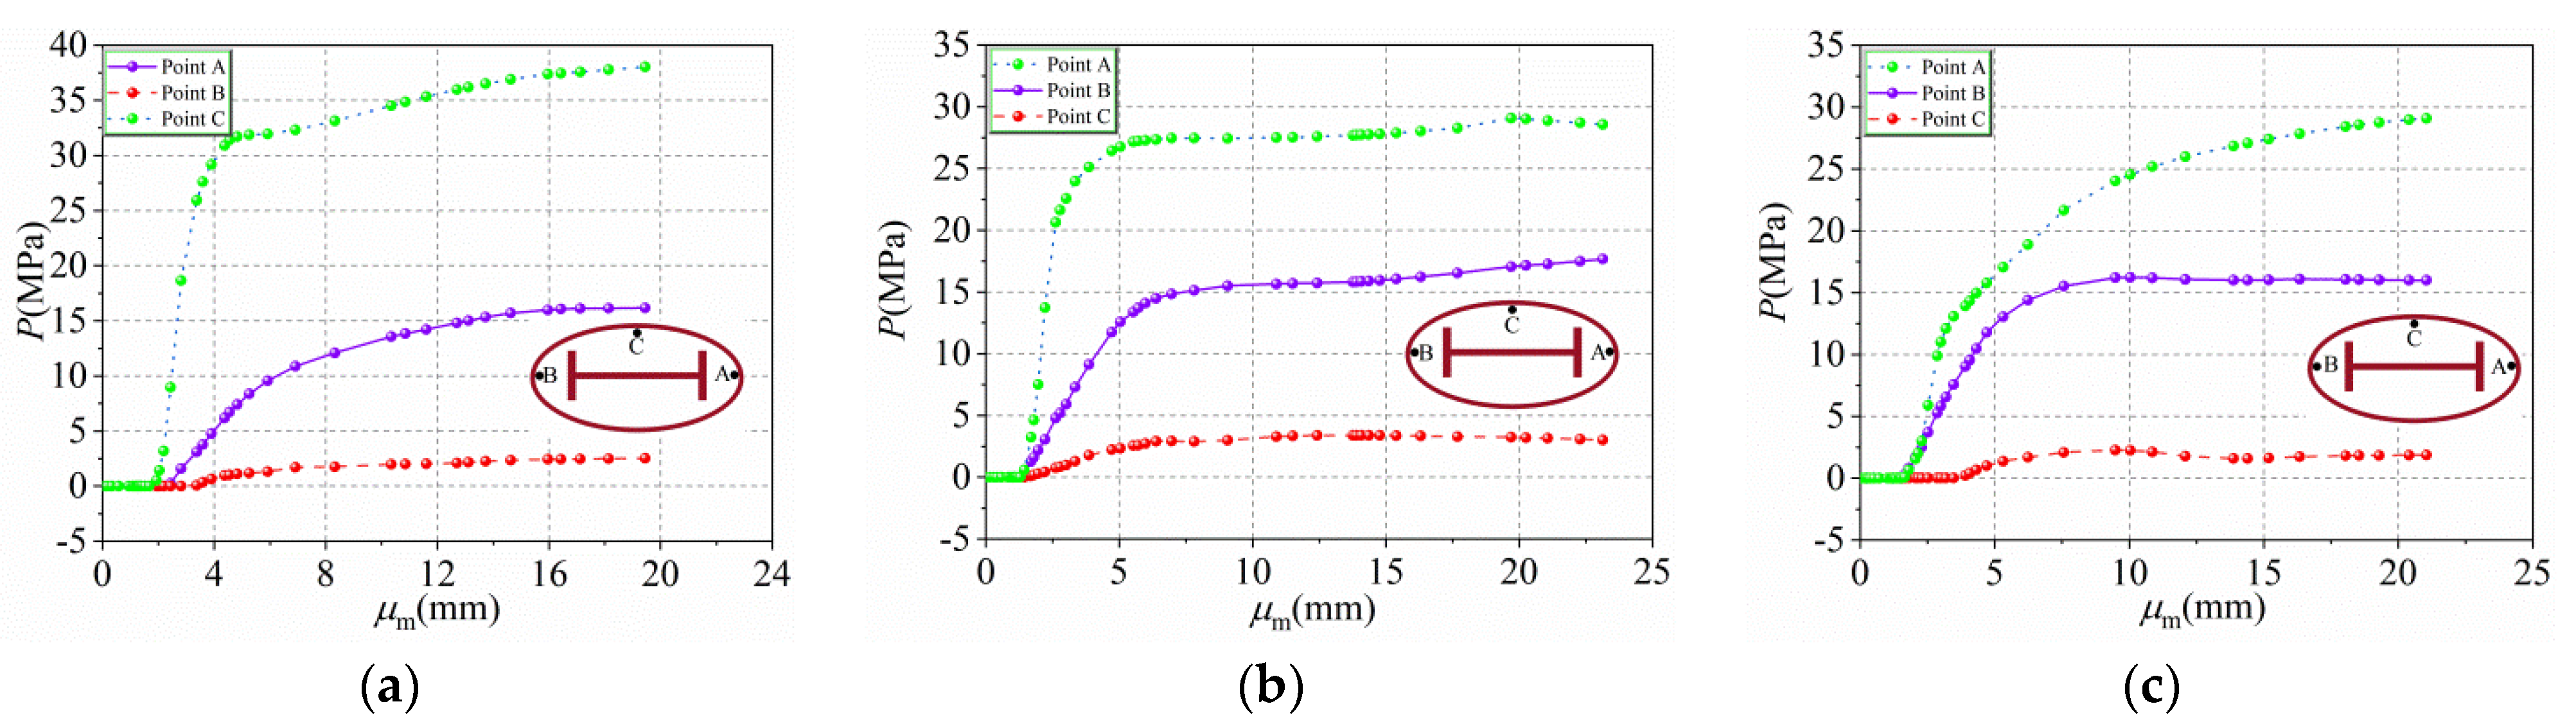
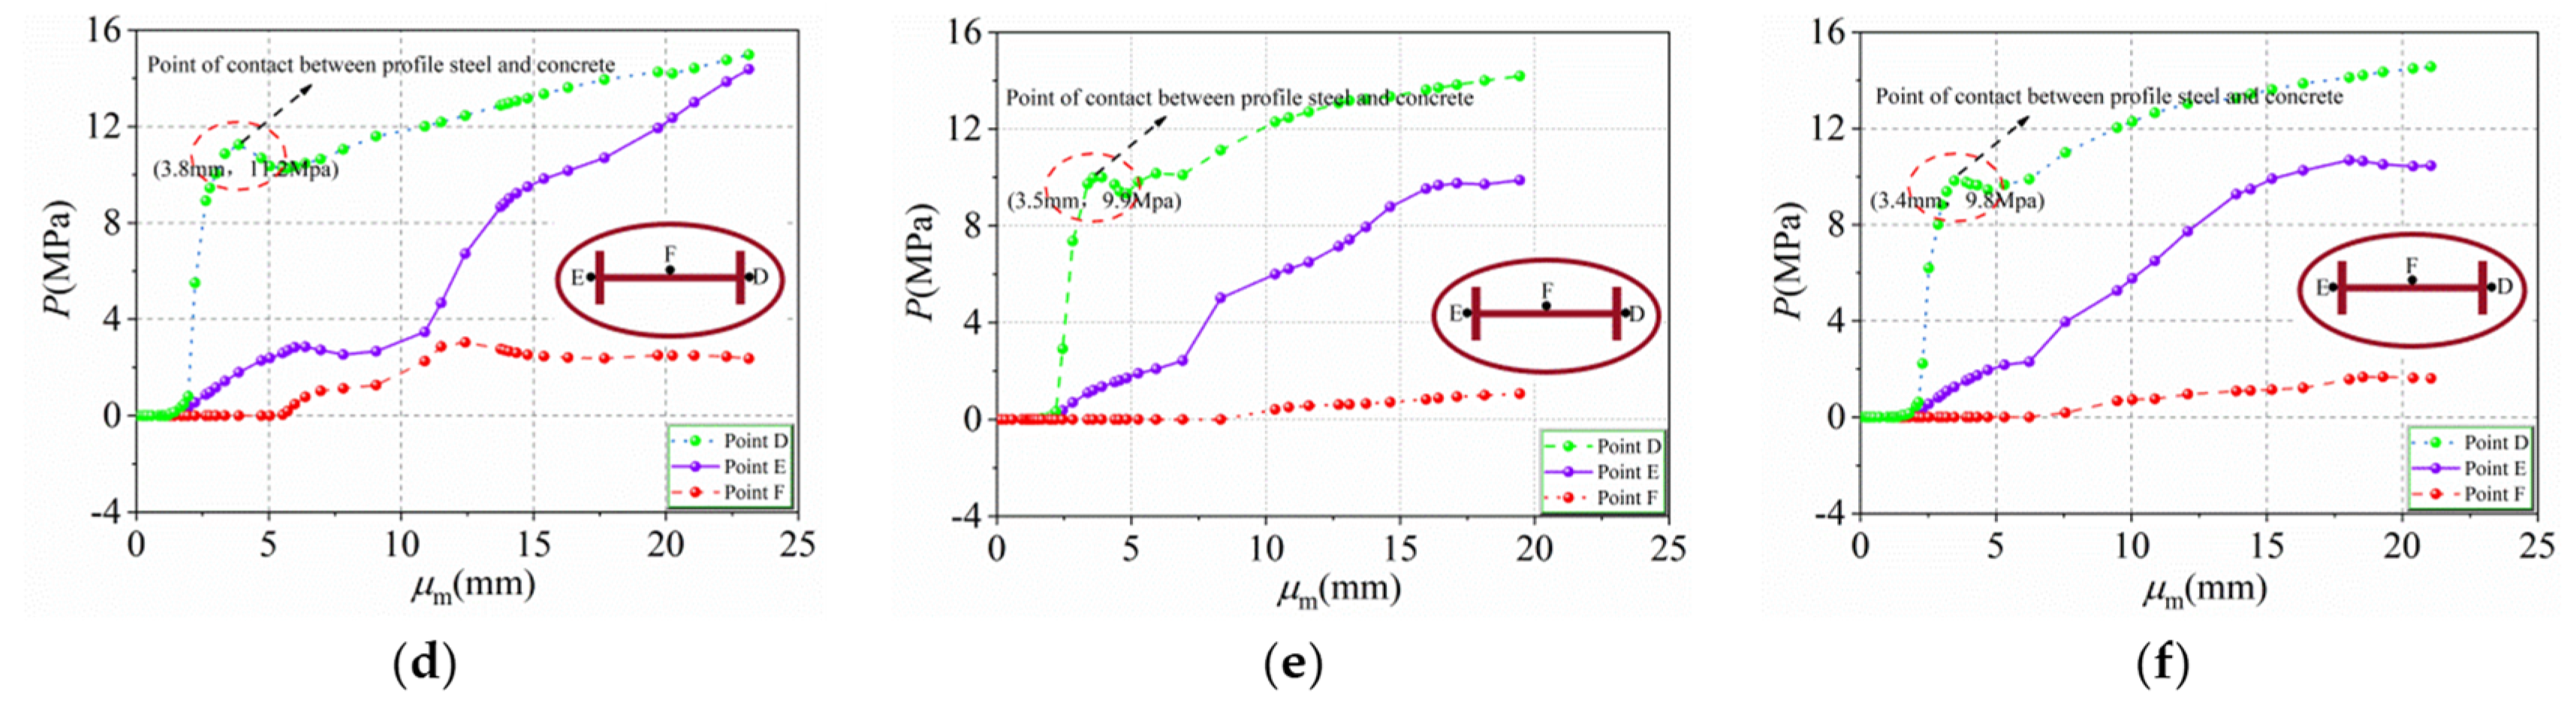
8.1. Contact Stress Analysis
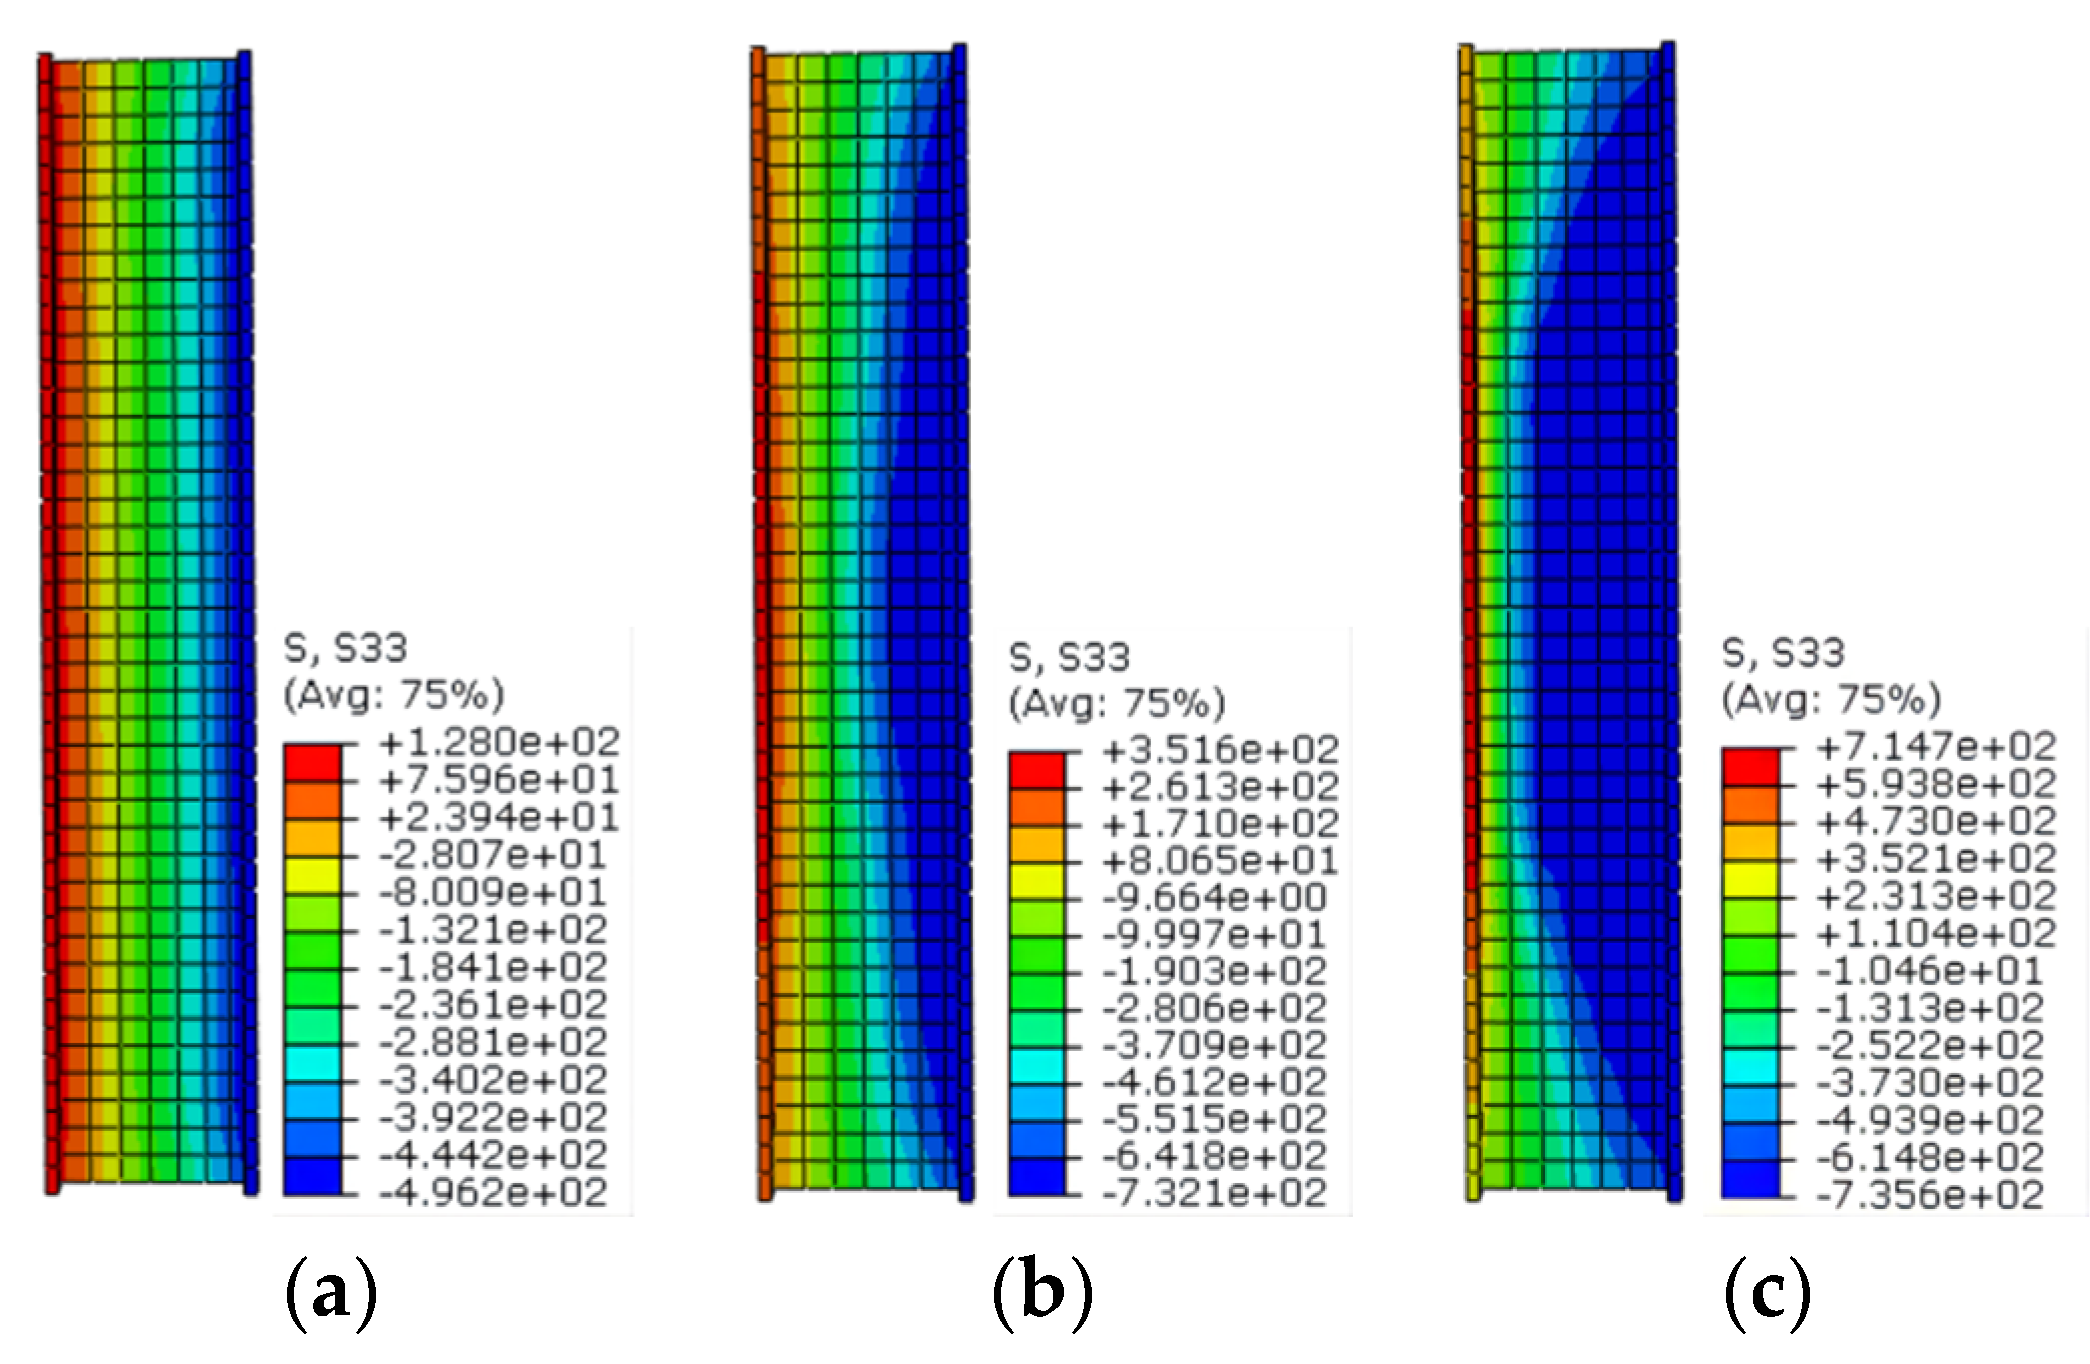
8.2. Failure Mechanism Analysis of HUCFESTCs
9. Bearing Capacity of HUCFESTCs Subjected to Eccentric Load
10. Conclusions
- With the increase in fy, t, fy1, AHS, and fcu, the bearing capacity to eccentric load of the HUCFESTCs gradually increases, and the middle cross-section deflection of the specimens decreases progressively, among which fy and t have the most significant effect. With increasing e, λ, and ψ, the bearing capacity to eccentric load of the HUCFESTCs gradually decreases. The change law of ultimate bearing capacity of the HUCFESTCs under eccentric load is similar to that of CFESTCs. At the same time, owing to the high strength of section steel and steel tube, the HUCFESTCs not only have high bearing capacity, but also have no lower ductility than the CFESTCs.
- The deformation trend of the HUCFESTCs subjected to eccentric load is similar to that of ordinary CFESTCs, and their stiffness increases gradually with the increase in fy, fy1, t, and e, among which the eccentric distance and wall thickness have more influence on the stiffness of the HUCFESTCs. At the beginning of loading, the HUCFESTCs conform to the assumption of a flat section, and with the increase in load, the deformation of the mid-span section is larger; HUCFESTCs do not conform to the assumption of a flat section.
- The main failure mode of the HUCFESTCs subjected to eccentric load is a local buckling of the steel tube; the concrete in the compression zone and the inner side of the H-shape steel is crushed and the H-shape steel buckled.
- An eccentricity discount factor is presented based on the formula for the ultimate bearing capacity of CFESTCs under axial compression stress, and statistical regression is then used to propose the formula for HUCFESTCs under eccentrical load. The maximum error is 8.36%, which can meet the demand for engineering accuracy.
Author Contributions
Funding
Institutional Review Board Statement
Informed Consent Statement
Data Availability Statement
Conflicts of Interest
References
- Zhao, X.; Packer, J. Tests and design of concrete-filled elliptical hollow section stub columns. Thin-Walled Struct. 2009, 47, 617–628. [Google Scholar] [CrossRef]
- Zhang, T.; Gong, Y.-Z.; Ding, F.-X.; Liu, X.-M.; Yu, Z.-W. Experimental and numerical investigation on the flexural behavior of concrete-filled elliptical steel tube (CFET). J. Build. Eng. 2021, 41, 102412. [Google Scholar] [CrossRef]
- Pourbaba, M.; Joghataie, A.; Mirmiran, A. Shear behavior of ultra-high performance concrete. Constr. Build. Mater. 2018, 183, 554–564. [Google Scholar] [CrossRef]
- Sohail, M.G.; Kahraman, R.; Al Nuaimi, N.; Gencturk, B.; Alnahhal, W. Durability characteristics of high and ultra-high performance concretes. J. Build. Eng. 2020, 33, 101669. [Google Scholar] [CrossRef]
- Alsalman, A.; Dang, C.; Prinz, G.S.; Hale, W.M. Evaluation of modulus of elasticity of ultra-high performance concrete. Constr. Build. Mater. 2017, 153, 918–928. [Google Scholar] [CrossRef]
- Jiang, L.Q.; Song, H.Y.; Ji, J. Axial compression behavior of GFRP tube reactive powder concrete composite columns with encased steel. J. Northeast. Pet. Univ. 2021, 45, 3. [Google Scholar]
- Ji, J.; He, L.; Jiang, L.; Ren, H.; Ni, S.; Wang, Z.; Li, Y.; Yu, C.; Lin, Y. Seismic Behavior of GFRP Tube Reactive Powder Concrete Composite Columns With Encased Steel. Front. Mater. 2021, 8, 516. [Google Scholar] [CrossRef]
- Sheehan, T.; Dai, X.; Chan, T.; Lam, D. Structural response of concrete-filled elliptical steel hollow sections under eccentric compression. Eng. Struct. 2012, 45, 314–323. [Google Scholar] [CrossRef]
- Yang, H.; Liu, F.; Chan, T.-M.; Wang, W. Behaviours of concrete-filled cold-formed elliptical hollow section beam-columns with varying aspect ratios. Thin-Walled Struct. 2017, 120, 9–28. [Google Scholar] [CrossRef]
- Hassanein, M.; Patel, V.; El Hadidy, A.; Al Abadi, H.; Elchalakani, M. Structural behaviour and design of elliptical high-strength concrete-filled steel tubular short compression members. Eng. Struct. 2018, 173, 495–511. [Google Scholar] [CrossRef]
- Ipek, S.; Erdoğan, A.; Güneyisi, E.M. Compressive behavior of concrete-filled double skin steel tubular short columns with the elliptical hollow section. J. Build. Eng. 2021, 38, 102200. [Google Scholar] [CrossRef]
- Guler, S.; Çopur, A.; Aydogan, M. Axial capacity and ductility of circular UHPC-filled steel tube columns. Mag. Concr. Res. 2013, 65, 898–905. [Google Scholar] [CrossRef]
- Wei, J.G.; Luo, X.; Ou, Z.J.; Chen, B.C. Experiment Study on Axial Compressive Behavior of Circular UHPC Filled high-strength Tube Stub Columns. J. Build. Strustures 2020, 11, 41. [Google Scholar] [CrossRef]
- Wei, J.G.; Xie, Z.T.; Luo, X.; Yang, Y.; Wu, Q.X.; Chen, B.C.; Yuan, Y. Behavior of circular steel tube confined ultra high performance concrete stub columns under axial compressive loading. J. Build. Strustures 2021, 43, 34. [Google Scholar] [CrossRef]
- Ji, J.; Zeng, W.; Wang, R.; Ren, H.; Zhang, L.; Liu, Y.; Jiang, L.; He, L.; Lin, Y.; Yu, C. Bearing Capacity of Hollow GFRP Pipe-Concrete-High Strength Steel Tube Composite Long Columns Under Eccentrical Compression Load. Front. Mater. 2021, 8, 402. [Google Scholar] [CrossRef]
- Ji, J.; Yu, C.; Jiang, L.; Zhan, J.; Ren, H.; Hao, S.; Fan, S.; Jiang, L.; Lin, Y.; He, L. Bearing Behavior of H-Shaped Honeycombed Steel Web Composite Columns with Rectangular Concrete-Filled Steel Tube Flanges under Eccentrical Compression Load. Adv. Civ. Eng. 2022, 2022, 2965131. [Google Scholar] [CrossRef]
- Ma, H.; Chen, Y.; Bai, H.; Zhao, Y. Eccentric compression performance of composite columns composed of RAC-filled circular steel tube and profile steel. Eng. Struct. 2019, 201, 109778. [Google Scholar] [CrossRef]
- Liao, J.; Li, Y.-L.; Ouyang, Y.; Zeng, J.-J. Axial compression tests on elliptical high strength steel tubes filled with self-compacting concrete of different mix proportions. J. Build. Eng. 2021, 40, 102678. [Google Scholar] [CrossRef]
- Uenaka, K. Experimental study on concrete-filled elliptical/oval steel tubular stub columns under compression. Thin-Walled Struct. 2014, 78, 131–137. [Google Scholar] [CrossRef]
- Dai, X.; Lam, D. Numerical modelling of the axial compressive behaviour of short concrete-filled elliptical steel columns. J. Constr. Steel Res. 2010, 66, 931–942. [Google Scholar] [CrossRef]
- Ren, Q.-X.; Han, L.-H.; Lam, D.; Li, W. Tests on elliptical concrete filled steel tubular (CFST) beams and columns. J. Constr. Steel Res. 2014, 99, 149–160. [Google Scholar] [CrossRef]
- Du, J.; Meng, W.; Khayat, K.H.; Bao, Y.; Guo, P.; Lyu, Z.; Abu-Obeidah, A.; Nassif, H.; Wang, H. New development of ultra-high-performance concrete (UHPC). Compos. Part B Eng. 2021, 224, 109220. [Google Scholar] [CrossRef]
- Ullah, R.; Qiang, Y.; Ahmad, J.; Vatin, N.I.; El-Shorbagy, M.A. Ultra-High-Performance Concrete (UHPC): A State-of-the-Art Review. Materials 2022, 15, 4131. [Google Scholar] [CrossRef] [PubMed]
- Tao, Z.; Wang, Z.-B.; Yu, Q. Finite element modelling of concrete-filled steel stub columns under axial compression. J. Constr. Steel Res. 2013, 89, 121–131. [Google Scholar] [CrossRef]
- Han, L.H. Concrete-Filled Steel Tube Structures: Theory and Practice; Science Press: Beijing, China, 2007. [Google Scholar]
- Mander, J.B.; Priestley, M.J.N.; Park, R. Theoretical Stress-Strain Model for Confined Concrete. J. Struct. Eng. 1988, 114, 1804–1826. [Google Scholar] [CrossRef]
- Teng, J.; Yu, T.; Wong, Y.; Dong, S. Hybrid FRP–concrete–steel tubular columns: Concept and behavior. Constr. Build. Mater. 2007, 21, 846–854. [Google Scholar] [CrossRef]
- Pagoulatou, M.; Sheehan, T.; Dai, X.; Lam, D. Finite element analysis on the capacity of circular concrete-filled double-skin steel tubular (CFDST) stub columns. Eng. Struct. 2014, 72, 102–112. [Google Scholar] [CrossRef]
- American Concrete Institute. Building Code Requirements for Structural Concrete and Commentary, ACI 318-05; American Concrete Institute: Farmington Hills, MI, USA, 2005. [Google Scholar]
- Ji, J.; Yu, D.Y.; Jiang, L.Q.; Liu, Y.C.; Yang, M.M.; Song, H.Y.; Jiang, L. Research on axial compression bearing capacity of different-strength concrete-filled double steel tube short columns. Build. Struct. 2020, 50, 120–129. [Google Scholar] [CrossRef]
- Luo, X.; Wei, J.G.; Han, J.P.; Han, B.C. Experimental study on compression performance of ultra-high- strength concrete (UHSC) filled high-strength steel tube stub columns subjected to eccentric load. J. Build. Struct. 2021, 41, 271–277. [Google Scholar] [CrossRef]
- Guo, X.S. Behaviors of Axially Loaded and Eccentrically Loaded concrete-filled Elliptical Hollow Sections. Master’s Thesis, Harbin Institute of Technology, Harbin, China, 2015. [Google Scholar]
- BS EN 1994-1-1: Eurocode 4; Design of Composite Steel and Concrete Structures Part 1-1: General Rules and Rules for Buildings. British Standards Institution: London, UK, 2004.


| Specimens | a/b | t/mm | fy/MPa | fy1/MPa | fck/MPa | e/mm | ||||
|---|---|---|---|---|---|---|---|---|---|---|
| Wei et al. [13] | UCS-1 | 1 | 4.4 | 1020 | 0 | 142.1 | 0 | 4536.15 | 4436.23 | 2.25 |
| UCS-2 | 1 | 6.2 | 1153 | 0 | 142.1 | 0 | 5482.38 | 5693.65 | 3.71 | |
| UCS-3 | 1 | 10.4 | 773 | 0 | 142.1 | 0 | 6354.45 | 6388.43 | 0.53 | |
| UCS-4 | 1 | 8.3 | 813 | 0 | 142.1 | 0 | 5510.30 | 5304.37 | 3.88 | |
| UCS-5 | 1 | 6.2 | 359 | 0 | 142.1 | 0 | 3186.18 | 3042.26 | 4.73 | |
| Ma et al. [19] | CESC-1 | 1 | 3 | 235 | 235 | 34 | 30 | 1694.59 | 1700.43 | 0.34 |
| CESC-2 | 1 | 2 | 235 | 235 | 34 | 30 | 2197.75 | 2167.51 | 1.40 | |
| Guo et al. [32] | S28-25a | 1.98 | 2.6 | 235 | 0 | 34 | 25 | 944.62 | 953.79 | 0.96 |
| S28-50a | 1.96 | 1.6 | 235 | 0 | 34 | 50 | 764.21 | 728.60 | 4.89 | |
| S10-80a | 1.51 | 2.6 | 235 | 0 | 34 | 0 | 1294.52 | 1224.33 | 5.50 | |
| S20-50a | 2.05 | 2.5 | 235 | 0 | 34 | 0 | 2506.65 | 2454.26 | 2.13 | |
| Yang et al. [9] | L-Ma-35-25 | 1.97 | 2.5 | 376.4 | 0 | 48.87 | 25 | 836.25 | 840.13 | 0.46 |
| L-Ma-35-50 | 1.92 | 2.6 | 376.4 | 0 | 48.87 | 50 | 638.81 | 639.54 | 0.11 | |
| L-Ma-50-25 | 1.95 | 2.6 | 376.4 | 0 | 48.87 | 25 | 648.76 | 638.62 | 1.59 | |
| L-Ma-50-50 | 1.95 | 2.6 | 376.4 | 0 | 48.87 | 50 | 529.15 | 538.74 | 1.78 | |
| Luo et al. [31] | UCFST-1 | 1 | 6.2 | 1153 | 0 | 146.3 | 14 | 3762 | 3810.36 | 1.26 |
| UCFST-2 | 1 | 6.2 | 1153 | 0 | 146.3 | 42 | 2501 | 2479.02 | 0.88 | |
| UCFST-3 | 1 | 6.2 | 1153 | 0 | 146.3 | 84 | 1757 | 1694.94 | 3.39 | |
| Specimen | 2a × 2b/mm | AHS/mm2 | t/mm | |||||
|---|---|---|---|---|---|---|---|---|
| HUCFEST-1 | 204 × 102 | 1180 | 6 | 0.5 | 0.47 | 1733.04 | 1658.32 | 4.50 |
| HUCFEST-2 | 204 × 102 | 1180 | 6 | 0.5 | 0.47 | 1886.88 | 1796.13 | 5.00 |
| HUCFEST-3 | 204 × 102 | 1180 | 6 | 0.5 | 0.47 | 2093.60 | 2033.94 | 2.87 |
| HUCFEST-4 | 204 × 102 | 1180 | 6 | 0.2 | 0.70 | 2473.18 | 2487.48 | 0.58 |
| HUCFEST-5 | 204 × 102 | 1180 | 6 | 0.2 | 0.70 | 2700.65 | 2694.19 | 0.22 |
| HUCFEST-6 | 204 × 102 | 1180 | 6 | 0.2 | 0.70 | 2928.20 | 2900.91 | 0.93 |
| HUCFEST-7 | 204 × 102 | 1180 | 6 | 0.5 | 0.47 | 1783.10 | 1713.38 | 0.47 |
| HUCFEST-8 | 204 × 102 | 1180 | 6 | 0.5 | 0.47 | 1837.25 | 1768.45 | 0.52 |
| HUCFEST-9 | 204 × 102 | 1180 | 6 | 0.2 | 0.70 | 2558.62 | 2570.08 | 4.06 |
| HUCFEST-10 | 204 × 102 | 1180 | 6 | 0.2 | 0.70 | 2639.90 | 2652.68 | 3.88 |
| HUCFEST-11 | 204 × 102 | 1180 | 2 | 0.3 | 0.6 | 1859.27 | 1958.35 | 5.07 |
| HUCFEST-12 | 204 × 102 | 1180 | 2 | 0.4 | 0.53 | 1576.21 | 1540.75 | 2.28 |
| HUCFEST-13 | 204 × 102 | 1180 | 2 | 0.5 | 0.47 | 1405.38 | 1503.16 | 6.53 |
| HUCFEST-14 | 204 × 102 | 1180 | 2 | 0.6 | 0.41 | 1247.50 | 1241.83 | 0.49 |
| HUCFEST-15 | 204 × 102 | 1180 | 2 | 0.7 | 0.33 | 1121.61 | 1087.97 | 3.04 |
| HUCFEST-16 | 204 × 102 | 1180 | 2 | 0.3 | 0.6 | 1738.27 | 1787.78 | 2.78 |
| HUCFEST-17 | 204 × 102 | 1180 | 2 | 0.4 | 0.53 | 1459.46 | 1489.14 | 2.02 |
| HUCFEST-18 | 204 × 102 | 1180 | 2 | 0.5 | 0.47 | 1297.01 | 1390.49 | 6.72 |
| HUCFEST-19 | 204 × 102 | 1180 | 2 | 0.6 | 0.41 | 1159.06 | 1224.96 | 5.38 |
| HUCFEST-20 | 204 × 102 | 1180 | 2 | 0.7 | 0.33 | 1047.21 | 993.21 | 5.42 |
| HUCFEST-21 | 204 × 102 | 1180 | 4 | 0.5 | 0.47 | 1843.24 | 1792.80 | 2.80 |
| HUCFEST-22 | 204 × 102 | 1180 | 8 | 0.5 | 0.47 | 2580.67 | 2477.55 | 4.00 |
| HUCFEST-23 | 204 × 102 | 1180 | 2 | 0.2 | 0.70 | 2158.57 | 2284.74 | 5.55 |
| HUCFEST-24 | 204 × 102 | 1180 | 4 | 0.2 | 0.70 | 2611.29 | 2689.20 | 2.91 |
| HUCFEST-25 | 204 × 102 | 1180 | 6 | 0.2 | 0.70 | 3111.30 | 3066.11 | 1.46 |
| HUCFEST-26 | 204 × 102 | 1180 | 8 | 0.2 | 0.70 | 3624.47 | 3416.33 | 6.08 |
| HUCFEST-27 | 204 × 102 | 1180 | 6 | 0.5 | 0.47 | 2138.67 | 2128.42 | 5.25 |
| HUCFEST-28 | 204 × 102 | 1180 | 6 | 0.5 | 0.47 | 2215.83 | 2044.07 | 8.36 |
| HUCFEST-29 | 204 × 102 | 1180 | 6 | 0.5 | 0.47 | 2280.12 | 2330.81 | 2.15 |
| HUCFEST-30 | 204 × 102 | 1180 | 6 | 0.2 | 0.70 | 2951.78 | 2892.63 | 2.02 |
| HUCFEST-31 | 204 × 102 | 1180 | 6 | 0.2 | 0.70 | 3233.47 | 3196.22 | 1.15 |
| HUCFEST-32 | 204 × 102 | 1180 | 2 | 0.5 | 0.47 | 1392.31 | 1423.16 | 2.20 |
| HUCFEST-33 | 204 × 102 | 1180 | 2 | 0.5 | 0.47 | 1384.54 | 1423.16 | 1.80 |
| HUCFEST-34 | 204 × 102 | 1180 | 2 | 0.2 | 0.70 | 2188.73 | 2284.74 | 4.23 |
| HUCFEST-35 | 204 × 102 | 1180 | 2 | 0.2 | 0.70 | 2166.45 | 2284.74 | 5.20 |
| HUCFEST-36 | 204 × 204 | 1180 | 2 | 0.5 | 0.47 | 3749.93 | 3933.10 | 4.68 |
| HUCFEST-37 | 204 × 136 | 1180 | 2 | 0.5 | 0.47 | 2570.45 | 2734.19 | 6.12 |
| HUCFEST-38 | 204 × 204 | 1180 | 2 | 0.5 | 0.47 | 5281.76 | 5073.21 | 3.95 |
| HUCFEST-39 | 204 × 136 | 1180 | 2 | 0.2 | 0.70 | 3766.03 | 3689.50 | 2.04 |
| HUCFEST-40 | 204 × 102 | 1000 | 6 | 0.5 | 0.47 | 2108.15 | 2215.45 | 5.09 |
| HUCFEST-41 | 204 × 102 | 680 | 6 | 0.5 | 0.47 | 2093.82 | 2100.72 | 0.33 |
| HUCFEST-42 | 204 × 102 | 1180 | 6 | 0.6 | 0.41 | 2012.77 | 1989.33 | 1.16 |
| HUCFEST-43 | 204 × 102 | 1000 | 6 | 0.6 | 0.41 | 1988.22 | 1955.60 | 1.64 |
| HUCFEST-44 | 204 × 102 | 680 | 6 | 0.6 | 0.41 | 1899.25 | 1854.26 | 2.37 |
Publisher’s Note: MDPI stays neutral with regard to jurisdictional claims in published maps and institutional affiliations. |
© 2022 by the authors. Licensee MDPI, Basel, Switzerland. This article is an open access article distributed under the terms and conditions of the Creative Commons Attribution (CC BY) license (https://creativecommons.org/licenses/by/4.0/).
Share and Cite
Ji, J.; Wang, W.; Jiang, L.; Ren, H.; Wang, Q.; Xuan, W.; Liu, Y. Bearing Capacity of UHPC-Filled High-Strength Elliptical Steel Tube Composite Columns with Encased High-Strength H-Shape Steel Subjected to Eccentrical Load. Buildings 2022, 12, 1272. https://doi.org/10.3390/buildings12081272
Ji J, Wang W, Jiang L, Ren H, Wang Q, Xuan W, Liu Y. Bearing Capacity of UHPC-Filled High-Strength Elliptical Steel Tube Composite Columns with Encased High-Strength H-Shape Steel Subjected to Eccentrical Load. Buildings. 2022; 12(8):1272. https://doi.org/10.3390/buildings12081272
Chicago/Turabian StyleJi, Jing, Weichen Wang, Liangqin Jiang, Hongguo Ren, Qingqin Wang, Wenyu Xuan, and Yingchun Liu. 2022. "Bearing Capacity of UHPC-Filled High-Strength Elliptical Steel Tube Composite Columns with Encased High-Strength H-Shape Steel Subjected to Eccentrical Load" Buildings 12, no. 8: 1272. https://doi.org/10.3390/buildings12081272