Flexural Strength of Partially Concrete-Filled Steel Tubes Subjected to Lateral Loads by Experimental Testing and Finite Element Modelling
Abstract
1. Introduction
2. Experimental Test Programme
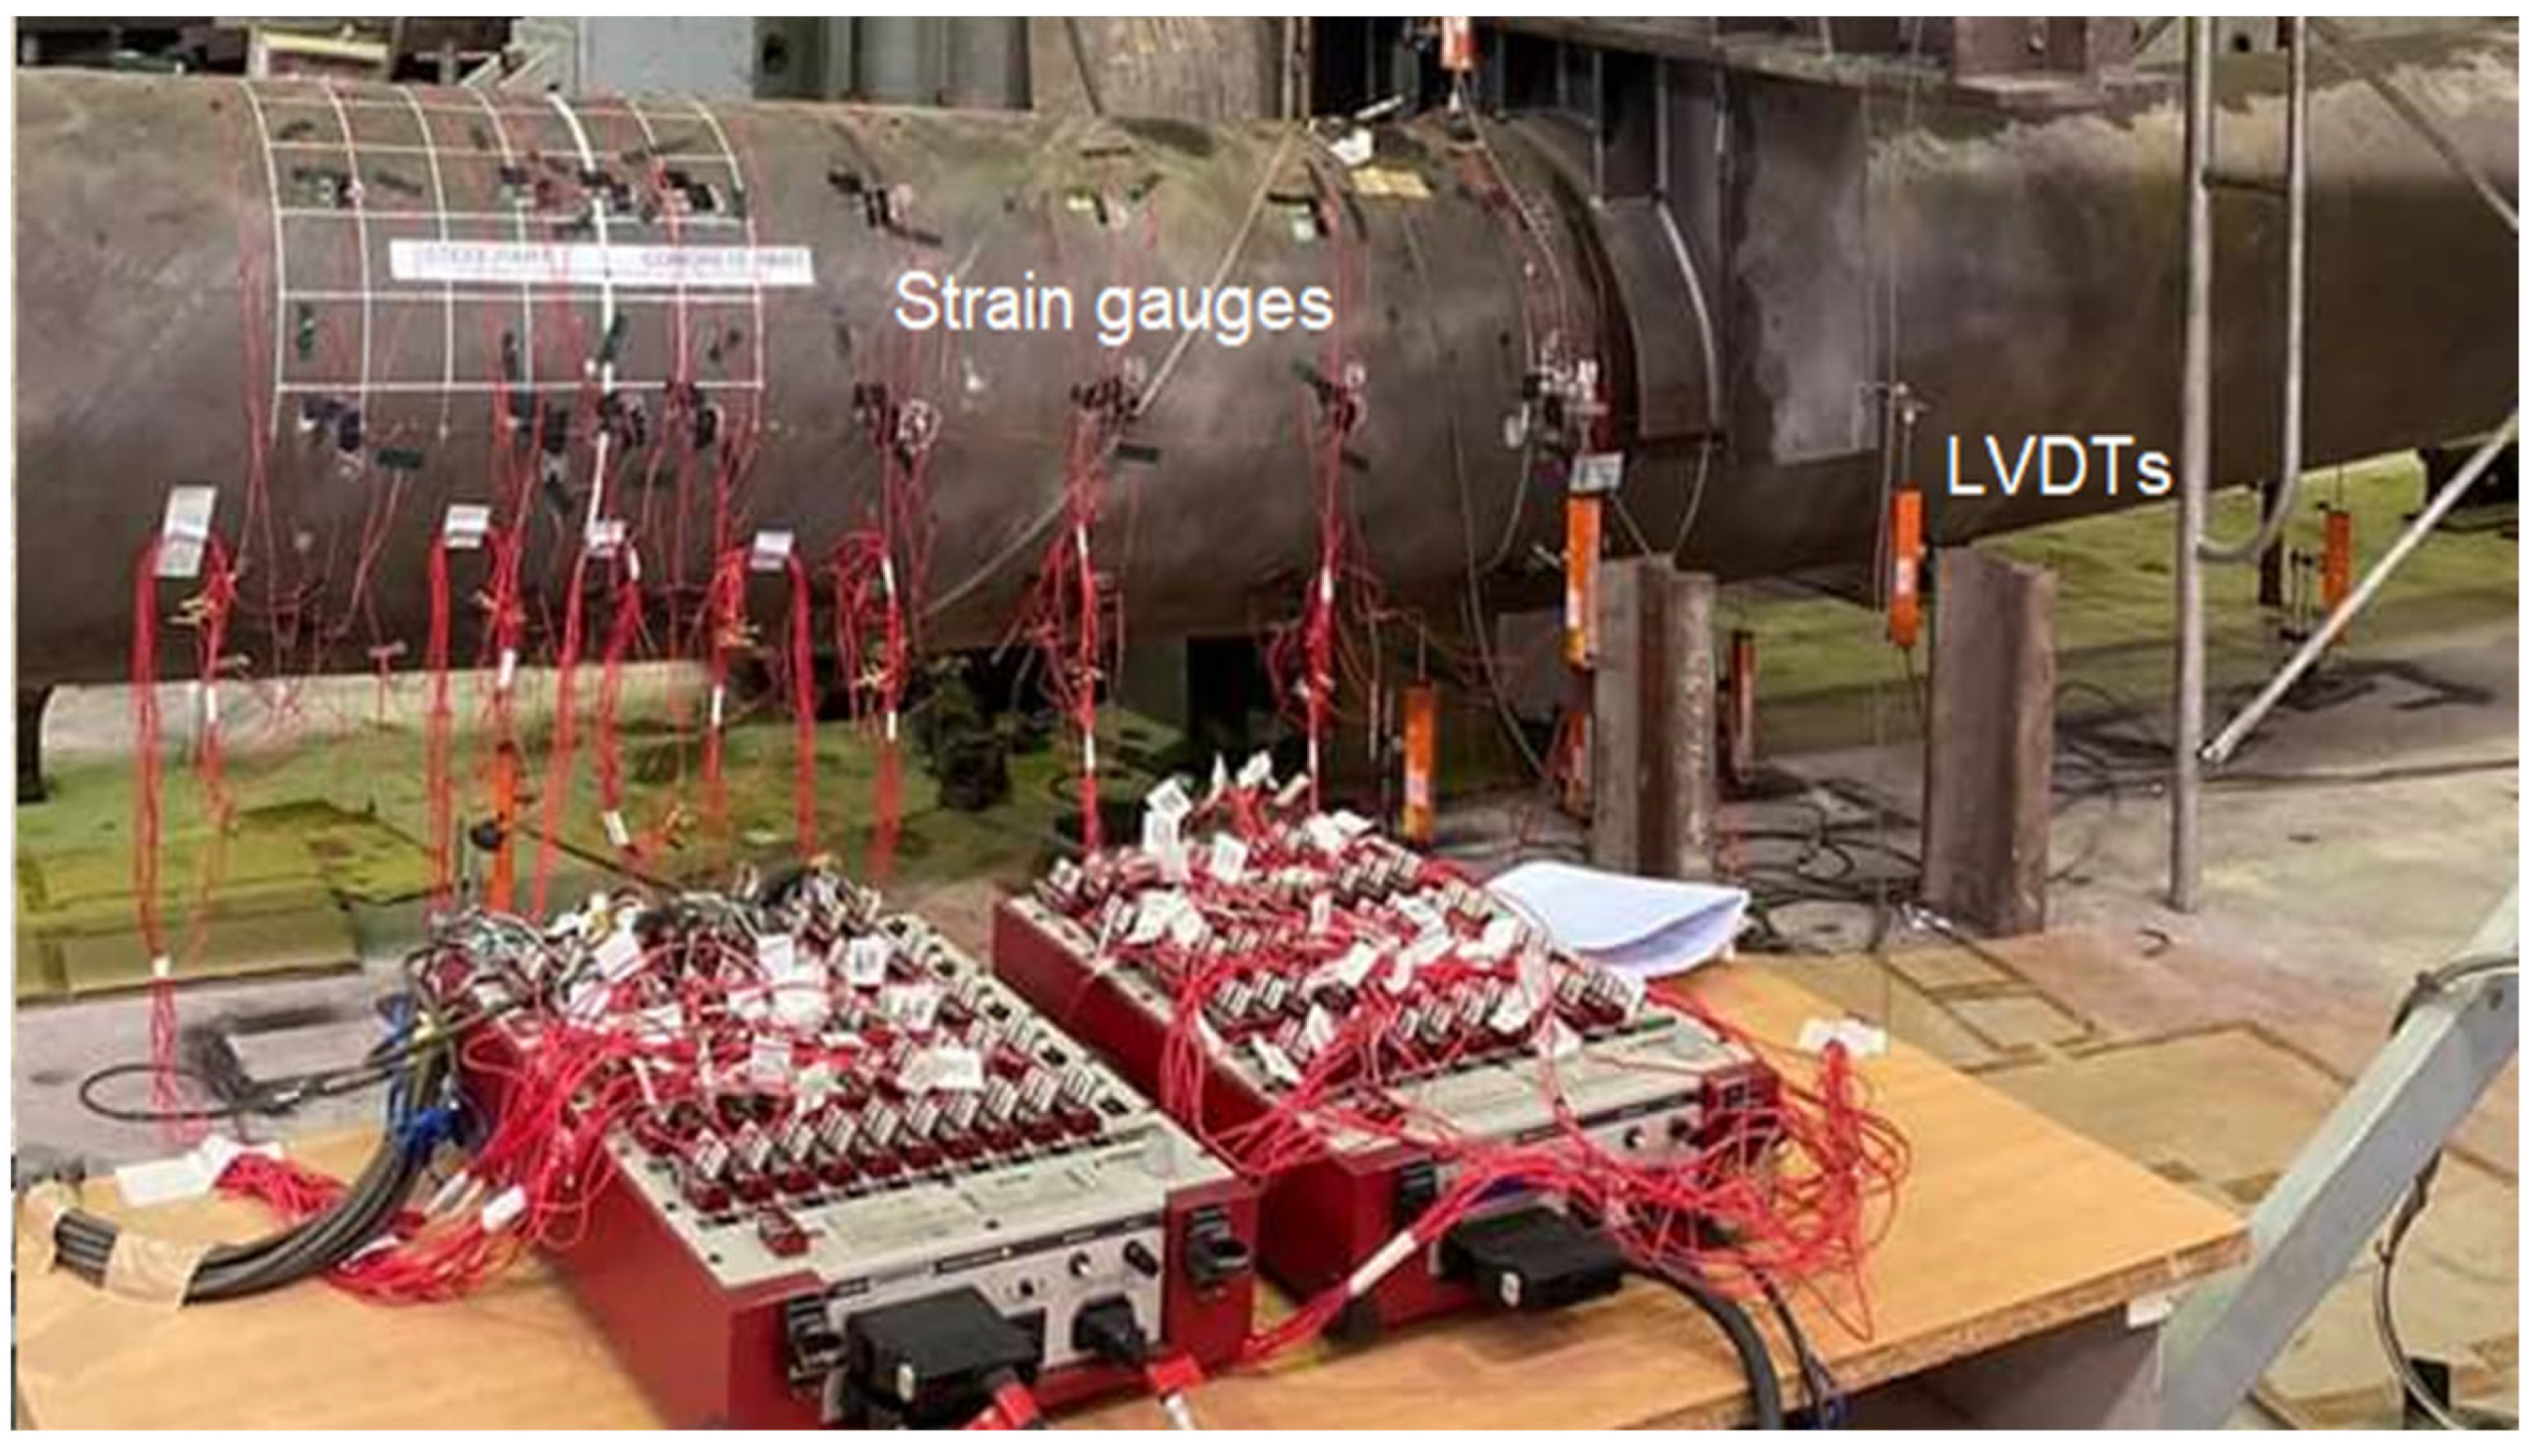
Testing Procedure
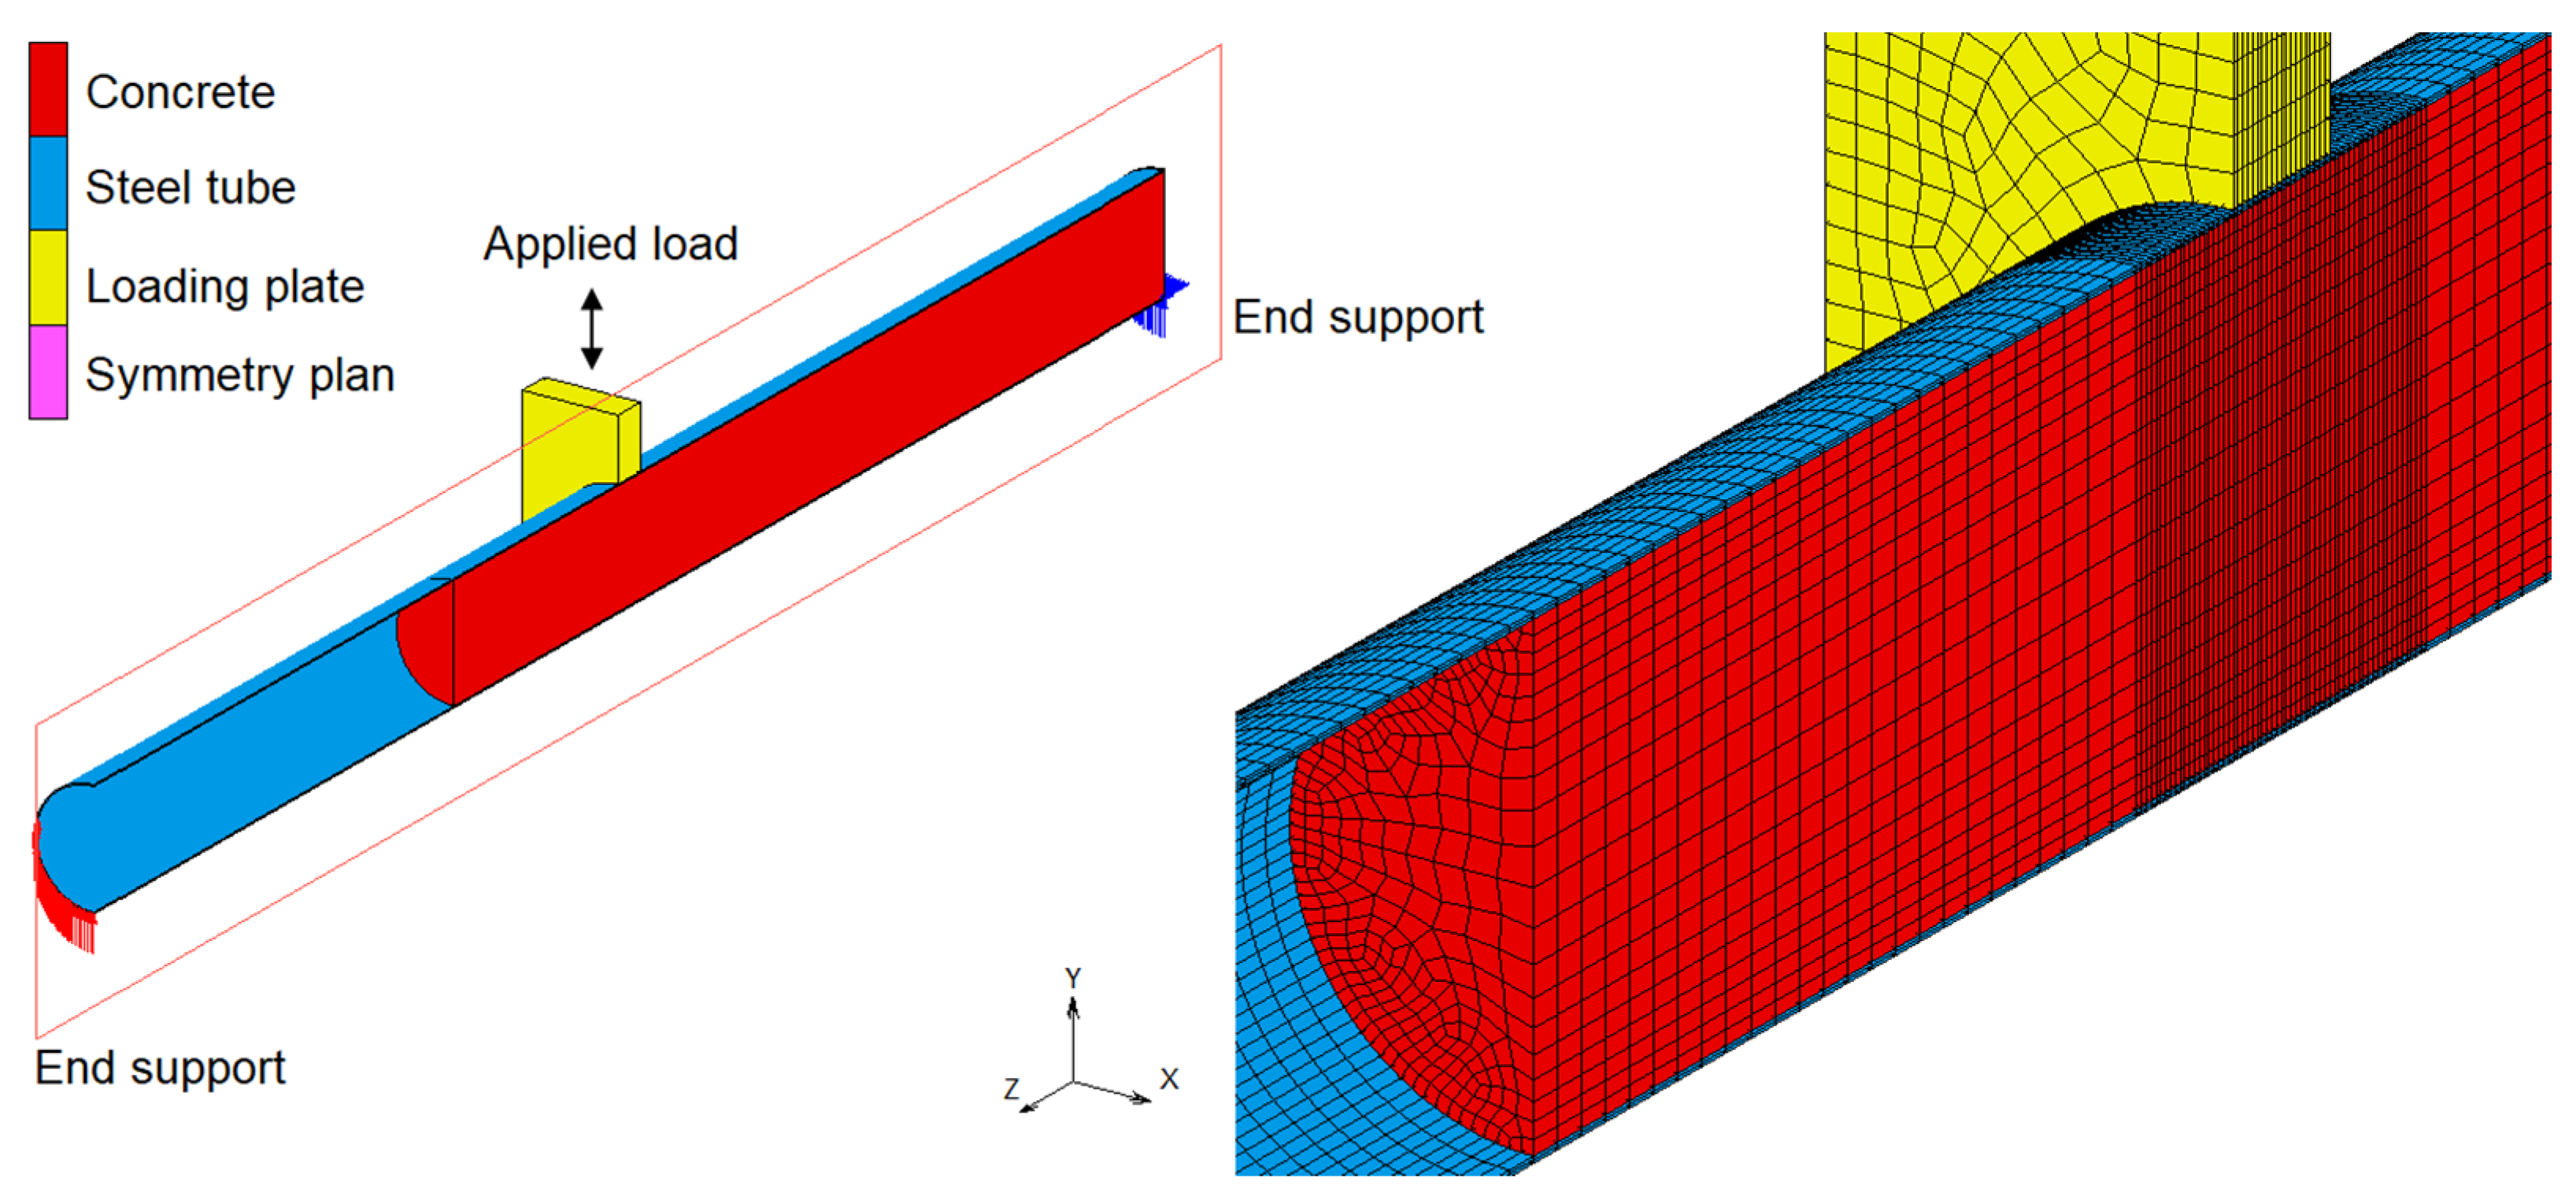
3. Finite Element Modelling
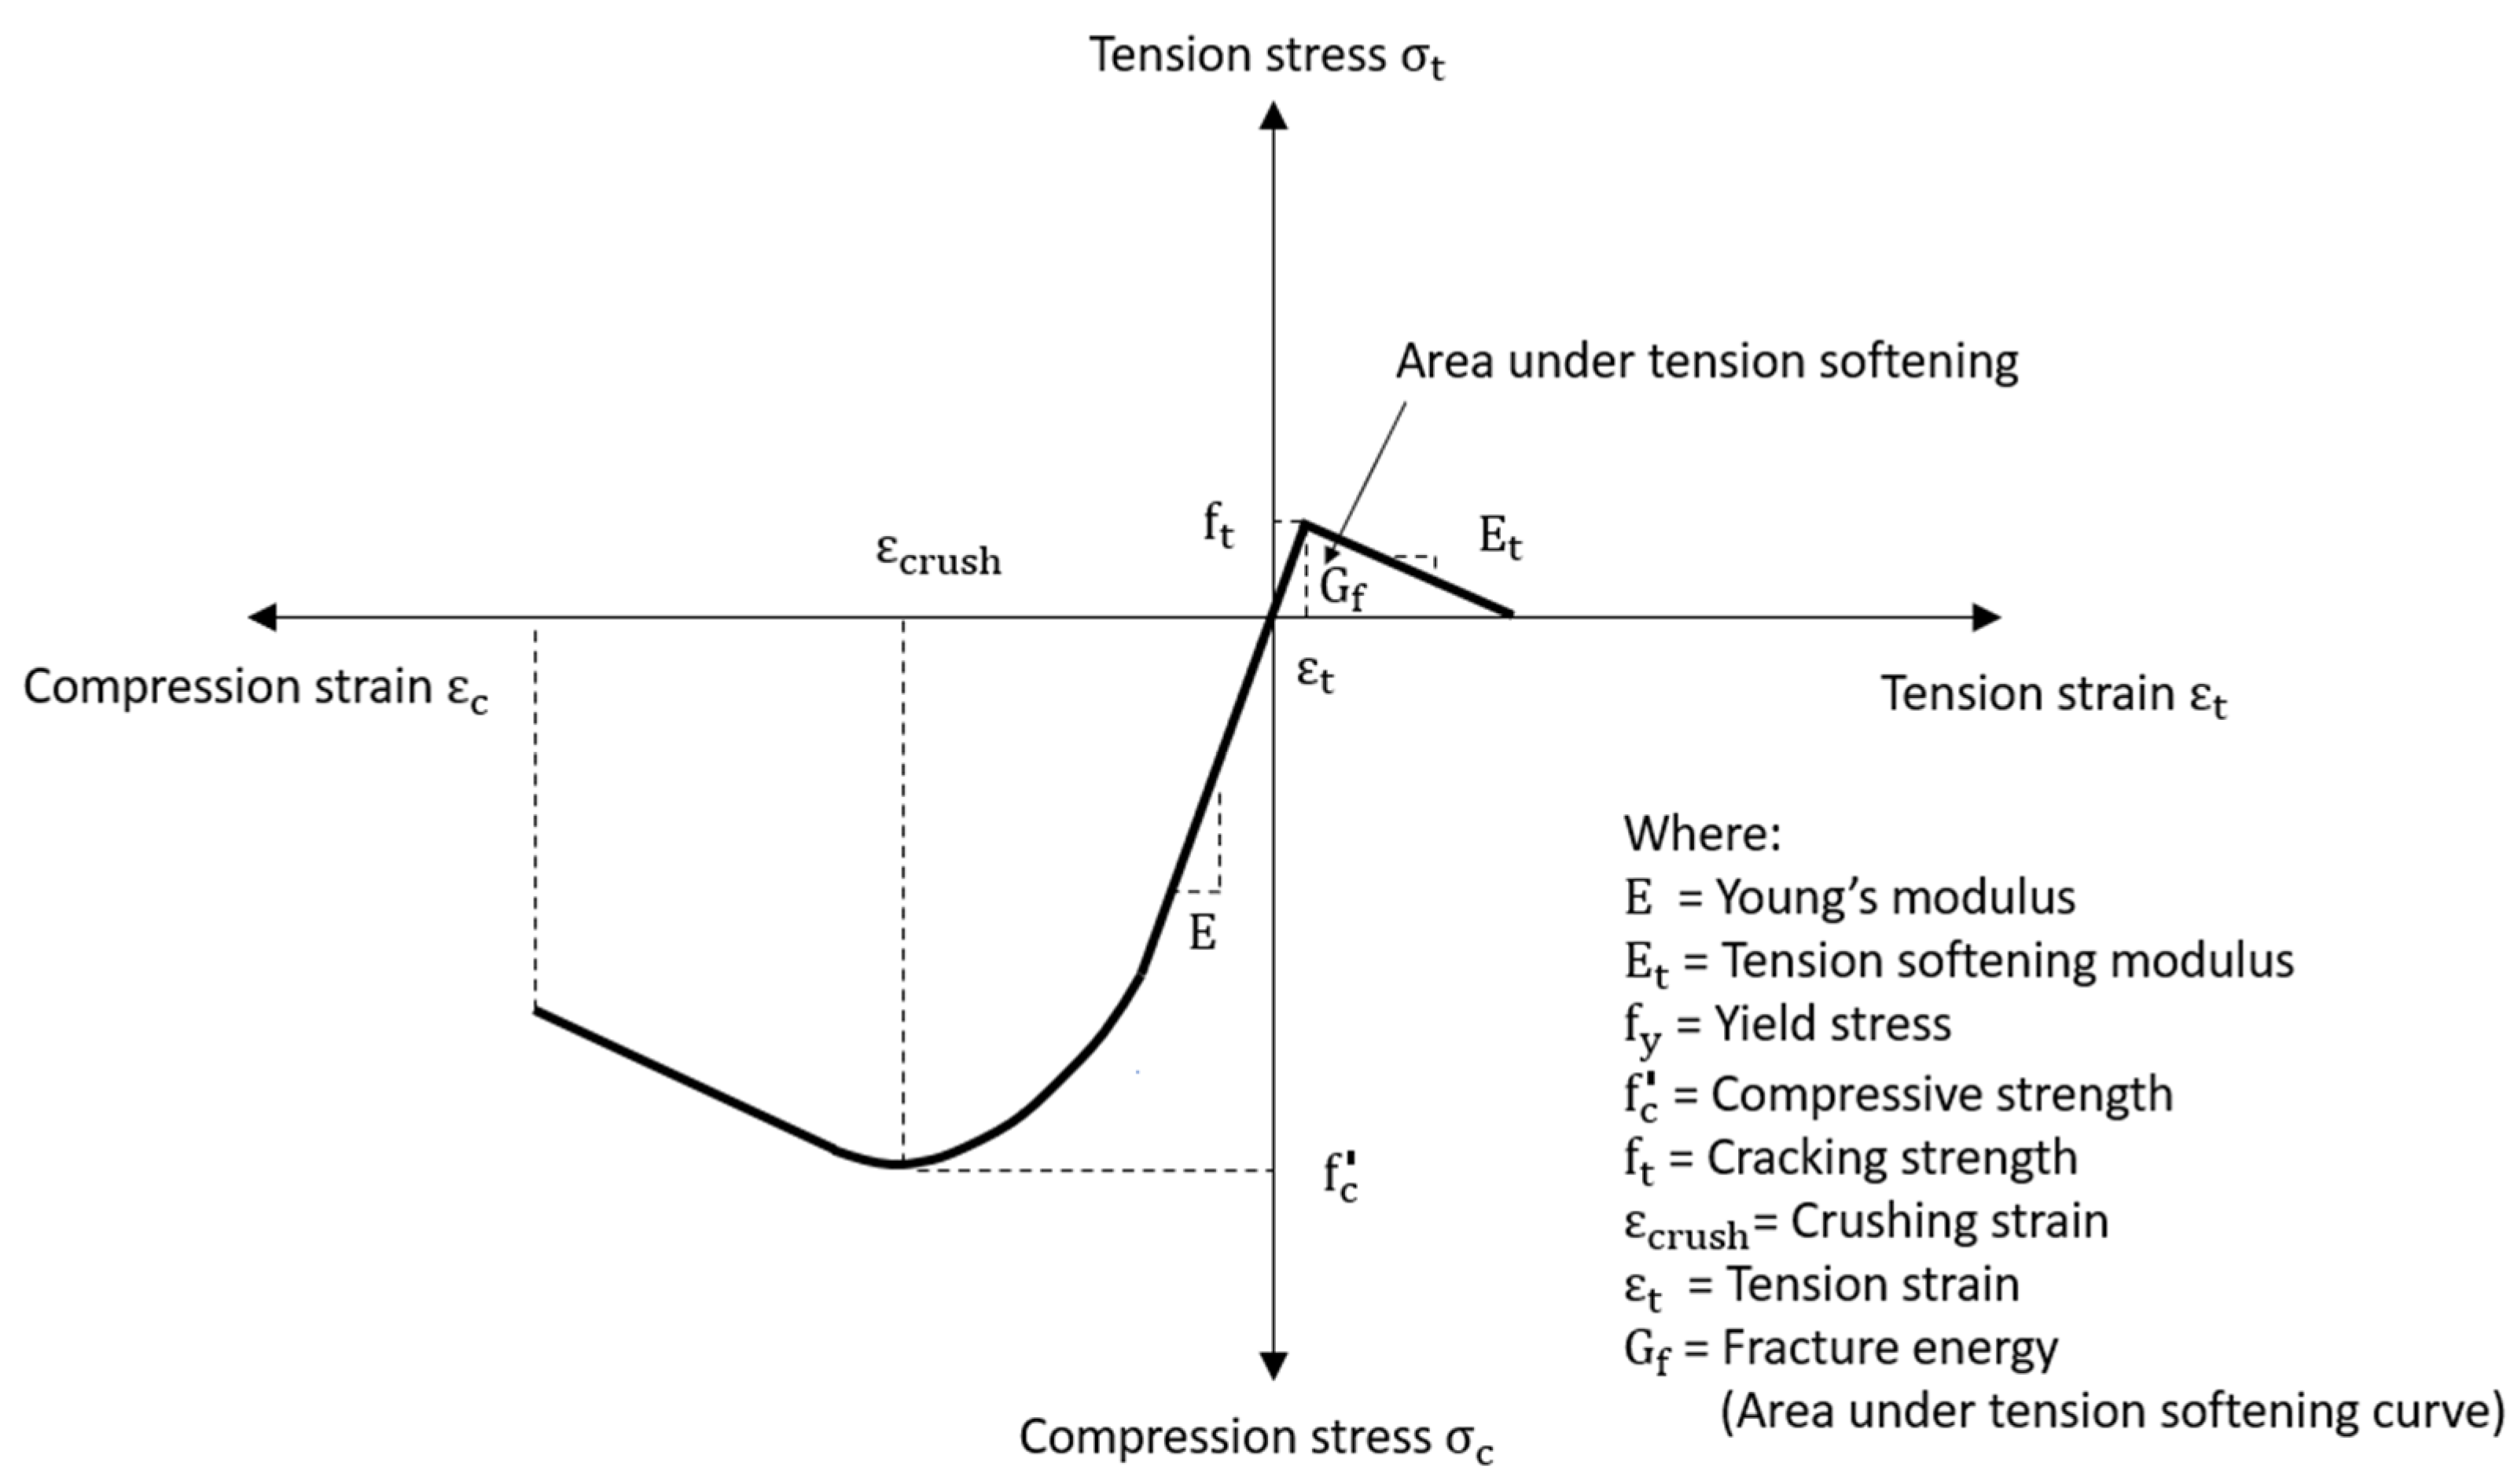
3.1. Concrete in Compression
3.2. Concrete in Tension
- (i)
- Mesh density: two different meshes, MESH I and MESH II, with the same small size in the region around the loading plate, were used for the concrete filling. MESH I had 49,938 solid elements of 50 mm × 50 mm × 50 mm, and MESH II was a very fine mesh, of 82,656 elements of 50 mm × 50 mm × 25 mm. The simulation results revealed that the maximum loads in MESH I differed from those of MESH II by less than 2%, but the analysis time was twice expensive for MESH II. Therefore, MESH I was considered accurate enough to be used in this study.
- (ii)
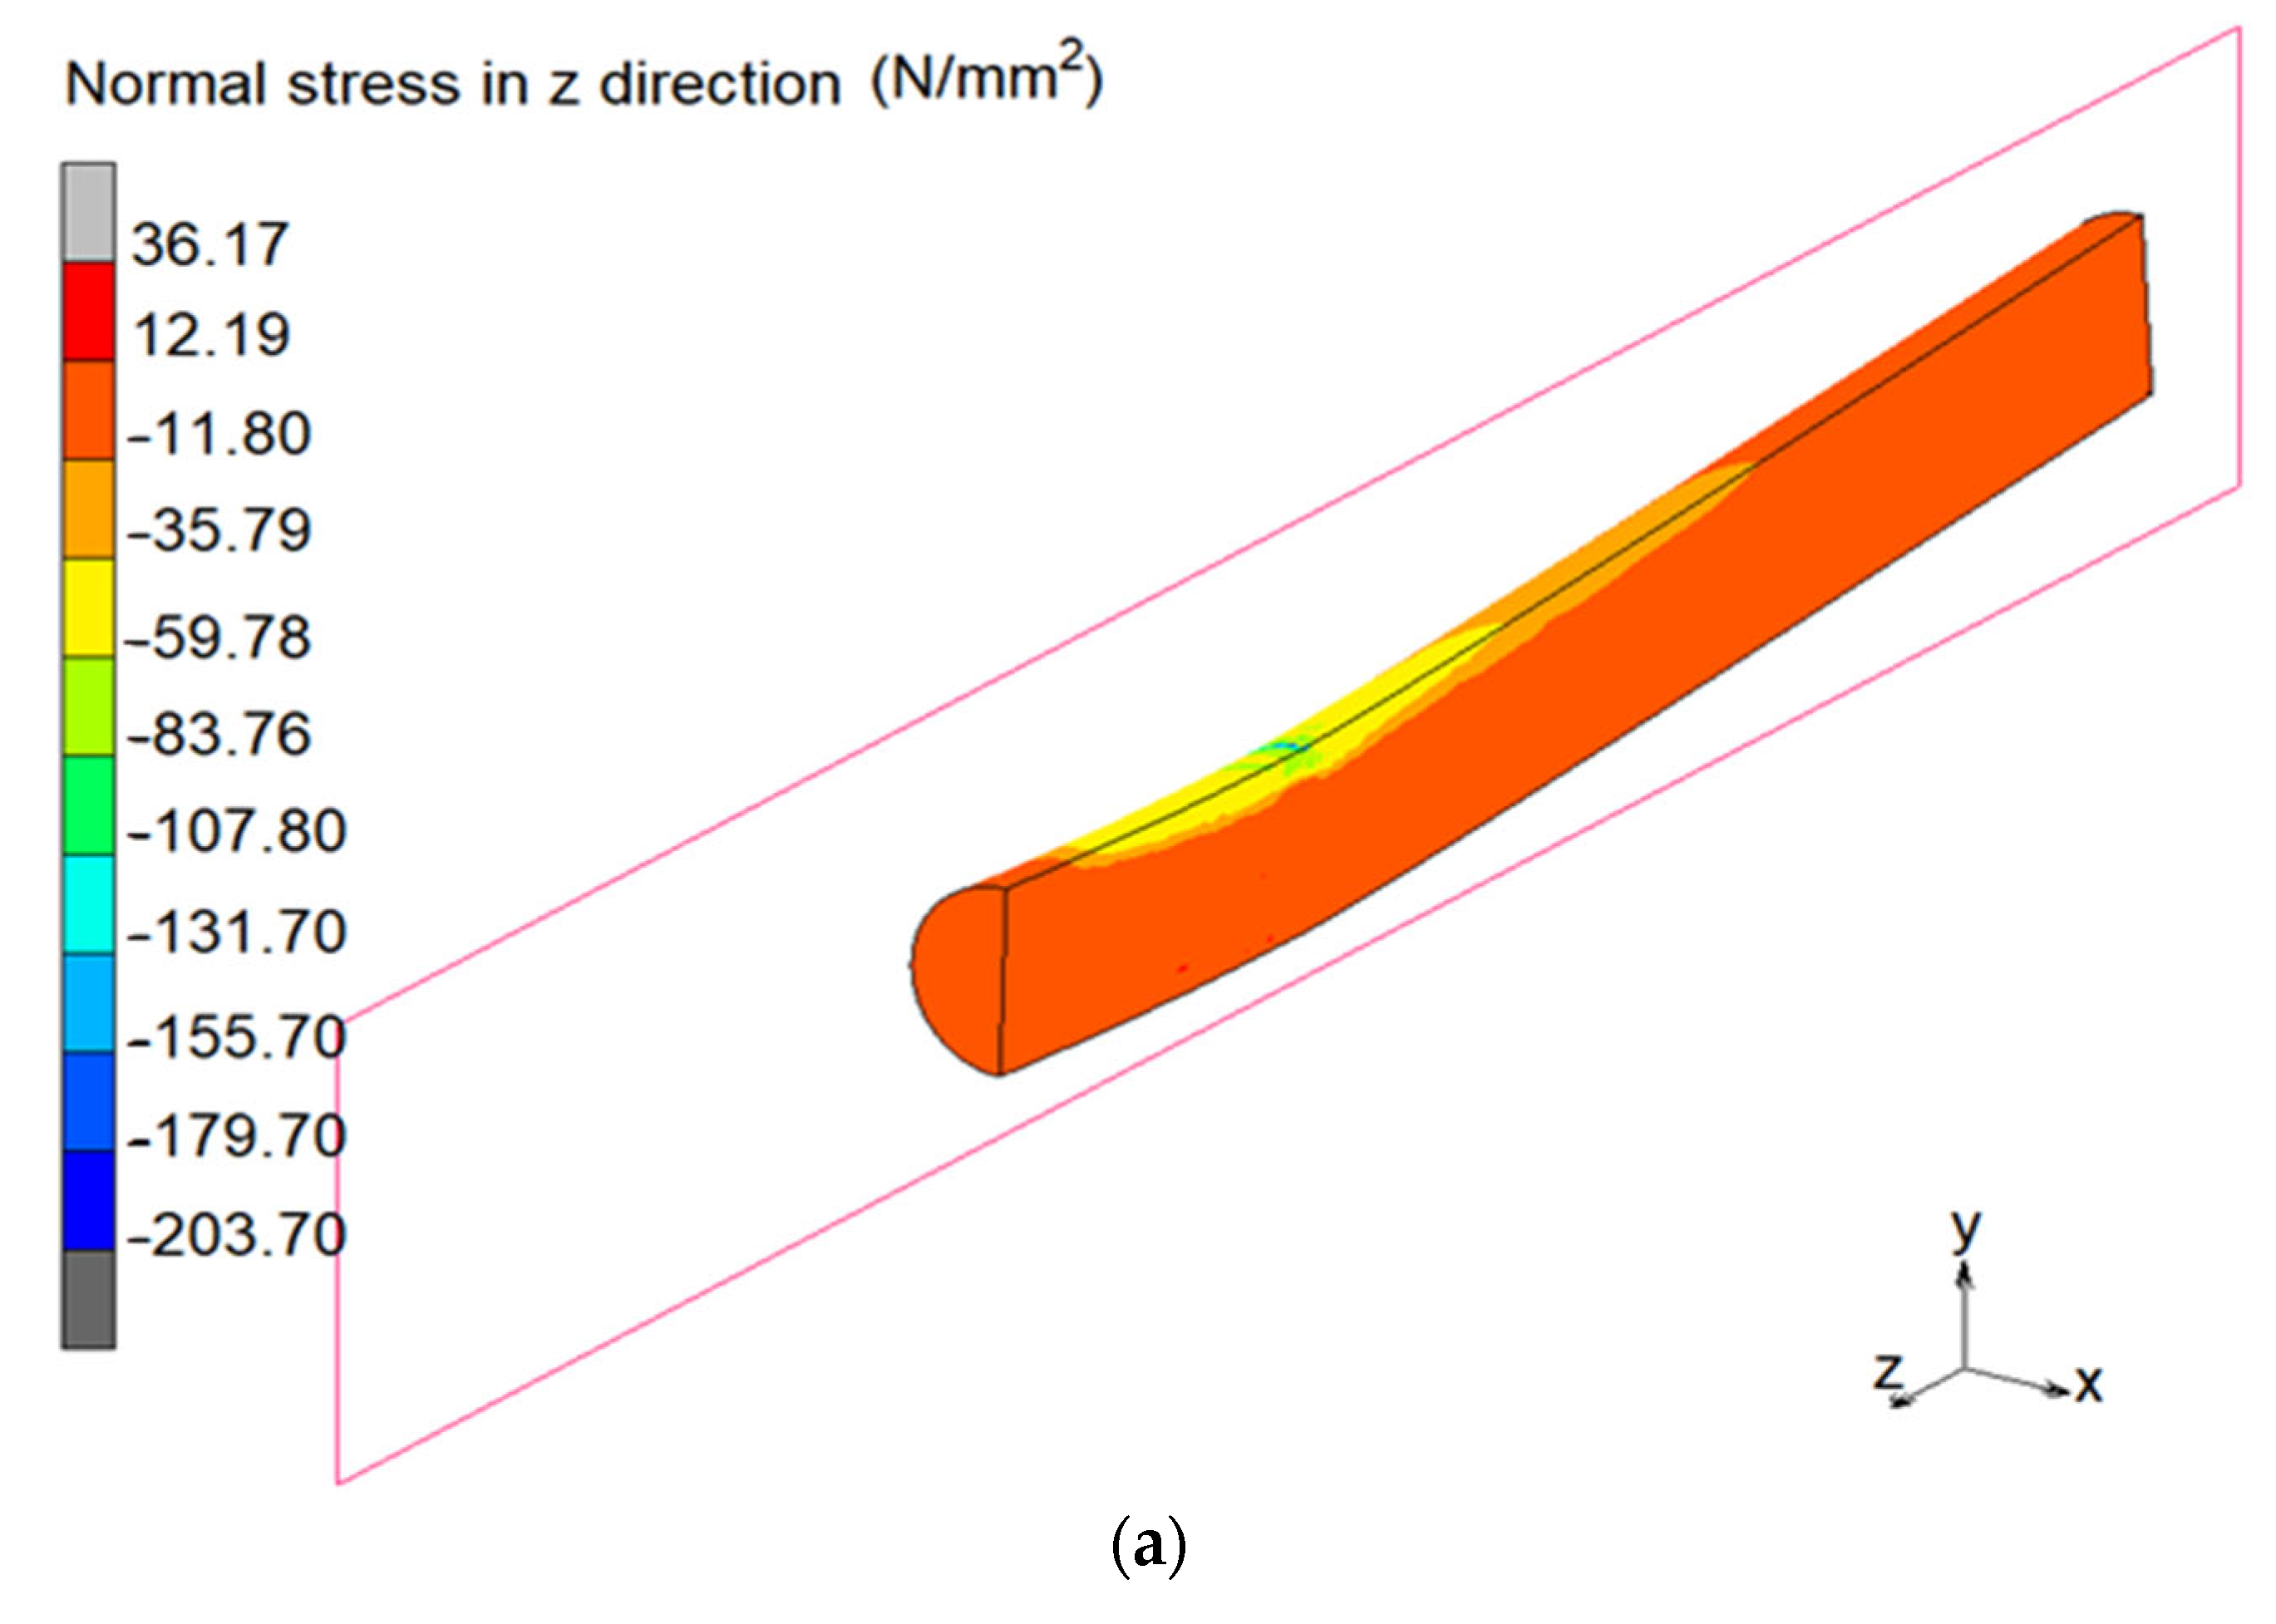
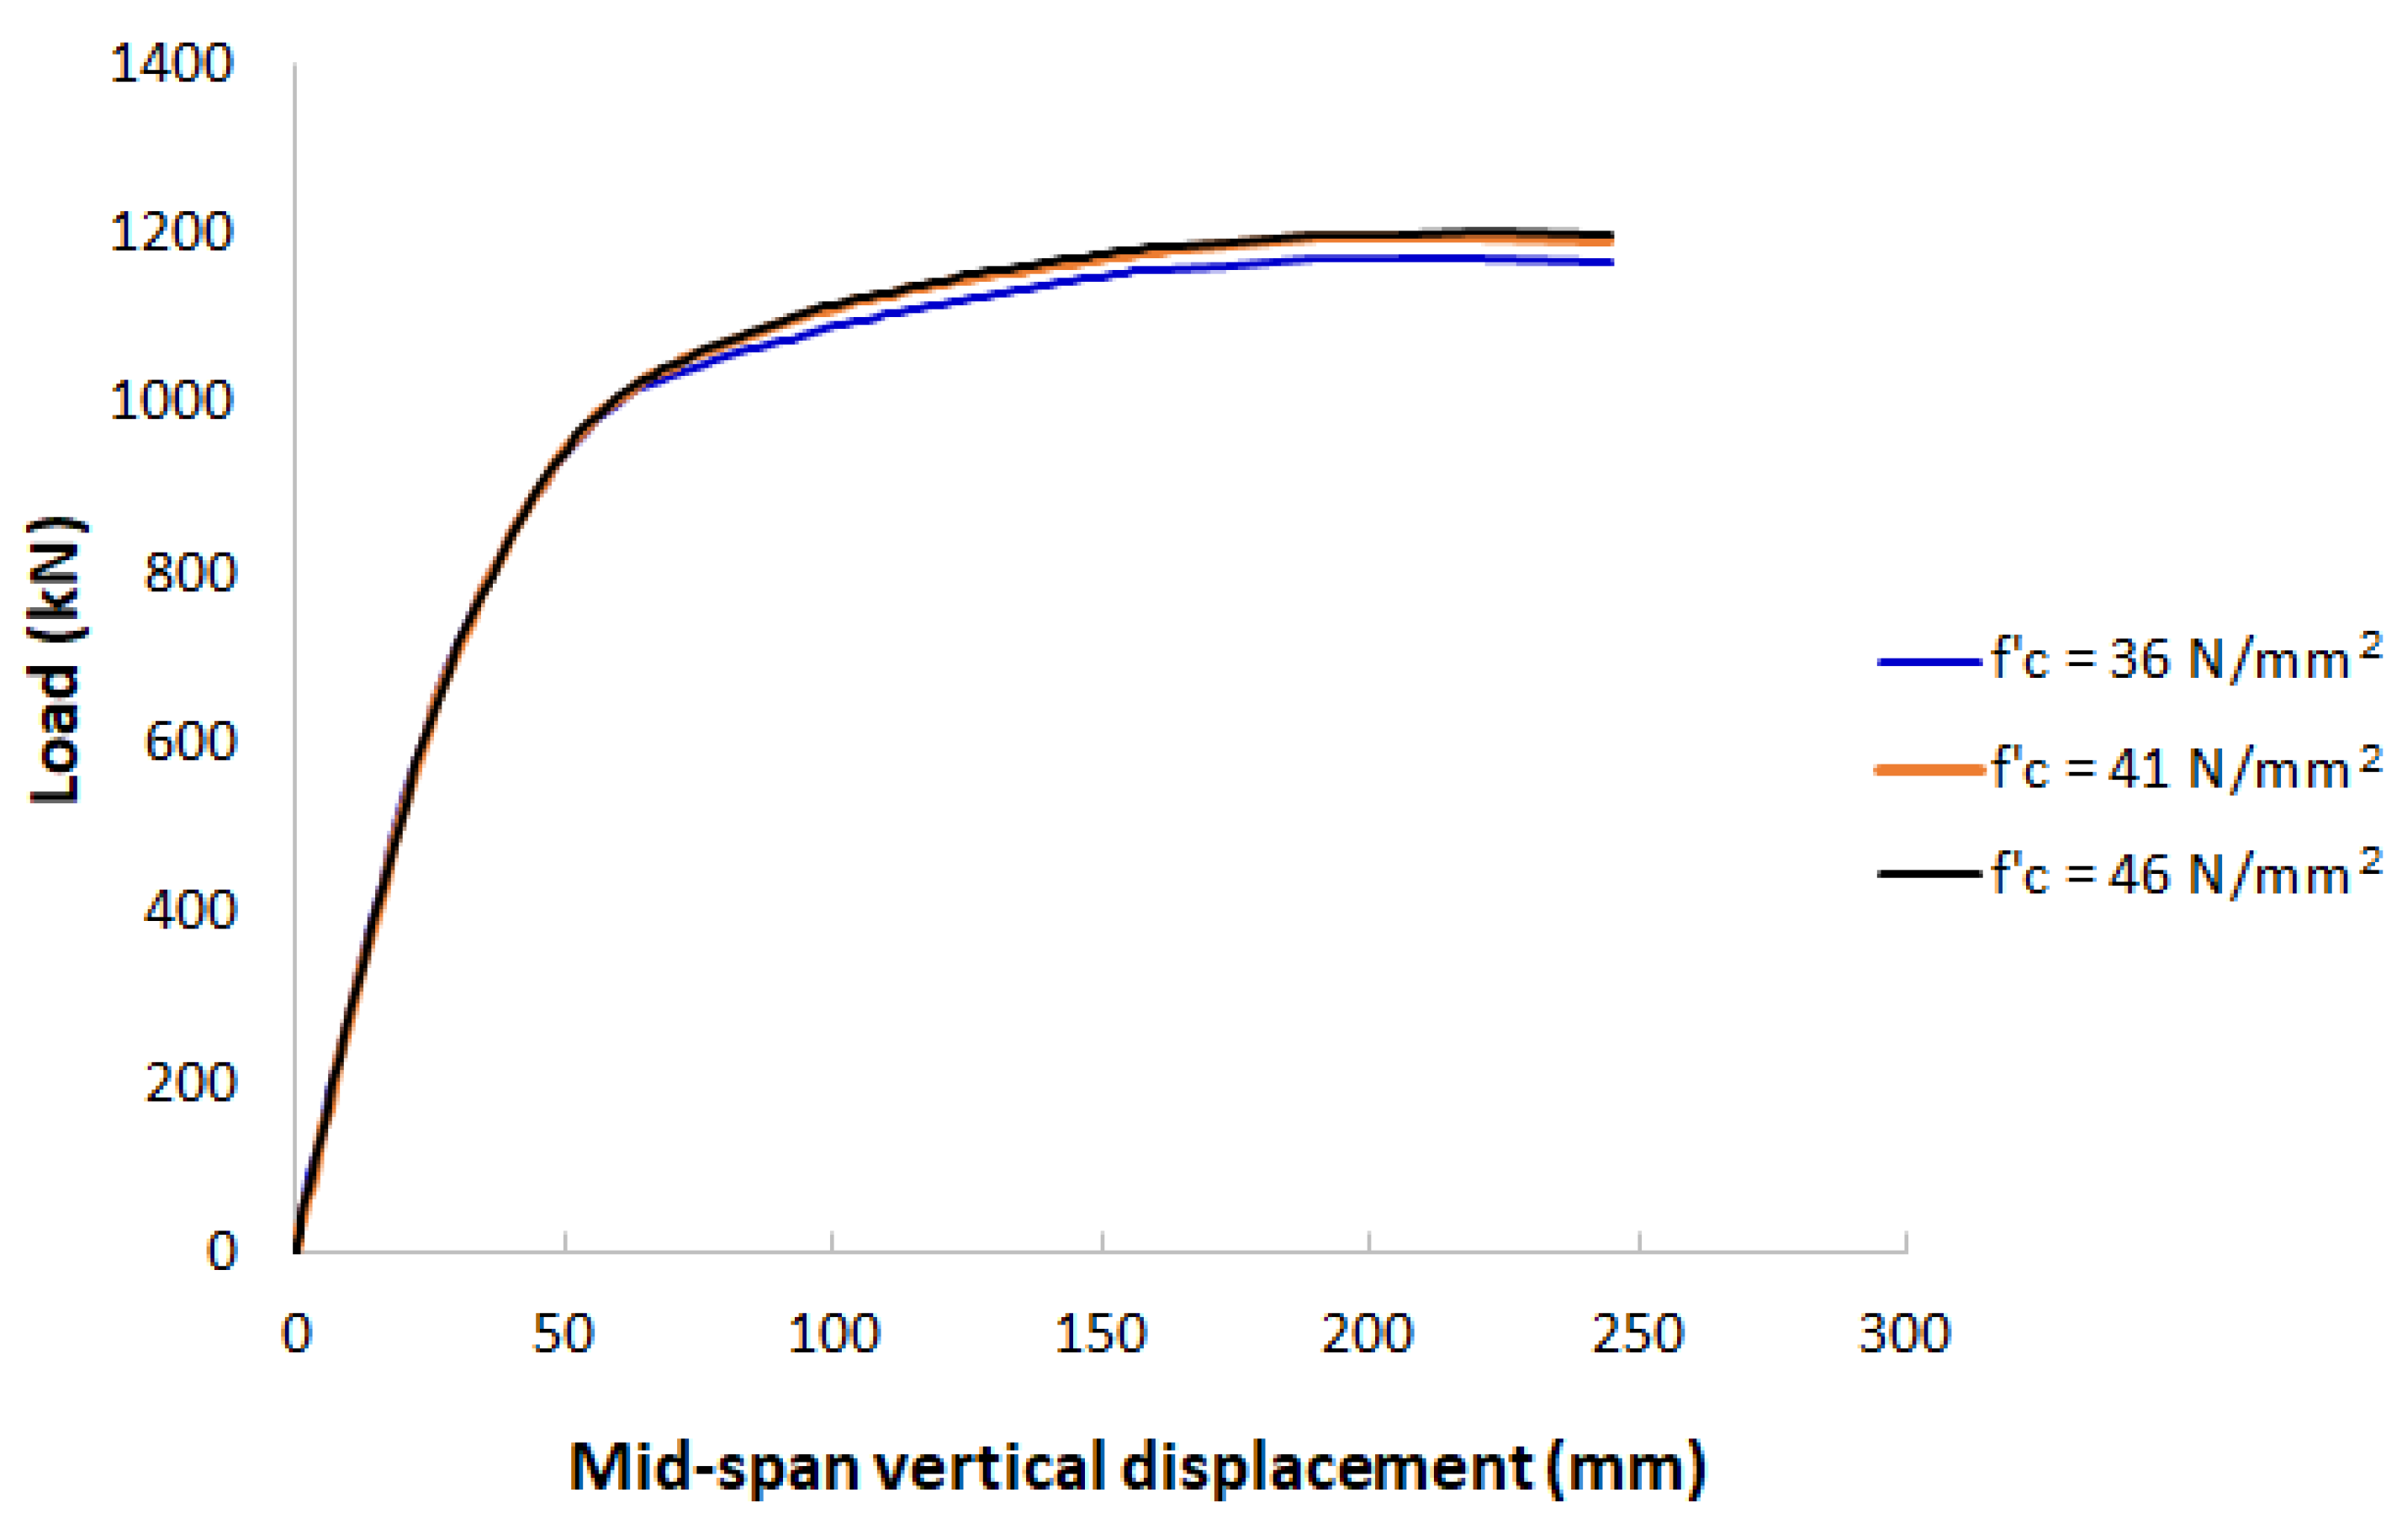
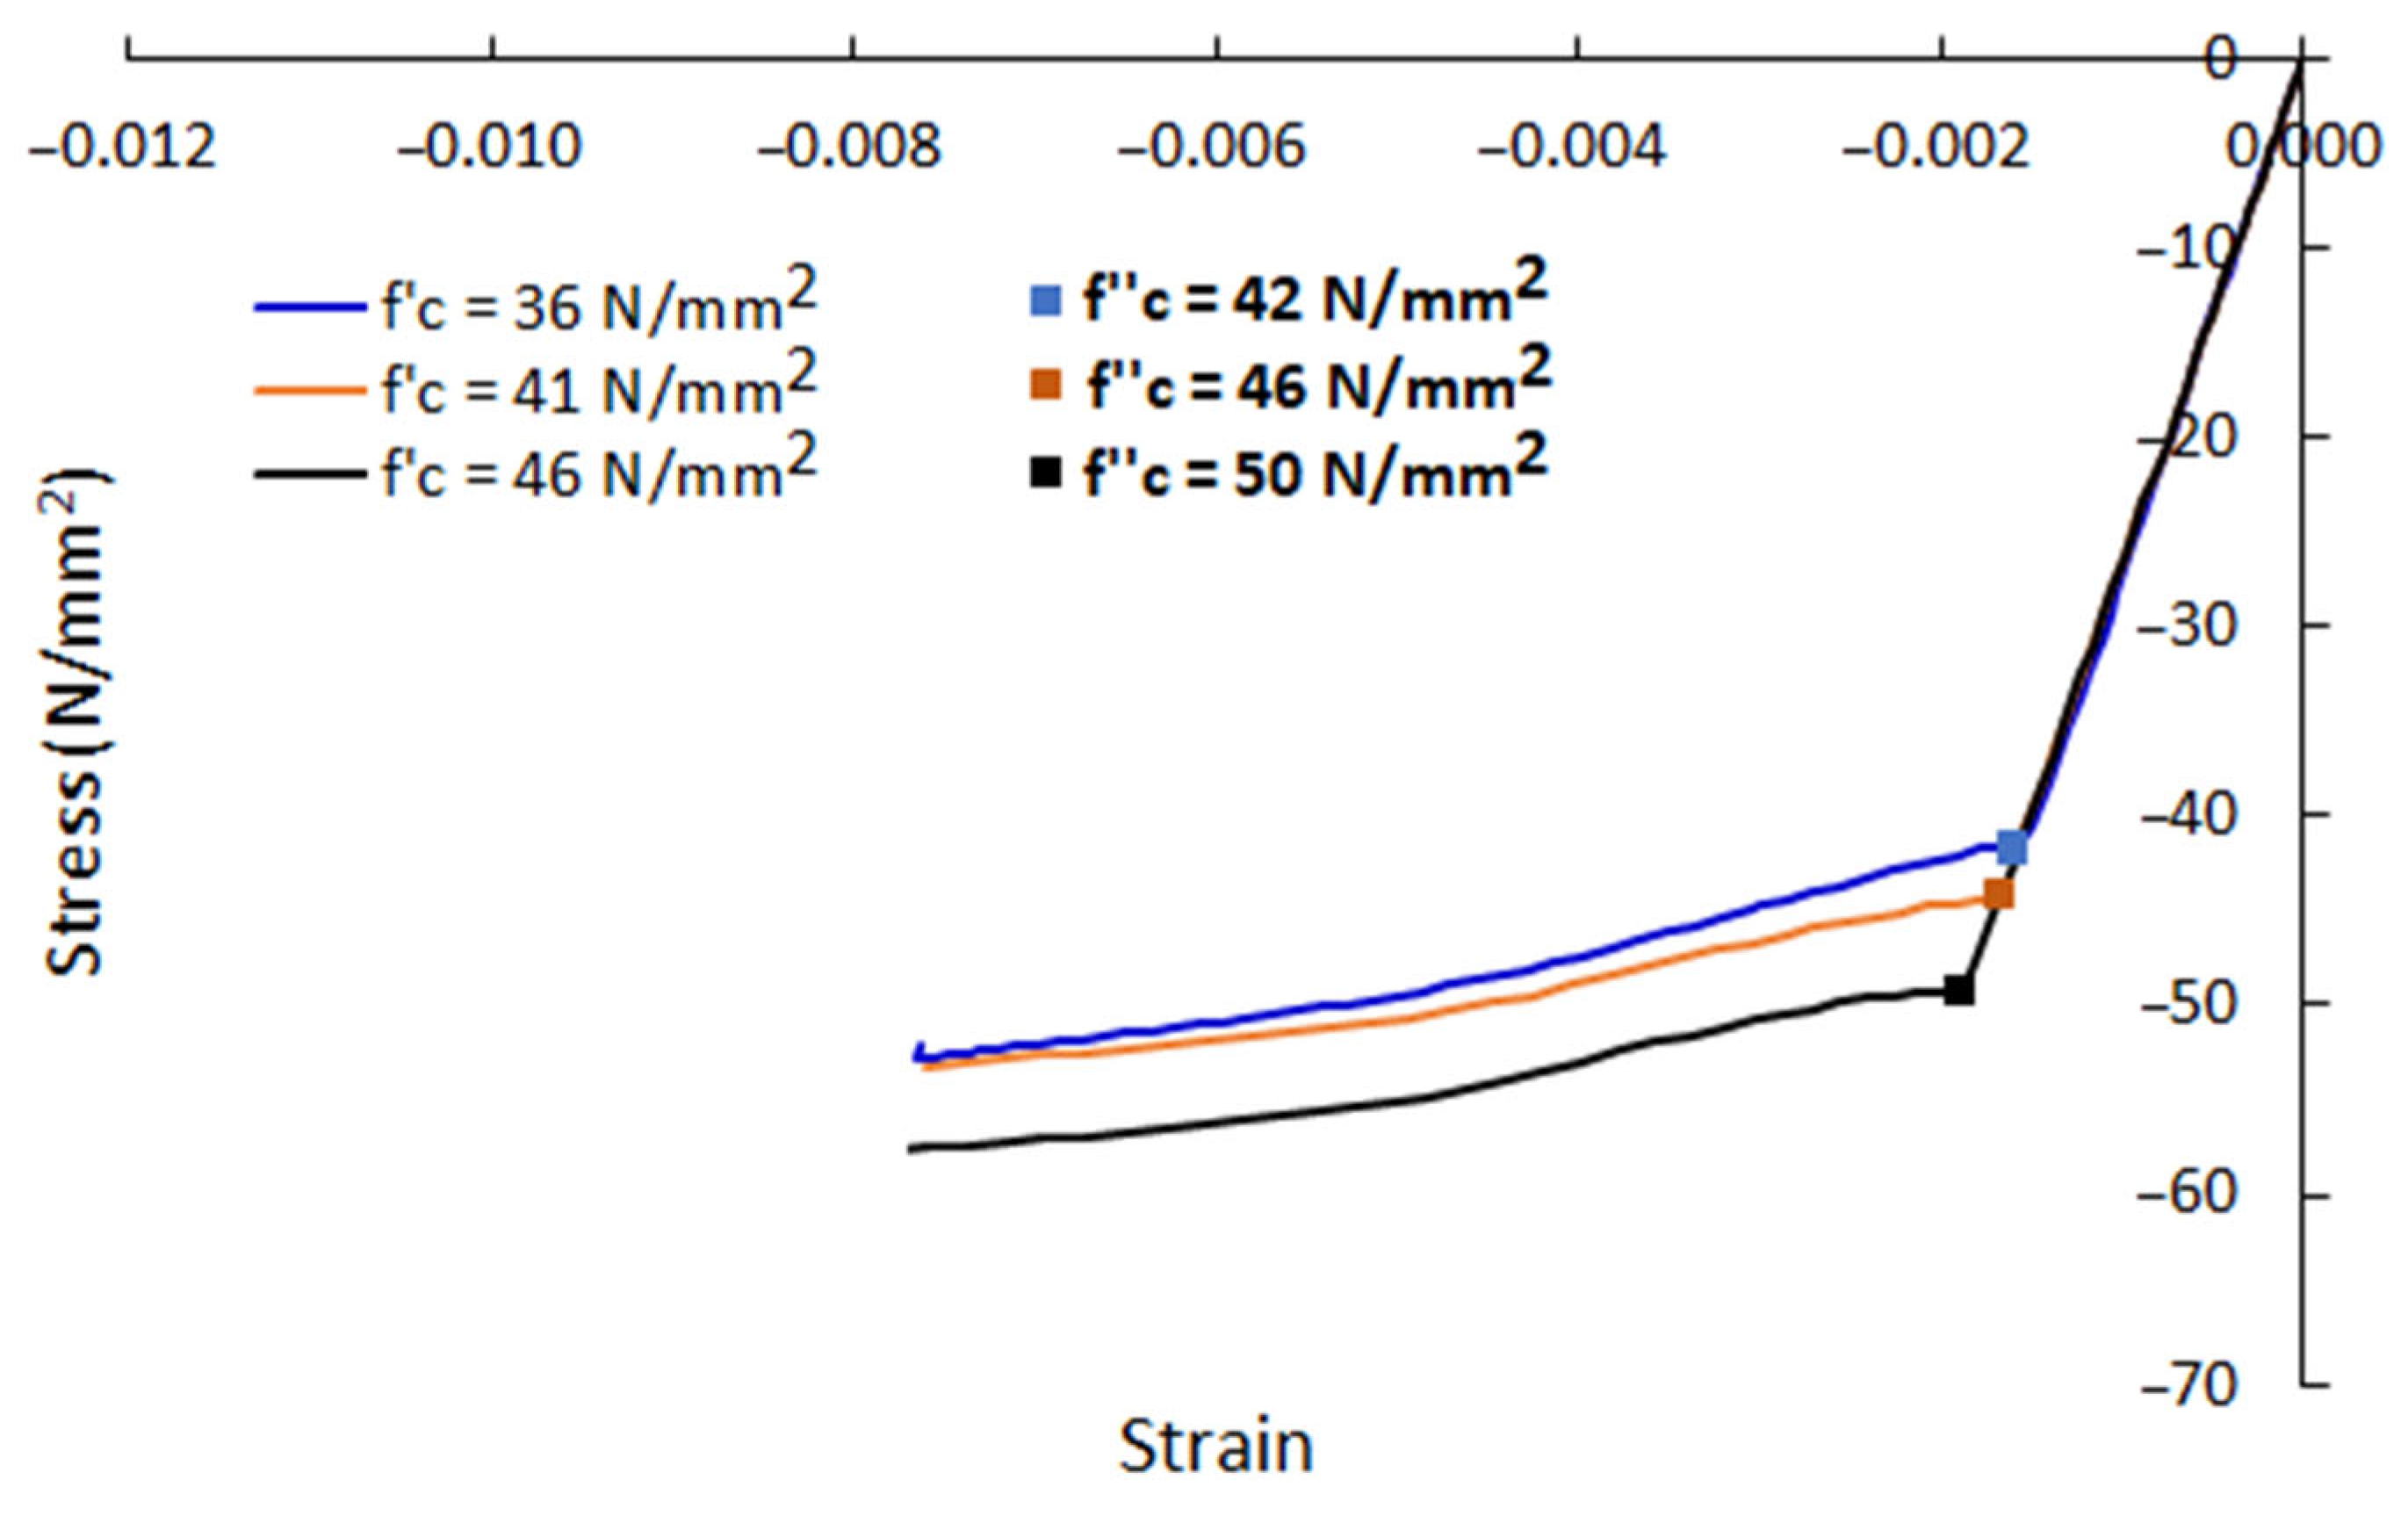
- Compressive strength: values of 41 N/mm2 and 46 N/mm2 were used for the compressive strength of concrete material in the FE models. The first value was for the concrete obtained from testing, and the second value was for confined concrete, proposed in [38], as presented in Appendix A. The two FE models, however, obtained similar results in terms of load-displacement relationship and maximum loads despite a small difference in their compressive strength values. It was because under the applied loads, the concrete filling was confined by the steel tube based on their frictional contact and structural configuration. This resulted in a significant increase in the compressive strength in the concrete filling after the yield point; it meant there was not crushing in the compressive region of concrete.
- (iii)
- Shear retention factor: in the literature on nonlinear Finite Element modelling of reinforced concrete structures, a range of values between 0.1 to 0.5 was suggested for the shear retention factor [42,43]; therefore, these values were investigated in this study. It was found that when values of shear retention factor were relatively small, they led to numerical instabilities in the Finite Element analysis; when values were from 0.2 to 0.5 the maximum load values differed to the experimental result from 1% to 3%, respectively. For these reasons, the typical value of 0.2 was used for the shear retention factor in this study.
- (iv)
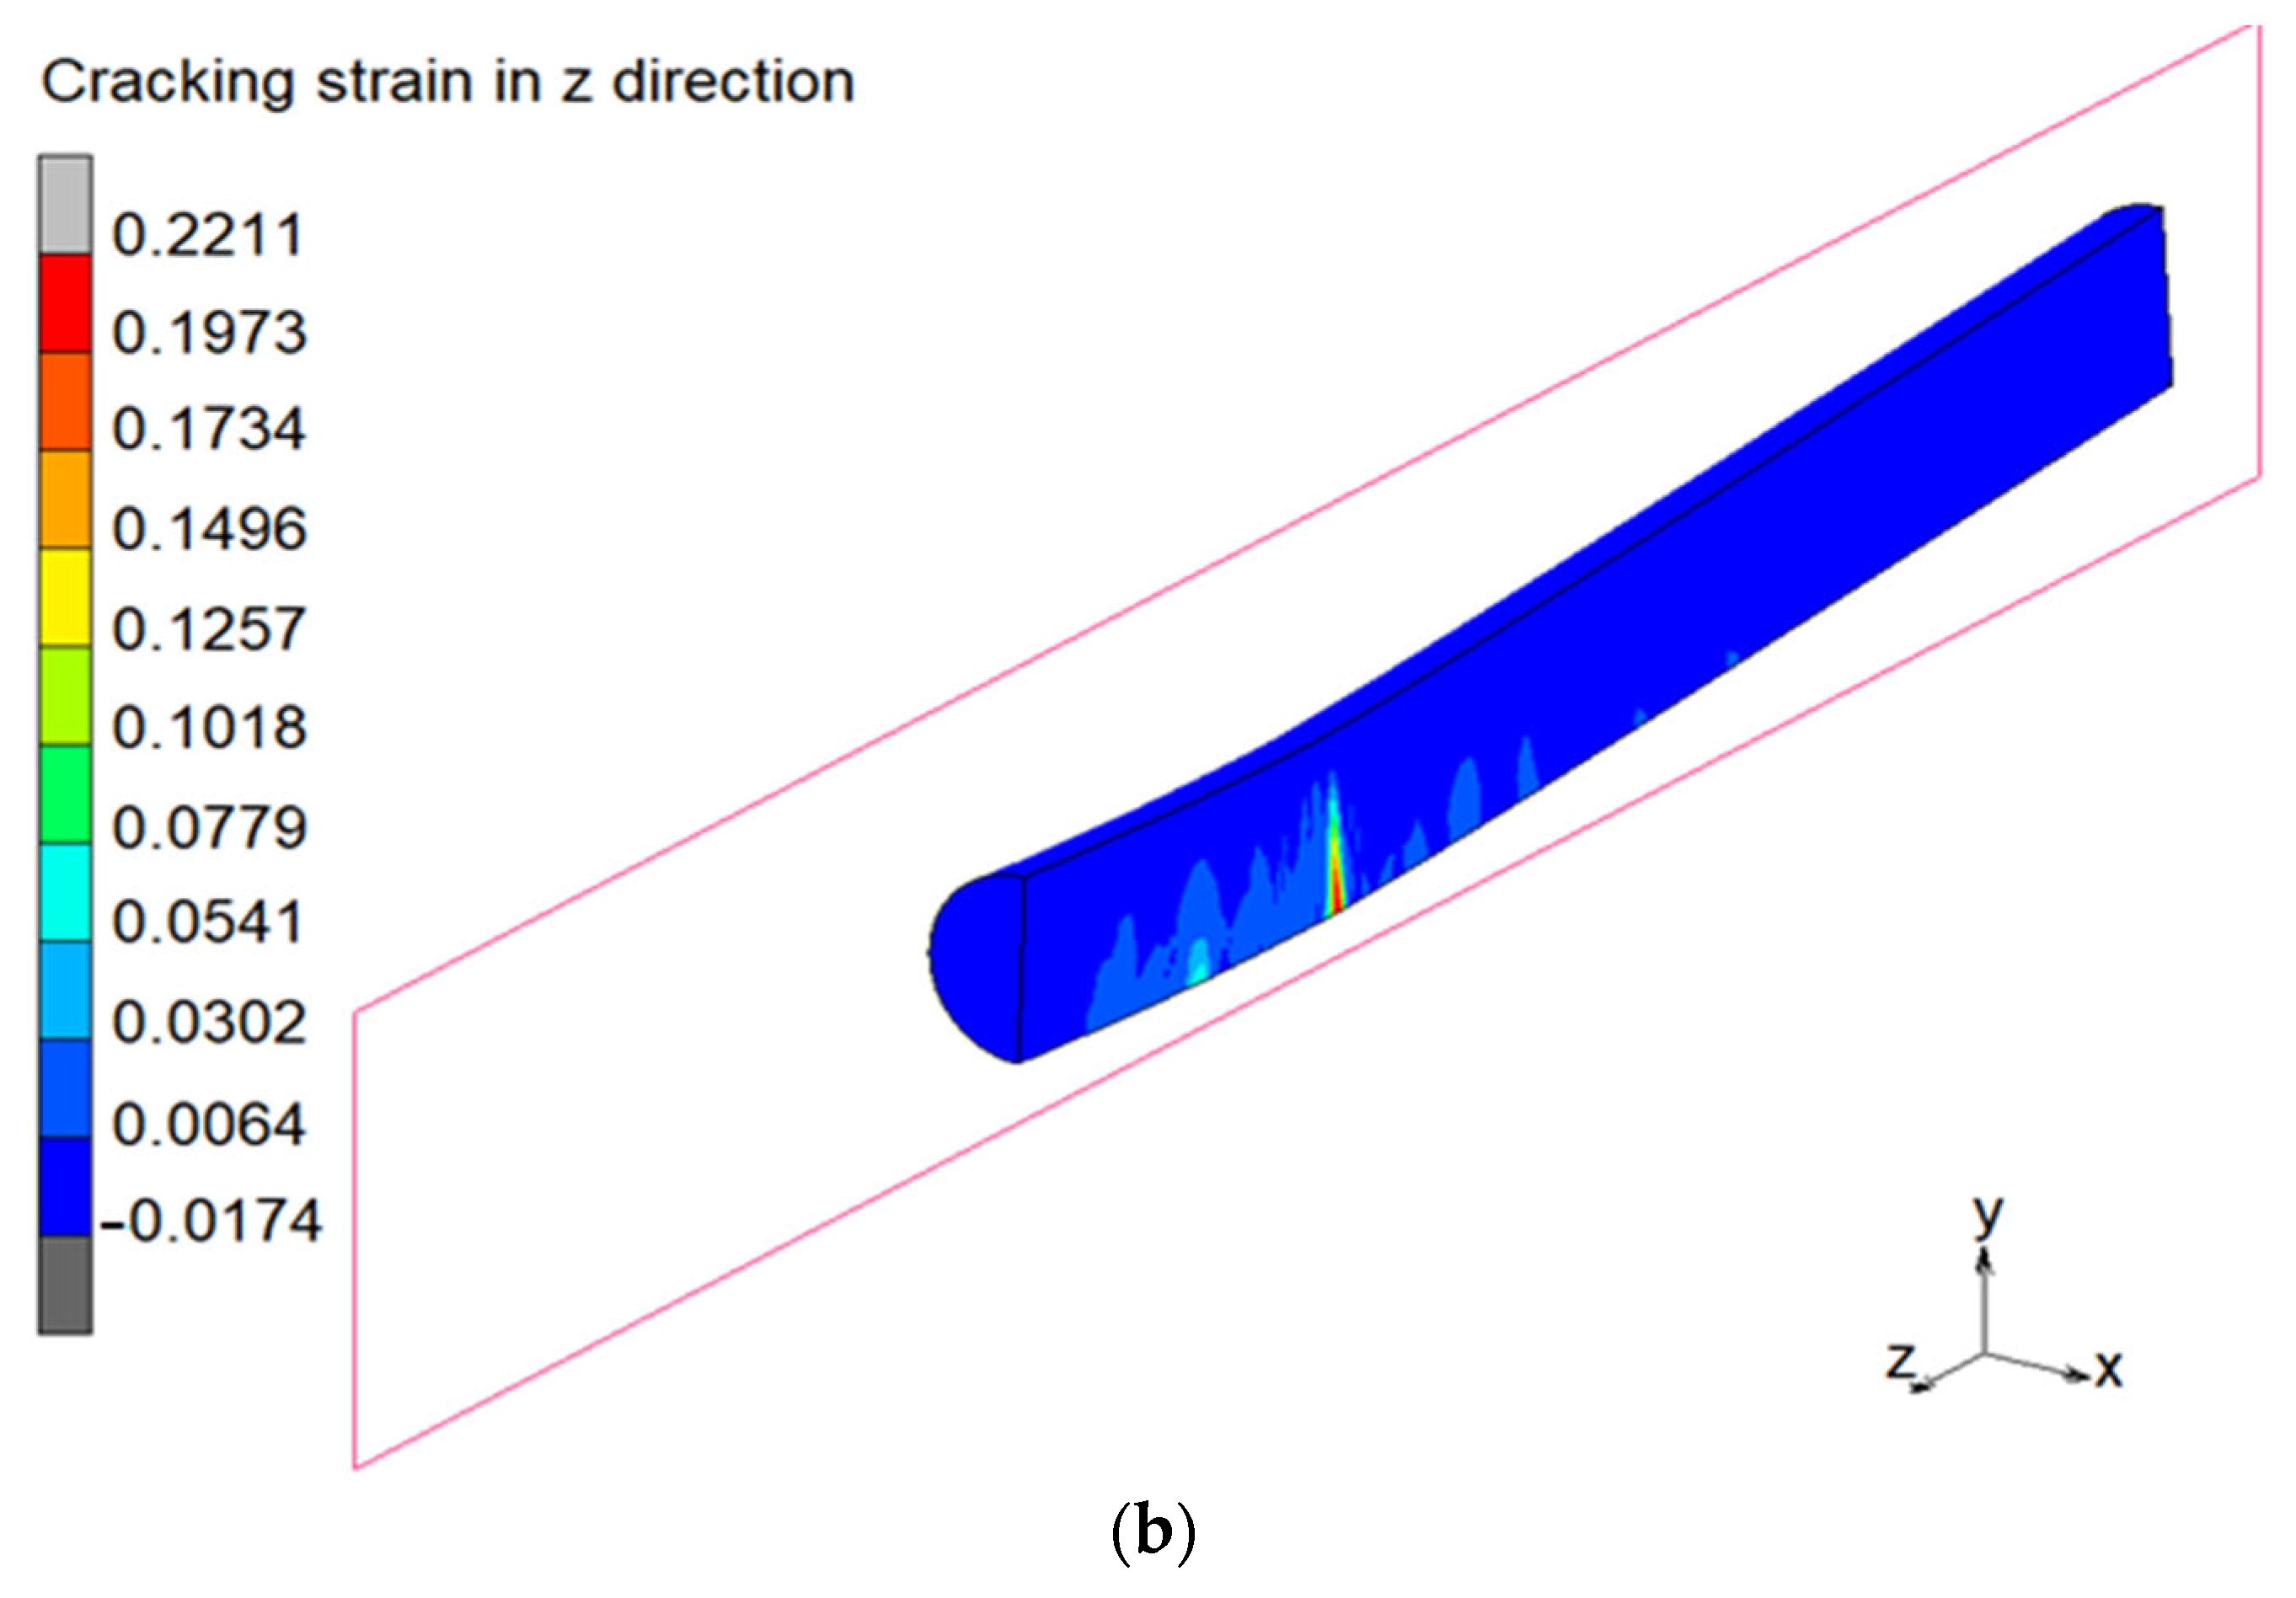
- Cracking strength: the values of cracking stress in the range of 5 to 10% of the compressive strength [38,41] which were of 2.5 to 4.6 N/mm2 were investigated. It was found that the maximum load values were greater than the experimental values from 1% to 3% for the cracking strength of 2.5 and 4.5 N/mm2, respectively. In this study, the value of cracking stress was taken as 2.5 N/mm2.
- (v)
- Tension softening modulus: The tension-softening modulus was assumed to be 5 to 10% of the modulus of elasticity. The investigation also included the case that the tension softening modulus was specified to zero for modelling concrete as a complete brittle material (the sudden cracking with a complete loss of the stiffness upon cracking). It was found that the maximum load values differed to the experimental result from −12% (when was zero) to 2% (when was 10% of the modulus of elasticity). In this study, the tension softening modulus was assumed to be 1930 N/mm2 which had a maximum difference of less than 1% to the experimental value.
- (vi)
- Loading step: an initial fraction of loading time of 0.001 s and a maximum fraction of loading time of 0.005 s were used for the solution to be stable and reliable. The time step was selected through a trial-and-error procedure by continuously reducing the time step until similar results were obtained. In particular, the first analysis started with a maximum time step of 0.02 s and then it reduced time step to a smaller one until a time step of 0.001 s. The amount of time step in one reduction varied from 0.0005 s up to 0.05 s was selected from comparing the result of the second analysis to the first analysis’s. The compared results were the slopes of load-displacement curves and the ultimate forces in the bending simulations of the PCFST specimen. The maximum difference in the slopes and in the ultimate forces was set up within 5%. It was found that converged results were observed when time step was small enough, and similar results were obtained for the analysis with a time step of 0.001 s and 0.002 s. In this study, a maximum time step of 0.001 s was selected for accuracy reasons. It should be noted that this time step was selected in association with a reasonable finite element mesh (refer to 3(i)), an implicit analysis type with a full iteration method (refer to 3(viii)), and a strict convergence tolerance (force tolerance of 0.01 and displacement tolerance of 0.01, refer to 3(vii)). The convergence and consistency of the numerical results seem to justify such time step. Excellent agreements when comparing with experimental results from the bending test further validated this time step selection.
- (vii)
- Analysis tolerance: a relative force tolerance of 0.01 and a relative displacement tolerance of 0.01 were used for the solution to be reliable.
- (viii)
- Analysis type: an implicit, static analysis was employed. A full Newton-Raphson method was used for the iterative procedure.
4. Parametric Study
4.1. The Tube Diameter-to-Thickness Ratio D/t
4.2. The Concrete Filling Length-to-Total Length Ratio Lf/L
4.3. The Compressive Strength of Concrete f’c
4.4. The Steel’s Yield Stress σy and Tensile Strength σt
5. Result and Discussion
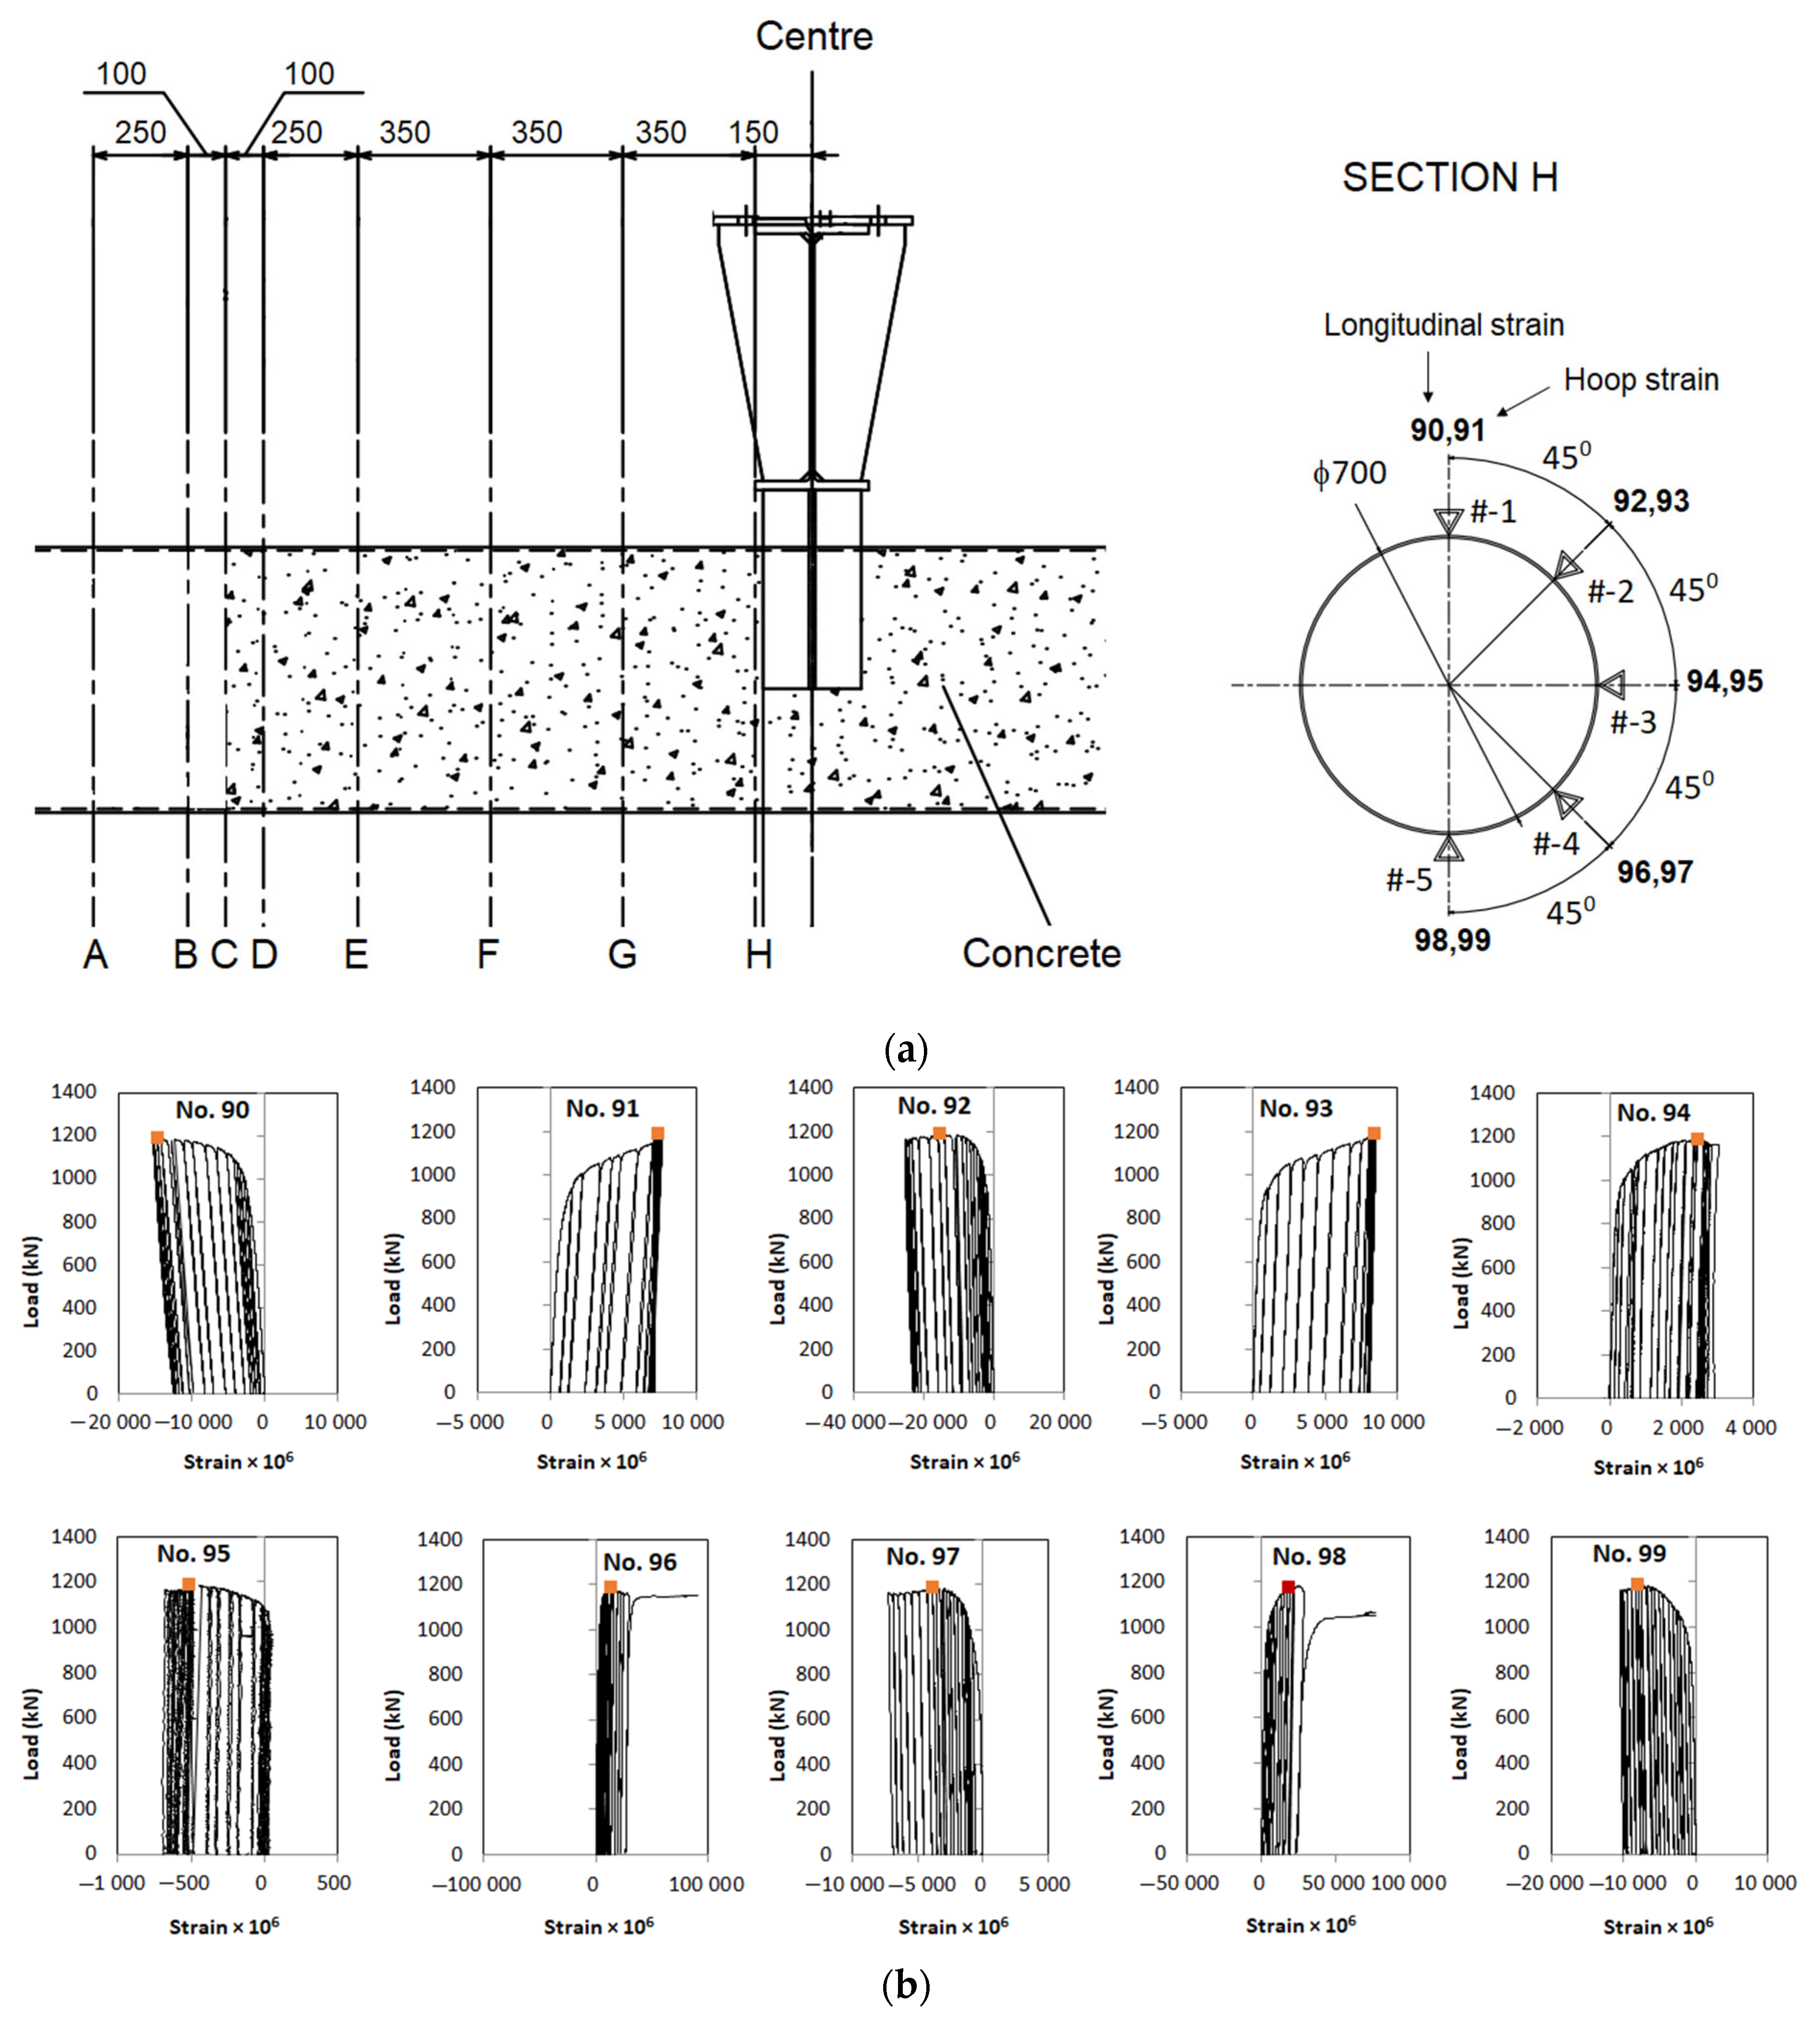
5.1. Experimental Results
5.2. Finite Element Modelling Results and Validation
5.3. Parametric Study Results
5.3.1. Effects of the Tube Diameter-to-Thickness Ratio D/t
5.3.2. Effects of the Concrete Filling Length-to-Total Length Ratio Lf/L and the Optimal Length
5.3.3. Effects of the Concrete Compressive Strength
5.3.4. Effects of the Steel’s Yield Stress σy and Tensile Strength σt
5.3.5. The Confined Strength of Concrete
6. Conclusions
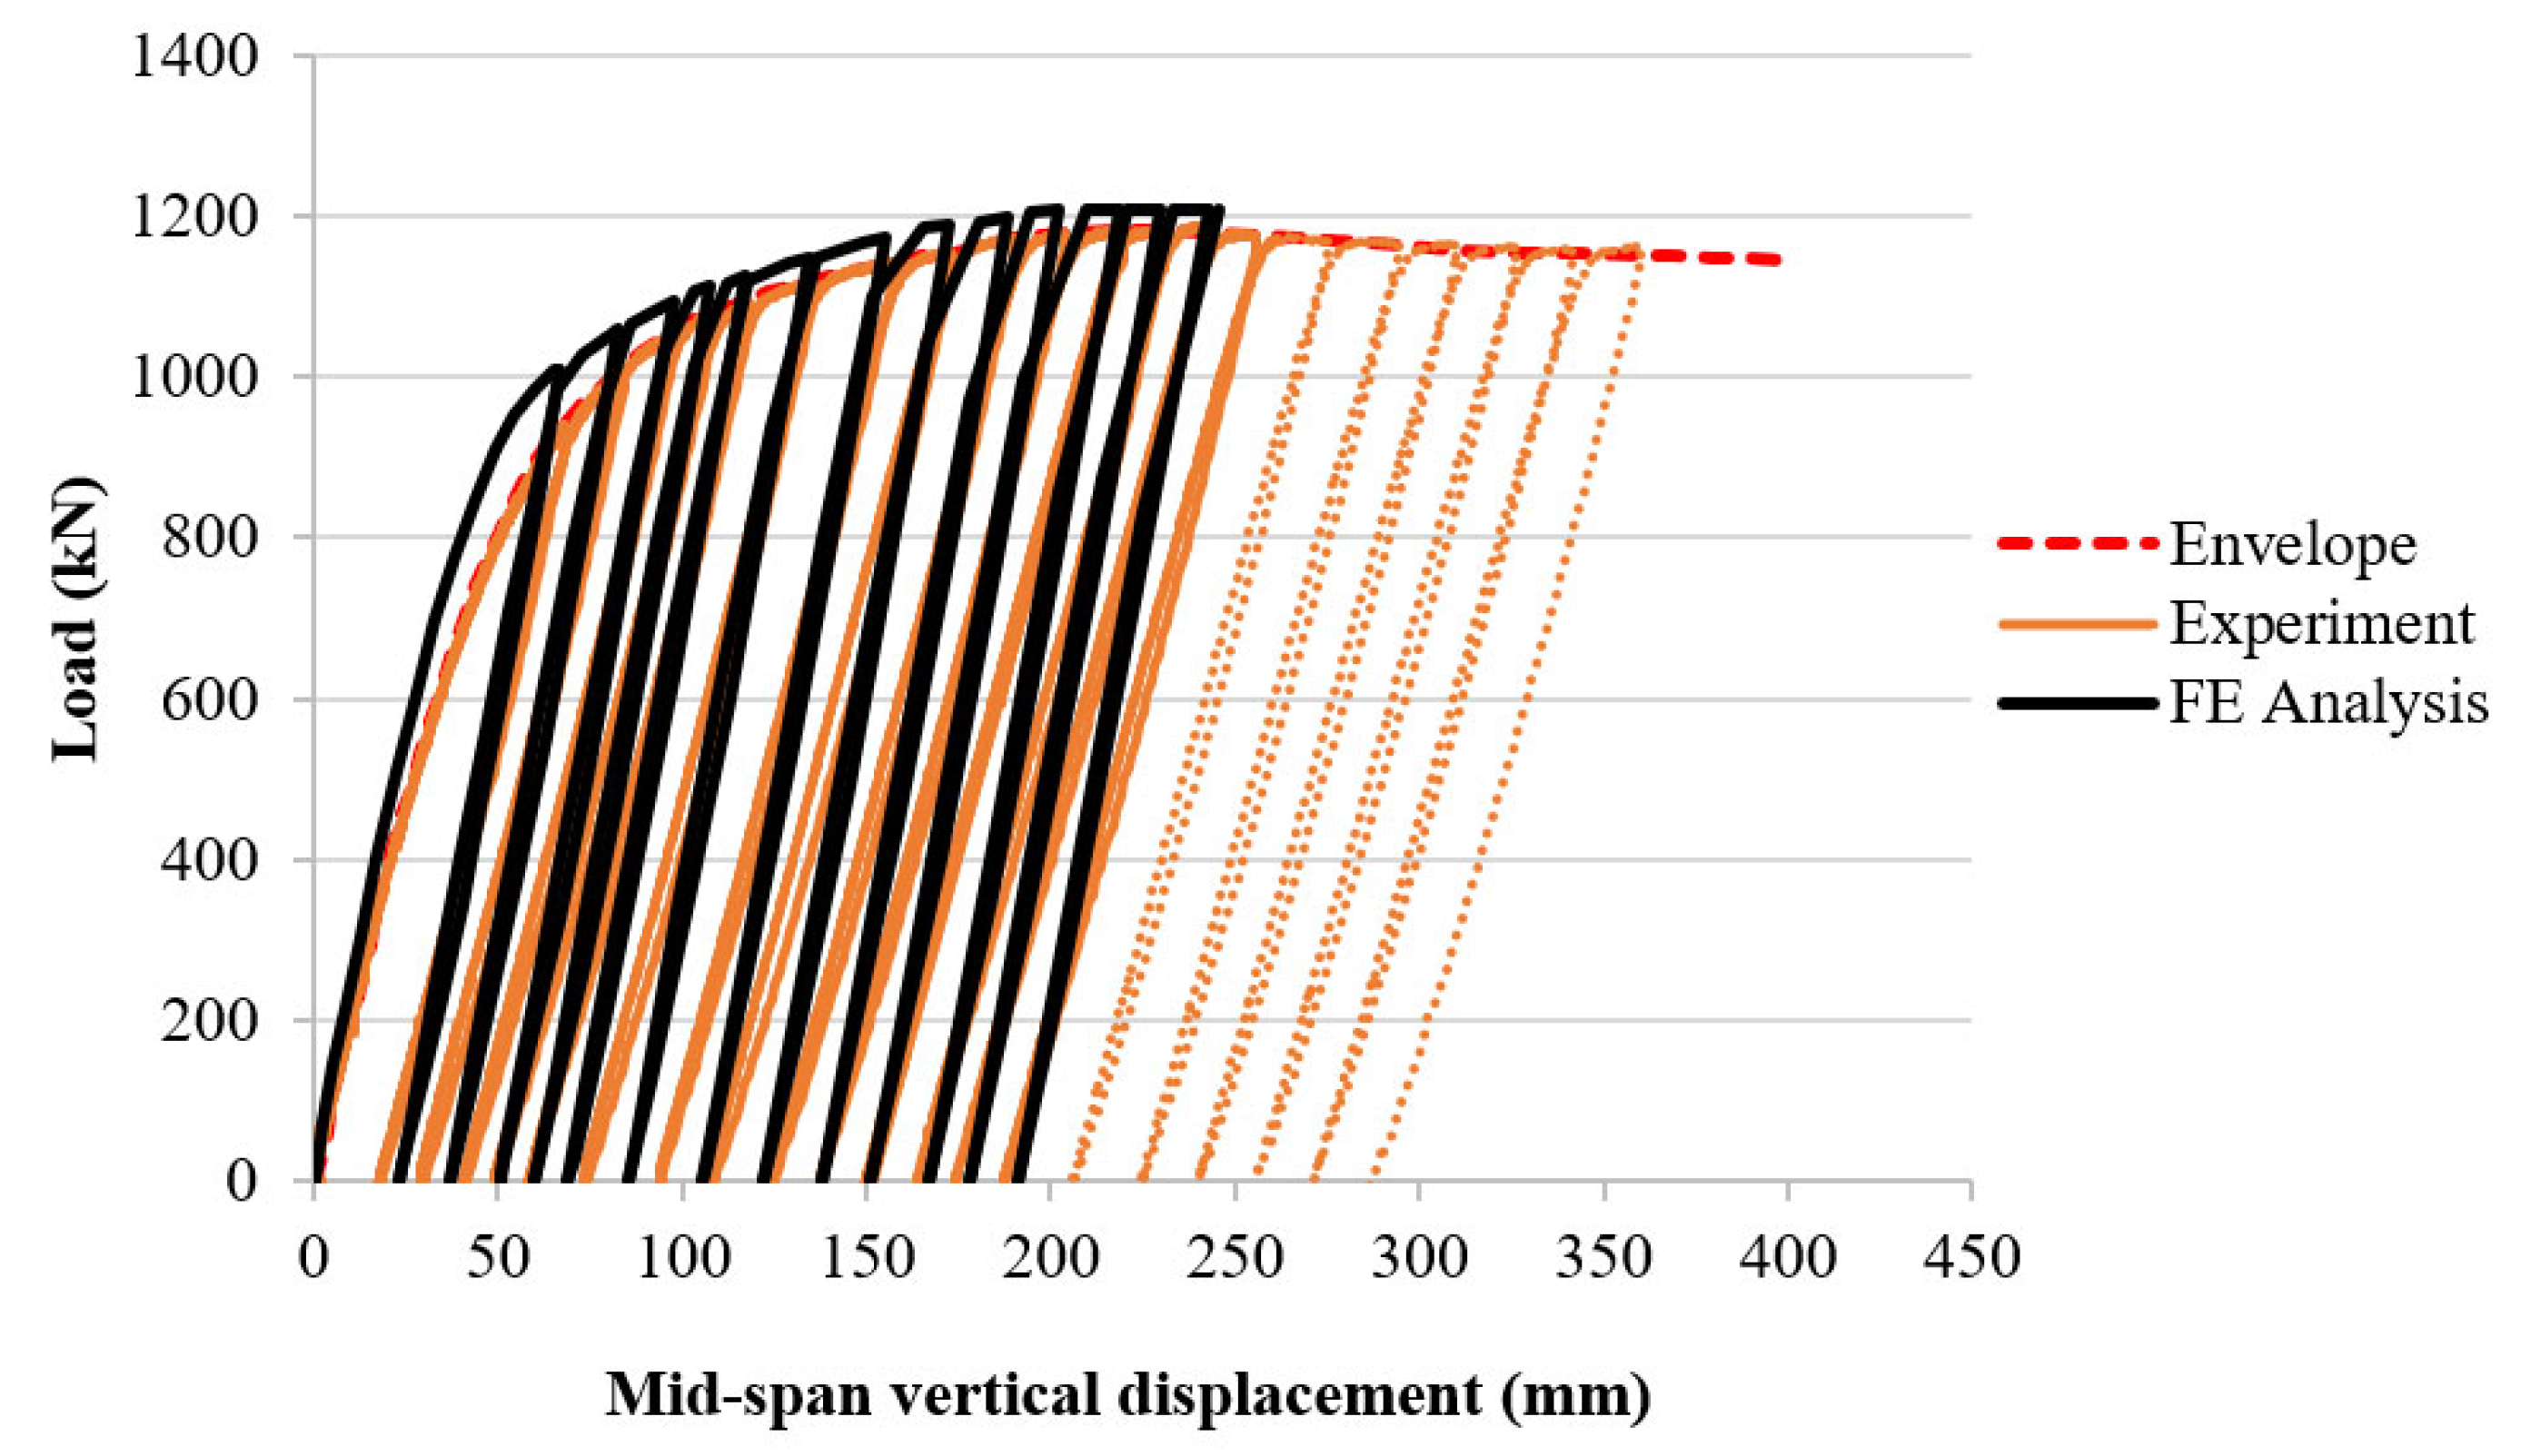
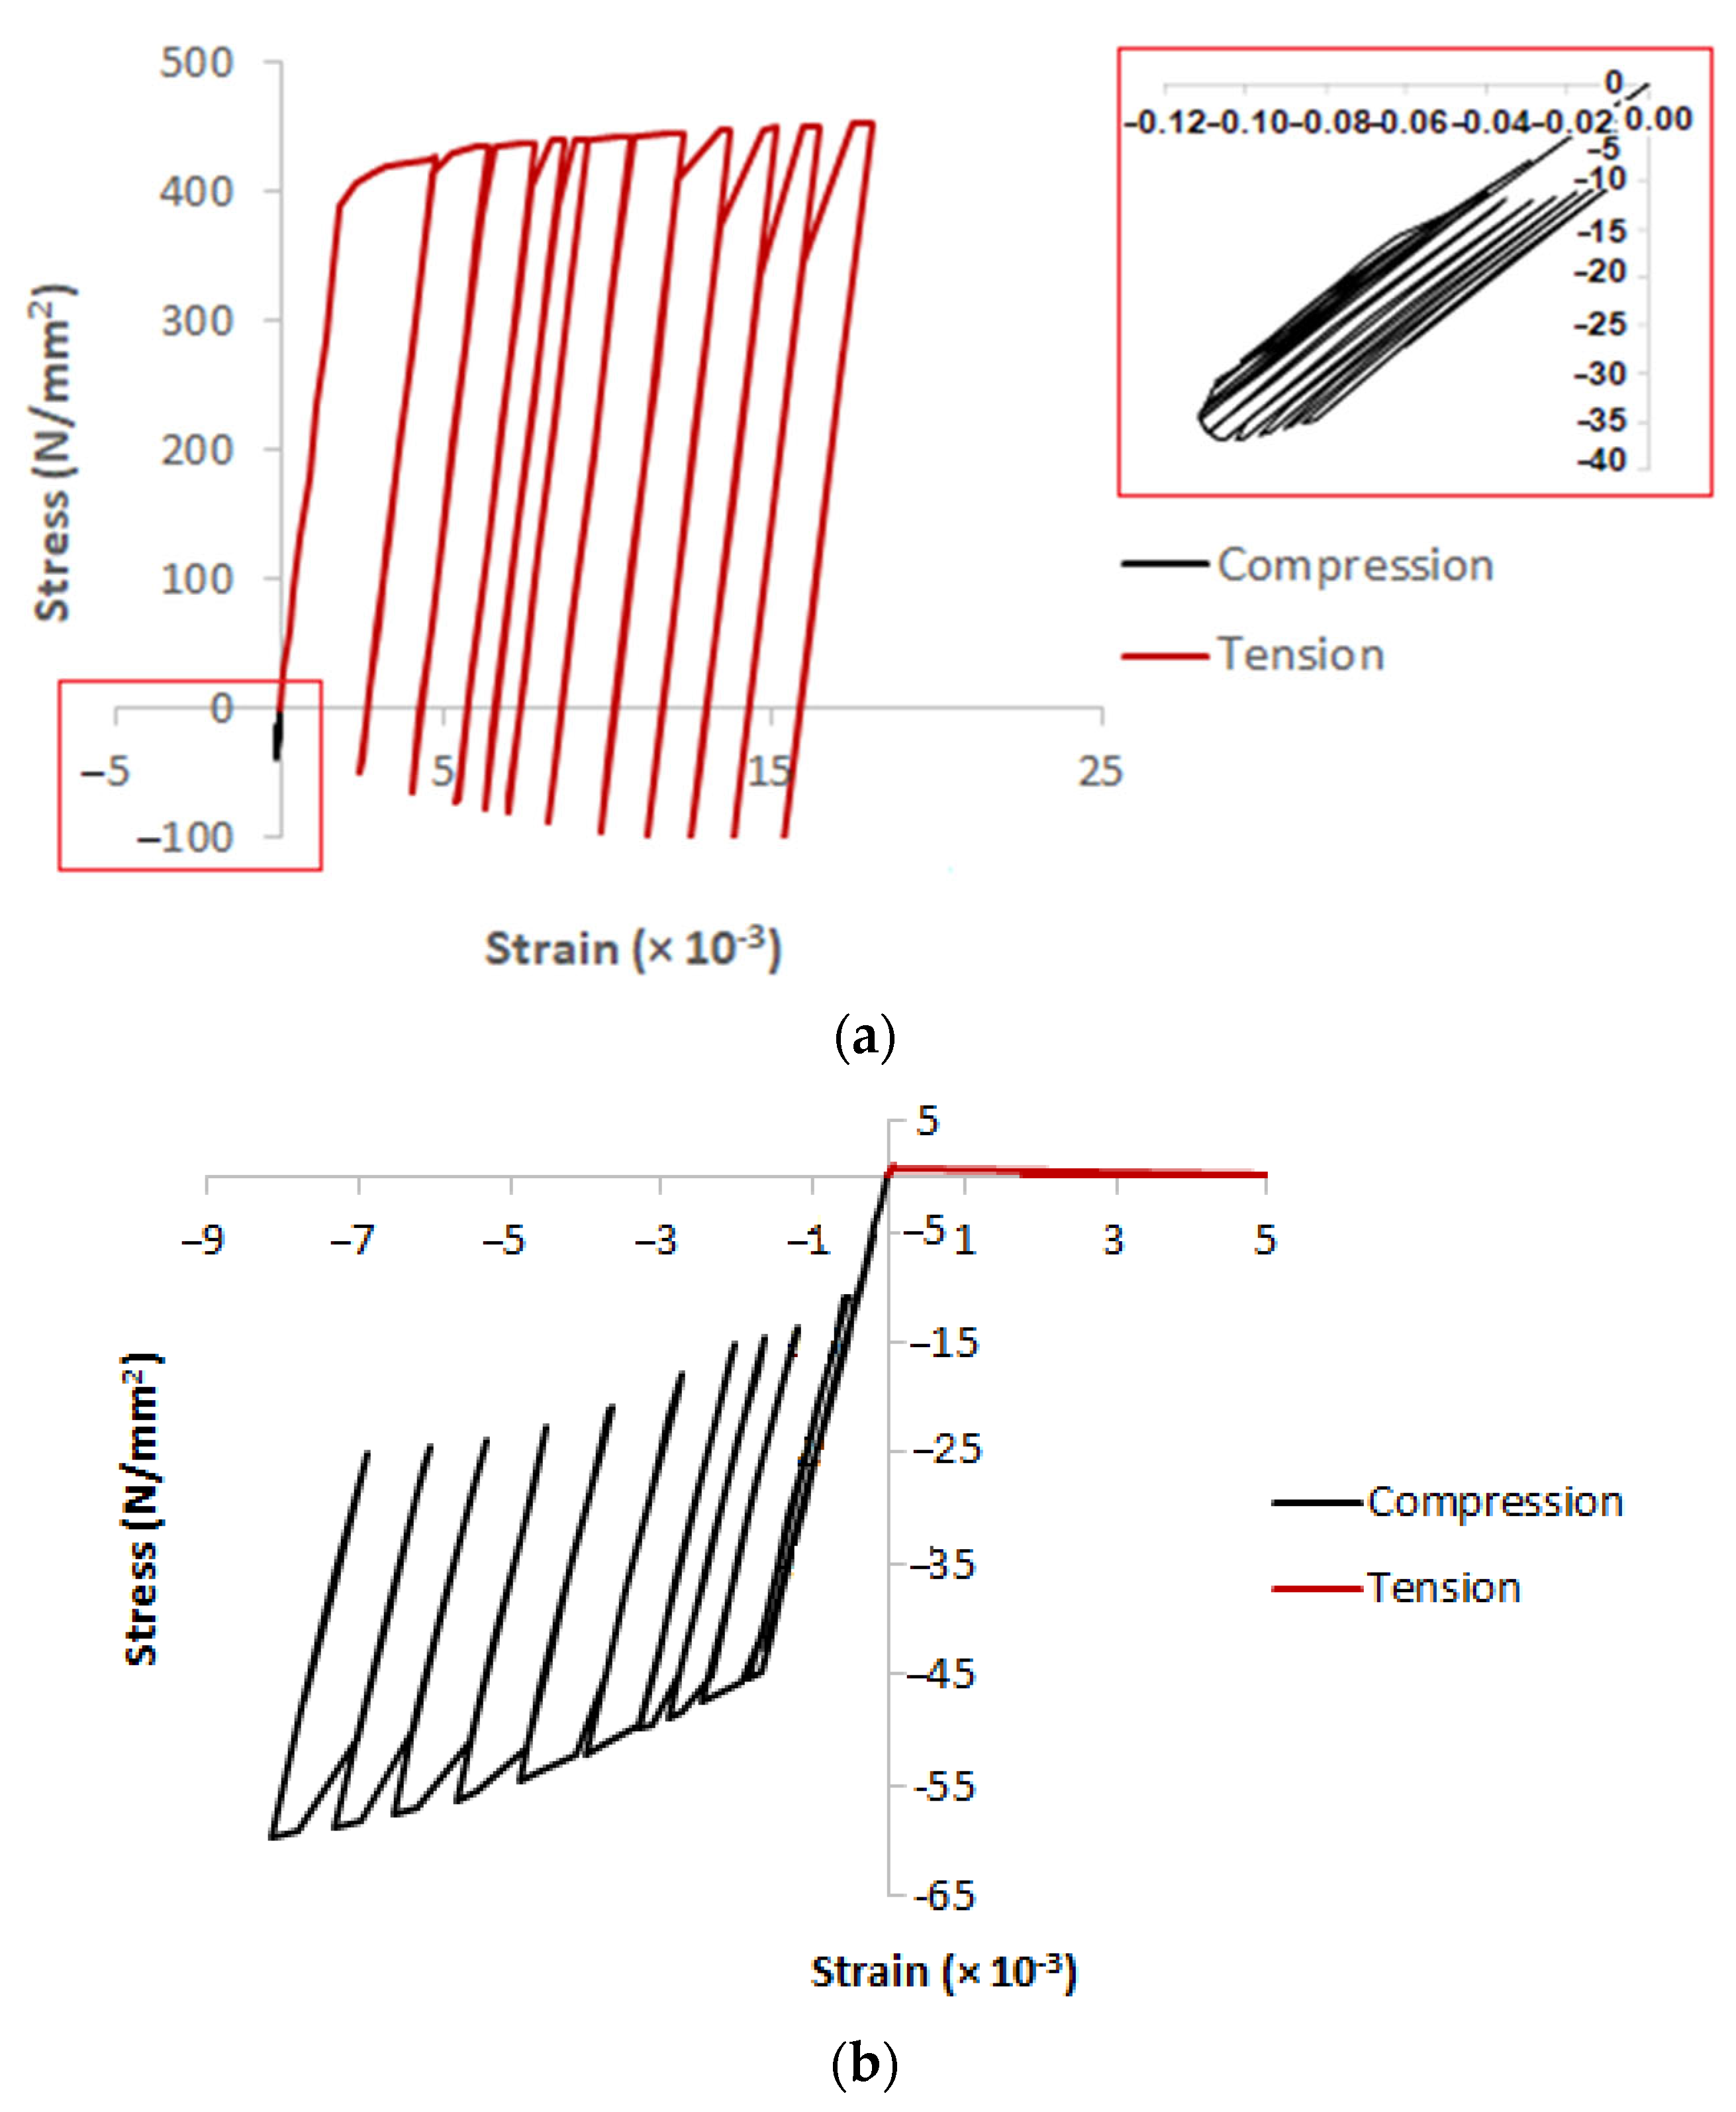
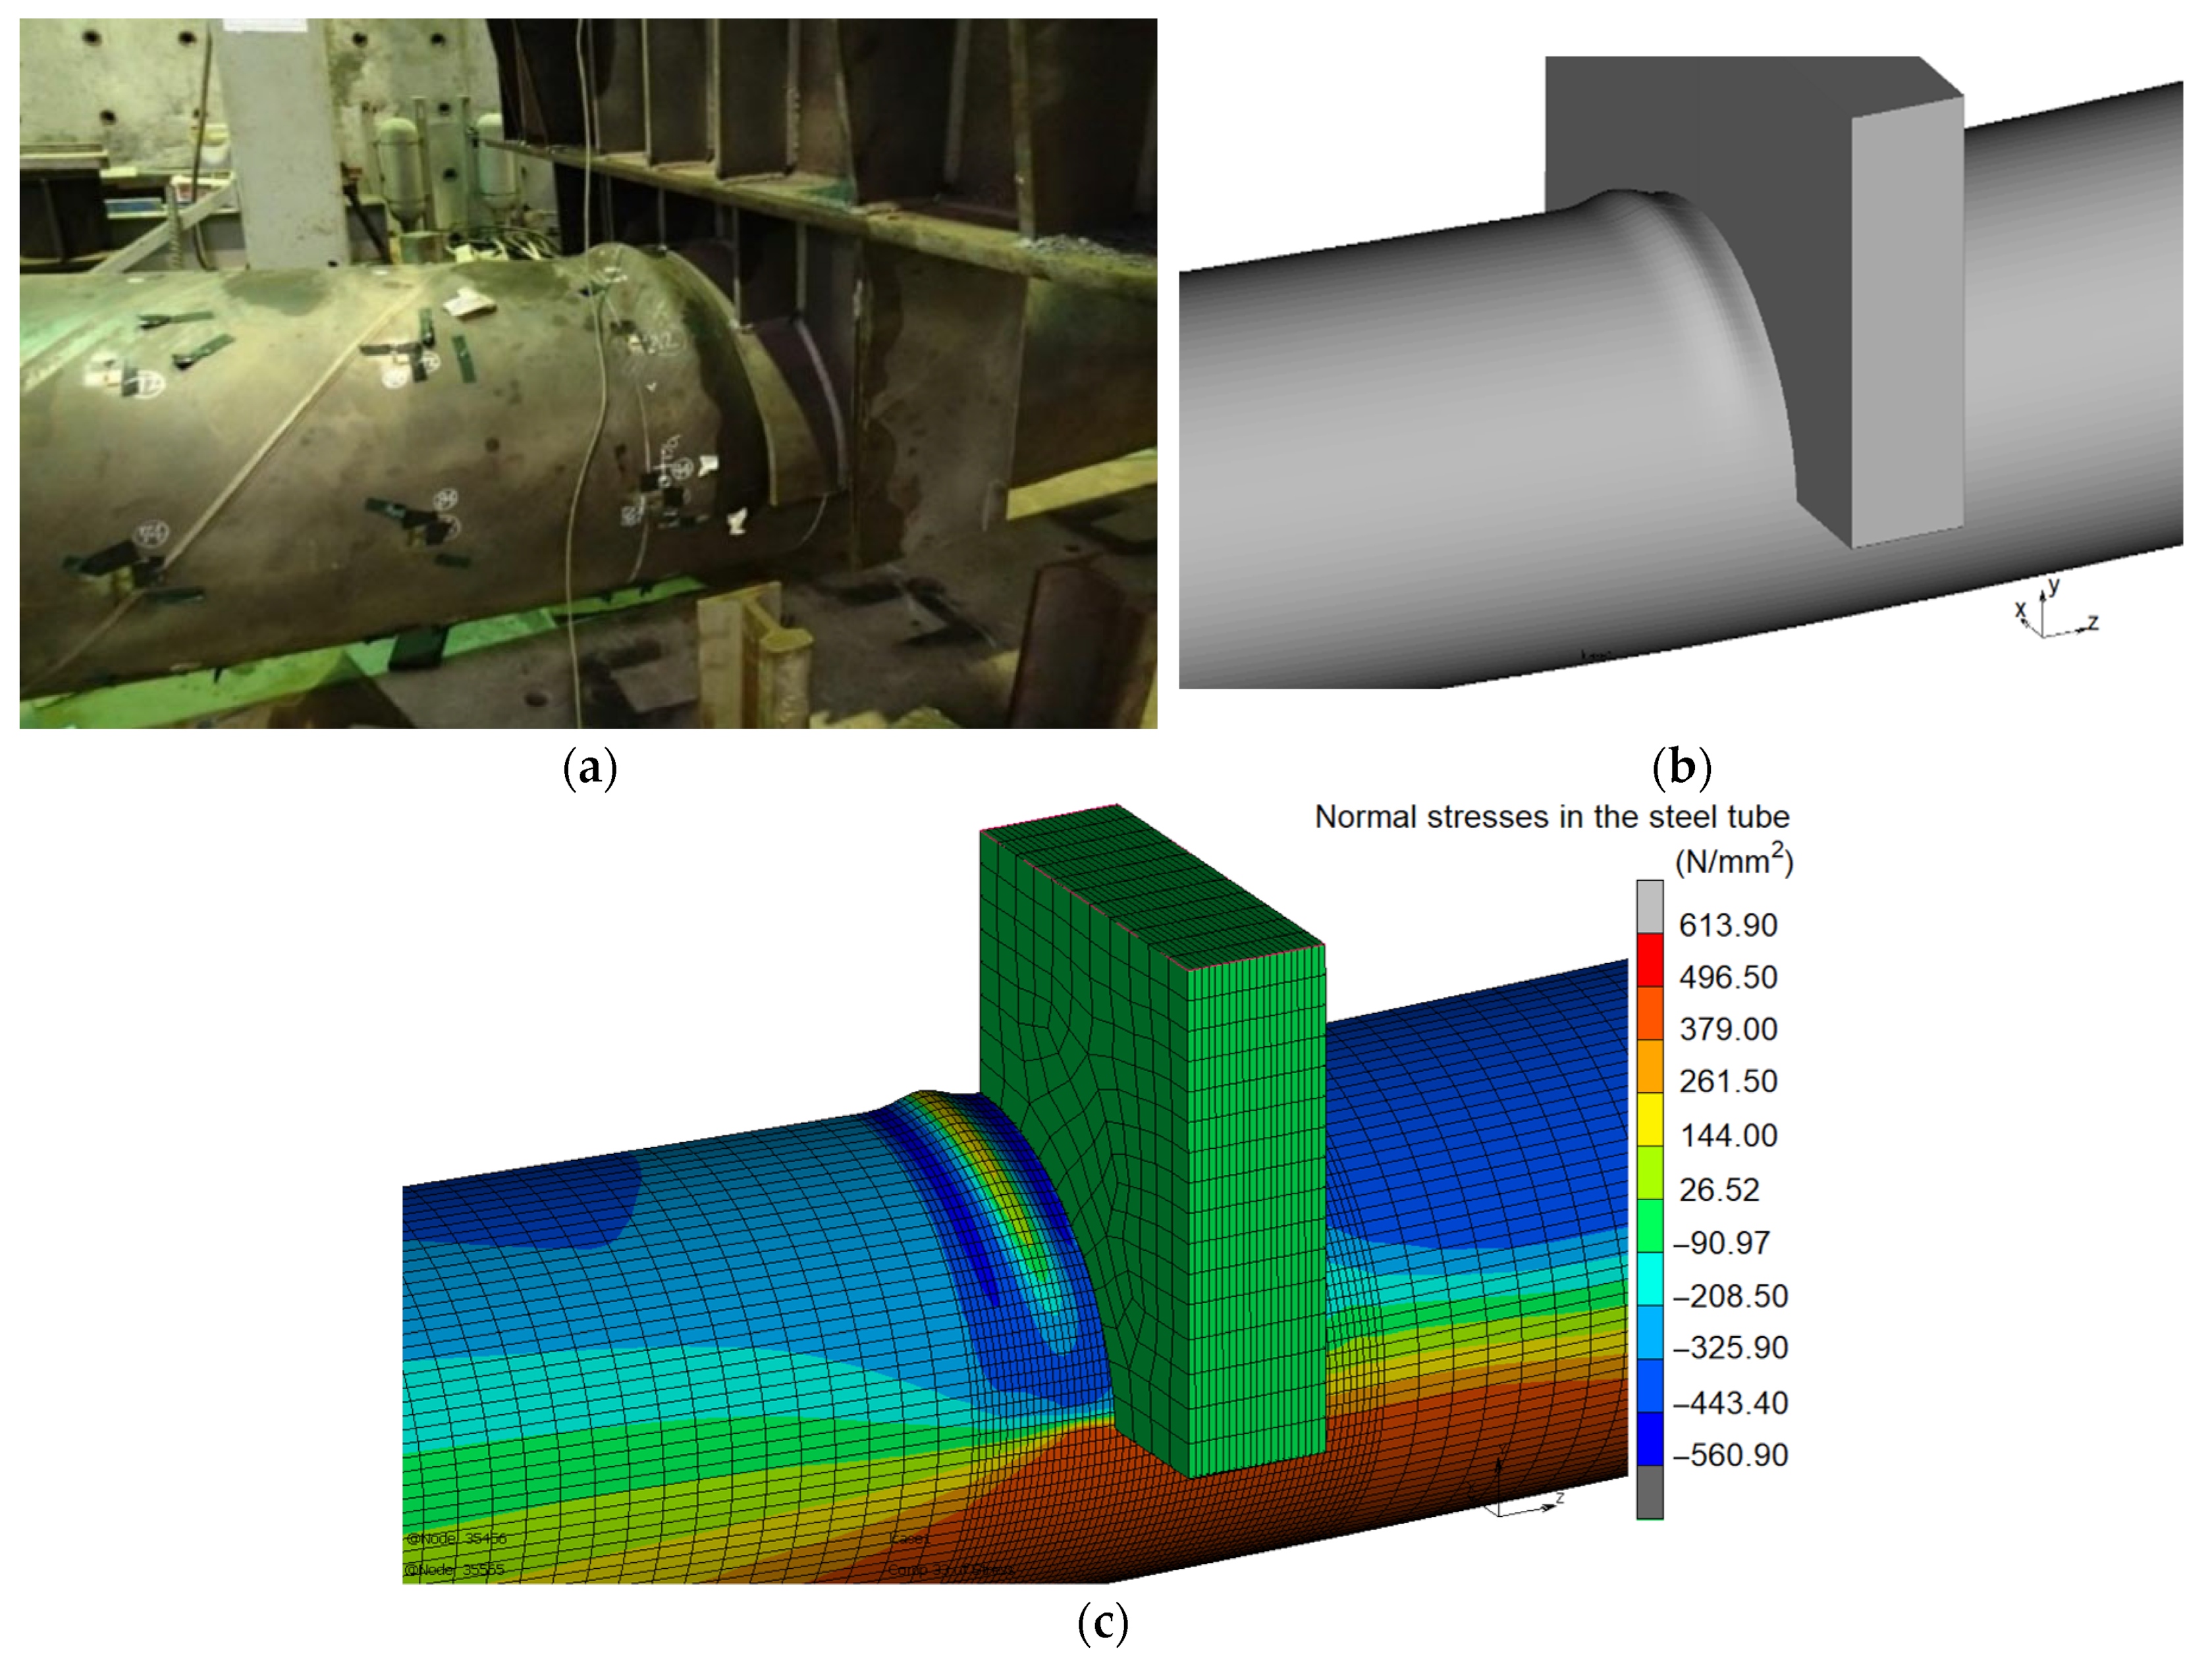
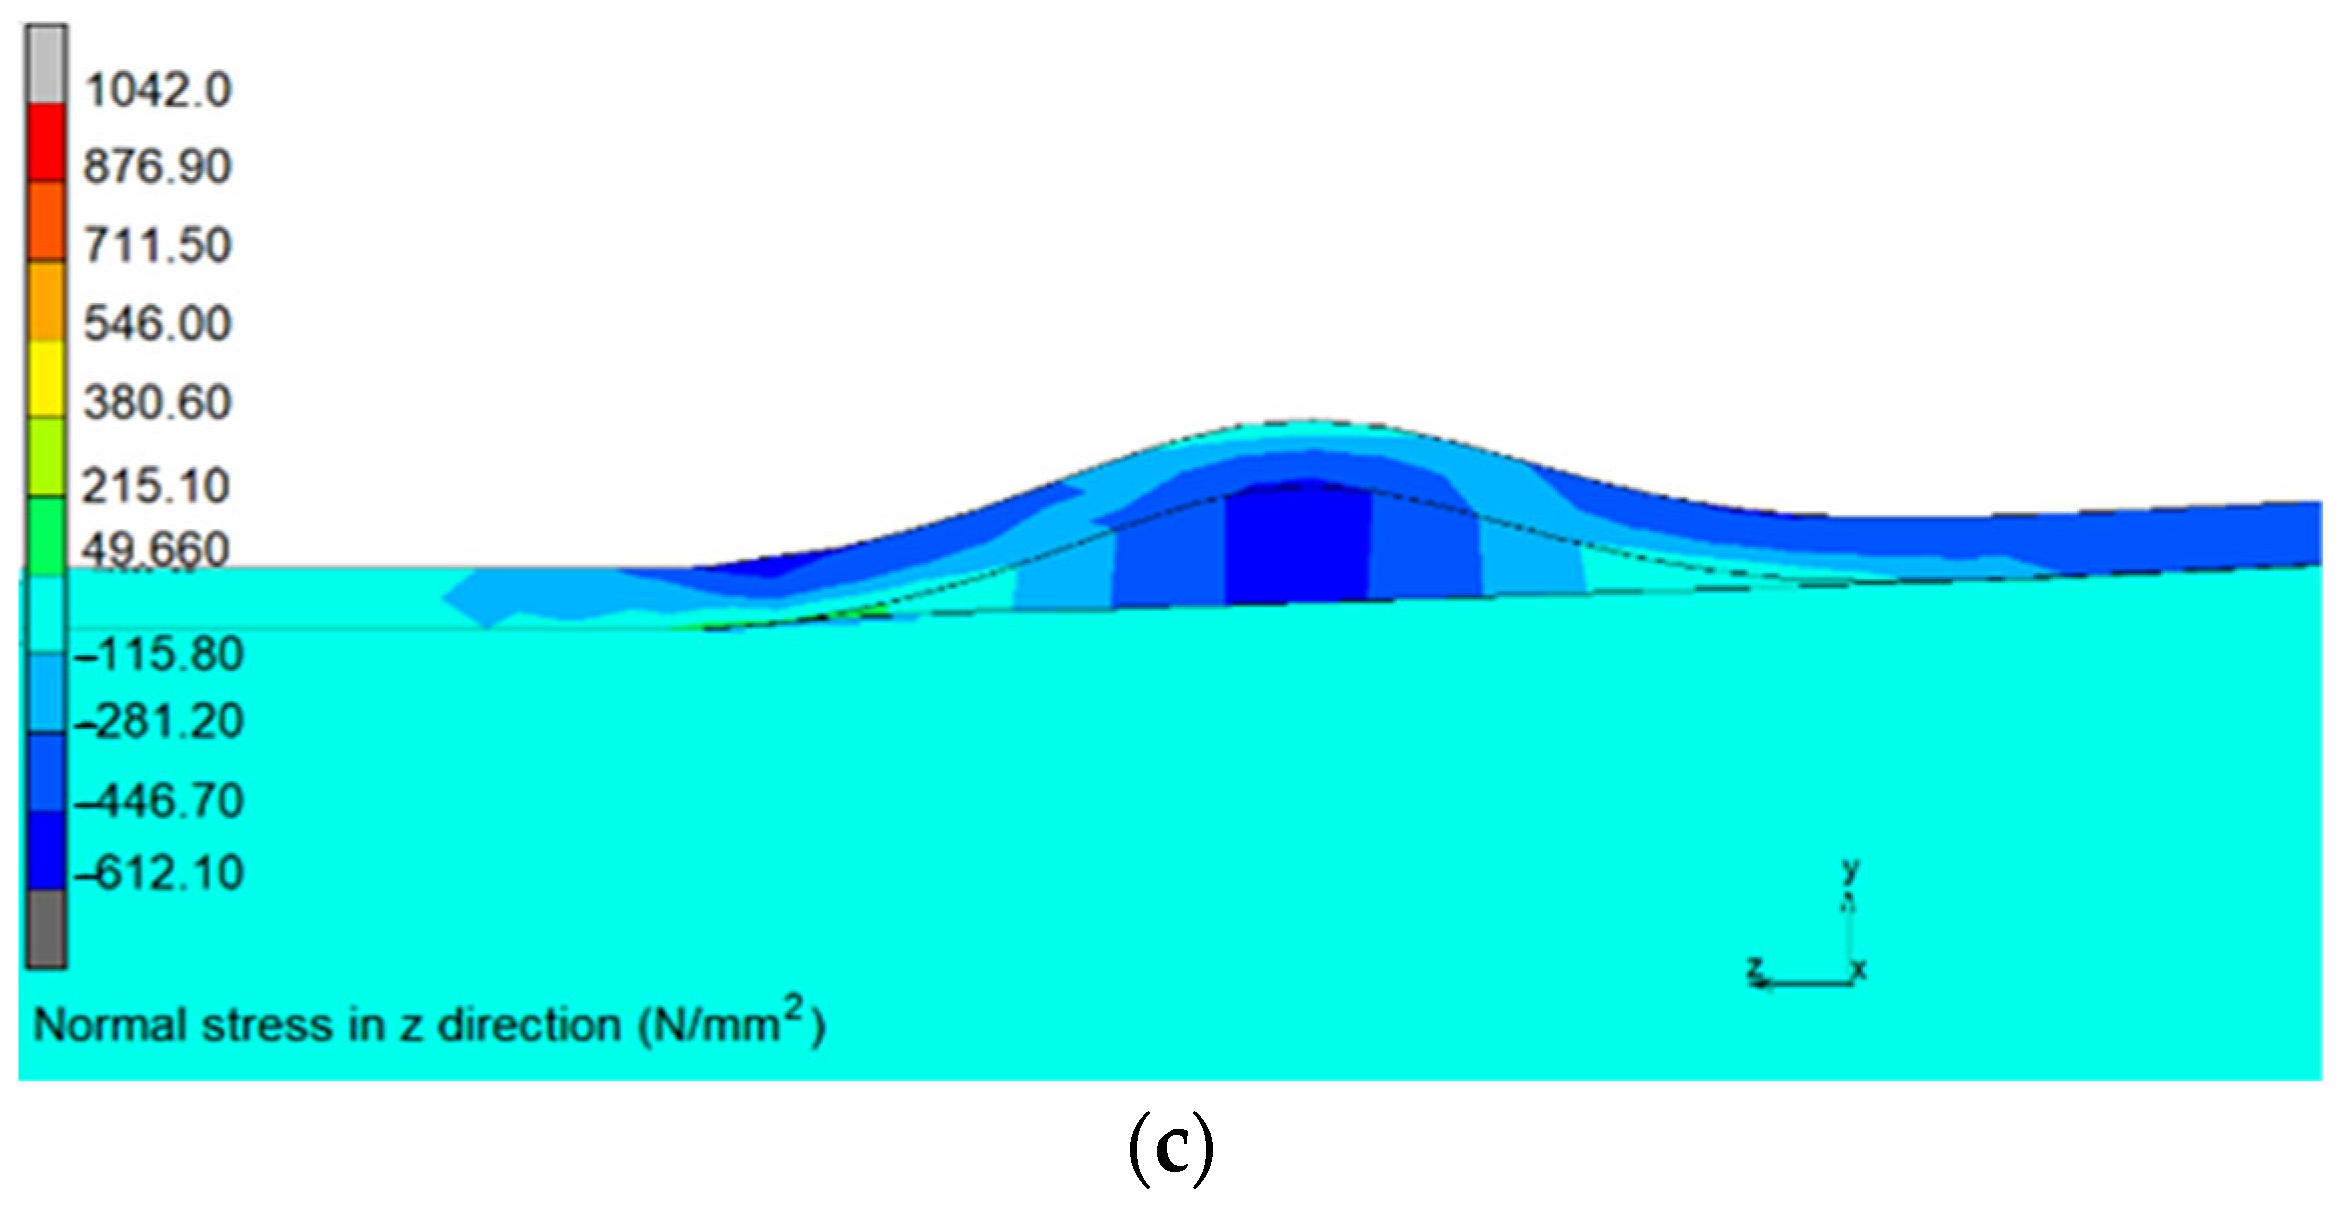
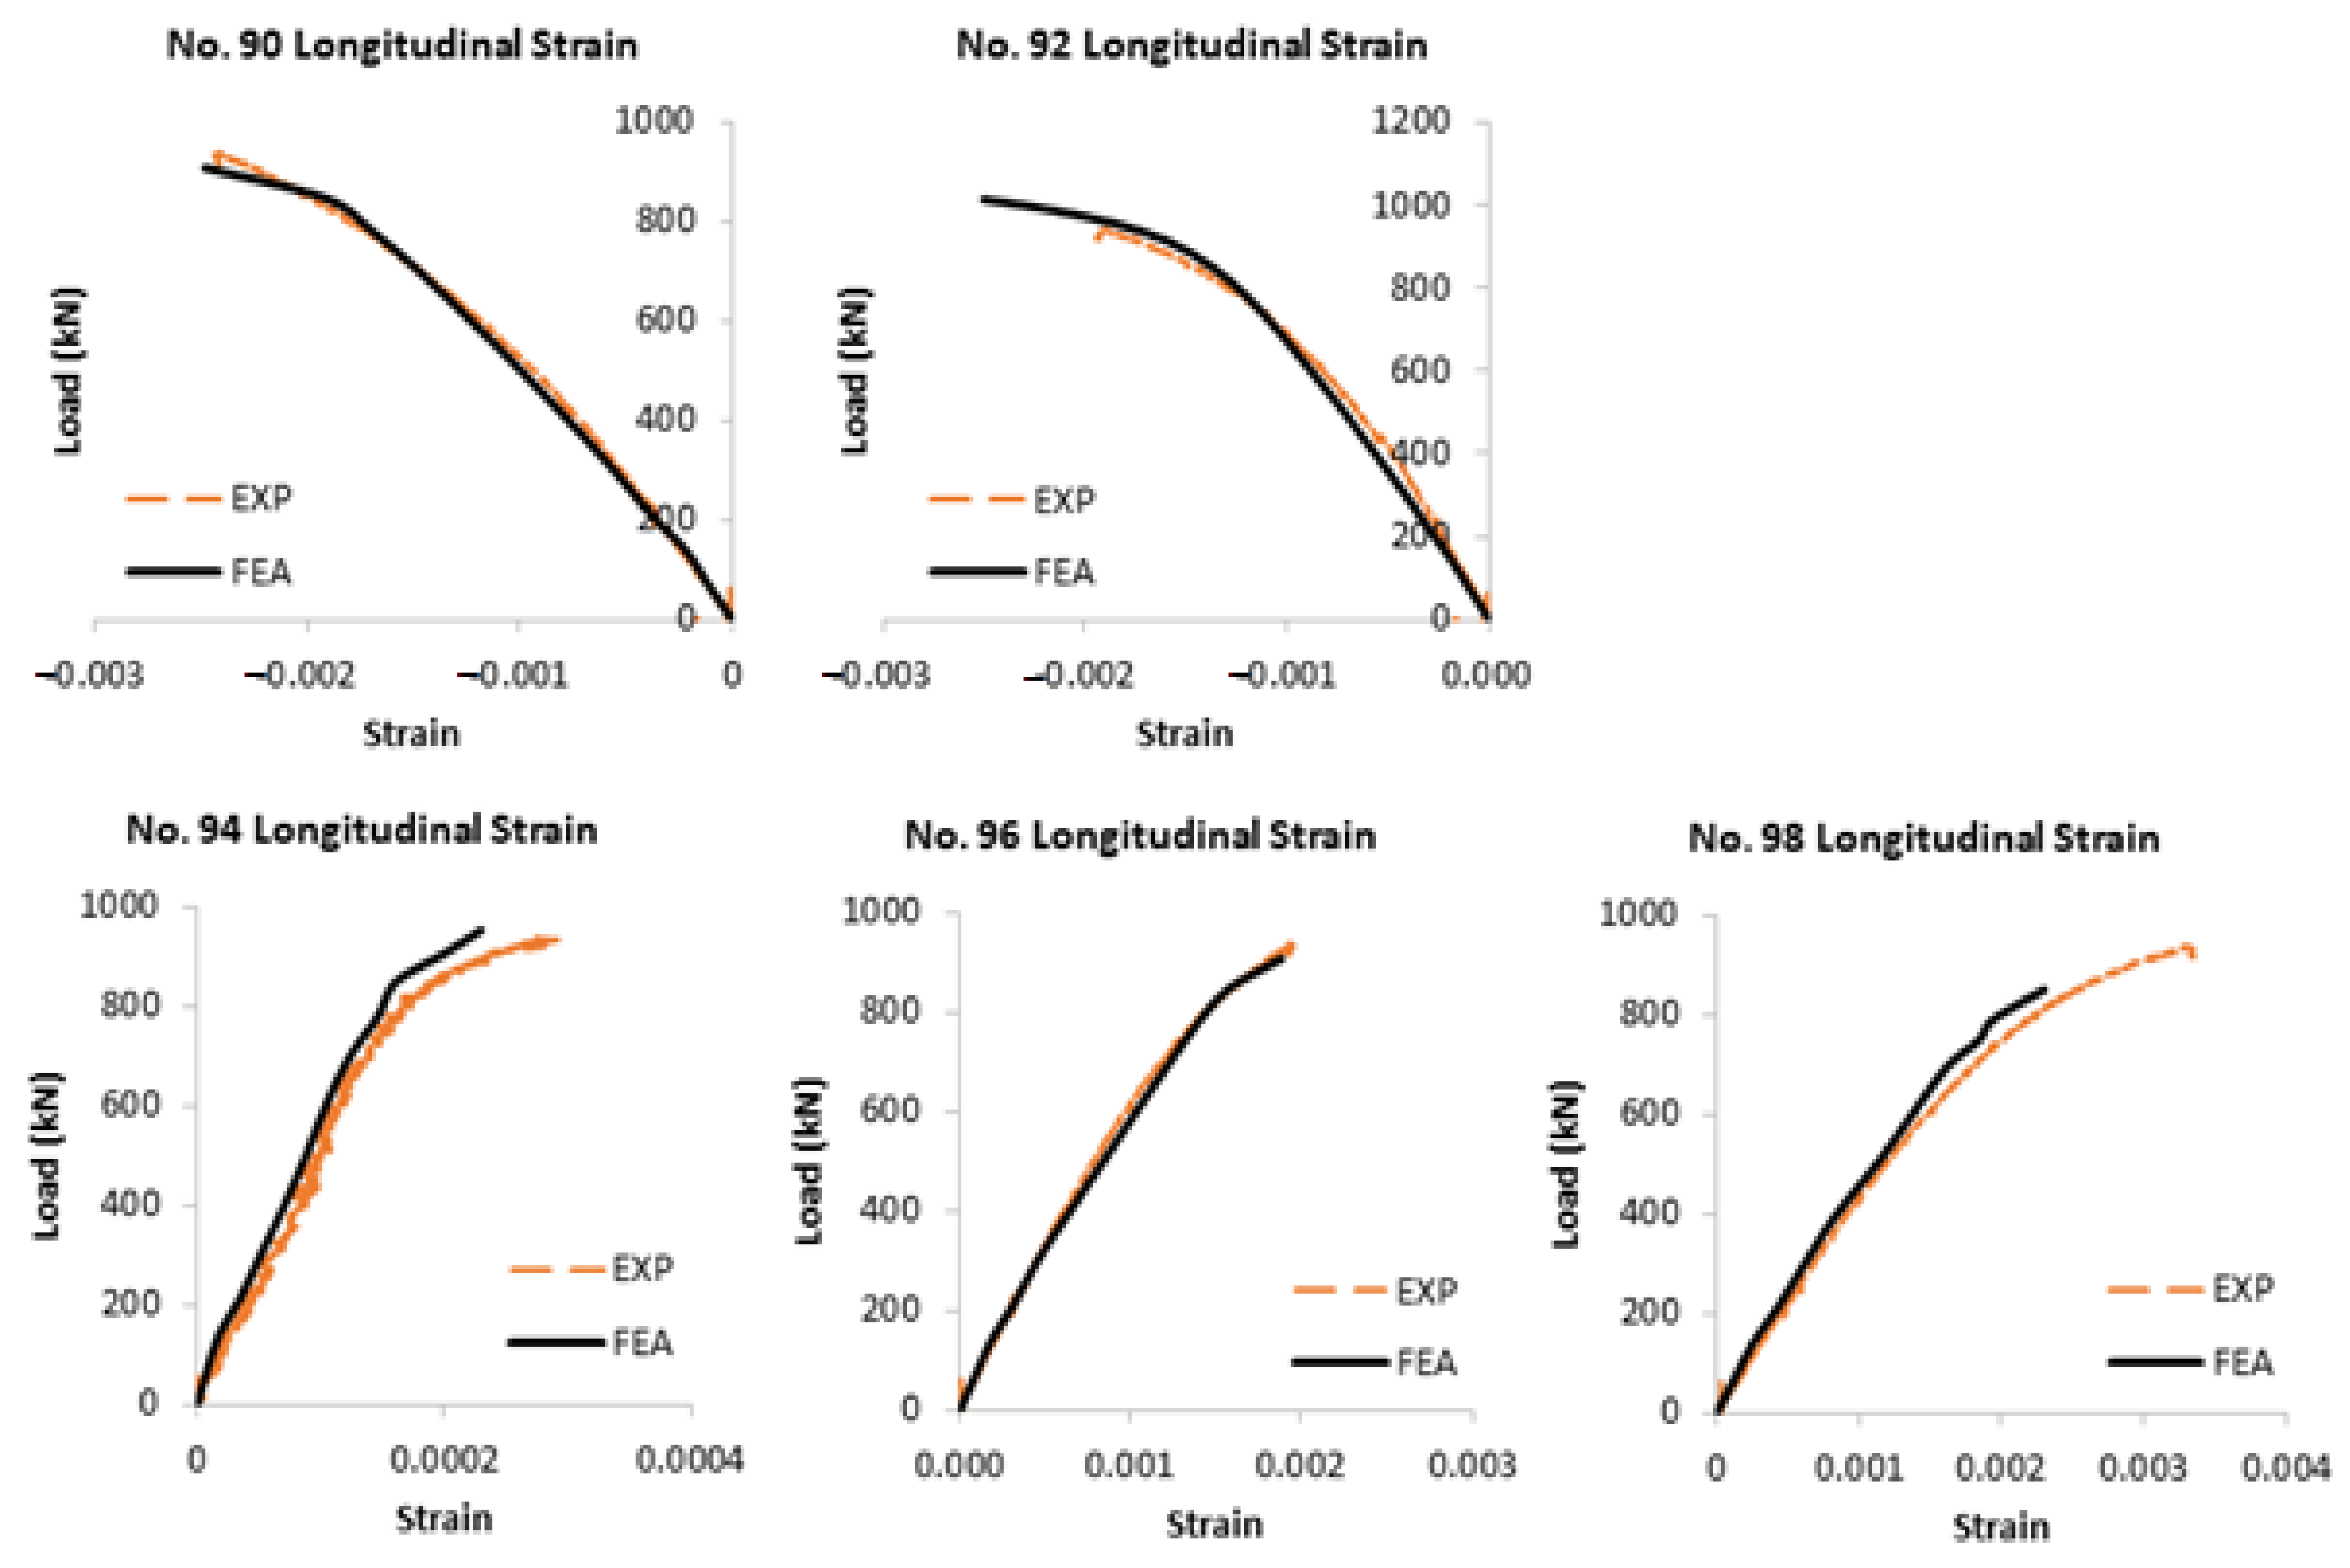
- The comparisons show excellent agreements between the experimental test and Finite Element results, including load-vertical displacement curves, longitudinal strain measurements at some cross-sections, buckling failure modes, and neutral axis positions in the transition area between steel tube and steel tube with concrete fill. Based on this validation, a comprehensive parametric study was then conducted to investigate the effects of the tube diameter-to-thickness ratio, the concrete filling length ratio, the compressive strength of concrete, and the tube steel’s yield and tensile strengths on the PCFST’s ultimate flexural strength and the confined strength of the concrete filling. Based on these studies, the confined strength of concrete predicted by FE modelling was evaluated considering the effects of different parameters and validating against the theoretical values.
- The results show that the ultimate load significantly increased when the tube diameter-to-thickness ratio D/t decreased, i.e., when D/t ratio decreased from 78 to 39, the ultimate load increased more than 95. When the D/t ratio increased, the tube became more vulnerable to failure by local buckling (buckled shapes formed around the loading point). It indicated the significant effects of increasing the tube’s thickness on increasing the PCFST’s ultimate flexural strength.
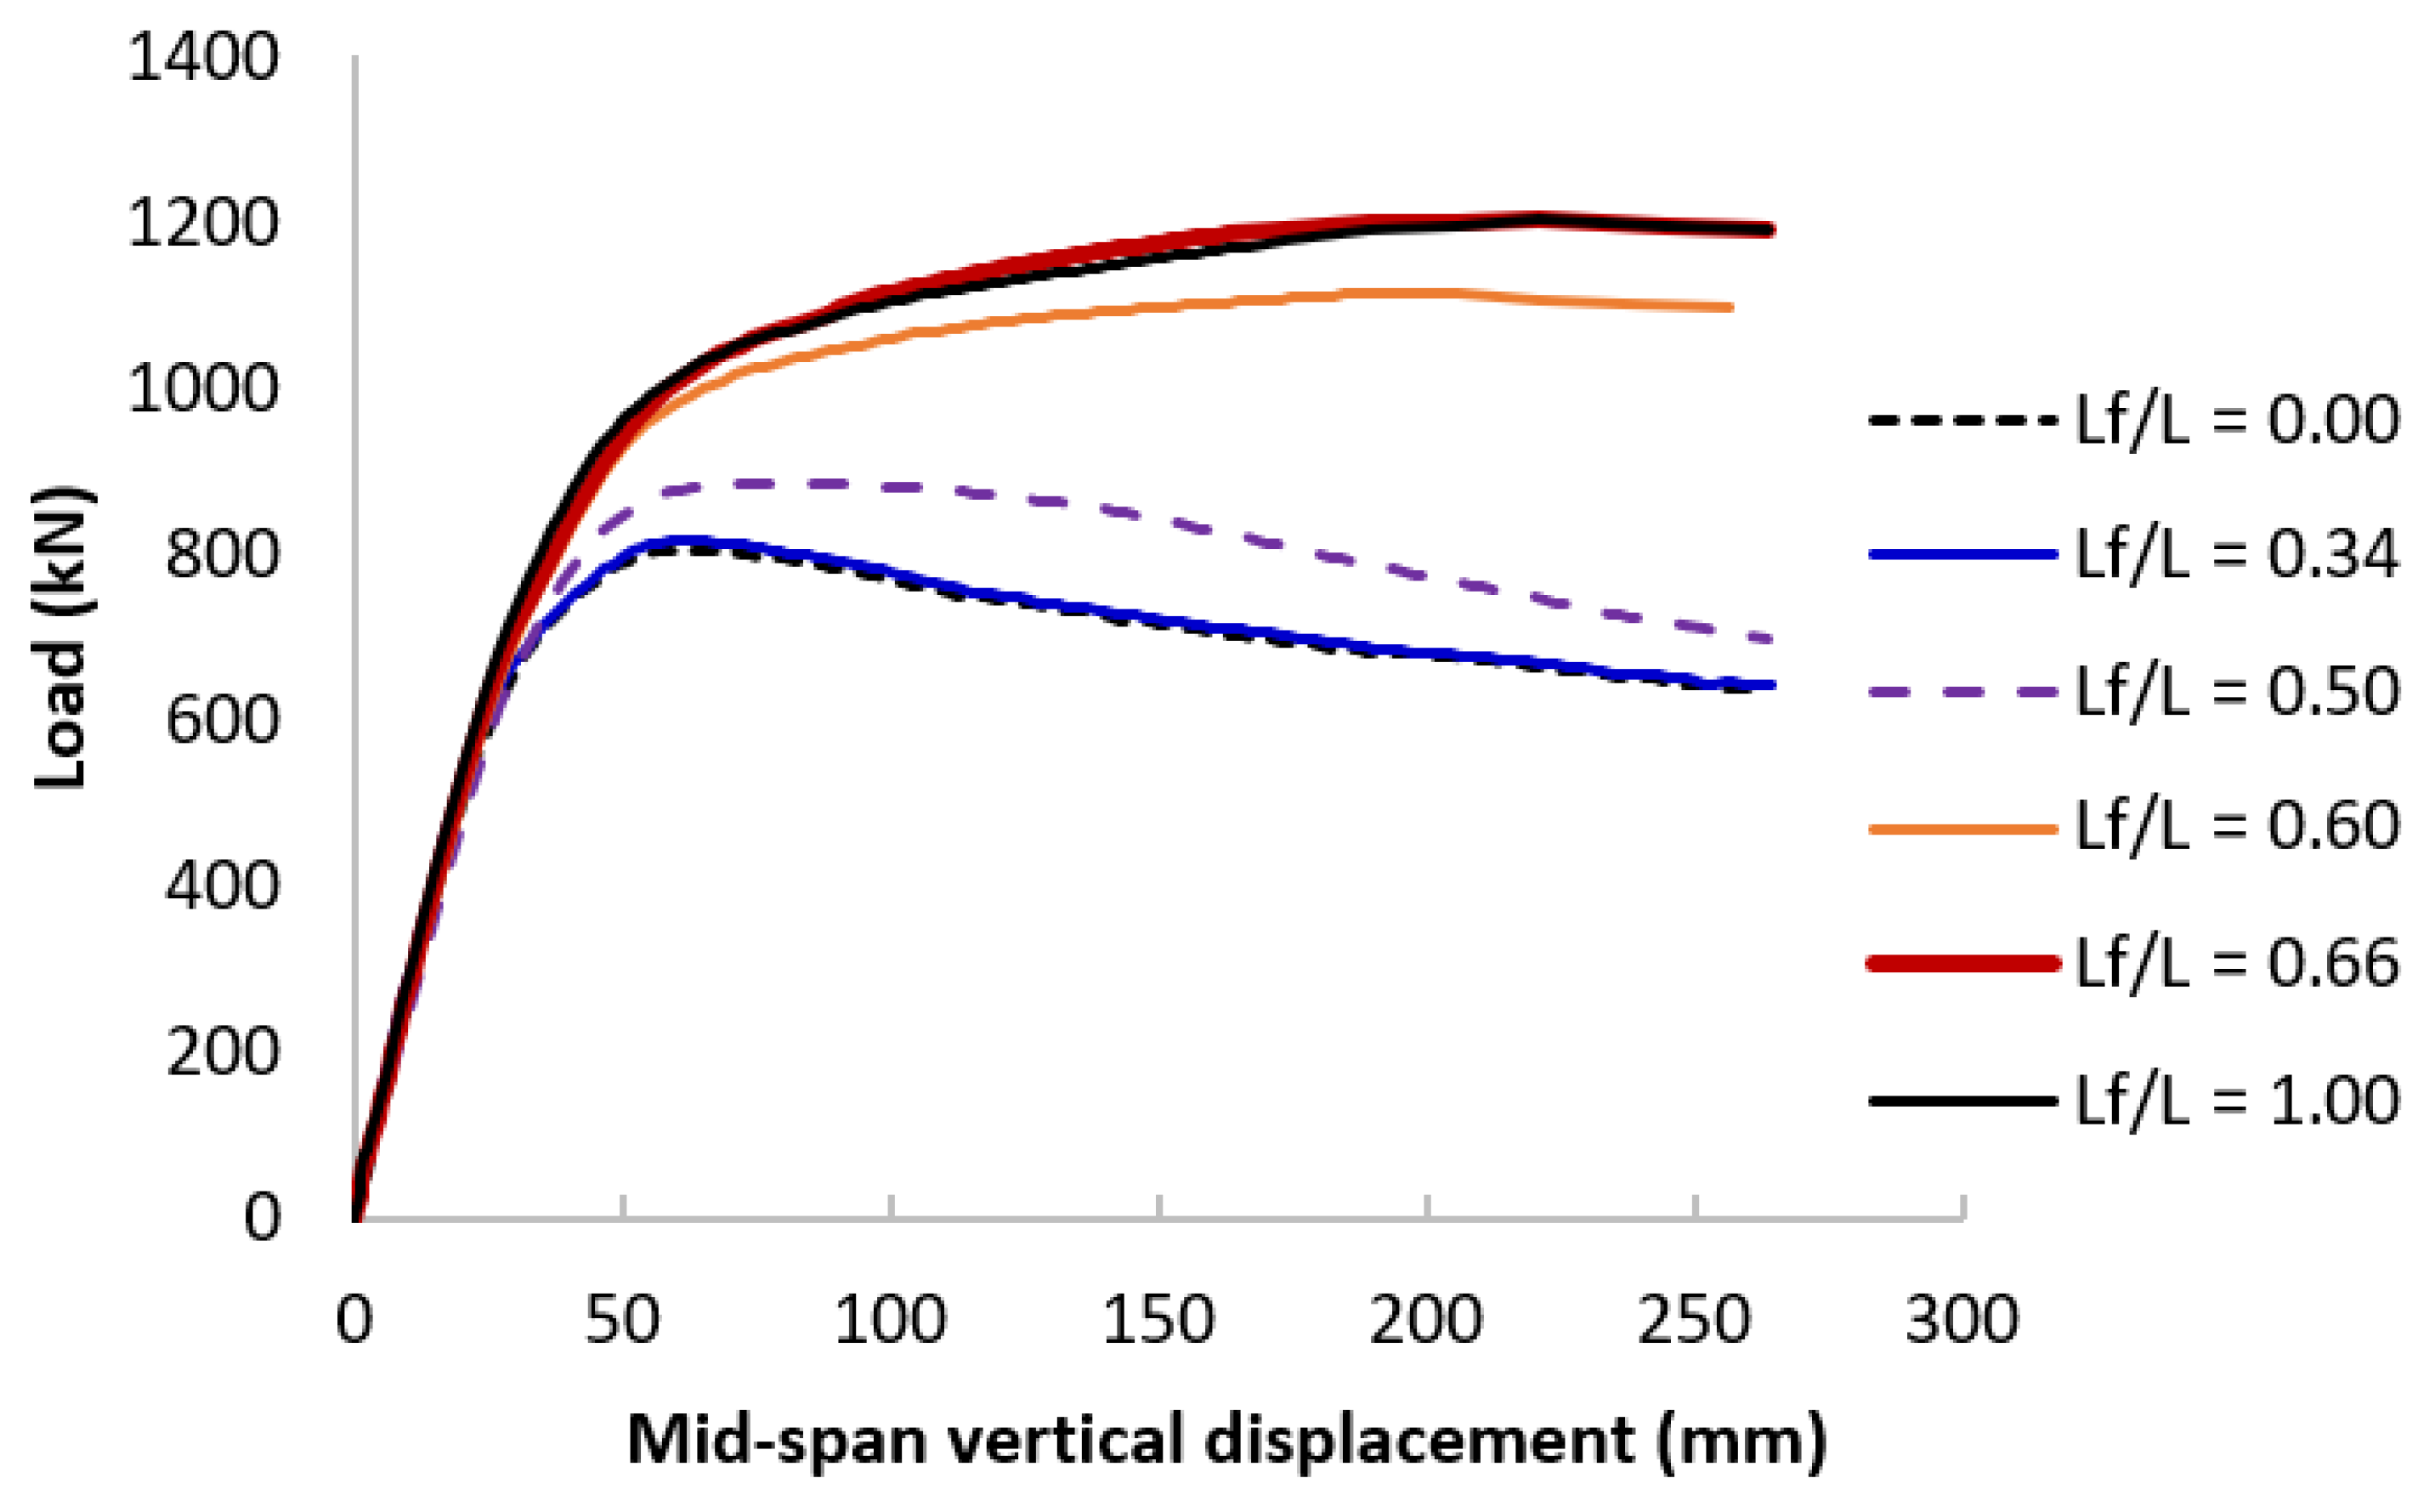
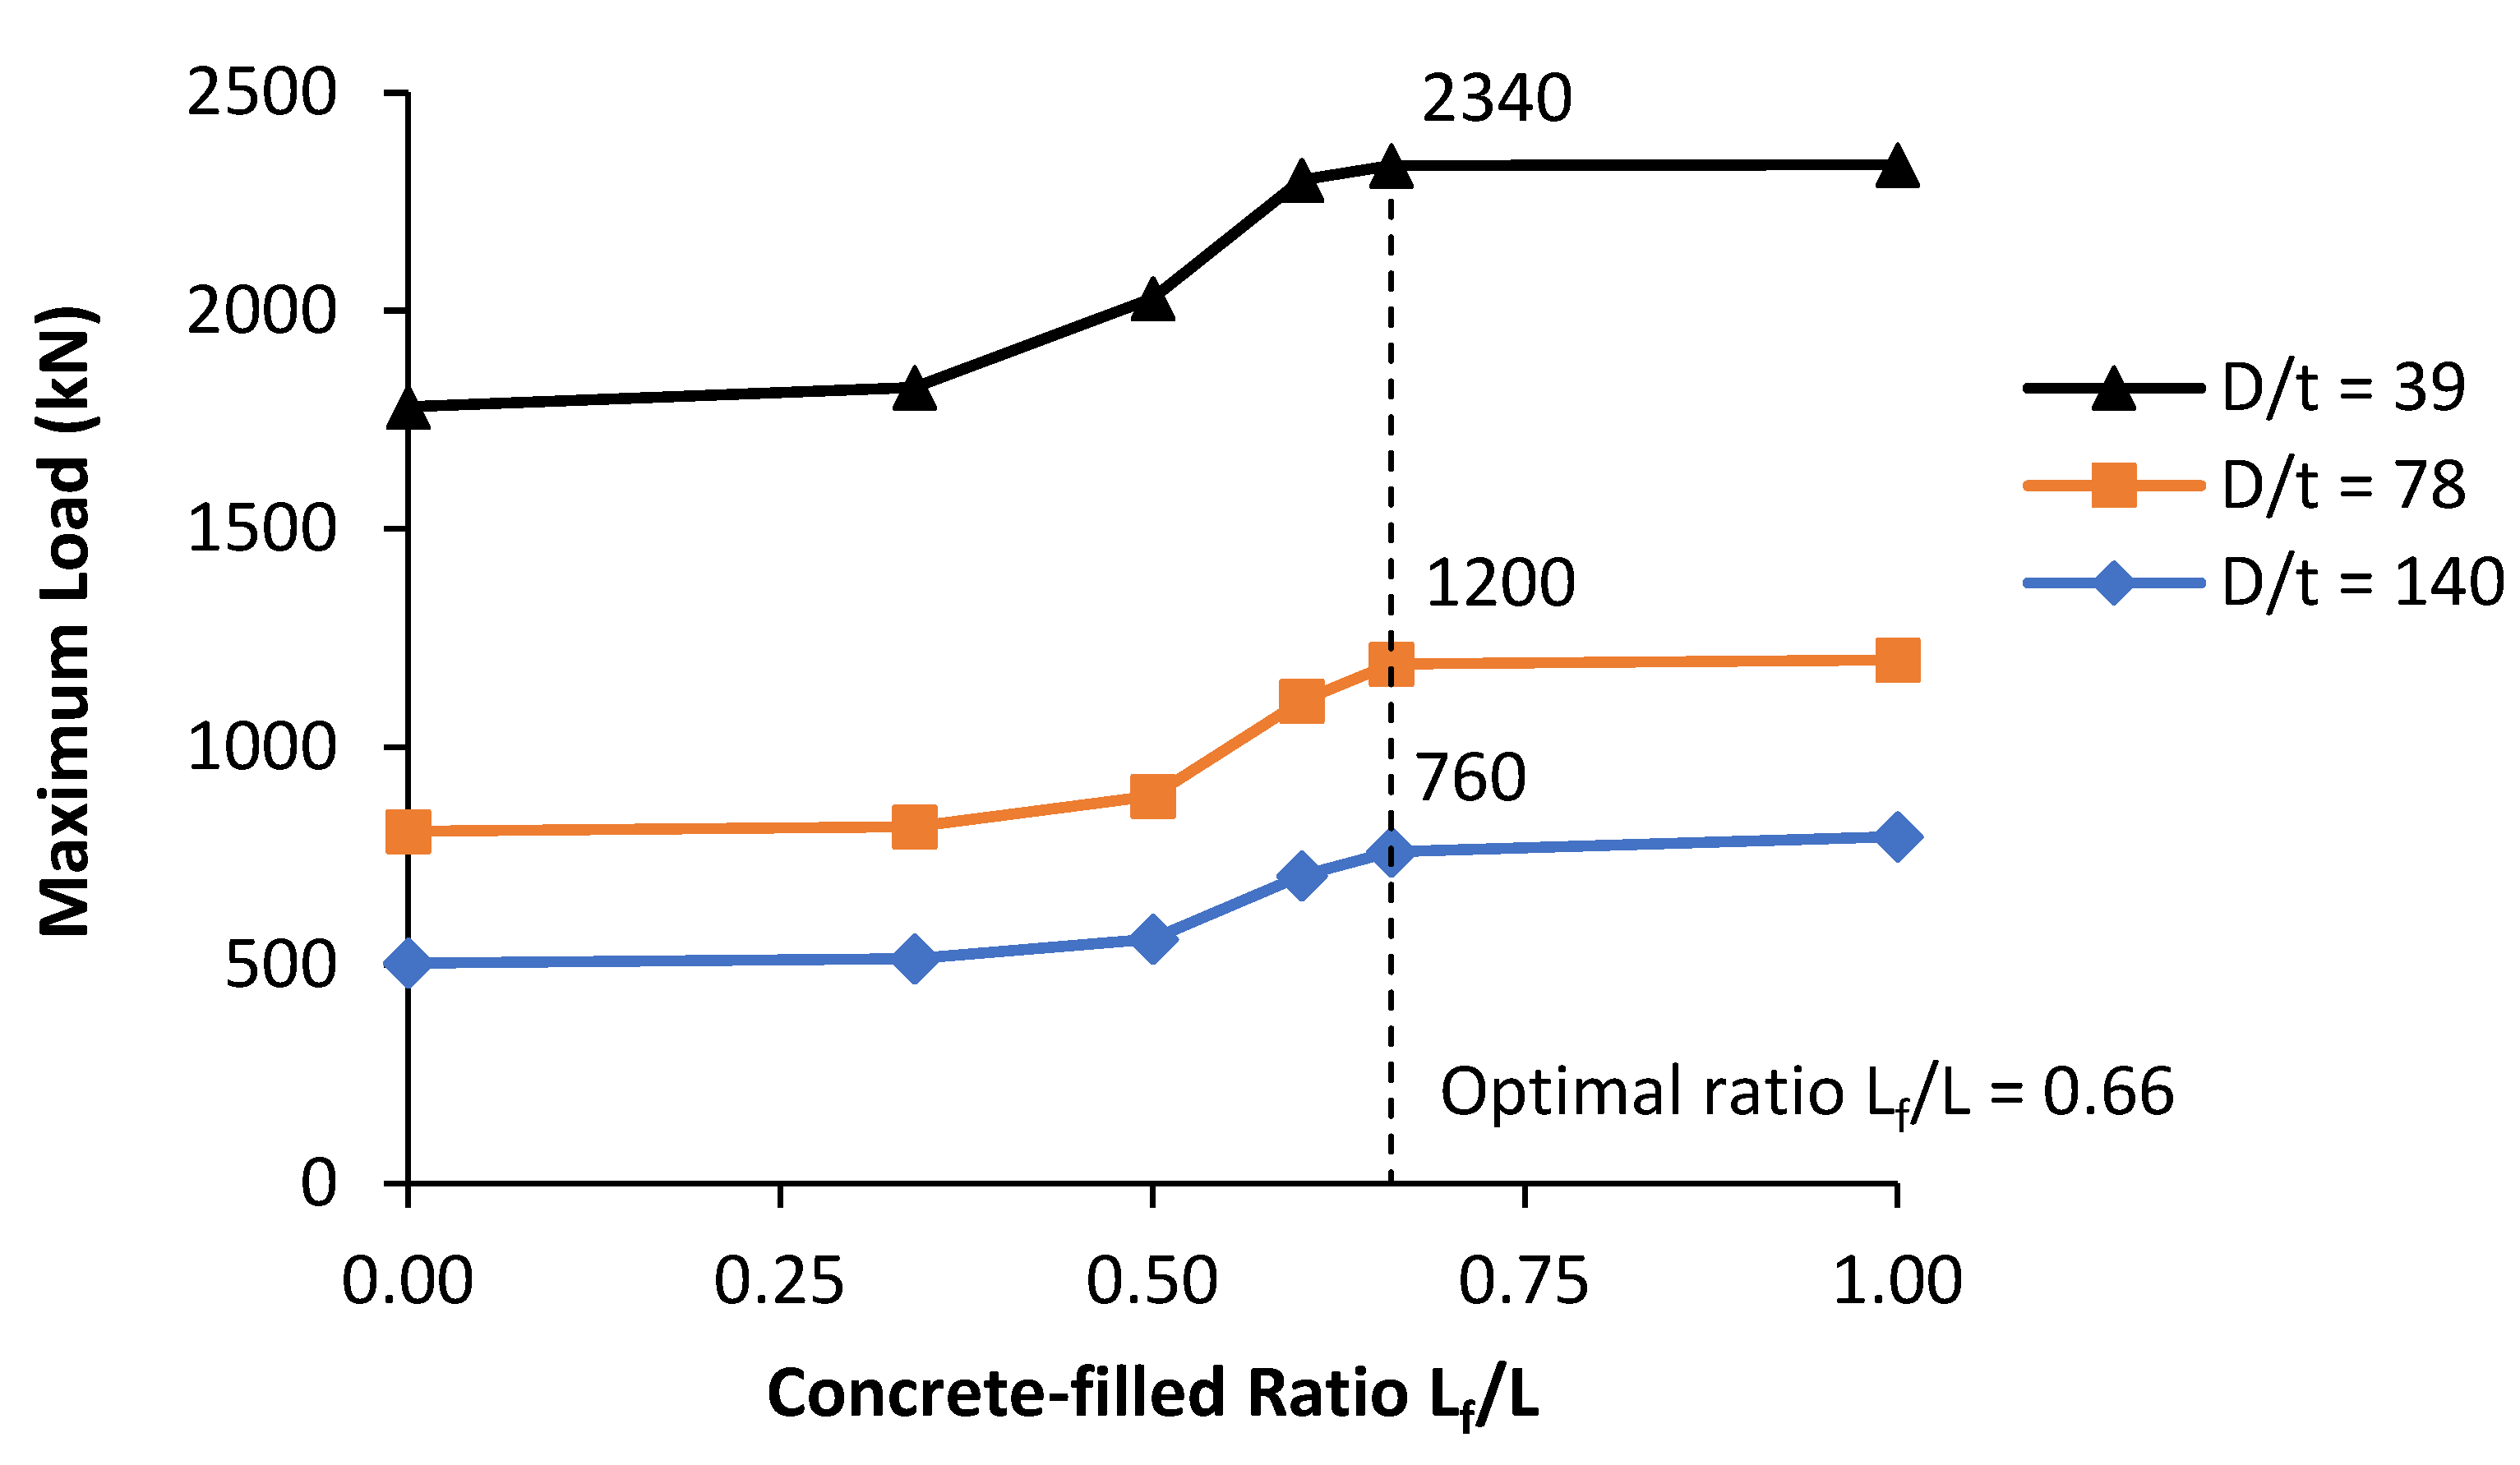
- An optimal length of the partial concrete filling could be determined considering the PCFST dimensions through D/t ratios. It was found that when the optimal length was about 66% of the tube length, the ultimate flexural strength of the PCFST was the same with that of the tube fully filed with concrete for its entire length. The PCFST with this optimal length of concrete filling defined the best flexural strength-to-weight ratio for the PCFST.
- The compressive strength of concrete did not have significant effects on the PCFST’s flexural strength, i.e., changing the compressive strength by 30% only resulted in a maximum difference of 2% for the PCFST’s ultimate loads.
- The material properties of the steel tube (yield stress and tensile strength) had significant effects on the PCFST’s flexural strength, i.e., when the steel strengths increased by 10%, the PCFST’s ultimate load could increase up to 14%.
- The confined stresses developed in the concrete filling predicted by FE modelling increased when the compressive strength increased, with a maximum difference of 9% for the same steel grade but this did not significantly affect the PCFST’s ultimate strength.
- The confined stresses developed in the concrete filling predicted by FE modelling increased when the steel’s yield stress and tensile strength increased, with a maximum difference of 5% and this significantly affected the PCFST’s ultimate strength, i.e., a maximum increase of 14%.
- The confined stresses developed in the concrete filling predicted by FE modelling remained unchanged when the concrete filling length was equal or greater than 66% of the tube length. However, it increased significantly, by 2.4 times when the tube’s thicknesses increased.
- The confined strengths predicted by FE analysis were in excellent agreement with those calculated by the theoretical model while the corresponding strains were lower than those calculated by the theoretical model.
Author Contributions
Funding
Data Availability Statement
Acknowledgments
Conflicts of Interest
Appendix A. Confined Concrete Model and Properties

References
- Gupta, P.K.; Sarda, S.M.; Kumar, M.S. Experimental and computational study of concrete filled steel tubular columns under axial loads. J. Constr. Steel Res. 2007, 63, 182–193. [Google Scholar] [CrossRef]
- Han, L.H.; Li, W.; Bjorhovde, R. Developments and advanced applications of concrete-filled steel tubular (CFST) structures. J. Constr. Steel Res. 2014, 100, 211–228. [Google Scholar] [CrossRef]
- Brown, N.K.; Kowalsky, M.K.; Nau, J.M. Impact of D/t on seismic behavior of reinforced concrete fill steel tubes. J. Constr. Steel Res. 2015, 107, 111–123. [Google Scholar] [CrossRef]
- Elremaily, A.; Azizinamini, A. Behavior and strength of circular concrete-filled tube columns. J. Constr. Steel Res. 2002, 58, 1567–1591. [Google Scholar] [CrossRef]
- Kilpatrick, A.E.; Vijaya, R.B. Tests on high-strength concrete filled steel tubular columns. ACI Struct. J. 1999, 96, 268–274. [Google Scholar]
- Roeder, C.W.; Lehman, D.E.; Bishop, E. Strength and stiffness of circular concrete-filled tubes. J. Struct. Eng. 2010, 136, 1545–1553. [Google Scholar] [CrossRef]
- Mitchell, J.R.; Fam, A.Z. Tests and analysis of cantilevered GFRP tubular poles with partial concrete filling. J. Compos. Constr. 2010, 14, 115–124. [Google Scholar] [CrossRef]
- Elchalakani, M.; Zhao, X.L.; Grzebieta, R.H. Concrete-filled circular steel tubes subjected to pure bending. J. Constr. Steel Res. 2001, 57, 1141–1168. [Google Scholar] [CrossRef]
- Jiang, A.Y.; Chen, J.; Jin, W.L. Experimental investigation and design of thin-walled concrete-filled steel tubes subject to bending. Thin-Walled Struct. 2013, 63, 44–50. [Google Scholar] [CrossRef]
- Wang, Z.B.; Yu, Q.; Tao, Z. Behaviour of CFRP externally reinforced circular CFST members under combined tension and bending. J. Constr. Steel Res. 2015, 106, 122–137. [Google Scholar] [CrossRef]
- Gunawardena, Y.; Aslani, F. Static flexural behaviour of concrete-filled spiral-welded stainless-steel tubes. Thin-Walled Struct. 2020, 151, 1–21. [Google Scholar] [CrossRef]
- Goto, Y.; Kumar, G.P.; Kawanishi, N. Nonlinear Finite-Element analysis for hysteretic behavior of thin-walled circular steel columns with in-filled concrete. J. Struct. Eng. 2010, 136, 1413–1422. [Google Scholar] [CrossRef]
- Han, L.H.; Lu, H.; Yao, G.H.; Liao, F.Y. Flexural study on the flexural behaviour of concrete-filled steel tubes. J. Constr. Steel Res. 2004, 60, 313–337. [Google Scholar] [CrossRef]
- Roeder, C.W.; Stephen, M.T.; Lehman, D.E. Concrete filled steel tubes for bridge pier and foundation construction. Int. J. Steel Struct. 2018, 18, 39–49. [Google Scholar] [CrossRef]
- Qiu, W.; McCann, F.; Espinos, A.; Romero, M.L.; Gardner, L. Numerical analysis and design of slender concrete-filled elliptical hollow section columns and beam-columns. Eng. Struct. 2017, 131, 90–100. [Google Scholar] [CrossRef]
- Hu, H.T.; Huang, C.S.; Chen, Z.L. Finite element analysis of CFT columns subjected to an axial compressive force and bending moment in combination. J. Constr. Steel Res. 2005, 61, 1692–1712. [Google Scholar] [CrossRef]
- Moon, J.; Roeder, C.W.; Lehman, D.E.; Lee, H.E. Analytical modelling of bending of circular concrete-filled steel tubes. Eng. Struct. 2012, 42, 349–361. [Google Scholar] [CrossRef]
- Zheng, Y.; He, C.; Zheng, L. Experimental and numerical investigation of circular double-tube concrete filled stainless steel tubular columns under cyclic loading. Thin-Walled Struct. 2018, 132, 151–166. [Google Scholar] [CrossRef]
- Shi, Y.L.; Xian, W.; Wang, W.D.; Li, H.W. Mechanical behaviour of circular steel-reinforced concrete-filled steel tubular members under pure bending loads. Structures 2020, 25, 8–23. [Google Scholar] [CrossRef]
- Xian, W.; Wang, W.D.; Wang, R.; Chen, W.; Hao, H. Dynamic response of steel-reinforced concrete-filled circular steel tubular members under lateral impact loads. Thin-Walled Struct. 2020, 151, 106736. [Google Scholar] [CrossRef]
- Xian, W.; Chen, W.; Hao, H.; Wang, W.D. Experimental and numerical studies on square steel-reinforced concrete-filled steel tubular (SRCFST) members subjected to lateral impact. Thin-Walled Struct. 2021, 160, 107409. [Google Scholar] [CrossRef]
- Wang, W.D.; Ji, S.H.; Xian, W.; Shi, Y.L. Experimental and numerical investigations of steel-reinforced concrete-filled steel tubular members under compression-bending-shear loads. J. Constr. Steel Res. 2021, 181, 106609. [Google Scholar] [CrossRef]
- Debnath, P.P.; Chan, T.M. A comprehensive numerical approach for modelling blind-bolted CFST connections. Structures 2021, 33, 2208–2225. [Google Scholar] [CrossRef]
- Kang, L.; Fan, W.; Liu, B.; Liu, Y. Numerically efficient analysis of concrete-filled steel tubular columns under lateral impact loading. J. Constr. Steel Res. 2020, 179, 106564. [Google Scholar] [CrossRef]
- Building and Construction Authority. BC4. Design Guide for Steel-Concrete Composite Columns with High Strength Materials—An Extension of Eurocode 4 Method To C90/105 Concrete and S550 Steel; Building and Construction Authority: Singapore, 2021. [Google Scholar]
- Liew, J.Y.R.; Xiong, M.-X.; Lai, B.-L. Design of Steel-Concrete Composite Structures—An Extension of EN1994-1-1 to High Strength Materials; Elsevier: Amsterdam, The Netherlands, 2021. [Google Scholar]
- Xiao, Y.; Wu, H. Retrofit of reinforced concrete columns using partially stiffened steel jackets. J. Struct. Eng. 2003, 12, 725–732. [Google Scholar] [CrossRef]
- Fam, A.; Mitchell, J. Enhancing flexural performance of free-standing tubular steel poles using an optimal partial concrete fill. Can. J. Civ. Eng. 2011, 38, 1145–1157. [Google Scholar] [CrossRef]
- Gerolymos, N.; Drosos, V.; Gazetas, G. Seismic response of single column bent on pile: Evidence of beneficial role of pile and soil inelasticity. Bull. Earthq. Eng. 2009, 7, 547–573. [Google Scholar] [CrossRef]
- Khalifa, M.; Shaat, A.; Ibrahim, S. Optimum concrete filling ratio for partially filled noncompact steel tubes. Thin-Walled Struct. 2019, 134, 159–173. [Google Scholar] [CrossRef]
- Liao, F.Y.; Han, L.H.; Tao, Z.; Rasmussen, K.J.R. Experimental behavior of concrete-filled stainless steel tubular columns under cyclic lateral loading. J. Struct. Eng. 2017, 14, 04016219. [Google Scholar] [CrossRef]
- Yuan, H.; Dang, J.; Aoki, T. Behavior of partially concrete-filled steel tube bridge piers under bi-directional seismic excitations. J. Constr. Steel Res. 2014, 93, 44–54. [Google Scholar] [CrossRef]
- Nguyen, T.T.T.; Thai, M.Q.; Dao, D.L. Simulation of the bending behaviour of concrete-filled steel tubes. Transp. J. 2020, 1–2, 50–53. (In Vietnamese) [Google Scholar]
- Nguyen, T.T.T.; Tran, V.N.; Tran, M.L. Studying applications of the pile and pile continuous structures for urban bridges in Vietnam. Transp. J. 2019, 12, 28–31. (In Vietnamese) [Google Scholar]
- AASHTO T 177; Standard Method of Test for Flexural Strength of Concrete Using Simple Beam with Center-Point Loading. The American Association of State Highway and Transportation Official: Washington, DC, USA, 2017.
- ASTM C293/C293M-16; Standard Method of Test for Flexural Strength of Concrete (Using Simple beam with center-point loading). The American Society for Testing and Materials: West Conshohocken, PA, USA, 2016.
- Buyukozturk, O. Nonlinear analysis of reinforced concrete structures. Comput. Struct. 1977, 7, 149–156. [Google Scholar] [CrossRef]
- Mander, J.B.; Priestley, M.J.N.; Park, N. Theoretical stress-strain model for confined concrete. J. Struct. Eng. 1988, 114, 1804–1826. [Google Scholar] [CrossRef]
- Jefferson, A. Craft—A plastic-damage-contact model for concrete. I. Model theory and thermodynamic considerations. Int. J. Solids Struct. 2003, 40, 5973–5999. [Google Scholar] [CrossRef]
- Nguyen, V.B. Numerical Modelling of Reinforced Concrete Bridge Pier Under Artificially Generated Earthquake Time-Histories. Ph.D. Thesis, University of Birmingham, Birmingham, UK, 2006. [Google Scholar]
- Bazant, Z.P.; Oh, B.H. Crack band theory for fracture of concrete. Mater. Struct. 1983, 16, 155–177. [Google Scholar]
- Bedard, C.; Kotsovos, M.D. Fracture processes of concrete for NLFEA methods. J. Struct. Eng. 1986, 112, 573–587. [Google Scholar] [CrossRef]
- Baran, E.; Schultz, A.E.; French, C.E. Performance of a prestressed concrete pedestrian bridge system under equivalent static lateral impact loads. J. Perform. Constr. Facil. 2013, 27, 450–459. [Google Scholar] [CrossRef]
- Richart, F.E.; Brandtzaeg, A.; Brown, R.L. A Study of The Failure of Concrete Under Combined Compressive Stresses; University of Illinois Engineering Experimental Station: Champaign, IL, USA, 1928. [Google Scholar]




| Material | Weight (kg/m3) | Volume (m3) |
|---|---|---|
| Water | 179 | 0.179 |
| Cement | 350 | 0.112 |
| Coarse aggregates (size: 5–20 mm) | 1010 | 0.015 |
| Sand | 835 | 0.319 |
| Admixtures | 1.4 | 0.001 |
| Air (1.5%) | ||
| Water/Cement ratio = 51% | ||
| Cement/Sand ratio = 42% |
| Concrete Filling Length Ratio | |||
|---|---|---|---|
| (1) | (2) | (3) | (4) |
| 0.00 | 1780 | 807 | 505 |
| 0.34 | 1824 | 817 | 515 |
| 0.50 | 2029 | 888 | 560 |
| 0.60 | 2300 | 1105 | 705 |
| 0.66 | 2333 | 1200 | 760 |
| 1.00 | 2335 | 1210 | 795 |
| Compressive Strength | Steel Yield and Ultimate Strength | Ultimate Load | Finite Element Analysis (FEA) | Theoretical Analysis (THEO) | Comparison | ||||
|---|---|---|---|---|---|---|---|---|---|
| (1) | (2) | (3) | (4) | (5) | (6) | (7) | (8) | (9) | (10) |
| σy = 334, σt = 488 | 1049 | 40 | 0.0015 | 52 | 40 | 0.0033 | 1.00 | 0.45 | |
| 36 | σy = 382, σt = 542 | 1173 | 42 | 0.0015 | 53 | 41 | 0.0035 | 1.02 | 0.43 |
| σy = 458, σt = 650 | 1343 | 42 | 0.0015 | 53 | 43 | 0.0038 | 0.98 | 0.39 | |
| σy = 334, σt = 488 | 1053 | 44 | 0.0017 | 56 | 45 | 0.0031 | 0.98 | 0.55 | |
| 41 | σy = 382, σt = 542 | 1200 | 46 | 0.0017 | 58 | 46 | 0.0033 | 1.00 | 0.52 |
| σy = 458, σt = 650 | 1359 | 47 | 0.0017 | 60 | 48 | 0.0035 | 0.98 | 0.49 | |
| σy = 334, σt = 488 | 1064 | 49 | 0.0019 | 59 | 50 | 0.0030 | 0.98 | 0.63 | |
| 46 | σy = 382, σt = 542 | 1200 | 50 | 0.0019 | 60 | 51 | 0..0031 | 0.98 | 0.61 |
| σy = 334, σt = 488 | 1364 | 52 | 0.0019 | 64 | 53 | 0.0034 | 0.98 | 0.56 | |
| Diameter-to-Thickness Ratio | Concrete Filling Length Ratio | Ultimate Load | Finite Element Analysis (FEA) | Theoretical Analysis (THEO) | Comparison | ||||
|---|---|---|---|---|---|---|---|---|---|
| (1) | (2) | (3) | (4) | (5) | (6) | (7) | (8) | (9) | (10) |
| 39 | 0.66 | 2333 | 120 | 0.0011 | 120 | 64 | 0.0058 | 1.88 | 0.19 |
| 1.00 | 2335 | 123 | 0.0011 | 123 | 64 | 0.0058 | 1.92 | 0.19 | |
| 78 | 0.66 | 1200 | 50 | 0.0019 | 60 | 51 | 0.0031 | 0.98 | 0.61 |
| 1.00 | 1210 | 50 | 0.0019 | 60 | 51 | 0.0031 | 0.98 | 0.61 | |
| 140 | 0.66 | 760 | 50 | 0.0019 | 50 | 48 | 0.0024 | 1.04 | 0.79 |
| 1.00 | 795 | 50 | 0.0019 | 56 | 48 | 0.0024 | 1.04 | 0.79 | |
Disclaimer/Publisher’s Note: The statements, opinions and data contained in all publications are solely those of the individual author(s) and contributor(s) and not of MDPI and/or the editor(s). MDPI and/or the editor(s) disclaim responsibility for any injury to people or property resulting from any ideas, methods, instructions or products referred to in the content. |
© 2023 by the authors. Licensee MDPI, Basel, Switzerland. This article is an open access article distributed under the terms and conditions of the Creative Commons Attribution (CC BY) license (https://creativecommons.org/licenses/by/4.0/).
Share and Cite
Nguyen, T.T.T.; Nguyen, V.B.; Thai, M.Q. Flexural Strength of Partially Concrete-Filled Steel Tubes Subjected to Lateral Loads by Experimental Testing and Finite Element Modelling. Buildings 2023, 13, 216. https://doi.org/10.3390/buildings13010216
Nguyen TTT, Nguyen VB, Thai MQ. Flexural Strength of Partially Concrete-Filled Steel Tubes Subjected to Lateral Loads by Experimental Testing and Finite Element Modelling. Buildings. 2023; 13(1):216. https://doi.org/10.3390/buildings13010216
Chicago/Turabian StyleNguyen, Thi Tuyet Trinh, Van Bac Nguyen, and Minh Quan Thai. 2023. "Flexural Strength of Partially Concrete-Filled Steel Tubes Subjected to Lateral Loads by Experimental Testing and Finite Element Modelling" Buildings 13, no. 1: 216. https://doi.org/10.3390/buildings13010216
APA StyleNguyen, T. T. T., Nguyen, V. B., & Thai, M. Q. (2023). Flexural Strength of Partially Concrete-Filled Steel Tubes Subjected to Lateral Loads by Experimental Testing and Finite Element Modelling. Buildings, 13(1), 216. https://doi.org/10.3390/buildings13010216


