

Evaluation of Flexural Behavior of Prestressed Concrete (PSC) Hollow-Core Slabs (HCSs)
by
 ,
,
Dong-Hwan Kim
1,
Min-Jun Kim
2,
Min-Su Jo
1,
Hyeong-Gook Kim
1,
Yeo-Jin Yoon
3 and
Kil-Hee Kim
1,* 1
Department of Architectural Engineering, Kongju National University, 1223-24, Cheonandaero, Seobuk, Cheonan 31080, Republic of Korea
2
Department of Public Housing Research, Land & Housing Research Institute, Daejeon 34047, Republic of Korea
3
Hansung PCC, Seongnam 13529, Republic of Korea
*
Author to whom correspondence should be addressed.
Buildings 2023, 13(11), 2869; https://doi.org/10.3390/buildings13112869
Submission received: 26 September 2023
/
Revised: 13 November 2023
/
Accepted: 14 November 2023
/
Published: 16 November 2023
(This article belongs to the Section Building Structures)
Abstract
:This study aimed to evaluate the flexural behavior characteristics of prestressed concrete hollow-core slabs (HCSs) through bending experiments. Six specimens were used as variables, both with and without reinforced concrete, in the HCS. A four-point load was applied in the form of a simple support beam to assess the flexural behavior and ultimate strength of HCS. The results demonstrate that, compared to non-reinforced specimens, the reinforced HCS exhibited higher maximum loads and better ductility performance. The experimental outcomes demonstrate that HCS showed an average of 10% higher capacity than the maximum load of the concrete structure standards (KDS 14 20 20, ACI 318-19, and PCI handbook), with or without reinforced concrete, leading to relatively safe predictions. This study’s experimental findings are anticipated to aid in evaluating structural safety in a relatively secure way. The findings indicate that the HCS structural system is excellent at sustaining the weight of a structure and ensuring its safety. Additionally, this investigation is anticipated to furnish practical guidance for optimizing the use of HCS systems in structural design and construction.
1. Introduction
Society is rapidly evolving with technological advances and information dissemination. As a result, the construction industry is striving to move away from traditional labor-intensive methods. To minimize on-site management and construction, numerous structural systems are gaining prominence. One such system is the prestressed hollow-core slab (PS-HCS), characterized by a low self-weight achieved through the development of a hollow core in the central section. PS-HCS exhibits exceptional structural efficiency. As a result, since their inception in the 1950s, PS-HCSs have been used to construct structures for various applications [1]. PS-HCSs with top and bottom stiffeners enjoy great popularity in both Europe and North America due to their superior flexural performance compared to that of reinforced concrete slabs [2,3,4,5,6]. Compared to reinforced concrete structures, which are typically cast in place, PS-HCSs are fabricated in a factory and installed on site, resulting in reduced construction time and simplified site management. The use of hollow-core slabs is advantageous in the construction of long-span structures because it reduces the self-weight of the structure [7,8,9,10,11,12,13,14]. As a result, such slabs are widely used in the construction of facilities that require long-span floors, including parking garages, distribution centers, semiconductor factories, and bridges [15]. When used as flooring systems, PS-HCSs create a load-bearing composite floor with reinforced concrete. This composite behavior allows for greater strength and stiffness under vertical loads while providing resistance to lateral loads due to diaphragm action.
In addition, PS-HCSs exhibit exceptional performance in the reduction of heavy impact sound, a significant source of noise between floors. When PS-HCSs are incorporated into multi-family housing, this property is expected to reduce vibration and subsequently limit inter-story noise disputes [16]. Since PS-HCS elements are produced by simultaneously pouring high-strength, low-slump concrete without formwork or compaction, shear reinforcement distribution is difficult. Therefore, it is essential to check the structural performance to avoid shear failure before flexural failure. In addition, the deformation of floors due to lateral loads caused by earthquakes must be considered [17]. The study found that the evaluation of horizontal shear strength during push-off tests is significantly affected by orientation, lattice, and interface roughness, with manufacturing method and interface roughness acting as variables [18]. Previous research on shear friction has been studied and used for comparison, and the need to consider the shrinkage and stiffness of the reinforced concrete–concrete interface has been emphasized while analyzing the primary factors affecting the interface [19]. Previous studies have mainly focused on the shear capacity of HCS with synthetic topping concrete and boundary roughness. However, research is lacking on the flexural behavior of PS-HCSs with composite sections and synthetic topping concrete. Previous studies have developed a finite element model to predict the stress distribution and crack pattern of slabs by conducting experiments with a height of 500 mm [20]. In addition, previous studies have proposed a joint slab consisting of PHC slabs and RC slabs with high-strength tendons for economical and rapid construction [21]. Additionally, previous studies have developed a machine learning model to evaluate the slip of HCS [22].
In this study, a full-size PS-HCS with a section height (h) of 350 mm is evaluated against flexural behavior. Shear reinforcement bars were strategically placed at both ends of a 1 m section to prevent failure of the reinforced concrete due to interfacial adhesion. The flexural test was conducted with and without the inclusion of reinforced concrete as a variable. To confirm the achievement of the required structural performance, the experimental results were compared with the results predicted by the design criteria.
Research Significance
HCS is an off-site construction method (OSC) that produces members in a factory and assembles them on site, and compared to general reinforced concrete, it is an effective construction technology for preventing global warming by minimizing CO2 generation through air shortening and easy site management.
For this purpose, both the material and production of HCS members need to be evaluated by systematic management, and the method for evaluating the bending capacity of these members needs to be improved. In this paper, the strain distribution of various load levels based on the maximum load along the depth in the center section of the HCS was evaluated by applying the strain fit condition.
The design values of the strength of prestressed hollow slabs are based on two failure mechanisms: bending and shear. However, the boundary between these two mechanisms is not always clear, and it is common in laboratory results for HCS to fail due to the bending–shear mechanism. Since HCS is composed of high-strength concrete with a low slump that is compacted simultaneously with pouring without formwork and the members are extruded and molded, a structural performance review is required to ensure that shear failure does not precede.
In general, when applied to a structure, reinforced concrete is poured on the site to secure continuity between slabs at the end so that the entire floor can act as a diaphragm, and it is important to evaluate the bending performance by securing the horizontal shear strength between the joint surfaces for the integrated behavior of HCS and reinforced concrete.
This can help to ensure the safety of structures using HCS. By understanding the flexural strength and stiffness of HCS, engineers and researchers can design HCS structures with stable flexural behavior. In addition, evaluating the flexural performance of HCS can help improve the efficiency of precast prestressed members, which can lead to material savings and improved constructability. It is possible to evaluate the factors that can affect the flexural performance of HCS by preventing brittle failure of the member according to the cross-sectional characteristics and loading conditions through an HCS flexural performance evaluation.
2. Major Structural Design Criteria of PS-HCS
Flexural Strength
KDS 14 20 20 [23] and ACI 318-19 [24] use assumptions and conditions for the analysis and design of deflections based on the grades of prestressed concrete members, as shown in Table 1. The properties of PS-HCS are used here to represent the deflection design of cracked members.
The deflection design of cracked prestressed concrete members is similar to the deflection design of reinforced concrete members because there is a section stress limit condition for the initial load but not for the ultimate load; so, members can be designed based on the limit condition of the initial load and also based on the strength design method for the ultimate stress. In addition, KDS 14 20 20 and ACI 318-19 specify that the crack resistance should be at least 1.2 times the crack moment, as shown in Equation 1, so that the member does not fail immediately after cracking but can cause ductile failure after receiving a certain amount of additional load.
The cracking moment (Mcr) can be found using Equation (2) as follows:
where is the flexural cracking strength of concrete and 0.63√(), is the section modulus from the neutral axis of the section to the bottom surface of the section, is the effective tension of the prestressing material, is the radius of gyration of the area, is the distance from the neutral axis of the section to the bottom surface of the section, and is the distance from the neutral axis of the section to the center of the prestressing member.
The flexural strength of prestressed concrete members can be accurately calculated using a material mechanism based on the appropriate deformation conditions. However, unlike the calculation of the flexural strength of reinforced concrete members, the calculation of the stress of high-strength PS steel () is not easy. Therefore, in the concrete structure standard, when calculating the flexural strength, the yield strength of PS steel () is not used to calculate the flexural strength; rather, the stress of PS steel at failure () is used to calculate the flexural strength.
The flexural strength of a prestressed concrete member can be calculated in two ways, depending on how the stress in PS steel () is calculated.
if the material mechanism is used.
is calculated using the stress in PS steel () in the reinforcement.
when the stress in the PS steel of the member with the attached tensioner () is calculated using Equation (3).
where is the stress in the PS steel, is the tensile strength of the PS steel, is the equivalent stress block factor, is the ratio of PS steel (), is the steel index of tensile reinforcement, () is the steel index of the compression bar (), is the ratio of tensile reinforcement (), is the ratio of the compressed rebar (), is the cross-sectional area of PS steel, is the cross-sectional area of the tensile reinforcement, is the cross-sectional area of the compressive reinforcement, is the compressive strength of concrete, is the width of the member, is the distance from the compression podium to the center of the PS steel section, is the distance from the compression podium to the center of the tensile reinforcement section, and is the coefficient according to the type of PS steel ( in the case of ; in the case of ; and for ).
If compressed rebar is considered in the calculation, the value of must be greater than or equal to 0.17; the value of (the distance from the compression podium to the cross-sectional center of the compression bar) should not be less than . For , the PS steel stress in the member with non-attached tensioning () is equal to Equations (4) and (5).
where is the yield strength () or less, Equation (4) is or less, and Equation (5) is .
Stress in PS steel () can be obtained using Equations (3)–(5), as shown earlier, and the depth of the equivalent stress block () and the depth of the neutral shaft () can be obtained by the force equilibrium condition shown in Equations (6) and (7).
The assumption of tensile reinforcement strain can be verified by the deformation fit condition, as shown in the following equation:
where is the strain in the tensile reinforcement and is the strain in the concrete.
Based on the above process, the design flexural strength of a prestressed concrete member can be calculated as shown in Equation (9).
where is the stress in the PS steel, is the yield strength of the tensile reinforcement, is the cross-sectional area of the PS steel, is the cross-sectional area of the tensile reinforcement, is the distance from the compression podium to the center of the PS steel section, is the distance from the compression podium to the center of the tensile steel section, and is the depth of the equivalent stress block.
3. Test Program
3.1. Materials
To evaluate the flexural performance of PS-HCSs, the compressive strengths of the concrete used to fabricate the specimens were designed to be 49 MPa and 27 MPa, respectively; the concrete mix design is shown in Table 2. To evaluate the compressive strength of the concrete, three φ100 mm × 200 mm cylinder specimens were fabricated according to ISO 1920-3:2019 [27], and the compressive strength of the concrete was evaluated according to ISO 1920-4:2020 [28].
A compressive strength evaluation of the specimens was performed immediately after the PS-HCS test; the compressive strength of the concrete averaged 57.6 MPa for the PS-HCS members and 30.5 MPa for the reinforced concrete, as shown in Table 3. The stress–strain relationship of the concrete, shown in Figure 1, was measured during the compressive strength test using concrete strain gauges attached to the longitudinal and transverse sides of the specimen.
The prestressed concrete tendon used to evaluate the flexural performance of PS-HCS was SWPC 7B, with values of φ of 12.7 mm and 9.5 mm, and the physical properties are Young’s modulus (Eps = 196 GPa), yield strength (fpy = 1581 MPa), yield strain (εpy = 0.0062 mm/mm), tensile strength (fpu = 1860 MPa), and tensile strain (εpu = 0.0800 mm/mm). The stress–strain relationship is shown in Figure 2.
3.2. Design of Specimens
Specimens were selected to evaluate the flexural performance of PS-HCSs subjected to static moments. There were six specimens in total; As Figure 3 the total height of the slab section was 350 mm, and the width was 1200 mm. The thickness of the topping concrete was planned to be 120mm. All specimens had the same length of 7000 mm. The shear span ratio (a/d) of the specimens was designed to be 7.2 for the non-composite specimens and 10.0 for the composite specimens, depending on the effective depth of the member to induce flexural failure.
In the specimen names shown in Table 4, F is the flexural specimen, N is the non-topping concrete HCS specimen, and R is the synthetic topping concrete reinforced specimen. In order to plan the integration of the HCS, synthetic topping concrete was applied to a rough surface on the top of the specimen. The prestressed tendon used to fabricate the specimen was SWPC 7BL, with 10-φ12.7 mm in the lower part and 2-φ9.5 mm in the upper reinforcement.
3.3. Test Setup
The experiment was conducted using a structure testing machine (Smart Natural Space Research Center at Kongju National University Republic of Korea). The test specimen was subjected to a four-point loading in the form of a simple support beam using a universal testing machine (UTM) with a capacity of 3000 kN, as shown in Figure 4. The load was applied continuously at a rate of 0.05 mm/s by a displacement control method; the flexural performance evaluation test was performed until the load decreased after the maximum load.
The deflection of the specimen due to the applied loading was measured by installing two LVDTs at the bottom of the center section between the applied loading points where the maximum deformation occurs, as shown in Figure 4a.
Strain gauges were installed at the top of the concrete and prestressing tendon of the test case between the points of loading and at a point 30 mm below the top; the strains of the prestressed concrete tendon and concrete were measured using the compatibility condition of the strain in the one-way slab.
4. Results and Discussion
4.1. Load–Displacement Relationship
The load–deflection relationship of the PS-HCS specimen is shown in Figure 4. The load on the specimen was measured using a load cell attached to the UTM; the deflection was measured using the displacement from the LVDT installed at the bottom of the center of the specimen.
As shown in Figure 5 and Figure 6, the flexural behavior of the non-synthetic topping and synthetic topping specimens was linear until the initial flexural crack occurred. After the flexural crack occurred, the flexural behavior was linear with the increasing load, but the flexural stiffness was lower than that of the initial flexural crack, showing typical flexural failure behavior. The experimental results of the PS-HCS specimens are shown in Table 5. The initial flexural crack of the non-synthetic topping concrete specimen, FN, occurred at an average of 176.7 kN with an average deflection of 10.9 mm. The maximum load was 320.6 kN on average, and the deflection was 110.8 mm.
The RCF specimens reinforced with synthetic topping concrete on PS-HCS had an average initial flexural crack of 229.3 kN and a deflection of 7.0 mm. Compared to those of the non-synthetic topping concrete specimen, those predicted by the cracking load and initial stiffness increased due to the increase in the cross-sectional area with the thickness. The maximum loads were about 1.4 times higher than those of the unreinforced FN specimens, showing values of 451.4 kN, 453.8 kN, and 449.8 kN, respectively; the deflections at the maximum load were 80.1 mm, 75.1 mm, and 78.4 mm, respectively.
4.2. Crack Pattern
The crack behavior of the PS-HCS specimen is shown in Figure 7. Flexural cracks occurred in the tensile region between the tension points of the specimen at the beginning of the prestressing; as the load increased, the cracks grew significantly into the compression synthetic topping concrete and progressed to both ends of the test section. As shown in Table 5, flexural cracks occurred at a high load capacity, with an average load in a range from 176.7 kN to 242.1 kN due to the introduction of prestressing; after maximum loading, the non-topping concrete specimen FN failed due to the concrete crushing of the compression. For the composite specimens, the RCF cracks in the compression topping concrete progressed only to the interface between the HCS member and the infill concrete.
4.3. Flexural Strength
The experimental flexural results and predicted flexural strength of the PS-HCS specimens are shown in Table 6. Experimental moments were obtained using the load measured by the load cell attached to the UTM; the ultimate flexural strength was expressed by applying Equations (2) and (9) from the major structural design criteria of PS-HCS. In addition, the deflection at the time of the flexural crack and the displacement at the time of the ultimate load were measured by the LVDT attached to the bottom of the specimen.
Comparing the experimental results of the load at the flexural crack to those predicted by KDS 14 20 20, the FN specimens with non-synthetic topping sections showed an average value of 179.2 kN; the ratio of this value in the experimental results to that in the analytical results at cracking was 0.99 on average, as shown in Table 5. The experimental results of the RCF specimens with a composite cross section showed an average maximum load value of 229.3 kN; the experimental results for the load at flexural cracking had an average of 0.83.
As shown in Table 6, for the FN specimen with a non-synthetic topping cross section, the experimental results showed an average load value of 323.8 kN; the analytical result value averaged 317.4 kN, indicating a ratio of 1.02. For the RCF specimen with a synthetic topping section, the experimental result value was 451.7 kN, and the analytical result value was 426.0 kN, showing an average ratio of 1.06.
Regarding the flexural strength, regardless of the use of synthetic topping or non-synthetic topping sections in the PS-HCS specimens, the flexural strength at the time of flexural cracking is 0.78–1.02 on average, and the nominal flexural strength (Mn) is 1.00–1.07 on average, indicating that the flexural strength of KDS 14 20 20 is satisfied in all specimens. In addition, the experimental flexural cracking strength and ultimate strength are 1.81–1.97 times higher on average, showing that the cracking moment of KDS 14 20 20 is at least 1.2 times higher than the cracking moment required for flexural failure.
4.4. Strain Distribution
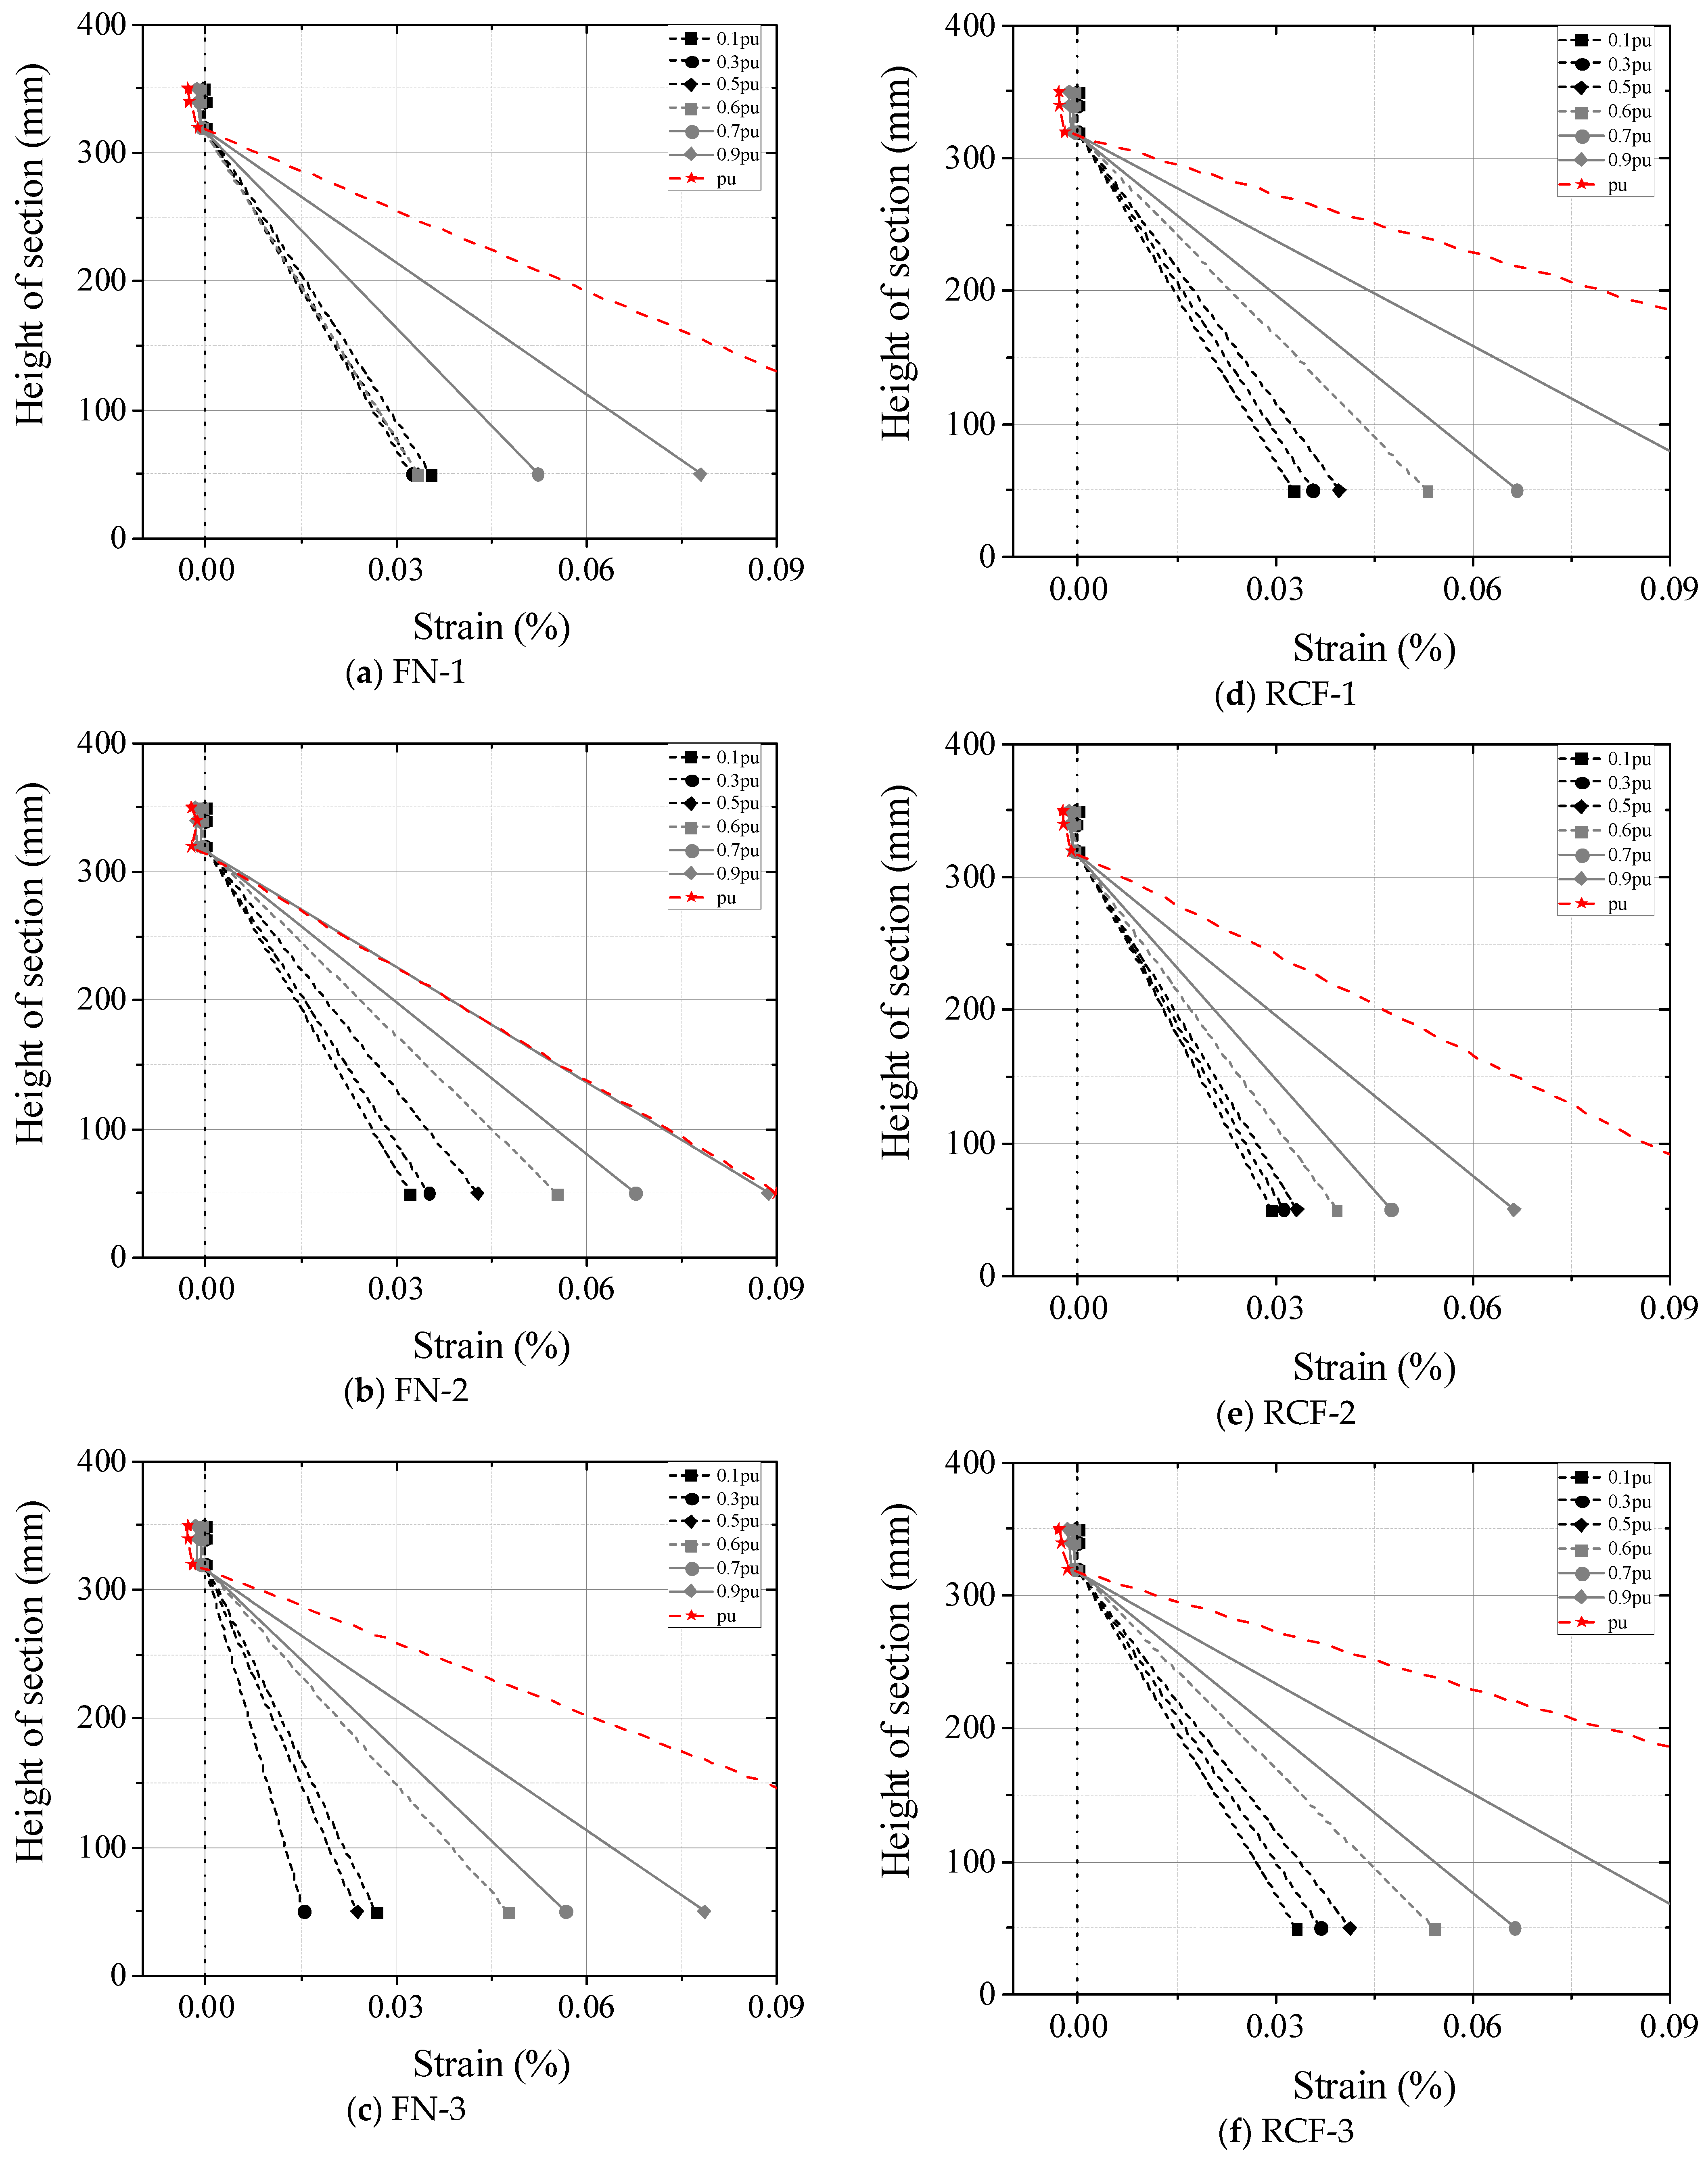
Figure 8 shows the strain distributions at different load levels based on the maximum load as a function of depth in the center section of the HCS. The strain distribution is derived from the strain gauge values attached to the concrete, compression tendons, and tension tendons on the y-axis. On the x-axis, positive strain values represent the tensile strain of the tensile reinforcement, and negative strain values represent the compressive strain of the concrete and tendons in the compression zone.
For all specimens, strain distributions of the reinforcement and concrete exhibited linear, uniform behavior until the tensile reinforcement yielded. The concrete compressive strains at the time of maximum load for the experiments were −0.0027, −0.0024, −0.0023, −0.0029, 0.0027, and −0.003, respectively, while the concrete failure strain did not reach 0.0033. As shown in Figure 8, the strain distributions of all specimens varied in the same proportion as the strain of the tensile reinforcement up to the 50% level (0.5) of the ultimate load, indicating the integrated behavior of the reinforced concrete and the member. Then, from the 60% level (0.6) of the ultimate load, the strain distribution began to show a strain distribution decrease below the strain of the tensile reinforcement. At ultimate load, all specimens had a tendon strain greater than 0.1, confirming the experimental results.
5. Conclusions
In this study, the flexural performance of PS hollow concrete slabs (HCSs) produced by extrusion molding was evaluated with or without synthetic topping concrete, and the following conclusions were drawn:
(1) The evaluation of the flexural performance of PS hollow concrete slabs (HCSs) showed that both composite and non-composite sections exhibited ductile flexural behavior up to the ultimate load; the stiffness increased due to the influence of the reinforcing concrete.
(2) Regarding the flexural strength, regardless of the use of synthetic topping or non-synthetic topping sections in the PS-HCS specimens, flexural strength at the time of flexural cracking is 0.78–1.02 on average, and the nominal flexural strength (Mn) is 1.00–1.07 on average, indicating that the flexural strength of KDS 14 20 20 is satisfied in all specimens. In addition, the experimental flexural cracking strength and ultimate strength are 1.81–1.97 times higher on average, showing that the cracking moment of KDS 14 20 20 is at least 1.2 times higher than the cracking moment required for flexural failure.
(3) HCS showed ductile flexural behavior up to the maximum load, regardless of the section height or the presence or absence of reinforced concrete; compared to HCS, the composite HCS showed a significant increase in flexural stiffness due to the presence of reinforced concrete, which tended to decrease with the increasing load while the deflection increased.
(4) The strain distributions of all specimens varied at the same rate as the strain of the tensile reinforcement up to the 50% level of maximum load (0.5); then, from the 60% level of maximum load (0.6), the strain distributions became lower than the strain of the tensile reinforcement, confirming the consolidation behavior of reinforced concrete and HCS.
Author Contributions
Conceptualization, K.-H.K. and H.-G.K.; data curation, D.-H.K. and M.-S.J.; formal analysis, M.-J.K. and Y.-J.Y.; funding acquisition, K.-H.K.; investigation, D.-H.K. and M.-S.J.; methodology, H.-G.K.; project administration, K.-H.K. and D.-H.K.; supervision, K.-H.K.; visualization, D.-H.K.; writing—original draft, D.-H.K.; writing—review and editing, K.-H.K. and H.-G.K. All authors have read and agreed to the published version of the manuscript.
Funding
This research was supported by the Basic Science Research Program through the National Research Foundation of Korea (NRF), funded by the Ministry of Education (2019R1A6A1A03032988) and (2021R1I1A1A010472611). This research was supported by the Korea Basic Science Institute (National Research Facilities and Equipment Center) grant funded by the Ministry of Education (2022R1A6C101A741). This research was supported by the Korea Basic Science Institute (National Research Facilities and Equipment Center) grant funded by the Ministry of Education (2022R1A6C102A907). This work was also supported by the National Research Foundation of Korea (NRF) grant funded by the Korea government (MSIT) (2023R1A2C3002443).
Data Availability Statement
The data presented in this study are available upon request from the corresponding author. The data are not publicly available due to privacy.
Acknowledgments
This research was conducted with experimental support from Hansung PCC.
Conflicts of Interest
Author Yeo-Jin Yoon was employed by the company Hansung PCC. The remaining authors declare that the research was conducted in the absence of any commercial or financial relationships that could be construed as a potential conflict of interest.
Nomenclature
| Mu | Ultimate flexural strength of HCS |
| Mn | Nominal flexural strength of HCS |
| Mcr | Flexural crack strength of HCS |
| fr | Flexural crack strength of concrete |
| Compressive strength of concrete | |
| Sb | Section modulus from the neutral axis to the bottom of the section |
| Pe | Effective tension of tension material |
| a | Depth of equivalent stress block |
| As | Cross-sectional area of tension reinforcement |
| e | Distance from the neutral axis of the section to the center of the tendon |
| fps | Tensile strength of tension tendon |
| fpu | Yield tensile strength of tension tendon |
| Coefficient according to the type of tendon | |
| Diameter of transverse bar between centers | |
| rc | Section secondary radius |
| Distance from the compression edge to the center of the tension bar cross section | |
| Distance from the compressed edge to the center of the tension member | |
| Steel index of tensile rebar | |
| Steel index of compressed rebar | |
| fy | Yield strength of logitudinal rebar |
References
- Lee, Y.J.; Kim, H.K.; Kim, M.J.; Kim, D.H.; Kim, K.H. Shear Performance for Prestressed Concrete Hollow Core Slabs. Appl. Sci. 2020, 10, 1636. [Google Scholar] [CrossRef]
- Becker, R.J.; Buettner, D.R. Shear tests of extruded hollow-core slabs. PCI J. 1985, 30, 40–54. [Google Scholar] [CrossRef]
- Hawkins, N.M.; Ghosh, S.K. Shear strength of hollow-core slabs. PCI J. 2006, 51, 110–114. [Google Scholar]
- Pajari, M. Web shear failure in prestressed hollow core slabs. J. Struct. Eng. 2009, 42, 83–104. [Google Scholar]
- Palmer, K.D.; Schultz, A.E. Factors affecting web-shear capacity of deep hollow-core units. PCI J. 2010, 55, 123–146. [Google Scholar] [CrossRef]
- Palmer, K.D.; Schultz, A.E. Experimental investigation of the web-shear strength of deep hollow-core units. PCI J. 2011, 56, 83–104. [Google Scholar] [CrossRef]
- Lee, Y.J.; Kim, H.K.; Kim, M.J.; Lee, J.S.; Kim, K.H. Evaluation of structural performance for prestressed concrete hollow core slabs. J. Korea Concr. Inst. 2019, 31, 505–512. (In Korean) [Google Scholar] [CrossRef]
- Ueda, T.; Stitmannaithum, B. Shear Strength of Precast Prestressed Hollow Slabs with Concrete Topping. ACI Struct. J. 1991, 88, 402–410. [Google Scholar]
- Pajari, M. Resistance of Prestressed Hollow Core Slabs Against Web Shear Failure; Technical Research Centre of Finland (VTT): Espoo, Finland, 2005. [Google Scholar]
- Walraven, J.C.; Mercx, W.P.M. The bearing capacity of prestressed hollow-core slabs. Heron 1983, 28, 1–46. [Google Scholar]
- TNO Building and Constructions Research. TNO Report: Standard Shear Tests on Prestressed Hollow Core Slabs According to EN 1168; TNO Building and Constructions Research: Hague, The Netherlands, 2005. [Google Scholar]
- Bertagnoli, G.; Mancini, G. Failure analysis of hollow-core slabs tested in shear. Struct. Concr. 2009, 10, 139–152. [Google Scholar] [CrossRef]
- Celal, M.S. Shear Behavior of Precast/Prestressed Hollow-Core Slabs. Master’s Thesis, University of Manitoba, Winnipeg, MB, Canada, 2011. [Google Scholar]
- Park, M.K.; Lee, D.H.; Han, S.J.; Kim, K.S. Web-shear capacity of thick precast prestressed hollow-core slab units produced by extrusion method. Int. J. Concr. Struct. Mater. 2019, 13, 19–32. [Google Scholar] [CrossRef]
- Lee, D.; Park, M.-K.; Joo, H.-E.; Han, S.-J.; Kim, K.S. Strengths of Thick Prestressed Precast Hollow-Core Slab Members Strengthened In Shear. ACI Struct. J. 2020, 117, 129–140. [Google Scholar]
- Imjai, T.; Suthiprabha, S.; Figueiredo, F.P.; Garcia, R. Strengthening of Hollow Core Slabs to Reduce Excessive Vibrations: A Case Study. In Proceedings of the 3rd RILEM Spring Convention and Conference, Guimarães, Portugal, 10–14 March 2020; pp. 309–319. [Google Scholar]
- Structural Engineering Society of New Zealand; New Zealand Society for Earthquake Engineering; New Zealand Concrete Society. Seismic Performance of Hollow Core Floor Systems, Guidelines for Design Assessment and Retrofit; Department of Building and Housing: Wellington, New Zealand, 2009; pp. 1–173.
- Mones, R.M.; Breña, S.F. Hollow-core slabs with cast-in-place concrete toppings: A study of interfacial shear strength. PCI J. 2013, 58, 124–141. [Google Scholar] [CrossRef]
- Santos, A.P.; Ferreira, M.A.; Carvalho, R.C.; Pinheiro, L.M. Determination of reinforcing bars for tests of hollow core slabs with continuity. Rev. IBRACON Estrut. Mater. 2013, 6, 903–932. [Google Scholar] [CrossRef]
- Michelini, E.; Bernardi, P.; Cerioni, R.; Belletti, B. Experimental and Numerical Assessment of Flexural and Shear Behavior of Precast Prestressed Deep Hollow-Core Slabs. Int. J. Concr. Struct. Mater. 2020, 14, 31. [Google Scholar] [CrossRef]
- Zhang, H.; Huang, W.; Liu, B.; Han, C.; Li, Q.; Chen, C. Flexural behavior of precast concrete hollow-core slabs with high-strength tendons. J. Build Eng. 2022, 59, 105050. [Google Scholar] [CrossRef]
- Haruna, S.I.; Ibrahim, Y.E.; Adamu, M.; Ahmed, O.S. Determination of Final Strand Slips of Prestressed Precast Hollow-Core Slabs Subjected to Flexural Load Using Machine Learning Algorithms. Buildings 2023, 13, 2013. [Google Scholar] [CrossRef]
- MOLIT. Design Code for Concrete Structural Flexural and Compression (KDS 14 20 20); Ministry of Land, Infrastructure and Transport, MOLIT: Sejong, Republic of Korea, 2022. (In Korean)
- ACI Committee 318. Building Code Requirements for Structural Concrete (ACI 318-19) and Commentary (ACI 318R-19); American Concrete Institute (ACI): Farmington Hills, MI, USA, 2019; 623p. [Google Scholar]
- MOLIT. Design Code for Composite Concrete Structures (KDS 14 20 66); Ministry of Land, Infrastructure and Transport (MOLIT): Sejong, Republic of Korea, 2021. (In Korean)
- PCI Industry Handbook Committee. PCI Design HandBook: Precast and Prestressed Concrete, 8th ed.; Precast/Prestressed Concrete Institute (PCI): Chicago, IL, USA, 2017. [Google Scholar]
- ISO 1920-3; Testing of Concrete-Part 3: Making and Curing Test Specimens. International Organization for Standardization: Geneva, Switzerland, 2019.
- ISO 1920-4; Testing of Concrete-Part 4: Strength of Hardened Concrete. International Organization for Standardization: Geneva, Switzerland, 2020.
Figure 1.
Concrete strain–stress relationship.

Figure 2.
Tendon strain–stress relationship.
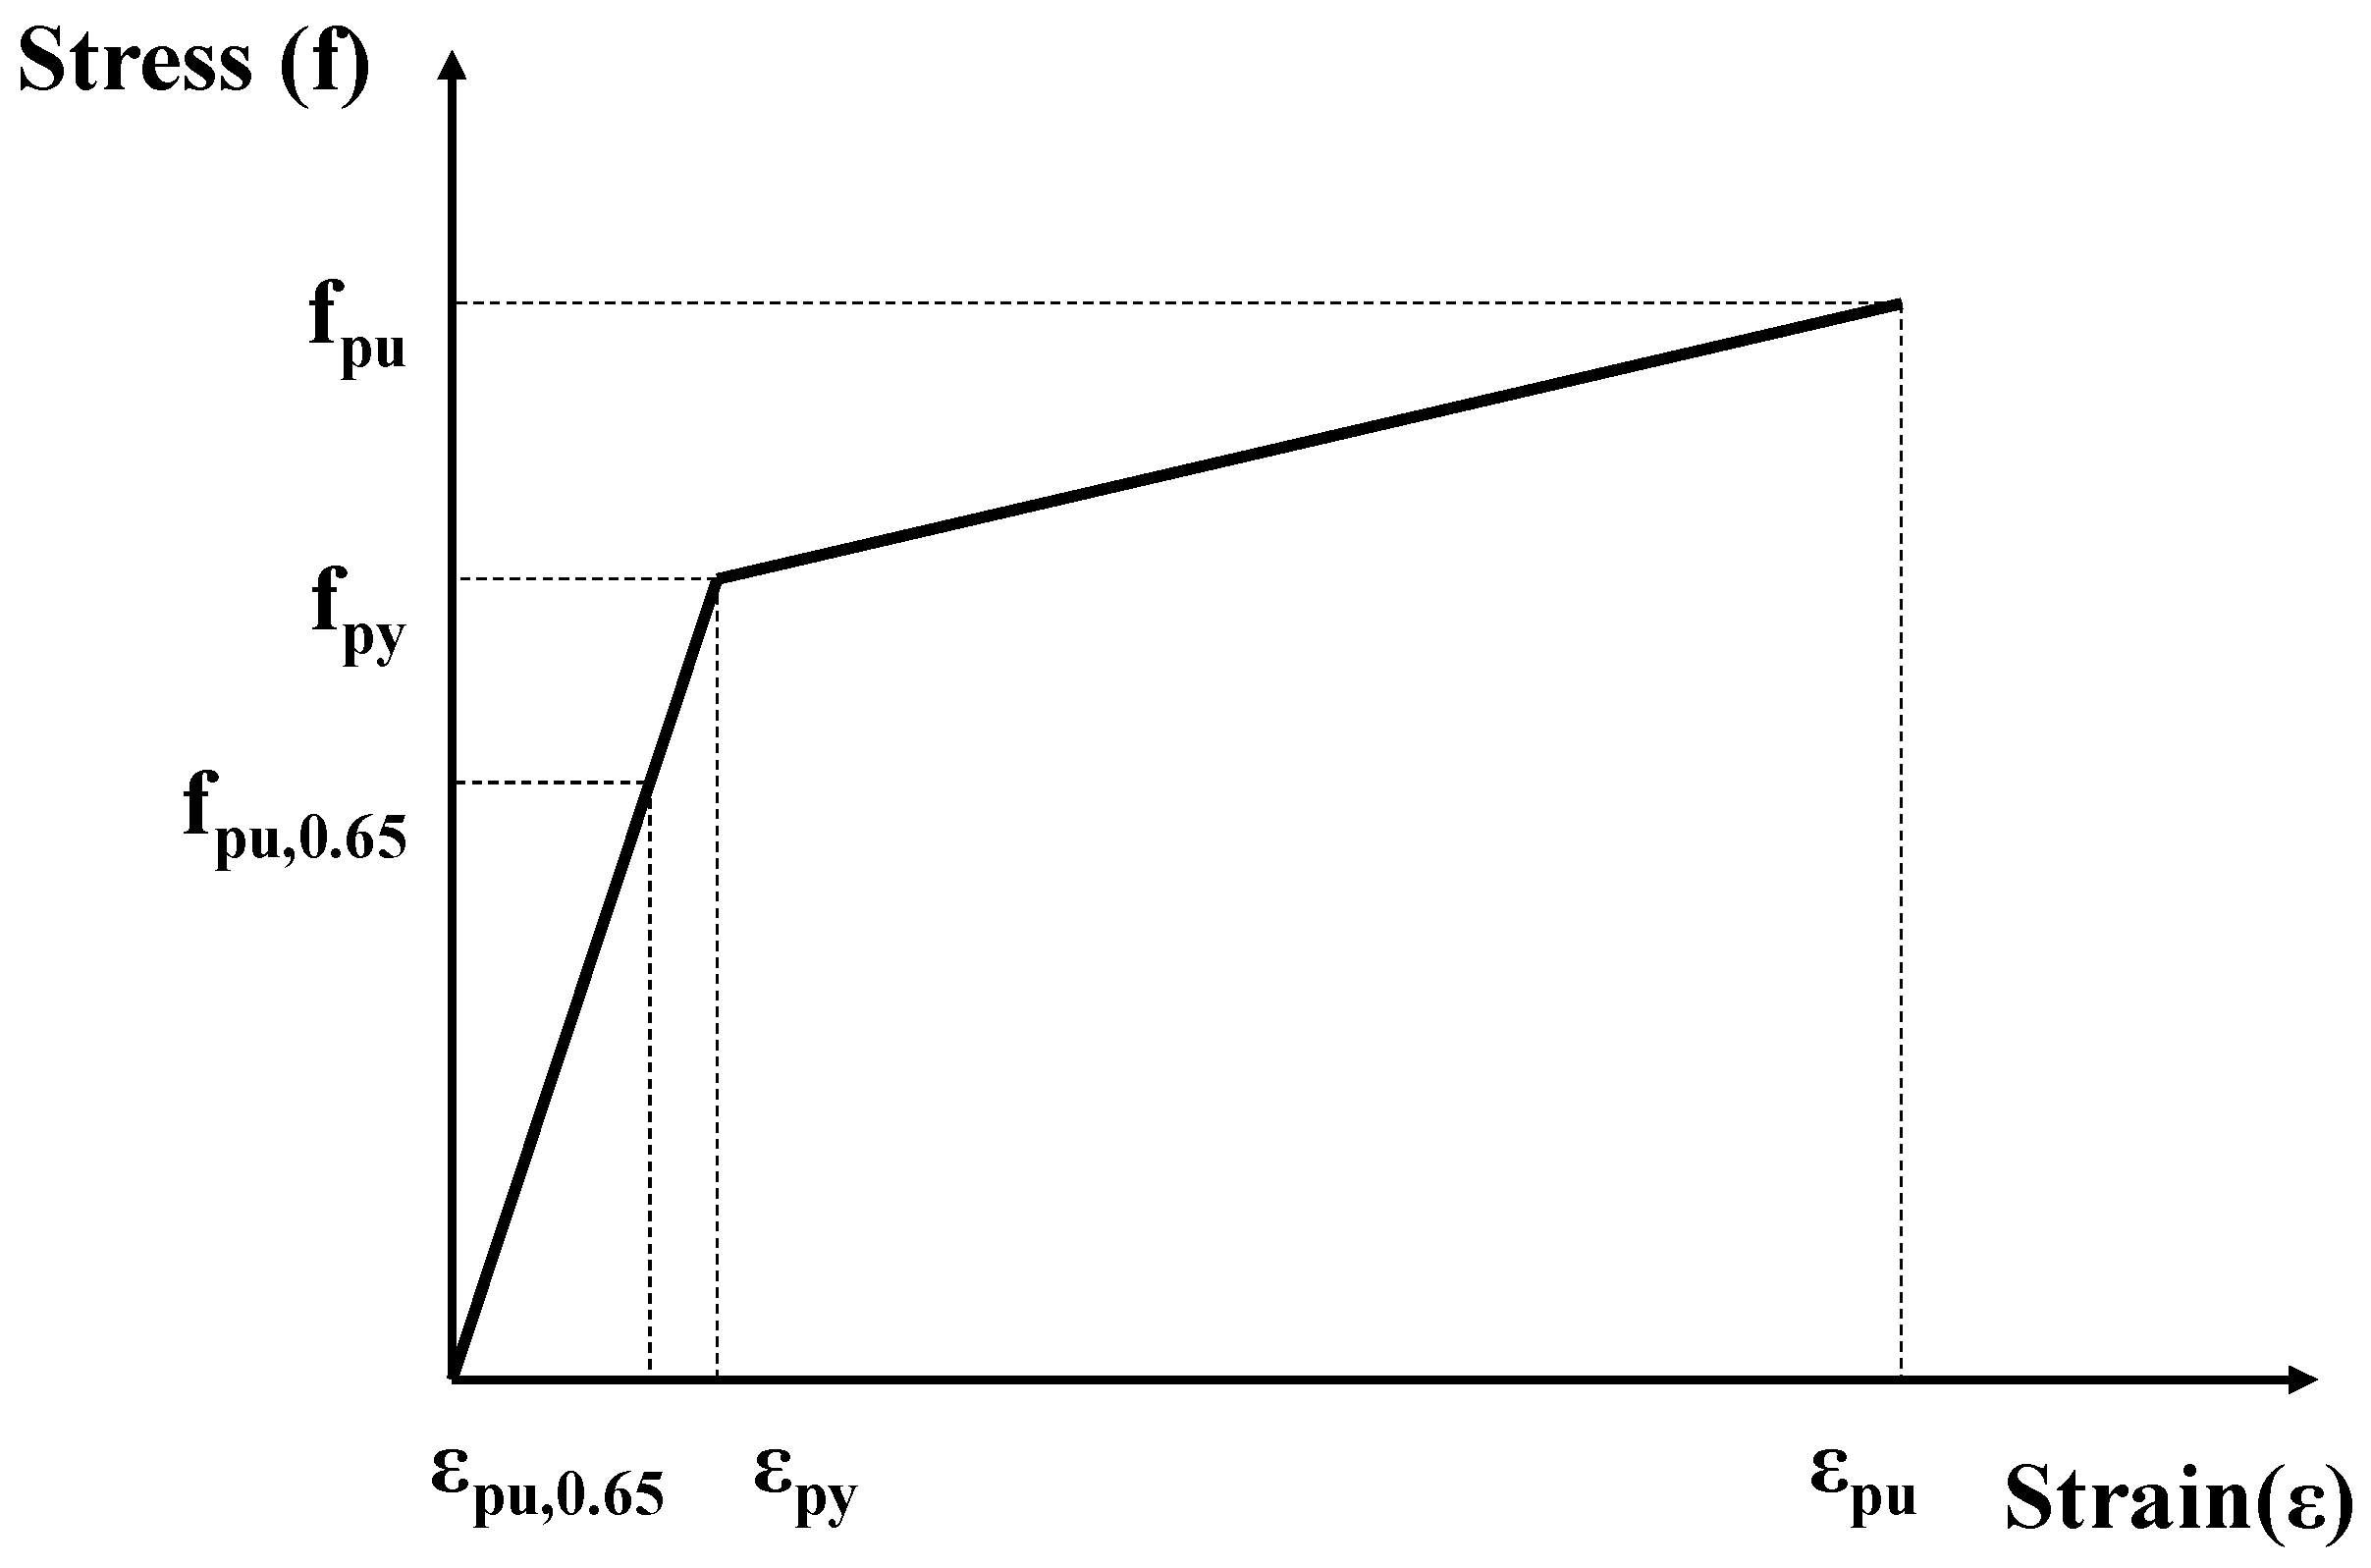
Figure 3.
Detail of specimens (unit: mm).
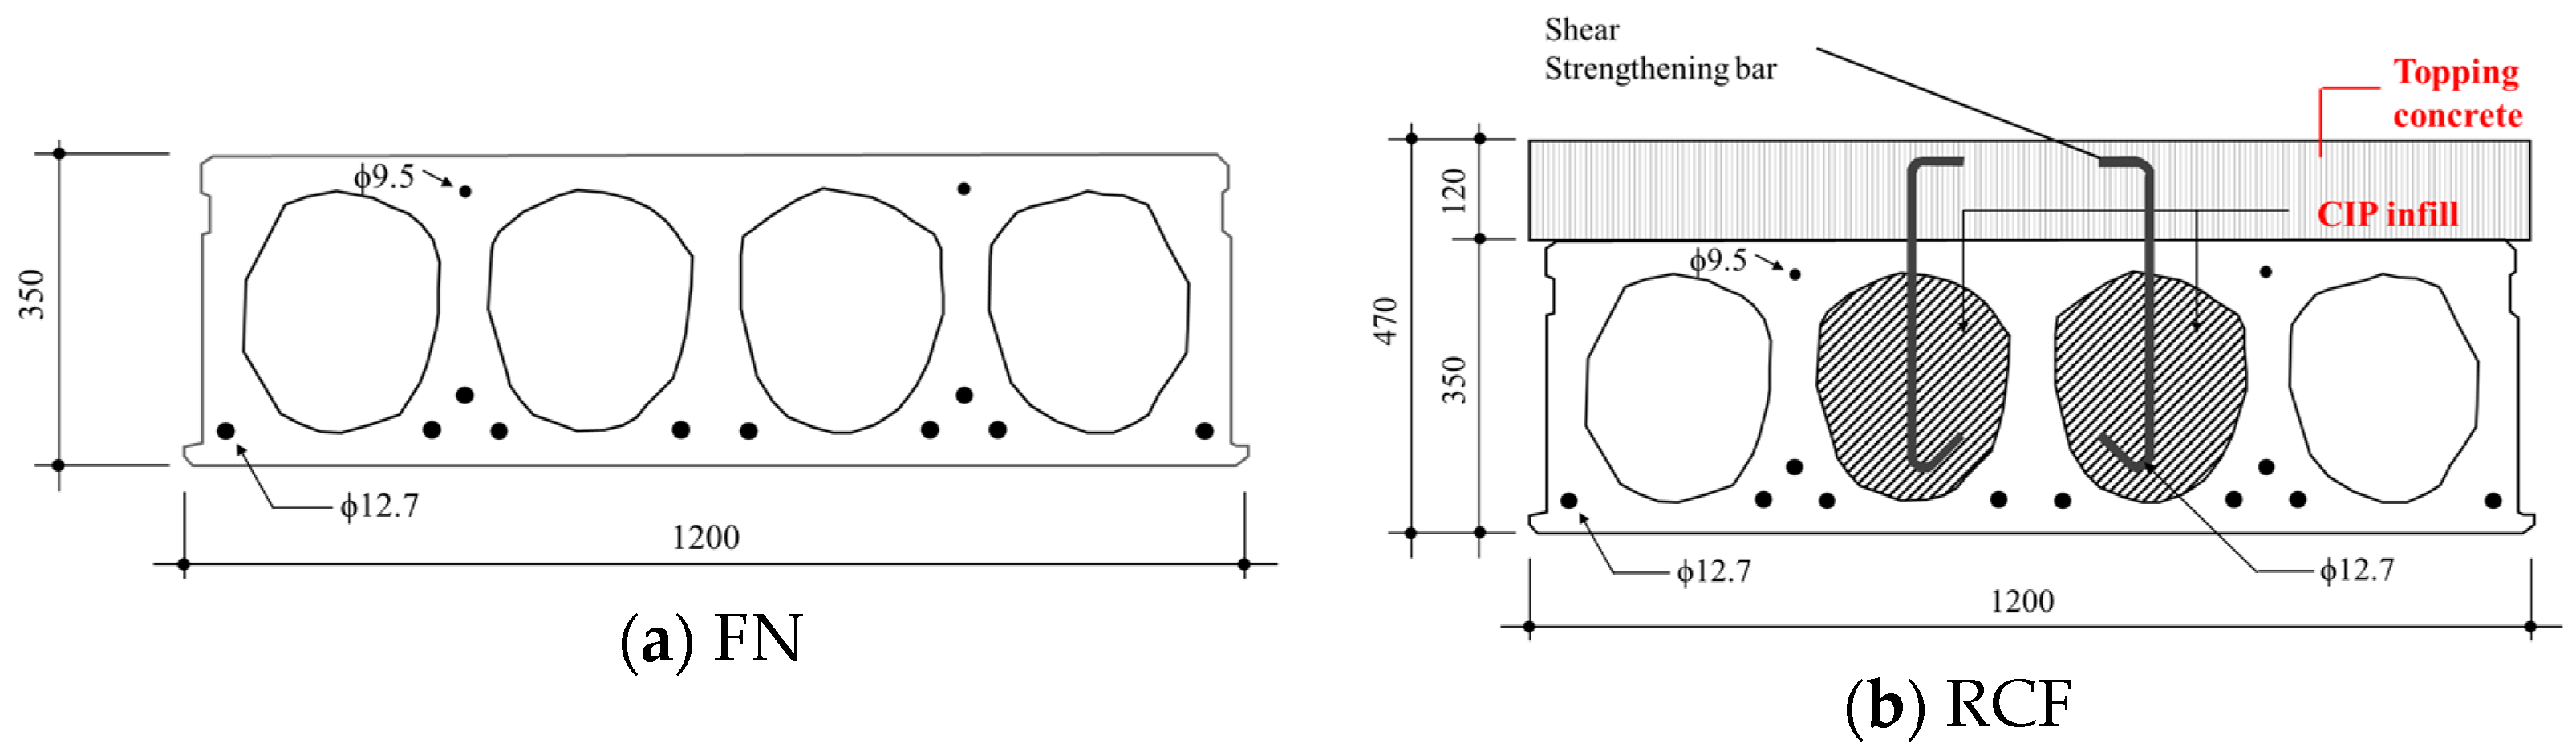
Figure 4.
Test setup (unit: mm).

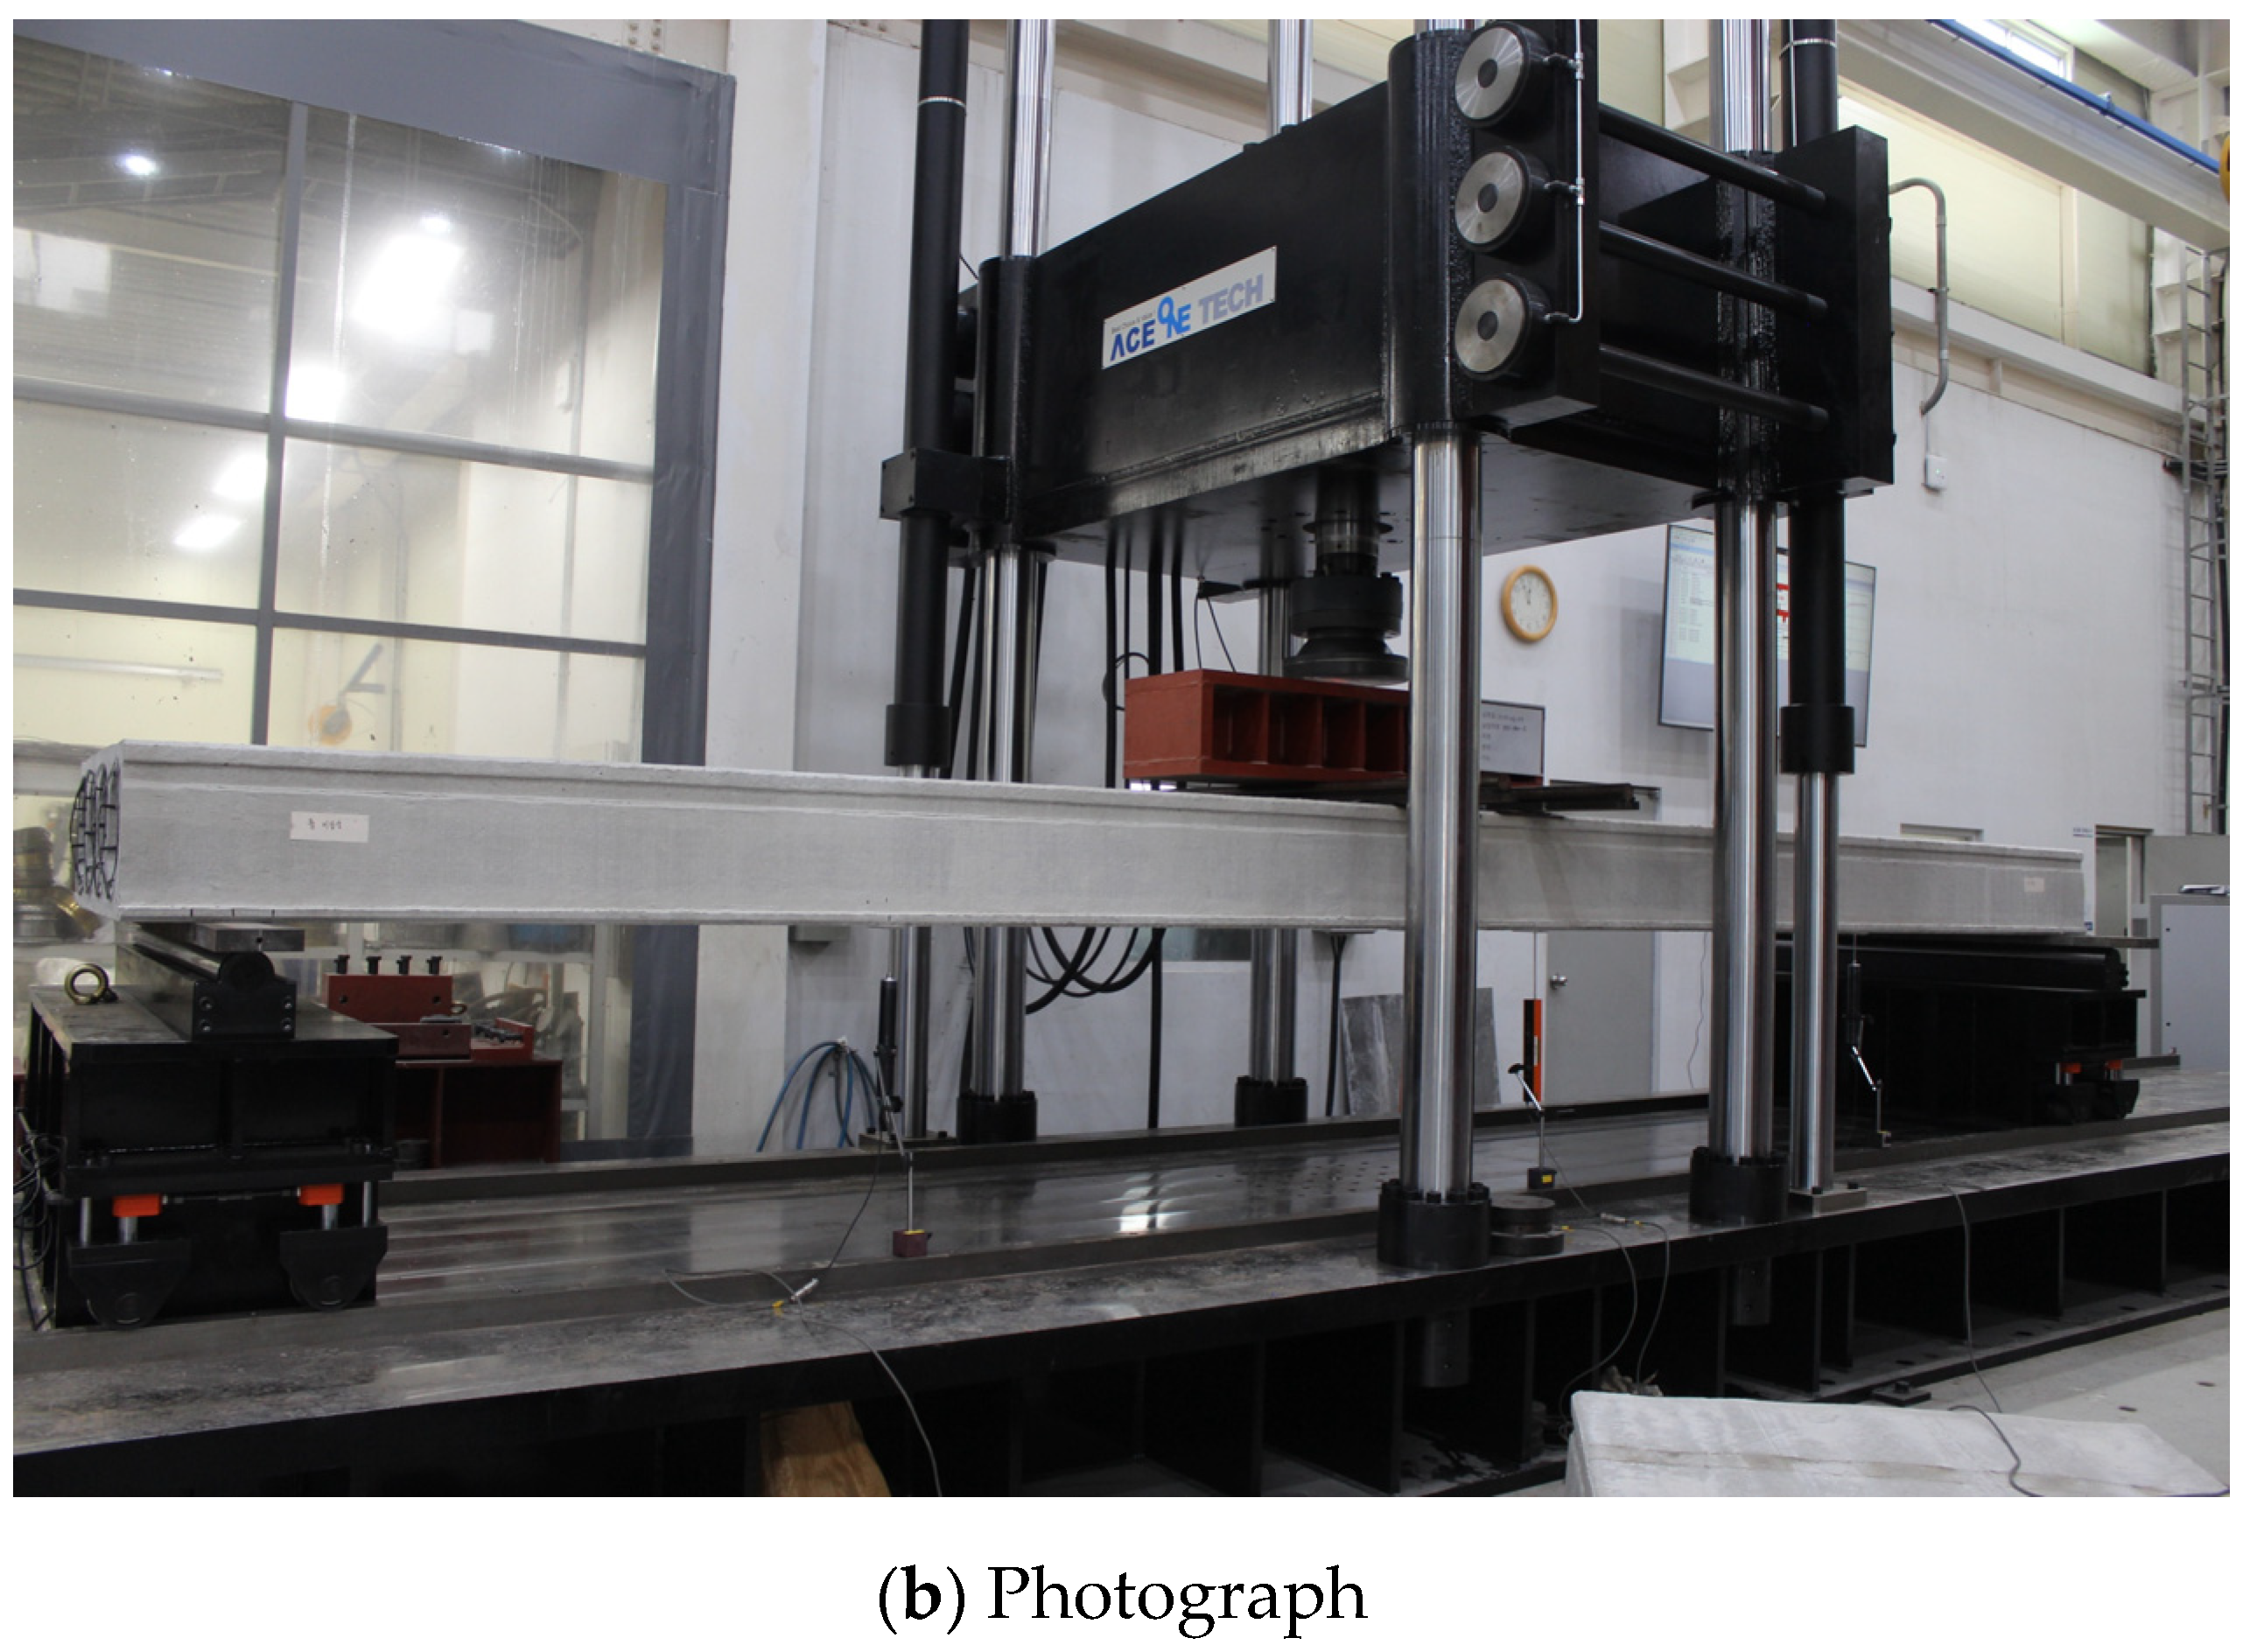
Figure 5.
Load–displacement relationship of FN series.

Figure 6.
Load–displacement relationship of RCF series.
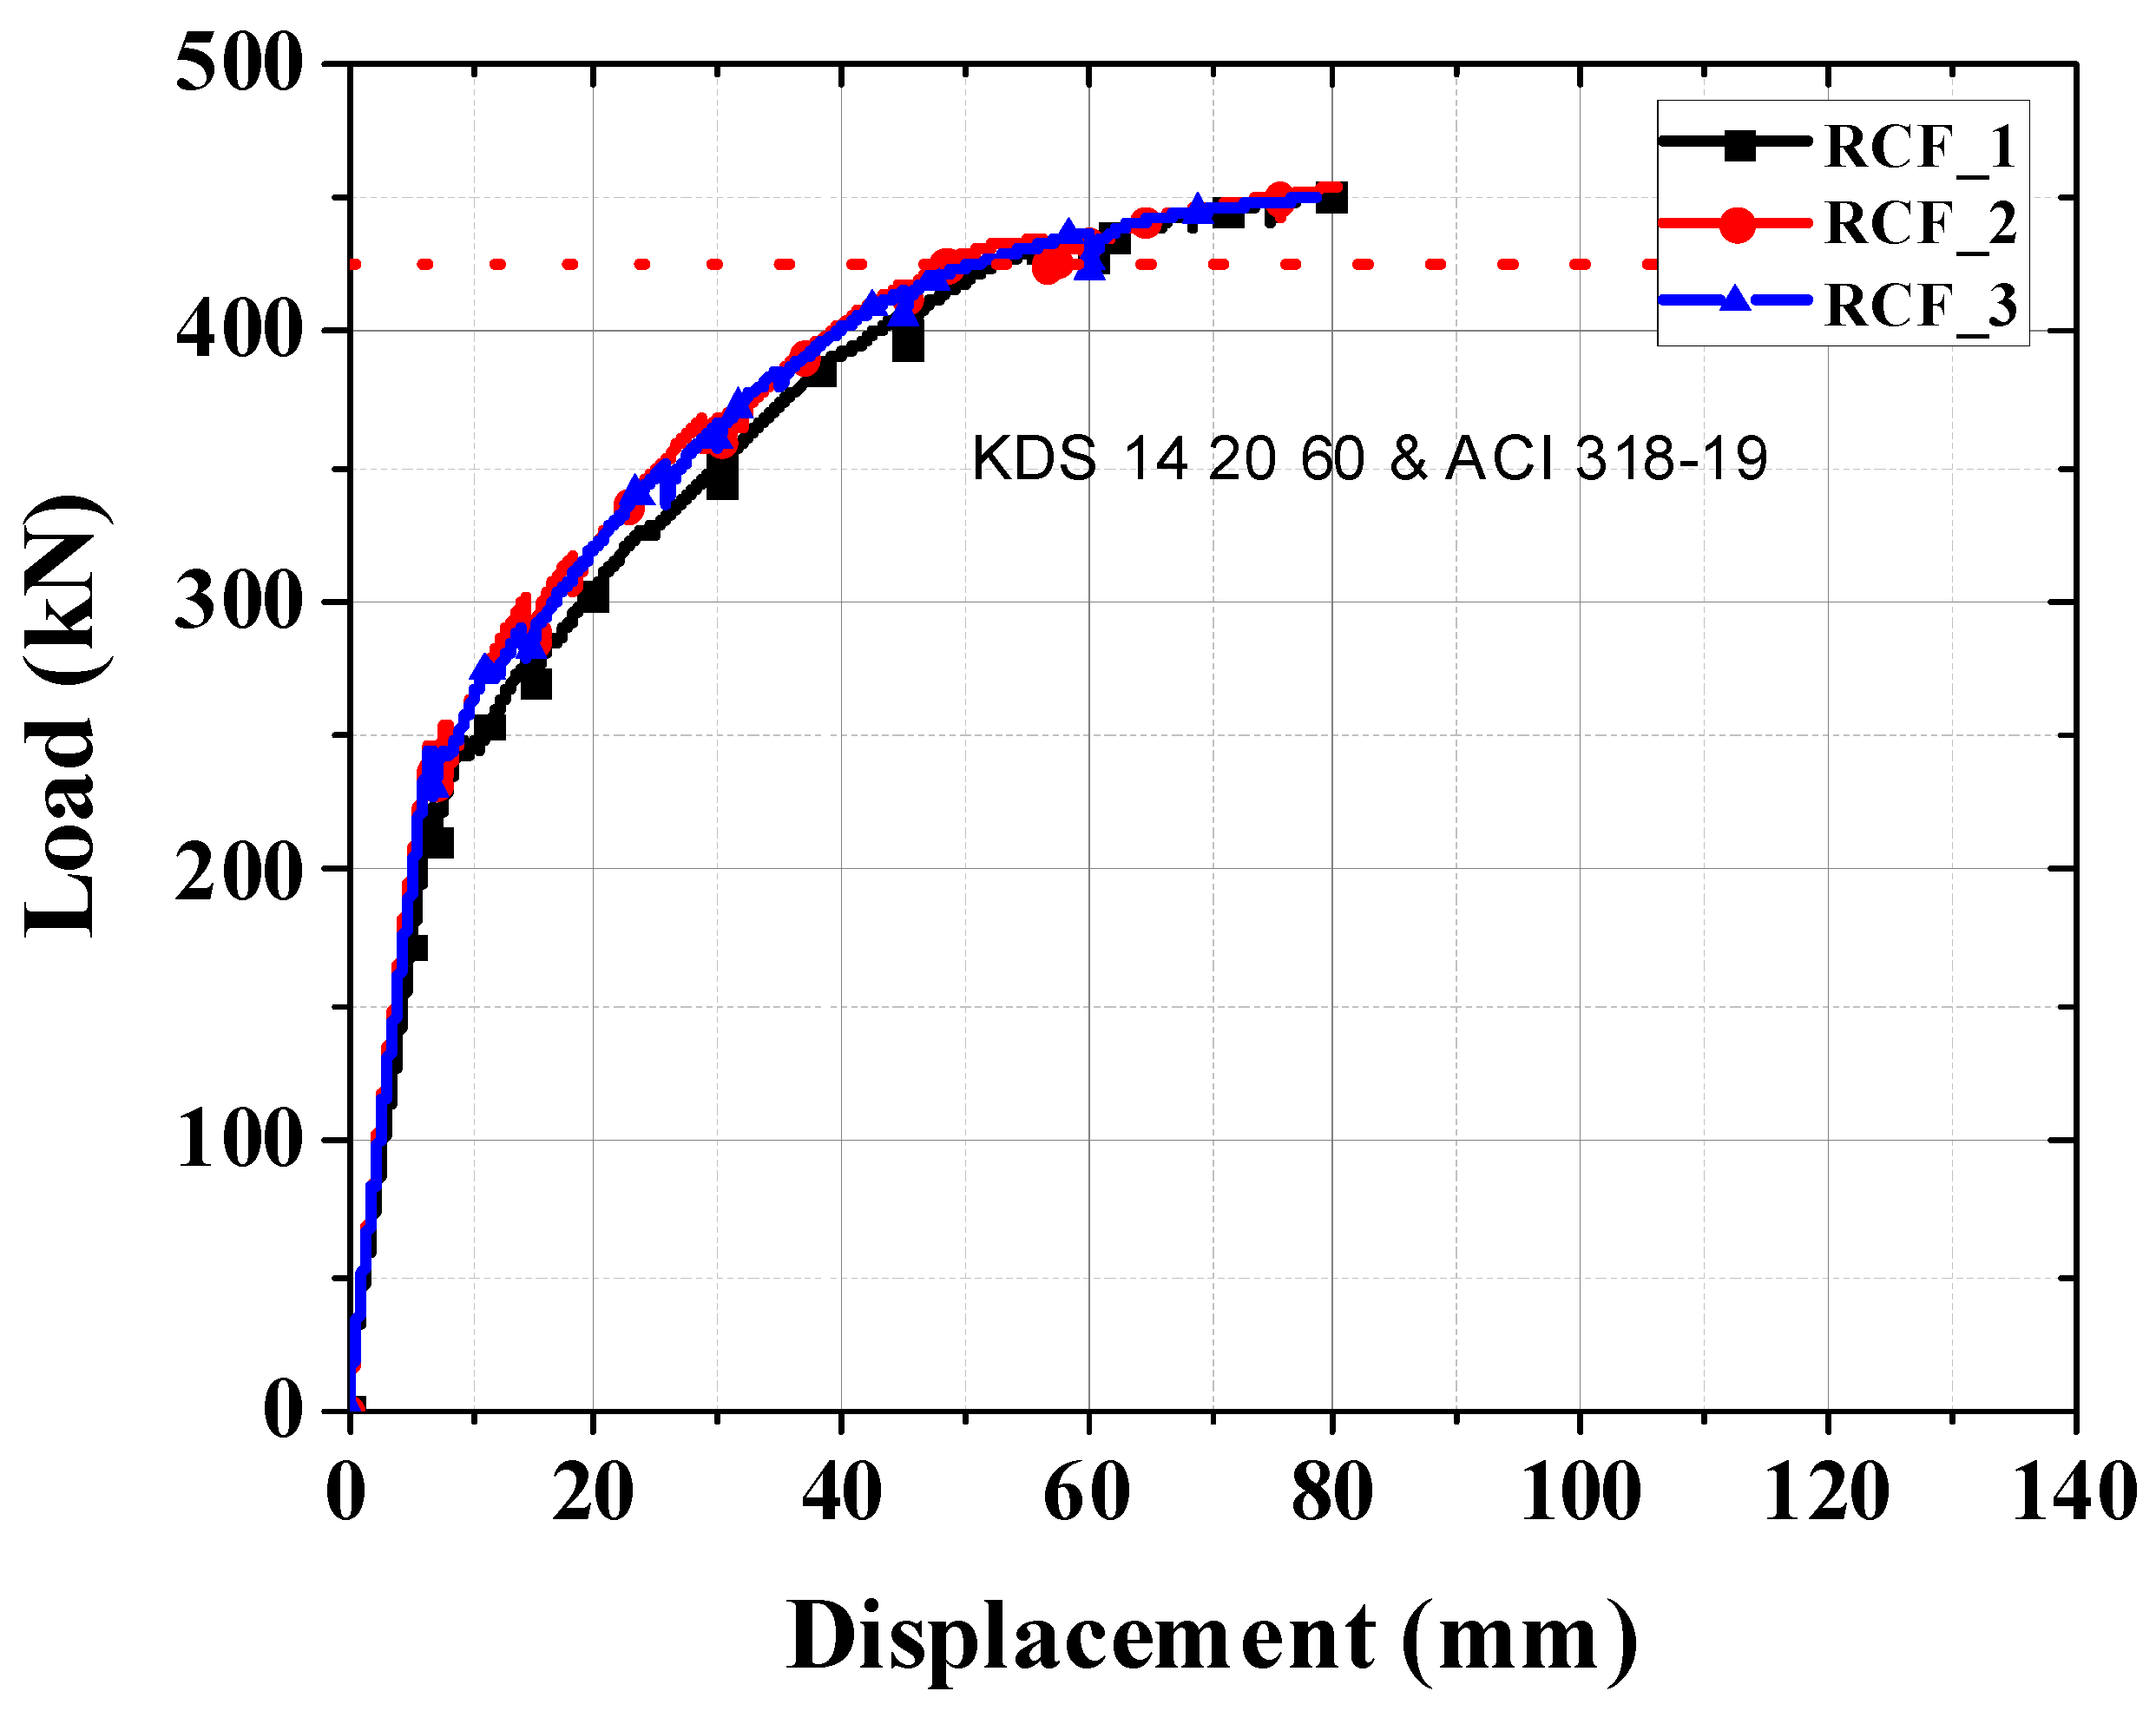
Figure 7.
Crack patterns of hollow-core slab at Mcr, Mu, and end of experiment and photo.
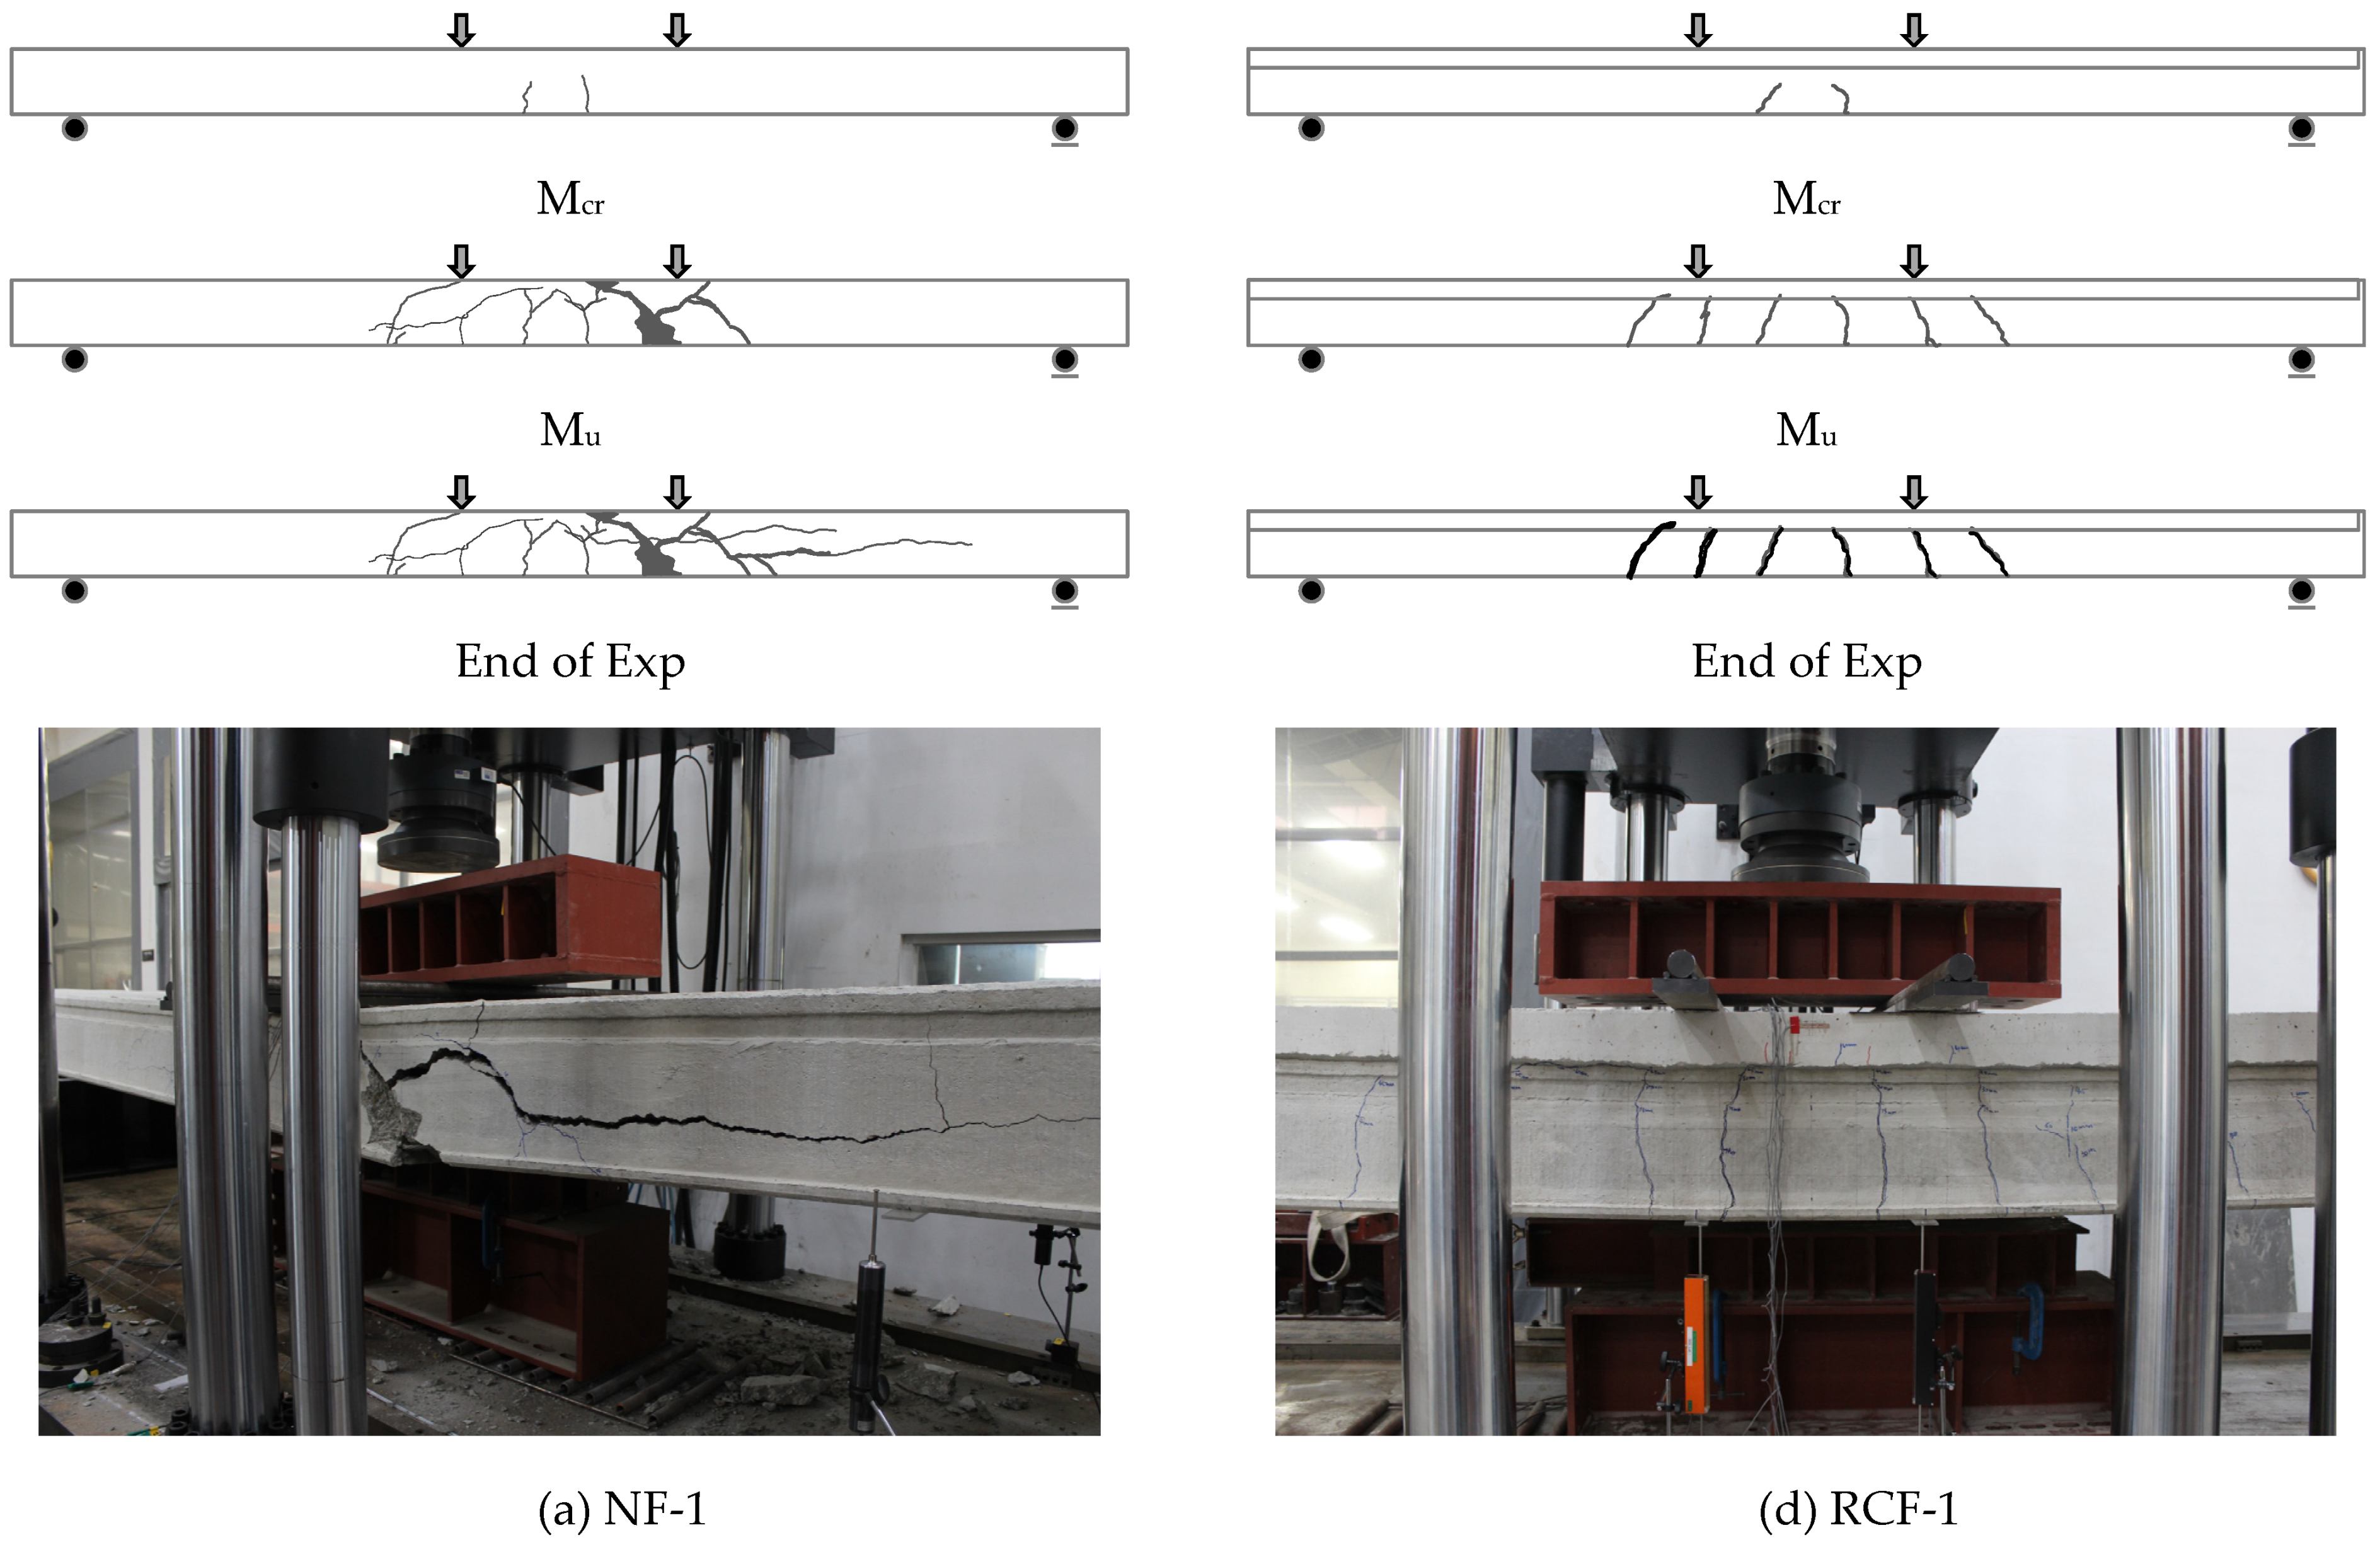

Figure 8.
Strain distribution of a tendon.

Table 1.
Assumptions and conditions for flexural analysis and design based on member grades [25,26].
| Rating | Assumptions and Conditions for Interpretation | Assumptions and Conditions for Design |
|---|---|---|
| Non-cracking rating | -Assumption of planarity -Full adhesion of concrete and reinforcement (For Attachment Tensioners) -Given the material’s properties | -The material is elastic -No change in tension under working load |
| Partial crack rating | -Assumption of planarity -Full attachment of concrete and tensioner (For attached tensioners) -Given the material’s properties | -The material is elastic -No change in tension under working load |
| Crack rating | -Assumption of planarity -Full attachment of concrete and tensioning (For attached tensioning) -Given the material’s properties | -Ignore the tensile strength of concrete -Concrete fails when the compressive strain of the compression podium is 0.0033. -Use Equivalent Stress Blocks |
Table 2.
Mix proportion of concrete.
| fck (N/mm2) | W/B (%) | S/a (%) | Material by Weight (kg/m3) | ||||
|---|---|---|---|---|---|---|---|
| W | C | S | G | AD | |||
| 27 | 52.0 | 47.0 | 325 | 874 | 1000 | 2.6 | |
| 49 | 36.8 | 49.5 | 136 | 370 | 942 | 976 | - |
Table 3.
Concrete compressive strength test results.
| HCS (N/mm2) | Synthetic Topping (N/mm2) | Note | ||||
|---|---|---|---|---|---|---|
| Design | Test | Ave | Design | Test | Ave | |
| 49 | 63.97 | 63.97 | 27.0 | 30.07 | 30.07 | Cylinder (φ100 × 200) |
| 48.21 | 30.24 | |||||
| 60.57 | 31.24 | |||||
Table 4.
Design of specimens.
| Specimens | f′c (N/mm2) | Size (mm) | Prestressing Strand | a/d (%) | H (mm) | ||||
|---|---|---|---|---|---|---|---|---|---|
| HCS | Synthetic Topping | h | b | l | Bottom | Top | |||
| FN-1 | 57.6 | – | 350 | 1200 | 7000 | 1012.7 | 29.5 | 10.0 | – |
| FN-2 | |||||||||
| FN-3 | |||||||||
| RCF-1 | 30.5 | 470 | 7.2 | 120 | |||||
| RCF-2 | |||||||||
| RCF-3 | |||||||||
Table 5.
Test results.
| Specimens | Experimental Results | |||||||
|---|---|---|---|---|---|---|---|---|
| VCr (kN) | VCr ave (kN) | δCr (mm) | δCr ave (mm) | VPeak (kN) | VPeak ave (kN) | δPeak (mm) | δPeak ave (mm) | |
| FN-1 | 177.0 | 179.2 | 11.4 | 10.9 | 322.7 | 323.8 | 120.0 | 107.4 |
| FN-2 | 176.3 | 10.4 | 318.5 | 101.5 | ||||
| FN-3 | 184.4 | 10.8 | 330.2 | 100.7 | ||||
| RCS-1 | 216.9 | 229.3 | 7.1 | 7.0 | 451.4 | 451.7 | 80.1 | 77.9 |
| RCS-2 | 241.4 | 7.0 | 453.8 | 75.1 | ||||
| RCS-3 | 229.7 | 7.0 | 449.8 | 78.4 | ||||
Table 6.
Test result and comparison of flexural strength.
| Specimens | Experimental Results | Analytical Results | Exp./Ana. | |||
|---|---|---|---|---|---|---|
| VCr (kN) | VPeak (kN) | VCr (kN) | VPeak (kN) | VCr | VPeak | |
| FN-1 | 177.0 | 322.7 | 181.3 | 317.4 | 0.98 | 1.02 |
| FN-2 | 176.3 | 318.5 | 0.97 | 1.00 | ||
| FN-3 | 184.4 | 330.2 | 1.02 | 1.04 | ||
| RCS-1 | 216.9 | 451.4 | 277.9 | 426.0 | 0.78 | 1.06 |
| RCS-2 | 241.4 | 453.8 | 0.87 | 1.07 | ||
| RCS-3 | 229.7 | 449.8 | 0.83 | 1.06 | ||
Disclaimer/Publisher’s Note: The statements, opinions and data contained in all publications are solely those of the individual author(s) and contributor(s) and not of MDPI and/or the editor(s). MDPI and/or the editor(s) disclaim responsibility for any injury to people or property resulting from any ideas, methods, instructions or products referred to in the content. |
© 2023 by the authors. Licensee MDPI, Basel, Switzerland. This article is an open access article distributed under the terms and conditions of the Creative Commons Attribution (CC BY) license (https://creativecommons.org/licenses/by/4.0/).
Share and Cite
MDPI and ACS Style
Kim, D.-H.; Kim, M.-J.; Jo, M.-S.; Kim, H.-G.; Yoon, Y.-J.; Kim, K.-H. Evaluation of Flexural Behavior of Prestressed Concrete (PSC) Hollow-Core Slabs (HCSs). Buildings 2023, 13, 2869. https://doi.org/10.3390/buildings13112869
AMA Style
Kim D-H, Kim M-J, Jo M-S, Kim H-G, Yoon Y-J, Kim K-H. Evaluation of Flexural Behavior of Prestressed Concrete (PSC) Hollow-Core Slabs (HCSs). Buildings. 2023; 13(11):2869. https://doi.org/10.3390/buildings13112869
Chicago/Turabian StyleKim, Dong-Hwan, Min-Jun Kim, Min-Su Jo, Hyeong-Gook Kim, Yeo-Jin Yoon, and Kil-Hee Kim. 2023. "Evaluation of Flexural Behavior of Prestressed Concrete (PSC) Hollow-Core Slabs (HCSs)" Buildings 13, no. 11: 2869. https://doi.org/10.3390/buildings13112869
Note that from the first issue of 2016, this journal uses article numbers instead of page numbers. See further details here.