
Comparison of Fragility Sets to Assess the Effectiveness of Retrofit Interventions on Masonry Buildings in Italy
 , , and
Abstract
:1. Introduction
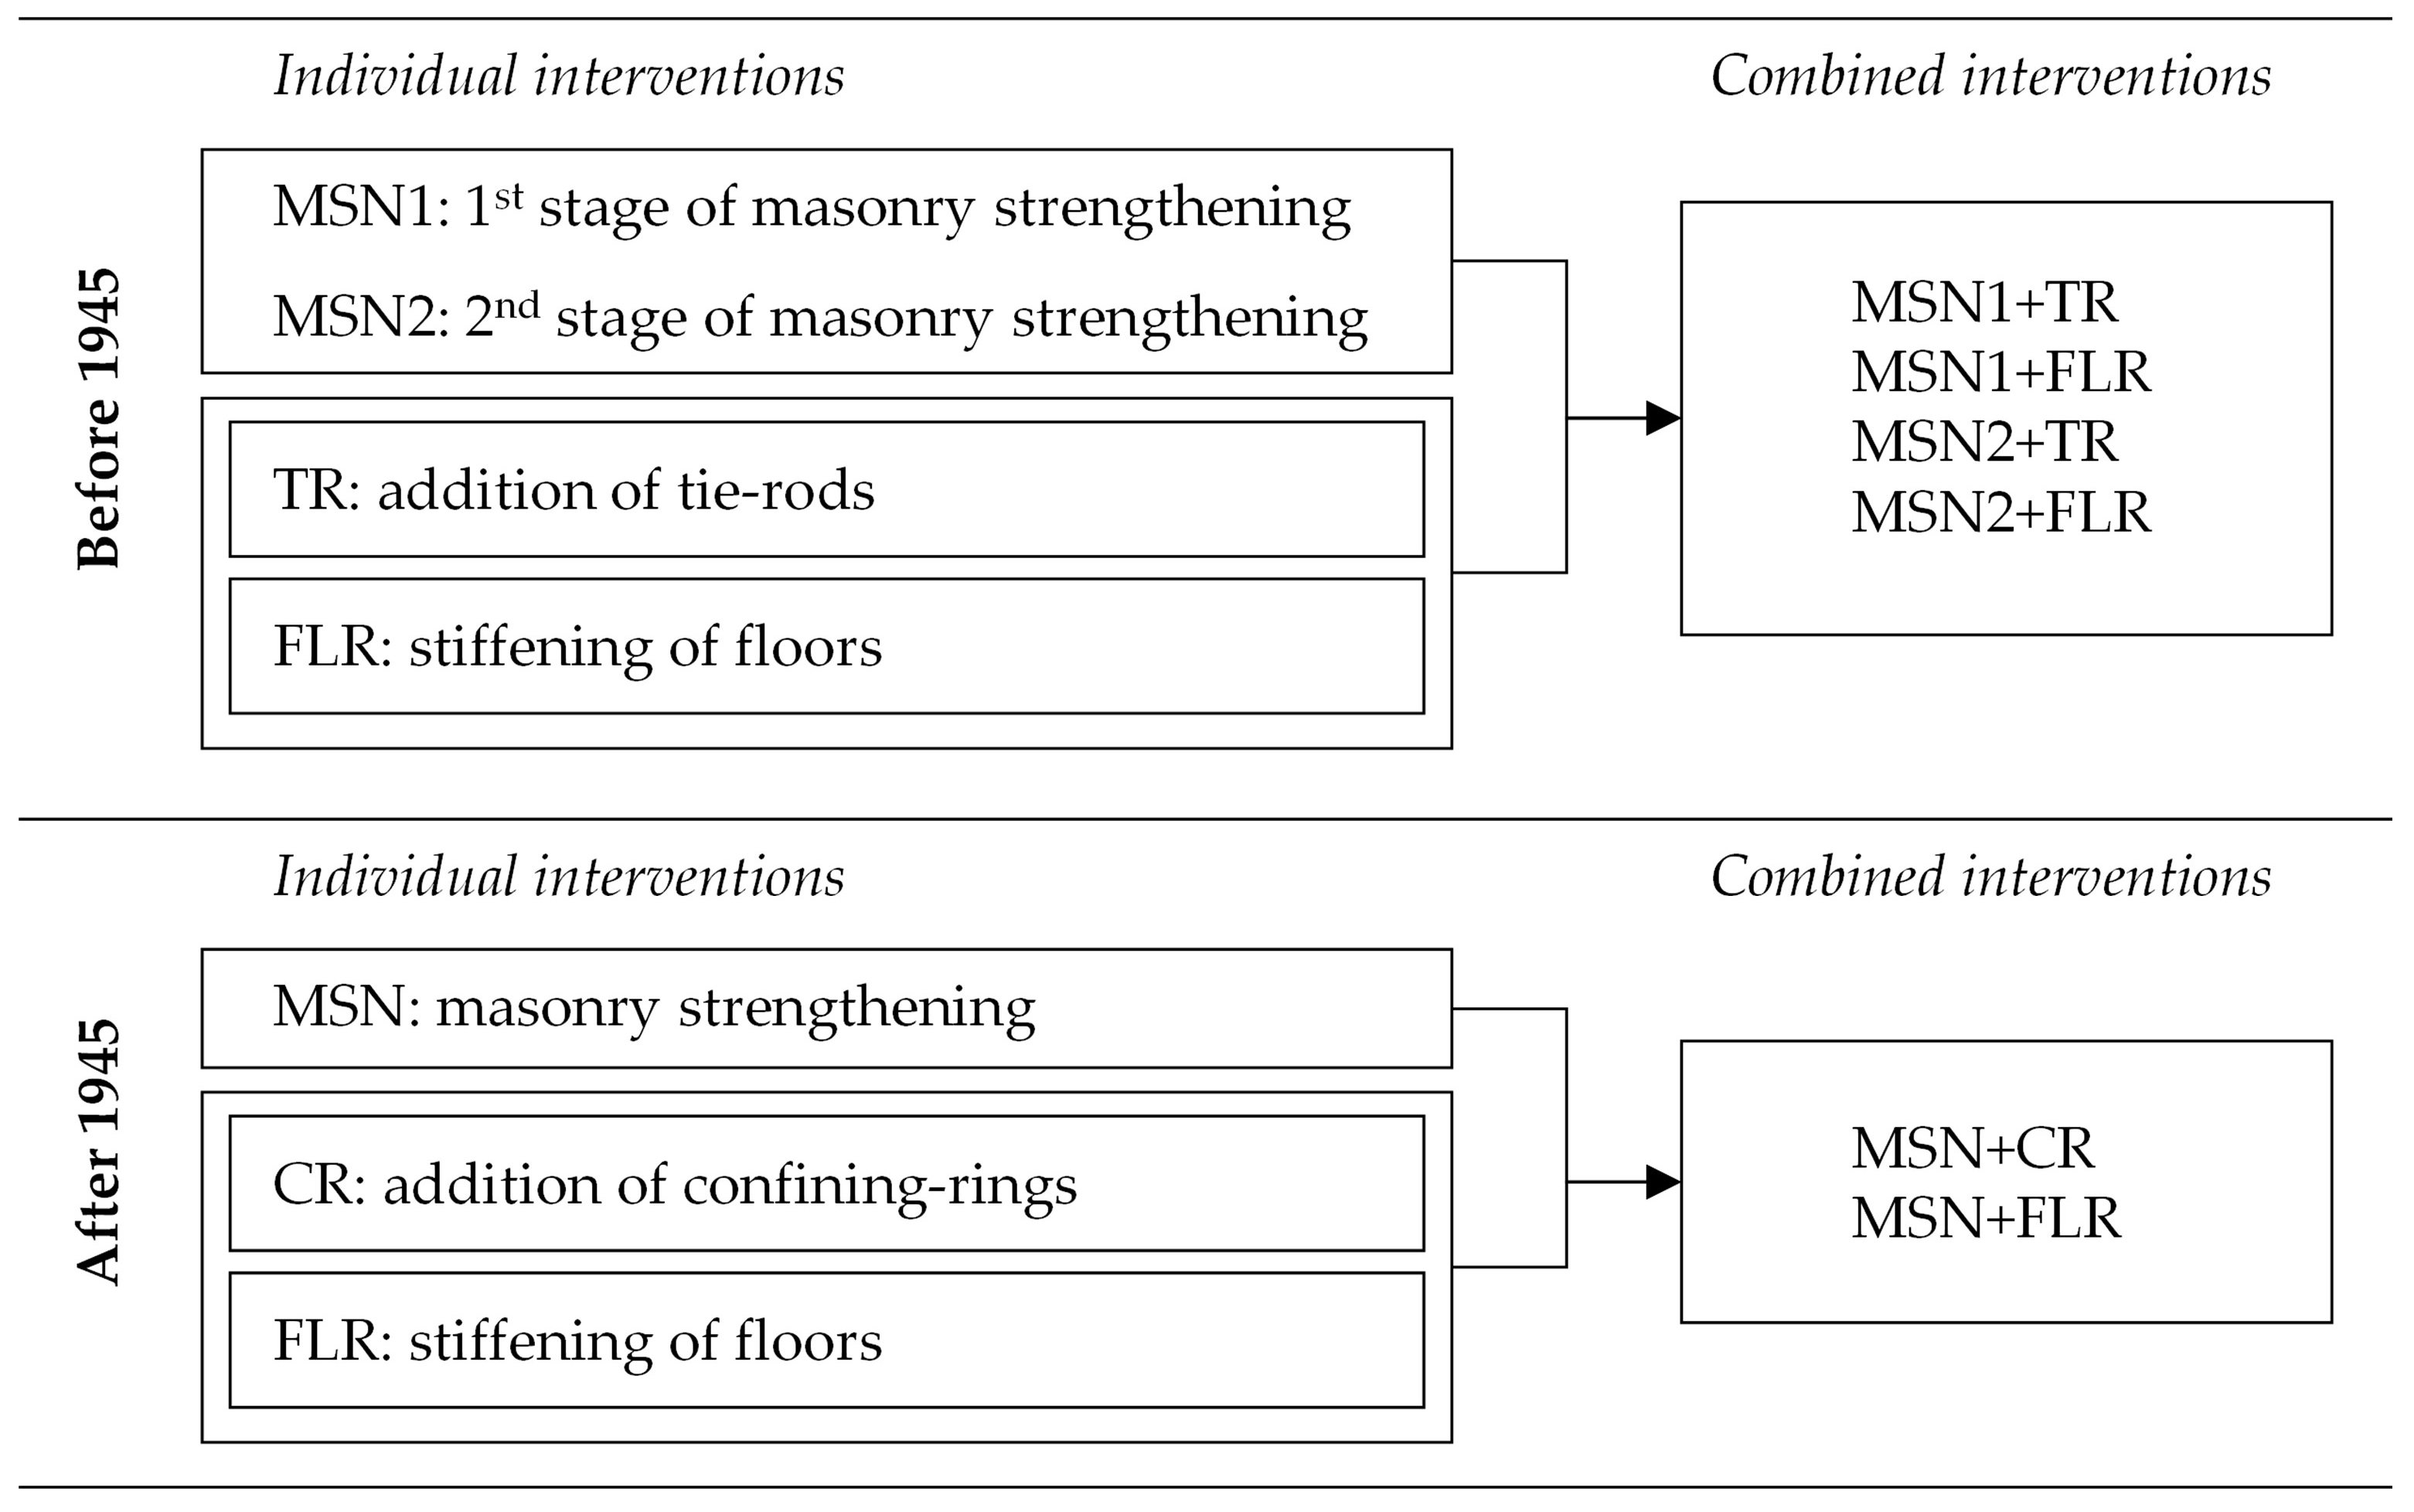
2. Selection and Modelling of Retrofit Interventions for Masonry Buildings
3. Approaches for Deriving Fragility Curves and Implementing Retrofit Interventions
3.1. Methods used for the Derivation of Fragility Curves
- A macroseismic–heuristic method, proposed by the research unit of UniGEa (the University of Genova).
- A simplified mechanical–heuristic method, proposed by the research unit of UniPD (the University of Padova);
- A simplified mechanical method, proposed by the research unit of UniGEb (the University of Genova).
3.2. Implementation of the Selected Retrofit Interventions within the Three Methods
4. Developed Fragility Models
4.1. ISTAT Types and Databases of Buildings Adopted for the Derivation of Fragility Curves
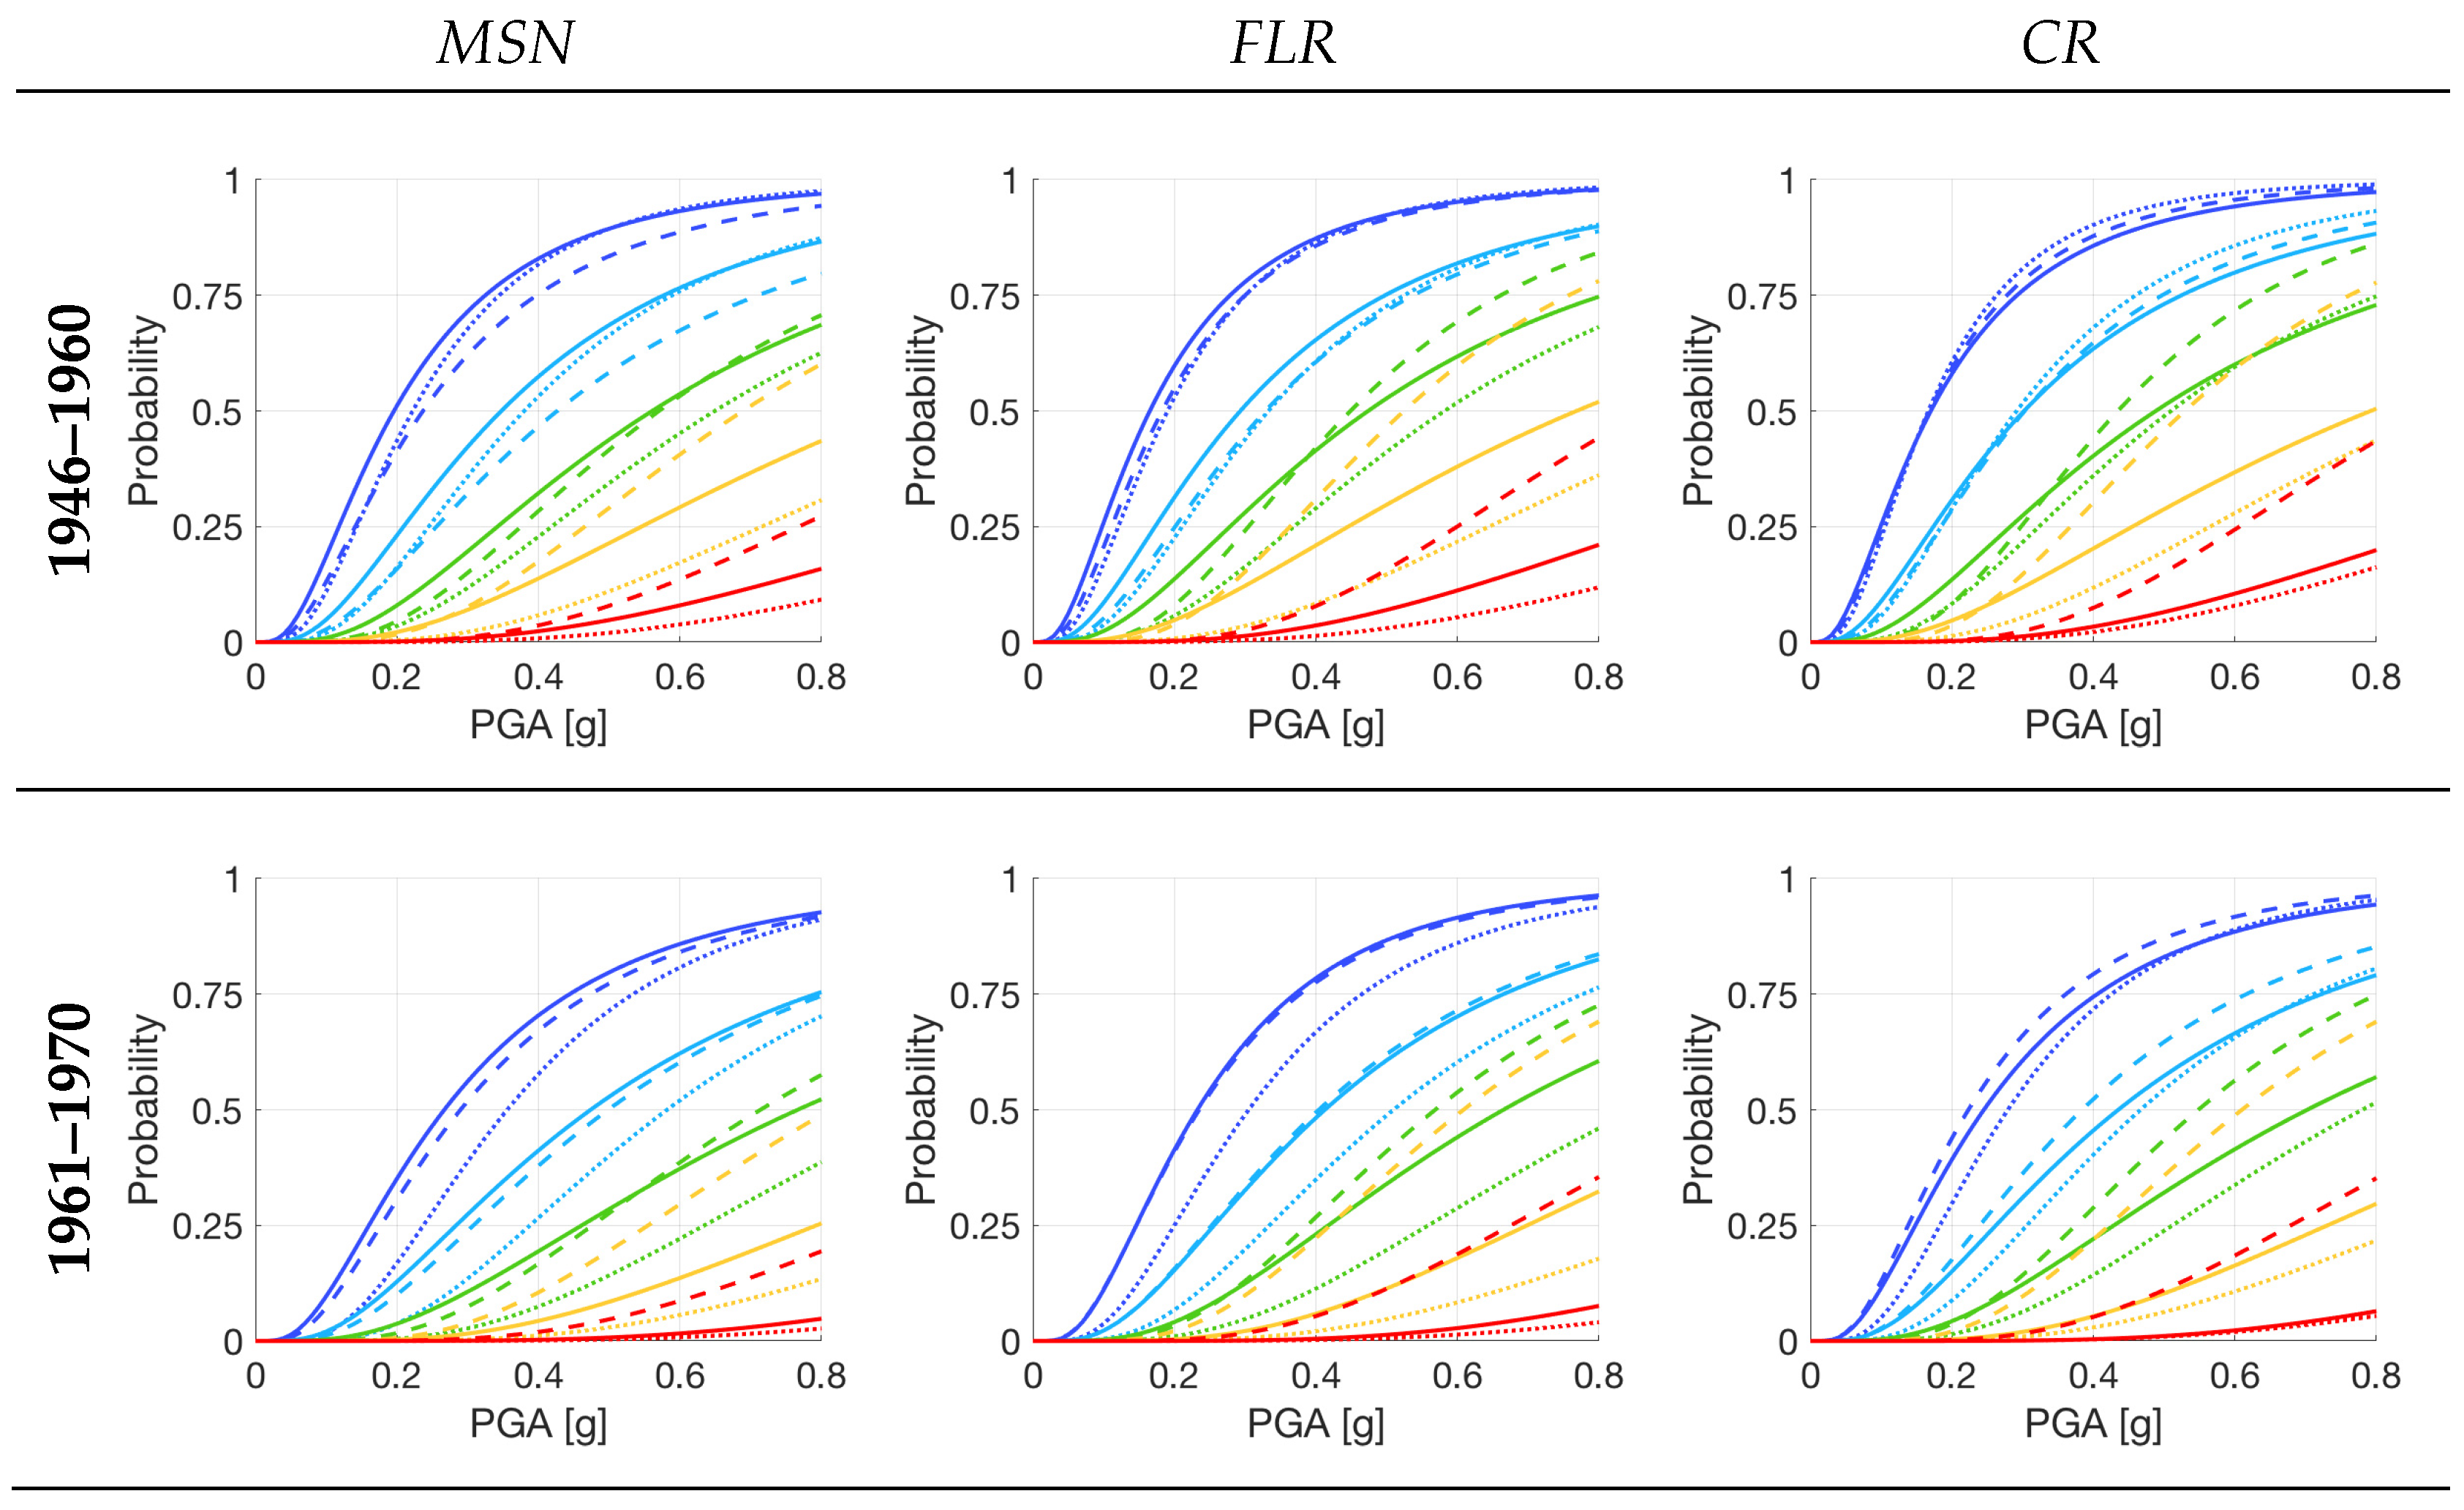
4.2. As-Built and Retrofitted Fragility Curves
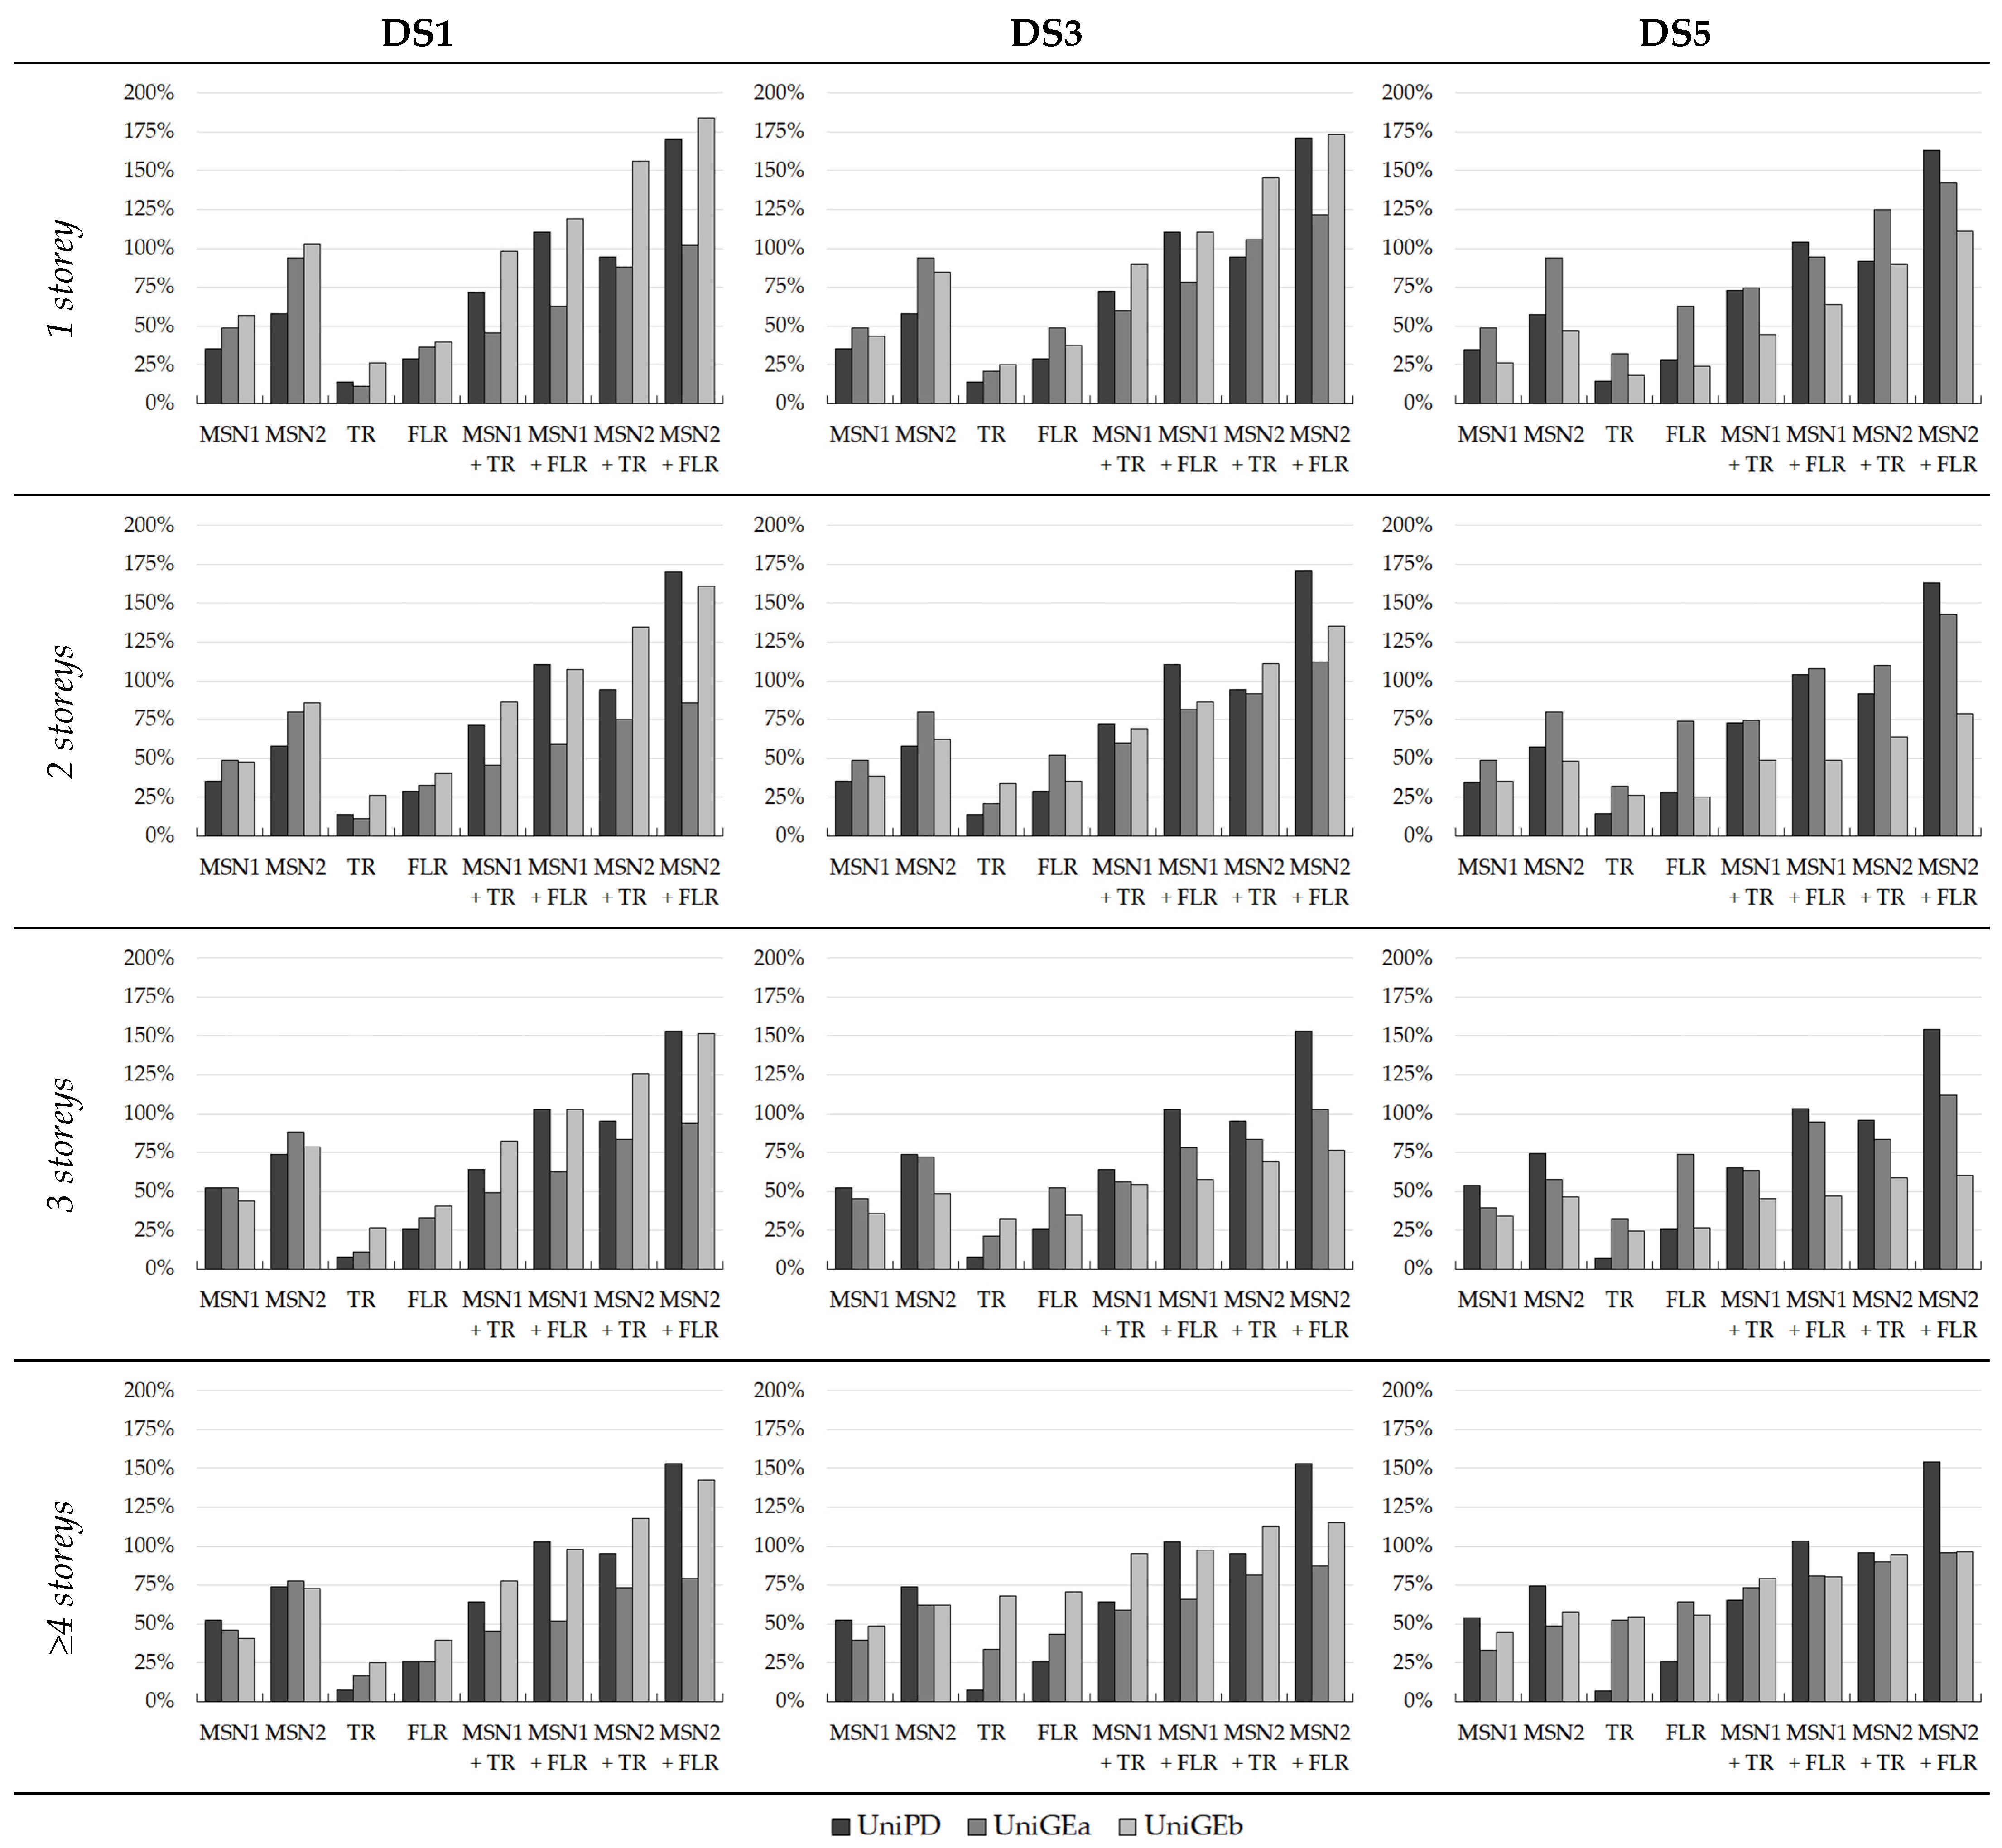
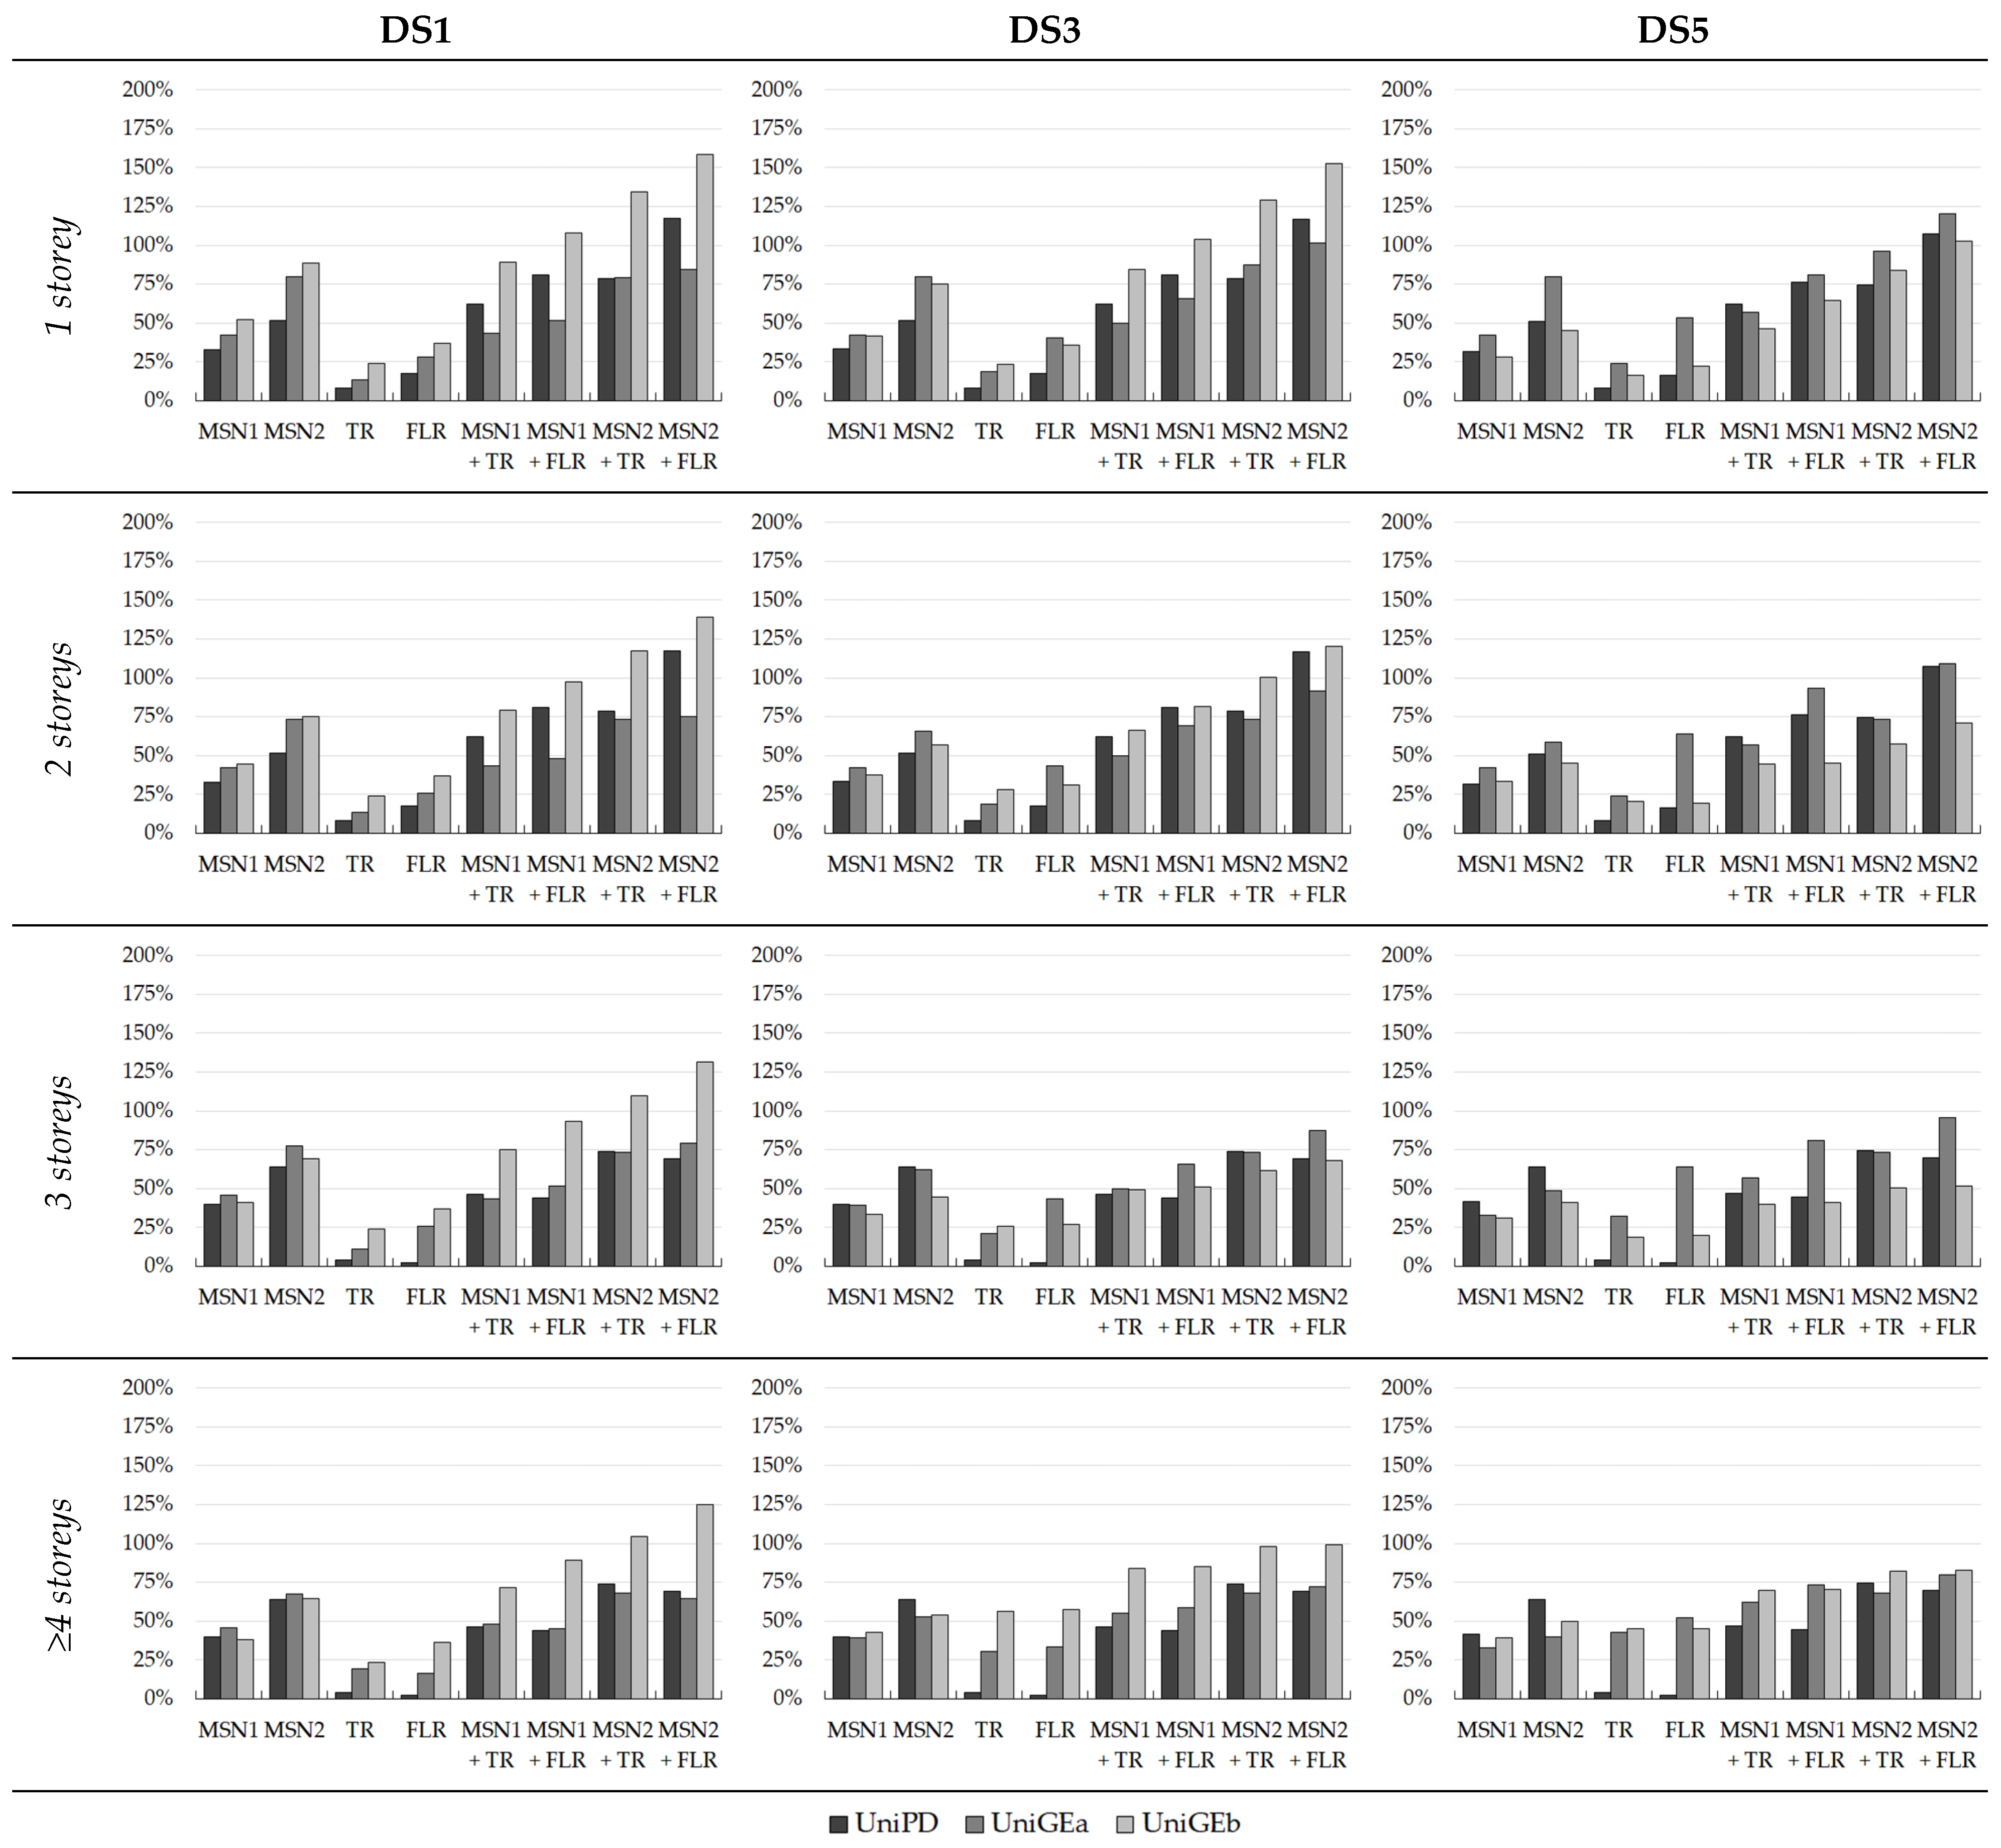
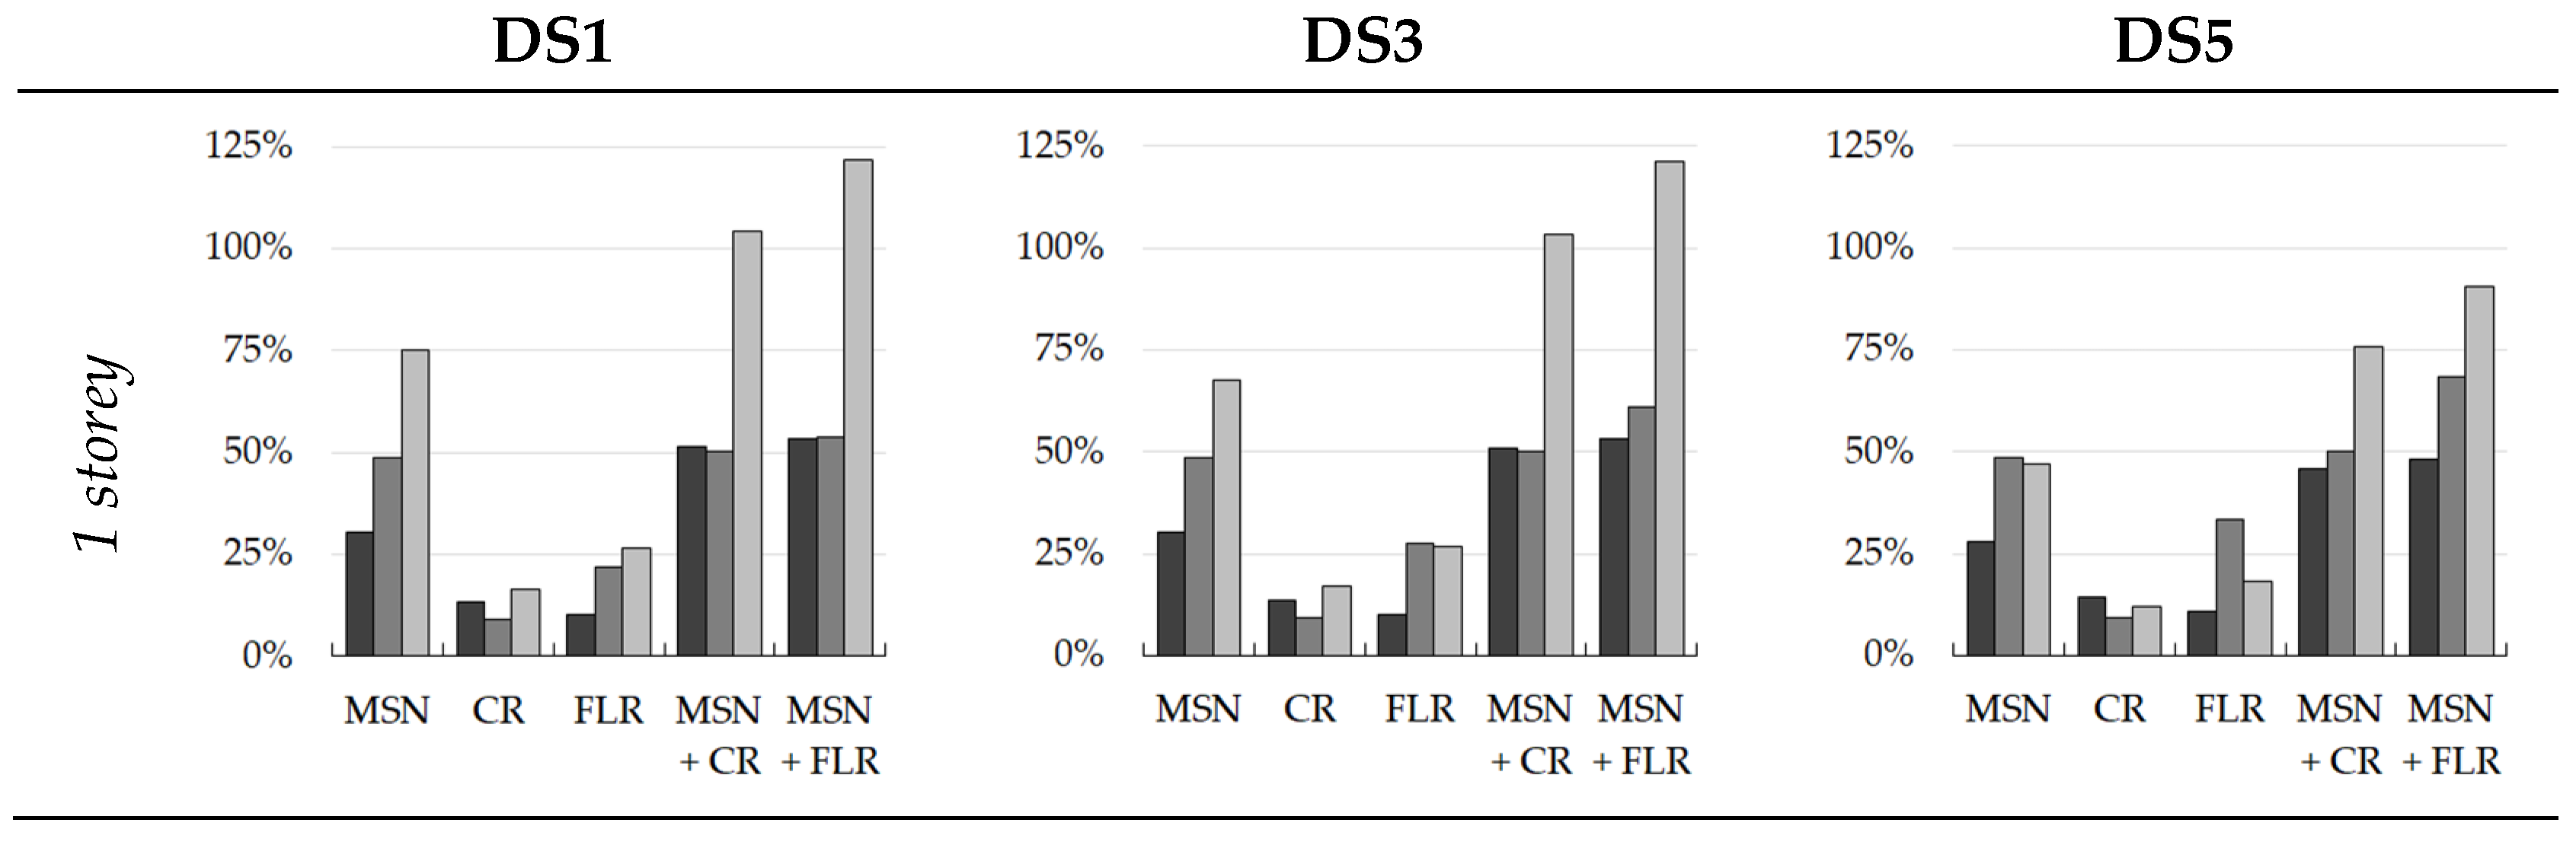
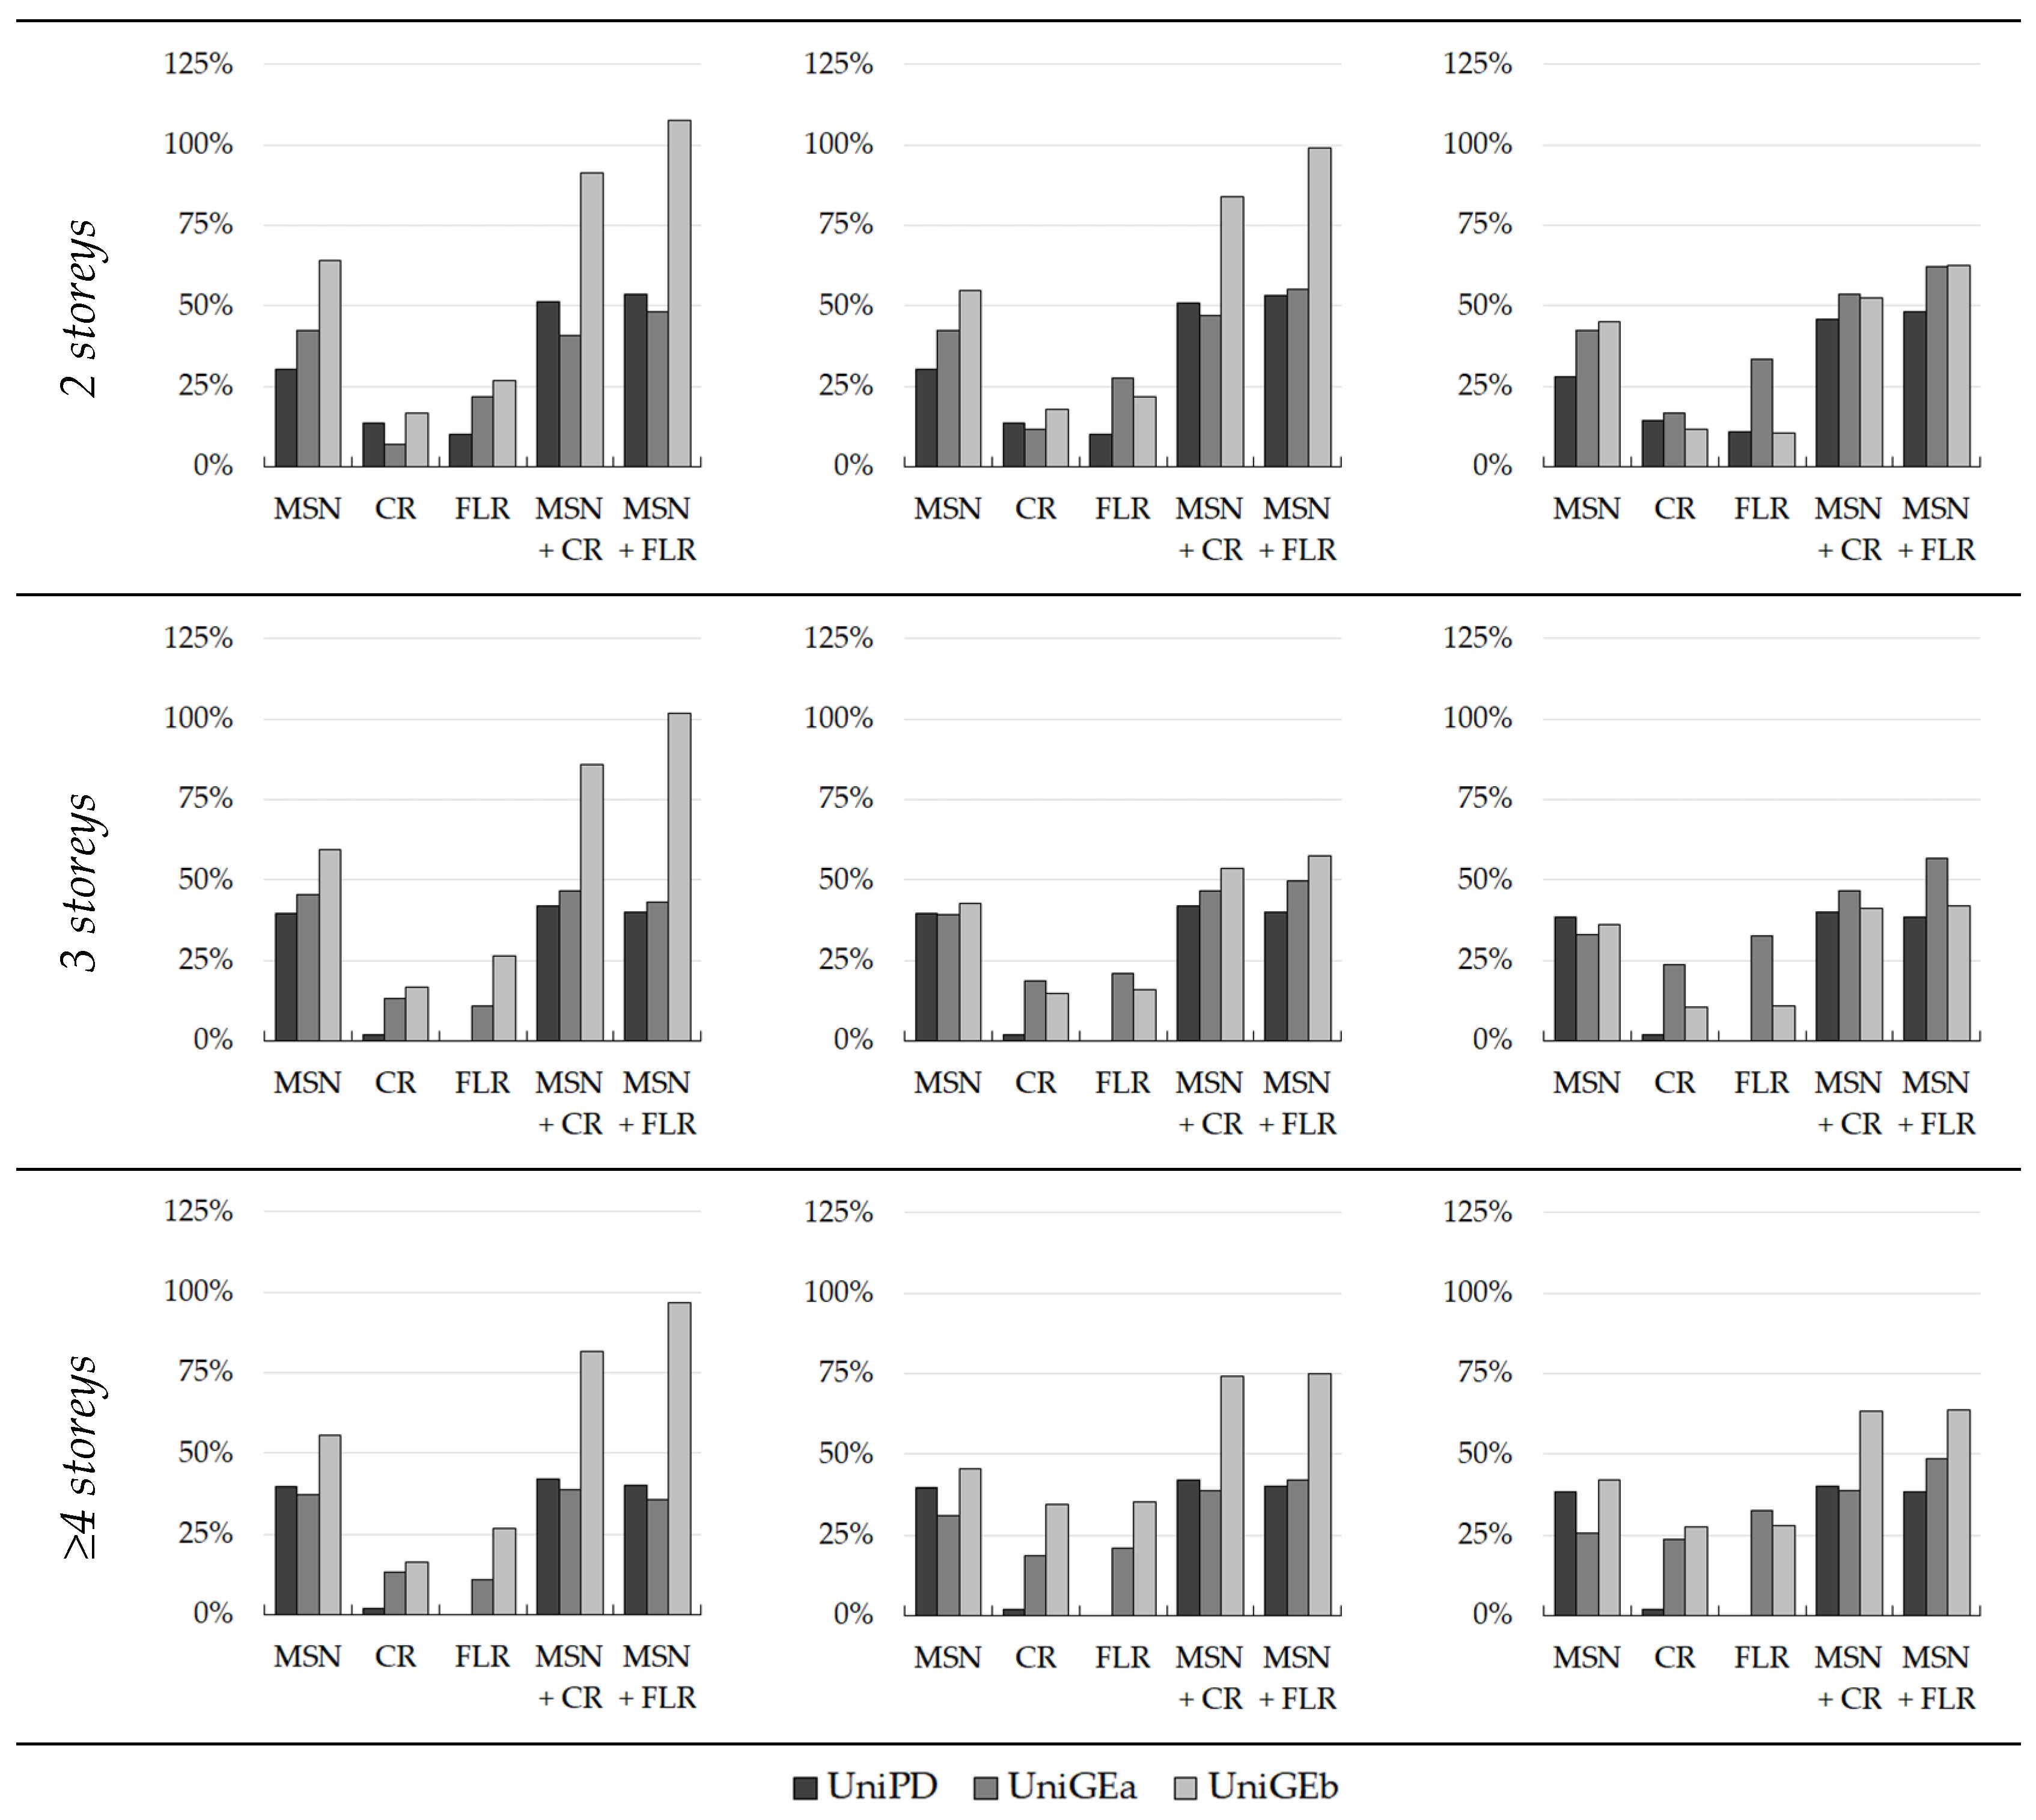
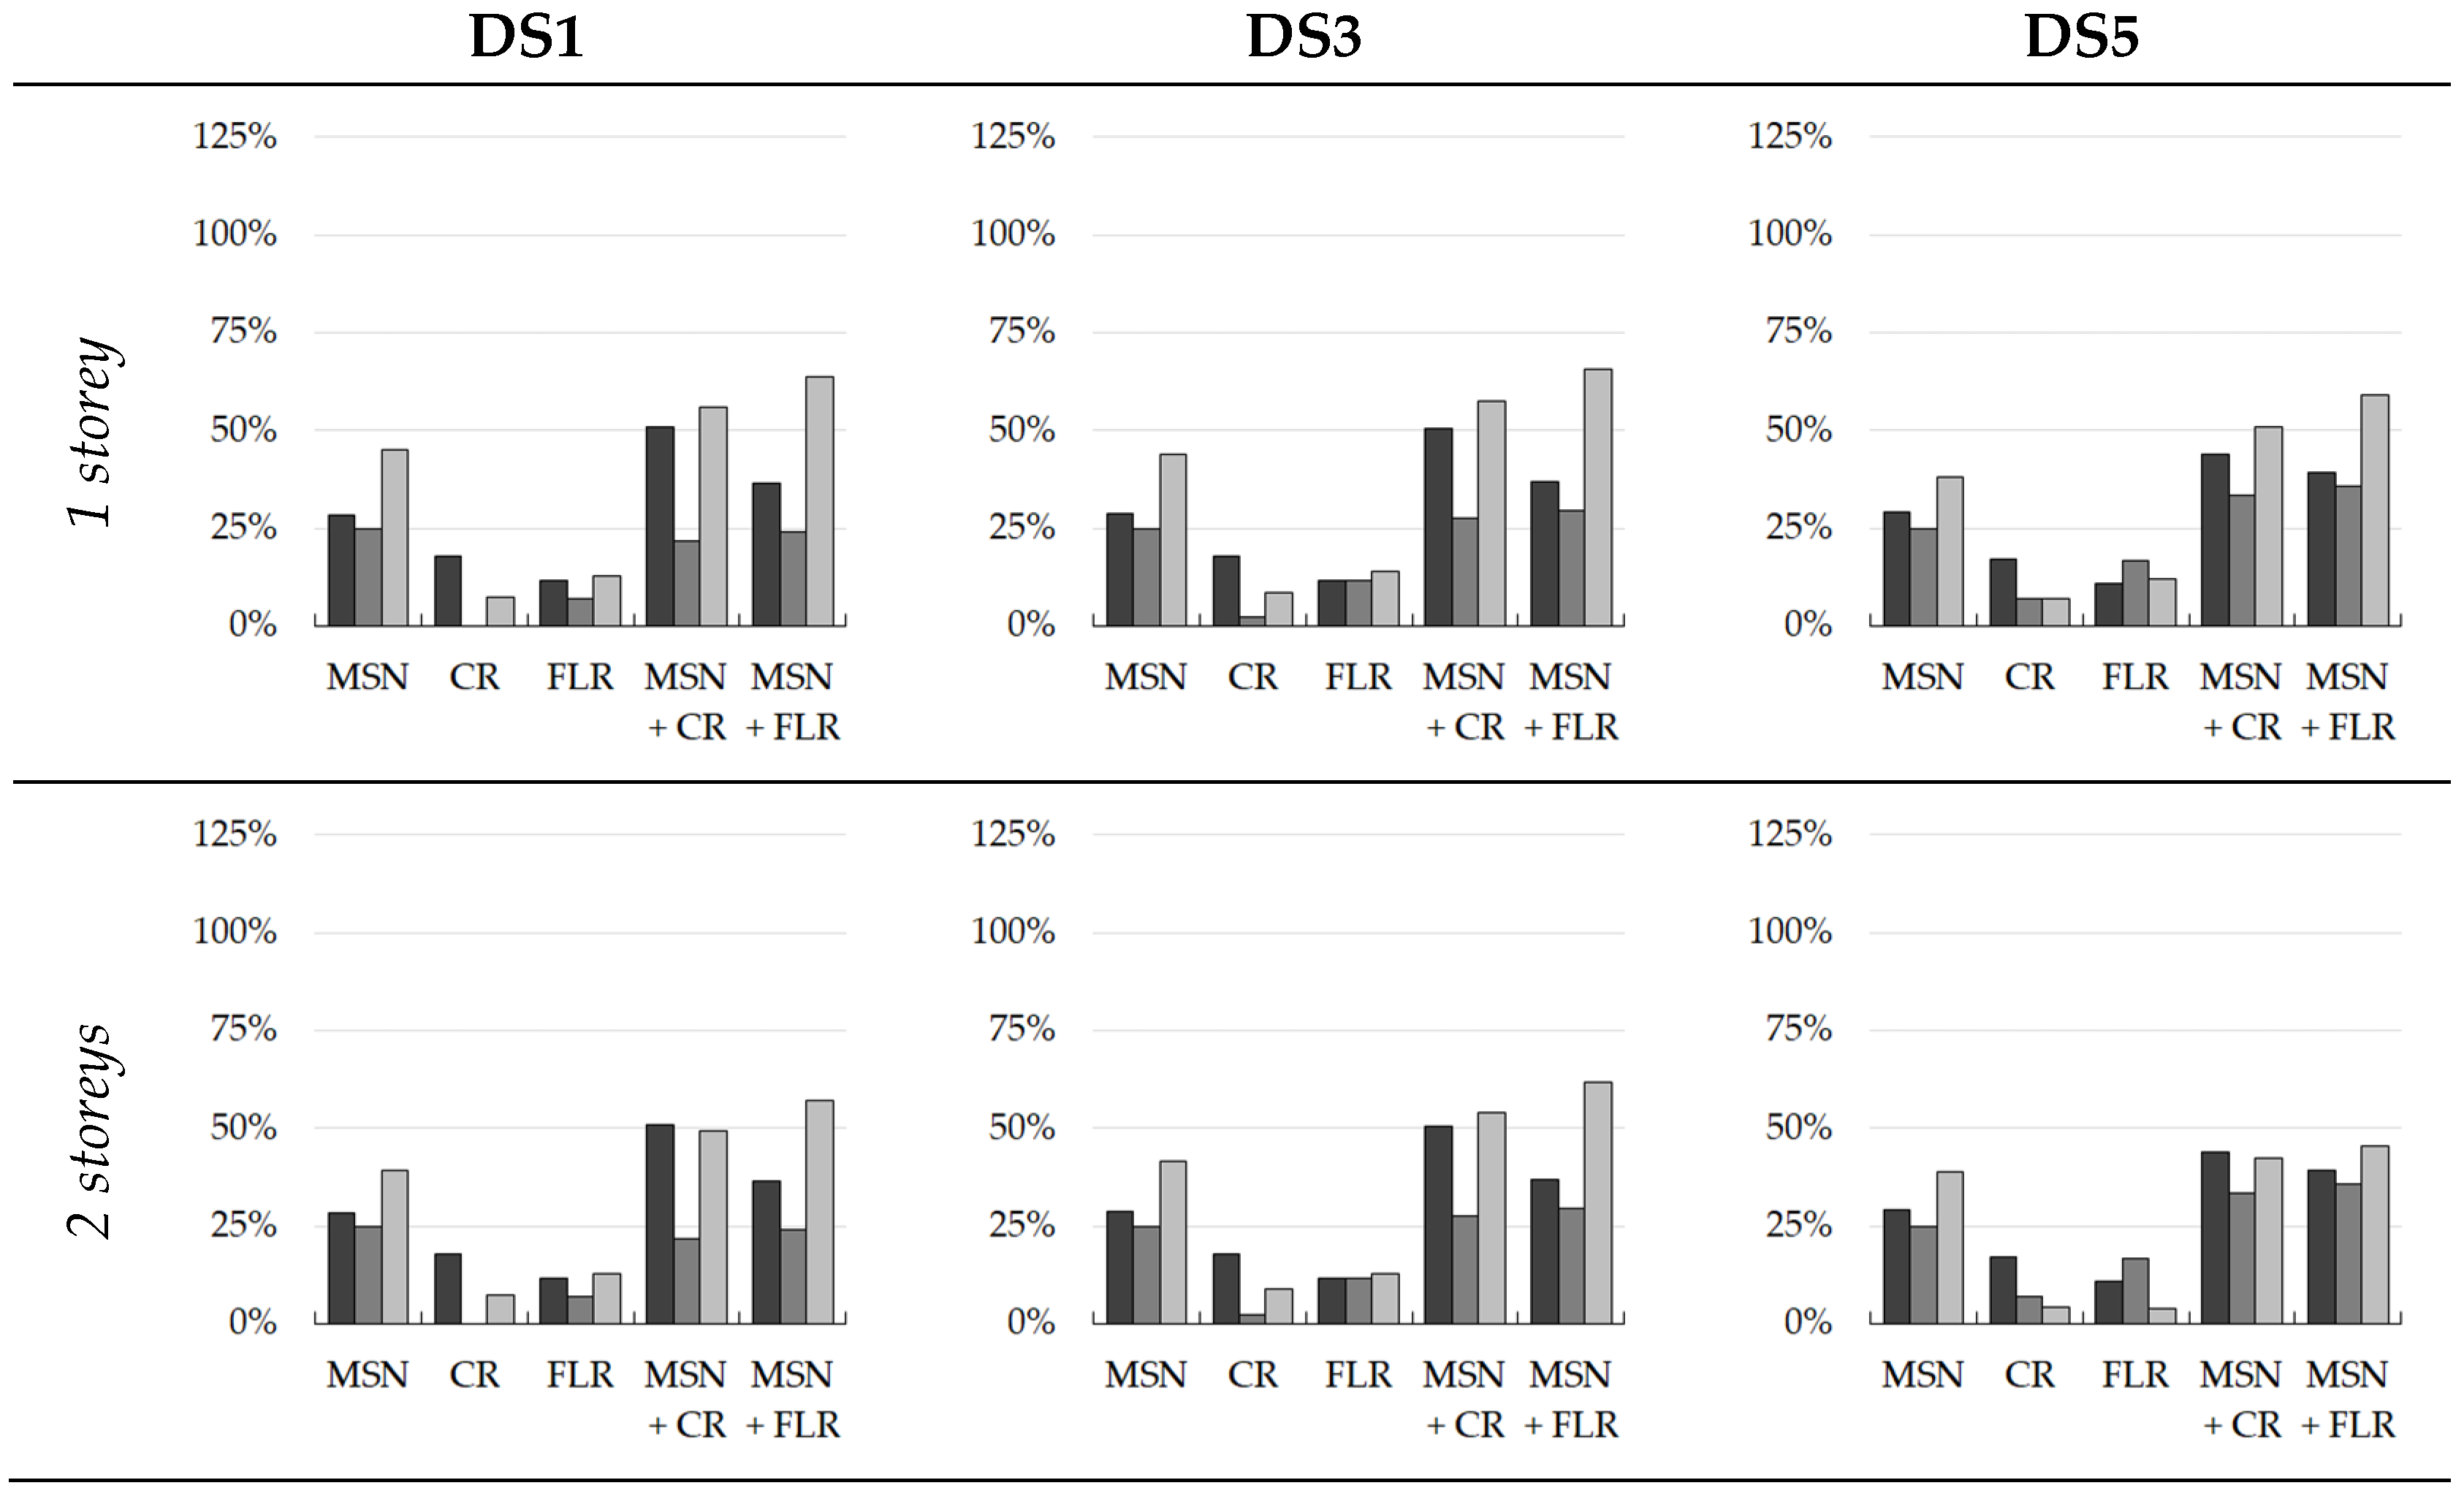
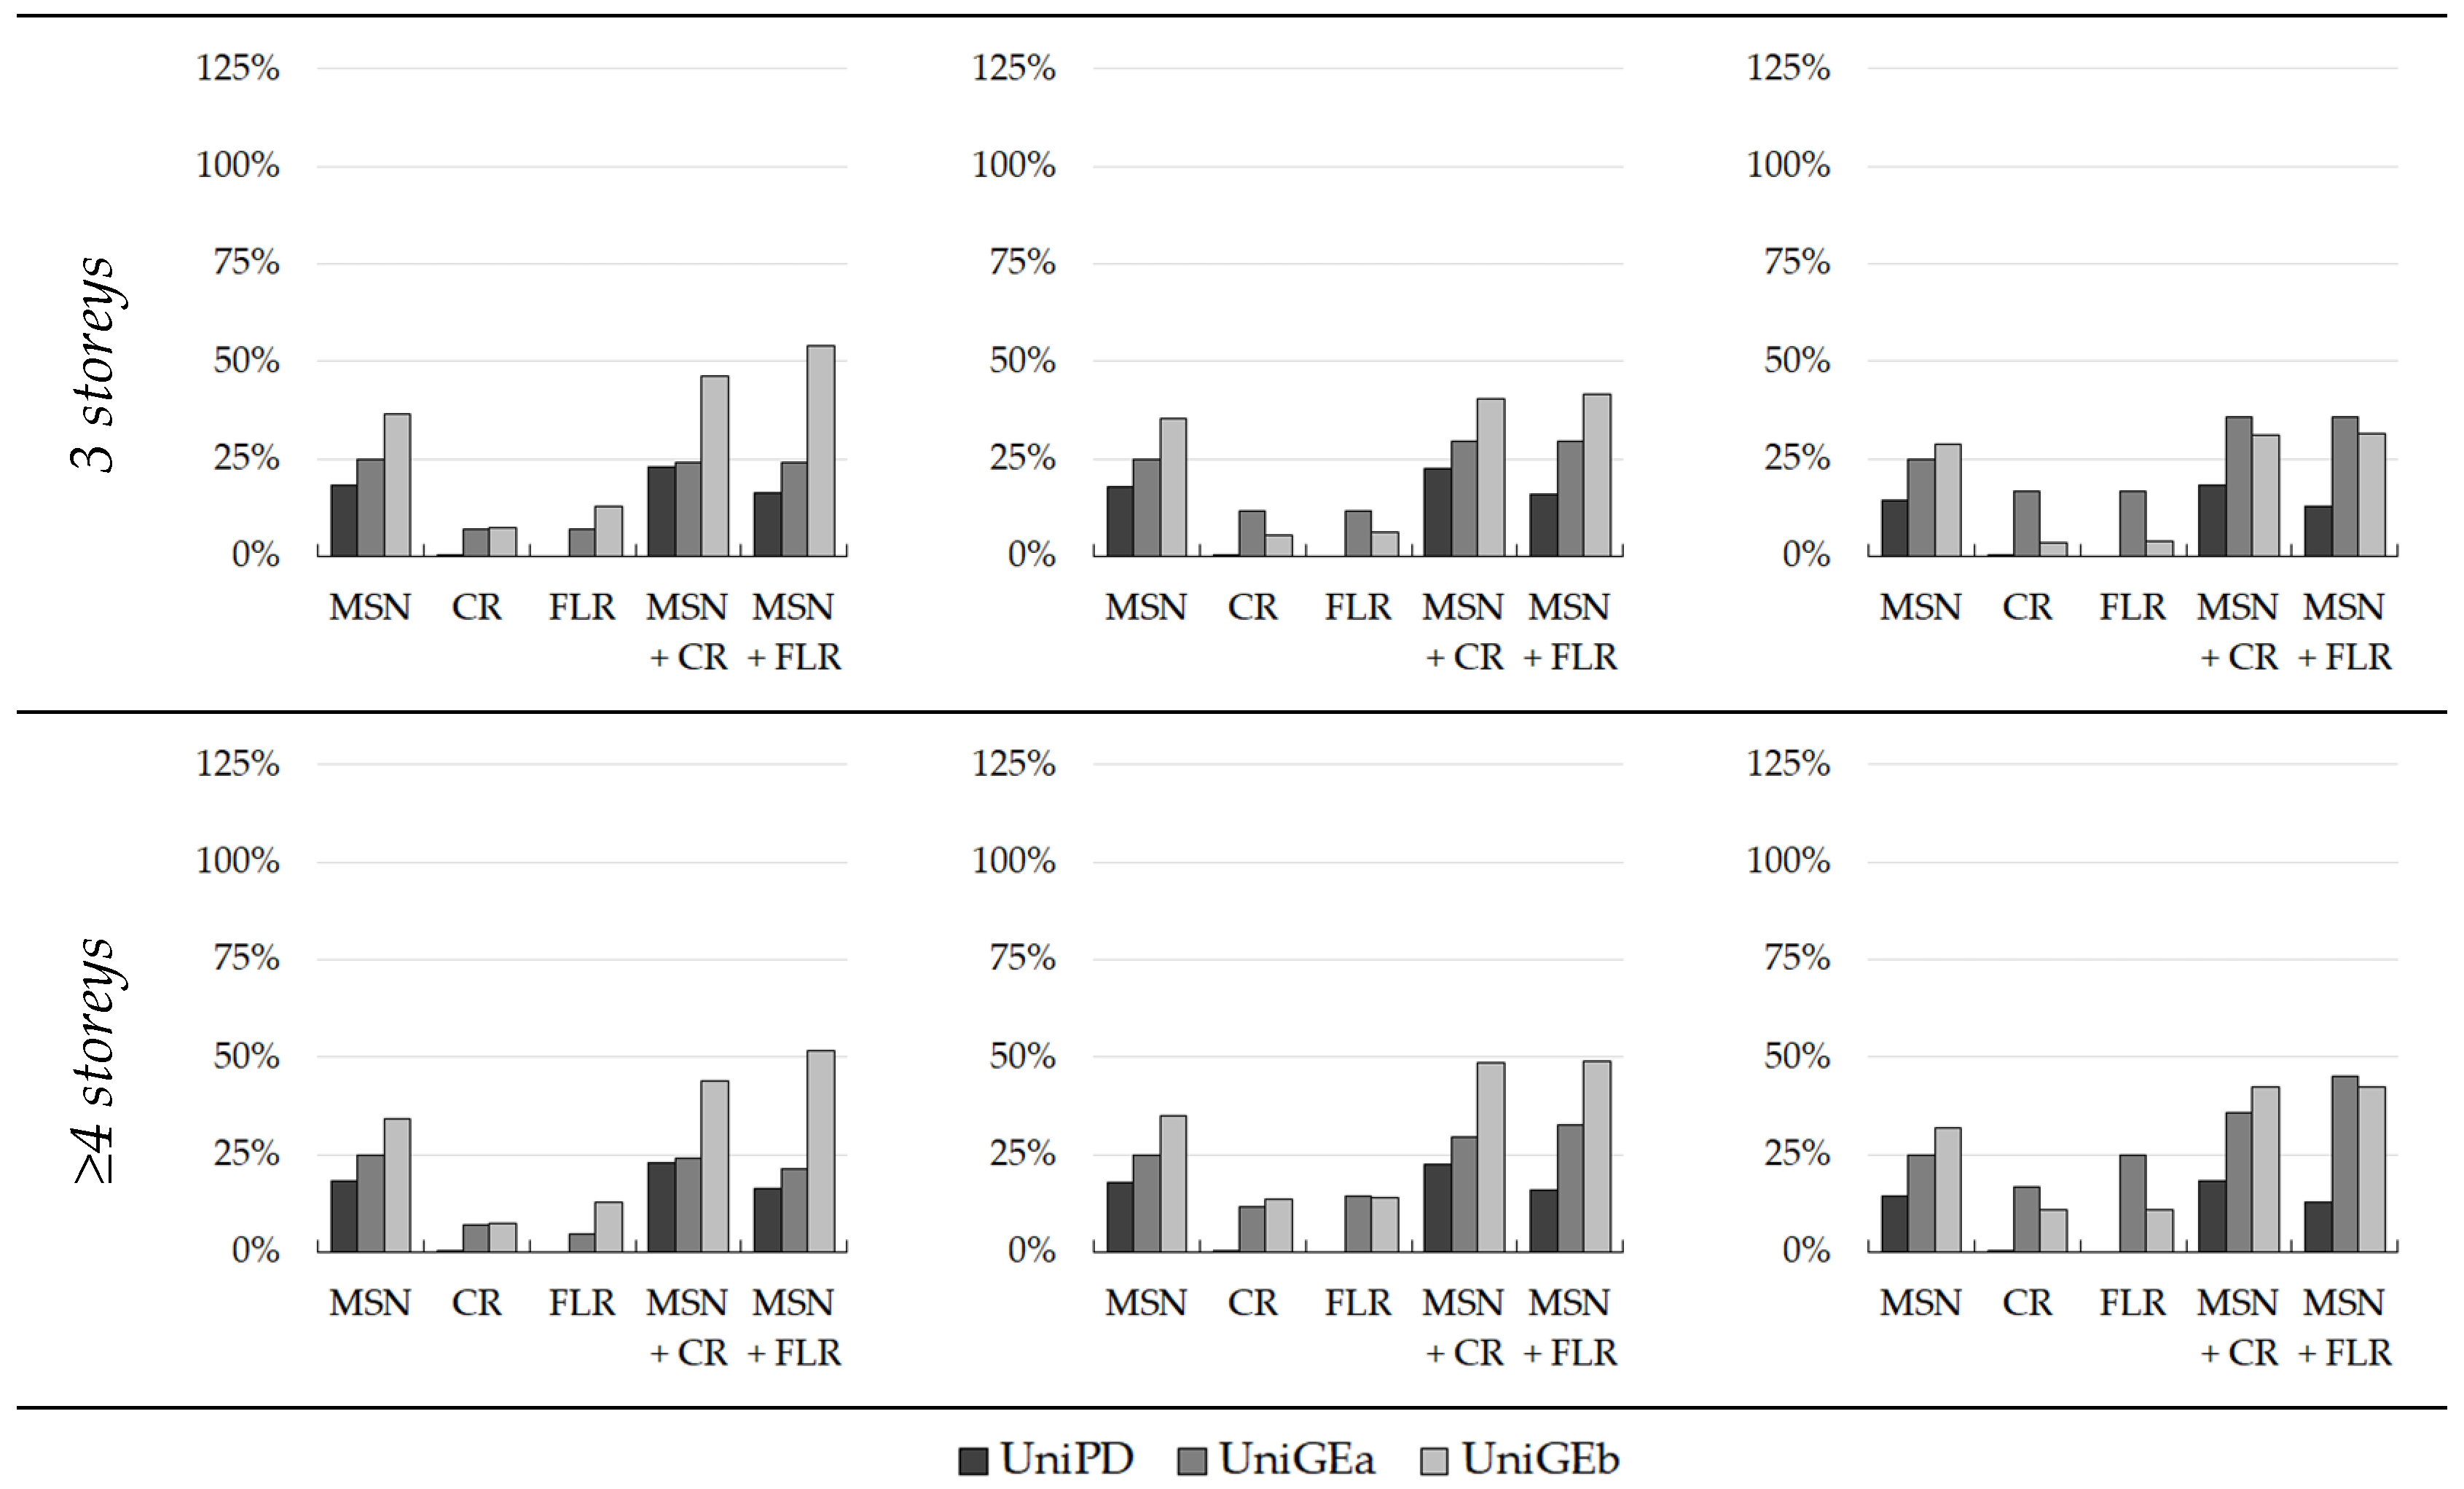
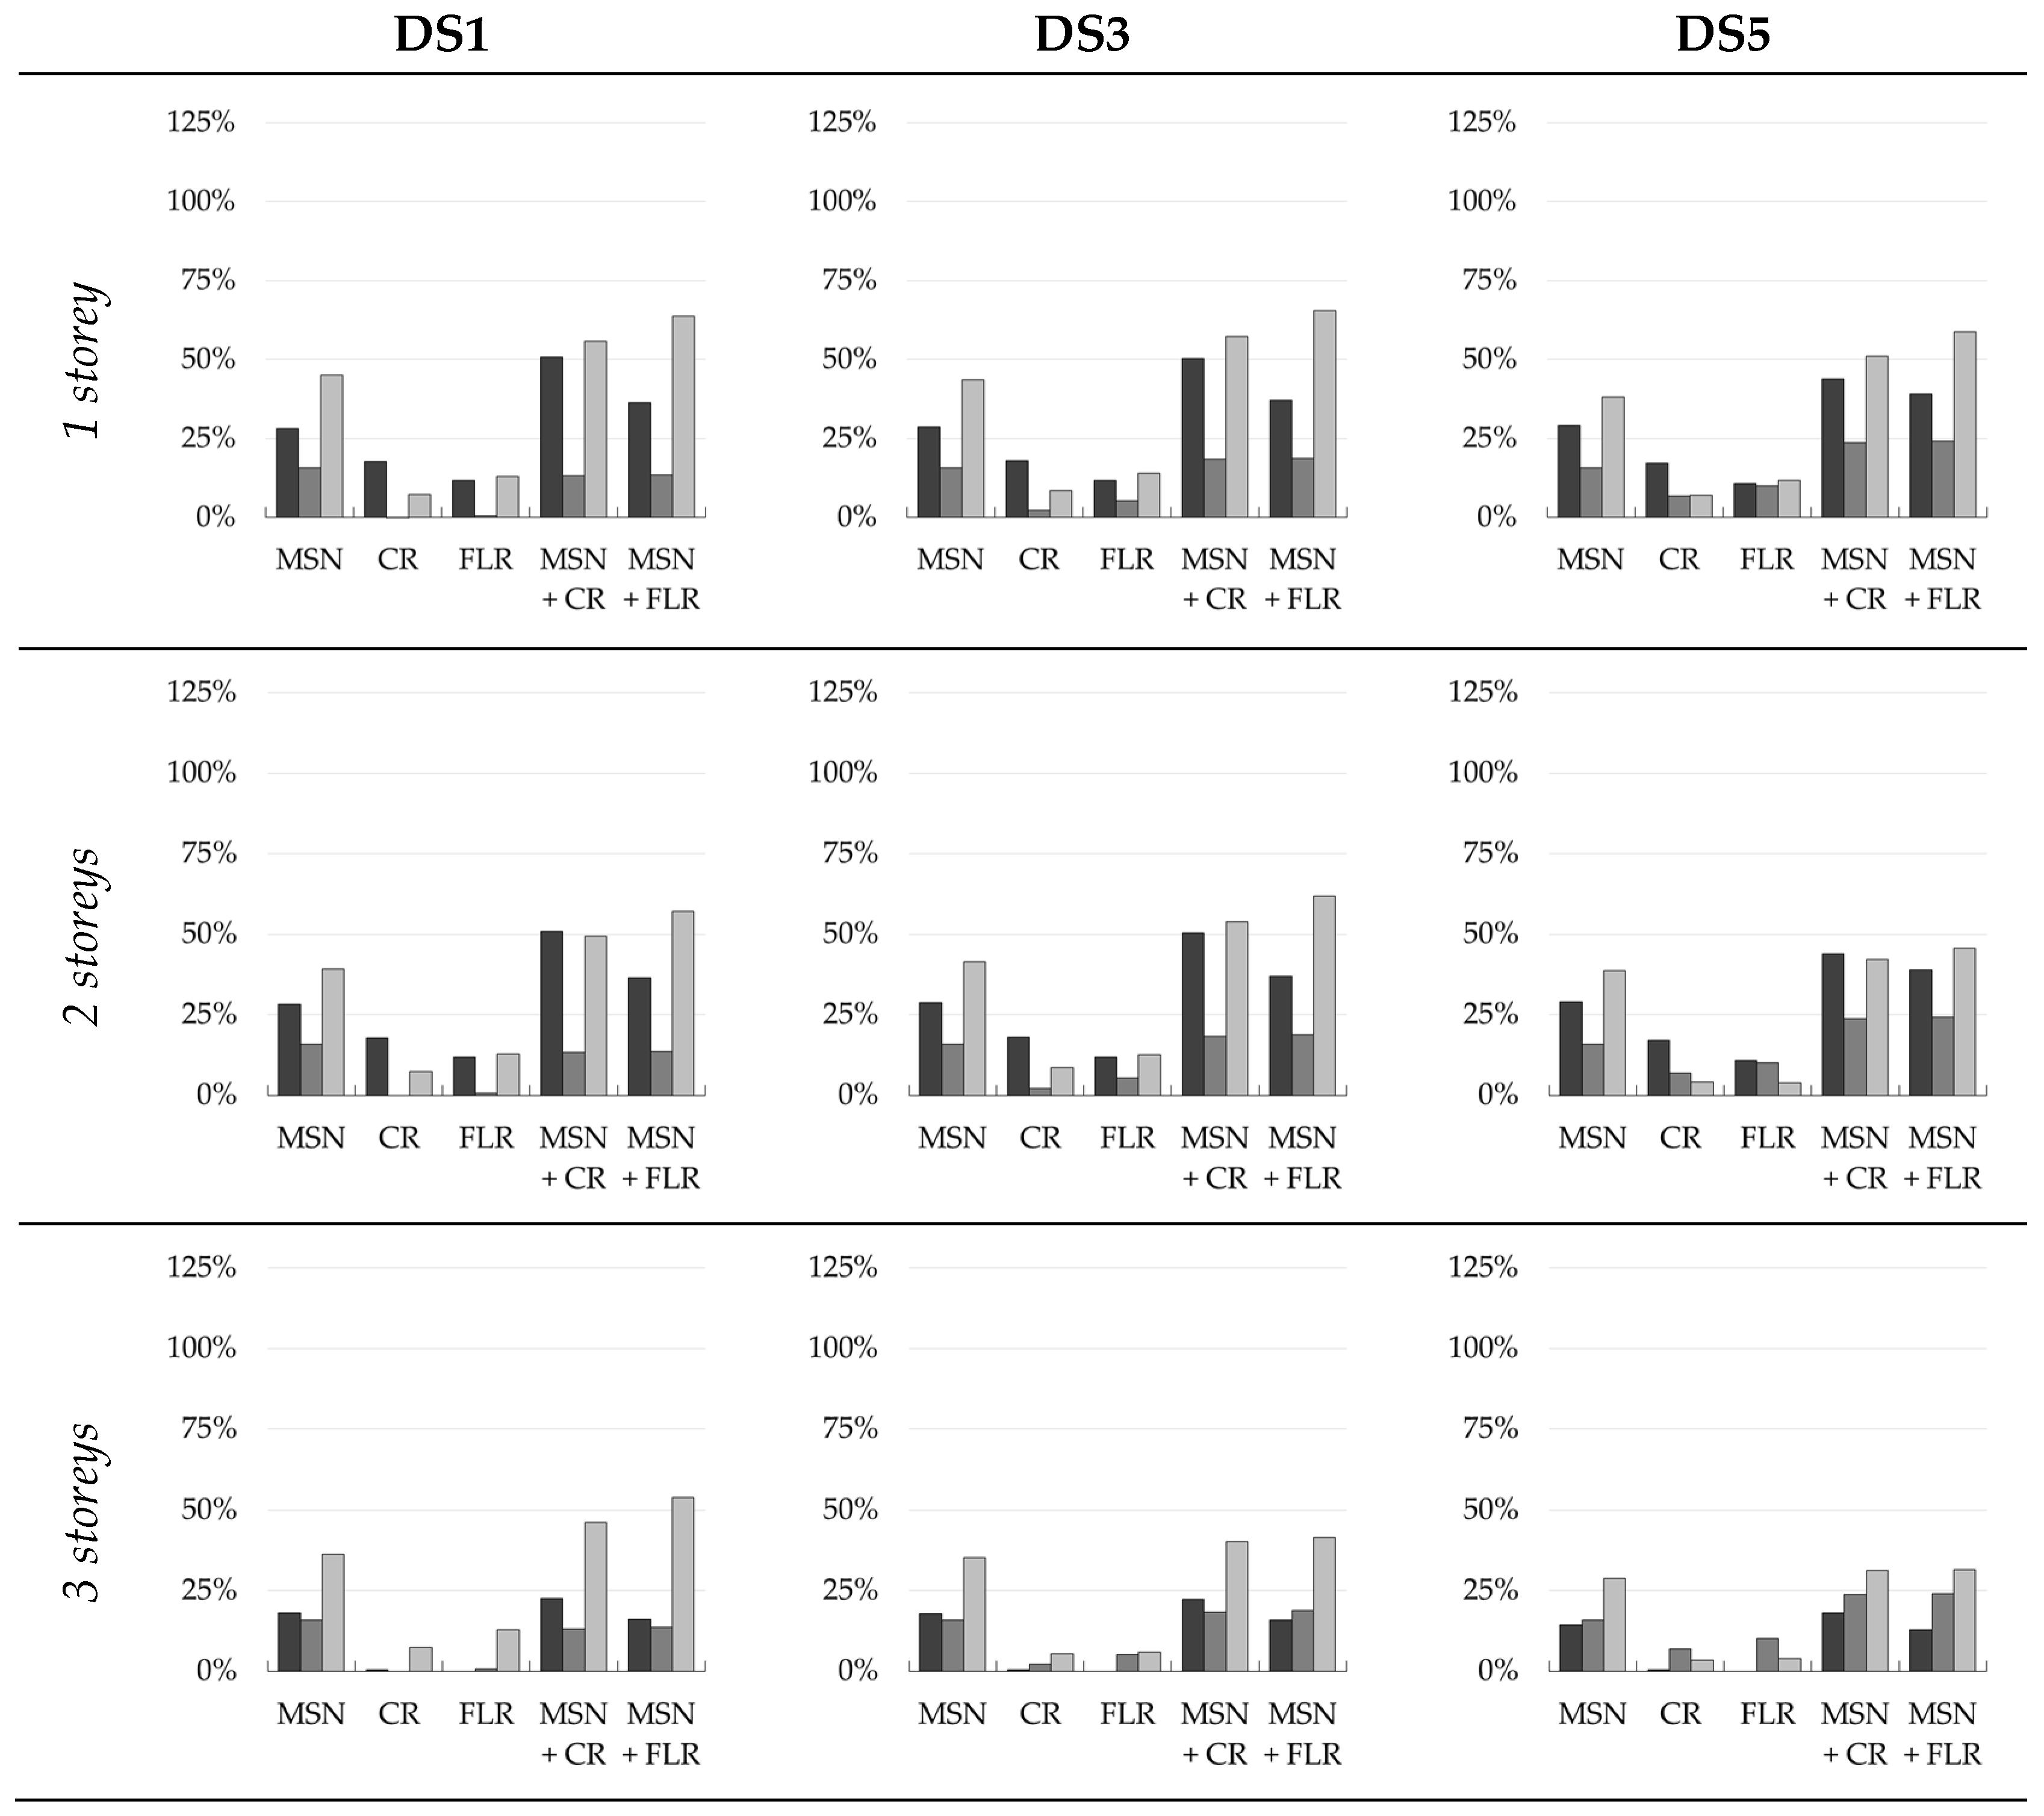
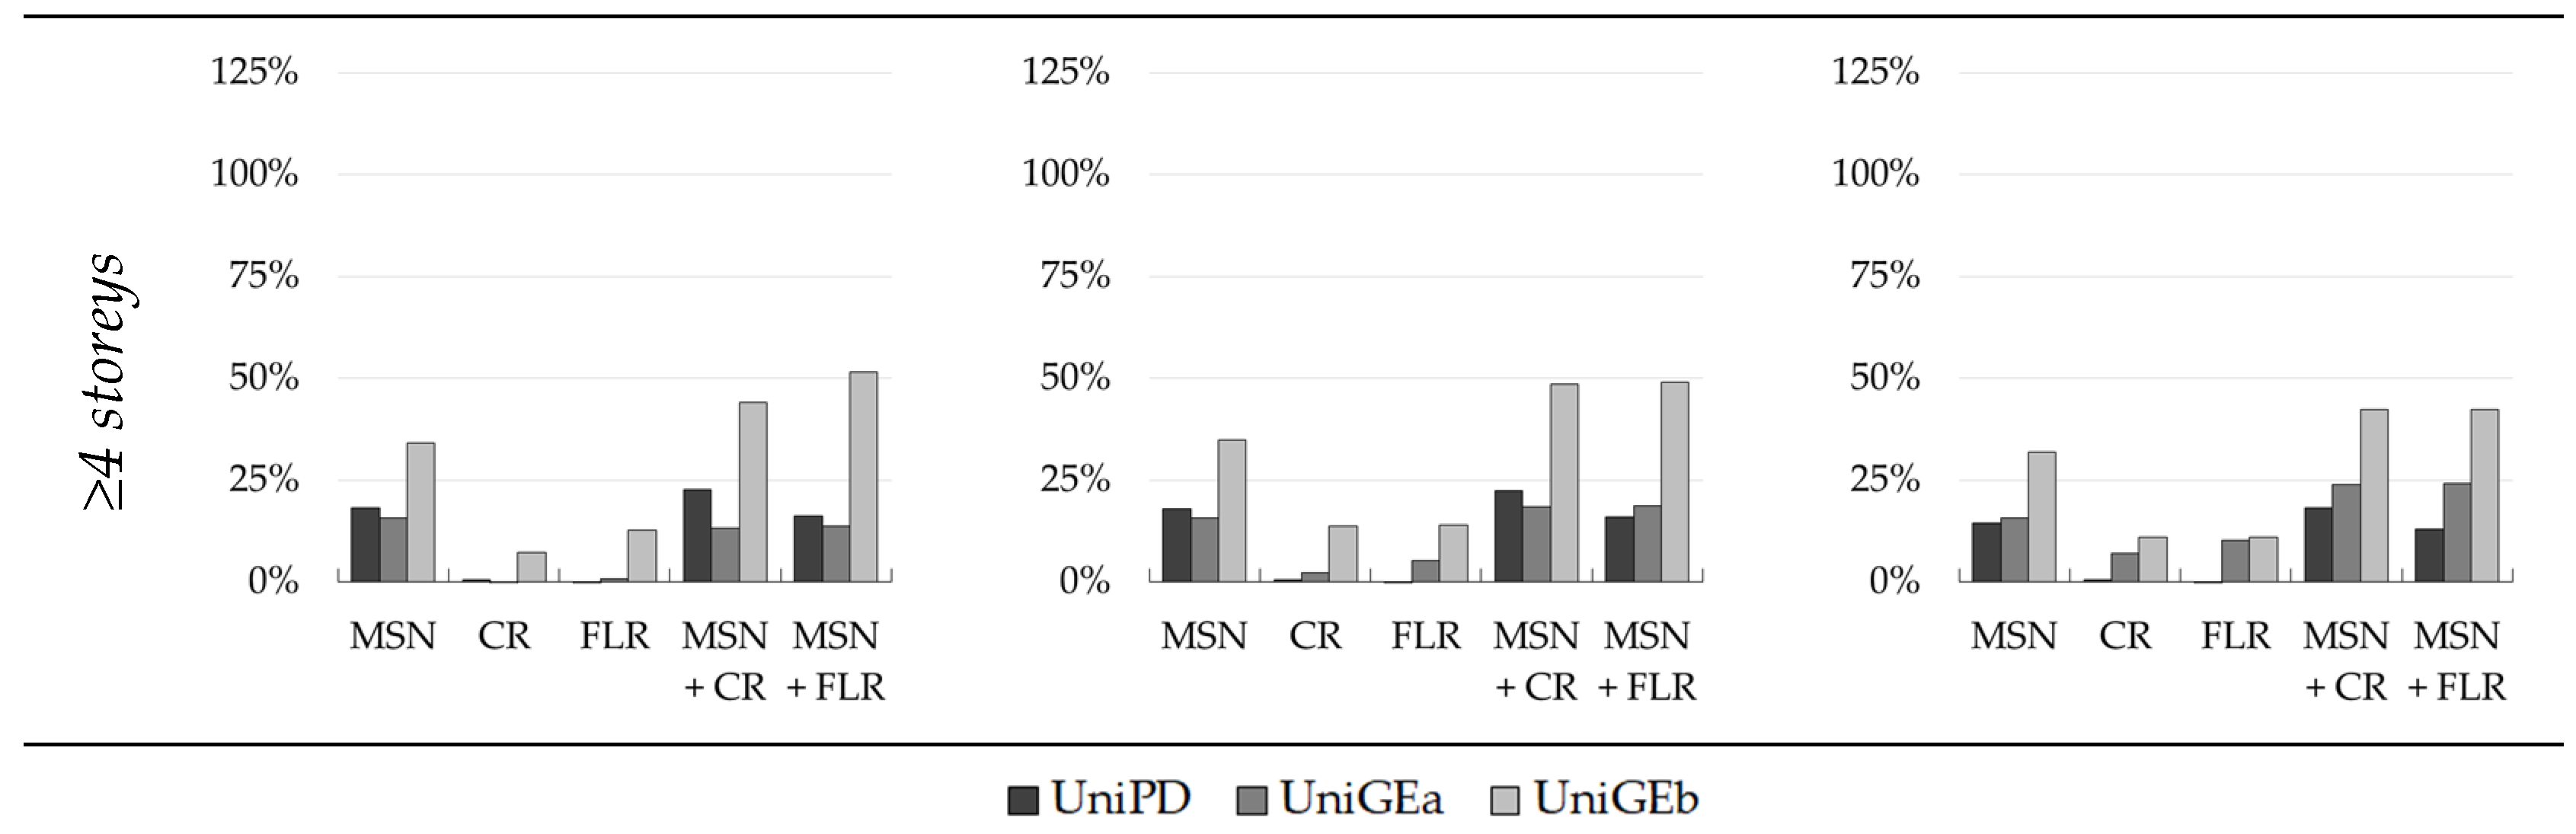
5. Effectiveness of Interventions
6. Conclusions
- The best-performing interventions are those of masonry strengthening (MSN2, MSN) for all of the construction periods analysed with a decreasing effectiveness as the age of the building decreases (i.e., for the more recent construction periods);
- Referring to DS3 (shown in Figure 10) and considering an average value among the results from the three methodologies, average percentage increases in the median PGA of 67% for pre-1919, 42% for 1946–1960, and 29% for 1971–1980 can be observed in the case of masonry strengthening;
- Concerning floor stiffening (FLR) interventions and to improve the box-like behaviour of the building by means of tie-rods (TR) or confining-rings (CR), it can be observed that, in this case, their effectiveness has the tendency to decrease as the age of the building decreases;
- For these interventions, the average increase in the DS3 median PGA is 39% for pre-1919, 20% for 1946–1960, and 10% for 1971–1980 for the FLR intervention, and 23% for pre-1919, 14% for 1946–1960, and 10% for 1971–1980 for the TR/CR interventions;
- As a summary for all types of strengthening, it can be said that FLR interventions drastically improve the seismic responses of more ancient buildings due to the poor performance of their original floors, while the effectiveness of this kind of intervention noticeably decreases in newer buildings. TR and CR interventions demonstrate more consistent behaviour in terms of improving the seismic performance of masonry buildings, despite having a minor effectiveness decrease throughout the different construction periods. Lastly, masonry strengthening interventions maintain high effectiveness, even in recent construction periods;
- The combined application of more interventions is always more efficient than the application of the individual interventions;
- The results presented by a percentage increase in the performance brought by different interventions for different building macro-classes obtained with the three methods confirmed the previous results and allowed the three methods to be compared;
- Although the results of the three models are different, due to their different approaches, the mitigated fragility sets display similar trends in terms of the improvements brought by the interventions, mutually validating the reliability of the three proposed models.
Author Contributions
Funding
Data Availability Statement
Acknowledgments
Conflicts of Interest
Appendix A

| Pre-1919 | DS1 | DS2 | DS3 | DS4 | DS5 | |||||||
|---|---|---|---|---|---|---|---|---|---|---|---|---|
| Id | N. Storeys | Intervention | µ [g] | β [-] | µ [g] | β [-] | µ [g] | β [-] | µ [g] | β [-] | µ [g] | β [-] |
| 1 | 1 | AS-BUILT | 0.099 | 0.600 | 0.162 | 0.600 | 0.265 | 0.600 | 0.433 | 0.600 | 0.708 | 0.600 |
| 2 | 1 | MSN1 | 0.147 | 0.600 | 0.241 | 0.600 | 0.394 | 0.600 | 0.644 | 0.600 | 1.052 | 0.600 |
| 3 | 1 | MSN2 | 0.192 | 0.600 | 0.314 | 0.600 | 0.513 | 0.600 | 0.839 | 0.600 | 1.371 | 0.600 |
| 4 | 1 | TR | 0.110 | 0.650 | 0.188 | 0.650 | 0.321 | 0.650 | 0.548 | 0.650 | 0.937 | 0.650 |
| 5 | 1 | FLR | 0.135 | 0.650 | 0.231 | 0.650 | 0.394 | 0.650 | 0.673 | 0.650 | 1.151 | 0.650 |
| 6 | 1 | MSN1 + TR | 0.145 | 0.650 | 0.247 | 0.650 | 0.423 | 0.650 | 0.723 | 0.650 | 1.235 | 0.650 |
| 7 | 1 | MSN1 + FLR | 0.161 | 0.650 | 0.275 | 0.650 | 0.471 | 0.650 | 0.805 | 0.650 | 1.376 | 0.650 |
| 8 | 1 | MSN2 + TR | 0.187 | 0.650 | 0.319 | 0.650 | 0.545 | 0.650 | 0.932 | 0.650 | 1.593 | 0.650 |
| 9 | 1 | MSN2 + FLR | 0.201 | 0.650 | 0.343 | 0.650 | 0.586 | 0.650 | 1.001 | 0.650 | 1.712 | 0.650 |
| 10 | 2 | AS-BUILT | 0.091 | 0.625 | 0.153 | 0.625 | 0.255 | 0.625 | 0.427 | 0.625 | 0.713 | 0.625 |
| 11 | 2 | MSN1 | 0.136 | 0.625 | 0.227 | 0.625 | 0.380 | 0.625 | 0.635 | 0.625 | 1.061 | 0.625 |
| 12 | 2 | MSN2 | 0.164 | 0.625 | 0.275 | 0.625 | 0.460 | 0.625 | 0.768 | 0.625 | 1.284 | 0.625 |
| 13 | 2 | TR | 0.101 | 0.675 | 0.177 | 0.675 | 0.309 | 0.675 | 0.541 | 0.675 | 0.945 | 0.675 |
| 14 | 2 | FLR | 0.122 | 0.700 | 0.217 | 0.700 | 0.388 | 0.700 | 0.694 | 0.700 | 1.241 | 0.700 |
| 15 | 2 | MSN1 + TR | 0.133 | 0.675 | 0.233 | 0.675 | 0.408 | 0.675 | 0.712 | 0.675 | 1.245 | 0.675 |
| 16 | 2 | MSN1 + FLR | 0.145 | 0.700 | 0.260 | 0.700 | 0.464 | 0.700 | 0.830 | 0.700 | 1.483 | 0.700 |
| 17 | 2 | MSN2 + TR | 0.160 | 0.675 | 0.280 | 0.675 | 0.489 | 0.675 | 0.855 | 0.675 | 1.495 | 0.675 |
| 18 | 2 | MSN2 + FLR | 0.170 | 0.700 | 0.303 | 0.700 | 0.542 | 0.700 | 0.969 | 0.700 | 1.731 | 0.700 |
| 19 | 3 | AS-BUILT | 0.084 | 0.650 | 0.144 | 0.650 | 0.246 | 0.650 | 0.421 | 0.650 | 0.719 | 0.650 |
| 20 | 3 | MSN1 | 0.128 | 0.625 | 0.214 | 0.625 | 0.358 | 0.625 | 0.598 | 0.625 | 1.000 | 0.625 |
| 21 | 3 | MSN2 | 0.159 | 0.600 | 0.259 | 0.600 | 0.424 | 0.600 | 0.693 | 0.600 | 1.132 | 0.600 |
| 22 | 3 | TR | 0.093 | 0.700 | 0.167 | 0.700 | 0.298 | 0.700 | 0.533 | 0.700 | 0.953 | 0.700 |
| 23 | 3 | FLR | 0.112 | 0.725 | 0.205 | 0.725 | 0.375 | 0.725 | 0.685 | 0.725 | 1.251 | 0.725 |
| 24 | 3 | MSN1 + TR | 0.126 | 0.675 | 0.220 | 0.675 | 0.384 | 0.675 | 0.672 | 0.675 | 1.174 | 0.675 |
| 25 | 3 | MSN1 + FLR | 0.137 | 0.700 | 0.245 | 0.700 | 0.438 | 0.700 | 0.782 | 0.700 | 1.398 | 0.700 |
| 26 | 3 | MSN2 + TR | 0.154 | 0.650 | 0.264 | 0.650 | 0.451 | 0.650 | 0.771 | 0.650 | 1.318 | 0.650 |
| 27 | 3 | MSN2 + FLR | 0.164 | 0.675 | 0.286 | 0.675 | 0.500 | 0.675 | 0.873 | 0.675 | 1.526 | 0.675 |
| 28 | ≥4 | AS-BUILT | 0.083 | 0.600 | 0.136 | 0.600 | 0.222 | 0.600 | 0.363 | 0.600 | 0.593 | 0.600 |
| 29 | ≥4 | MSN1 | 0.121 | 0.575 | 0.193 | 0.575 | 0.309 | 0.575 | 0.494 | 0.575 | 0.789 | 0.575 |
| 30 | ≥4 | MSN2 | 0.147 | 0.550 | 0.231 | 0.550 | 0.360 | 0.550 | 0.563 | 0.550 | 0.880 | 0.550 |
| 31 | ≥4 | TR | 0.097 | 0.675 | 0.169 | 0.675 | 0.296 | 0.675 | 0.517 | 0.675 | 0.904 | 0.675 |
| 32 | ≥4 | FLR | 0.104 | 0.675 | 0.182 | 0.675 | 0.318 | 0.675 | 0.557 | 0.675 | 0.973 | 0.675 |
| 33 | ≥4 | MSN1 + TR | 0.120 | 0.650 | 0.206 | 0.650 | 0.352 | 0.650 | 0.601 | 0.650 | 1.028 | 0.650 |
| 34 | ≥4 | MSN1 + FLR | 0.126 | 0.650 | 0.215 | 0.650 | 0.367 | 0.650 | 0.628 | 0.650 | 1.073 | 0.650 |
| 35 | ≥4 | MSN2 + TR | 0.144 | 0.625 | 0.241 | 0.625 | 0.403 | 0.625 | 0.673 | 0.625 | 1.125 | 0.625 |
| 36 | ≥4 | MSN2 + FLR | 0.149 | 0.625 | 0.249 | 0.625 | 0.416 | 0.625 | 0.695 | 0.625 | 1.162 | 0.625 |
| 1919–1945 | DS1 | DS2 | DS3 | DS4 | DS5 | |||||||
|---|---|---|---|---|---|---|---|---|---|---|---|---|
| Id | N. Storeys | Intervention | µ [g] | β [-] | µ [g] | β [-] | µ [g] | β [-] | µ [g] | β [-] | µ [g] | β [-] |
| 37 | 1 | AS-BUILT | 0.120 | 0.650 | 0.205 | 0.650 | 0.350 | 0.650 | 0.599 | 0.650 | 1.023 | 0.650 |
| 38 | 1 | MSN1 | 0.171 | 0.650 | 0.292 | 0.650 | 0.498 | 0.650 | 0.852 | 0.650 | 1.456 | 0.650 |
| 39 | 1 | MSN2 | 0.216 | 0.650 | 0.369 | 0.650 | 0.631 | 0.650 | 1.078 | 0.650 | 1.842 | 0.650 |
| 40 | 1 | TR | 0.136 | 0.675 | 0.237 | 0.675 | 0.415 | 0.675 | 0.725 | 0.675 | 1.268 | 0.675 |
| 41 | 1 | FLR | 0.154 | 0.700 | 0.275 | 0.700 | 0.491 | 0.700 | 0.878 | 0.700 | 1.570 | 0.700 |
| 42 | 1 | MSN1 + TR | 0.172 | 0.675 | 0.300 | 0.675 | 0.525 | 0.675 | 0.917 | 0.675 | 1.604 | 0.675 |
| 43 | 1 | MSN1 + FLR | 0.181 | 0.700 | 0.324 | 0.700 | 0.580 | 0.700 | 1.036 | 0.700 | 1.852 | 0.700 |
| 44 | 1 | MSN2 + TR | 0.215 | 0.675 | 0.376 | 0.675 | 0.657 | 0.675 | 1.148 | 0.675 | 2.006 | 0.675 |
| 45 | 1 | MSN2 + FLR | 0.221 | 0.700 | 0.395 | 0.700 | 0.707 | 0.700 | 1.263 | 0.700 | 2.258 | 0.700 |
| 46 | 2 | AS-BUILT | 0.107 | 0.675 | 0.188 | 0.675 | 0.328 | 0.675 | 0.573 | 0.675 | 1.002 | 0.675 |
| 47 | 2 | MSN1 | 0.153 | 0.675 | 0.267 | 0.675 | 0.467 | 0.675 | 0.816 | 0.675 | 1.426 | 0.675 |
| 48 | 2 | MSN2 | 0.186 | 0.650 | 0.318 | 0.650 | 0.544 | 0.650 | 0.930 | 0.650 | 1.590 | 0.650 |
| 49 | 2 | TR | 0.122 | 0.700 | 0.217 | 0.700 | 0.388 | 0.700 | 0.694 | 0.700 | 1.241 | 0.700 |
| 50 | 2 | FLR | 0.135 | 0.750 | 0.252 | 0.750 | 0.471 | 0.750 | 0.879 | 0.750 | 1.644 | 0.750 |
| 51 | 2 | MSN1 + TR | 0.154 | 0.700 | 0.275 | 0.700 | 0.491 | 0.700 | 0.878 | 0.700 | 1.570 | 0.700 |
| 52 | 2 | MSN1 + FLR | 0.159 | 0.750 | 0.297 | 0.750 | 0.555 | 0.750 | 1.037 | 0.750 | 1.939 | 0.750 |
| 53 | 2 | MSN2 + TR | 0.186 | 0.675 | 0.325 | 0.675 | 0.568 | 0.675 | 0.993 | 0.675 | 1.735 | 0.675 |
| 54 | 2 | MSN2 + FLR | 0.188 | 0.725 | 0.344 | 0.725 | 0.628 | 0.725 | 1.148 | 0.725 | 2.098 | 0.725 |
| 55 | 3 | AS-BUILT | 0.107 | 0.650 | 0.182 | 0.650 | 0.311 | 0.650 | 0.532 | 0.650 | 0.910 | 0.650 |
| 56 | 3 | MSN1 | 0.155 | 0.625 | 0.259 | 0.625 | 0.433 | 0.625 | 0.724 | 0.625 | 1.211 | 0.625 |
| 57 | 3 | MSN2 | 0.189 | 0.600 | 0.309 | 0.600 | 0.506 | 0.600 | 0.826 | 0.600 | 1.351 | 0.600 |
| 58 | 3 | TR | 0.118 | 0.700 | 0.211 | 0.700 | 0.377 | 0.700 | 0.674 | 0.700 | 1.205 | 0.700 |
| 59 | 3 | FLR | 0.134 | 0.725 | 0.244 | 0.725 | 0.447 | 0.725 | 0.817 | 0.725 | 1.493 | 0.725 |
| 60 | 3 | MSN1 + TR | 0.153 | 0.675 | 0.267 | 0.675 | 0.467 | 0.675 | 0.816 | 0.675 | 1.426 | 0.675 |
| 61 | 3 | MSN1 + FLR | 0.161 | 0.700 | 0.288 | 0.700 | 0.515 | 0.700 | 0.921 | 0.700 | 1.647 | 0.700 |
| 62 | 3 | MSN2 + TR | 0.185 | 0.650 | 0.316 | 0.650 | 0.539 | 0.650 | 0.922 | 0.650 | 1.576 | 0.650 |
| 63 | 3 | MSN2 + FLR | 0.191 | 0.675 | 0.334 | 0.675 | 0.583 | 0.675 | 1.020 | 0.675 | 1.782 | 0.675 |
| 64 | ≥4 | AS-BUILT | 0.098 | 0.650 | 0.167 | 0.650 | 0.285 | 0.650 | 0.487 | 0.650 | 0.833 | 0.650 |
| 65 | ≥4 | MSN1 | 0.142 | 0.625 | 0.237 | 0.625 | 0.397 | 0.625 | 0.663 | 0.625 | 1.109 | 0.625 |
| 66 | ≥4 | MSN2 | 0.163 | 0.600 | 0.267 | 0.600 | 0.436 | 0.600 | 0.713 | 0.600 | 1.166 | 0.600 |
| 67 | ≥4 | TR | 0.116 | 0.700 | 0.208 | 0.700 | 0.372 | 0.700 | 0.664 | 0.700 | 1.187 | 0.700 |
| 68 | ≥4 | FLR | 0.114 | 0.725 | 0.208 | 0.725 | 0.380 | 0.725 | 0.695 | 0.725 | 1.270 | 0.725 |
| 69 | ≥4 | MSN1 + TR | 0.145 | 0.675 | 0.253 | 0.675 | 0.442 | 0.675 | 0.773 | 0.675 | 1.350 | 0.675 |
| 70 | ≥4 | MSN1 + FLR | 0.141 | 0.700 | 0.253 | 0.700 | 0.452 | 0.700 | 0.808 | 0.700 | 1.444 | 0.700 |
| 71 | ≥4 | MSN2 + TR | 0.164 | 0.650 | 0.280 | 0.650 | 0.479 | 0.650 | 0.819 | 0.650 | 1.400 | 0.650 |
| 72 | ≥4 | MSN2 + FLR | 0.160 | 0.675 | 0.280 | 0.675 | 0.490 | 0.675 | 0.857 | 0.675 | 1.497 | 0.675 |
| 1946–1960 | DS1 | DS2 | DS3 | DS4 | DS5 | |||||||
|---|---|---|---|---|---|---|---|---|---|---|---|---|
| Id | N. Storeys | Intervention | µ [g] | β [-] | µ [g] | β [-] | µ [g] | β [-] | µ [g] | β [-] | µ [g] | β [-] |
| 73 | 1 | AS-BUILT | 0.184 | 0.600 | 0.300 | 0.600 | 0.491 | 0.600 | 0.802 | 0.600 | 1.312 | 0.600 |
| 74 | 1 | MSN | 0.273 | 0.600 | 0.447 | 0.600 | 0.730 | 0.600 | 1.193 | 0.600 | 1.950 | 0.600 |
| 75 | 1 | CR | 0.201 | 0.600 | 0.328 | 0.600 | 0.536 | 0.600 | 0.876 | 0.600 | 1.432 | 0.600 |
| 76 | 1 | FLR | 0.224 | 0.625 | 0.374 | 0.625 | 0.626 | 0.625 | 1.046 | 0.625 | 1.748 | 0.625 |
| 77 | 1 | MSN + CR | 0.276 | 0.600 | 0.451 | 0.600 | 0.737 | 0.600 | 1.205 | 0.600 | 1.969 | 0.600 |
| 78 | 1 | MSN + FLR | 0.283 | 0.625 | 0.473 | 0.625 | 0.790 | 0.625 | 1.321 | 0.625 | 2.208 | 0.625 |
| 79 | 2 | AS-BUILT | 0.156 | 0.650 | 0.267 | 0.650 | 0.456 | 0.650 | 0.780 | 0.650 | 1.333 | 0.650 |
| 80 | 2 | MSN | 0.222 | 0.650 | 0.380 | 0.650 | 0.649 | 0.650 | 1.110 | 0.650 | 1.897 | 0.650 |
| 81 | 2 | CR | 0.167 | 0.675 | 0.292 | 0.675 | 0.510 | 0.675 | 0.891 | 0.675 | 1.557 | 0.675 |
| 82 | 2 | FLR | 0.190 | 0.675 | 0.333 | 0.675 | 0.582 | 0.675 | 1.017 | 0.675 | 1.777 | 0.675 |
| 83 | 2 | MSN + CR | 0.220 | 0.675 | 0.384 | 0.675 | 0.671 | 0.675 | 1.173 | 0.675 | 2.051 | 0.675 |
| 84 | 2 | MSN + FLR | 0.232 | 0.675 | 0.405 | 0.675 | 0.707 | 0.675 | 1.236 | 0.675 | 2.161 | 0.675 |
| 85 | 3 | AS-BUILT | 0.131 | 0.650 | 0.224 | 0.650 | 0.383 | 0.650 | 0.654 | 0.650 | 1.118 | 0.650 |
| 86 | 3 | MSN | 0.191 | 0.625 | 0.318 | 0.625 | 0.532 | 0.625 | 0.890 | 0.625 | 1.487 | 0.625 |
| 87 | 3 | CR | 0.148 | 0.675 | 0.259 | 0.675 | 0.453 | 0.675 | 0.792 | 0.675 | 1.384 | 0.675 |
| 88 | 3 | FLR | 0.145 | 0.700 | 0.259 | 0.700 | 0.463 | 0.700 | 0.828 | 0.700 | 1.480 | 0.700 |
| 89 | 3 | MSN + CR | 0.192 | 0.650 | 0.328 | 0.650 | 0.561 | 0.650 | 0.958 | 0.650 | 1.638 | 0.650 |
| 90 | 3 | MSN + FLR | 0.188 | 0.675 | 0.328 | 0.675 | 0.573 | 0.675 | 1.002 | 0.675 | 1.751 | 0.675 |
| 91 | ≥4 | AS-BUILT | 0.130 | 0.625 | 0.217 | 0.625 | 0.363 | 0.625 | 0.607 | 0.625 | 1.015 | 0.625 |
| 92 | ≥4 | MSN | 0.178 | 0.600 | 0.292 | 0.600 | 0.477 | 0.600 | 0.779 | 0.600 | 1.274 | 0.600 |
| 93 | ≥4 | CR | 0.147 | 0.650 | 0.252 | 0.650 | 0.430 | 0.650 | 0.736 | 0.650 | 1.257 | 0.650 |
| 94 | ≥4 | FLR | 0.144 | 0.675 | 0.252 | 0.675 | 0.440 | 0.675 | 0.769 | 0.675 | 1.344 | 0.675 |
| 95 | ≥4 | MSN + CR | 0.181 | 0.625 | 0.302 | 0.625 | 0.505 | 0.625 | 0.843 | 0.625 | 1.410 | 0.625 |
| 96 | ≥4 | MSN + FLR | 0.177 | 0.650 | 0.302 | 0.650 | 0.516 | 0.650 | 0.882 | 0.650 | 1.508 | 0.650 |
| 1961–1970 | DS1 | DS2 | DS3 | DS4 | DS5 | |||||||
|---|---|---|---|---|---|---|---|---|---|---|---|---|
| Id | N. Storeys | Intervention | µ [g] | β [-] | µ [g] | β [-] | µ [g] | β [-] | µ [g] | β [-] | µ [g] | β [-] |
| 97 | 1 | AS-BUILT | 0.294 | 0.600 | 0.481 | 0.600 | 0.786 | 0.600 | 1.284 | 0.600 | 2.099 | 0.600 |
| 98 | 1 | MSN | 0.367 | 0.600 | 0.599 | 0.600 | 0.979 | 0.600 | 1.601 | 0.600 | 2.616 | 0.600 |
| 99 | 1 | CR | 0.288 | 0.625 | 0.481 | 0.625 | 0.803 | 0.625 | 1.343 | 0.625 | 2.244 | 0.625 |
| 100 | 1 | FLR | 0.314 | 0.625 | 0.525 | 0.625 | 0.877 | 0.625 | 1.466 | 0.625 | 2.451 | 0.625 |
| 101 | 1 | MSN + CR | 0.358 | 0.625 | 0.599 | 0.625 | 1.001 | 0.625 | 1.674 | 0.625 | 2.798 | 0.625 |
| 102 | 1 | MSN + FLR | 0.365 | 0.625 | 0.609 | 0.625 | 1.019 | 0.625 | 1.702 | 0.625 | 2.846 | 0.625 |
| 103 | 2 | AS-BUILT | 0.285 | 0.600 | 0.467 | 0.600 | 0.763 | 0.600 | 1.247 | 0.600 | 2.038 | 0.600 |
| 104 | 2 | MSN | 0.356 | 0.600 | 0.582 | 0.600 | 0.951 | 0.600 | 1.554 | 0.600 | 2.541 | 0.600 |
| 105 | 2 | CR | 0.279 | 0.625 | 0.467 | 0.625 | 0.780 | 0.625 | 1.304 | 0.625 | 2.179 | 0.625 |
| 106 | 2 | FLR | 0.305 | 0.625 | 0.510 | 0.625 | 0.852 | 0.625 | 1.424 | 0.625 | 2.380 | 0.625 |
| 107 | 2 | MSN + CR | 0.348 | 0.625 | 0.582 | 0.625 | 0.972 | 0.625 | 1.625 | 0.625 | 2.717 | 0.625 |
| 108 | 2 | MSN + FLR | 0.354 | 0.625 | 0.592 | 0.625 | 0.989 | 0.625 | 1.653 | 0.625 | 2.763 | 0.625 |
| 109 | 3 | AS-BUILT | 0.236 | 0.650 | 0.403 | 0.650 | 0.689 | 0.650 | 1.177 | 0.650 | 2.012 | 0.650 |
| 110 | 3 | MSN | 0.294 | 0.650 | 0.502 | 0.650 | 0.858 | 0.650 | 1.467 | 0.650 | 2.508 | 0.650 |
| 111 | 3 | CR | 0.252 | 0.675 | 0.440 | 0.675 | 0.769 | 0.675 | 1.344 | 0.675 | 2.350 | 0.675 |
| 112 | 3 | FLR | 0.252 | 0.675 | 0.440 | 0.675 | 0.769 | 0.675 | 1.344 | 0.675 | 2.350 | 0.675 |
| 113 | 3 | MSN + CR | 0.292 | 0.675 | 0.511 | 0.675 | 0.893 | 0.675 | 1.561 | 0.675 | 2.728 | 0.675 |
| 114 | 3 | MSN + FLR | 0.292 | 0.675 | 0.511 | 0.675 | 0.893 | 0.675 | 1.561 | 0.675 | 2.728 | 0.675 |
| 115 | ≥4 | AS-BUILT | 0.219 | 0.600 | 0.358 | 0.600 | 0.586 | 0.600 | 0.957 | 0.600 | 1.564 | 0.600 |
| 116 | ≥4 | MSN | 0.273 | 0.600 | 0.447 | 0.600 | 0.730 | 0.600 | 1.193 | 0.600 | 1.950 | 0.600 |
| 117 | ≥4 | CR | 0.234 | 0.625 | 0.391 | 0.625 | 0.654 | 0.625 | 1.093 | 0.625 | 1.827 | 0.625 |
| 118 | ≥4 | FLR | 0.229 | 0.650 | 0.391 | 0.650 | 0.669 | 0.650 | 1.143 | 0.650 | 1.954 | 0.650 |
| 119 | ≥4 | MSN + CR | 0.272 | 0.625 | 0.454 | 0.625 | 0.759 | 0.625 | 1.269 | 0.625 | 2.121 | 0.625 |
| 120 | ≥4 | MSN + FLR | 0.266 | 0.650 | 0.454 | 0.650 | 0.776 | 0.650 | 1.327 | 0.650 | 2.268 | 0.650 |
| 1971–1980 | DS1 | DS2 | DS3 | DS4 | DS5 | |||||||
|---|---|---|---|---|---|---|---|---|---|---|---|---|
| Id | N. Storeys | Intervention | µ [g] | β [-] | µ [g] | β [-] | µ [g] | β [-] | µ [g] | β [-] | µ [g] | β [-] |
| 121 | 1 | AS-BUILT | 0.338 | 0.575 | 0.541 | 0.575 | 0.864 | 0.575 | 1.381 | 0.575 | 2.208 | 0.575 |
| 122 | 1 | MSN | 0.392 | 0.575 | 0.626 | 0.575 | 1.001 | 0.575 | 1.600 | 0.575 | 2.557 | 0.575 |
| 123 | 1 | CR | 0.331 | 0.600 | 0.541 | 0.600 | 0.884 | 0.600 | 1.444 | 0.600 | 2.361 | 0.600 |
| 124 | 1 | FLR | 0.341 | 0.600 | 0.557 | 0.600 | 0.910 | 0.600 | 1.487 | 0.600 | 2.431 | 0.600 |
| 125 | 1 | MSN + CR | 0.383 | 0.600 | 0.626 | 0.600 | 1.023 | 0.600 | 1.673 | 0.600 | 2.734 | 0.600 |
| 126 | 1 | MSN + FLR | 0.384 | 0.600 | 0.628 | 0.600 | 1.026 | 0.600 | 1.678 | 0.600 | 2.742 | 0.600 |
| 127 | 2 | AS-BUILT | 0.321 | 0.600 | 0.525 | 0.600 | 0.858 | 0.600 | 1.402 | 0.600 | 2.292 | 0.600 |
| 128 | 2 | MSN | 0.372 | 0.600 | 0.608 | 0.600 | 0.994 | 0.600 | 1.624 | 0.600 | 2.655 | 0.600 |
| 129 | 2 | CR | 0.314 | 0.625 | 0.525 | 0.625 | 0.877 | 0.625 | 1.466 | 0.625 | 2.451 | 0.625 |
| 130 | 2 | FLR | 0.323 | 0.625 | 0.541 | 0.625 | 0.904 | 0.625 | 1.510 | 0.625 | 2.524 | 0.625 |
| 131 | 2 | MSN + CR | 0.364 | 0.625 | 0.608 | 0.625 | 1.016 | 0.625 | 1.699 | 0.625 | 2.839 | 0.625 |
| 132 | 2 | MSN + FLR | 0.365 | 0.625 | 0.610 | 0.625 | 1.019 | 0.625 | 1.704 | 0.625 | 2.848 | 0.625 |
| 133 | 3 | AS-BUILT | 0.273 | 0.650 | 0.467 | 0.650 | 0.798 | 0.650 | 1.363 | 0.650 | 2.330 | 0.650 |
| 134 | 3 | MSN | 0.316 | 0.650 | 0.541 | 0.650 | 0.924 | 0.650 | 1.579 | 0.650 | 2.699 | 0.650 |
| 135 | 3 | CR | 0.267 | 0.675 | 0.467 | 0.675 | 0.816 | 0.675 | 1.426 | 0.675 | 2.492 | 0.675 |
| 136 | 3 | FLR | 0.275 | 0.675 | 0.481 | 0.675 | 0.840 | 0.675 | 1.468 | 0.675 | 2.566 | 0.675 |
| 137 | 3 | MSN + CR | 0.309 | 0.675 | 0.541 | 0.675 | 0.945 | 0.675 | 1.651 | 0.675 | 2.886 | 0.675 |
| 138 | 3 | MSN + FLR | 0.310 | 0.675 | 0.542 | 0.675 | 0.948 | 0.675 | 1.656 | 0.675 | 2.895 | 0.675 |
| 139 | ≥4 | AS-BUILT | 0.254 | 0.600 | 0.415 | 0.600 | 0.678 | 0.600 | 1.109 | 0.600 | 1.812 | 0.600 |
| 140 | ≥4 | MSN | 0.294 | 0.600 | 0.481 | 0.600 | 0.786 | 0.600 | 1.284 | 0.600 | 2.099 | 0.600 |
| 141 | ≥4 | CR | 0.248 | 0.625 | 0.415 | 0.625 | 0.694 | 0.625 | 1.159 | 0.625 | 1.938 | 0.625 |
| 142 | ≥4 | FLR | 0.256 | 0.625 | 0.427 | 0.625 | 0.714 | 0.625 | 1.194 | 0.625 | 1.995 | 0.625 |
| 143 | ≥4 | MSN + CR | 0.288 | 0.625 | 0.481 | 0.625 | 0.803 | 0.625 | 1.343 | 0.625 | 2.244 | 0.625 |
| 144 | ≥4 | MSN + FLR | 0.288 | 0.625 | 0.482 | 0.625 | 0.806 | 0.625 | 1.347 | 0.625 | 2.251 | 0.625 |
| Pre-1919 | DS1 | DS2 | DS3 | DS4 | DS5 | |||||||
|---|---|---|---|---|---|---|---|---|---|---|---|---|
| Id | N. Storeys | Intervention | µ [g] | β [-] | µ [g] | β [-] | µ [g] | β [-] | µ [g] | β [-] | µ [g] | β [-] |
| 1, 10 | 1–2 | AS-BUILT | 0.098 | 0.693 | 0.173 | 0.715 | 0.280 | 0.718 | 0.453 | 0.751 | 0.825 | 0.793 |
| 2, 11 | 1–2 | MSN1 | 0.132 | 0.707 | 0.234 | 0.732 | 0.378 | 0.725 | 0.611 | 0.725 | 1.110 | 0.716 |
| 3, 12 | 1–2 | MSN2 | 0.154 | 0.694 | 0.274 | 0.726 | 0.442 | 0.735 | 0.715 | 0.758 | 1.301 | 0.684 |
| 4, 13 | 1–2 | TR | 0.112 | 0.740 | 0.198 | 0.768 | 0.320 | 0.755 | 0.517 | 0.766 | 0.948 | 0.804 |
| 5, 14 | 1–2 | FLR | 0.126 | 0.737 | 0.223 | 0.760 | 0.360 | 0.749 | 0.582 | 0.753 | 1.059 | 0.758 |
| 6, 15 | 1–2 | MSN1 + TR | 0.168 | 0.692 | 0.298 | 0.718 | 0.481 | 0.737 | 0.780 | 0.778 | 1.425 | 0.698 |
| 7, 16 | 1–2 | MSN1 + FLR | 0.205 | 0.702 | 0.365 | 0.703 | 0.588 | 0.683 | 0.945 | 0.677 | 1.685 | 0.670 |
| 8, 17 | 1–2 | MSN2 + TR | 0.190 | 0.730 | 0.338 | 0.737 | 0.545 | 0.729 | 0.879 | 0.761 | 1.579 | 0.711 |
| 9, 18 | 1–2 | MSN2 + FLR | 0.264 | 0.737 | 0.469 | 0.738 | 0.758 | 0.726 | 1.223 | 0.653 | 2.172 | 0.611 |
| 19, 28 | ≥3 | AS-BUILT | 0.073 | 0.747 | 0.129 | 0.776 | 0.209 | 0.784 | 0.337 | 0.781 | 0.612 | 0.808 |
| 20, 29 | ≥3 | MSN1 | 0.111 | 0.756 | 0.197 | 0.786 | 0.317 | 0.774 | 0.514 | 0.785 | 0.942 | 0.816 |
| 21, 30 | ≥3 | MSN2 | 0.127 | 0.748 | 0.225 | 0.780 | 0.363 | 0.767 | 0.587 | 0.772 | 1.068 | 0.767 |
| 22, 31 | ≥3 | TR | 0.078 | 0.736 | 0.139 | 0.757 | 0.224 | 0.761 | 0.362 | 0.770 | 0.656 | 0.806 |
| 23, 32 | ≥3 | FLR | 0.091 | 0.681 | 0.162 | 0.702 | 0.262 | 0.706 | 0.424 | 0.735 | 0.770 | 0.774 |
| 24, 33 | ≥3 | MSN1 + TR | 0.119 | 0.744 | 0.212 | 0.768 | 0.342 | 0.756 | 0.553 | 0.756 | 1.009 | 0.778 |
| 25, 34 | ≥3 | MSN1 + FLR | 0.148 | 0.671 | 0.262 | 0.694 | 0.423 | 0.699 | 0.684 | 0.717 | 1.241 | 0.672 |
| 26, 35 | ≥3 | MSN2 + TR | 0.142 | 0.701 | 0.253 | 0.729 | 0.408 | 0.733 | 0.659 | 0.747 | 1.196 | 0.697 |
| 27, 36 | ≥3 | MSN2 + FLR | 0.184 | 0.686 | 0.327 | 0.700 | 0.529 | 0.709 | 0.856 | 0.752 | 1.554 | 0.708 |
| 1919–1945 | DS1 | DS2 | DS3 | DS4 | DS5 | |||||||
|---|---|---|---|---|---|---|---|---|---|---|---|---|
| Id | N. Storeys | Intervention | µ [g] | β [-] | µ [g] | β [-] | µ [g] | β [-] | µ [g] | β [-] | µ [g] | β [-] |
| 37, 46 | 1–2 | AS-BUILT | 0.107 | 0.753 | 0.190 | 0.767 | 0.307 | 0.765 | 0.496 | 0.785 | 0.910 | 0.813 |
| 38, 47 | 1–2 | MSN1 | 0.142 | 0.705 | 0.253 | 0.733 | 0.408 | 0.742 | 0.660 | 0.764 | 1.197 | 0.712 |
| 39, 48 | 1–2 | MSN2 | 0.162 | 0.701 | 0.287 | 0.734 | 0.465 | 0.754 | 0.753 | 0.791 | 1.373 | 0.694 |
| 40, 49 | 1–2 | TR | 0.116 | 0.771 | 0.206 | 0.798 | 0.332 | 0.781 | 0.538 | 0.774 | 0.983 | 0.803 |
| 41, 50 | 1–2 | FLR | 0.126 | 0.741 | 0.223 | 0.765 | 0.360 | 0.756 | 0.581 | 0.762 | 1.058 | 0.765 |
| 42, 51 | 1–2 | MSN1 + TR | 0.173 | 0.716 | 0.308 | 0.743 | 0.497 | 0.763 | 0.807 | 0.802 | 1.475 | 0.705 |
| 43, 52 | 1–2 | MSN1 + FLR | 0.194 | 0.697 | 0.344 | 0.705 | 0.555 | 0.697 | 0.895 | 0.727 | 1.604 | 0.700 |
| 44, 53 | 1–2 | MSN2 + TR | 0.191 | 0.745 | 0.339 | 0.755 | 0.548 | 0.750 | 0.884 | 0.780 | 1.586 | 0.711 |
| 45, 54 | 1–2 | MSN2 + FLR | 0.233 | 0.696 | 0.413 | 0.714 | 0.665 | 0.693 | 1.066 | 0.627 | 1.888 | 0.599 |
| 55, 64 | ≥3 | AS-BUILT | 0.084 | 0.719 | 0.149 | 0.746 | 0.241 | 0.751 | 0.390 | 0.768 | 0.707 | 0.819 |
| 56, 65 | ≥3 | MSN1 | 0.118 | 0.784 | 0.209 | 0.814 | 0.338 | 0.802 | 0.547 | 0.802 | 0.999 | 0.809 |
| 57, 66 | ≥3 | MSN2 | 0.138 | 0.728 | 0.245 | 0.760 | 0.395 | 0.770 | 0.638 | 0.790 | 1.159 | 0.749 |
| 58, 67 | ≥3 | TR | 0.088 | 0.718 | 0.155 | 0.739 | 0.251 | 0.742 | 0.405 | 0.771 | 0.735 | 0.819 |
| 59, 68 | ≥3 | FLR | 0.086 | 0.725 | 0.153 | 0.737 | 0.247 | 0.747 | 0.399 | 0.768 | 0.724 | 0.828 |
| 60, 69 | ≥3 | MSN1 + TR | 0.123 | 0.743 | 0.218 | 0.775 | 0.353 | 0.762 | 0.570 | 0.764 | 1.038 | 0.773 |
| 61, 70 | ≥3 | MSN1 + FLR | 0.121 | 0.701 | 0.215 | 0.727 | 0.347 | 0.709 | 0.561 | 0.708 | 1.023 | 0.738 |
| 62, 71 | ≥3 | MSN2 + TR | 0.146 | 0.707 | 0.260 | 0.733 | 0.419 | 0.746 | 0.678 | 0.775 | 1.231 | 0.709 |
| 63, 72 | ≥3 | MSN2 + FLR | 0.143 | 0.687 | 0.253 | 0.713 | 0.409 | 0.717 | 0.661 | 0.732 | 1.199 | 0.683 |
| 1946–1960 | DS1 | DS2 | DS3 | DS4 | DS5 | |||||||
|---|---|---|---|---|---|---|---|---|---|---|---|---|
| Id | N. Storeys | Intervention | µ [g] | β [-] | µ [g] | β [-] | µ [g] | β [-] | µ [g] | β [-] | µ [g] | β [-] |
| 73, 79 | 1–2 | AS-BUILT | 0.150 | 0.732 | 0.266 | 0.760 | 0.430 | 0.767 | 0.696 | 0.783 | 1.264 | 0.704 |
| 74, 80 | 1–2 | MSN | 0.196 | 0.750 | 0.348 | 0.751 | 0.561 | 0.732 | 0.903 | 0.747 | 1.618 | 0.704 |
| 75, 81 | 1–2 | CR | 0.170 | 0.800 | 0.302 | 0.818 | 0.488 | 0.809 | 0.792 | 0.820 | 1.448 | 0.702 |
| 76, 82 | 1–2 | FLR | 0.165 | 0.774 | 0.293 | 0.784 | 0.474 | 0.787 | 0.768 | 0.807 | 1.403 | 0.698 |
| 77, 83 | 1–2 | MSN + CR | 0.227 | 0.750 | 0.403 | 0.754 | 0.650 | 0.728 | 1.042 | 0.671 | 1.846 | 0.643 |
| 78, 84 | 1–2 | MSN + FLR | 0.230 | 0.695 | 0.409 | 0.716 | 0.659 | 0.696 | 1.057 | 0.634 | 1.871 | 0.608 |
| 85, 91 | ≥3 | AS-BUILT | 0.135 | 0.748 | 0.240 | 0.783 | 0.387 | 0.782 | 0.625 | 0.800 | 1.134 | 0.763 |
| 86, 92 | ≥3 | MSN | 0.189 | 0.755 | 0.335 | 0.761 | 0.540 | 0.759 | 0.873 | 0.791 | 1.569 | 0.714 |
| 87, 93 | ≥3 | CR | 0.138 | 0.737 | 0.244 | 0.771 | 0.395 | 0.775 | 0.637 | 0.790 | 1.157 | 0.748 |
| 88, 94 | ≥3 | FLR | 0.133 | 0.730 | 0.236 | 0.764 | 0.381 | 0.760 | 0.616 | 0.777 | 1.118 | 0.753 |
| 89, 95 | ≥3 | MSN + CR | 0.192 | 0.759 | 0.340 | 0.767 | 0.549 | 0.756 | 0.886 | 0.778 | 1.590 | 0.711 |
| 90, 96 | ≥3 | MSN + FLR | 0.189 | 0.689 | 0.335 | 0.704 | 0.541 | 0.707 | 0.874 | 0.753 | 1.571 | 0.710 |
| 1961–1980 | DS1 | DS2 | DS3 | DS4 | DS5 | |||||||
|---|---|---|---|---|---|---|---|---|---|---|---|---|
| Id | N. Storeys | Intervention | µ [g] | β [-] | µ [g] | β [-] | µ [g] | β [-] | µ [g] | β [-] | µ [g] | β [-] |
| 97, 103, 121, 127 | 1–2 | AS-BUILT | 0.208 | 0.739 | 0.369 | 0.741 | 0.595 | 0.716 | 0.956 | 0.699 | 1.703 | 0.679 |
| 98, 104, 122, 128 | 1–2 | MSN | 0.267 | 0.754 | 0.474 | 0.760 | 0.766 | 0.753 | 1.237 | 0.659 | 2.199 | 0.608 |
| 99, 105, 123, 129 | 1–2 | CR | 0.245 | 0.745 | 0.435 | 0.751 | 0.702 | 0.731 | 1.127 | 0.642 | 1.995 | 0.602 |
| 100, 106, 124, 130 | 1–2 | FLR | 0.233 | 0.689 | 0.413 | 0.707 | 0.665 | 0.690 | 1.066 | 0.627 | 1.888 | 0.599 |
| 101, 107, 125, 131 | 1–2 | MSN + CR | 0.314 | 0.791 | 0.556 | 0.767 | 0.895 | 0.756 | 1.427 | 0.681 | 2.451 | 0.611 |
| 102, 108, 126, 132 | 1–2 | MSN + FLR | 0.284 | 0.696 | 0.504 | 0.708 | 0.816 | 0.714 | 1.322 | 0.662 | 2.368 | 0.616 |
| 109, 115, 133, 139 | ≥3 | AS-BUILT | 0.169 | 0.676 | 0.300 | 0.706 | 0.485 | 0.736 | 0.786 | 0.785 | 1.437 | 0.700 |
| 110, 116, 134, 140 | ≥3 | MSN | 0.200 | 0.691 | 0.354 | 0.694 | 0.571 | 0.680 | 0.919 | 0.691 | 1.644 | 0.683 |
| 111, 117, 135, 141 | ≥3 | CR | 0.170 | 0.688 | 0.301 | 0.711 | 0.487 | 0.724 | 0.790 | 0.760 | 1.444 | 0.699 |
| 112, 118, 136, 142 | ≥3 | FLR | 0.159 | 0.659 | 0.283 | 0.687 | 0.457 | 0.702 | 0.740 | 0.730 | 1.348 | 0.685 |
| 113, 119, 137, 143 | ≥3 | MSN + CR | 0.207 | 0.678 | 0.368 | 0.689 | 0.593 | 0.685 | 0.953 | 0.683 | 1.698 | 0.671 |
| 114, 120, 138, 144 | ≥3 | MSN + FLR | 0.196 | 0.646 | 0.349 | 0.657 | 0.562 | 0.655 | 0.906 | 0.681 | 1.621 | 0.682 |
| Pre-1919 | DS1 | DS2 | DS3 | DS4 | DS5 | |||||||
|---|---|---|---|---|---|---|---|---|---|---|---|---|
| Id | N. Storeys | Intervention | µ [g] | β [-] | µ [g] | β [-] | µ [g] | β [-] | µ [g] | β [-] | µ [g] | β [-] |
| 1 | 1 | AS-BUILT | 0.118 | 0.714 | 0.189 | 0.716 | 0.304 | 0.557 | 0.413 | 0.531 | 0.690 | 0.539 |
| 2 | 1 | MSN1 | 0.185 | 0.712 | 0.296 | 0.715 | 0.435 | 0.576 | 0.523 | 0.541 | 0.874 | 0.548 |
| 3 | 1 | MSN2 | 0.239 | 0.711 | 0.384 | 0.714 | 0.560 | 0.582 | 0.607 | 0.571 | 1.015 | 0.577 |
| 4 | 1 | TR | 0.149 | 0.689 | 0.245 | 0.689 | 0.380 | 0.537 | 0.489 | 0.518 | 0.816 | 0.525 |
| 5 | 1 | FLR | 0.165 | 0.688 | 0.256 | 0.688 | 0.418 | 0.540 | 0.511 | 0.522 | 0.854 | 0.528 |
| 6 | 1 | MSN1 + TR | 0.233 | 0.691 | 0.384 | 0.691 | 0.576 | 0.553 | 0.597 | 0.546 | 0.997 | 0.554 |
| 7 | 1 | MSN1 + FLR | 0.258 | 0.690 | 0.401 | 0.690 | 0.640 | 0.557 | 0.678 | 0.553 | 1.133 | 0.559 |
| 8 | 1 | MSN2 + TR | 0.302 | 0.693 | 0.497 | 0.693 | 0.746 | 0.562 | 0.783 | 0.562 | 1.309 | 0.566 |
| 9 | 1 | MSN2 + FLR | 0.334 | 0.692 | 0.519 | 0.692 | 0.829 | 0.568 | 0.870 | 0.568 | 1.454 | 0.571 |
| 10 | 2 | AS-BUILT | 0.101 | 0.665 | 0.187 | 0.663 | 0.274 | 0.539 | 0.379 | 0.525 | 0.634 | 0.533 |
| 11 | 2 | MSN1 | 0.150 | 0.669 | 0.277 | 0.668 | 0.381 | 0.530 | 0.512 | 0.512 | 0.855 | 0.518 |
| 12 | 2 | MSN2 | 0.188 | 0.673 | 0.348 | 0.672 | 0.444 | 0.543 | 0.562 | 0.518 | 0.939 | 0.523 |
| 13 | 2 | TR | 0.128 | 0.640 | 0.236 | 0.639 | 0.367 | 0.502 | 0.479 | 0.496 | 0.800 | 0.502 |
| 14 | 2 | FLR | 0.143 | 0.638 | 0.263 | 0.637 | 0.370 | 0.506 | 0.475 | 0.494 | 0.794 | 0.499 |
| 15 | 2 | MSN1 + TR | 0.189 | 0.648 | 0.349 | 0.648 | 0.464 | 0.515 | 0.564 | 0.504 | 0.942 | 0.508 |
| 16 | 2 | MSN1 + FLR | 0.211 | 0.646 | 0.388 | 0.646 | 0.511 | 0.521 | 0.563 | 0.510 | 0.941 | 0.515 |
| 17 | 2 | MSN2 + TR | 0.238 | 0.655 | 0.439 | 0.654 | 0.579 | 0.523 | 0.621 | 0.516 | 1.037 | 0.520 |
| 18 | 2 | MSN2 + FLR | 0.265 | 0.653 | 0.488 | 0.653 | 0.644 | 0.528 | 0.677 | 0.527 | 1.131 | 0.531 |
| 19 | 3 | AS-BUILT | 0.082 | 0.628 | 0.154 | 0.619 | 0.288 | 0.534 | 0.405 | 0.527 | 0.676 | 0.535 |
| 20 | 3 | MSN1 | 0.119 | 0.651 | 0.219 | 0.650 | 0.391 | 0.512 | 0.542 | 0.507 | 0.905 | 0.512 |
| 21 | 3 | MSN2 | 0.147 | 0.656 | 0.272 | 0.655 | 0.428 | 0.511 | 0.592 | 0.506 | 0.988 | 0.510 |
| 22 | 3 | TR | 0.104 | 0.619 | 0.192 | 0.618 | 0.381 | 0.497 | 0.505 | 0.497 | 0.843 | 0.502 |
| 23 | 3 | FLR | 0.116 | 0.619 | 0.214 | 0.619 | 0.387 | 0.493 | 0.511 | 0.493 | 0.854 | 0.498 |
| 24 | 3 | MSN1 + TR | 0.150 | 0.631 | 0.277 | 0.630 | 0.445 | 0.495 | 0.587 | 0.495 | 0.981 | 0.499 |
| 25 | 3 | MSN1 + FLR | 0.167 | 0.628 | 0.309 | 0.628 | 0.453 | 0.494 | 0.595 | 0.493 | 0.993 | 0.497 |
| 26 | 3 | MSN2 + TR | 0.186 | 0.638 | 0.344 | 0.637 | 0.487 | 0.497 | 0.641 | 0.497 | 1.071 | 0.500 |
| 27 | 3 | MSN2 + FLR | 0.207 | 0.635 | 0.383 | 0.635 | 0.507 | 0.500 | 0.649 | 0.498 | 1.084 | 0.501 |
| 28 | ≥4 | AS-BUILT | 0.072 | 0.573 | 0.162 | 0.533 | 0.241 | 0.580 | 0.349 | 0.564 | 0.582 | 0.573 |
| 29 | ≥4 | MSN1 | 0.102 | 0.620 | 0.189 | 0.616 | 0.358 | 0.535 | 0.503 | 0.526 | 0.841 | 0.532 |
| 30 | ≥4 | MSN2 | 0.125 | 0.638 | 0.230 | 0.637 | 0.391 | 0.531 | 0.548 | 0.521 | 0.915 | 0.527 |
| 31 | ≥4 | TR | 0.090 | 0.574 | 0.174 | 0.559 | 0.405 | 0.499 | 0.539 | 0.499 | 0.901 | 0.504 |
| 32 | ≥4 | FLR | 0.101 | 0.588 | 0.187 | 0.583 | 0.410 | 0.496 | 0.543 | 0.496 | 0.908 | 0.501 |
| 33 | ≥4 | MSN1 + TR | 0.128 | 0.615 | 0.237 | 0.614 | 0.471 | 0.496 | 0.624 | 0.496 | 1.042 | 0.500 |
| 34 | ≥4 | MSN1 + FLR | 0.143 | 0.615 | 0.264 | 0.615 | 0.476 | 0.492 | 0.629 | 0.492 | 1.050 | 0.496 |
| 35 | ≥4 | MSN2 + TR | 0.158 | 0.625 | 0.291 | 0.624 | 0.513 | 0.494 | 0.679 | 0.494 | 1.134 | 0.497 |
| 36 | ≥4 | MSN2 + FLR | 0.176 | 0.622 | 0.324 | 0.622 | 0.518 | 0.492 | 0.684 | 0.492 | 1.142 | 0.495 |
| 1919–1945 | DS1 | DS2 | DS3 | DS4 | DS5 | |||||||
|---|---|---|---|---|---|---|---|---|---|---|---|---|
| Id | N. Storeys | Intervention | µ [g] | β [-] | µ [g] | β [-] | µ [g] | β [-] | µ [g] | β [-] | µ [g] | β [-] |
| 37 | 1 | AS-BUILT | 0.136 | 0.775 | 0.218 | 0.777 | 0.344 | 0.615 | 0.451 | 0.568 | 0.764 | 0.582 |
| 38 | 1 | MSN1 | 0.206 | 0.769 | 0.331 | 0.771 | 0.488 | 0.637 | 0.576 | 0.593 | 0.976 | 0.607 |
| 39 | 1 | MSN2 | 0.256 | 0.758 | 0.411 | 0.759 | 0.602 | 0.629 | 0.654 | 0.610 | 1.108 | 0.622 |
| 40 | 1 | TR | 0.169 | 0.740 | 0.277 | 0.738 | 0.425 | 0.589 | 0.525 | 0.553 | 0.889 | 0.566 |
| 41 | 1 | FLR | 0.186 | 0.736 | 0.289 | 0.736 | 0.466 | 0.590 | 0.552 | 0.560 | 0.935 | 0.573 |
| 42 | 1 | MSN1 + TR | 0.256 | 0.739 | 0.422 | 0.738 | 0.634 | 0.601 | 0.659 | 0.598 | 1.117 | 0.614 |
| 43 | 1 | MSN1 + FLR | 0.283 | 0.736 | 0.439 | 0.736 | 0.700 | 0.602 | 0.740 | 0.598 | 1.255 | 0.612 |
| 44 | 1 | MSN2 + TR | 0.318 | 0.732 | 0.523 | 0.731 | 0.788 | 0.598 | 0.829 | 0.596 | 1.406 | 0.606 |
| 45 | 1 | MSN2 + FLR | 0.351 | 0.730 | 0.544 | 0.730 | 0.870 | 0.602 | 0.914 | 0.601 | 1.549 | 0.610 |
| 46 | 2 | AS-BUILT | 0.116 | 0.717 | 0.213 | 0.712 | 0.307 | 0.568 | 0.417 | 0.545 | 0.707 | 0.560 |
| 47 | 2 | MSN1 | 0.168 | 0.720 | 0.308 | 0.715 | 0.422 | 0.570 | 0.556 | 0.540 | 0.943 | 0.553 |
| 48 | 2 | MSN2 | 0.203 | 0.714 | 0.373 | 0.710 | 0.482 | 0.574 | 0.605 | 0.544 | 1.025 | 0.555 |
| 49 | 2 | TR | 0.144 | 0.683 | 0.265 | 0.680 | 0.394 | 0.526 | 0.503 | 0.513 | 0.853 | 0.523 |
| 50 | 2 | FLR | 0.159 | 0.679 | 0.292 | 0.677 | 0.402 | 0.538 | 0.497 | 0.514 | 0.843 | 0.523 |
| 51 | 2 | MSN1 + TR | 0.208 | 0.690 | 0.382 | 0.688 | 0.510 | 0.553 | 0.603 | 0.534 | 1.023 | 0.545 |
| 52 | 2 | MSN1 + FLR | 0.229 | 0.687 | 0.421 | 0.685 | 0.557 | 0.556 | 0.605 | 0.543 | 1.025 | 0.555 |
| 53 | 2 | MSN2 + TR | 0.252 | 0.689 | 0.463 | 0.687 | 0.615 | 0.551 | 0.657 | 0.541 | 1.115 | 0.551 |
| 54 | 2 | MSN2 + FLR | 0.278 | 0.686 | 0.510 | 0.685 | 0.676 | 0.555 | 0.714 | 0.551 | 1.210 | 0.560 |
| 55 | 3 | AS-BUILT | 0.094 | 0.683 | 0.174 | 0.673 | 0.317 | 0.547 | 0.445 | 0.541 | 0.755 | 0.555 |
| 56 | 3 | MSN1 | 0.133 | 0.699 | 0.244 | 0.694 | 0.423 | 0.530 | 0.584 | 0.525 | 0.989 | 0.536 |
| 57 | 3 | MSN2 | 0.159 | 0.694 | 0.292 | 0.690 | 0.458 | 0.528 | 0.628 | 0.521 | 1.065 | 0.530 |
| 58 | 3 | TR | 0.117 | 0.660 | 0.215 | 0.657 | 0.398 | 0.508 | 0.530 | 0.508 | 0.898 | 0.517 |
| 59 | 3 | FLR | 0.129 | 0.657 | 0.236 | 0.655 | 0.403 | 0.505 | 0.534 | 0.506 | 0.906 | 0.515 |
| 60 | 3 | MSN1 + TR | 0.165 | 0.670 | 0.303 | 0.667 | 0.474 | 0.516 | 0.623 | 0.515 | 1.057 | 0.525 |
| 61 | 3 | MSN1 + FLR | 0.182 | 0.666 | 0.334 | 0.664 | 0.480 | 0.516 | 0.628 | 0.515 | 1.065 | 0.525 |
| 62 | 3 | MSN2 + TR | 0.198 | 0.669 | 0.363 | 0.667 | 0.513 | 0.516 | 0.671 | 0.515 | 1.137 | 0.523 |
| 63 | 3 | MSN2 + FLR | 0.218 | 0.666 | 0.400 | 0.665 | 0.533 | 0.518 | 0.676 | 0.516 | 1.146 | 0.524 |
| 64 | ≥4 | AS-BUILT | 0.082 | 0.630 | 0.174 | 0.579 | 0.270 | 0.594 | 0.390 | 0.580 | 0.661 | 0.597 |
| 65 | ≥4 | MSN1 | 0.113 | 0.669 | 0.209 | 0.662 | 0.386 | 0.548 | 0.543 | 0.540 | 0.920 | 0.553 |
| 66 | ≥4 | MSN2 | 0.135 | 0.674 | 0.248 | 0.670 | 0.416 | 0.541 | 0.583 | 0.533 | 0.989 | 0.544 |
| 67 | ≥4 | TR | 0.101 | 0.617 | 0.190 | 0.604 | 0.422 | 0.508 | 0.565 | 0.508 | 0.957 | 0.516 |
| 68 | ≥4 | FLR | 0.112 | 0.626 | 0.206 | 0.622 | 0.426 | 0.506 | 0.567 | 0.505 | 0.961 | 0.514 |
| 69 | ≥4 | MSN1 + TR | 0.141 | 0.653 | 0.259 | 0.650 | 0.497 | 0.513 | 0.661 | 0.513 | 1.121 | 0.523 |
| 70 | ≥4 | MSN1 + FLR | 0.155 | 0.651 | 0.285 | 0.649 | 0.501 | 0.510 | 0.663 | 0.511 | 1.125 | 0.520 |
| 71 | ≥4 | MSN2 + TR | 0.168 | 0.654 | 0.307 | 0.652 | 0.535 | 0.509 | 0.709 | 0.509 | 1.203 | 0.517 |
| 72 | ≥4 | MSN2 + FLR | 0.184 | 0.652 | 0.338 | 0.651 | 0.538 | 0.507 | 0.712 | 0.507 | 1.207 | 0.515 |
| 1946–1960 | DS1 | DS2 | DS3 | DS4 | DS5 | |||||||
|---|---|---|---|---|---|---|---|---|---|---|---|---|
| Id | N. Storeys | Intervention | µ [g] | β [-] | µ [g] | β [-] | µ [g] | β [-] | µ [g] | β [-] | µ [g] | β [-] |
| 73 | 1 | AS-BUILT | 0.174 | 0.854 | 0.280 | 0.853 | 0.436 | 0.692 | 0.531 | 0.628 | 0.877 | 0.628 |
| 74 | 1 | MSN | 0.306 | 0.820 | 0.490 | 0.820 | 0.731 | 0.689 | 0.781 | 0.673 | 1.288 | 0.673 |
| 75 | 1 | CR | 0.204 | 0.811 | 0.332 | 0.807 | 0.511 | 0.655 | 0.595 | 0.608 | 0.982 | 0.608 |
| 76 | 1 | FLR | 0.221 | 0.803 | 0.344 | 0.803 | 0.553 | 0.650 | 0.627 | 0.614 | 1.035 | 0.614 |
| 77 | 1 | MSN + CR | 0.357 | 0.788 | 0.583 | 0.785 | 0.887 | 0.645 | 0.933 | 0.643 | 1.539 | 0.643 |
| 78 | 1 | MSN + FLR | 0.387 | 0.782 | 0.602 | 0.782 | 0.964 | 0.643 | 1.013 | 0.643 | 1.671 | 0.643 |
| 79 | 2 | AS-BUILT | 0.144 | 0.783 | 0.260 | 0.770 | 0.368 | 0.599 | 0.475 | 0.564 | 0.783 | 0.564 |
| 80 | 2 | MSN | 0.237 | 0.768 | 0.426 | 0.757 | 0.570 | 0.620 | 0.689 | 0.581 | 1.137 | 0.581 |
| 81 | 2 | CR | 0.168 | 0.742 | 0.303 | 0.734 | 0.435 | 0.560 | 0.529 | 0.540 | 0.873 | 0.540 |
| 82 | 2 | FLR | 0.183 | 0.734 | 0.329 | 0.728 | 0.449 | 0.574 | 0.525 | 0.544 | 0.866 | 0.544 |
| 83 | 2 | MSN + CR | 0.276 | 0.737 | 0.497 | 0.731 | 0.678 | 0.586 | 0.724 | 0.579 | 1.194 | 0.579 |
| 84 | 2 | MSN + FLR | 0.300 | 0.732 | 0.540 | 0.729 | 0.734 | 0.587 | 0.773 | 0.584 | 1.275 | 0.584 |
| 85 | 3 | AS-BUILT | 0.115 | 0.746 | 0.209 | 0.729 | 0.359 | 0.553 | 0.502 | 0.548 | 0.828 | 0.548 |
| 86 | 3 | MSN | 0.184 | 0.743 | 0.331 | 0.732 | 0.513 | 0.546 | 0.683 | 0.538 | 1.127 | 0.538 |
| 87 | 3 | CR | 0.135 | 0.713 | 0.242 | 0.705 | 0.412 | 0.526 | 0.553 | 0.525 | 0.913 | 0.525 |
| 88 | 3 | FLR | 0.146 | 0.706 | 0.263 | 0.701 | 0.416 | 0.526 | 0.557 | 0.524 | 0.919 | 0.524 |
| 89 | 3 | MSN + CR | 0.215 | 0.713 | 0.386 | 0.708 | 0.551 | 0.539 | 0.708 | 0.537 | 1.169 | 0.537 |
| 90 | 3 | MSN + FLR | 0.233 | 0.708 | 0.419 | 0.705 | 0.565 | 0.540 | 0.713 | 0.540 | 1.176 | 0.540 |
| 91 | ≥4 | AS-BUILT | 0.099 | 0.692 | 0.196 | 0.634 | 0.320 | 0.593 | 0.456 | 0.582 | 0.753 | 0.582 |
| 92 | ≥4 | MSN | 0.155 | 0.721 | 0.279 | 0.710 | 0.465 | 0.551 | 0.648 | 0.544 | 1.069 | 0.544 |
| 93 | ≥4 | CR | 0.116 | 0.666 | 0.211 | 0.649 | 0.431 | 0.525 | 0.582 | 0.522 | 0.961 | 0.522 |
| 94 | ≥4 | FLR | 0.126 | 0.668 | 0.227 | 0.661 | 0.433 | 0.523 | 0.584 | 0.520 | 0.963 | 0.520 |
| 95 | ≥4 | MSN + CR | 0.181 | 0.695 | 0.325 | 0.690 | 0.558 | 0.528 | 0.746 | 0.527 | 1.231 | 0.527 |
| 96 | ≥4 | MSN + FLR | 0.196 | 0.690 | 0.352 | 0.688 | 0.560 | 0.527 | 0.748 | 0.526 | 1.233 | 0.526 |
| 1961–1980 | DS1 | DS2 | DS3 | DS4 | DS5 | |||||||
|---|---|---|---|---|---|---|---|---|---|---|---|---|
| Id | N. Storeys | Intervention | µ [g] | β [-] | µ [g] | β [-] | µ [g] | β [-] | µ [g] | β [-] | µ [g] | β [-] |
| 97, 121 | 1 | AS-BUILT | 0.271 | 0.805 | 0.432 | 0.802 | 0.676 | 0.673 | 0.740 | 0.632 | 1.198 | 0.649 |
| 98, 122 | 1 | MSN | 0.394 | 0.773 | 0.627 | 0.771 | 0.971 | 0.654 | 1.021 | 0.649 | 1.655 | 0.663 |
| 99, 123 | 1 | CR | 0.291 | 0.772 | 0.468 | 0.767 | 0.733 | 0.636 | 0.793 | 0.607 | 1.284 | 0.624 |
| 100, 124 | 1 | FLR | 0.306 | 0.763 | 0.477 | 0.763 | 0.771 | 0.626 | 0.828 | 0.605 | 1.341 | 0.622 |
| 101, 125 | 1 | MSN + CR | 0.423 | 0.749 | 0.679 | 0.745 | 1.063 | 0.615 | 1.117 | 0.615 | 1.810 | 0.627 |
| 102, 126 | 1 | MSN + FLR | 0.445 | 0.742 | 0.693 | 0.742 | 1.119 | 0.609 | 1.175 | 0.609 | 1.905 | 0.620 |
| 103, 127 | 2 | AS-BUILT | 0.208 | 0.742 | 0.358 | 0.724 | 0.504 | 0.599 | 0.586 | 0.560 | 0.949 | 0.574 |
| 104, 128 | 2 | MSN | 0.290 | 0.728 | 0.499 | 0.713 | 0.714 | 0.600 | 0.813 | 0.566 | 1.317 | 0.578 |
| 105, 129 | 2 | CR | 0.223 | 0.712 | 0.384 | 0.700 | 0.548 | 0.564 | 0.610 | 0.545 | 0.988 | 0.556 |
| 106, 130 | 2 | FLR | 0.235 | 0.702 | 0.404 | 0.696 | 0.569 | 0.568 | 0.608 | 0.549 | 0.986 | 0.560 |
| 107, 131 | 2 | MSN + CR | 0.311 | 0.705 | 0.535 | 0.698 | 0.777 | 0.567 | 0.833 | 0.561 | 1.350 | 0.572 |
| 108, 132 | 2 | MSN + FLR | 0.327 | 0.699 | 0.563 | 0.696 | 0.816 | 0.561 | 0.853 | 0.561 | 1.382 | 0.571 |
| 109, 133 | 3 | AS-BUILT | 0.159 | 0.708 | 0.273 | 0.689 | 0.430 | 0.544 | 0.566 | 0.528 | 0.916 | 0.540 |
| 110, 134 | 3 | MSN | 0.216 | 0.705 | 0.372 | 0.690 | 0.582 | 0.528 | 0.729 | 0.523 | 1.181 | 0.532 |
| 111, 135 | 3 | CR | 0.170 | 0.681 | 0.293 | 0.670 | 0.453 | 0.528 | 0.586 | 0.518 | 0.949 | 0.526 |
| 112, 136 | 3 | FLR | 0.179 | 0.672 | 0.308 | 0.667 | 0.456 | 0.528 | 0.587 | 0.518 | 0.952 | 0.526 |
| 113, 137 | 3 | MSN + CR | 0.232 | 0.683 | 0.399 | 0.676 | 0.603 | 0.522 | 0.742 | 0.523 | 1.203 | 0.531 |
| 114, 138 | 3 | MSN + FLR | 0.244 | 0.677 | 0.420 | 0.675 | 0.608 | 0.522 | 0.745 | 0.524 | 1.206 | 0.532 |
| 115, 139 | ≥4 | AS-BUILT | 0.133 | 0.668 | 0.235 | 0.628 | 0.397 | 0.557 | 0.541 | 0.543 | 0.876 | 0.558 |
| 116, 140 | ≥4 | MSN | 0.178 | 0.686 | 0.307 | 0.672 | 0.536 | 0.531 | 0.713 | 0.523 | 1.155 | 0.533 |
| 117, 141 | ≥4 | CR | 0.142 | 0.644 | 0.246 | 0.628 | 0.452 | 0.526 | 0.600 | 0.520 | 0.972 | 0.527 |
| 118, 142 | ≥4 | FLR | 0.150 | 0.638 | 0.258 | 0.632 | 0.453 | 0.525 | 0.600 | 0.519 | 0.973 | 0.526 |
| 119, 143 | ≥4 | MSN + CR | 0.191 | 0.667 | 0.329 | 0.660 | 0.591 | 0.518 | 0.770 | 0.517 | 1.248 | 0.525 |
| 120, 144 | ≥4 | MSN + FLR | 0.201 | 0.661 | 0.346 | 0.660 | 0.592 | 0.518 | 0.770 | 0.517 | 1.248 | 0.524 |
References
- Italian Civil Protection Department National Risk Assessment. Overview of the Potential Major Disasters in Italy: Seismic, Volcanic, Tsunami, Hydrogeological/Hydraulic and Extreme Weather, Droughts and Forest Fire Risks 2018; Italian Civil Protection Department National Risk Assessment: Rome, Italy, 2018.
- Augenti, N.; Parisi, F. Learning from Construction Failures Due to the 2009 L’Aquila, Italy, Earthquake. J. Perform. Constr. Facil. 2010, 24, 536–555. [Google Scholar] [CrossRef]
- Sorrentino, L.; Cattari, S.; da Porto, F.; Magenes, G.; Penna, A. Seismic Behaviour of Ordinary Masonry Buildings during the 2016 Central Italy Earthquakes. Bull. Earthq. Eng. 2019, 17, 5583–5607. [Google Scholar] [CrossRef]
- Valluzzi, M.R.; Sbrogiò, L.; Saretta, Y.; Wenliuhan, H. Seismic Response of Masonry Buildings in Historical Centres Struck by the 2016 Central Italy Earthquake. Impact of Building Features on Damage Evaluation. Int. J. Archit. Herit. 2021, 16, 1859–1884. [Google Scholar] [CrossRef]
- Dolce, M.; Prota, A.; Borzi, B.; da Porto, F.; Lagomarsino, S.; Magenes, G.; Moroni, C.; Penna, A.; Polese, M.; Speranza, E.; et al. Seismic Risk Assessment of Residential Buildings in Italy. Bull. Earthq. Eng. 2021, 19, 2999–3032. [Google Scholar] [CrossRef]
- Masi, A.; Lagomarsino, S.; Dolce, M.; Manfredi, V.; Ottonelli, D. Towards the Updated Italian Seismic Risk Assessment: Exposure and Vulnerability Modelling. Bull. Earthq. Eng. 2021, 19, 3253–3286. [Google Scholar] [CrossRef]
- Lagomarsino, S. The MARS Vulnerability Model: A New Metrics Based on EMS-98 Vulnerability Classes; Conspress: Bucharest, Romania, 2022; pp. 3327–3336. [Google Scholar]
- Cattari, S.; Alfano, S.; Masi, A.; Manfredi, V.; Borzi, B.; Di Meo, A.; da Porto, F.; Saler, E.; Dall’Asta, A.; Gioiella, L.; et al. Risk Assessment of Italian School Buildings at National Scale: The MARS Project Experience; Conspress: Bucharest, Romania, 2022; pp. 3383–3392. [Google Scholar]
- Di Meo, A.; Faravelli, M.; Pascale, V.; Borzi, B.; Calderini, C.; Sisti, R.; Speranza, E.; Bocchi, F. Damage Survey on Churches: A New Observed Damage Database of Past Italian Earthquakes (Da.D.O.). Int. J. Disaster Risk Reduct. 2023, 87, 103595. [Google Scholar] [CrossRef]
- Calvi, G.M.; Pinho, R.; Magenes, G.; Bommer, J.J.; Restrepo-Vélez, L.F.; Crowley, H. Development of Seismic Vulnerability Assessment Methodologies over the Past 30 Years. ISET J. Earthq. Technol. 2006, 43, 75–104. [Google Scholar]
- ISTAT 15° Censimento della Popolazione e delle Abitazioni 2011. Website and Data Warehouse. Available online: https://www.istat.it/it/censimenti-permanenti/censimenti-precedenti/popolazione-e-abitazioni/popolazione-2011 (accessed on 26 September 2022).
- Borzi, B.; Faravelli, M.; Di Meo, A. Application of the SP-BELA Methodology to RC Residential Buildings in Italy to Produce Seismic Risk Maps for the National Risk Assessment. Bull. Earthq. Eng. 2021, 19, 3185–3208. [Google Scholar] [CrossRef]
- Donà, M.; Carpanese, P.; Follador, V.; Sbrogiò, L.; da Porto, F. Mechanics-Based Fragility Curves for Italian Residential URM Buildings. Bull. Earthq. Eng. 2021, 19, 3099–3127. [Google Scholar] [CrossRef]
- Rosti, A.; Del Gaudio, C.; Rota, M.; Ricci, P.; Di Ludovico, M.; Penna, A.; Verderame, G.M. Empirical Fragility Curves for Italian Residential RC Buildings. Bull. Earthq. Eng. 2021, 19, 3165–3183. [Google Scholar] [CrossRef]
- Rosti, A.; Rota, M.; Penna, A. Empirical Fragility Curves for Italian URM Buildings. Bull. Earthq. Eng. 2021, 19, 3057–3076. [Google Scholar] [CrossRef]
- Zuccaro, G.; Perelli, F.L.; De Gregorio, D.; Cacace, F. Empirical Vulnerability Curves for Italian Mansory Buildings: Evolution of Vulnerability Model from the DPM to Curves as a Function of Accelertion. Bull. Earthq. Eng. 2021, 19, 3077–3097. [Google Scholar] [CrossRef]
- Lagomarsino, S.; Cattari, S.; Ottonelli, D. The Heuristic Vulnerability Model: Fragility Curves for Masonry Buildings. Bull. Earthq. Eng. 2021, 19, 3129–3163. [Google Scholar] [CrossRef]
- Cao, X.-Y. An Iterative PSD-Based Procedure for the Gaussian Stochastic Earthquake Model with Combined Intensity and Frequency Nonstationarities: Its Application into Precast Concrete Structures. Mathematics 2023, 11, 1294. [Google Scholar] [CrossRef]
- Smerzini, C.; Galasso, C.; Iervolino, I.; Paolucci, R. Ground Motion Record Selection Based on Broadband Spectral Compatibility. Earthq. Spectra 2014, 30, 1427–1448. [Google Scholar] [CrossRef]
- Manfredi, V.; Masi, A.; Özcebe, A.G.; Paolucci, R.; Smerzini, C. Selection and Spectral Matching of Recorded Ground Motions for Seismic Fragility Analyses. Bull. Earthq. Eng. 2022, 20, 4961–4987. [Google Scholar] [CrossRef]
- Feng, D.-C.; Cao, X.-Y.; Beer, M. An Enhanced PDEM-Based Framework for Reliability Analysis of Structures Considering Multiple Failure Modes and Limit States. Probabilistic Eng. Mech. 2022, 70, 103367. [Google Scholar] [CrossRef]
- Cattari, S.; Angiolilli, M. Multiscale Procedure to Assign Structural Damage Levels in Masonry Buildings from Observed or Numerically Simulated Seismic Performance. Bull. Earthq. Eng. 2022, 20, 7561–7607. [Google Scholar] [CrossRef]
- da Porto, F.; Lagomarsino, S.; Cattari, S.; Follador, V.; Carpanese, P.; Donà, M.; Alfano, S. Fragility Curves of As-Built and Retrofitted Masonry Buildings in Italy; Conspress: Bucharest, Romania, 2022; pp. 3337–3346. [Google Scholar]
- Follador, V.; Carpanese, P.; Donà, M.; da Porto, F. Effect of Retrofit Interventions on Seismic Fragility of Italian Residential Masonry Buildings. Int. J. Disaster Risk Reduct. 2023, 91, 103668. [Google Scholar] [CrossRef]
- Gentile, R.; Galasso, C. Simplified Seismic Loss Assessment for Optimal Structural Retrofit of RC Buildings. Earthq. Spectra 2021, 37, 346–365. [Google Scholar] [CrossRef]
- Aljawhari, K.; Gentile, R.; Galasso, C. A Fragility-Oriented Approach for Seismic Retrofit Design. Earthq. Spectra 2022, 38, 1813–1843. [Google Scholar] [CrossRef]
- Xu, J.-G.; Cao, X.-Y.; Wu, G. Seismic Collapse and Reparability Performance of Reinforced Concrete Frames Retrofitted with External PBSPC BRBF Sub-Frame in near-Fault Regions. J. Build. Eng. 2023, 64, 105716. [Google Scholar] [CrossRef]
- Sbrogiò, L.; Saretta, Y.; Valluzzi, M.R. Empirical Performance Levels of Strengthened Masonry Buildings Struck by the 2016 Central Italy Earthquake: Proposal of a New Taxonomy. Int. J. Archit. Herit. 2023, 17, 1017–1042. [Google Scholar] [CrossRef]
- Vettore, M.; Saretta, Y.; Sbrogiò, L.; Valluzzi, M.R. A New Methodology for the Survey and Evaluation of Seismic Damage and Vulnerability Entailed by Structural Interventions on Masonry Buildings: Validation on the Town of Castelsantangelo Sul Nera (MC), Italy. Int. J. Archit. Herit. 2022, 16, 182–207. [Google Scholar] [CrossRef]
- Da Porto, F.; Valluzzi, M.R.; Munari, M.; Modena, C.; Arêde, A.; Costa, A.A. Strengthening of Stone and Brick Masonry Buildings. In Strengthening and Retrofitting of Existing Structures; Costa, A., Arêde, A., Varum, H., Eds.; Building Pathology and Rehabilitation; Springer: Singapore, 2018; Volume 9, pp. 59–84. ISBN 978-981-10-5857-8. [Google Scholar]
- Saretta, Y.; Sbrogiò, L.; Valluzzi, M.R. Seismic Response of Masonry Buildings in Historical Centres Struck by the 2016 Central Italy Earthquake. Calibration of a Vulnerability Model for Strengthened Conditions. Constr. Build. Mater. 2021, 299, 123911. [Google Scholar] [CrossRef]
- Oliveira, D.V.; Silva, R.A.; Garbin, E.; Lourenço, P.B. Strengthening of Three-Leaf Stone Masonry Walls: An Experimental Research. Mater. Struct. 2012, 45, 1259–1276. [Google Scholar] [CrossRef]
- Silva, B.; Dalla Benetta, M.; da Porto, F.; Valluzzi, M.R. Compression and Sonic Tests to Assess Effectiveness of Grout Injection on Three-Leaf Stone Masonry Walls. Int. J. Archit. Herit. 2014, 8, 408–435. [Google Scholar] [CrossRef]
- de Felice, G.; De Santis, S.; Garmendia, L.; Ghiassi, B.; Larrinaga, P.; Lourenço, P.B.; Oliveira, D.V.; Paolacci, F.; Papanicolaou, C.G. Mortar-Based Systems for Externally Bonded Strengthening of Masonry. Mater. Struct. 2014, 47, 2021–2037. [Google Scholar] [CrossRef]
- Giaretton, M.; Dizhur, D.; Garbin, E.; Ingham, J.; da Porto, F. In-Plane Strengthening of Clay Brick and Block Masonry Walls Using Textile-Reinforced Mortar. J. Compos. Constr. 2018, 22, 04018028. [Google Scholar] [CrossRef]
- Valluzzi, M.; Sbrogiò, L.; Saretta, Y. Intervention Strategies for the Seismic Improvement of Masonry Buildings Based on FME Validation: The Case of a Terraced Building Struck by the 2016 Central Italy Earthquake. Buildings 2021, 11, 404. [Google Scholar] [CrossRef]
- Modena, C.; Valluzzi, M.R.; da Porto, F.; Casarin, F. Structural Aspects of The Conservation of Historic Masonry Constructions in Seismic Areas: Remedial Measures and Emergency Actions. Int. J. Archit. Herit. 2011, 5, 539–558. [Google Scholar] [CrossRef]
- Calderini, C.; Piccardo, P.; Vecchiattini, R. Experimental Characterization of Ancient Metal Tie-Rods in Historic Masonry Buildings. Int. J. Archit. Herit. 2019, 13, 425–437. [Google Scholar] [CrossRef]
- Podestà, S.; Scandolo, L. Earthquakes and Tie-Rods: Assessment, Design, and Ductility Issues. Int. J. Archit. Herit. 2019, 13, 329–339. [Google Scholar] [CrossRef]
- Graziotti, F.; Tomassetti, U.; Penna, A.; Magenes, G. Out-of-Plane Shaking Table Tests on URM Single Leaf and Cavity Walls. Eng. Struct. 2016, 125, 455–470. [Google Scholar] [CrossRef]
- CNR-DT 212/2013; Istruzioni per la Valutazione Affidabilistica della Sicurezza Sismica di Edifici Esistenti. CNR: Rome, Italy, 2014.
- Magenes, G.; Penna, A.; Senaldi, I.E.; Rota, M.; Galasco, A. Shaking Table Test of a Strengthened Full-Scale Stone Masonry Building with Flexible Diaphragms. Int. J. Archit. Herit. 2014, 8, 349–375. [Google Scholar] [CrossRef]
- Senaldi, I.; Magenes, G.; Penna, A.; Galasco, A.; Rota, M. The Effect of Stiffened Floor and Roof Diaphragms on the Experimental Seismic Response of a Full-Scale Unreinforced Stone Masonry Building. J. Earthq. Eng. 2014, 18, 407–443. [Google Scholar] [CrossRef]
- Lagomarsino, S.; Giovinazzi, S. Macroseismic and Mechanical Models for the Vulnerability and Damage Assessment of Current Buildings. Bull. Earthq. Eng. 2006, 4, 415–443. [Google Scholar] [CrossRef]
- Grünthal, G. (Ed.) European Macroseismic Scale 1998: EMS-98; Cahiers du Centre Européen de Géodynamique et de Séismologie; European Seismological Commission, Subcommission on Engineering Seismology; Working Group Macroseismic Scales: Luxembourg, 1998; Volume 15, ISBN 978-2-87977-008-6. [Google Scholar]
- Di Ludovico, M.; Cattari, S.; Verderame, G.; Del Vecchio, C.; Ottonelli, D.; Del Gaudio, C.; Prota, A.; Lagomarsino, S. Fragility Curves of Italian School Buildings: Derivation from L’Aquila 2009 Earthquake Damage via Observational and Heuristic Approaches. Bull. Earthq. Eng. 2023, 21, 397–432. [Google Scholar] [CrossRef]
- Bernardini, A.; Gori, M.; Modena, C. Application of Coupled Analytical Models and Experimental Knowledge to Seismic Vulnerability Analyses of Masonry Buildings. In Earthquake Damage Evaluation and Vulnerability Analysis of Building Structures; Omega Scientific: Oxford, UK, 1990; Volume 3, pp. 161–180. [Google Scholar]
- Valluzzi, M.R.; Follador, V.; Sbrogiò, L. Vulnus Web: A Web-Based Procedure for the Seismic Vulnerability Assessment of Masonry Buildings. Sustainability 2023, 15, 6787. [Google Scholar] [CrossRef]
- Ferrini, M.; Melozzi, A.; Pagliazzi, A.; Scarparolo, S. Rilevamento della Vulnerabilità Sismica Degli Edifici in Muratura. Manuale per la Compilazione della Scheda GNDT/CNR di II Livello. Regione Toscana, Italy. 2003. Available online: https://www.abacomurature.it/pdf/01%20Manuale%20compilazione%20schede%20II%20liv_GNDT.pdf (accessed on 16 August 2023).
- Lagomarsino, S.; Cattari, S. Fragility Functions of Masonry Buildings. In SYNER-G: Typology Definition and Fragility Functions for Physical Elements at Seismic Risk; Pitilakis, K., Crowley, H., Kaynia, A.M., Eds.; Geotechnical, Geological and Earthquake Engineering; Springer: Dordrecht, The Netherlands, 2014; Volume 27, pp. 111–156. ISBN 978-94-007-7871-9. [Google Scholar]
- Cattari, S.; Alfano, S.; Ottonelli, D.; Saler, E.; Da Porto, F. Comparative Study on Two Analytical Mechanical-Based Methods for Deriving Fragility Curves Targeted to Masonry School Buildings. In Proceedings of the 8th International Conference on Computational Methods in Structural Dynamics and Earthquake Engineering Methods in Structural Dynamics and Earthquake Engineering, Athens, Greece, 28–30 June 2021; pp. 3155–3175. [Google Scholar]
- Freeman, S.A. The Capacity Spectrum Method as a Tool for Seismic Design. In Proceedings of the 11th European Conference on Earthquake Engineering, Paris, France, 6–11 September 1998. [Google Scholar]
- da Porto, F.; Donà, M.; Rosti, A.; Rota, M.; Lagomarsino, S.; Cattari, S.; Borzi, B.; Onida, M.; De Gregorio, D.; Perelli, F.L.; et al. Comparative Analysis of the Fragility Curves for Italian Residential Masonry and RC Buildings. Bull. Earthq. Eng. 2021, 19, 3209–3252. [Google Scholar] [CrossRef]
- Dolce, M.; Speranza, E.; Giordano, F.; Borzi, B.; Bocchi, F.; Conte, C.; Di Meo, A.; Faravelli, M.; Pascale, V. Observed Damage Database of Past Italian Earthquakes: The Da.D.O. WebGIS. Boll. Geofis. Teor. Appl. 2019, 60, 141–164. [Google Scholar]


| Masonry Type | Stone | Soft Stone | Solid Brick | Hollow Brick | |||||
|---|---|---|---|---|---|---|---|---|---|
| Irregular | Uncut | Cut | Ashlar | Irregular | Regular | ||||
| MSN1 | UniGEb | 2 | 1.7 | 1.5 | 1.2 | 1.4 | 1.2 | 1.5 | - |
| UniPD | 1.7 | 1.6 | 1.5 | - | |||||
| MSN2 | UniGEb | 2.9 | 2.3 | 1.9 | 1.2 | 1.4 | 1.2 | 1.6 | - |
| UniPD | 2.4 | 1.9 | 1.8 | - | |||||
| MSN | UniGEb | 2.9 | 2.3 | 1.9 | 1.2 | 1.4 | 1.2 | 1.6 | 1.3 |
| UniPD | - | - | 1.7 | 1.3 | |||||
| Construction Period | Pre-1919 | 1919–1945 | 1946–1960 | 1961–1970 | 1971–1980 | |
|---|---|---|---|---|---|---|
| As Built | ||||||
| V | 0.92 ÷ 0.98 | 0.84 ÷ 0.91 | 0.71 ÷ 0.82 | 0.55 ÷ 0.65 | 0.51 ÷ 0.6 | |
| Q | 2.2 ÷ 2.4 | 2.4 ÷ 2.5 | 2.2 ÷ 2.4 | 2.2 ÷ 2.4 | 2.1 ÷ 2.4 | |
| Masonry strengthening | ||||||
| MSN1 | ΔV | −0.12 ÷ −0.135 | −0.12 | - | - | - |
| ΔQ | 0–−0.1 | 0 ÷ −0.1 | - | - | - | |
| MSN2 | ΔV | −0.18 ÷ −0.225 | −0.16 ÷ −0.2 | - | - | - |
| ΔQ | 0–−0.2 | 0–−0.2 | - | - | - | |
| MSN | ΔV | - | - | −0.1 ÷ −0.135 | −0.075 | −0.05 |
| ΔQ | - | - | 0–−0.1 | 0 | 0 | |
| Improvement of connections | ||||||
| TR | ΔV | −0.05 ÷ −0.075 | −0.05 ÷ −0.075 | - | - | - |
| ΔQ | 0.2–0.3 | 0.1–0.2 | - | - | - | |
| CR | ΔV | - | - | −0.03 ÷ −0.05 | 0 ÷ −0.03 | 0 |
| ΔQ | - | - | 0–0.1 | 0.1 | 0.1 | |
| Horizontal diaphragms stiffening | ||||||
| FLR | ΔV | −0.1 ÷ −0.12 | −0.075 ÷ −0.1 | −0.05 ÷ −0.075 | −0.03 | −0.01 |
| ΔQ | 0.2–0.3 | 0.2–0.3 | 0.1–0.2 | 0.1–0.2 | 0.1 | |
Disclaimer/Publisher’s Note: The statements, opinions and data contained in all publications are solely those of the individual author(s) and contributor(s) and not of MDPI and/or the editor(s). MDPI and/or the editor(s) disclaim responsibility for any injury to people or property resulting from any ideas, methods, instructions or products referred to in the content. |
© 2023 by the authors. Licensee MDPI, Basel, Switzerland. This article is an open access article distributed under the terms and conditions of the Creative Commons Attribution (CC BY) license (https://creativecommons.org/licenses/by/4.0/).
Share and Cite
Follador, V.; Carpanese, P.; Donà, M.; Alfano, S.; Cattari, S.; Lagomarsino, S.; da Porto, F. Comparison of Fragility Sets to Assess the Effectiveness of Retrofit Interventions on Masonry Buildings in Italy. Buildings 2023, 13, 2937. https://doi.org/10.3390/buildings13122937
Follador V, Carpanese P, Donà M, Alfano S, Cattari S, Lagomarsino S, da Porto F. Comparison of Fragility Sets to Assess the Effectiveness of Retrofit Interventions on Masonry Buildings in Italy. Buildings. 2023; 13(12):2937. https://doi.org/10.3390/buildings13122937
Chicago/Turabian StyleFollador, Veronica, Pietro Carpanese, Marco Donà, Sara Alfano, Serena Cattari, Sergio Lagomarsino, and Francesca da Porto. 2023. "Comparison of Fragility Sets to Assess the Effectiveness of Retrofit Interventions on Masonry Buildings in Italy" Buildings 13, no. 12: 2937. https://doi.org/10.3390/buildings13122937