Article

Response Displacement Method for Seismic Calculation of Subway Station Complex Structure of TOD Mode

School of Civil Engineering, Hebei University of Science and Technology, Shijiazhuang 050018, China
*
Author to whom correspondence should be addressed.
Buildings 2023, 13(12), 2987; https://doi.org/10.3390/buildings13122987
Submission received: 14 September 2023 / Revised: 17 November 2023 / Accepted: 27 November 2023 / Published: 30 November 2023

Abstract

:
The TOD mode with rail transit stations as the center has become an important direction of future central city construction. However, at present, there is still a lack of simplified calculation methods for the seismic design of a subway station complex structure of TOD mode. Based on the load-structure model of the classic response displacement method and the seismic deformation characteristics of the underground complex structure, an improved response displacement method for seismic calculation of the subway station complex structure considering the influence of the upper frame structure was proposed in this paper. Then, based on the actual engineering case, the applicability of the improved reaction displacement method was verified through investigating the influencing factors such as seismic wave type, ground motion intensity, building position, structure form, structure stiffness, and stratum stiffness. Furthermore, a series of numerical simulation experiments were conducted to verify the simplified method and further evaluate its computational accuracy. The result shows that the error in calculating the internal force and deformation response of a station complex structure by using the improved reaction displacement method can be controlled at about 10%. The improved response deformation method is proved to be a highly practical pseudo-static method.

1. Introduction

In recent years, with the rapid development of urbanization in China, the urban development model of high-density and the land use mode of intensity have gradually become the main development direction of future urban construction [1]. Under this background, the TOD mode appears based on the rail transit subway station as the core, integrating transportation, offices, a shopping mall, residences and other functions in the urban complex structure. The subway station complex structure of TOD mode was of a dual characteristic-both common underground subway station and aboveground frame structure. Currently, the research on its seismic response characteristics and failure mechanism is still insufficient, and there is a lack of simplified methods to directly guide its seismic design [2,3].
Wang G B [4] studied the influence of the upper frame structure on the seismic response of the underground subway station via numerical simulation. The analysis shows that the influence of the lighter upper structure on the dynamic response of the structural system is limited. Zhang et al. [5] established a three-dimensional finite element model of a structure system of a soil-subway station and its upper cover structure by using ABAQUS software, then the seismic performance of the structure system was analyzed, and the effects of different vertical ground motion and beam stiffness on the system were obtained. An [6] analyzed the seismic response of a large-chassis subway station under an upper cover single tower frame structure by using the finite element software Midas GTS NX, and the calculation results show that the existence of the upper cover structure increases the internal force of the subway station structure. Han [7,8] established a three-dimensional finite element numerical model of an underground subway station-soil-ground building integrated structural system, and analyzed the seismic response, seismic damage evolution process, and failure mechanism of the system under different influencing factors. The results show that the existence of surface buildings changes the internal force and dynamic characteristics of the original station structure. Liu [9] established the dynamic analysis model of the integrated structural system by using the SATWE module in the design software PKPM and the finite element software MIDAS. The elastic analysis under frequent earthquakes and the elastic-plastic analysis under rare earthquakes were analyzed, and the seismic performance of the structural system was evaluated. Currently, the most widely used method in the seismic design of underground structures is the response displacement method [10]. The traditional response displacement method was improved by many scholars aiming at the limitation of it, such as the integral response displacement method [11], the inertial force-displacement method [12], the generalized response displacement method [13,14] and so on. Among them, Qiu [15] proposed the seismic design method of subway station structure in the vicinity of the existence of ground buildings, and the influence of the size of the numerical model on the accuracy of the simplified method was analyzed. The results showed that the influence of the size effect on the calculation results can be ignored when the distance between the model boundary and the structure exceeds four times the length of the structure. However, previous studies have focused more on the improvement of the traditional response displacement method with errors, and have not considered the seismic response characteristics of the underground complex structure under the upper structure, which is not suitable for direct use.
Therefore, this paper proposes an improved response displacement method suitable for the seismic analysis of the subway station complex structure of the TOD mode considering the influence of the additional seismic load generated by the upper frame structure on the subway station complex structure based on the load-structure model of the traditional response displacement method. The calculation results of time-history analysis are used as exact solutions to discuss the applicability of the improved response displacement method.

2. Proposition and Implementation of Improved Response Displacement Method

2.1. Traditional Response Displacement Method and Its Limitations

The response displacement method is a common method for seismic design of underground structures. It uses beam element modeling and soil springs to consider the dynamic response and interaction between underground structures and soil. The seismic load is applied to the structure in the form of relative displacement of the soil layer in the free field, the shear force of soil around the structure, and the peak acceleration of ground. Finally, the internal force and deformation of the structure under seismic load are obtained via calculation. The simplified mechanical model is shown in Figure 1.
The response displacement method has a rigorous theory and high calculation accuracy. The upper structure has a great influence on the internal force and deformation of the subway station [6]. Applying the load-structure model of the traditional response displacement method to the seismic analysis of the subway station structure under the upper structure will lead to two problems. On the one hand, the unfavorable factors of the upper cover structure are not considered, resulting in a smaller calculation result. On the other hand, it cannot reflect the influence of changes in the internal force and deformation of the upper-cover structure of the subway station. Therefore, the calculation results of the traditional response displacement method do not meet the requirements for the integrated subway station and its upper cover structure.

2.2. Improved Response Displacement Method

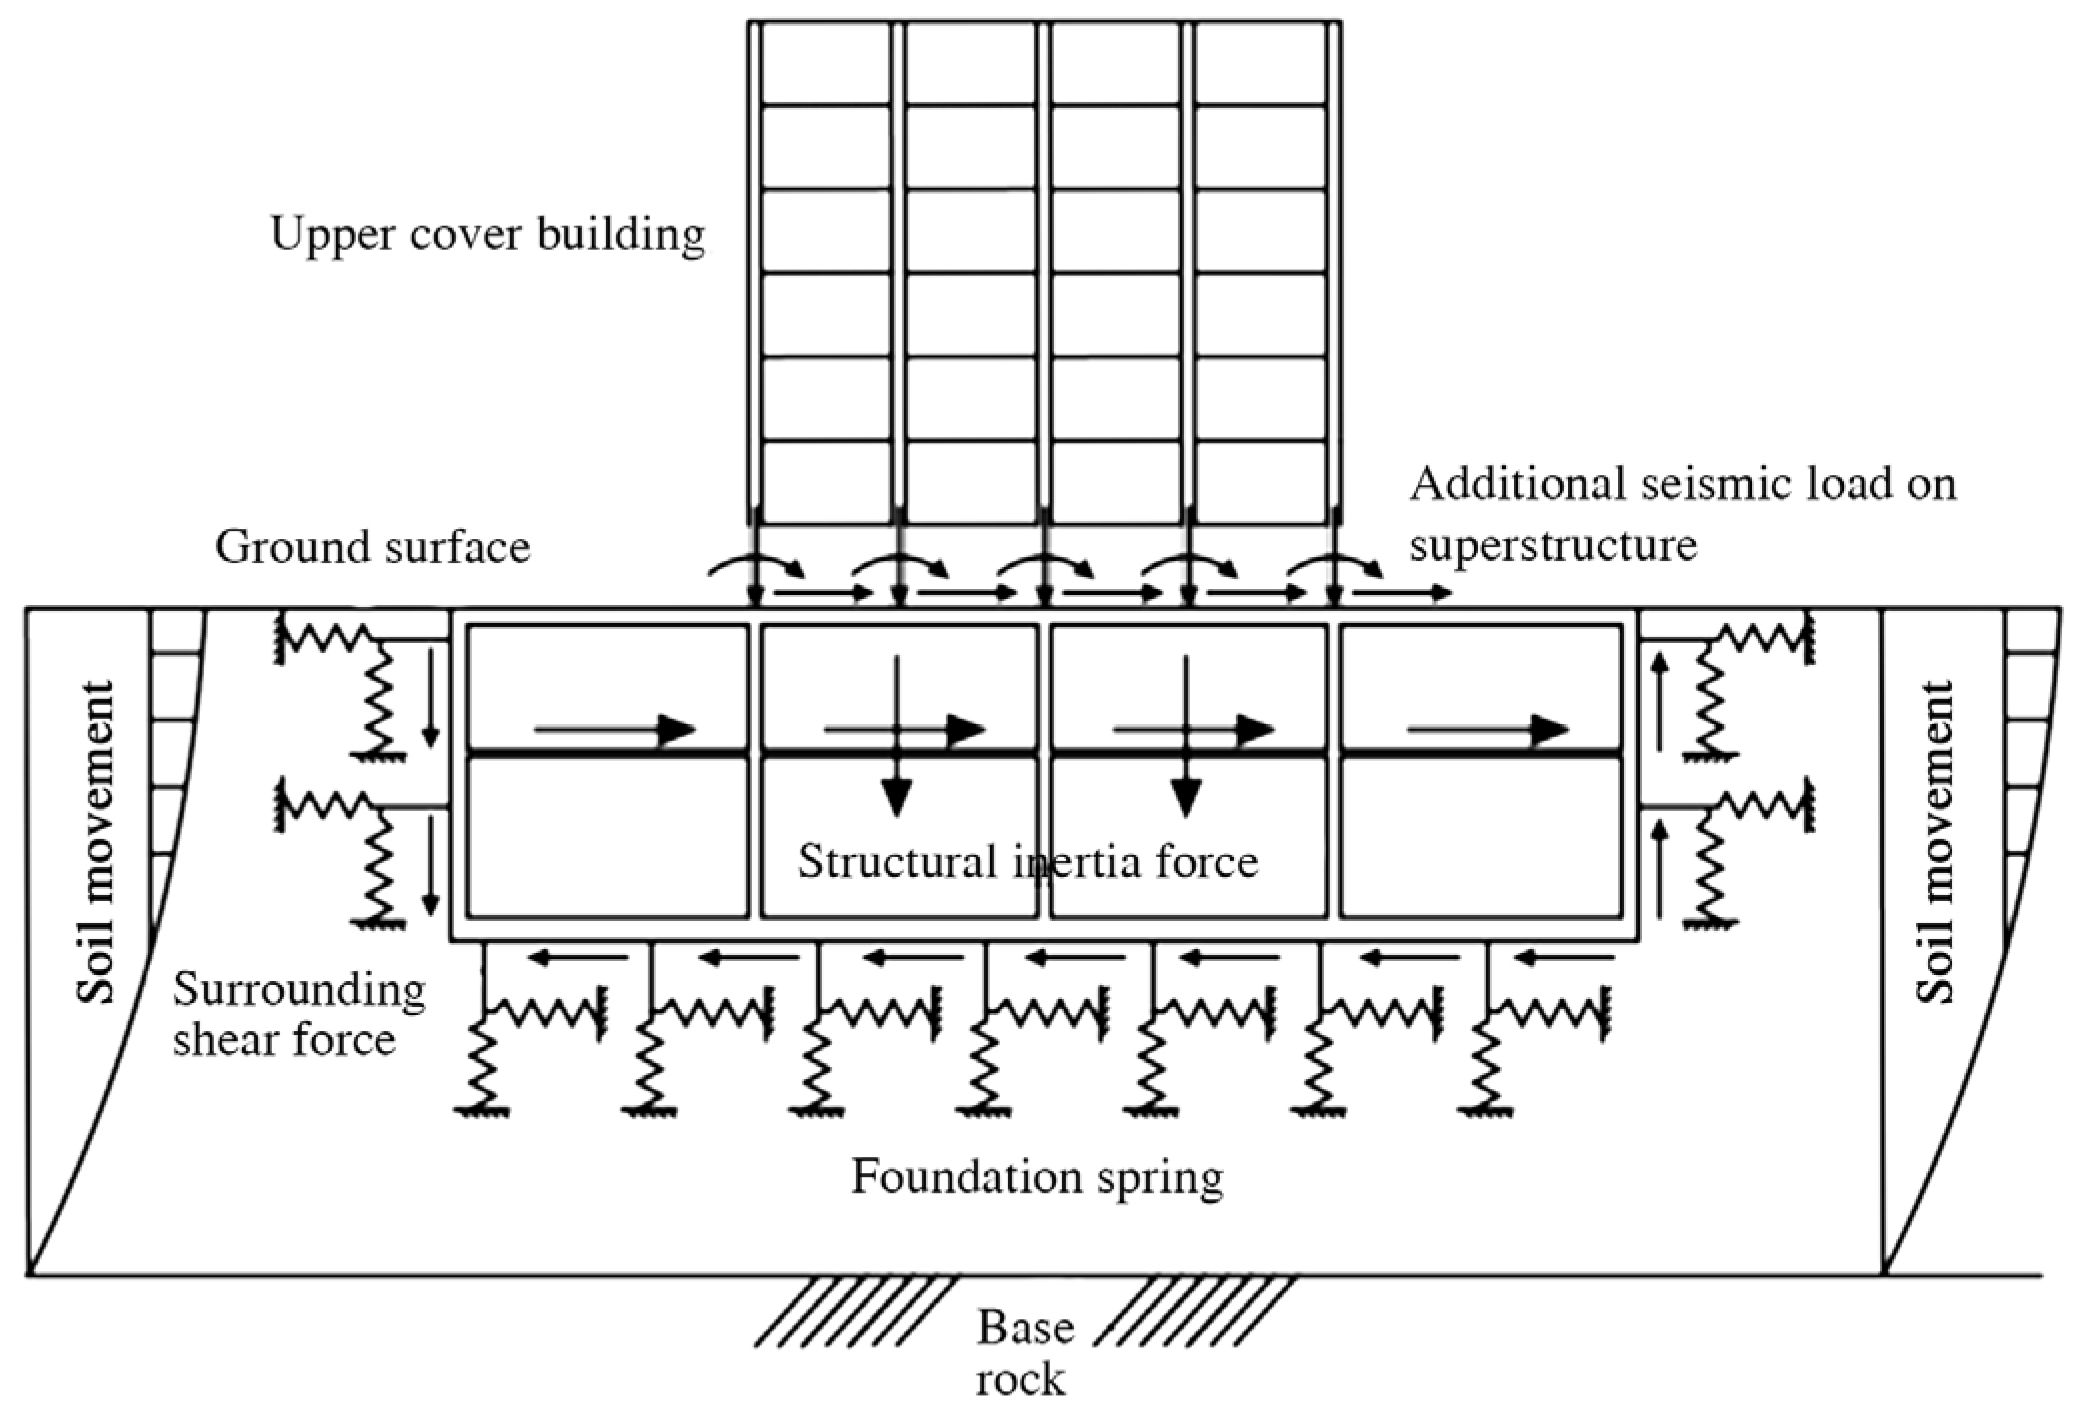
Compared with common subway stations, the TOD structure model is an integrated structural system of ground and underground. The upper cover structure is directly embedded in the roof of the subway station complex. Under a horizontal earthquake, the base of the upper structure will generate a large bottom bending moment, torque, and shear force, etc. Meanwhile, as the upper structure is often a high-rise building, the vertical inertia force generated under the vertical earthquake is not negligible. Here, the additional internal force of the foundation base and vertical inertial force generated by the upper cover structure are unified as the additional seismic load of the upper cover structure. Based on the load-structure model of the traditional response displacement method and the seismic response law of the underground complex structure of the TOD mode, a simplified mechanical model for the seismic calculation of the subway station complex structure considering the influence of the upper cover structure frame structure is proposed, as shown in Figure 2.

2.2.1. Additional Seismic Load of Superstructure

Both the equivalent base shear method and the mode-superposition response spectrum method are based on the basic assumption that the structure is in linear elasticity. The traditional mode-superposition response spectrum method and the equivalent base shear method assume that the bottom is a fixed end in seismic calculation. The premise of this assumption is that the foundation stiffness is very large. For the seismic design of the underground complex structure of the TOD mode, the upper structure is directly embedded in the roof of the lower large underground complex structure, and the stiffness of the underground structure is greater than that of the general foundation. Therefore, it is more in line with the assumption of considering setting the bottom of the upper cover structure as a fixed-end constraint to construct a calculation diagram. It is feasible to use the traditional ‘gourd string’ model to calculate the seismic action of the superstructure.
(1)
Bottom shear
The calculation of the bottom shear force of the upper cover structure can be obtained by the mode-superposition response spectrum method. The calculation formula is:
S = S j 2
S j = F j i
F j i = G i α j γ j ϕ j i
where G i is the weight of the simplified particle i of the structural floor; α j is the jth vibration mode seismic influence coefficient calculated according to the jth order period of the system; γ j is the participation coefficient of the j-mode; ϕ j i is the mode displacement of j vibration mode at i particle.
When the height of the upper structure does not exceed 40 m and it is a frame structure, the bottom shear force of the building can also be obtained by the equivalent base shear method. The calculation formula is:
F E K = G e q α 1
where F E K is the bottom shear force of the structure; G e q is the structural equivalent total mass load; α 1 is the seismic influence coefficient of the first mode.
(2)
Bottom bending moment
Under the action of the horizontal earthquake, the bending moment generated by the bottom of the upper-structure column directly acts on the top plate of the subway station structure, which can be approximately solved by the anti-bending point method. It is assumed that the contra flexure point of the bottom column is at a height of 2/3 column from the top plate of the station.
The shear force of the bottom columns of the upper cover structure can be calculated using the following formula:
V k = i k k = 1 m i k V , k = 1 , , m
where i k is the linear stiffness of the kth column in the bottom floor; k = 1 m i k is the sum of the linear stiffnesses of all the columns in the bottom floor; V k is the shear force of the kth column in the bottom floor; and V is the sum of the shear forces of the columns in the bottom floor.
After obtaining the shear force of each column, the column bottom bending moment of each column can be obtained according to the position of the assumed contra flexure point.
(3)
Vertical inertia force
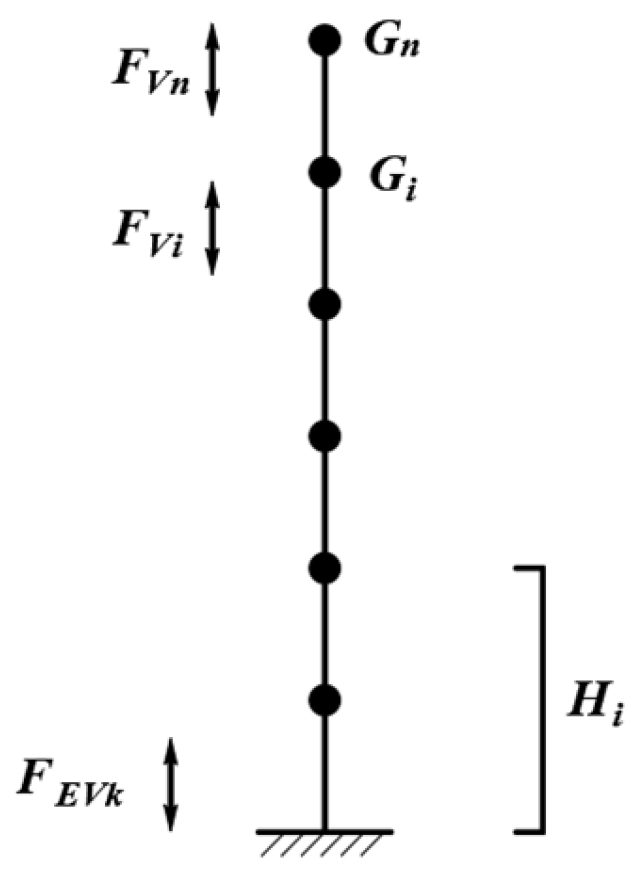
The equivalent base shear method can be used to calculate the vertical inertia force of the upper building. It is an equivalent horizontal seismic action method. The calculation diagram is shown in Figure 3. The calculation formula is:
F E V k = 0.65 α m a x G e g
F v i = G i H i j = 1 n G j H j 2 F E v k , j = 1 , , n
where F E V k is the standard value of the total vertical seismic action of the structure; F v i is the standard value of vertical seismic action of particle i; α m a x is the maximum horizontal seismic influence coefficient; G e g is the structural equivalent total gravity load; G i is the gravity load of the layer i; H i is the height of the particle from the ground.
The vertical seismic load is calculated according to the distribution ratio of the gravity load borne by each component multiplied by the dynamic response increasing coefficient of 1.5.

2.2.2. Improved Response Displacement Method Implementation Steps

(1) One-dimensional free-field analysis. Free Field Analysis, a program included in Midas GTS NX, is used to conduct the 1D free-field analysis, find the moment when the maximum relative displacement of the soil occurs at the top and bottom plate positions, and record the relative displacement of the soil layer from the top plate to the bottom plate, the soil shear force at the top and bottom plate positions, and the horizontal acceleration of the ground soil layer at this moment.
(2) Solve for the foundation spring stiffness. The convergent shear modulus of each soil layer calculated using the one-dimensional free field is used to establish a finite element model of the soil layer, as shown in Figure 4. The horizontal and vertical uniformly distributed loads are applied at the location of the model structure to obtain the deformation in both directions and to derive the coefficient of foundation, which can also be derived from the inverse by applying forced displacements. Finally, the foundation spring stiffness is obtained by the formula k = Kld, where k is the foundation spring stiffness; K is the bed coefficient; l is the concentrated spring spacing of the foundation; d is the calculated length of the stratum along the longitudinal direction of the underground structure.
(3) Additional seismic load on the upper structure. The calculation process refers to Section 2.2.1 to find out the key parameters such as bottom shear force, bottom bending moment, and vertical inertia force for the seismic load of the upper structure.
(4) Establishment of improved load-structure model of the response displacement method. Ground movement, ground shear force, horizontal and vertical acceleration of the structure, and additional seismic load of the upper cover structure are applied at the corresponding position of the structure: where the stratum displacement is imposed at the end of the horizontal soil spring on the side walls and bedplate of the structure; the stratigraphic shear force is applied on the side wall and the bottom plate of the structure; the horizontal acceleration applied to the structure is the horizontal relative acceleration of each soil layer along the height in one-dimensional free-field analysis; and the additional seismic load is applied at the location where the upper structure column is connected to the top slab of the subway station.

3. Example Analysis

3.1. Calculation Model and Parameters

The calculation model comes from a project in Tongzhou, Beijing, where the underground subway station complex is a three-story and ten-span box frame structure, the above-tower building is a frame structure, and the cross section of the structural system and its corresponding dimensions are shown in Figure 5. The cross-sectional dimension of the column in the underground metro station is 0.8 m × 1.2 m, using C45 concrete; the side walls are 1.1 m thick, and the thickness of the top, middle, and bottom slabs are 1.0 m, 0.4 m, and 1.2 m, respectively, using C40 concrete; the slab of the upper structure is 0.15 m thick, and the cross-sectional dimension of the column is 0.7 m × 0.7 m, and the upper structure is all made of C35 concrete. The parameters of each soil layer are derived from the geological survey report of the project site. The soil layers with similar physical and mechanical properties are merged and simplified into eight soil layers. The main parameters of the soil layer are shown in Table 1.
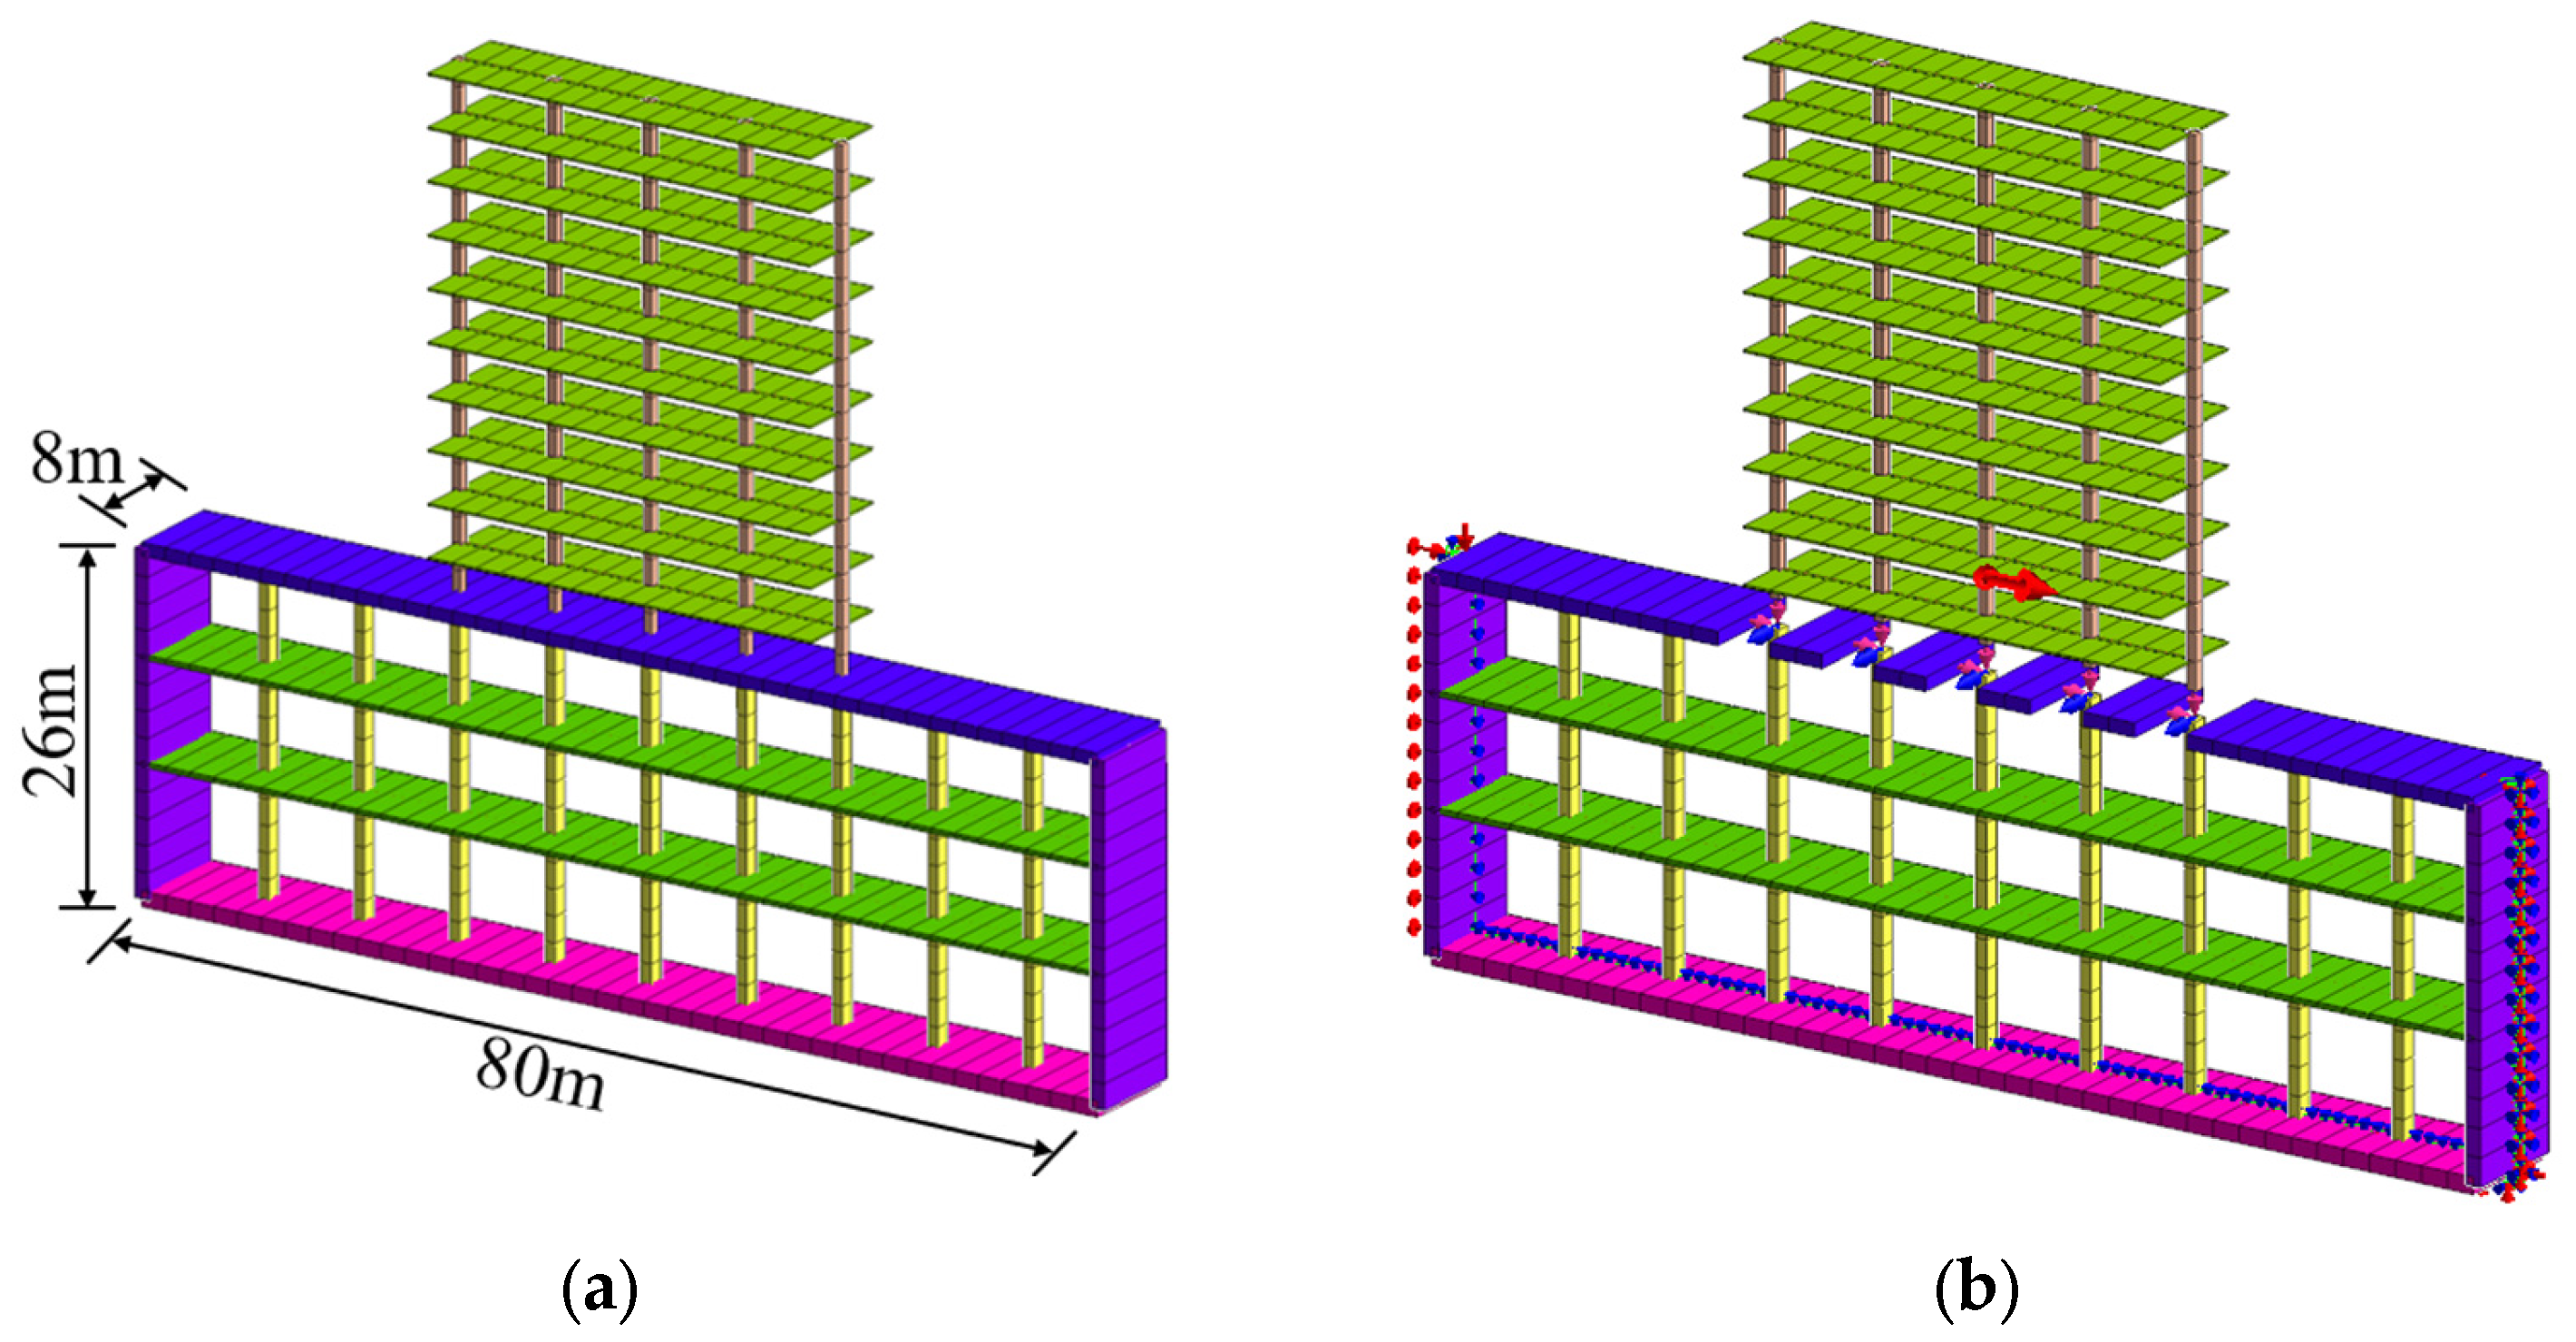
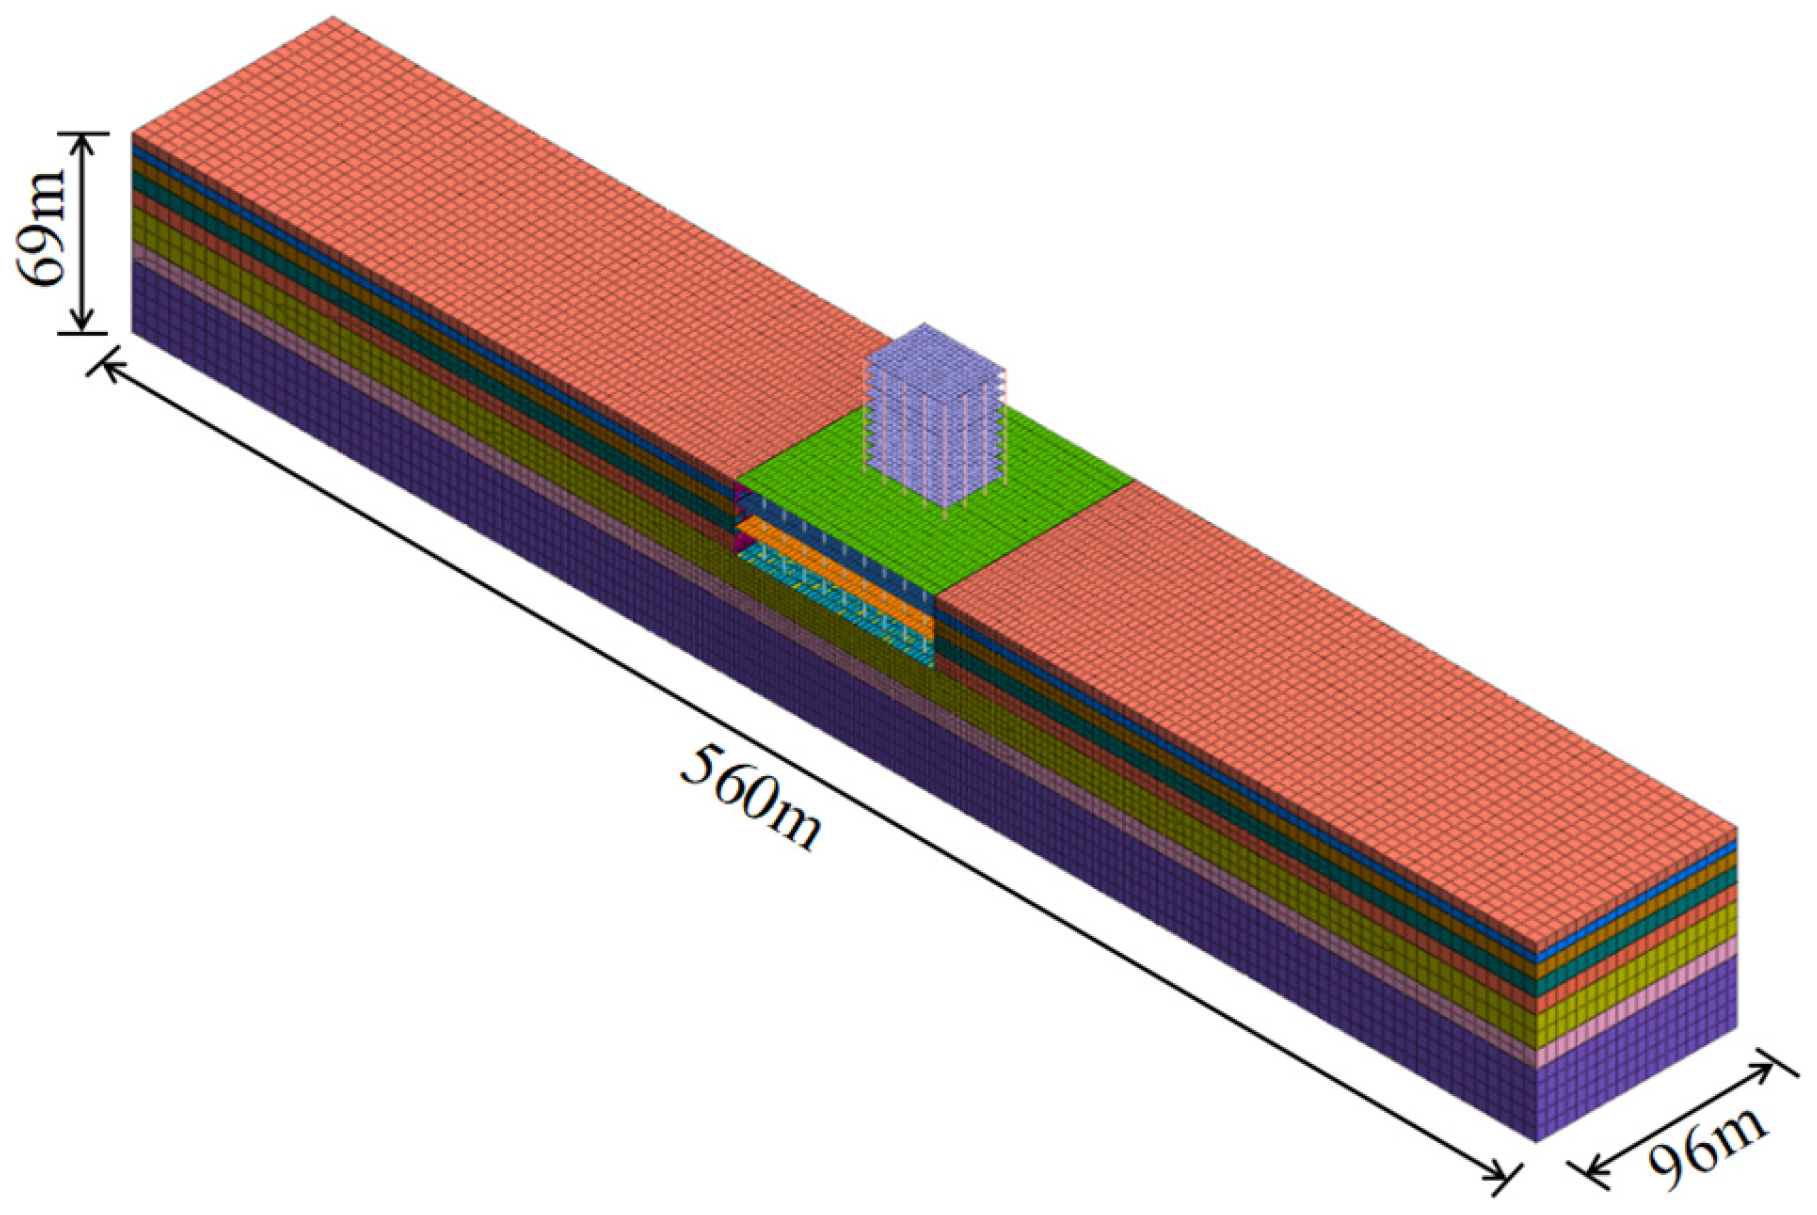
Based on the project, the improved response displacement method model for seismic calculation of underground structures is shown in Figure 6. The load-structure model is modeled by the equivalent frame method [16], that is, the middle column of the subway station is taken as the prototype size of 0.8 m × 1.2 m, the lateral width of the side wall and the top and bottom plates is taken as the actual width, and the longitudinal length is taken as the sum of the half column spacing before and after the middle column, that is 8.0 m. At the same time, the calculation accuracy of the improved response displacement method was evaluated, and the calculation results of the time-history analysis method were used as the benchmark. The finite element software Midas GTS NX was used to establish a three-dimensional numerical model of soil-structure interaction with a model length of 560 m, a width of 80 m, and a soil thickness of 69 m, as shown in Figure 7. The modified Moore–Coulomb constitutive model and elasticity constitutive model are adopted for the model soil and structure, respectively, and the model system adopts Rayleigh damping with the damping ratio taken as 5%. The bottom boundary of the numerical model is a fixed constraint, and the free field boundary is used all around. The structural dimensions, material parameters, and seismic waves and their peak accelerations of the numerical model are kept consistent with the pseudo-static model. For the structural system under the TOD mode to carry out the internal force and deformation analysis under seismic action, the structural system is designed in accordance with the elastic behavior, and it is assumed that the structure and members are in the elastic working state, and the internal force and deformation analysis adopts the linear dynamic method.

3.2. Input Ground Motion and Seismic Response of Underground Structure

In order to analyze the applicability of the improved response displacement method under the different seismic waves, the Beijing artificial wave and the Kobe wave, the near-field seismic wave Loma Prieta wave and the far-field seismic wave Landers wave were selected as the input seismic bedrock motion, and the acceleration–time–course curves of seismic waves are shown in Figure 8. The acceleration response spectra of the three seismic components of the seismic waves are shown in Figure 9. In addition, the analysis of the influencing factors of the improved response displacement method is based on the calculated results of the structural reaction under the Beijing artificial wave, and the conditions under other seismic waves are compared with this condition.
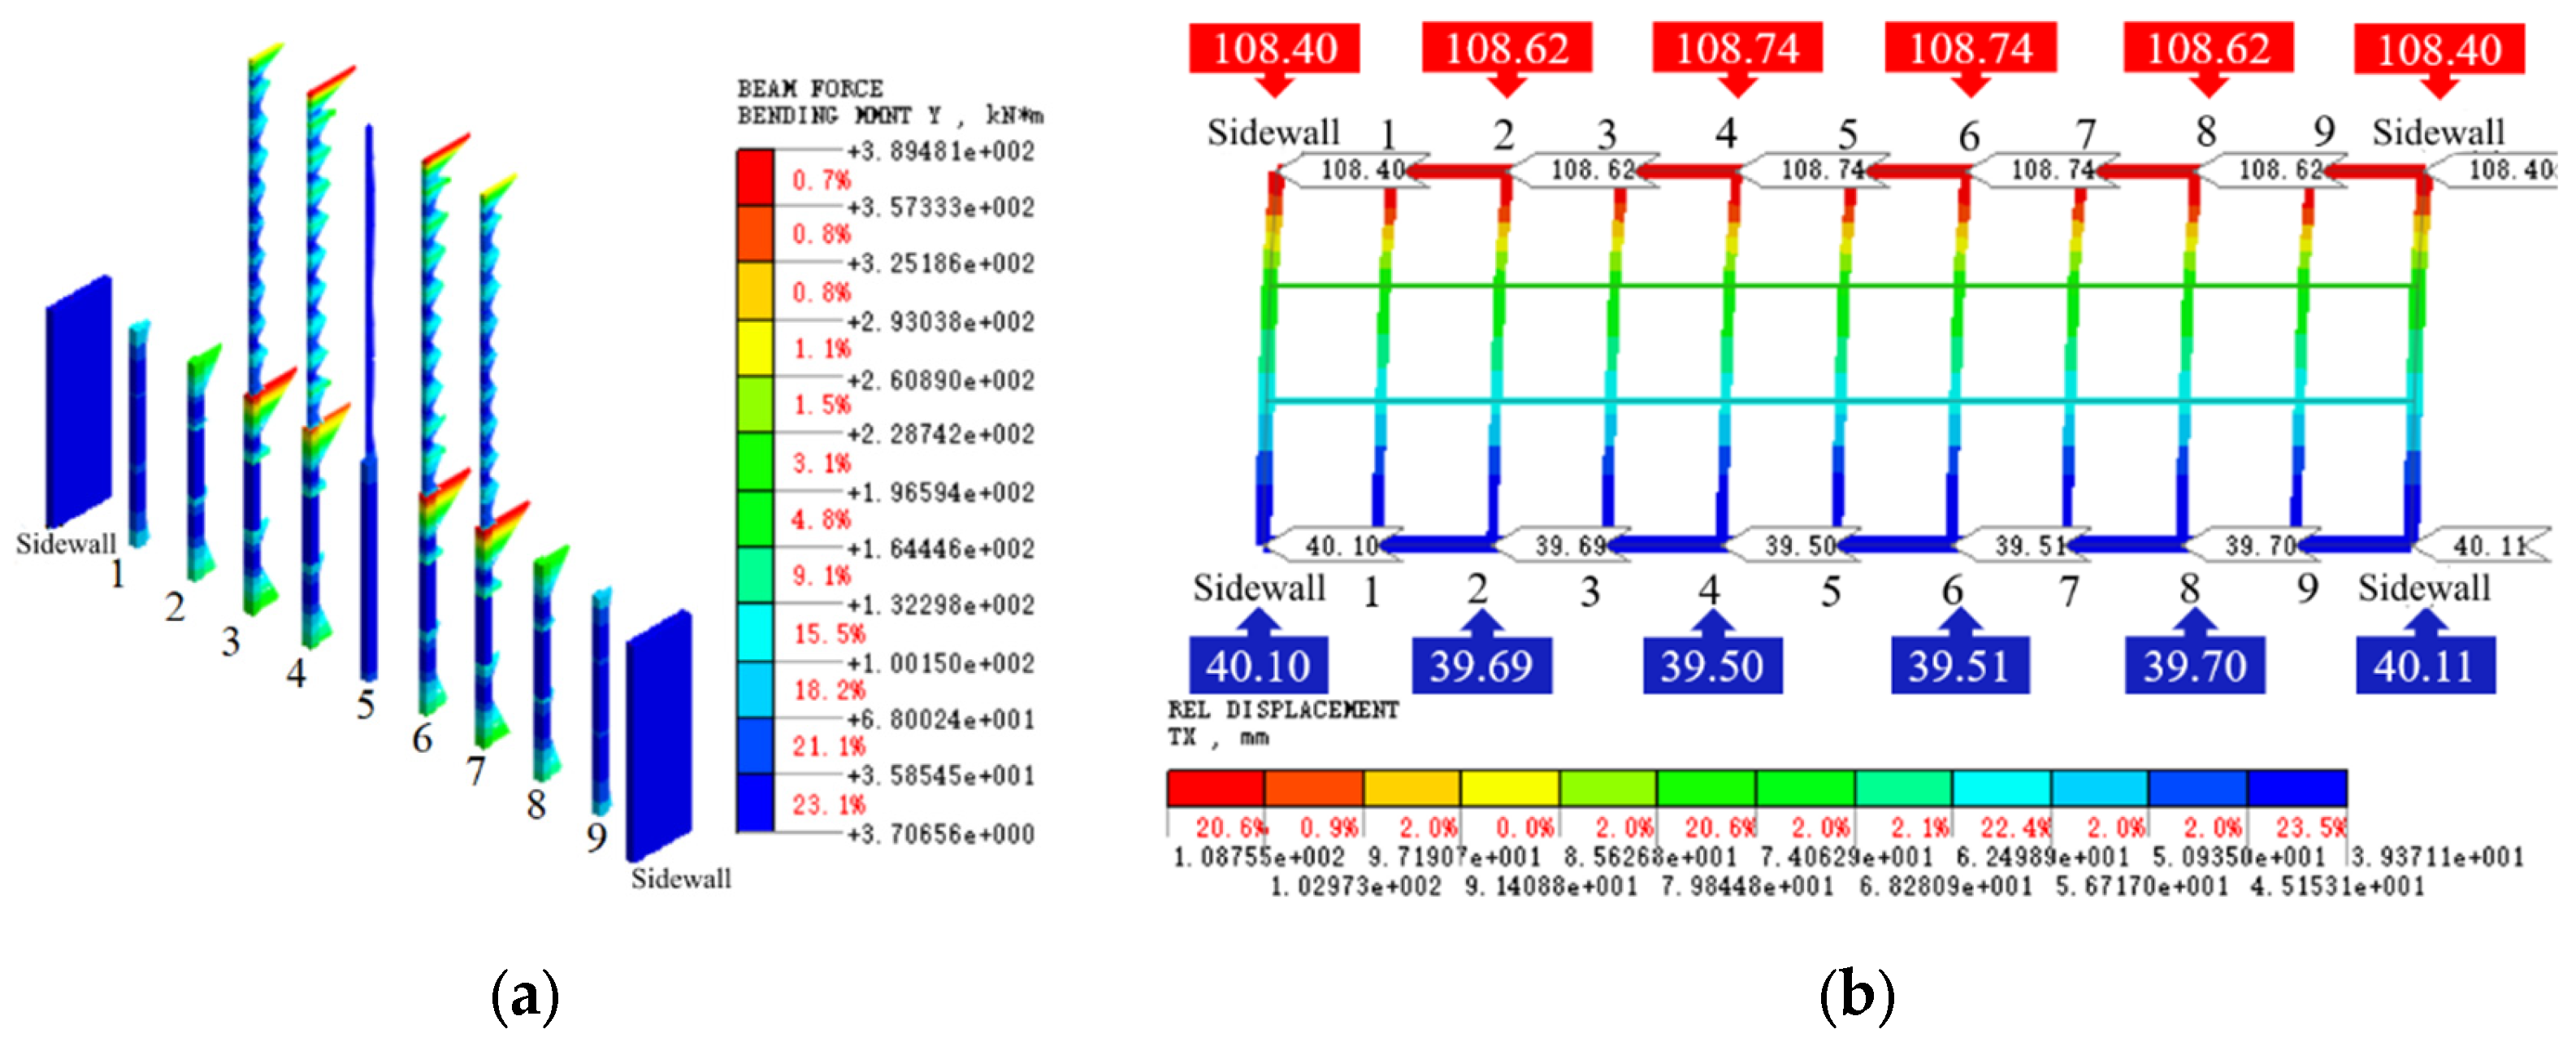
For the convenience of analysis, the middle columns in the subway station are numbered column 1 to column 9, whereas the columns in the subway stations with upper cover structures are numbered column 3 to column 7, as shown in Figure 10. The calculated results of the bending moment and deformation of the middle column of the subway station complex and its superstructure system under the action of the Beijing artificial wave with a peak acceleration of 0.2 g are shown in Figure 10. As can be seen from the bending moment cloud atlas in Figure 10, the top of the negative first floor and the bottom of the negative third floor of each middle column of the subway station have significantly larger bending moments compared to the rest of the column. At the same time, the internal force and deformation of the middle column in the area with and without the upper cover structure are also different. Comparing the top bending moment of the middle column of the negative layer of the subway station at different locations, it is found that the bending moment of the building with upper cover is obviously larger than that of the building without upper cover, and the deformation of the underground structure with upper cover is still shearing type deformation, which is consistent with the conclusion obtained in Reference [6]. In addition, the horizontal deformation of the middle column of the underground structure is slightly larger than that of the side wall, and that of the middle column at the position directly connected with the upper building is the largest.
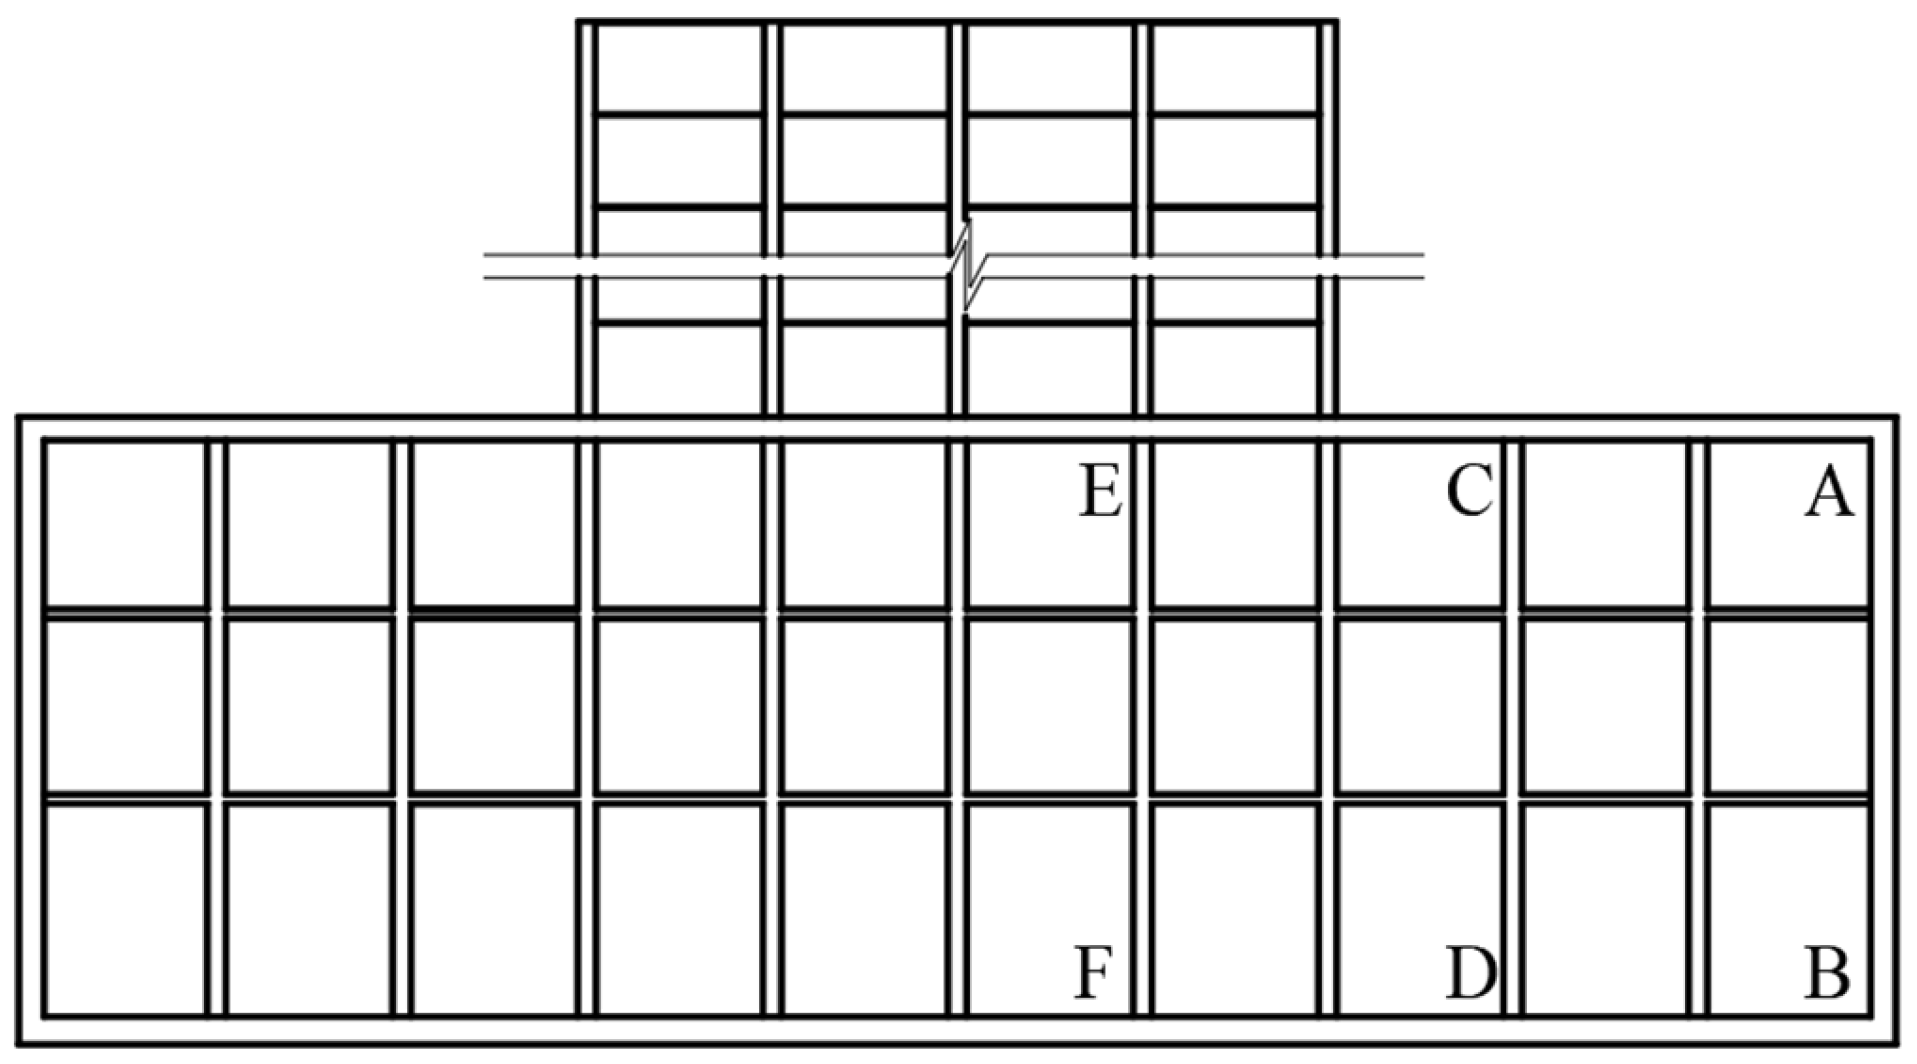
As the top of the middle column in the negative layer, the bottom of the middle column in the negative three layers, and the top and bottom of the side wall in the underground structure have the largest internal force and deformation, it is the key part to be considered in seismic design. Because of the limited space, only the calculation results of these key parts are concerned when the quasi-static seismic calculation of the underground structure is carried out. The monitoring position of the structure when taking the improved response displacement method proposed in this paper for seismic calculation is shown in Figure 11. Where, A is the top of the side wall, B is the bottom of the side wall, C is the top of the middle column of the building without upper cover, D is the bottom of the middle column of the building without upper cover, E is the top of the middle column of the building with upper cover, and F is the bottom of the middle column of the building with upper cover.

4. Analysis of Calculation Results

4.1. One-Dimensional Free-Field Analysis and Bottom Shear Method Calculation Results

The displacements, accelerations, and shear stresses at different locations of the one-dimensional free-field soil layers were obtained via Free Field Analysis, the bed coefficients in the horizontal and vertical directions were obtained by the finite element method, and the additional seismic loads on the upper structure, including shear force, bending moment and vertical inertia force, were obtained via the bottom shear method, and the data are shown in Table 2.

4.2. Seismic Wave Types and Different Peak Acceleration

The bending moment, deformation, and error of the key parts of the subway station complex and its upper structure system calculated via the traditional response displacement method, the time-history method and the improved response displacement method, under the action of the Kobe wave, the Loma Prieta wave, the Landers wave with peak acceleration of 0.2 g, and the Beijing artificial wave with peak acceleration of 0.05 g, 0.1 g, 0.2 g, and 0.4 g, respectively, are given in Table 3, Table 4, Table 5 and Table 6. The deformation error is defined as the ratio of the difference between the numerical results calculated via the response displacement method and the time-history method to the numerical results calculated via the time-history method, the result is a positive number, same as below.
It can be clearly seen from Table 3 and Table 4 that under the action of different seismic waves, the calculation results of the traditional response displacement method and the time-history analysis method are quite different, and the calculation results of the traditional response displacement method are generally smaller than the results of the time-history analysis method. The maximum error of structural deformation is 25%, and the bending moment error at the middle column E is greater. Because the improved response displacement method considers the additional seismic load of the upper structure under the seismic action, the calculation results are closer to the real situation, the results of the improved response displacement method and the time-history analysis method are closer, with a maximum error of about 10%.
Meanwhile, under the action of near-field seismic waves and far-field seismic waves, the calculation results of the improved response displacement method are close to the results of the time-history analysis method, so the improved response displacement method can also provide high accuracy for the action of different types of ground shaking.
The internal force and deformation of the side wall and the middle column calculated via the improved response displacement method are increased compared with the traditional response displacement method, and the growth law of the internal force and deformation of the structure are basically the same under different seismic waves. It can be seen from Table 3 and Table 5 that the top bending moment of the side wall and the middle column calculated via the improved response displacement method is greatly increased compared with the traditional response displacement method, with an increase of about 10 to 40%. The increase of the bottom bending moment of the side wall and the middle column is small, and the maximum increase is not more than 20%. The bending moment of the middle column with upper cover structure increases more than that without upper cover structure. It can be seen from Table 4 and Table 6 that the internal forces of the side wall and the middle column in the improved response displacement method are similar to those in the time-history analysis method, but the displacement of the former is slightly larger than that of the latter. This is due to the fact that the top bending moment of the structural side walls and middle column increases more than the bottom in the improved response displacement method compared to the traditional response displacement method, the significant increase in internal force at the top of the structure makes the horizontal deformation at the top of the structure increase.
From Table 5 and Table 6, it can be seen that the change pattern in the calculation results obtained via the three calculation methods is consistent for the subway station complex structure of the TOD mode under the action of the Beijing artificial waves with different ground vibration intensities, and the internal forces and deformations of the subway station structures increase with the peak seismic acceleration.

4.3. Analysis of Different Upper Cover Structure Position Forms

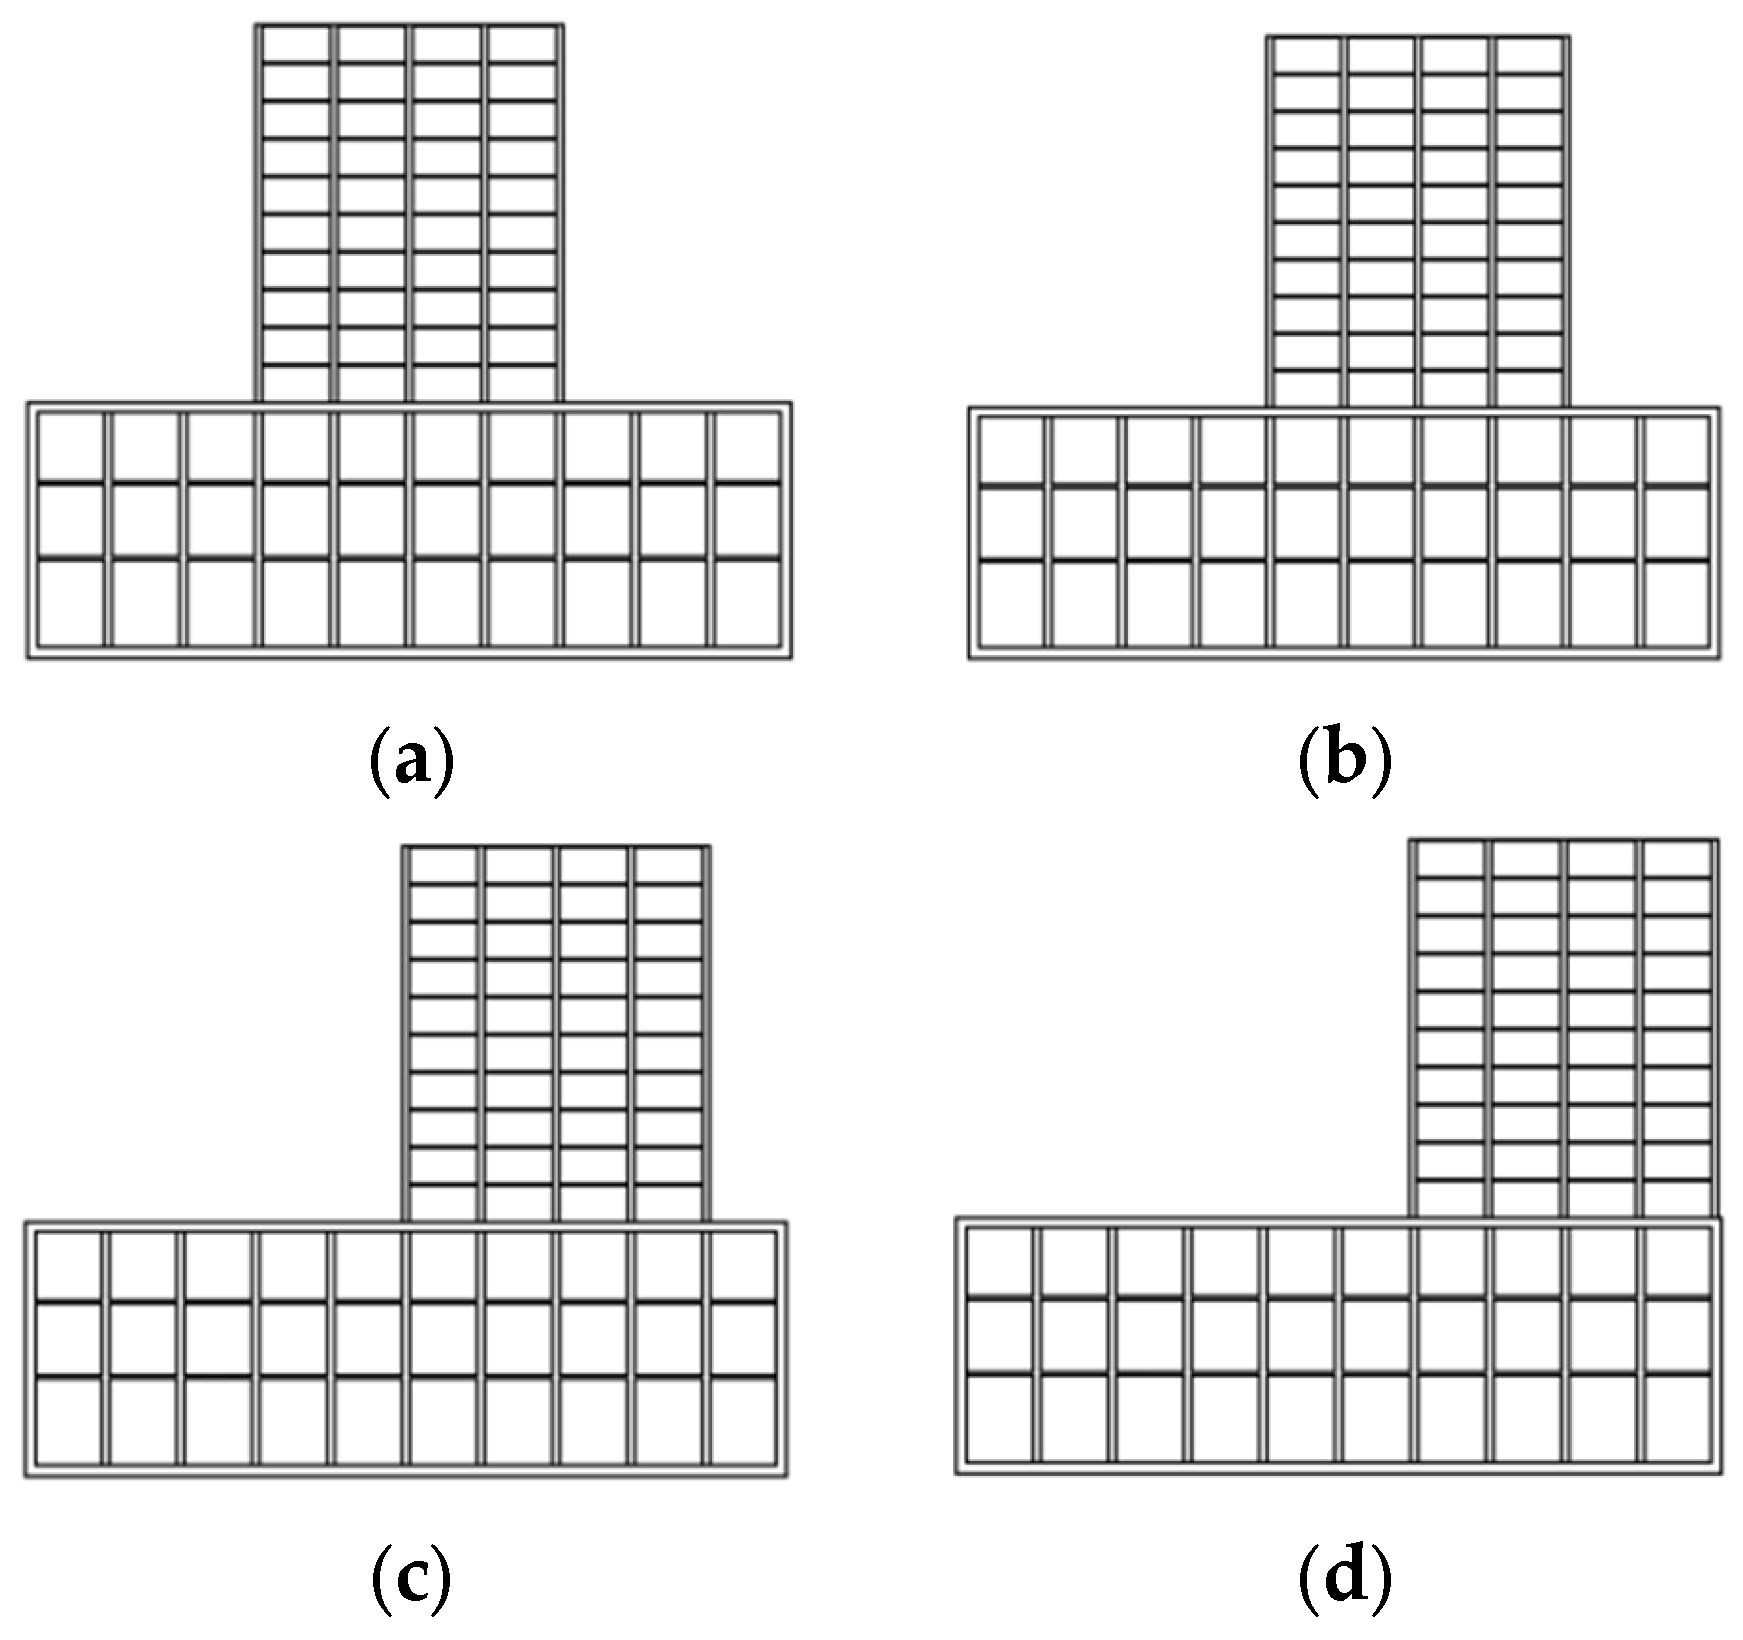
To investigate the general applicability of the improved response displacement method, the calculation conditions where the subway station and the upper cover structure are in different relative positions are set up, as shown in Figure 12. Table 7 and Table 8 show the internal forces and deformations of the structures of the subway station complexes obtained via the three calculation methods, which differ in their upper cover structure with respect to their relative positions.
It can be seen from Table 7 that with the change in the relative position between the upper cover structure and the lower subway station structure, the bending moment at the side wall A and the middle column C and D decreases first and then increases. The bending moment at the side wall B does not change significantly, and the bending moment at the middle column E and F decreases first, then increases and then decreases. The variation law in the bending moment at different positions of the subway station structure calculated via the improved response displacement method is basically consistent with that calculated by the time-history analysis method, and the maximum error is 12%. However, the change in internal force and deformation of the subway station complex is not obvious, and some of the calculation results obtained via the traditional response displacement method differ greatly from the time analysis method, with the maximum error reaching 206%, which is very unreasonable, during the change in the position of the superstructure frame structure, since the traditional reaction displacement method cannot consider the additional seismic load of the superstructure.

4.4. Different Cover Structures

In order to explore the influence of different upper cover structure forms on the calculation accuracy of the improved response displacement method, three working conditions of underground station complex superstructure frame structure and frame-symmetric shear wall structure, and frame-asymmetric shear wall structure are analyzed.
The plan layout of the three upper cover structures forms is shown in Figure 13, where the frame column cross-section size of the frame-shear wall is 0.7 m × 0.7 m, the thickness of the shear wall is 0.5 m, and the beam has a cross-section size of 0.4 m × 0.8 m.
The improved response displacement method model established when the upper structure is a frame-shear wall structure, the parameters of shear wall are determined according to the equivalent stiffness, and that of the frame columns remain the same as the upper frame structure.
The internal forces and deformations of the subway station obtained via different calculation methods for the three structural forms are given in Table 9 and Table 10 and Figure 14.
It can be seen that the internal force and deformation of the underground structure are related to the form of the upper structure from Table 9 and Table 10 and Figure 14. By comparing the calculation results obtained from the three different upper structure forms using the time-history analysis method, it is found that the upper structure form has less influence on the bending moment of the sidewall of the subway station, but has more influence on the bending moment at middle columns E and F. This is because the superstructure form of central column E and central column F has changed from a frame structure to a shear wall structure, which changes the form of load transmission, resulting in a large change in the bending moment of some middle columns in the subway station, and the variation law in bending moment is different between the two upper structure forms. In addition, the three-dimensional numerical model based on time-history analysis shows that the bending moment of the column in the subway station complex structure changes along the cross section of the station and the longitudinal section of the station. The models based on the traditional response displacement method and the improved response displacement method are both two-dimensional quasi-static models, and only the variation in the middle column bending moment can be reflected on the cross section of the subway station. Therefore, the calculation results based on the traditional response displacement method and the improved response displacement method are analyzed in Figure 14c; the calculation results of the bending moment at column E and column F of the subway station both show large errors, indicating that the improved response displacement method is not applicable to this upper structure frame-shear wall structure with asymmetric shear wall arrangement.

4.5. Analysis of Different Relative Positions of Underground Stations to the Ground

Compared with the common subway station, the roof of subway stations with upper structures is closer to the ground, but not necessarily at the same height as the ground. In order to investigate the applicability of the improved response displacement method under different relative positions of underground stations and the ground, three calculation conditions were set up for the top plate of the subway station 4 m above the ground, equal to the ground and 4 m below the ground. The working condition that the top plate of subway station is located 4 m below the ground is that the bottom of the upper structure has been buried into the soil, and the external wall of the upper structure buried in the soil is 0.8 m thick steel and concrete out-wall. Table 11 and Table 12 and Figure 15 show the internal forces and deformations of the subway station structure obtained via different calculation methods for three working conditions: 4 m above ground level, equal to ground level, and 4 m below ground level.
The calculation results of Table 11 and Table 12 and Figure 15 show that in the process of the location of the roof of the subway station from above the ground to level with the ground, and then to below the ground, the bending moments at the A and B positions of the side wall of the subway station and the C and D positions of the middle column become larger, the bending moments at the E and F positions of the middle column increase first and then decrease, and the deformation of the side wall and the middle column decreases. The internal force and deformation of the side wall calculated based on the traditional response displacement method can clearly reflect the above variation law, but the calculation results are small. In addition, the variation law in bending moment at E and F of the middle column is obviously different from that obtained via the time-history analysis method, and the calculation results are also quite different such as the maximum error of deformation is as high as 47%. The deformation of the structure calculated via the modified response displacement method is slightly smaller than that obtained by the time-history analysis method for the working condition in which the top plate position is 4 m above the ground level, unlike the other two working conditions. However, the internal force calculation results obtained by the improved response displacement method are similar to those obtained via the time-history analysis method, which can well reflect the variation in the internal force of the side walls and the middle column.

4.6. Different Station Complex Structure Stiffness

In order to analyze the influence of structural stiffness on the applicability of the improved response displacement method, the structural stiffness of the subway station complex is adjusted to 1/2, 1, 2, and 4 times of the original. Table 13 and Table 14 show the internal force and deformation results of the subway station structure calculated via different methods under four working conditions.
Analysis of the data in Table 13 and Table 14 shows that the increase in structural stiffness leads to an increase in internal forces at different locations. Therefore, it is not appropriate to resist external loads by increasing the structural stiffness only in seismic design. However, the increase in structural stiffness makes the deformation of underground structure decrease, and the structural stiffness can be appropriately increased for the underground structure with strict control of deformation. Compared with the results of the four working conditions obtained via the time-history analysis method, the maximum error of the deformation calculation results of the improved response displacement method is only 11%, and the greater the stiffness, the smaller the error; while the calculation error of the traditional response displacement method is mostly above 20%.

4.7. Different Soil Stiffness

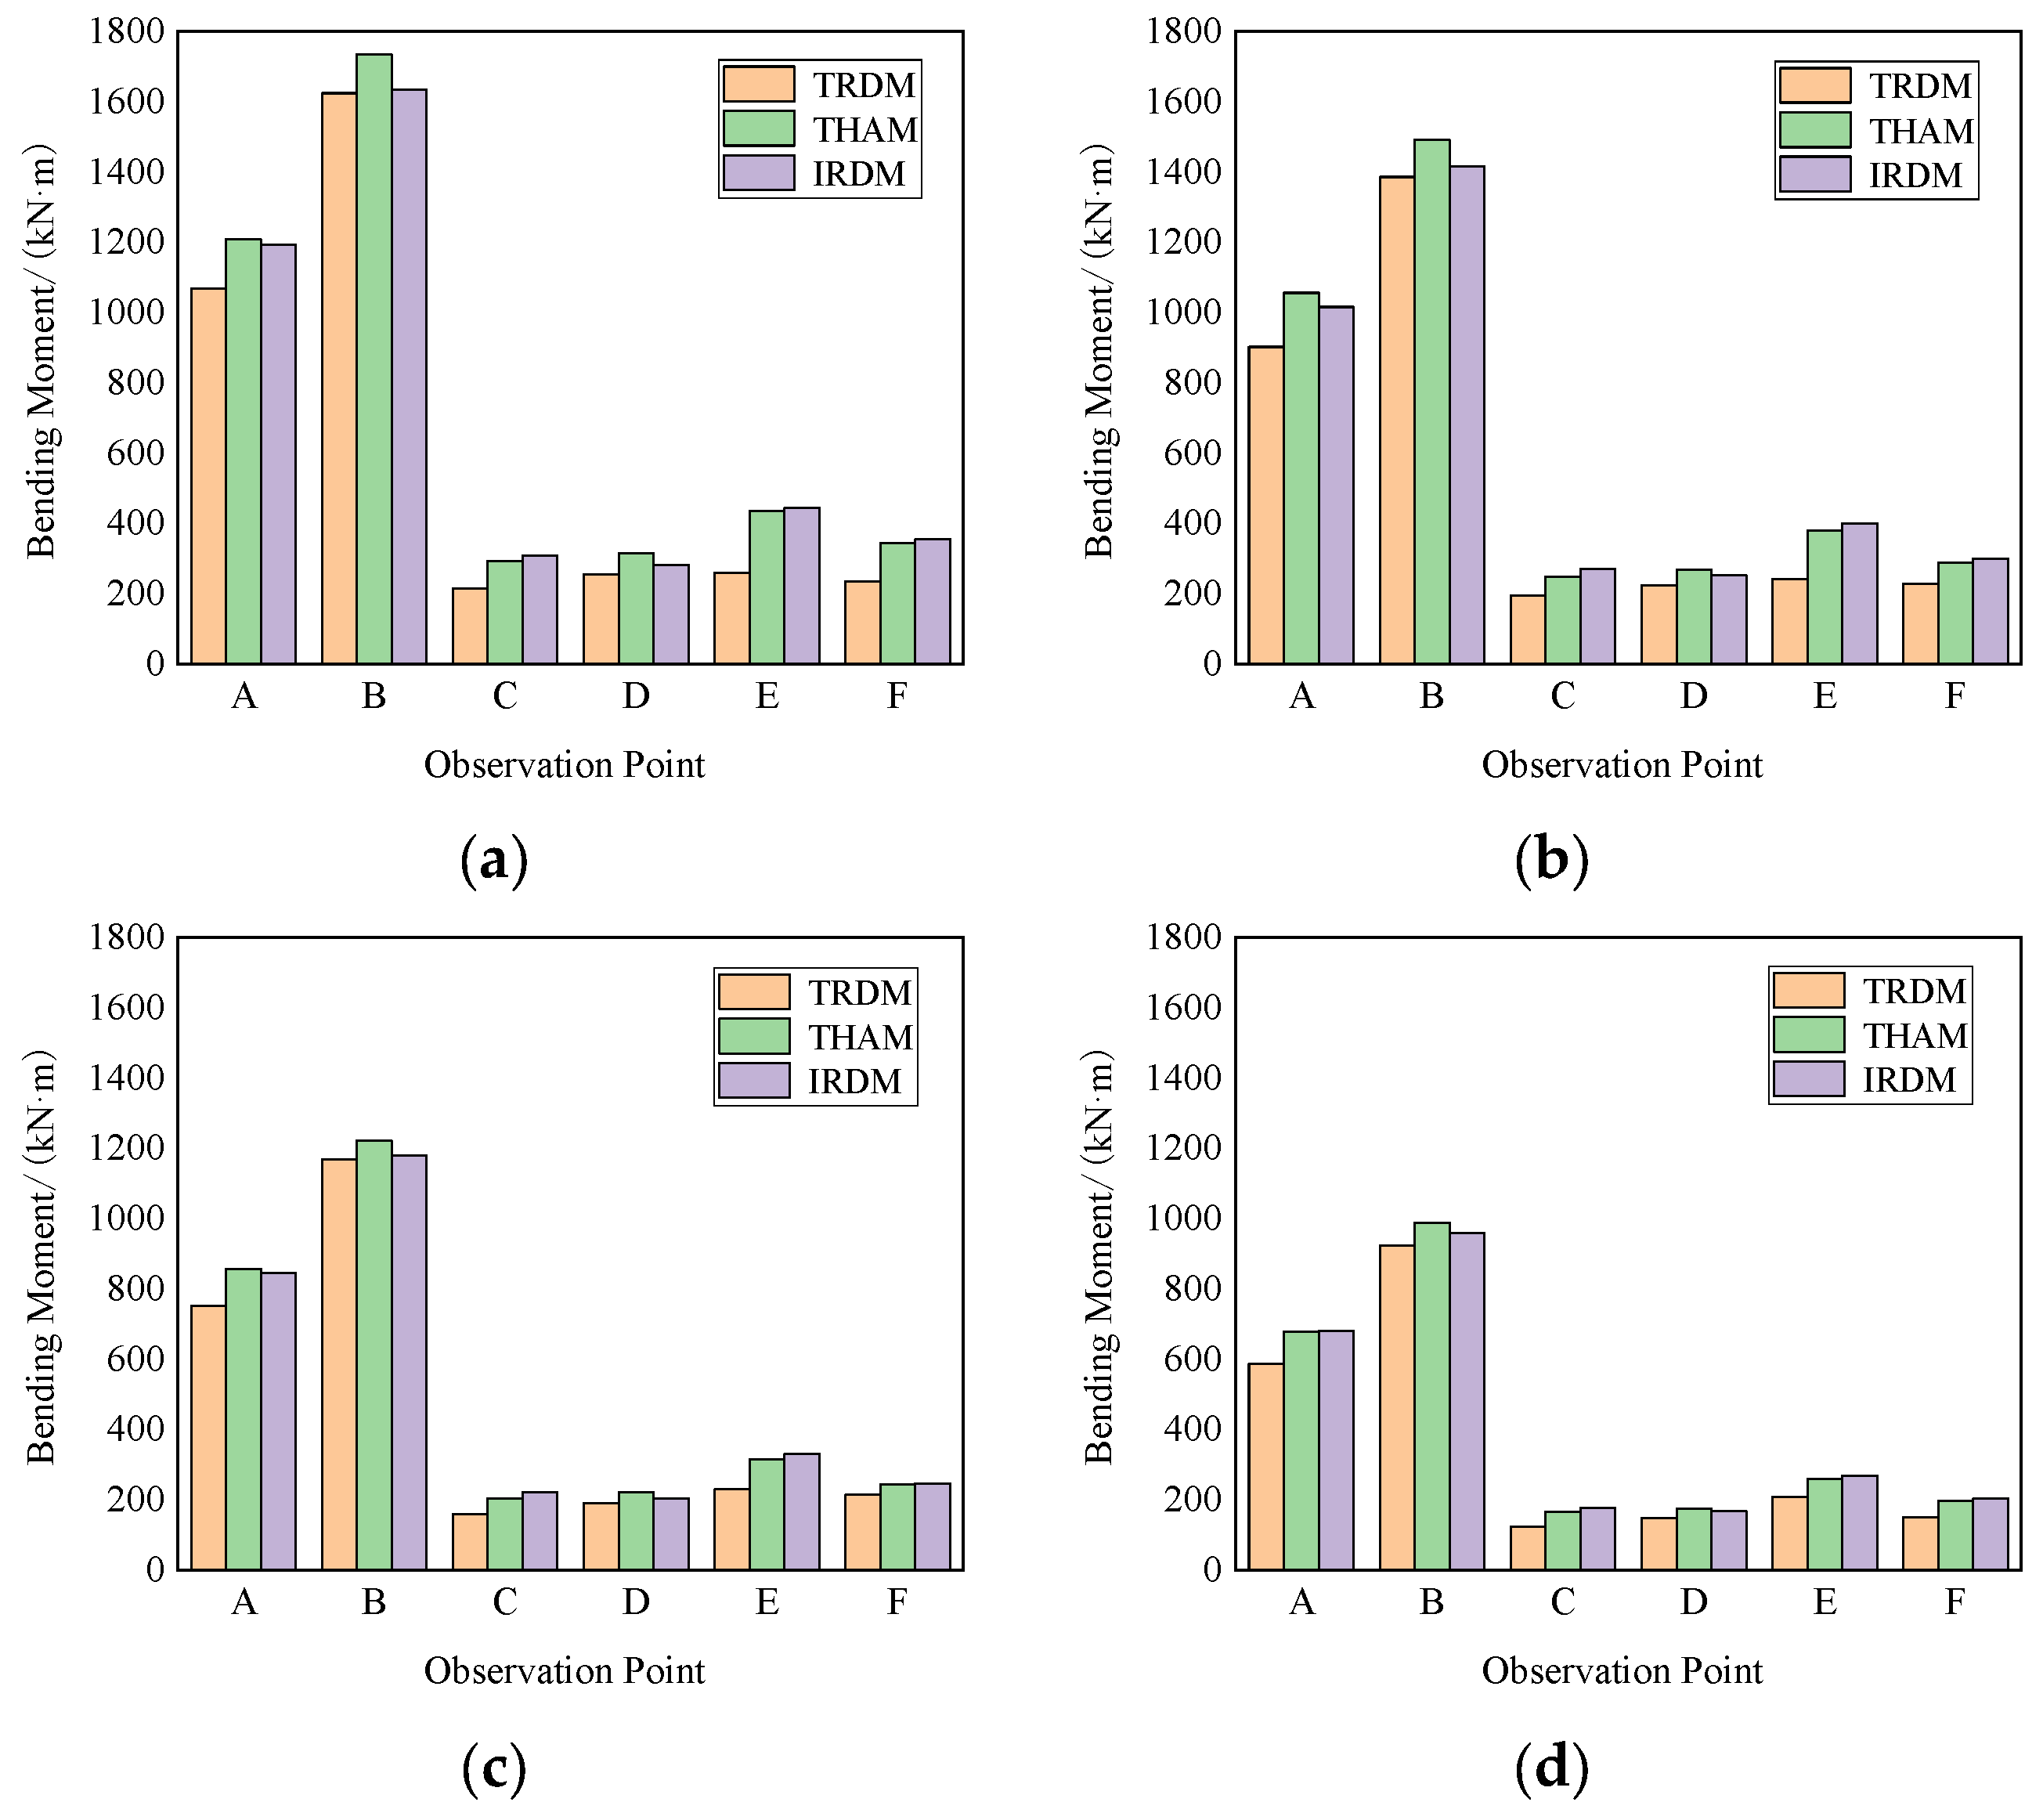
Table 15 and Table 16 and Figure 16 show the results of internal force and deformation of the structure calculated via different methods with the soil stiffness is adjusted to 1/4, 1/2, 1, and 2 times of the original.
Analysis of Table 15 and Table 16 and Figure 16 shows that as the stiffness of the soil increases, the internal force and deformation of the structure tend to become smaller, indicating that the greater the stiffness of the soil, the smaller the external load effect on the underground structure. In engineering, measures to increase the stiffness of the surrounding rock can be used to improve the seismic performance of the structure. The calculation results of the improved response displacement method are slightly smaller than those of the time-history analysis method when the soil stiffness is small, and that of the improved response displacement method are slightly larger when the soil stiffness is larger. The calculation results of internal force and deformation of traditional response displacement method are always small, and the maximum error reaches 26%. Overall, the error of the calculation obtained by the pseudo-static method to calculate the underground structure tend to decrease with the increase in soil stiffness.

5. Conclusions

An improved response displacement method for the seismic calculation of a subway station complex structure considering the influence of the upper frame structure was proposed based on the theory of the traditional response displacement method, and verified by case analysis, and the main conclusions are as follows:
(1)
For seismic calculations, both the equivalent base shear method and the mode-superposition response spectrum method are calculated assuming that the structural system is in a linear elastic state, and the structural system in the TOD mode is designed according to the elastic behavior, and the analysis of the internal forces and deformations is carried out using the linear dynamic method.
(2)
Compared with the calculation results of the time-history analysis method, the internal force and deformation error of a subway station complex calculated via the traditional response displacement method is larger, and the overall value is smaller, so the design is dangerous. The error of internal force and deformation calculated by the improved response displacement method is small, the maximum error is only about 10%, and the variation law is basically consistent with the results in the time-history analysis method.
(3)
The near-field seismic wave and far-field seismic wave are selected as the input seismic bedrock motion, respectively, and compared with the calculation results of the time-history analysis method, the improved response displacement method can still provide better accuracy for different types of ground shaking.
(4)
The traditional response displacement method cannot consider the additional seismic load and vertical inertia force of the superstructure, some of the calculation results obtained via the traditional reaction displacement method are not in conformity with the time-range analysis, and the maximum error is 206%, which makes the calculation results obviously distorted in the process of changing the position of the superstructure frame structure. While the improved reaction displacement method in the calculation results of the underground station structure at different locations of the bending moment change rule and the time-history analysis method is basically consistent, the maximum error is 12%.
(5)
The deformation of the subway station complex structure under strong seismic action is shear-type deformation in the presence of a upper cover single tower frame structure, and the upper cover structure significantly increases the internal force and deformation of the columns in the underground structure connected to it. The top and bottom of the middle columns and side walls in the structure of the subway station complex of TOD mode, especially the middle column members directly connected to the upper structure, are the weak links in seismic design.
(6)
The internal forces and deformations of the subway station complex structure calculated via the time-history analysis method, the traditional response displacement method, and the improved response displacement method under different ground vibration intensities increase with the increase of peak acceleration of ground vibration, respectively.

Author Contributions

Under supervision by J.A. and M.L., F.F. performed the data analysis. Y.Z. constructed the numerical simulation analysis. All authors have read and agreed to the published version of the manuscript.

Funding

This work has been supported by the Fund of Colleges and Universities in Hebei province Science and Technology Research Project (QN2023079).

Data Availability Statement

The data presented in this study are available in article.

Acknowledgments

The authors sincerely thank the anonymous reviewers for their insightful comments and suggestions.

Conflicts of Interest

The authors declare that they have no known competing financial interests or personal relationships that could have appeared to influence the work reported in this paper.

References

  1. Lu, J.; Chen, Y. Integrated design of under-and above-ground urban space: Strategies for effective development of underground space. J. Shanghai Jiaotong Univ. 2012, 46, 1–6. [Google Scholar]
  2. Niu, B. Structural Design of Large-span Column-free subway Station Co-built with Underground Complex. Urban Rapid Rail Transit 2022, 35, 60–64. [Google Scholar]
  3. Li, G.; Zhang, H.; Wang, R.; Dong, Z.; Yu, D. Analysis of seismic failure and influencing factors of complex structures under seismic excitation. J. Build. Struct. 2022, 44, 188–203. [Google Scholar]
  4. Wang, G.B.; Yuan, M.Z.; Ma, X.F.; Wu, J. Numerical study on the seismic response of the underground subway station-surrounding soil mass-ground adjacent building system. Front. Struct. Civ. Eng. 2017, 11, 424–435. [Google Scholar] [CrossRef]
  5. Zhang, T.; Chen, Q. Seismic Response of the System of Soil and Subway Station with Upper Structure. Chin. Q. Mech. 2019, 40, 504–514. [Google Scholar]
  6. An, J.; Zhao, Z.; Wang, X. Seismic Response of Large Chassis Subway Station under Upper Cover Single Tower Frame Structure. China Railw. Sci. 2021, 42, 166–175. [Google Scholar]
  7. Han, X.; An, S.; Zhang, Y.; Liu, S. Influencing factors of seismic response of integrated transportation hub structure. J. Heilongjiang Univ. Sci. Technol. 2019, 29, 682–690. [Google Scholar]
  8. Han, X.; Tao, L.; Zhang, Y. Seismic damage mechanism of integrated station structure of urban rail transit hub. J. Cent. South Univ. (Sci. Technol.) 2021, 52, 925–935. [Google Scholar]
  9. Liu, C. Seismic Performance of Integrated subway station and Upper Cover with High⁃Rise Building. J. Disaster Prev. Mitig. Eng. 2022, 42, 490–498. [Google Scholar]
  10. GB50909-2014; Code for Seismic Design of Urban Rail Transit Structures. China Planning Press: Beijing, China, 2014.
  11. Liu, J.; Wang, W.; Zhao, D.; Zhang, X. Integral response deformation method for seismic analysis of underground structure. Chin. J. Rock Mech. Eng. 2013, 32, 1618–1624. [Google Scholar]
  12. Du, X.; Xu, Z.; Xu, C.; Li, Y. Inertia force-displacement method for seismic analysis of shallow buried underground structures. Chin. J. Geotech. Eng. 2018, 40, 583–591. [Google Scholar]
  13. Xu, Z.; Du, X.; Xu, C.; Han, R.; Qiao, L. Research on generalized response displacement method for seismic analysis of underground structures with complex sections. Rock Soil Mech. 2019, 40, 3247–3254. [Google Scholar]
  14. Du, X.; Jiang, J.; Xu, Z.; Xu, C.; Liu, S. Study on quantification of seismic performance index for rectangular frame subway station structure. China Civ. Eng. J. 2019, 52, 111–119,128. [Google Scholar]
  15. Qiu, Y.; Zhang, H.; Yu, Z. A seismic design method of subway stations affected by surrounding buildings. Rock Soil Mech. 2021, 42, 1443–1452. [Google Scholar]
  16. An, J.; Tao, L.; Li, J. Equivalent plane frame method for the seismic design of the cross section of underground structures. Mod. Tunn. Technol. 2016, 53, 43–50. [Google Scholar]
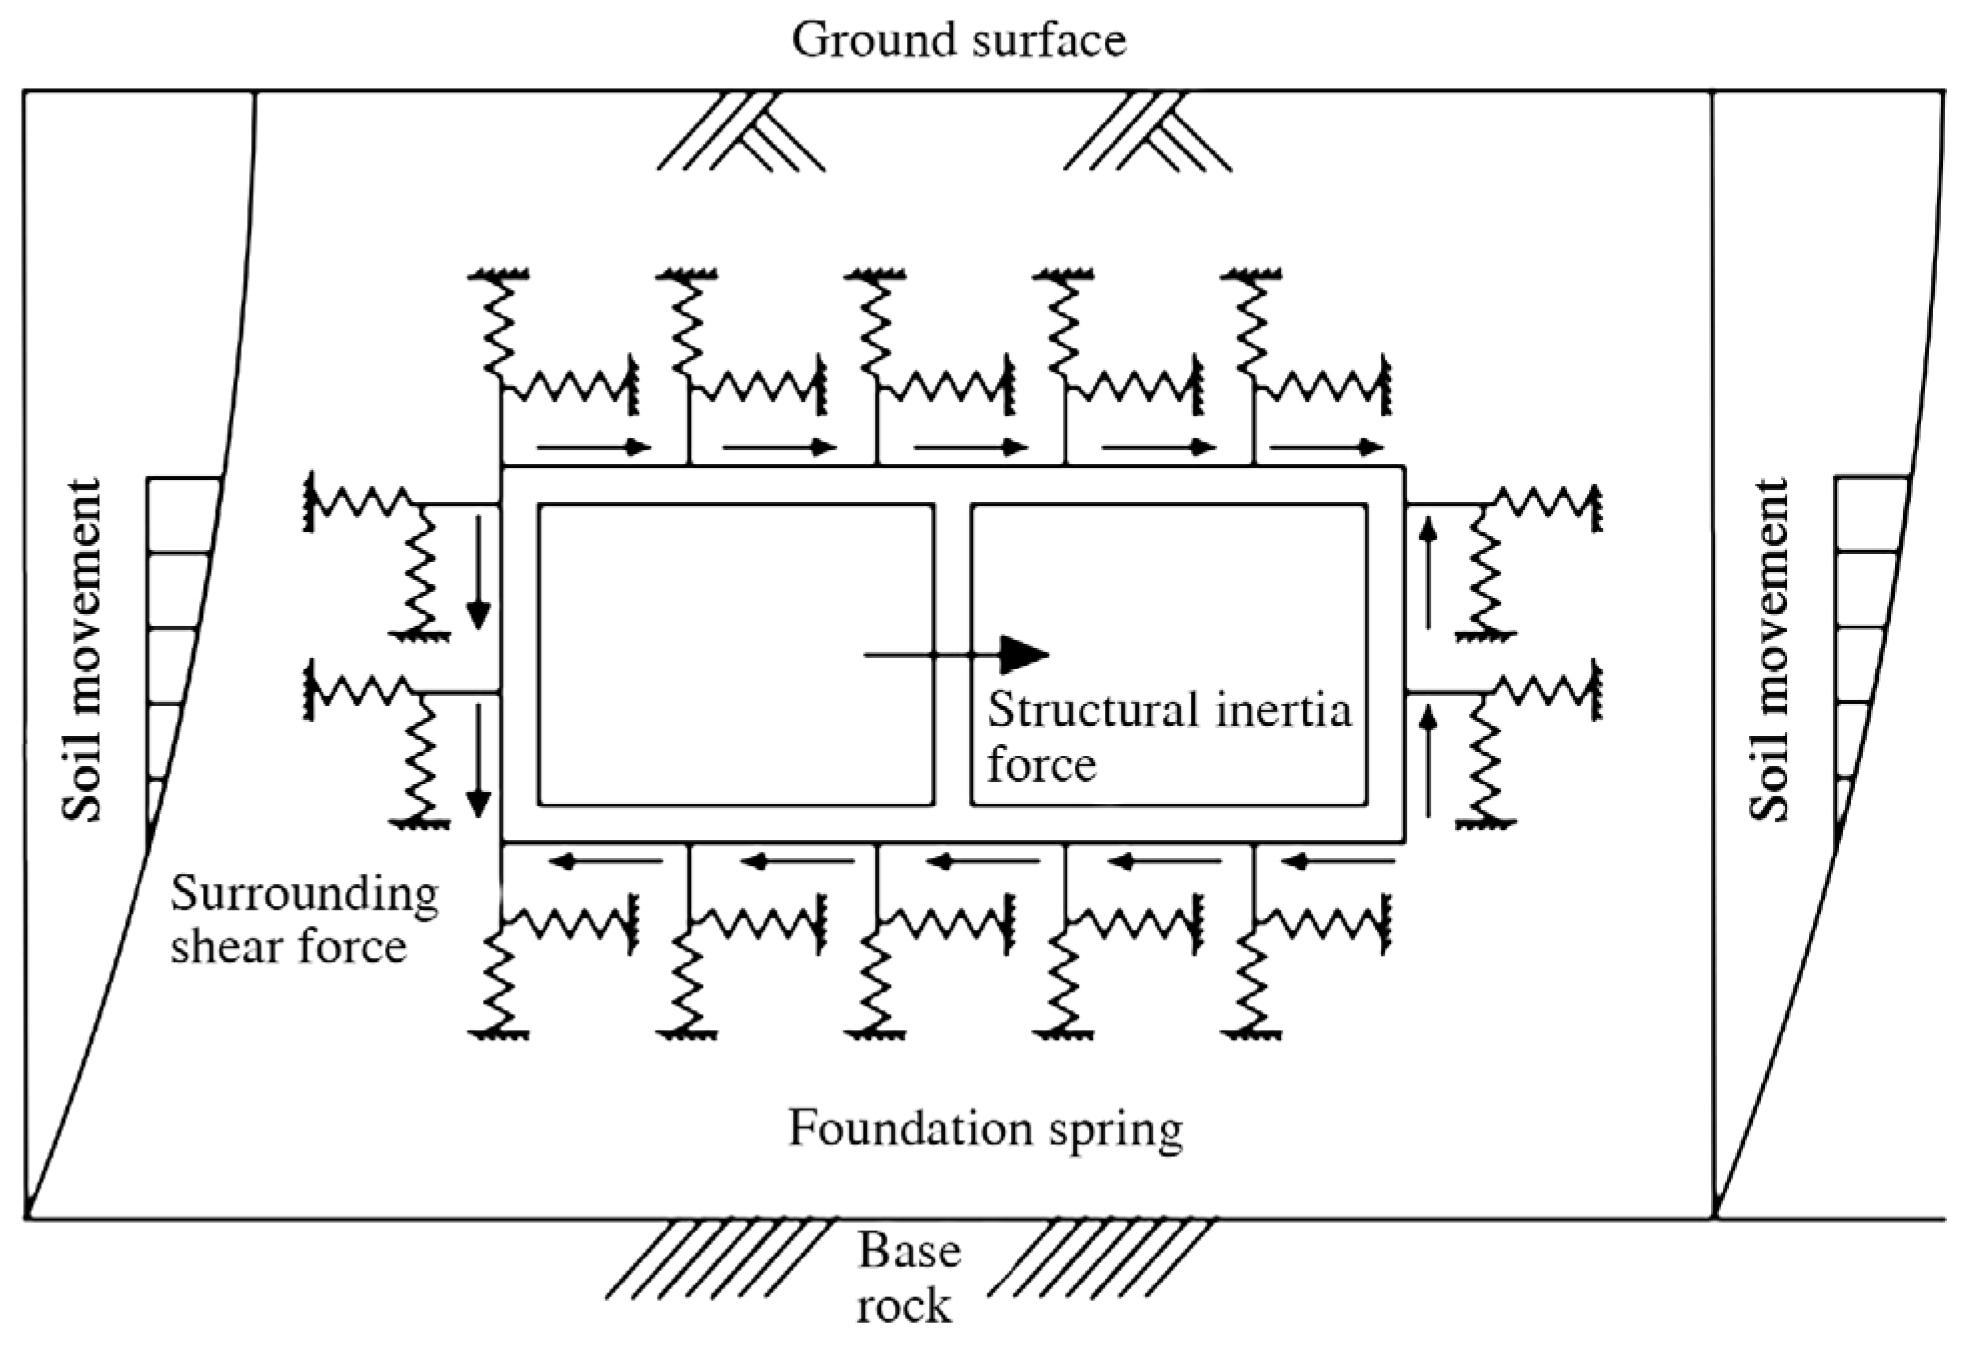
Figure 1. Sketch of response deformation method.
Buildings 13 02987 g001
Figure 2. Improved response displacement method model (theoretical model).
Buildings 13 02987 g002
Figure 3. Vertical seismic action of upper building.
Buildings 13 02987 g003
Figure 4. Sketch of calculating the foundation coefficient by the static finite element method.
Buildings 13 02987 g004
Figure 5. Cross section of subway station complex structure with upper frame structure (Unit: m).
Buildings 13 02987 g005
Figure 6. Improved response displacement method model (finite element model). (a) Structural model. (b) Load-structure model.
Buildings 13 02987 g006
Figure 7. Numerical model for time-history analysis of soil-structure interaction.
Buildings 13 02987 g007
Figure 8. The acceleration–time–history curve of the input wave. (a) Beijing artificial wave. (b) Kobe wave. (c) Loma Prieta wave. (d) Landers wave.
Buildings 13 02987 g008
Figure 9. Acceleration response spectrum of input seismic waves. (a) Kobe wave. (b) Loma Prieta wave. (c) Landers wave.
Buildings 13 02987 g009
Figure 10. Cloud diagram of columns in underground structure. (a) Middle column bending moment cloud diagram. (b) Column deformation cloud (unit: mm).
Buildings 13 02987 g010
Figure 11. Location of the monitoring point of the structural section.
Buildings 13 02987 g011
Figure 12. Working conditions for different superstructure locations. (a) No offset. (b) Offset one span. (c) Offset two spans. (d) Offset three spans.
Buildings 13 02987 g012
Figure 13. Layout plan of different superstructure structures. (a) Upper frame structure. (b) Upper frame-symmetric shear wall structure. (c) Upper frame-asymmetric shear wall structure.
Buildings 13 02987 g013
Figure 14. Bending moment calculation results of different upper cover structures. (a) Frame structure. (b) Frame-symmetric shear wall structure. (c) Frame-asymmetric shear wall structure.
Buildings 13 02987 g014
Figure 15. Bending moment calculation results of different relative height of subway stations. (a) 4 m above the ground. (b) Equal to the ground. (c) 4 m below the ground.
Buildings 13 02987 g015
Figure 16. Bending moment calculation results of different soil layer stiffness. (a) 1/4 times soil stiffness. (b) 1/2 times soil stiffness. (c) 1× soil stiffness. (d) 2× soil stiffness.
Buildings 13 02987 g016
Table 1. Soil parameters.
Soil TypesSoil ThicknessNatural Density
ρ (g/cm3)
Constrained Modulus
E (MPa)
Poisson Ratio
γ
Cohesion
C (kPa)
Friction Angle
φ (°)
① Miscellaneous fill4.01.754.00.389510
② Silty clay3.51.905.00.3133010
③ Sandy silt5.52.0210.00.3132030
④ Fine sand–medium sand6.02.0026.00.300030
⑤ Silty clay6.01.9911.00.3573010
⑥ Fine sand–medium sand12.02.0255.00.300032
⑦ Heavy clayey silt7.02.1225.00.3132526
⑧ Pebble round gravel25.02.12142.50.278030
Table 2. Pre-preparation calculation data.
PositionOne-Dimensional Free Field AnalysisCoefficient of
Soil Reaction
Additional Seismic Load
Displacement
(m)
Acceleration
(g)
Shearing
Force
(kN)
Horizontal
Direction
(kN/m3)
Vertical
Direction
(kN/m3)
Shearing
Force
(kN)
Bending
Moment
(kN·m)
Vertical
Inertia
Force (kN)
Top plate0.170.17---Total shearing force
6433.48
Single column shear force
321.67
Single column
857.79
Total inertia force
4181.76
Single column inertia force
209.09
Medium Plate 10.150.1828.4625632108
Medium Plate 20.030.0856.9339203487
Bedplate0.000.0092.5112,4129773
Table 3. Bending moment of different seismic waves conditions (unit: kN·m).
Seismic WaveCalculating MethodSide Wall ASide Wall BMiddle Column CMiddle Column DMiddle Column EMiddle Column F
Beijing artificial waveTRDM652.361132.68170.44190.28230.35215.14
THAM757.081221.19203.53221.52316.54243.53
IRDM806.211179.35211.20205.37330.84247.25
Kobe waveTRDM527.631257.6492.3699.22110.34102.61
THAM645.381439.81110.43118.98184.95125.57
IRDM663.451450.48100.74105.83210.27129.58
Loma Prieta waveTRDM531.45 1492.73 63.0296.45 125.02 114.86
THAM650.52 1594.83 115.10132.33 206.01 137.51
IRDM675.34 1609.70 100.32119.02 234.74 141.37
Landers waveTRDM361.38 1029.33 54.6097.24 16.11 81.94
THAM554.27 1316.48 89.48143.22 197.32 150.69
IRDM580.38 1331.73 80.95131.47 230.59 155.70
Note: In this table, TRDM represents the traditional response displacement method, THAM represents the time-history analysis method, and IRDM represents the improved response displacement method. The representation method in the article is the same below.
Table 4. Structural deformation of different seismic wave conditions (unit: mm).
Seismic WaveCalculating MethodSide Wall AMiddle Column CMiddle Column EDeformation Error
Beijing artificial waveTRDM57.23 56.35 55.5120%
THAM68.54 69.06 69.46-
IRDM74.88 74.57 75.039%
Kobe waveTRDM60.71 59.82 58.9321%
THAM74.20 74.62 74.90-
IRDM82.00 81.52 82.1311%
Loma Prieta waveTRDM51.10 50.54 49.22 25%
THAM66.23 67.77 68.12 -
IRDM74.71 75.24 75.6712%
Landers waveTRDM65.28 65.61 64.8116%
THAM76.5678.2178.39-
IRDM85.52 86.08 86.32 11%
Table 5. Bending moment of different earthquake intensities conditions (unit: kN·m).
Different Peak
Acceleration
Calculating
Method
Side Wall ASide Wall BMiddle Column CMiddle Column DMiddle Column EMiddle Column F
0.05 gTRDM196.99280.3941.2645.3954.1550.37
THAM214.27305.3050.8855.3879.1360.88
IRDM224.94307.0757.6154.8585.6865.70
0.10 gTRDM380.19580.4183.3492.15112.14103.25
THAM428.54610.60101.76110.76158.27121.76
IRDM445.37611.06111.76106.96167.94126.15
0.20 gTRDM752.361168.23160.44190.28220.35215.14
THAM857.081221.19 203.53221.52316.54243.53
IRDM846.211179.35 221.28205.37330.84247.25
0.40 gTRDM1527.292406.55 333.72388.17462.33441.04
THAM1714.162442.39 407.05443.03633.07487.05
IRDM1699.812382.29 453.62423.06658.37489.56
Table 6. Deformation of different earthquake intensities conditions (unit: mm).
Different Peak AccelerationCalculating MethodSide Wall AMiddle Column CMiddle Column EDeformation Error
0.05 gTRDM14.2314.0113.6421%
THAM17.1217.2617.37-
IRDM18.8218.4618.3910%
0.10 gTRDM28.3327.7626.9522%
THAM34.2534.5334.73-
IRDM37.8237.4737.3310%
0.20 gTRDM57.2356.3555.5120%
THAM68.5469.0669.46-
IRDM74.8874.5775.039%
0.40 gTRDM113.32109.88109.9121%
THAM137.01138.12138.94-
IRDM146.76148.62147.068%
Table 7. Bending moment calculation results of different upper cover structure locations (unit: kN·m).
Structural PositionCalculating MethodSide Wall ASide Wall BMiddle Column CMiddle Column DMiddle Column EMiddle Column F
No offsetTRDM752.361168.23160.44190.28230.35215.14
THAM857.081221.19203.53221.52316.54243.53
IRDM846.211179.35221.28205.37330.84247.25
Offset one spanTRDM752.331169.25170.14191.36228.93215.68
THAM761.951189.05119.97141.3067.8288.62
IRDM746.691177.83136.54205.6688.61247.53
Offset two spansTRDM752.401169.88175.53192.47227.02216.53
THAM761.131178.75206.54204.63400.61297.65
IRDM754.831162.06220.38205.91362.88247.76
Offset three spansTRDM731.371167.41177.24194.37226.48217.58
THAM793.401180.71326.67218.9186.96102.96
IRDM781.321185.24205.48206.1798.07247.69
Table 8. Deformation calculation results of different superstructure locations (unit: mm).
Structural PositionCalculating MethodSide Wall AMiddle Column CMiddle Column EDeformation Error
No offsetTRDM57.23 56.35 55.51 20%
THAM68.54 69.06 69.46 -
IRDM74.88 74.57 75.03 9%
Offset one spanTRDM55.00 54.25 53.26 22%
THAM68.22 68.69 68.13 -
IRDM74.82 75.23 75.63 11%
Offset two spansTRDM57.24 57.68 57.50 19%
THAM69.63 70.39 70.77 -
IRDM75.26 75.83 76.34 8%
Offset three spansTRDM57.21 57.70 57.48 18%
THAM69.29 69.76 70.19 -
IRDM74.35 74.63 74.92 7%
Table 9. Bending moment calculation results of different upper cover structures (unit: kN·m).
Structural StyleCalculating MethodSide Wall ASide Wall BMiddle Column CMiddle Column DMiddle Column EMiddle Column F
Frame structureTRDM719.88 1261.52 97.54 129.47 53.13 88.02
THAM835.07 1325.07 144.94 162.90 145.35 122.09
IRDM822.03 1270.68 164.47 143.52 163.23 126.55
Frame-symmetric shear wall structureTRDM681.74 1168.65 49.18 233.73 2159.03 737.25
THAM808.45 1238.56 101.32 270.50 2458.41 794.72
IRDM794.10 1178.73 122.80 249.18 2653.81 819.63
Frame-asymmetric shear wall structureTRDM687.70 1282.86 104.22 240.72 192.00 174.57
THAM824.87 1244.94 109.19 278.65 2515.51 812.40
IRDM791.69 1310.86 165.43 306.50 289.70 252.54
Table 10. Deformation calculation results of different upper cover structures (unit: mm).
Structural StyleCalculating MethodSide Wall AMiddle Column CMiddle Column EDeformation Error
Frame structureTRDM49.73 48.53 47.29 25%
THAM64.17 64.79 65.13 -
IRDM72.43 71.98 72.39 12%
Frame-symmetric shear wall structureTRDM59.65 59.09 58.68 16%
THAM69.81 70.25 70.77 -
IRDM77.97 77.32 77.93 11%
Frame-asymmetric shear wall structureTRDM58.22 56.92 55.83 22%
THAM72.33 72.74 73.21 -
IRDM79.96 79.36 79.91 10%
Table 11. Bending moment calculation results of different relative height of subway stations (unit: kN·m).
Station and GroundCalculating MethodSide Wall ASide Wall BMiddle Column CMiddle Column DMiddle Column EMiddle Column F
4 m above the groundTRDM564.02703.46120.54153.24194.26146.28
THAM620.65796.6694.8484.96147.5190.78
IRDM640.58821.93112.3097.28162.16103.88
Equal to the groundTRDM752.361168.23160.44190.28230.35215.14
THAM857.081221.19203.53221.52316.54243.53
IRDM846.211179.35221.28205.37330.84247.25
4 m below the groundTRDM806.391241.53196.57226.14320.54260.61
THAM833.371304.75289.38245.43152.07126.18
IRDM887.431277.65326.13264.29161.23129.55
Table 12. Deformation calculation results of different relative height of subway stations (unit: mm).
Station and GroundCalculating MethodSide Wall AMiddle Column CMiddle Column EDeformation Error
4 m above the groundTRDM55.75 54.88 54.42 47%
THAM101.21101.56101.81-
IRDM95.47 95.01 96.31 6%
Equal to the groundTRDM57.2356.3555.5120%
THAM68.5469.0669.46-
IRDM74.8874.5775.039%
4 m below the groundTRDM40.6440.3540.1721%
THAM49.0250.2050.69-
IRDM52.5851.9753.227%
Table 13. Bending moment calculation results of different structural stiffness (unit: kN·m).
Structural StiffnessCalculating MethodSide Wall ASide Wall BMiddle Column CMiddle Column DMiddle Column EMiddle Column F
0.50 TRDM545.19 789.34 110.65 126.01 147.74 131.51
THAM571.39 808.74 133.03 143.84 206.89 157.12
IRDM553.08 765.81 149.51 136.01 216.24 158.49
1.00 TRDM752.36 1168.23 160.44 190.28 230.35 215.14
THAM857.08 1221.19 203.53 221.52 316.54 243.53
IRDM846.21 1179.35 221.28 205.37 330.84 247.25
2.00 TRDM1068.35 1670.57 232.64 268.29 278.49 255.50
THAM1259.91 1856.21 311.40 347.79 484.31 375.04
IRDM1269.32 1792.61 338.56 310.11 509.49 378.29
4.00 TRDM1715.38 2675.25 364.20 430.03 505.58 486.22
THAM1997.00 2820.95 476.26 513.93 731.21 560.12
IRDM1963.21 2759.68 511.16 476.46 764.24 578.57
Table 14. Deformation calculation results of different structural stiffness (unit: mm).
Structural StiffnessCalculating MethodSide Wall AMiddle Column CMiddle Column EDeformation Error
0.50 TRDM66.16 65.37 64.39 23%
THAM82.25 82.87 83.35 -
IRDM91.35 89.48 90.04 11%
1.00 TRDM57.23 56.35 55.51 20%
THAM68.54 69.06 69.46 -
IRDM74.88 74.57 75.03 9%
2.00 TRDM47.30 46.57 46.65 19%
THAM56.64 57.07 57.40 -
IRDM61.38 61.63 62.01 8%
4.00 TRDM43.03 42.37 41.74 20%
THAM51.53 51.92 52.23 -
IRDM54.66 54.04 55.17 6%
Table 15. Bending moment calculation results of different soil layer stiffness (unit: kN·m).
Soil StiffnessCalculating MethodSide Wall ASide Wall BMiddle Column CMiddle Column DMiddle Column EMiddle Column F
1/4TRDM1068.35 1623.84 216.59 254.98 260.38 236.14
THAM1208.48 1734.09 293.08 314.56 436.83 343.38
IRDM1193.16 1633.40 308.91 283.21 443.82 354.83
1/2TRDM901.33 1385.87 194.77 223.58 241.45 228.17
THAM1055.07 1491.07 248.31 270.03 379.21 289.07
IRDM1015.45 1415.22 270.85 252.81 400.98 300.16
1TRDM752.36 1168.23 160.44 190.28 230.35 215.14
THAM857.08 1221.19 203.53 221.52 316.54 243.53
IRDM846.21 1179.35 221.28 205.37 330.84 247.25
2TRDM586.84 922.90 123.38 149.37 209.25 151.25
THAM679.66 989.16 166.89 176.33 259.56 198.48
IRDM681.20 959.99 177.69 168.61 267.98 203.24
Table 16. Deformation calculation results of different soil layer stiffness (unit: mm).
Soil StiffnessCalculating MethodSide Wall AMiddle Column CMiddle Column EDeformation Error
1/4TRDM86.42 84.33 83.26 26%
THAM102.81 109.11 112.53 -
IRDM110.26 110.92 111.63 7%
1/2TRDM74.40 73.26 72.16 24%
THAM89.79 87.71 95.16 -
IRDM97.34 95.45 97.16 10%
1TRDM57.23 56.35 55.51 20%
THAM68.54 69.06 69.46 -
IRDM74.88 74.57 75.03 9%
2TRDM45.78 45.64 46.07 19%
THAM54.83 56.63 55.57 -
IRDM59.90 59.66 59.27 7%
Disclaimer/Publisher’s Note: The statements, opinions and data contained in all publications are solely those of the individual author(s) and contributor(s) and not of MDPI and/or the editor(s). MDPI and/or the editor(s) disclaim responsibility for any injury to people or property resulting from any ideas, methods, instructions or products referred to in the content.