
Influence of Underground Excavation Expansion on Surrounding Rock Characteristics at Intersection of Ventilation Shaft and Tunnel: A Case Study
Abstract
:
1. Introduction
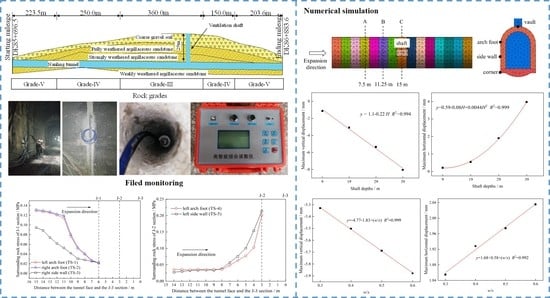
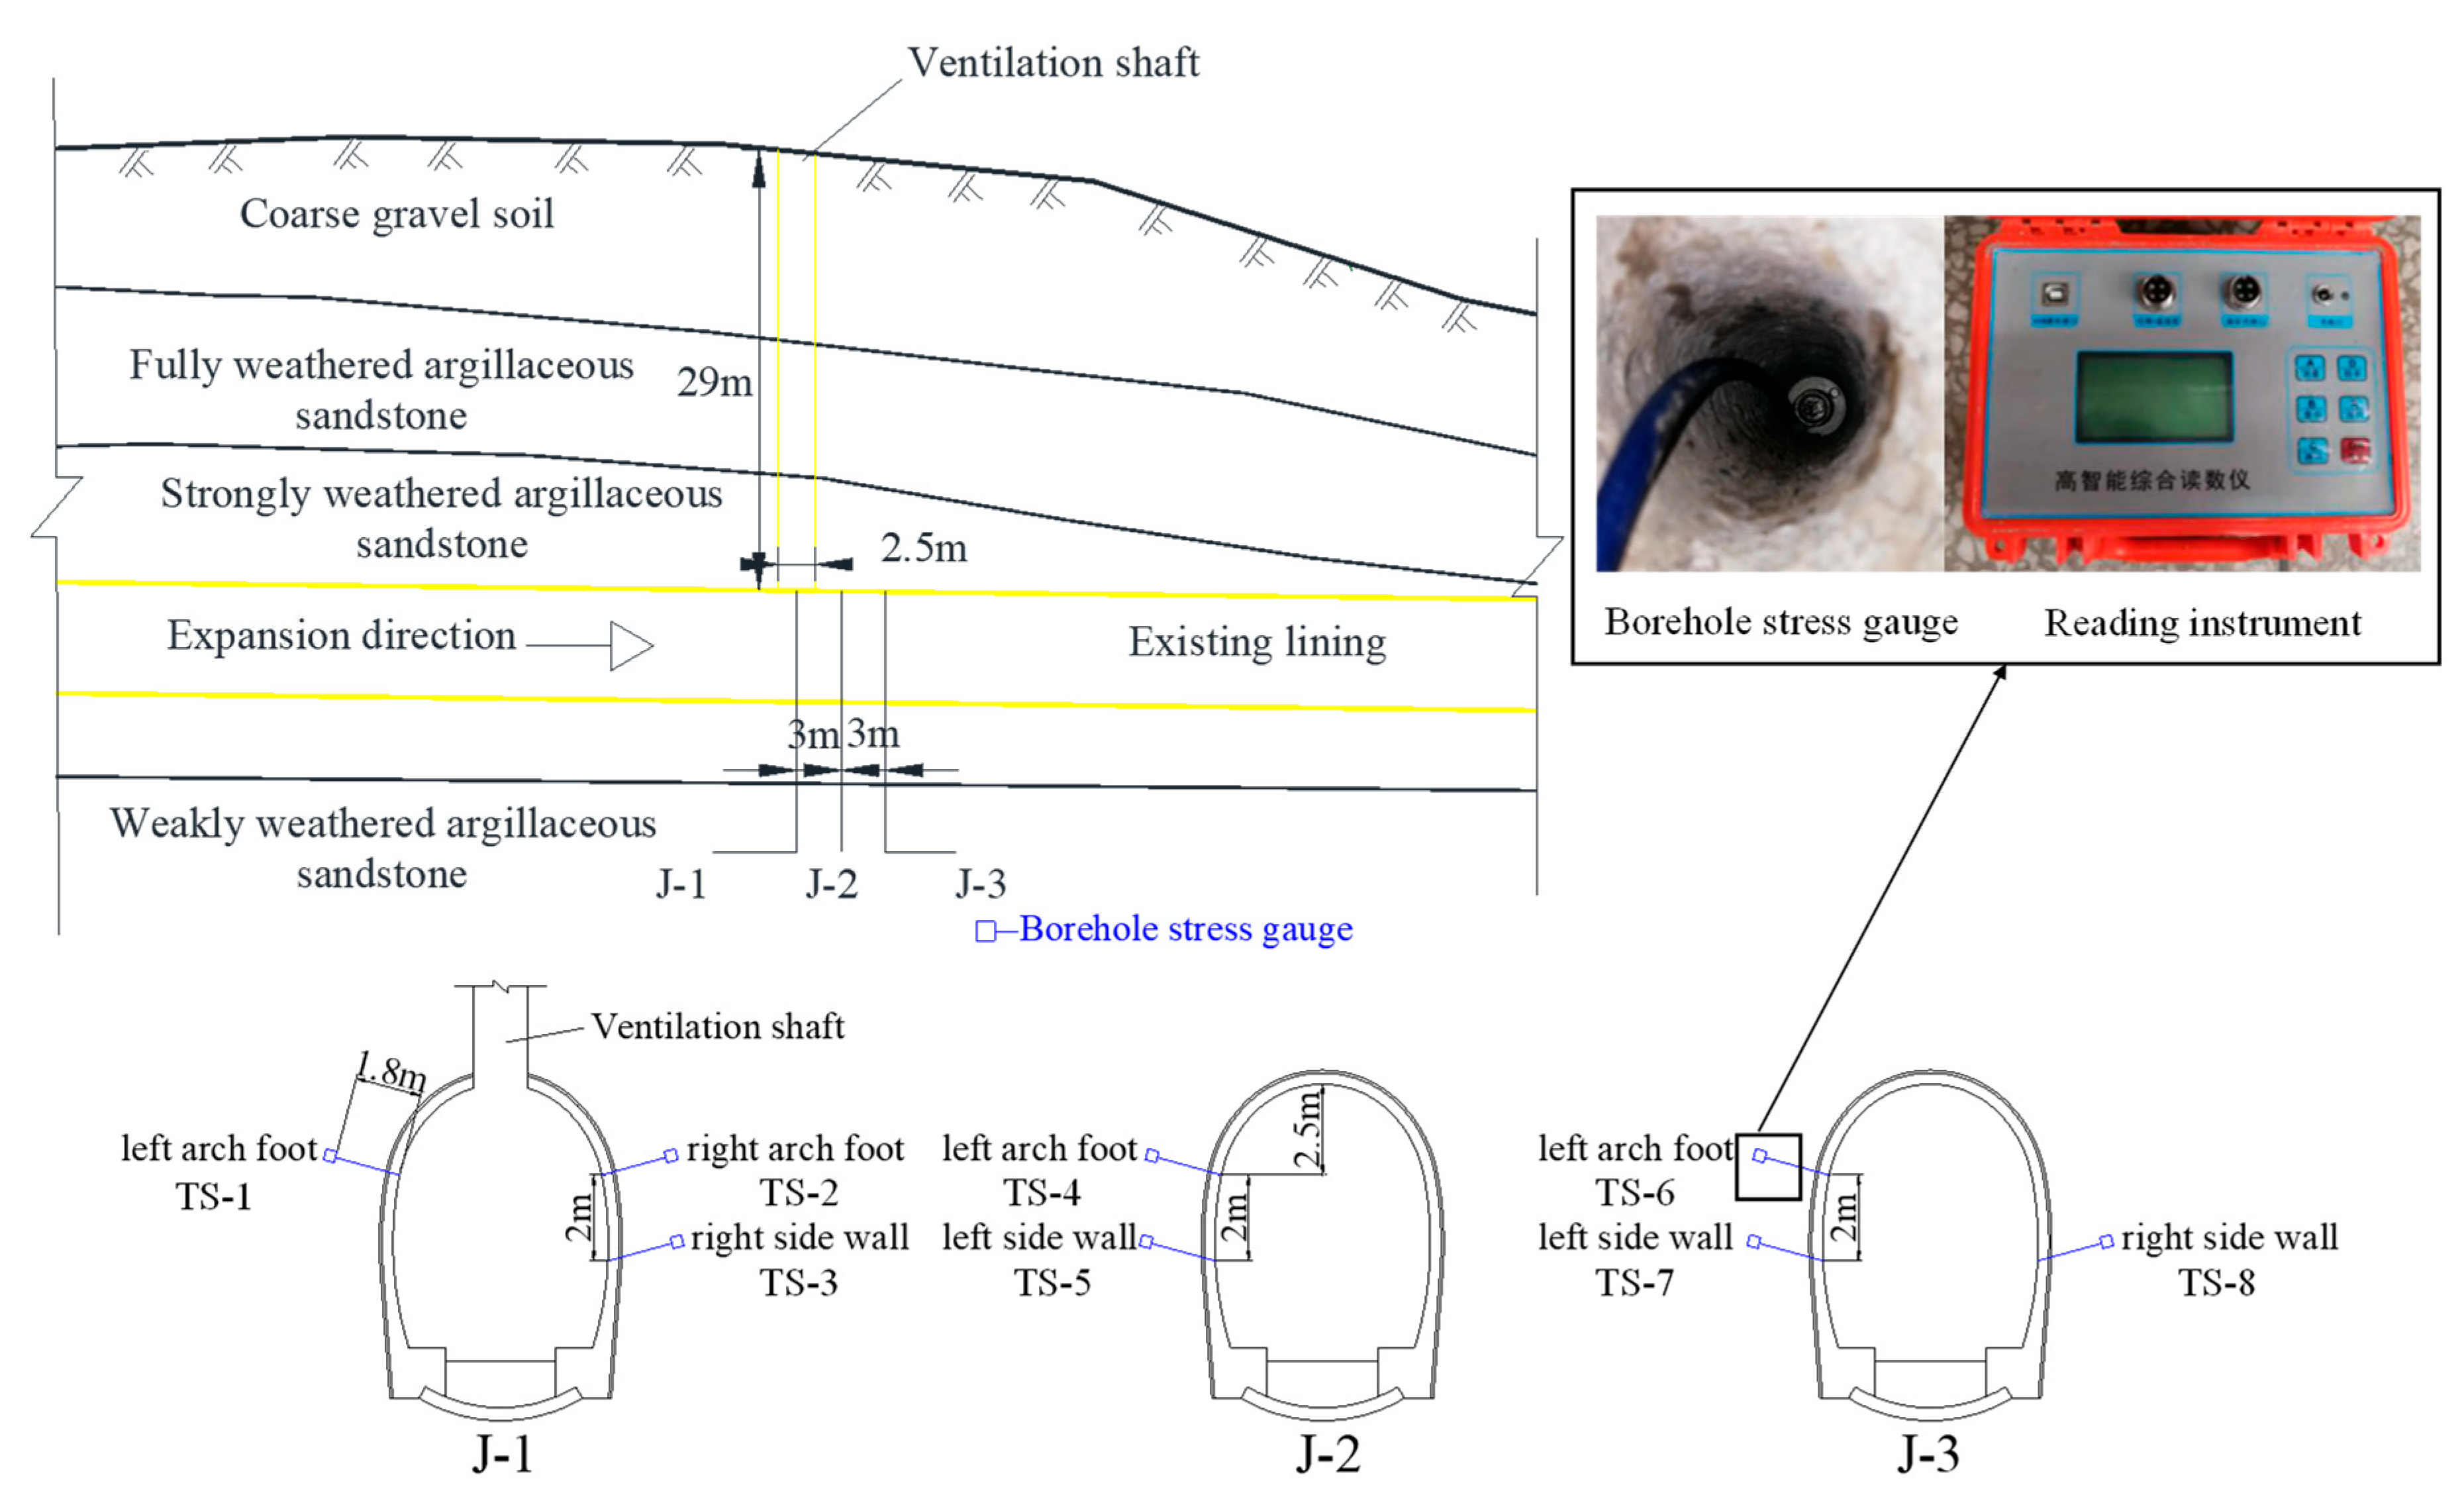
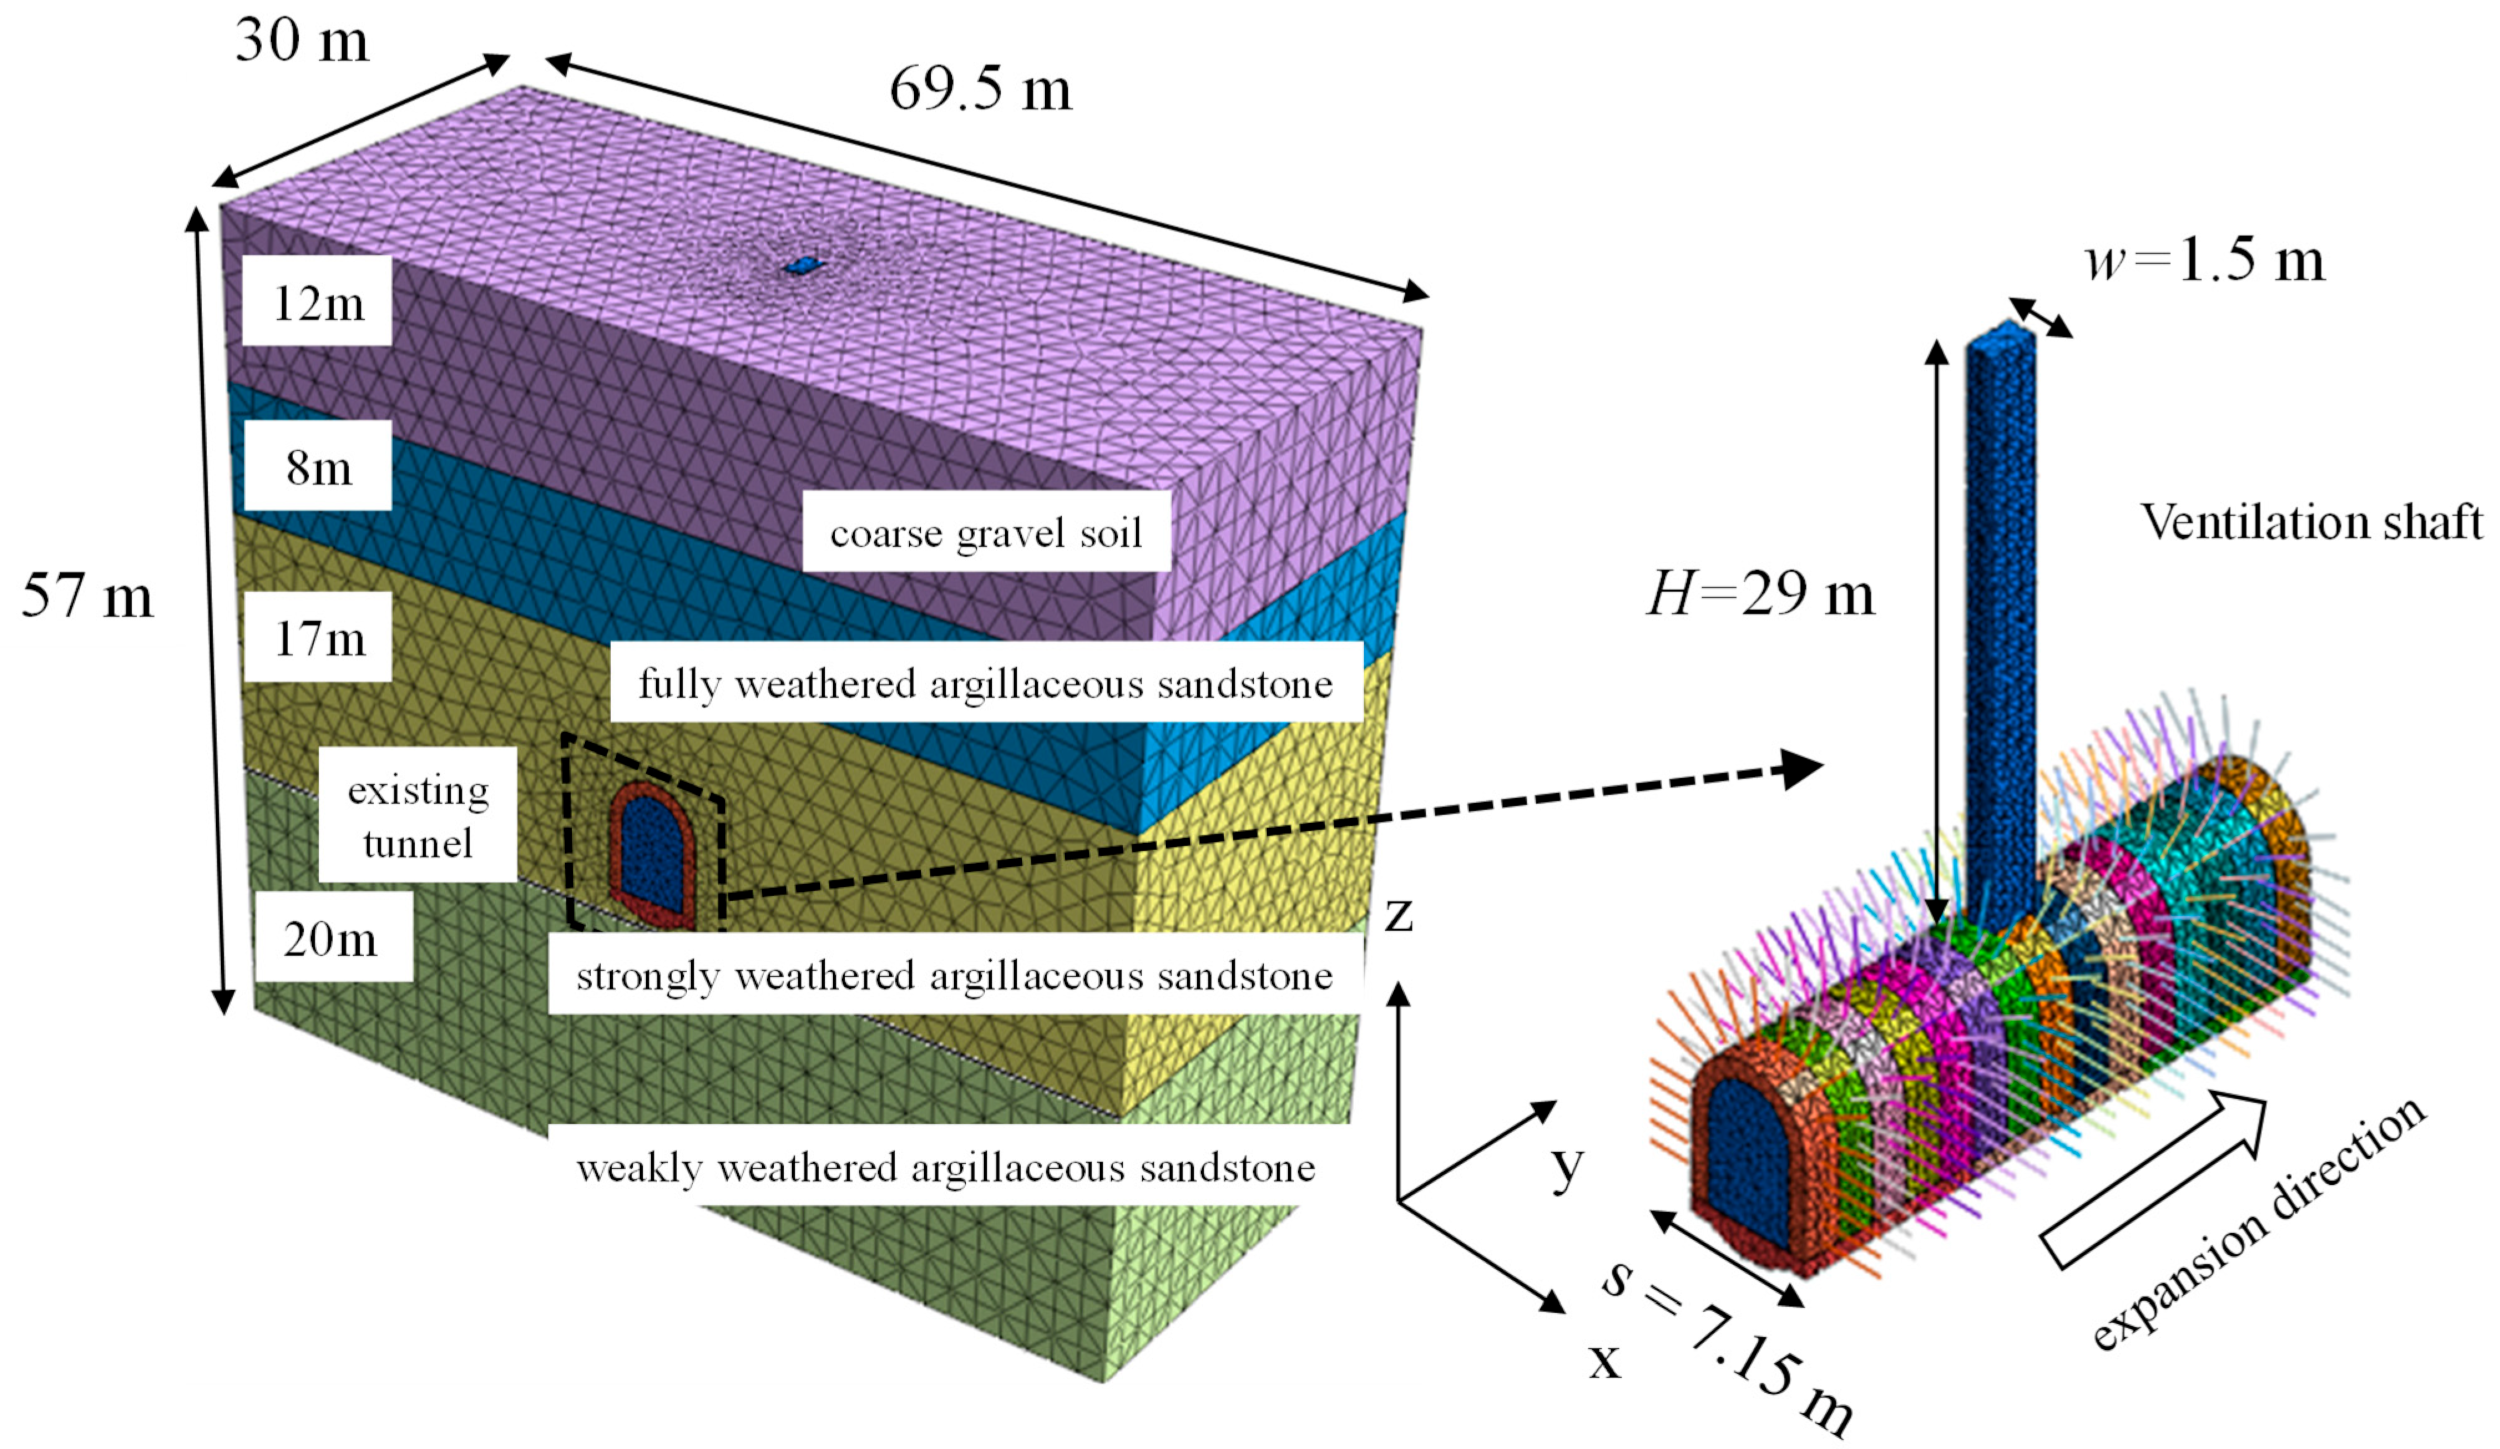
2. Project Overview
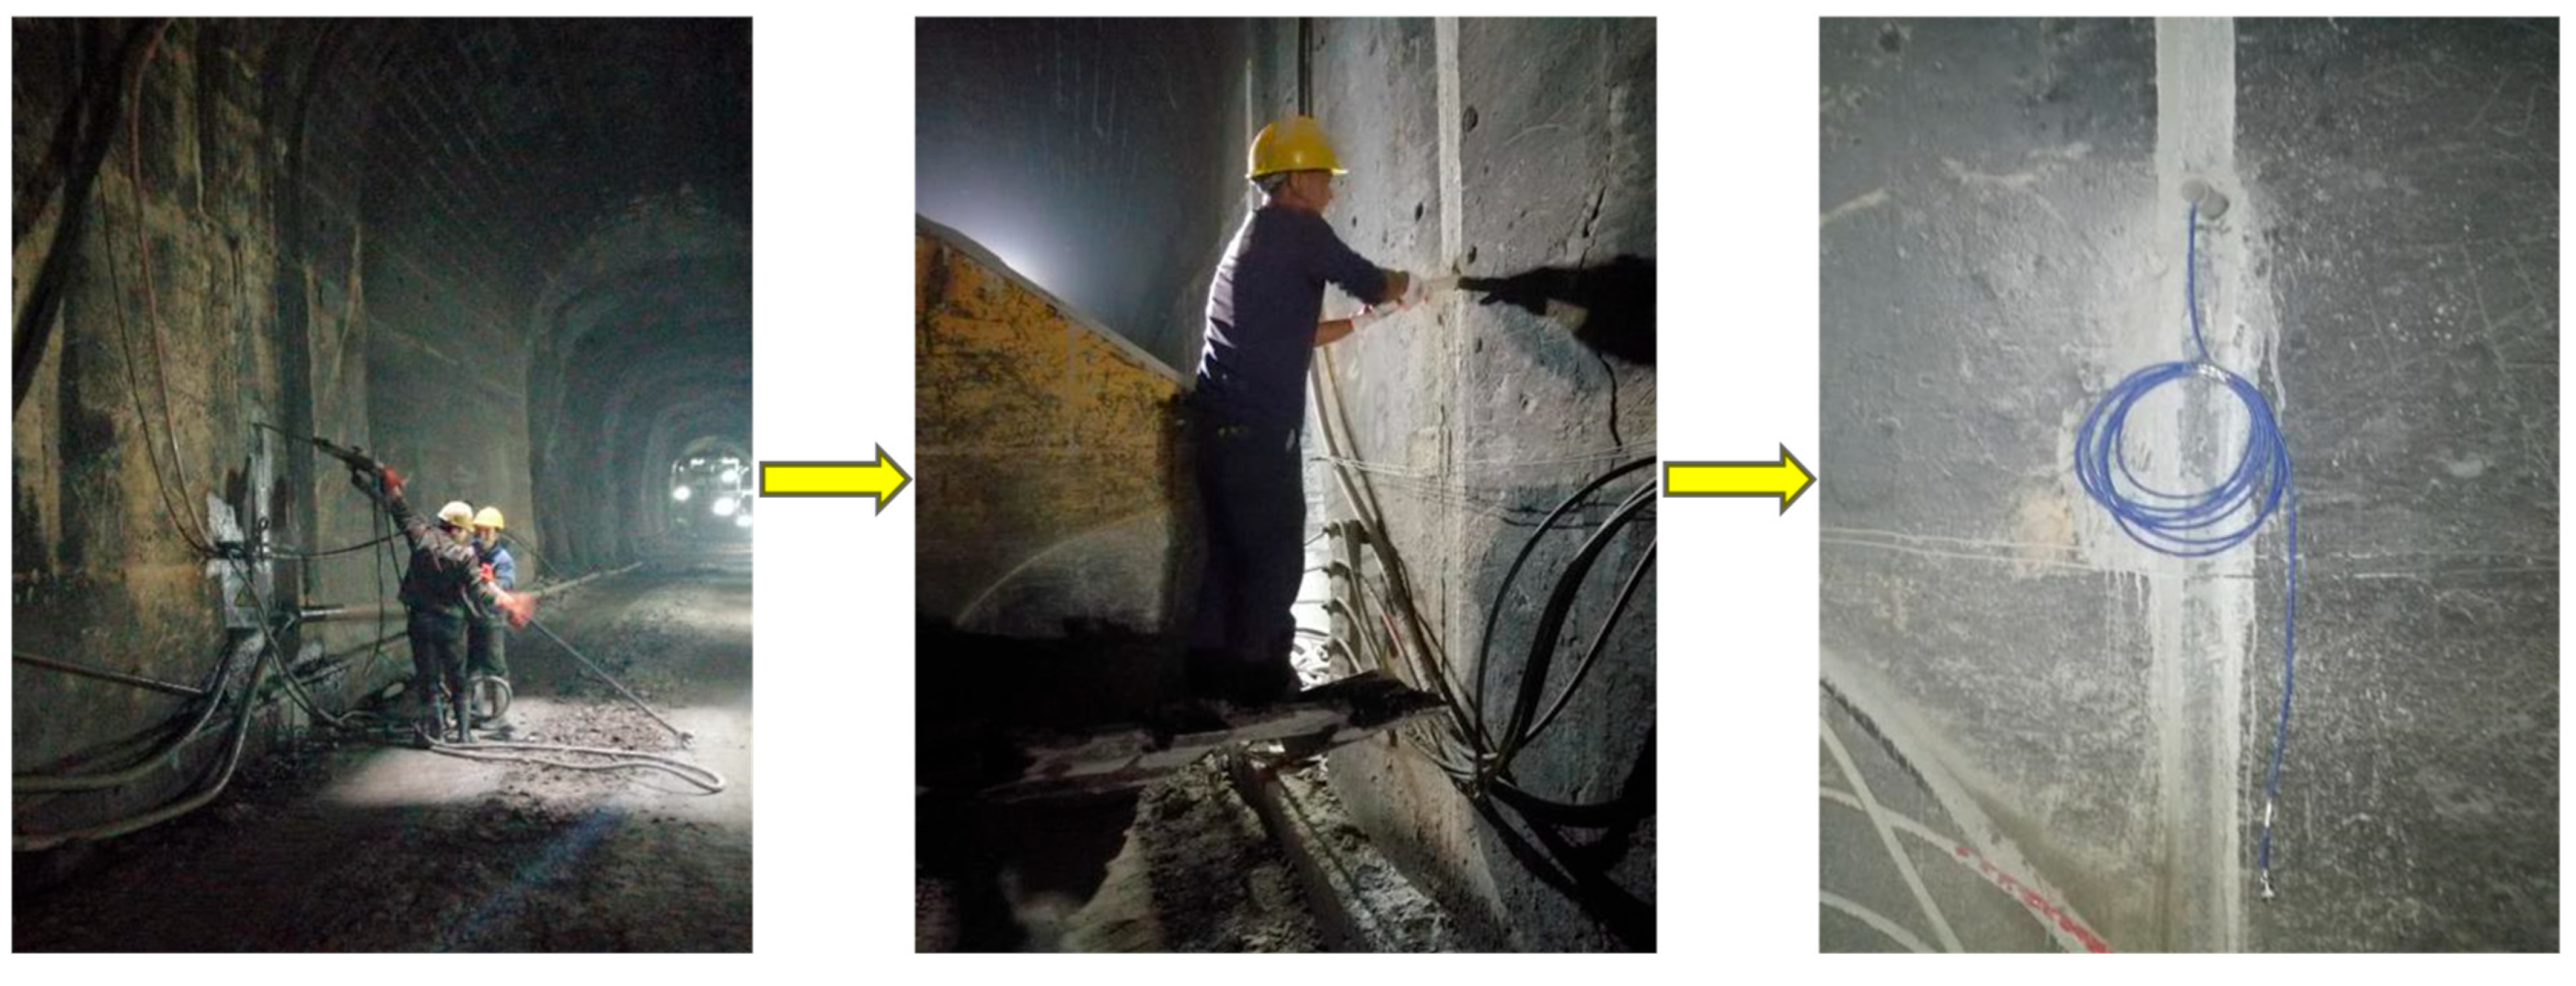
3. Field Monitoring
3.1. Monitoring Points Layout
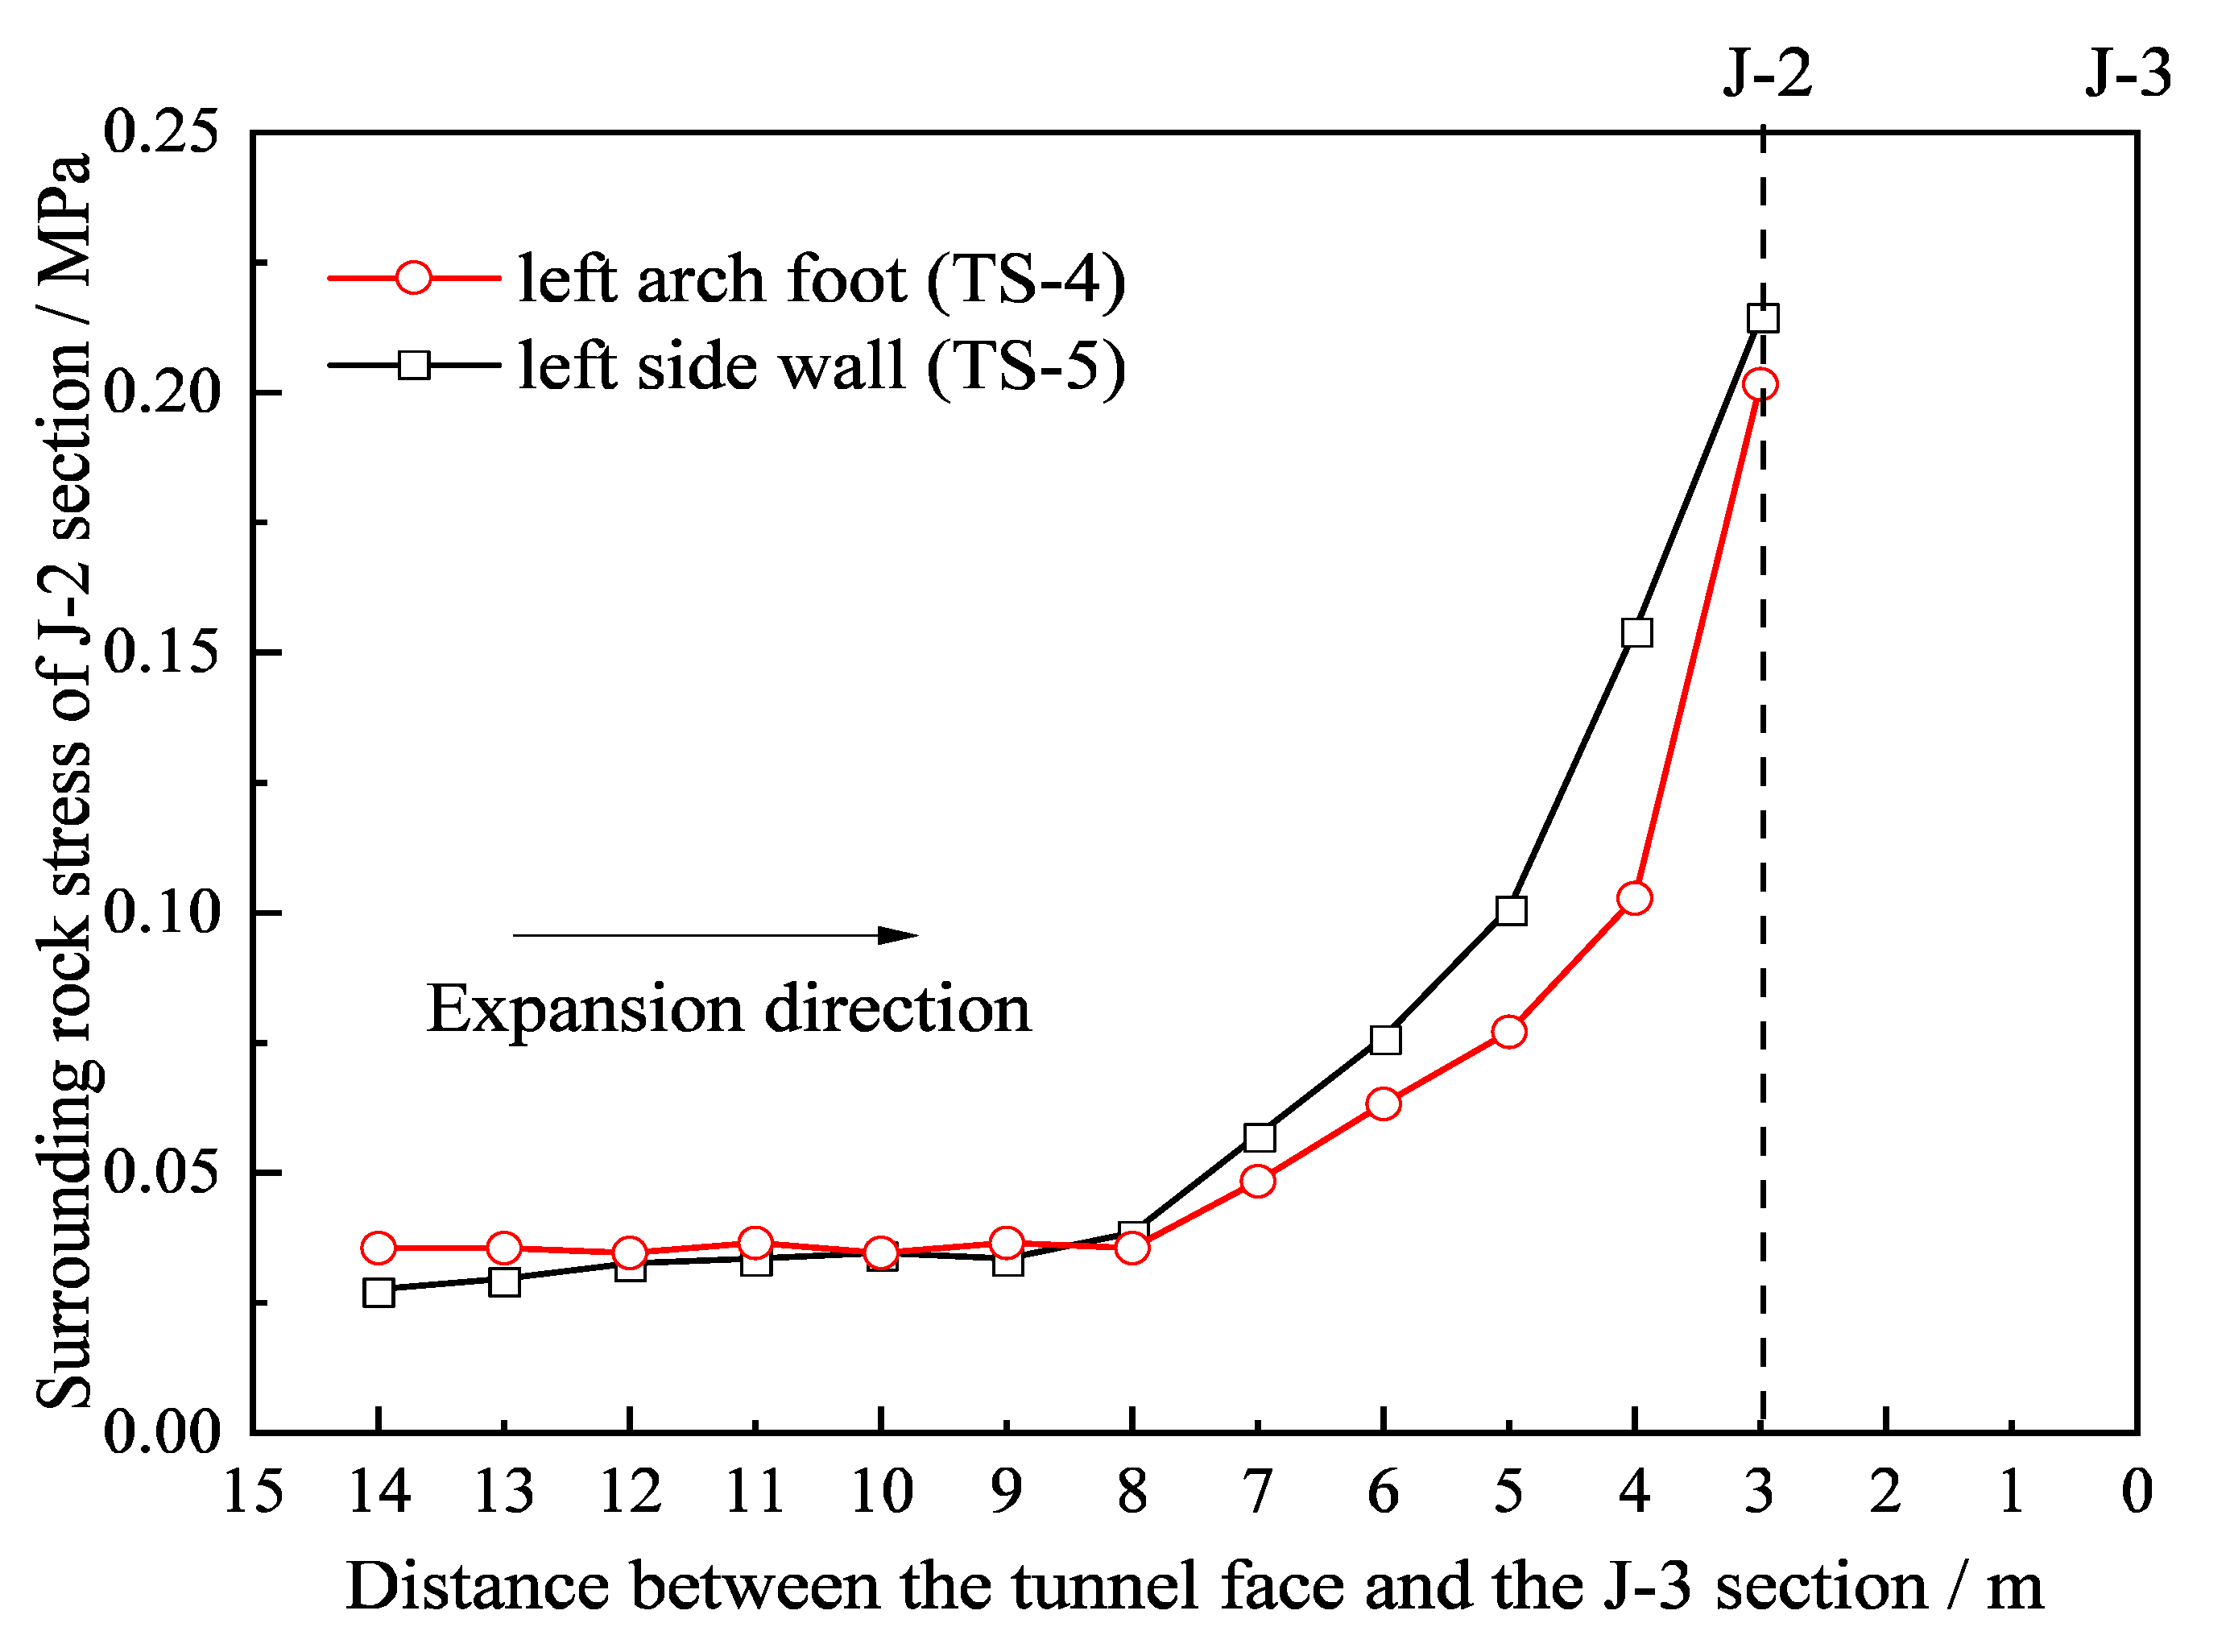
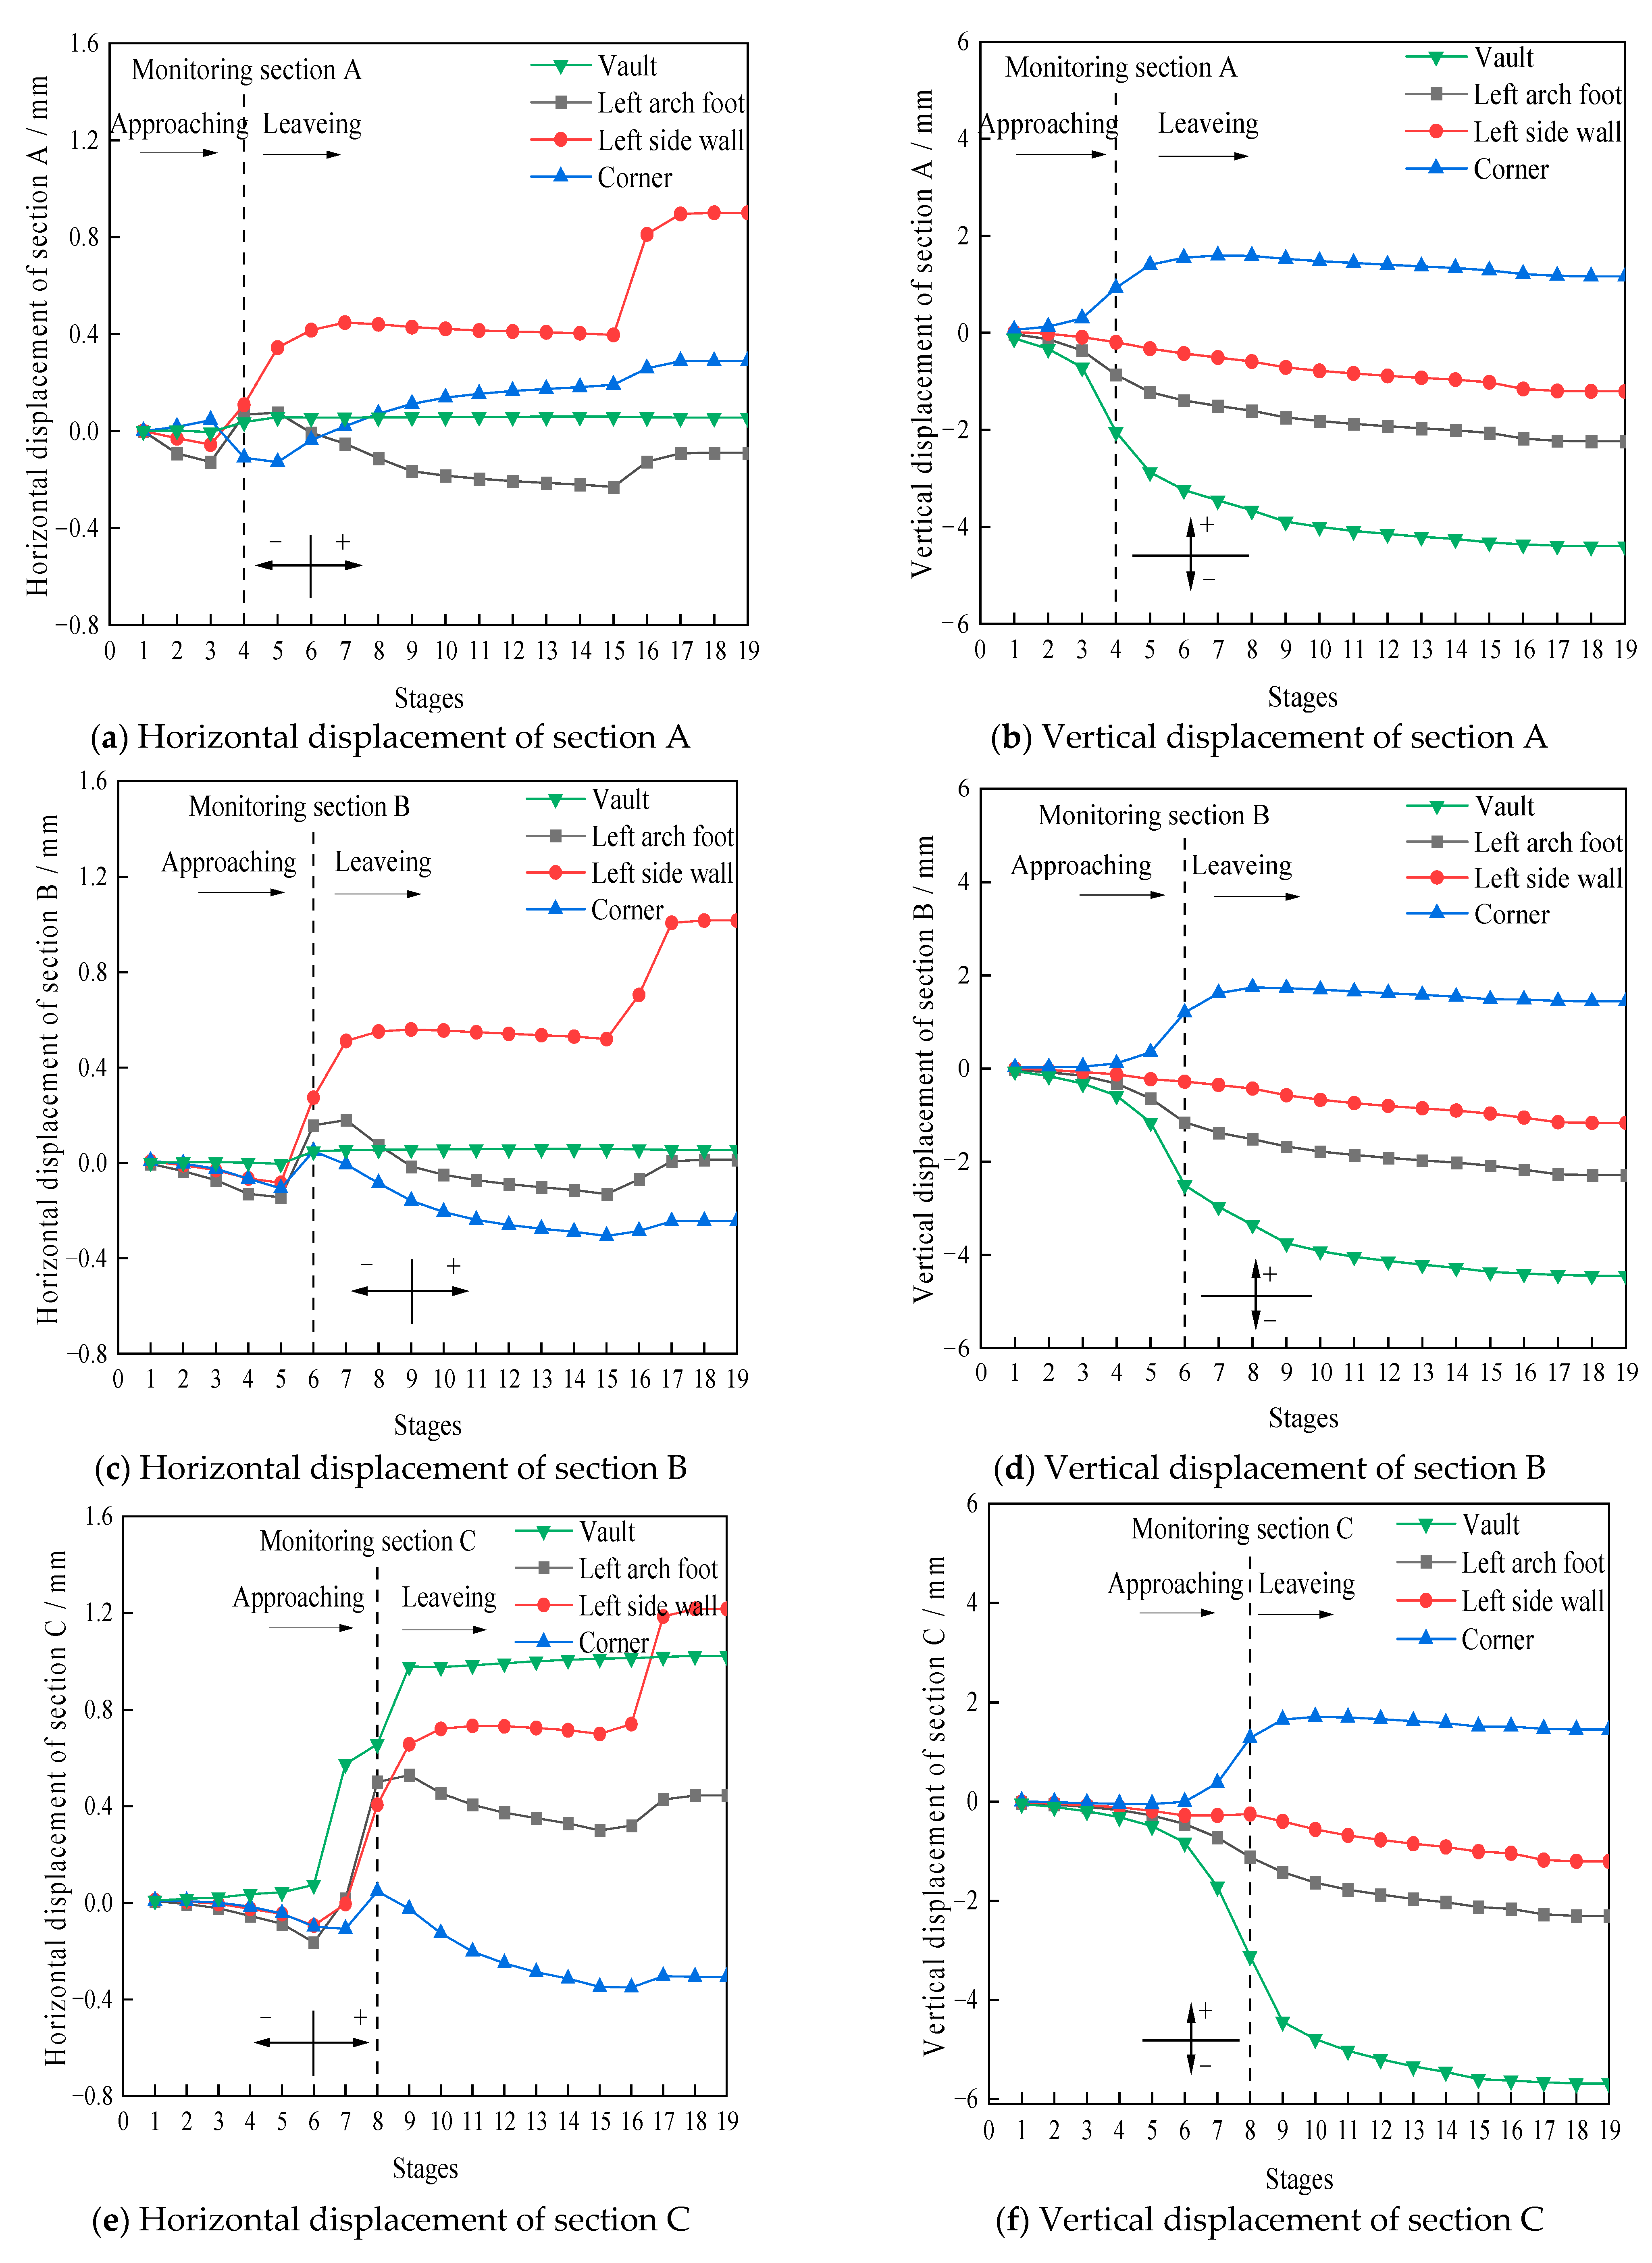
3.2. Analysis of Monitoring Results
4. Finite Element Analysis (FEA) of the Expansion Tunnel
4.1. Finite Element Model
4.2. Material Property
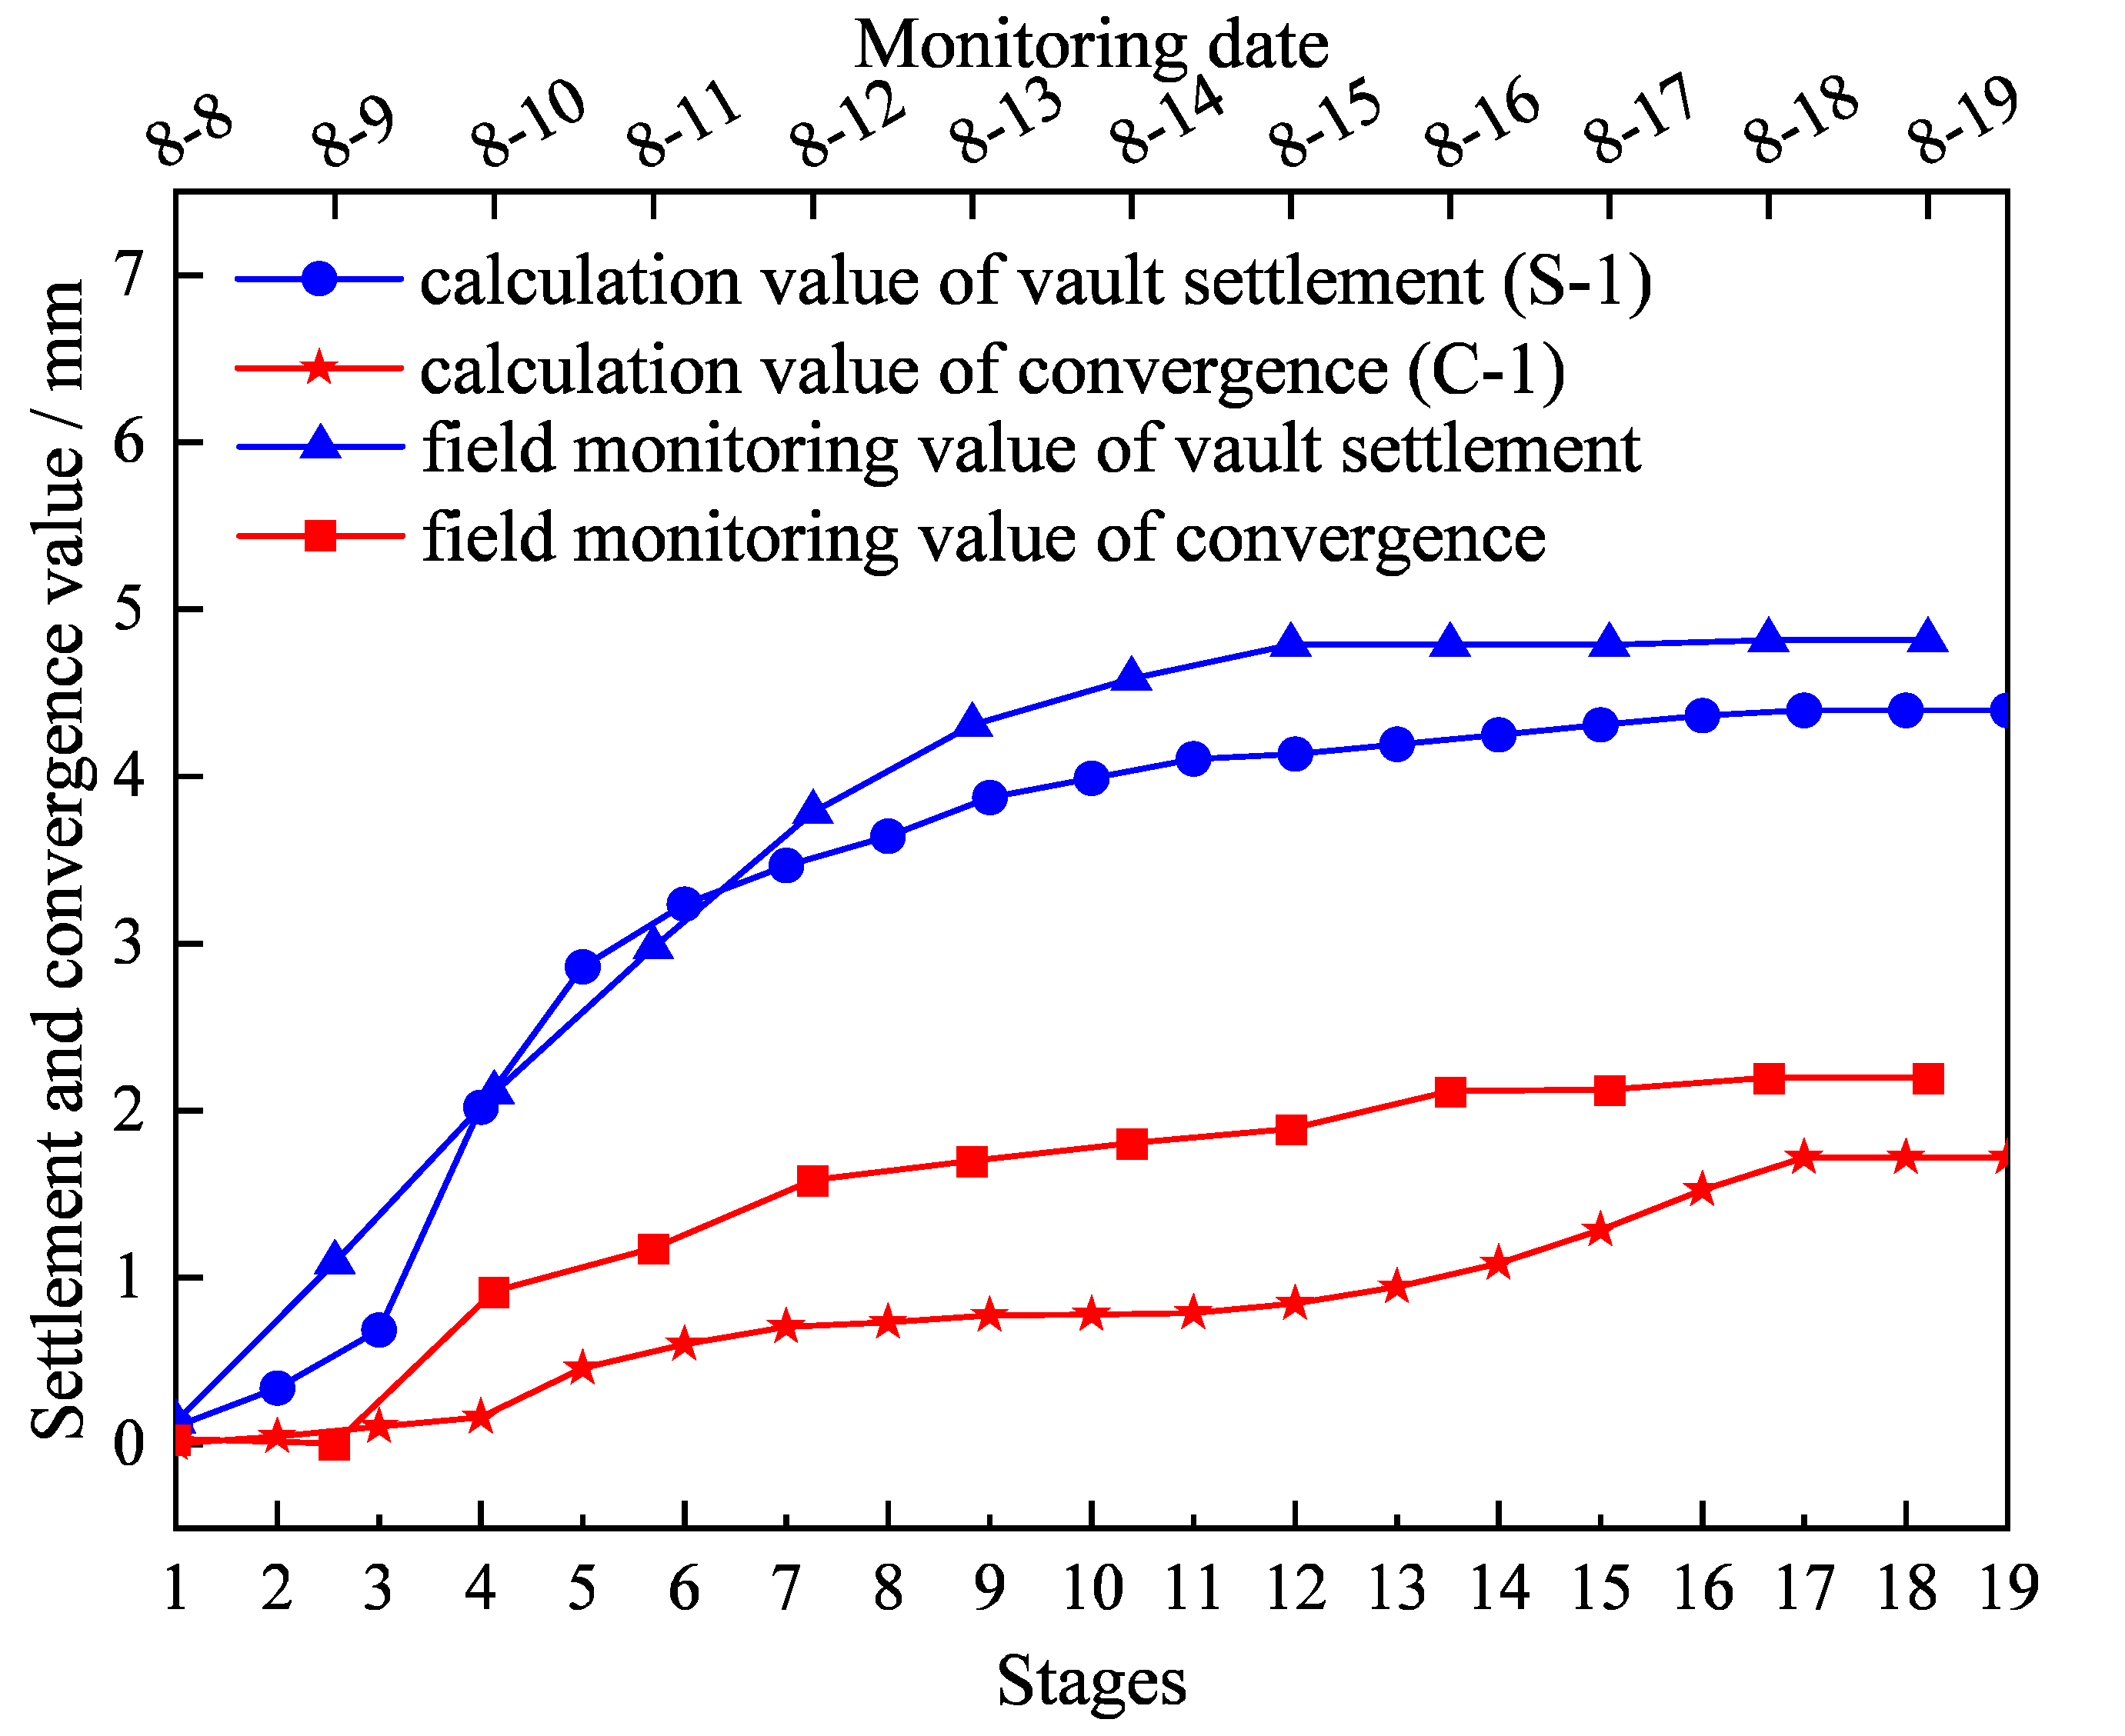
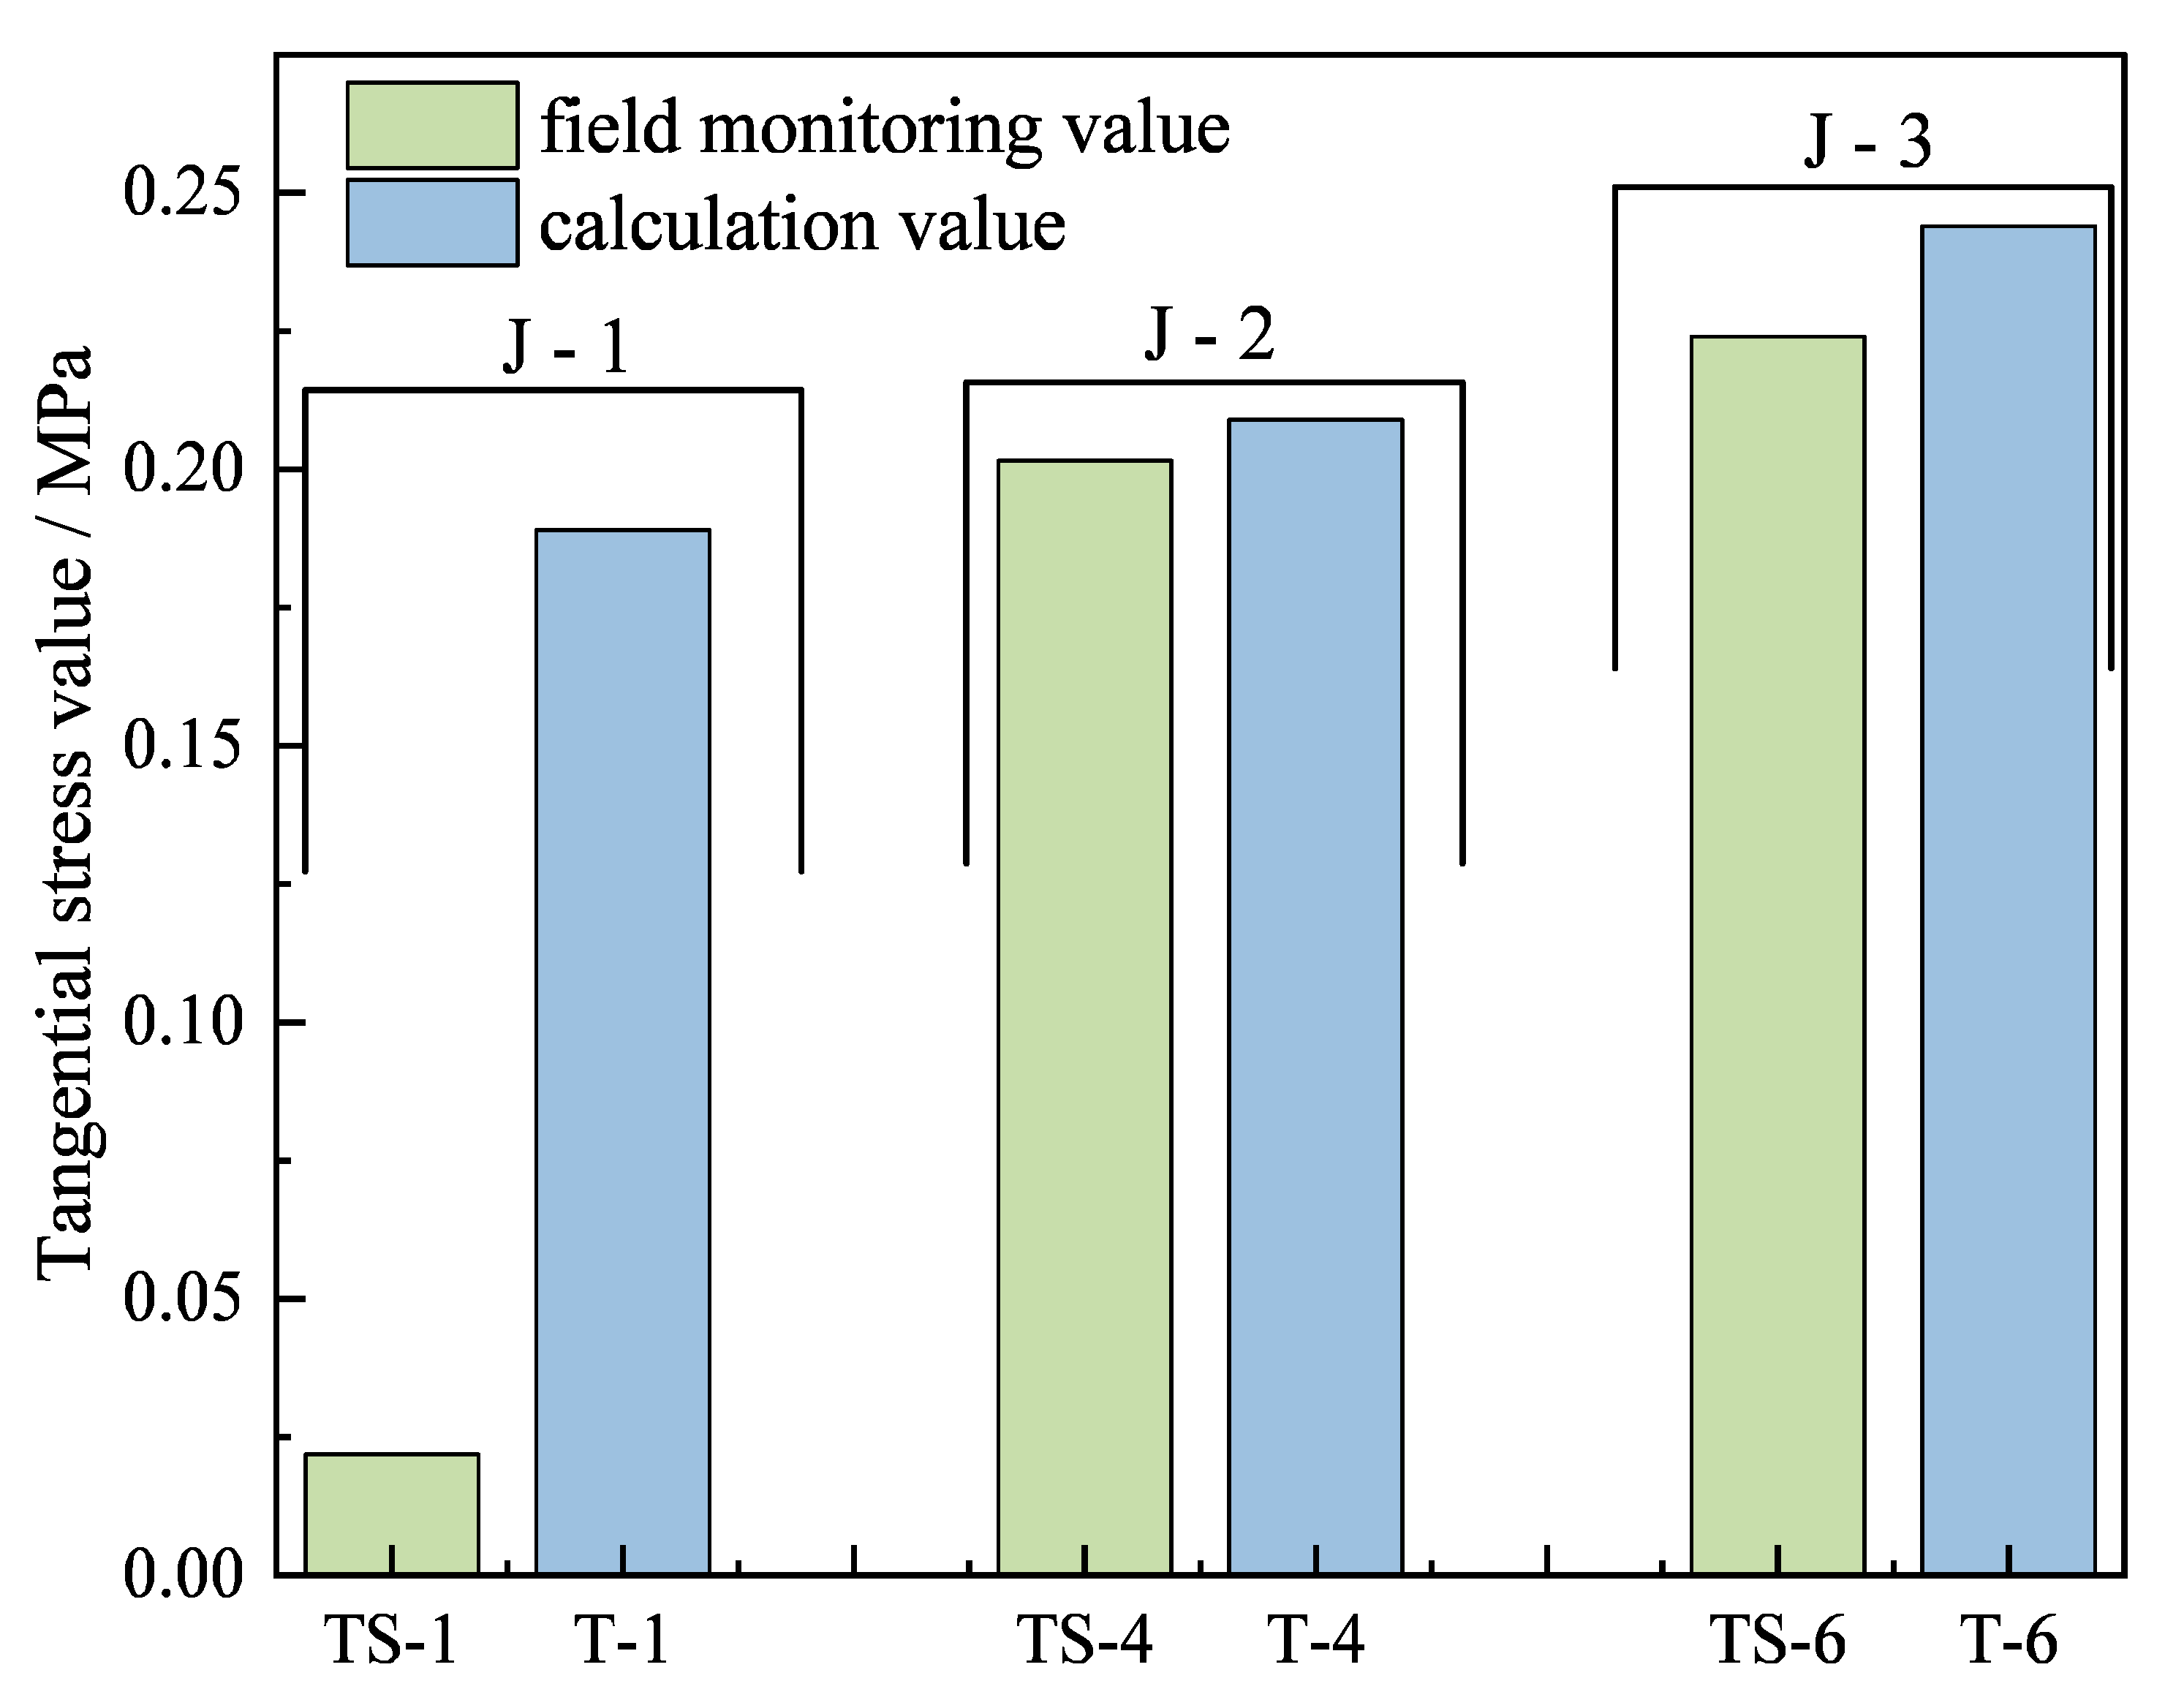
4.3. Validation of Model Accuracy
5. Results and Discussion
5.1. Influences of Tunnel Expansion on Surrounding Rock
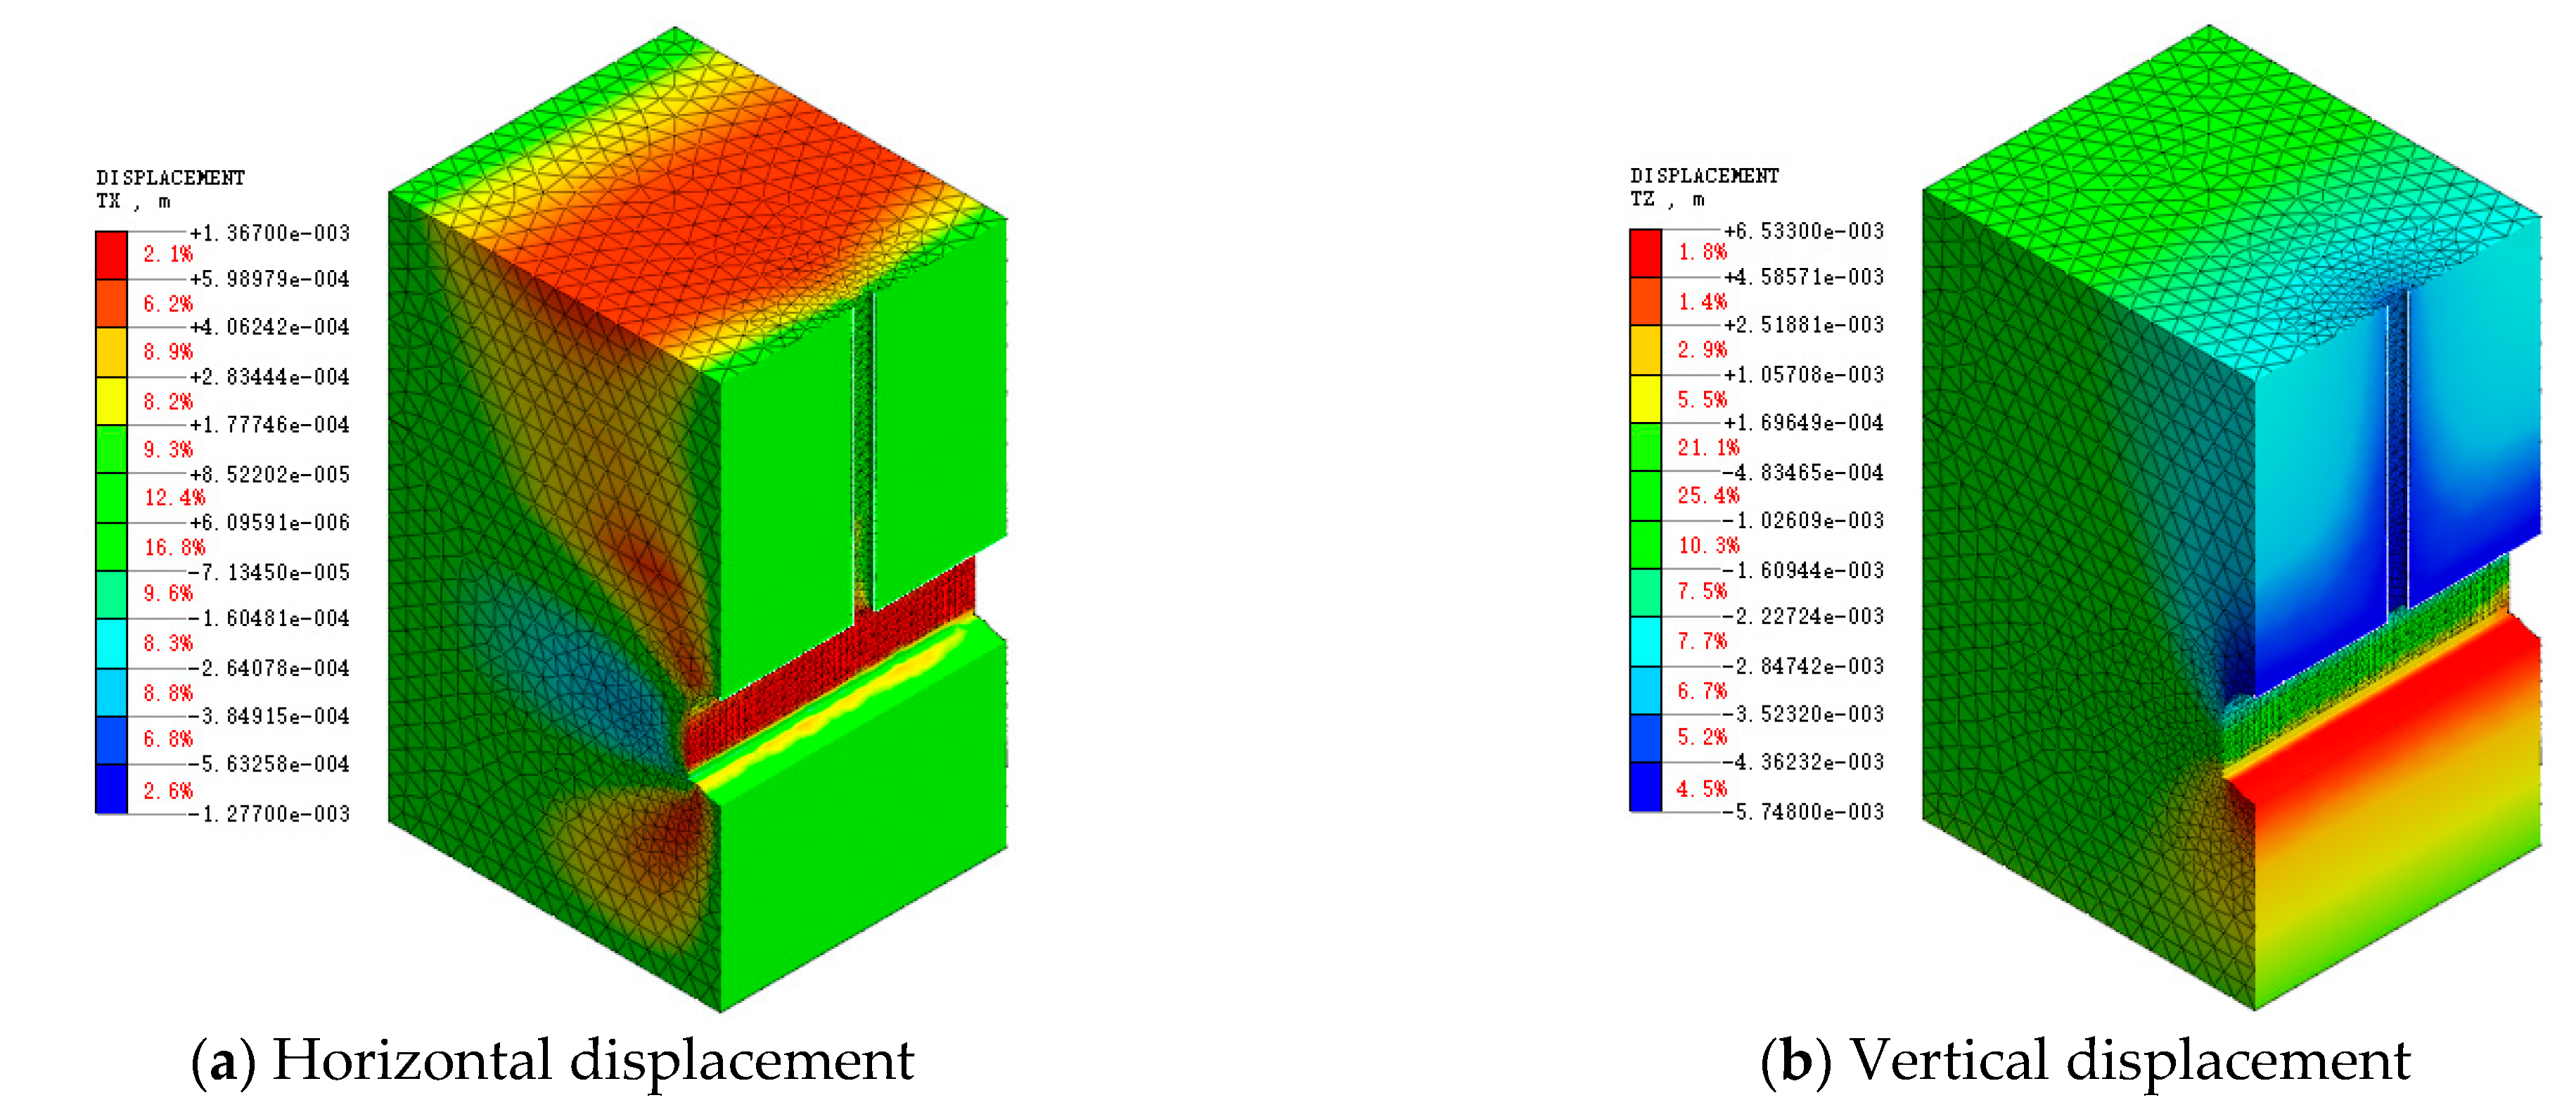
5.1.1. Deformation Analysis of Surrounding Rock
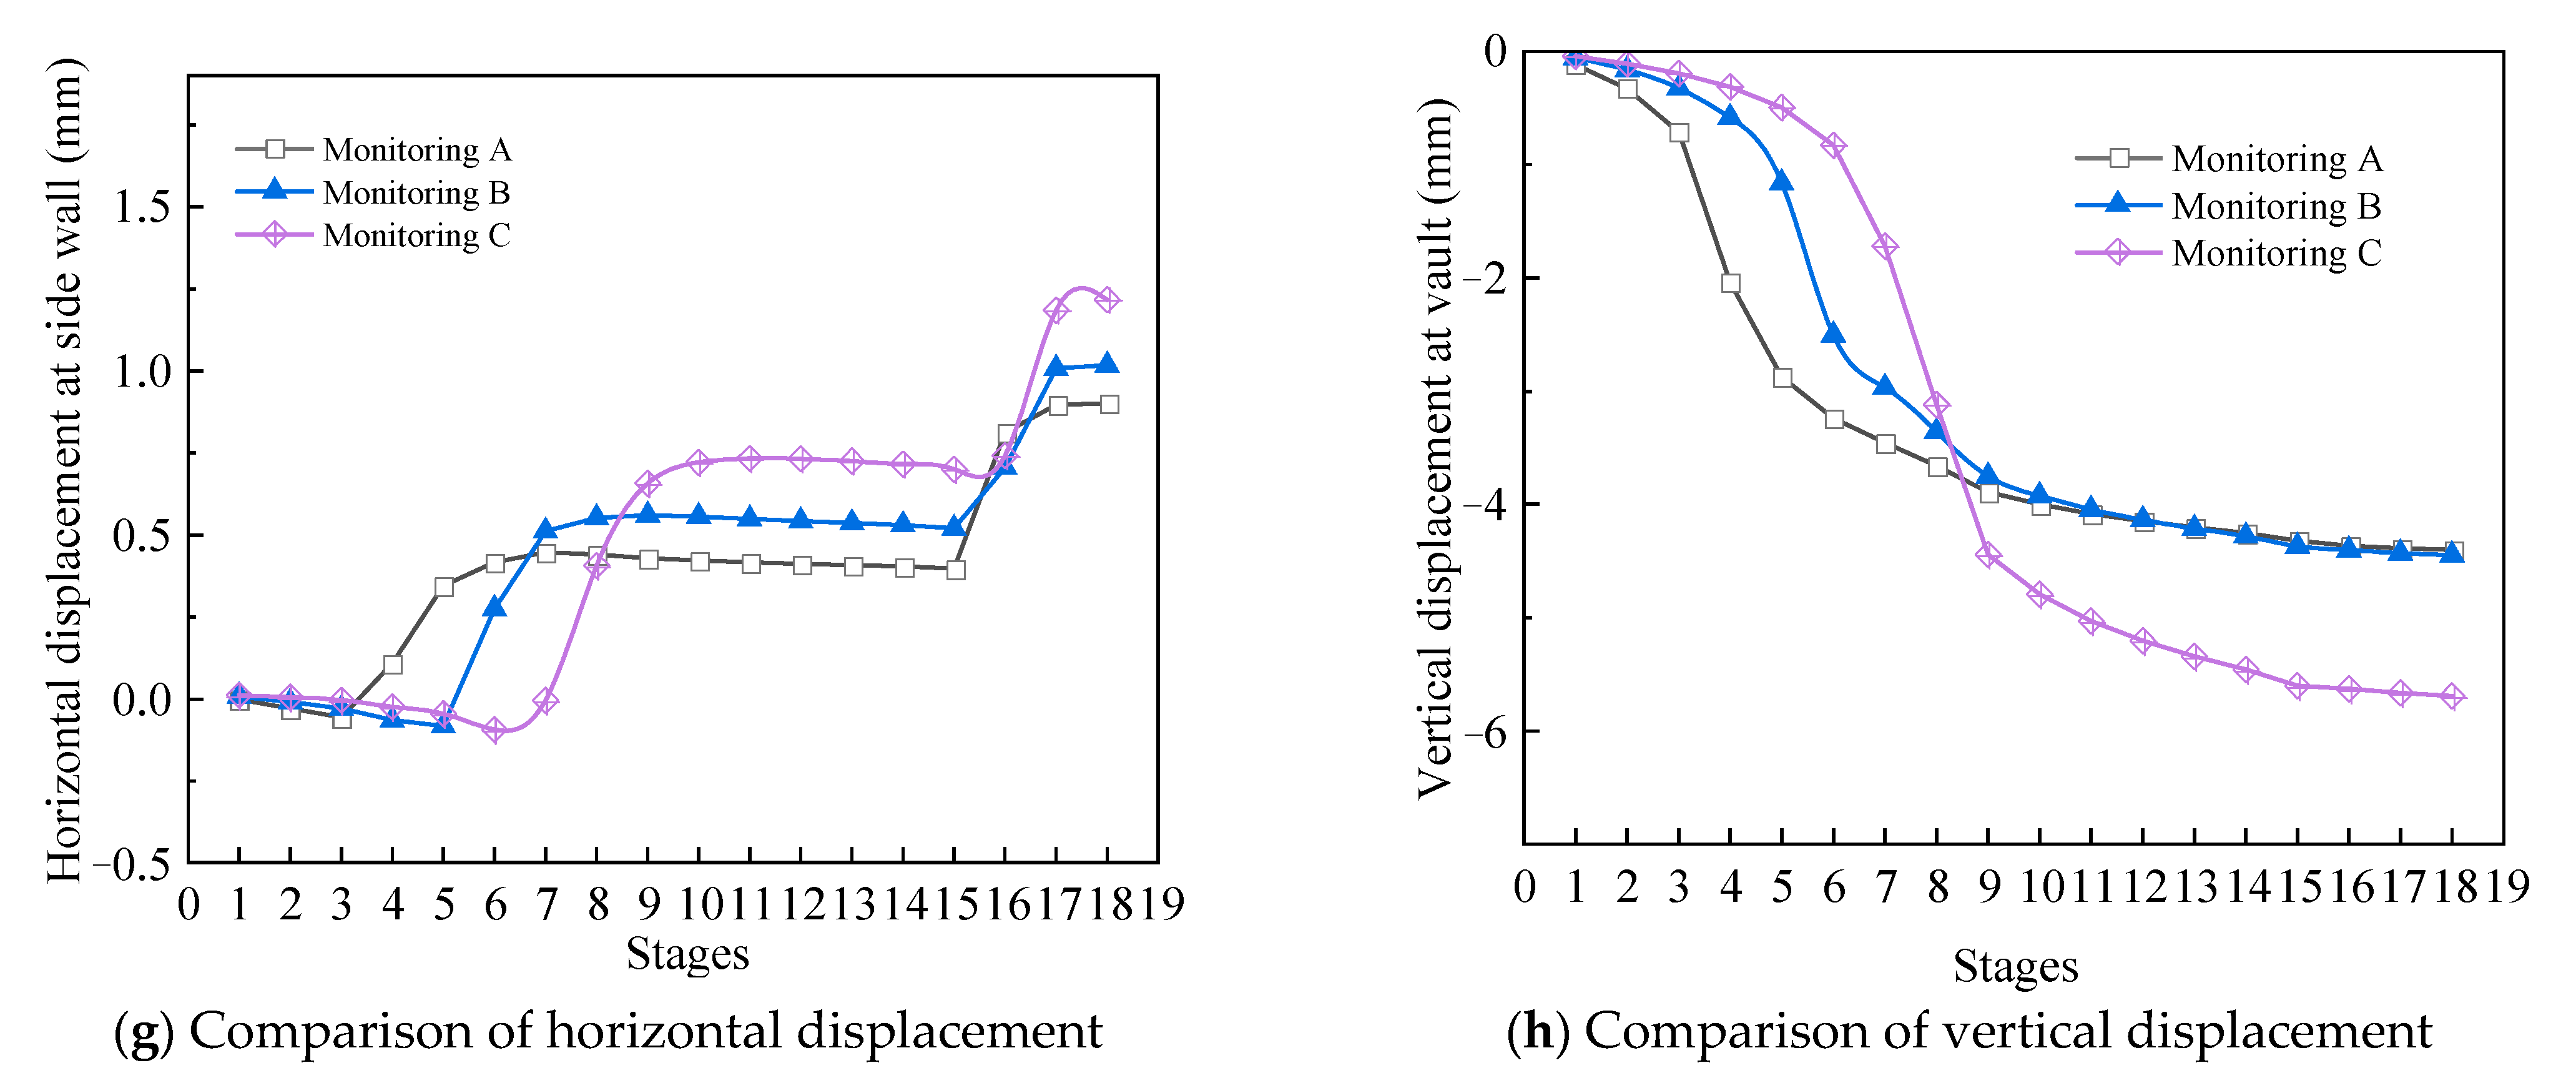
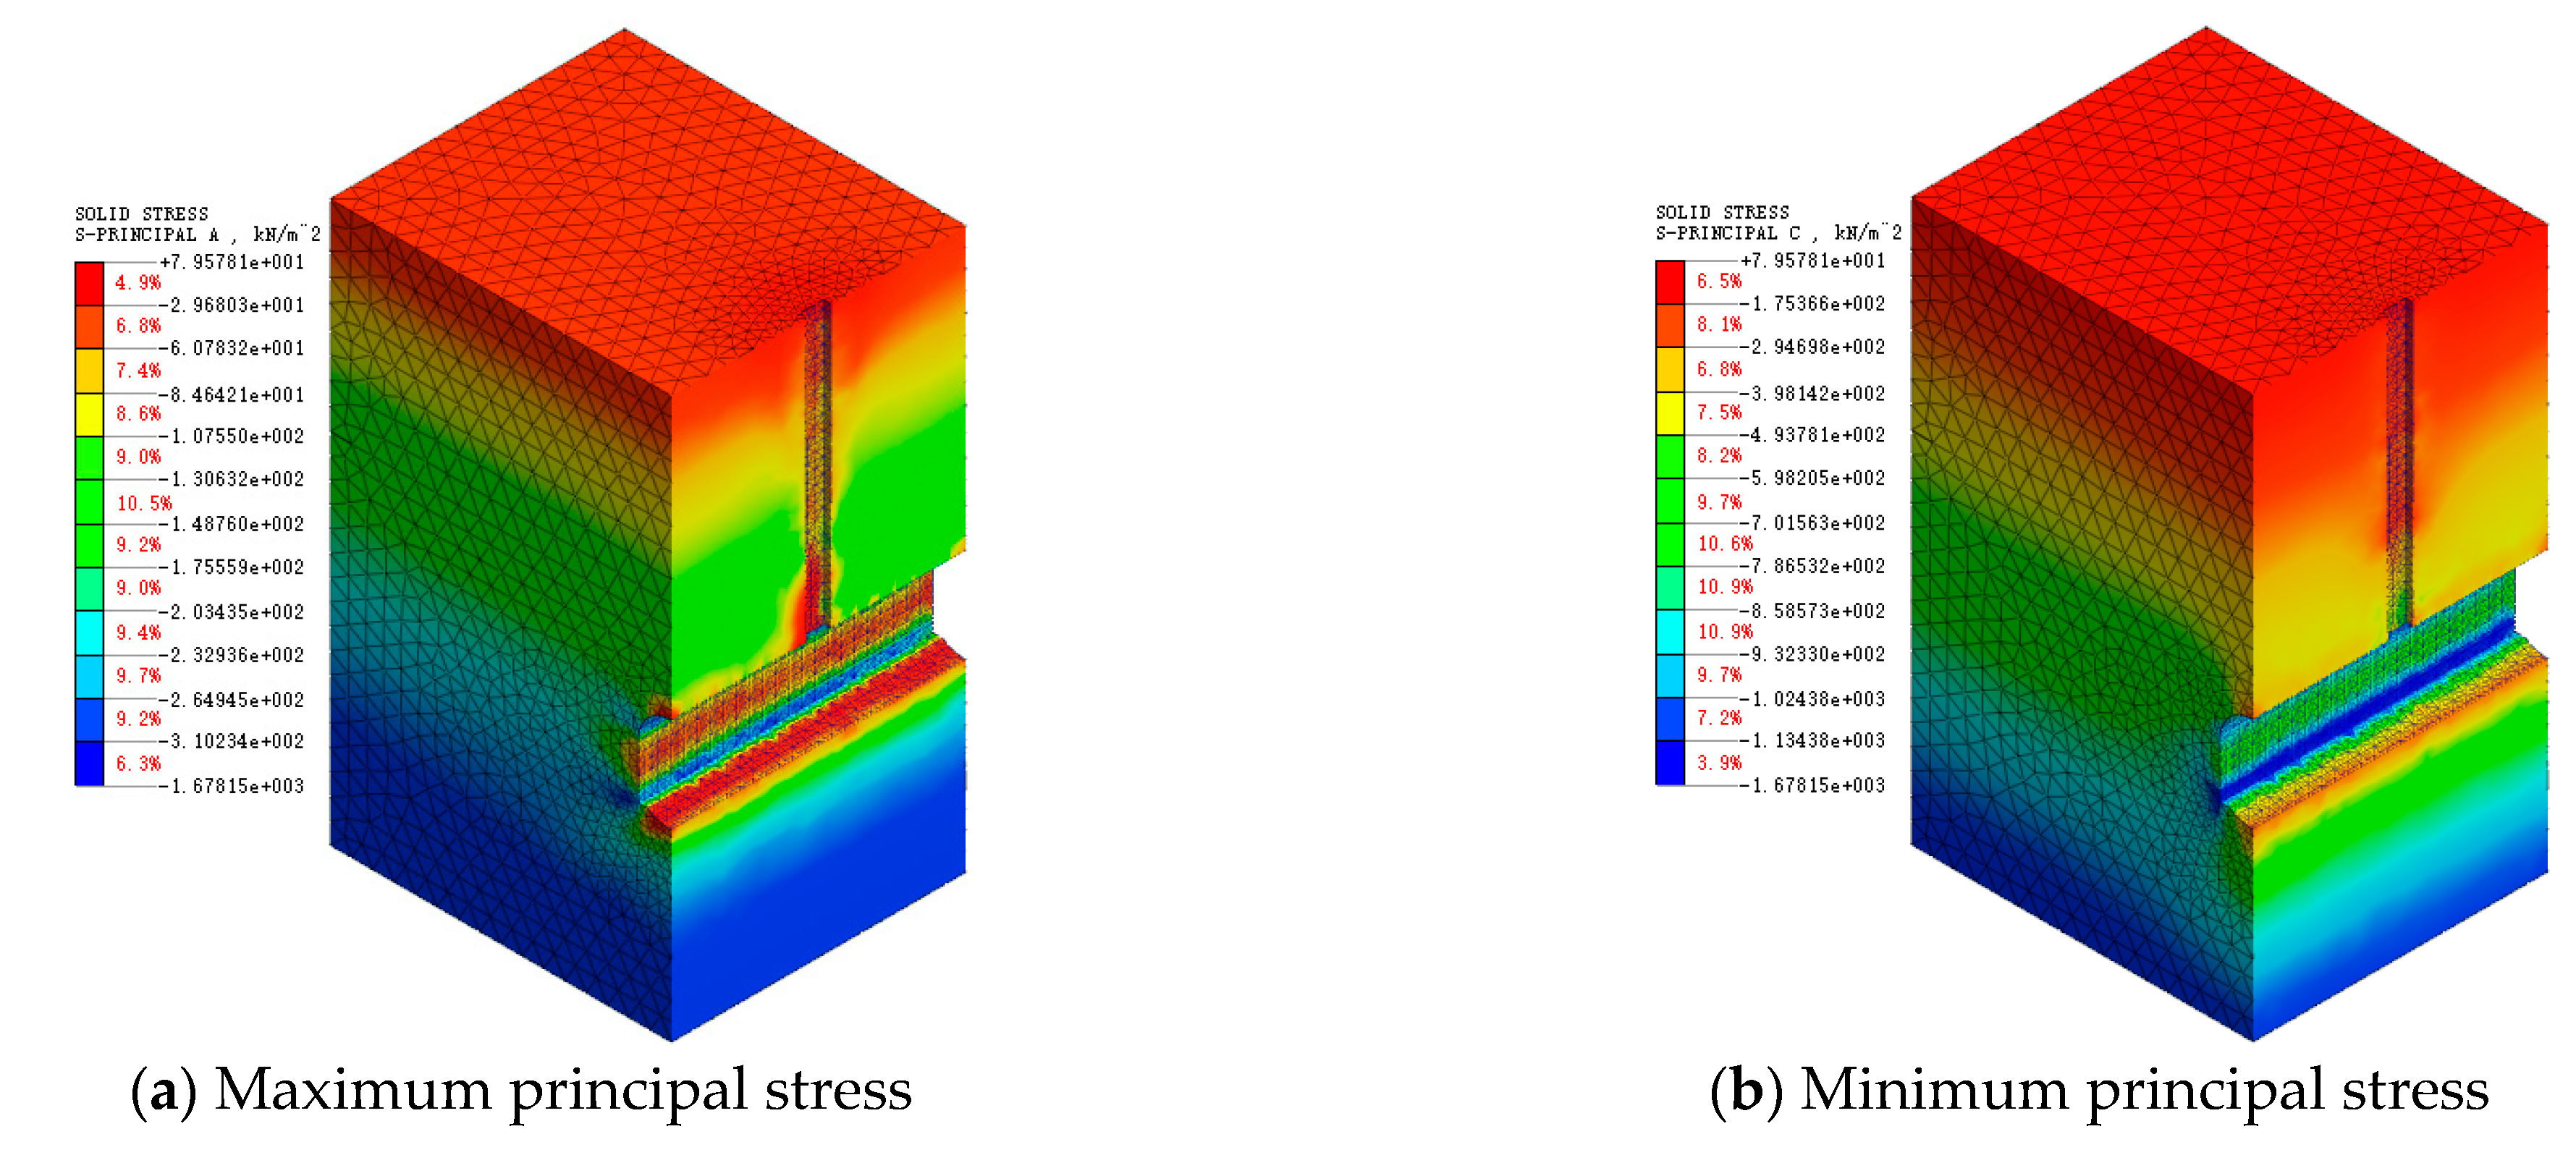
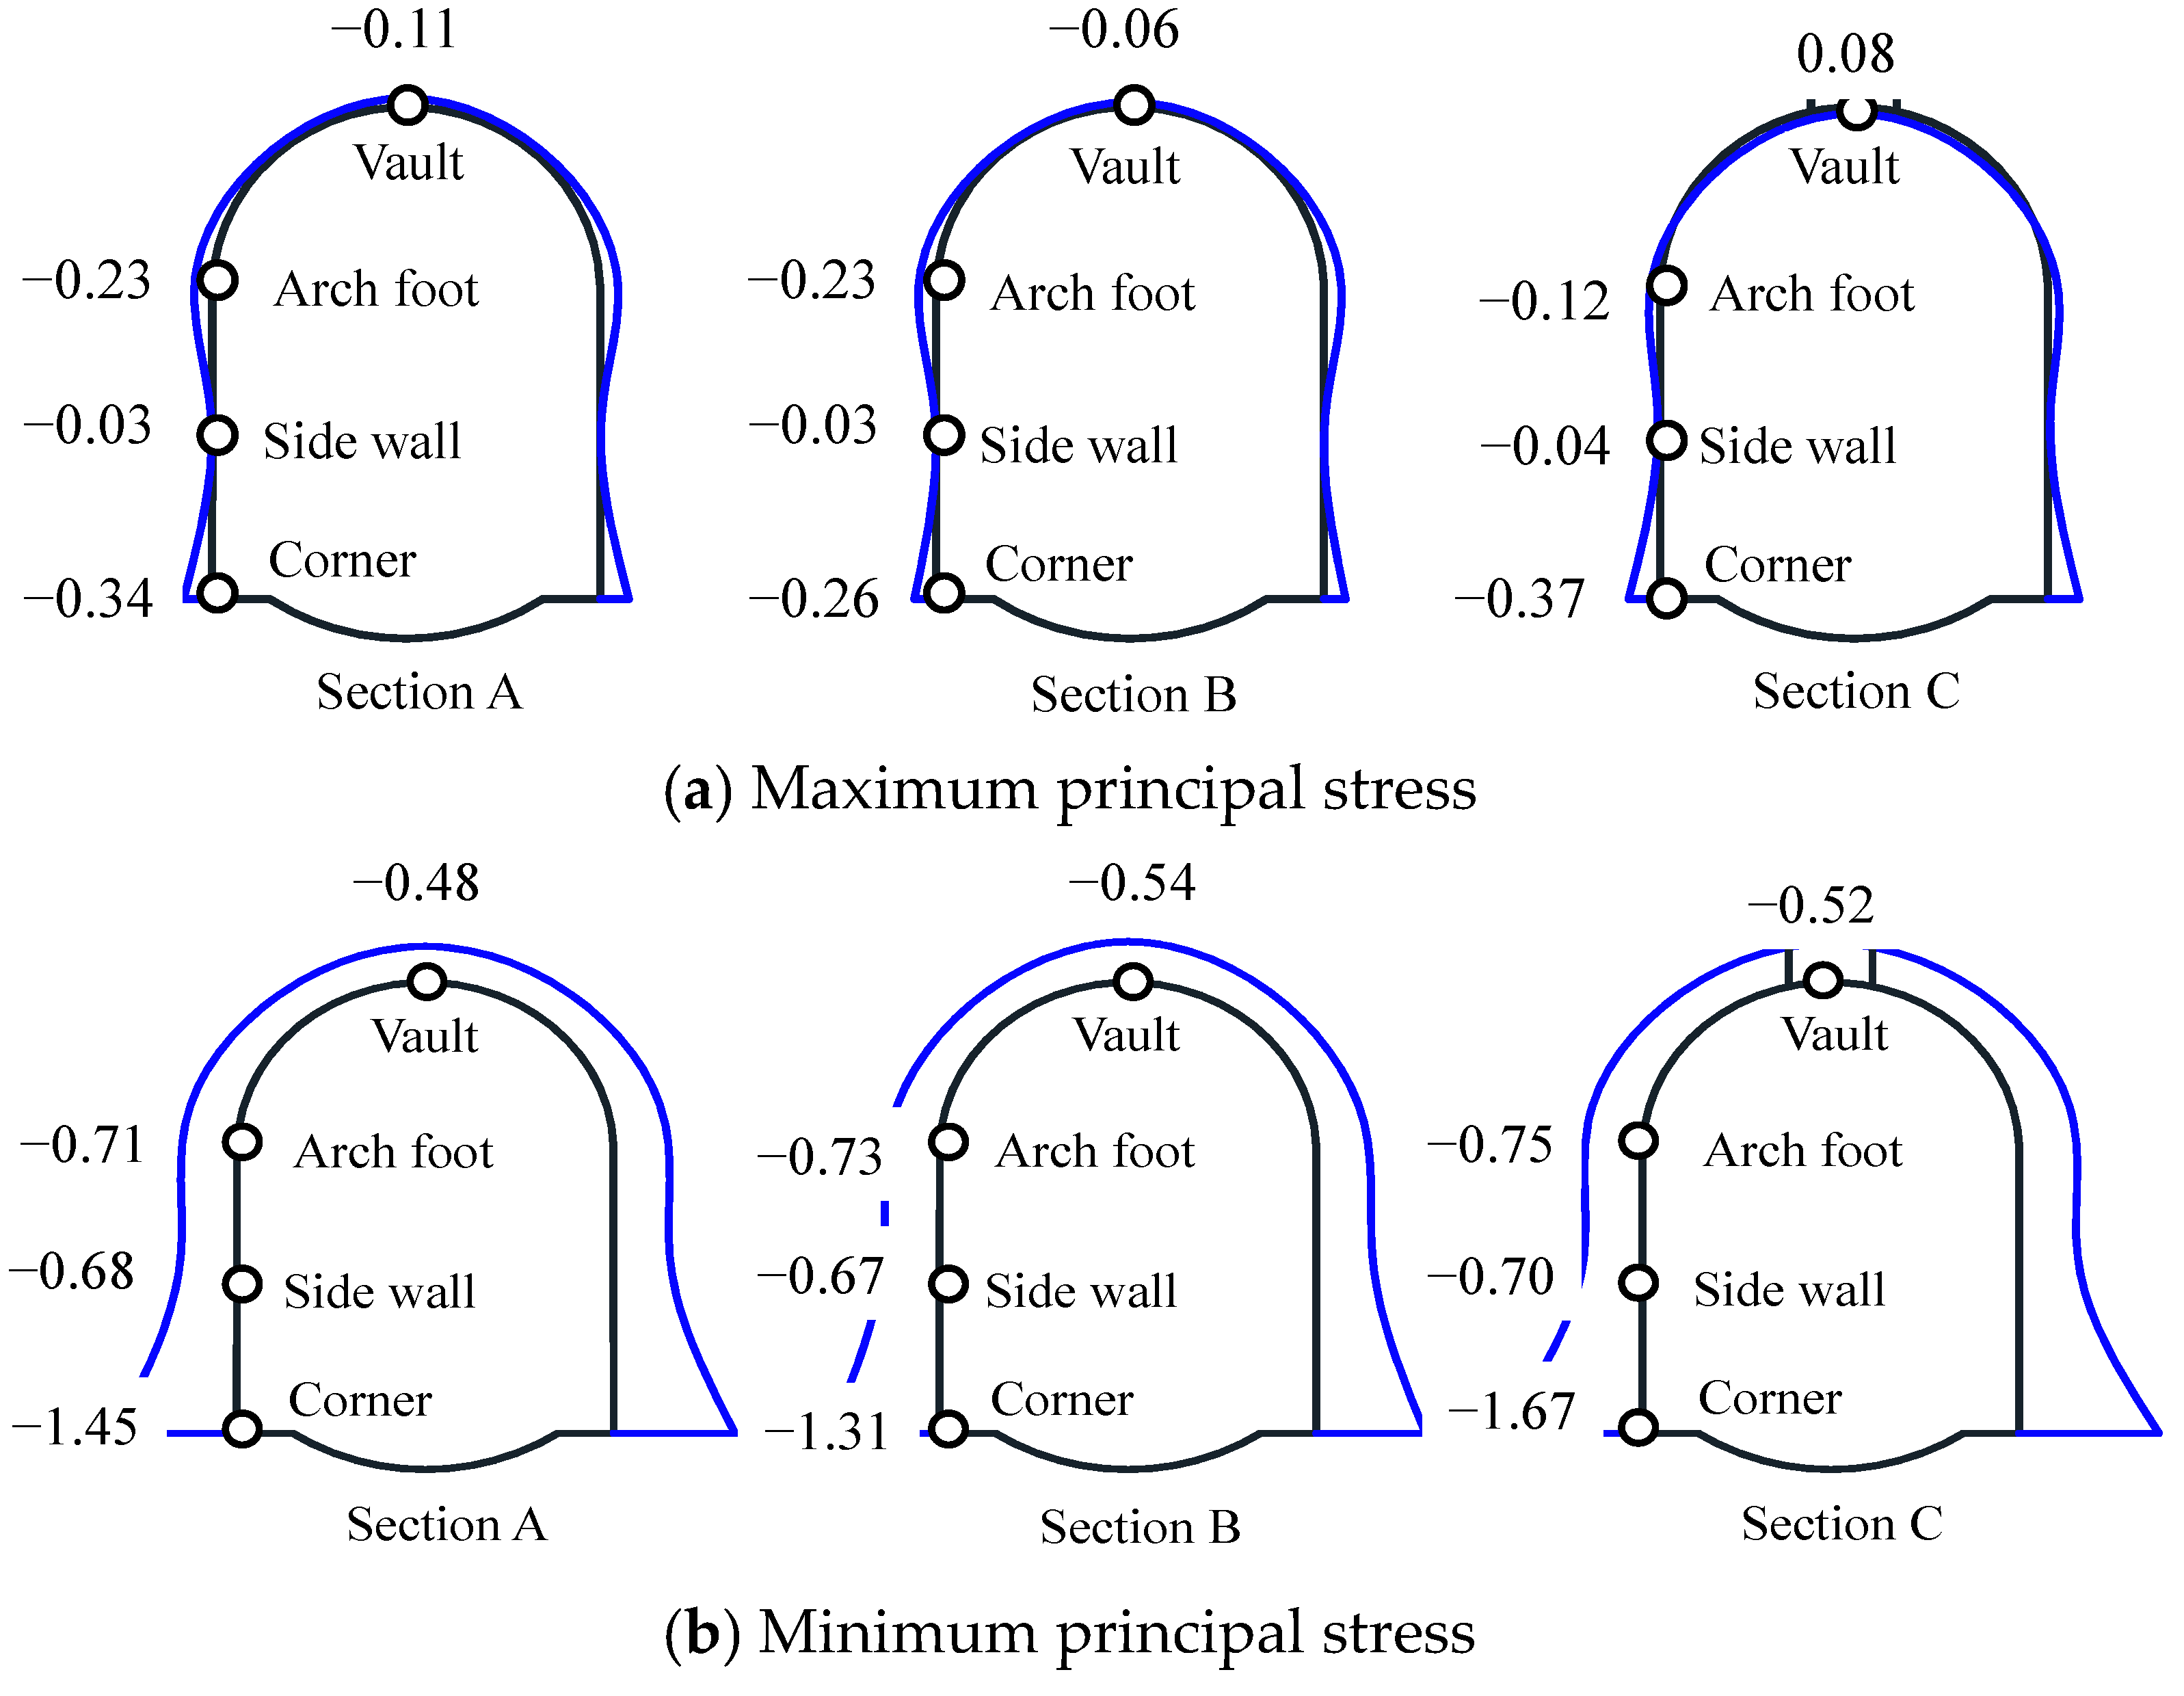
5.1.2. Stress Analysis of Surrounding Rock
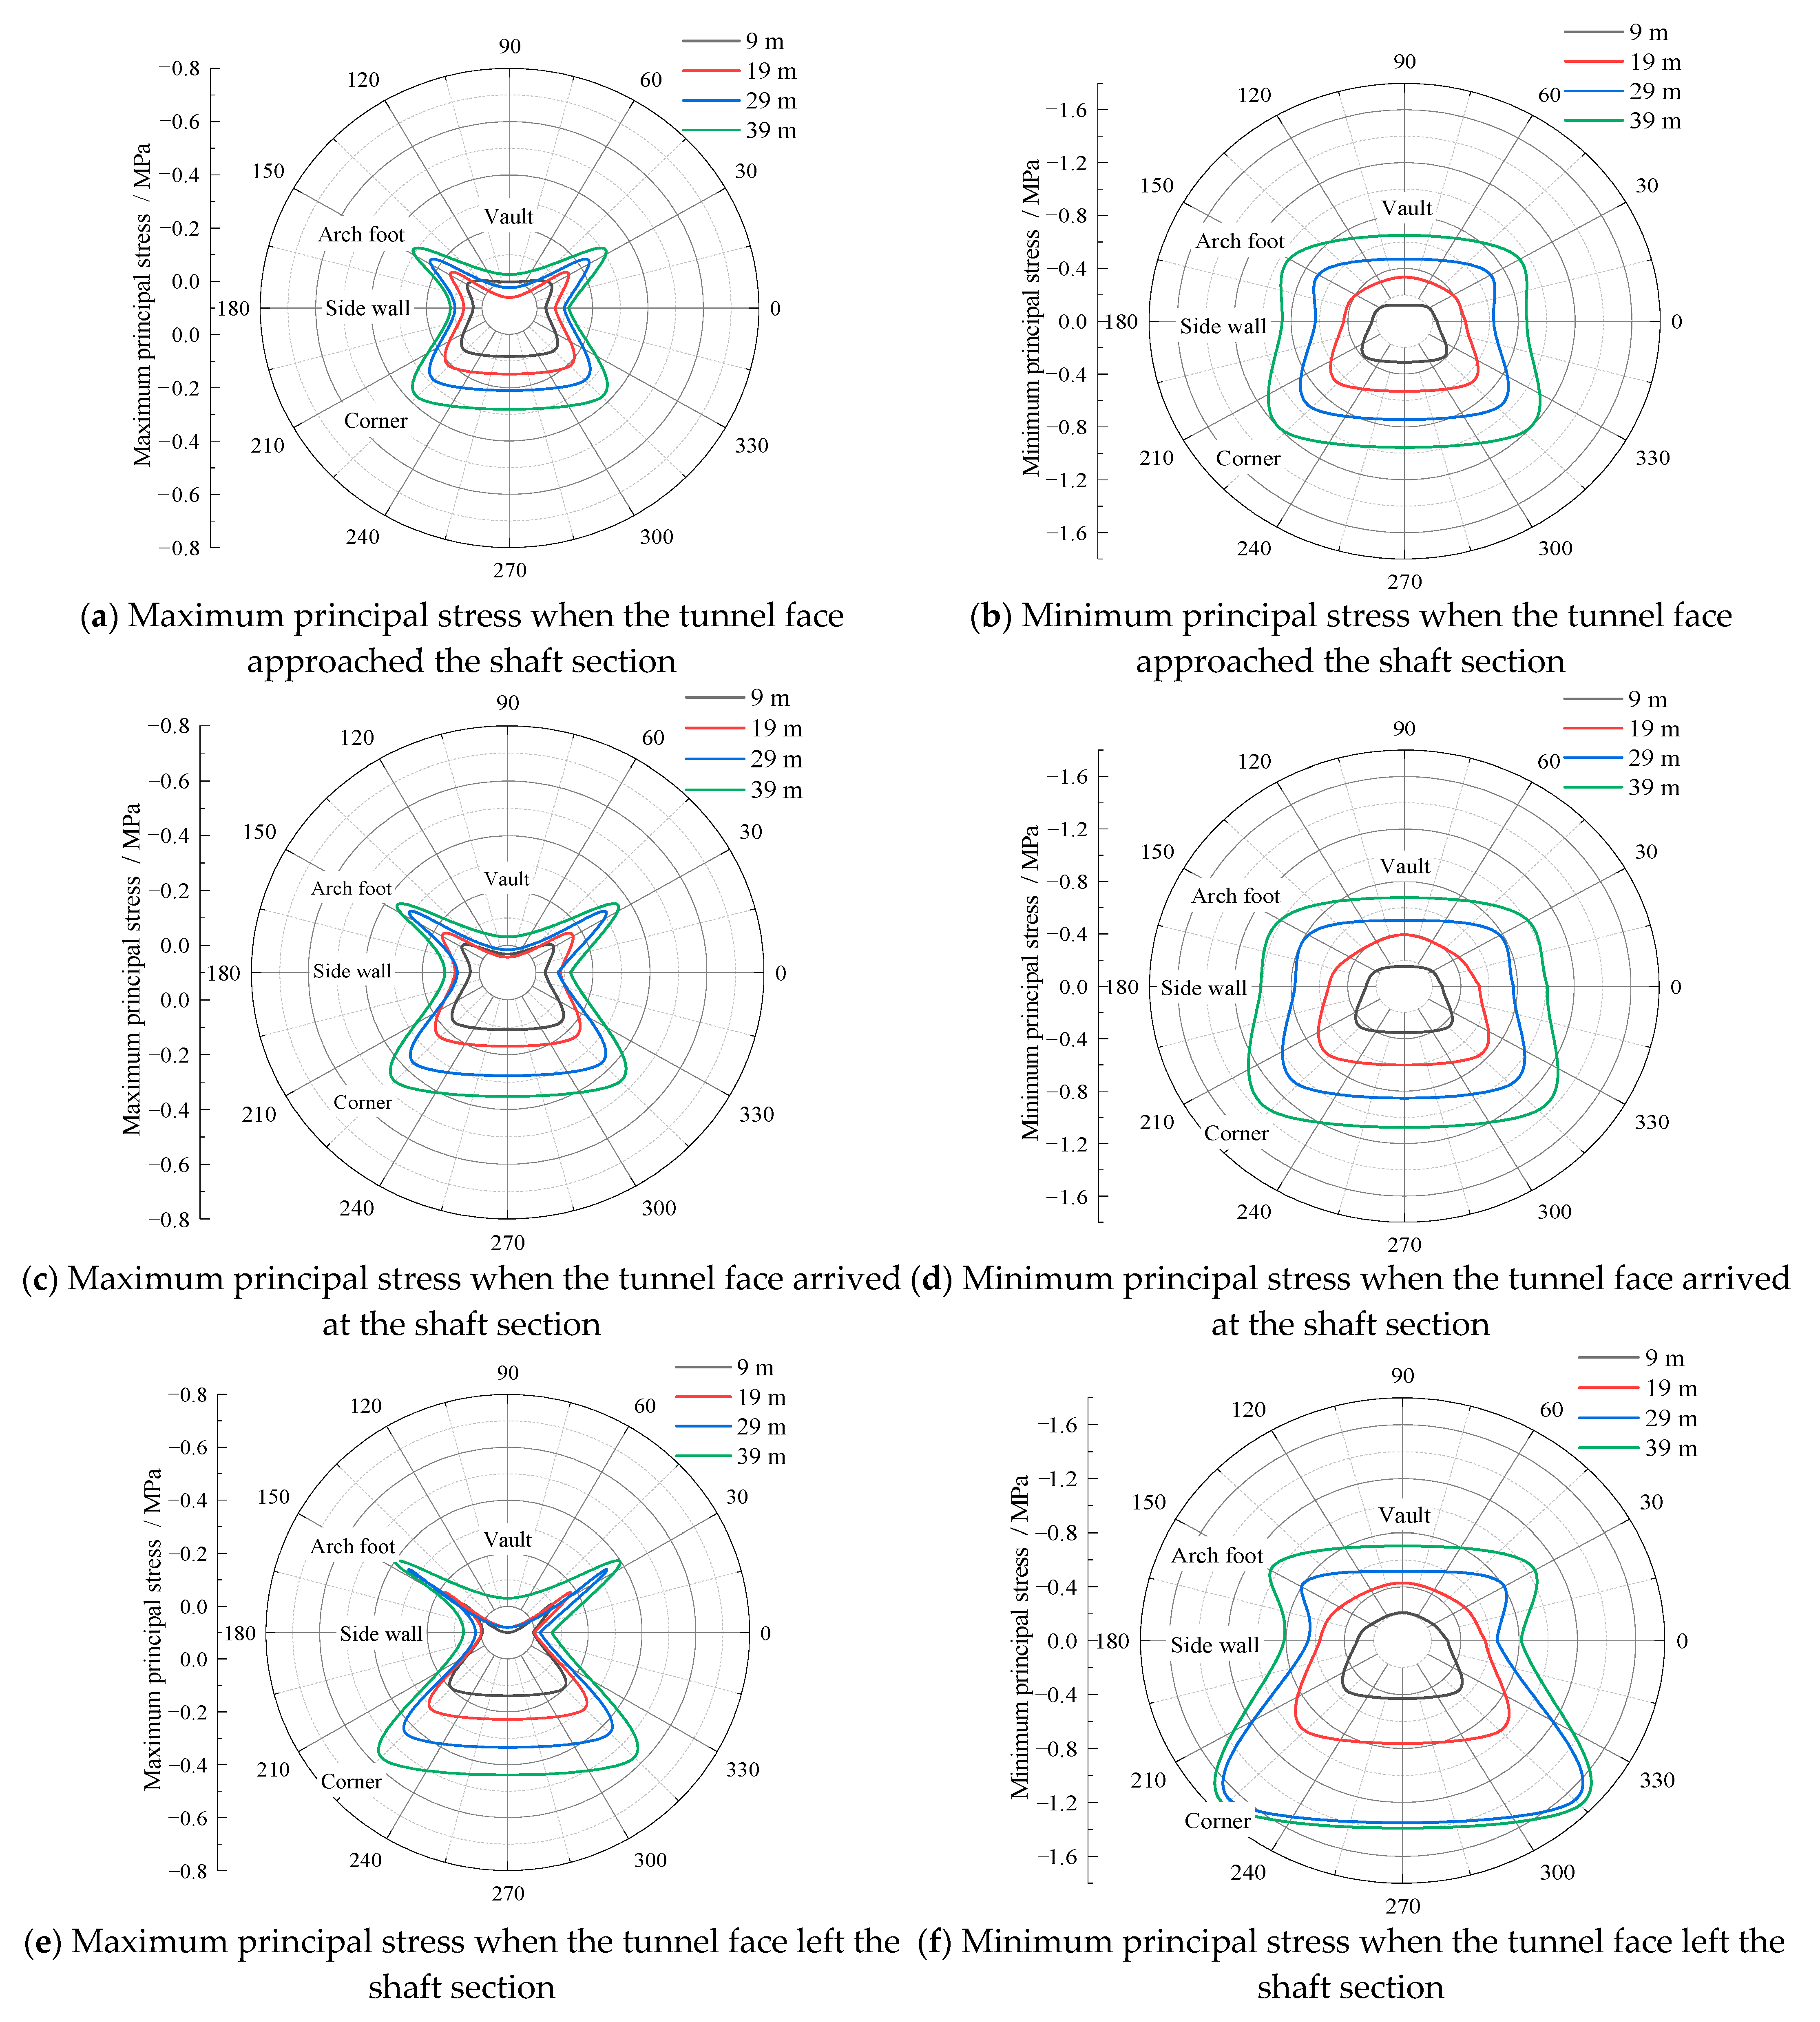
5.2. Influences of Shaft Depths
- (1)
- Principal stress distributions
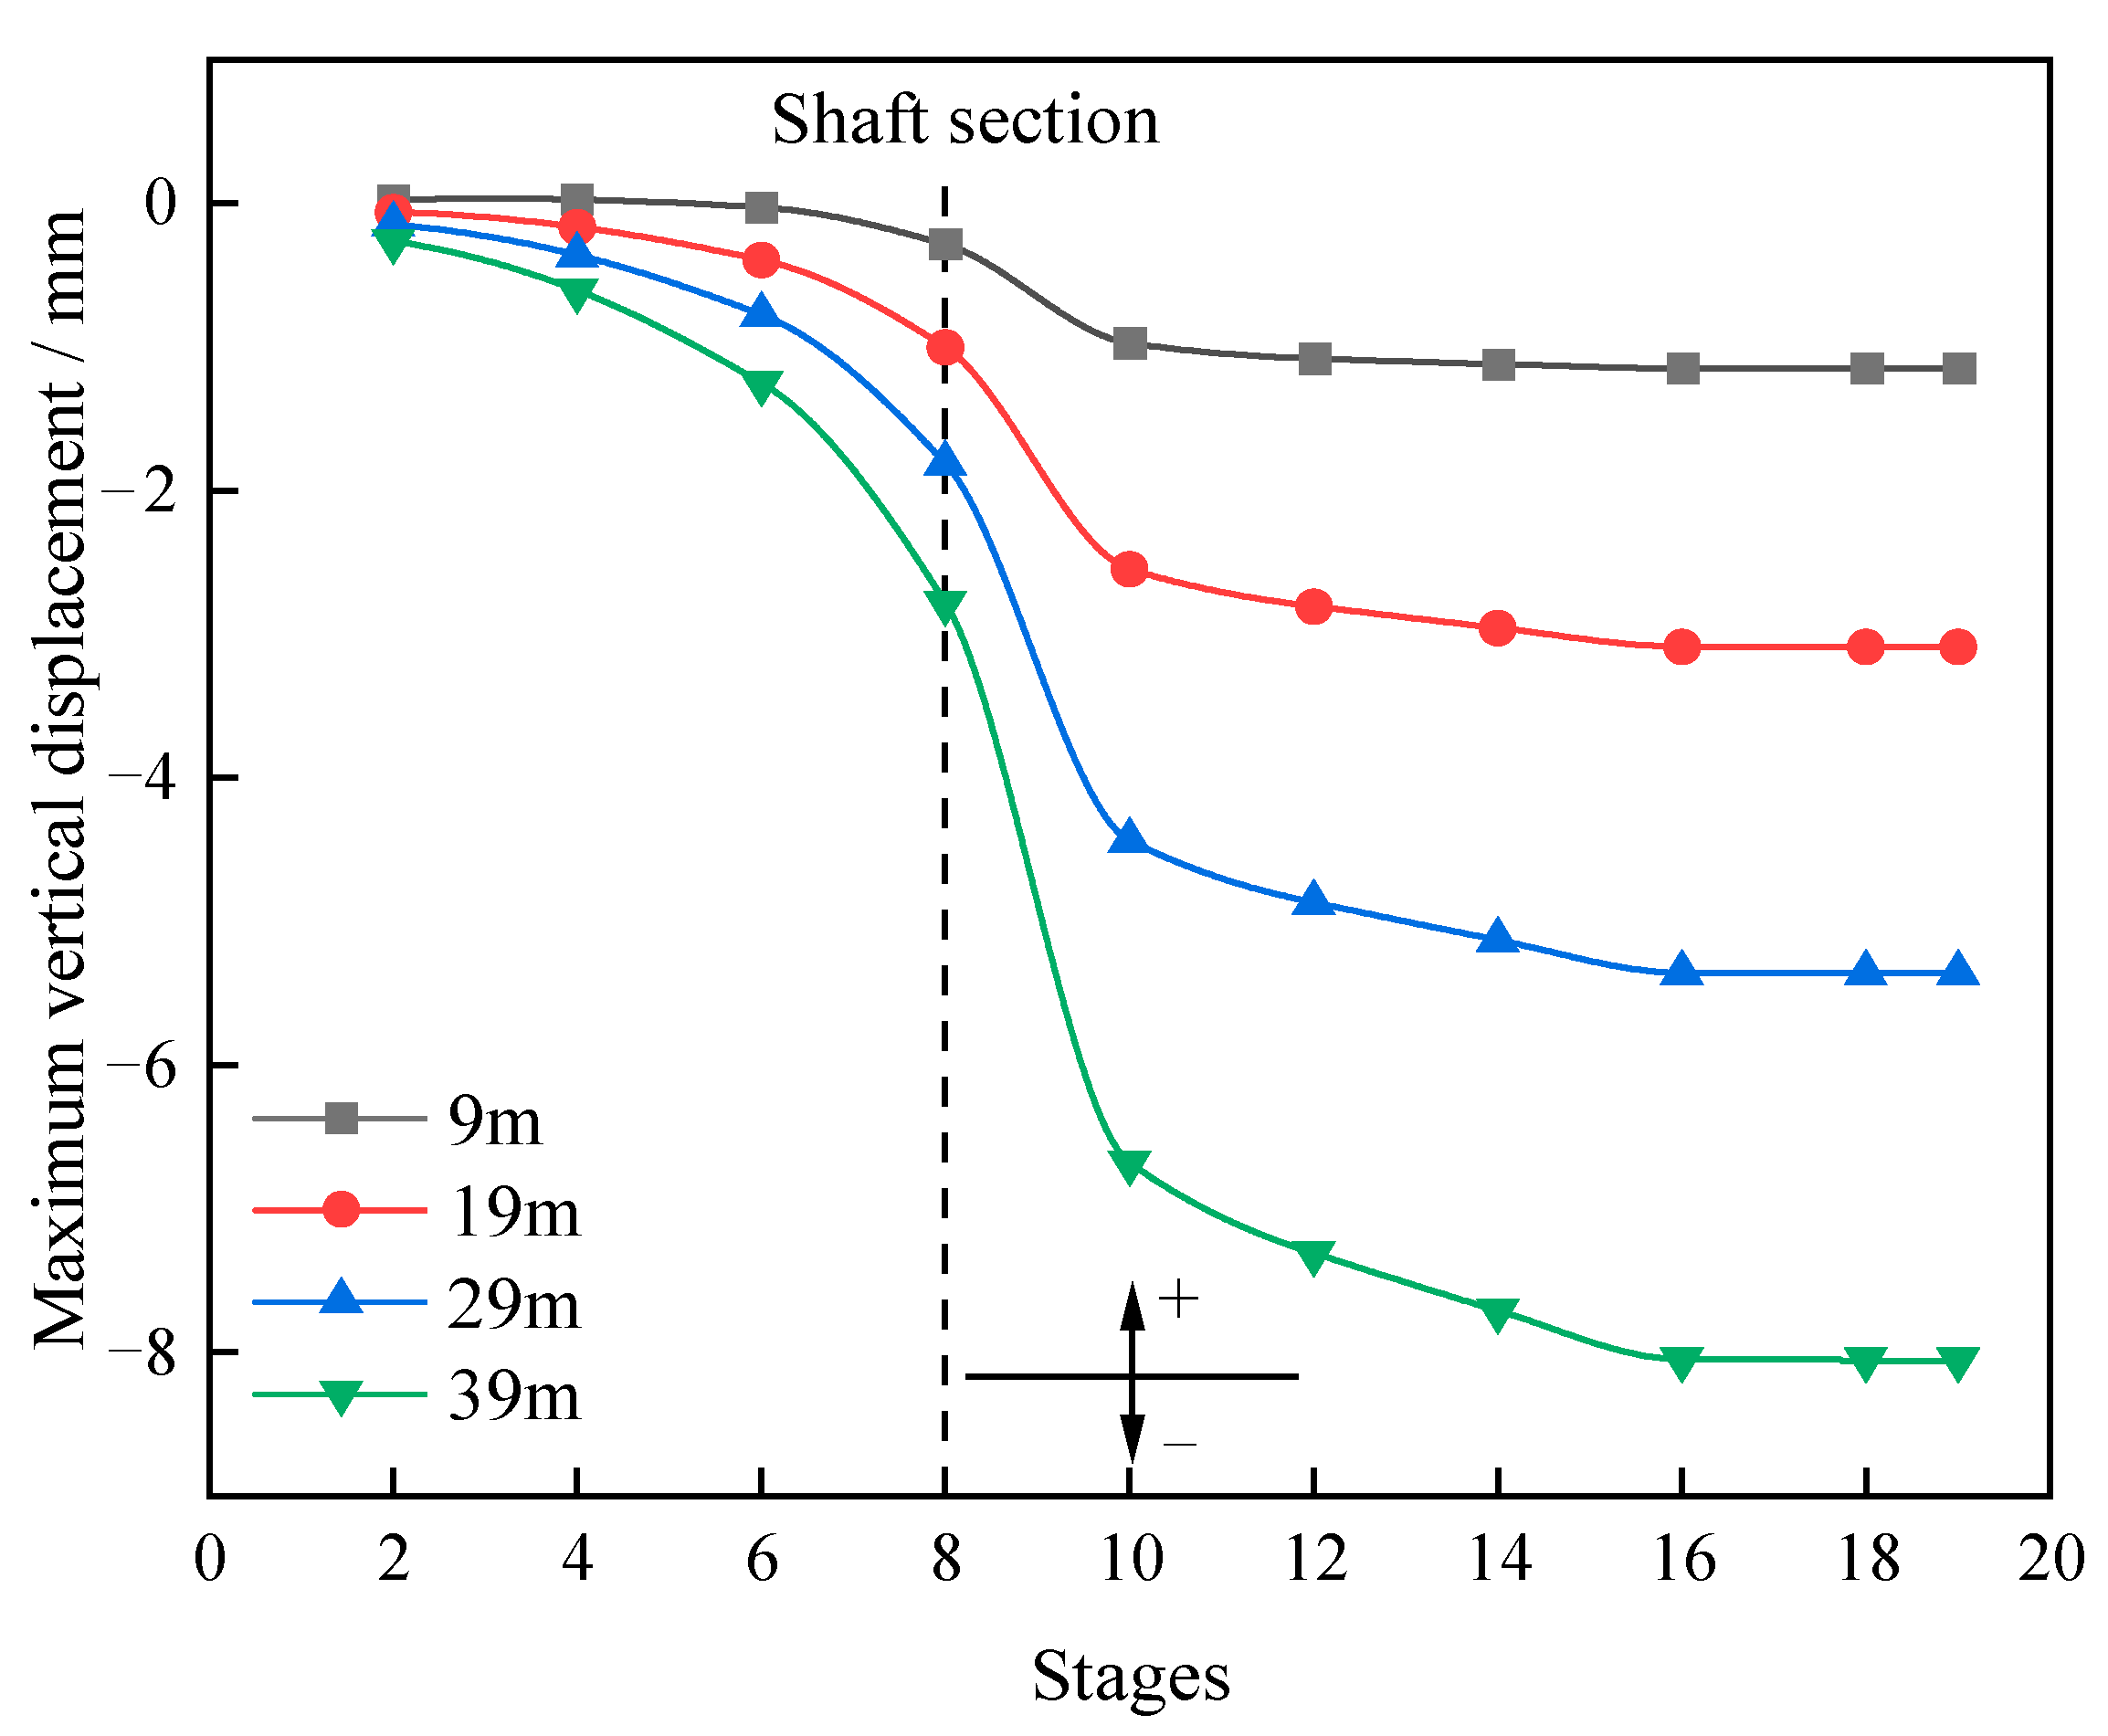
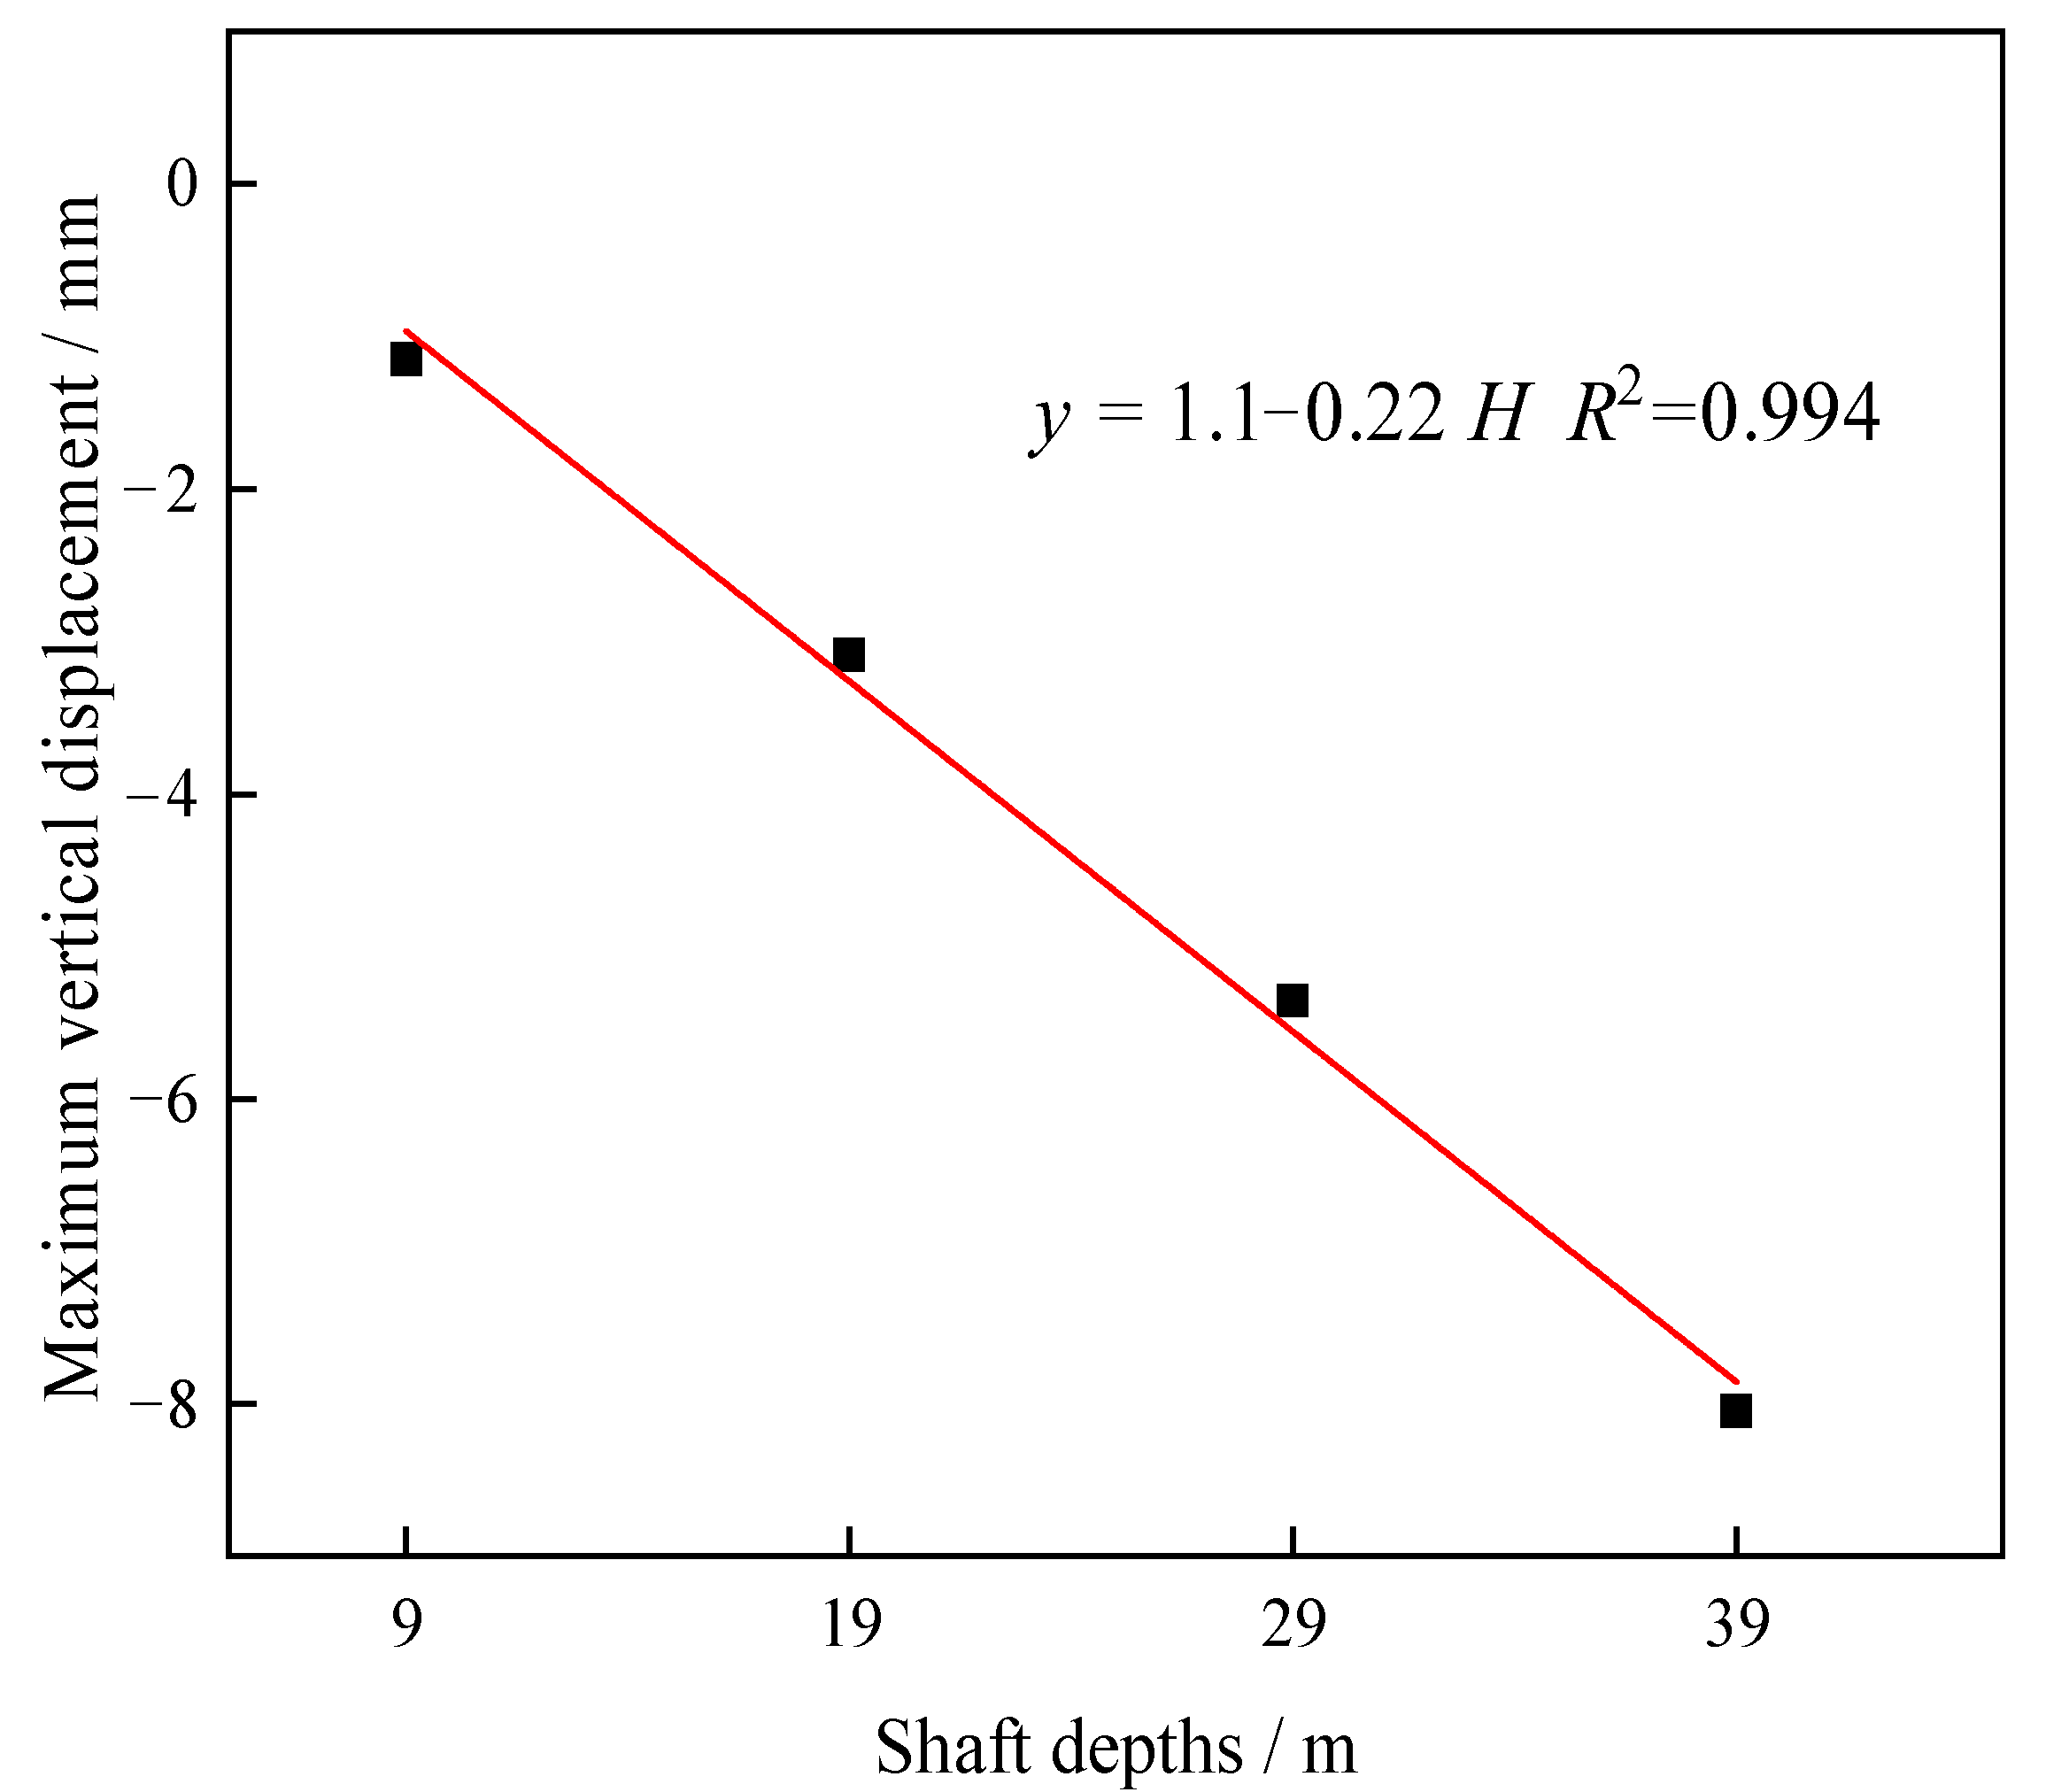
- (2)
- Displacement distributions
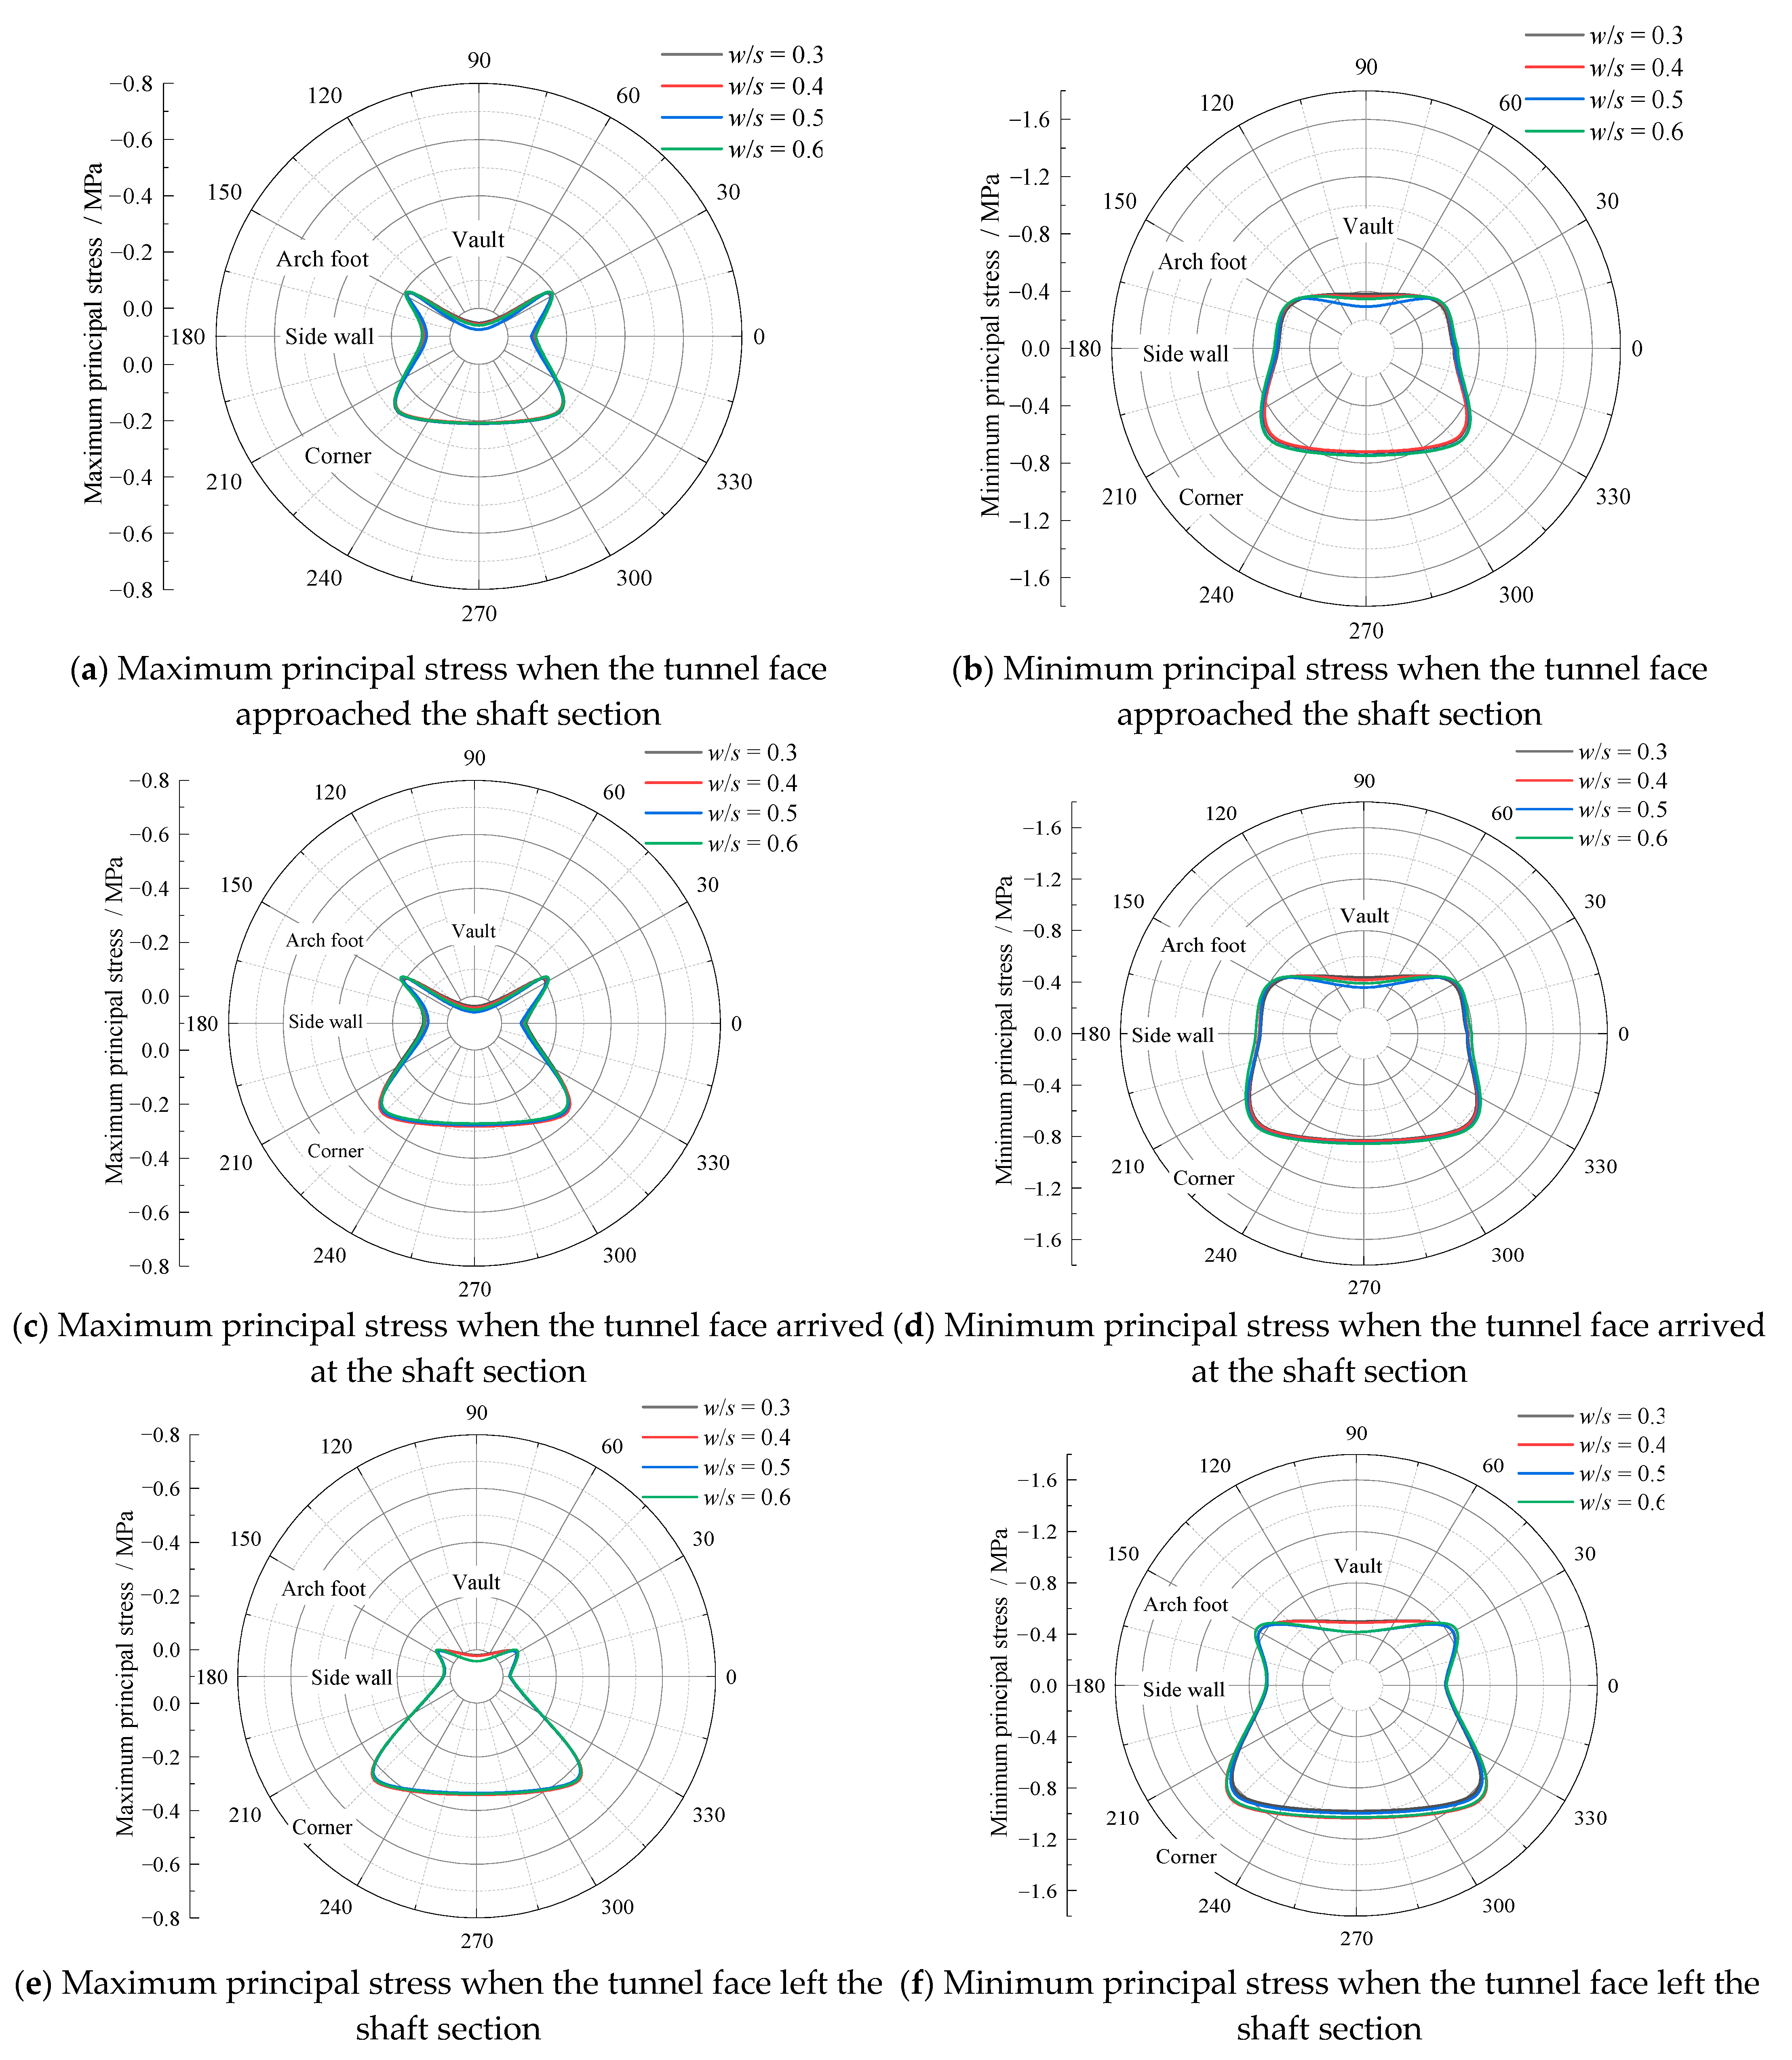
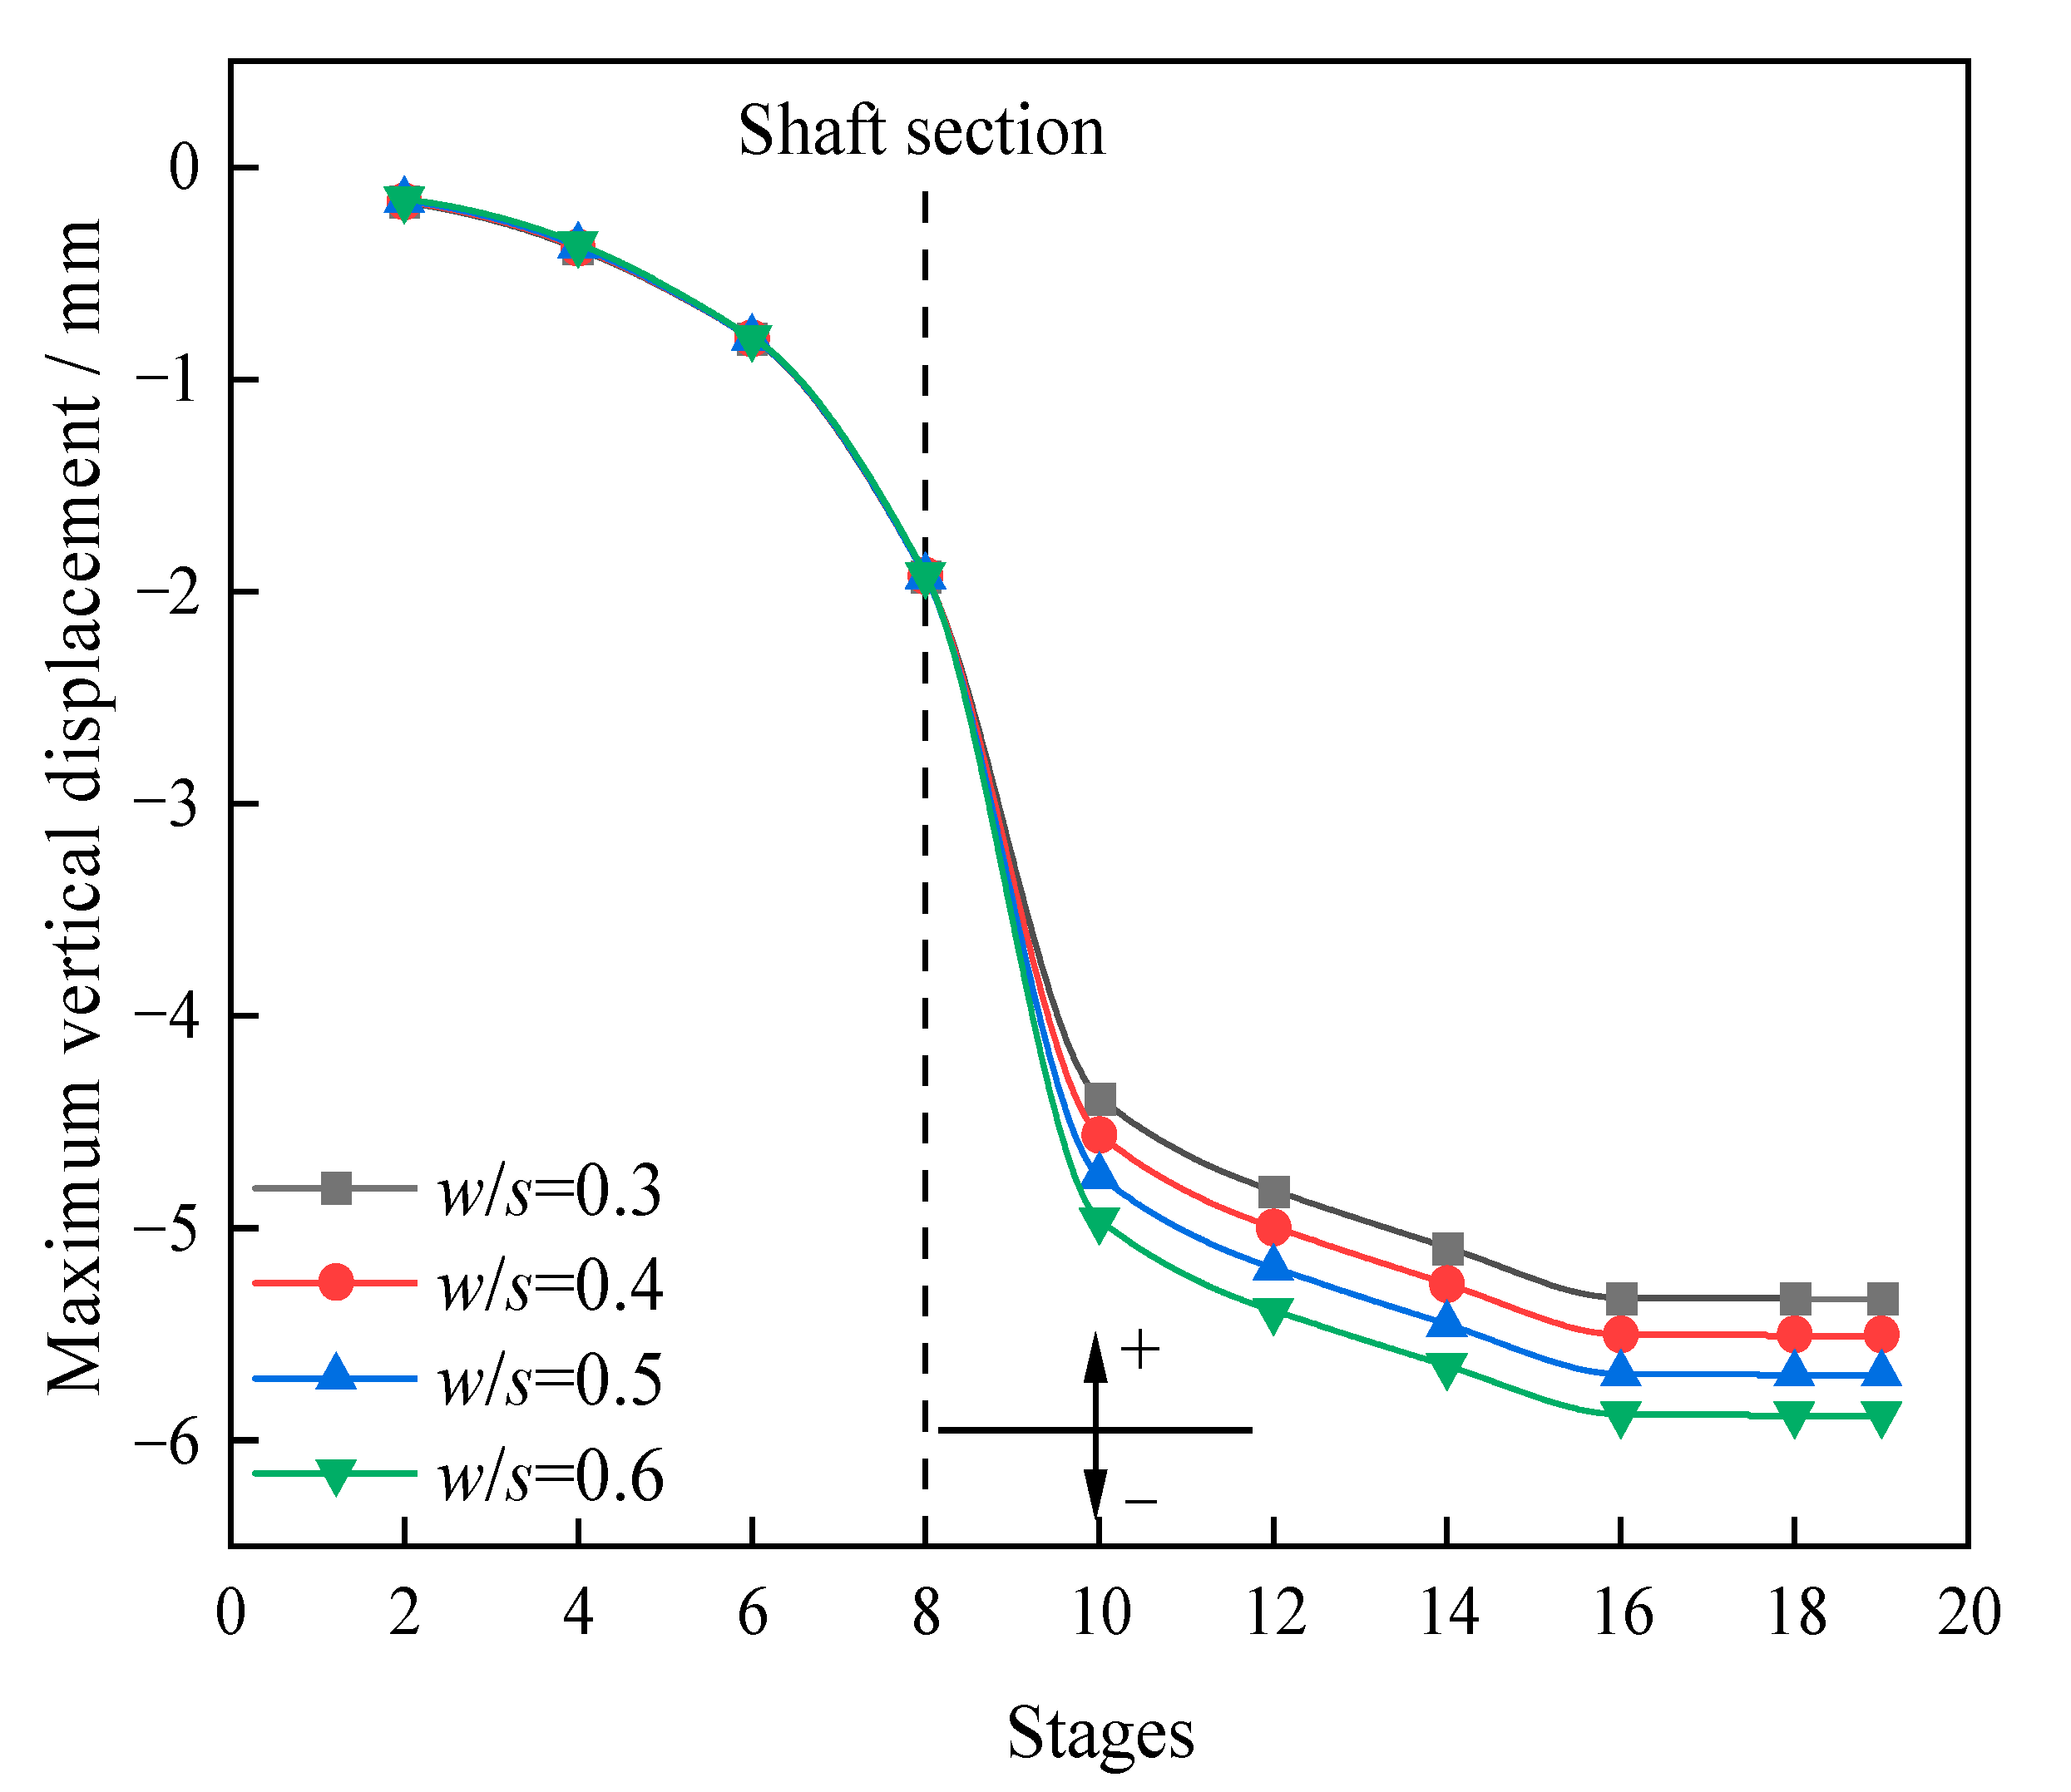
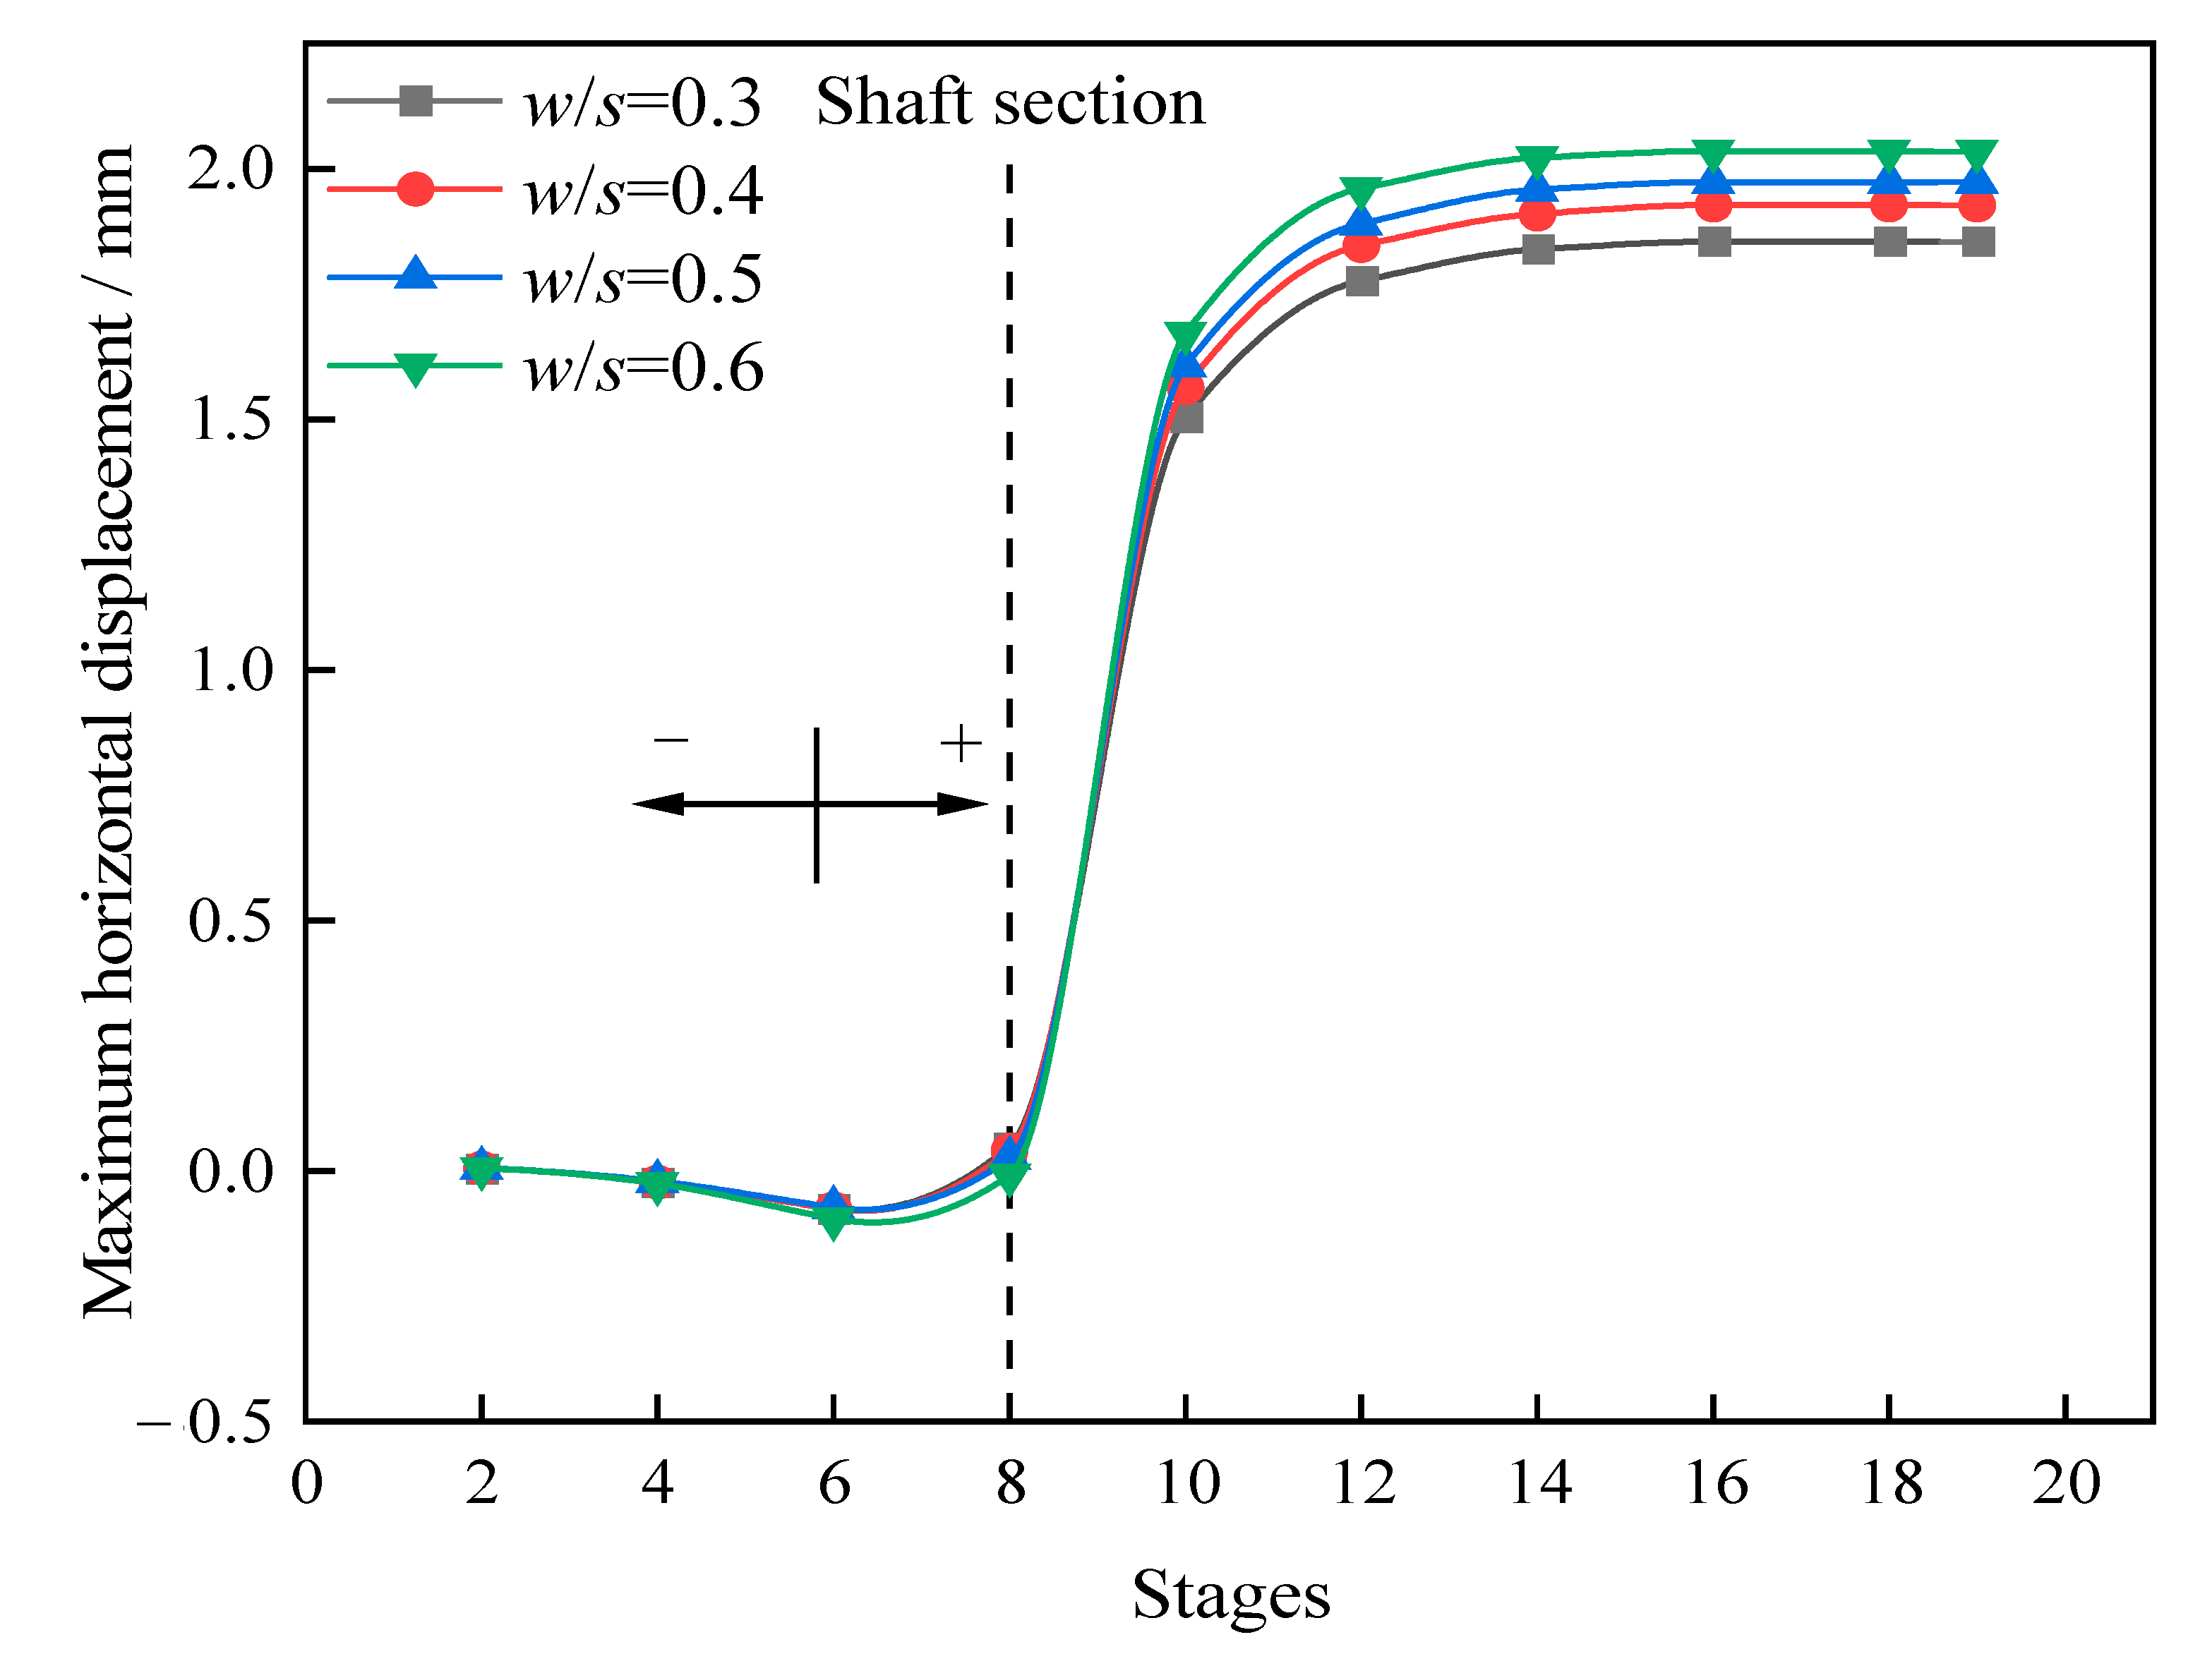
5.3. Influences of Width–Span Ratios
- (1)
- Principal stress distributions
- (2)
- Displacement distributions
6. Conclusions
- (1)
- The tangential stress at the J-1 section decreased with the approach of the tunnel face, and the tangential stress at the J-2 section and J-3 section increased. When the distance between the tunnel face and the monitoring section was about 0.91 to 1.45 times that of the existing tunnel’s span, the growth rate of tangential stress increased obviously.
- (2)
- The existence of the ventilation shaft weakened the stability of the surrounding rock during the expansion process. Compared with section A, the horizontal and vertical displacements in section C increased by 47.5% and 29.3%, respectively.
- (3)
- The maximum vertical displacement of the vault had a linear relationship with the shaft depth, and the maximum horizontal displacement of the side wall was in a quadratic relationship with the shaft depth. The smaller the shaft depth, the greater the tensile stress was on the surrounding rock in the vault.
- (4)
- The maximum vertical and horizontal displacements of the surrounding rock both had linear relationships with the width–span ratio. The greater the width–span ratio, the greater the tensile stress on the surrounding rock of the vault was, and the change in width–span ratio had less influence on other parts of the tunnel.
Author Contributions
Funding
Data Availability Statement
Acknowledgments
Conflicts of Interest
References
- Chen, Z.L.; Chen, J.Y.; Liu, H.; Zhang, Z.F. Present status and development trends of underground space in Chinese cities: Evaluation and analysis. Tunn. Undergr. Space Technol. 2018, 71, 253–270. [Google Scholar] [CrossRef]
- Cui, J.Q.; Broere, W.; Lin, D. Underground space utilisation for urban renewal. Tunn. Undergr. Space Technol. 2021, 108, 103726. [Google Scholar] [CrossRef]
- Valipour, A.; Yadollahi, M.; Mohamad, Z.R. An enhanced multi-objective optimization approach for risk allocation. Can. J. Civ. Eng. 2013, 41, 164–177. [Google Scholar]
- Liu, D.; Gao, W.; Sun, B.; Liu, D.; Zhou, S. Numerical simulation of blasting vibration on existing tunnel extension. Rock Soil Mech. 2016, 37, 3011–3016. [Google Scholar]
- Lai, H.; Xu, X.; Chang, R.; Xie, Y. Study on mechanical characteristics of highway tunnel expansion. China J. Highw. Transp. 2014, 27, 84–93. [Google Scholar]
- Lin, Z. Stability analysis for large-span highway tunnel by side-expand excavation. J. Railw. Sci. Eng. 2009, 6, 46–50. [Google Scholar]
- Zhang, M. Numerical Analysis for Dynamic Response of In Situ Blasting Expansion of Large Cross-Section Tunnel with Small Net Distance. Adv. Civ. Eng. 2021, 2021, 2896782. [Google Scholar] [CrossRef]
- Sun, X.; Dong, H.; Su, X.; Ai, X. 3D finite element analysis on mechanical characteristics of surrounding rocks of expansion project: A case study on houci tunnel on Zhangzhou-Longyan highway. Tunn. Constr. 2016, 36, 53–57. [Google Scholar]
- Jia, Y.; Ouyang, A.; Wang, S.; Liang, X.; Wang, B.; Liu, C.; Ye, F. Development and Application of Model Test System for Reconstruction and Expansion of Existing Shallow Single-Hole Tunnel into Twin-Arch Tunnel. Adv. Civ. Eng. 2021, 2021, 6656165. [Google Scholar] [CrossRef]
- Jia, Y.; Xia, Y.X.; De Chen, X.; Zhou, Y.D.; Han, X.B.; Zhou, S.W. Force and deformation characteristics during the reconstruction and expansion of shallow single-tube tunnels into large-span multiarch tunnels. Adv. Mater. Sci. Eng. 2019, 2019, 2783784. [Google Scholar] [CrossRef] [Green Version]
- Li, Y.; Jin, X.; Lv, Z.; Dong, J.; Guo, J. Deformation and mechanical characteristics of tunnel lining in tunnel intersection between subway station tunnel and construction tunnel. Tunn. Undergr. Space Technol. 2016, 56, 22–33. [Google Scholar] [CrossRef]
- Hsiao, F.Y.; Wang, C.L.; Chern, J.C. Numerical simulation of rock deformation for support design in tunnel intersection area. Tunn. Undergr. Space Technol. 2009, 24, 14–21. [Google Scholar] [CrossRef]
- Yixiong, H.; Ning, L.; Baoshun, S.; Bo, W.; Chengyong, C. Construction of Multiple Intersections of Tunnel Structures in Limestone and Mudstone Sections: A Case Study. Arab. J. Sci. Eng. 2022, 47, 1–21. [Google Scholar] [CrossRef]
- Zhang, Z.Q.; Xu, J.; Wan, X.Y. Study on tunnel construction mechanics at intersection of horizontal adit and major tunnel in highway. Rock Soil Mech. 2007, 28, 247–252. [Google Scholar]
- Xie, B.; Han, Y.; Huang, H.; Chen, L.; Zhou, Y.; Fan, C. Numerical study of natural ventilation in urban shallow tunnels: Impact of shaft cross section. Sustain. Cities Soc. 2018, 42, 521–537. [Google Scholar] [CrossRef]
- Ji, J.; Han, J.Y.; Fan, C.G.; Gao, Z.H.; Sun, J.H. Influence of cross-sectional area and aspect ratio of shaft on natural ventilation in urban road tunnel. Int. J. Heat Mass Transf. 2013, 67, 420–431. [Google Scholar] [CrossRef]
- Fan, C.G.; Ji, J.; Wang, W.; Sun, J.H. Effects of vertical shaft arrangement on natural ventilation performance during tunnel fires. International. J. Heat Mass Transf. 2014, 73, 158–169. [Google Scholar] [CrossRef]
- Zhou, Y.; Yang, Y.; Mao, Z.; Bu, R.; Gong, J.; Wang, Y. Analytical and numerical study on natural ventilation performance in single- and gable-slope city tunnels. Sustain. Cities Soc. 2019, 45, 258–270. [Google Scholar] [CrossRef]
- Yao, Y.; Zhang, S.; Shi, L.; Cheng, X. Effects of shaft inclination angle on the capacity of smoke exhaust under tunnel fire. Indoor Built Environ. 2017, 28, 77–87. [Google Scholar] [CrossRef]
- Li, Y.; Peng, L.; Lei, M. Research progress in the design and construction technology of crossing tunnels. J. Railw. Sci. Eng. 2014, 11, 67–73. [Google Scholar]
- Guo, X.; Wang, Z.; Geng, P.; Chen, C.; Zhang, J. Ground surface settlement response to subway station construction activities using pile-beam-arch method. Tunn. Undergr. Space Technol. 2021, 108, 103729. [Google Scholar] [CrossRef]
- Yu, C.; Ding, W.; Zhang, Q. Research on a calculation method for the damage evaluation of the existing urban tunnel lining structure. Mod. Tunn. Technol. 2018, 55, 11–18. [Google Scholar]


| Name | Elastic Modulus E/MPa | Poisson’s Ratio μ | Weight γ/(kN/m3) | Cohesion c/kPa | Friction Angle φ/º |
|---|---|---|---|---|---|
| coarse gravel soil | 40 | 0.3 | 19 | 15 | 20 |
| fully weathered argillaceous sandstone | 400 | 0.3 | 19.9 | 50 | 21 |
| strongly weathered argillaceous sandstone | 520 | 0.28 | 21.2 | 60 | 26 |
| weakly weathered argillaceous sandstone | 1000 | 0.24 | 22.2 | 150 | 35 |
| Name | Elastic Modulus E/GPa | Poisson’s Ratio μ | Weight γ/(kN/m3) | Diameter d/mm | Thickness t/mm |
|---|---|---|---|---|---|
| original existing lining | 15.6 | 0.27 | 25 | - | 400 |
| shaft lining | 20 | 0.27 | 22 | - | 300 |
| initial lining | 28 | 0.17 | 24.5 | - | 200 |
| anchor of expanded tunnel | 83.8 | 0.3 | 78 | 25 | - |
| Shaft Depth | Maximum Principal Stress | Location | Minimum Principal Stress | Location |
|---|---|---|---|---|
| 9 m | 0.10 | vault | −0.53 | corner |
| 19 m | 0.08 | vault | −0.94 | corner |
| 29 m | 0.08 | vault | −1.67 | corner |
| 39 m | −0.03 | vault | −1.72 | corner |
| w/s | Maximum Principal Stress | Location | Minimum Principal Stress | Location |
|---|---|---|---|---|
| 0.3 | 0.021 | vault | −1.212 | corner |
| 0.4 | 0.024 | vault | −1.212 | corner |
| 0.5 | 0.043 | vault | −1.233 | corner |
| 0.6 | 0.043 | vault | −1.272 | corner |
Disclaimer/Publisher’s Note: The statements, opinions and data contained in all publications are solely those of the individual author(s) and contributor(s) and not of MDPI and/or the editor(s). MDPI and/or the editor(s) disclaim responsibility for any injury to people or property resulting from any ideas, methods, instructions or products referred to in the content. |
© 2023 by the authors. Licensee MDPI, Basel, Switzerland. This article is an open access article distributed under the terms and conditions of the Creative Commons Attribution (CC BY) license (https://creativecommons.org/licenses/by/4.0/).
Share and Cite
Dong, J.; Wang, X.; Bai, Q.; Zhao, W. Influence of Underground Excavation Expansion on Surrounding Rock Characteristics at Intersection of Ventilation Shaft and Tunnel: A Case Study. Buildings 2023, 13, 388. https://doi.org/10.3390/buildings13020388
Dong J, Wang X, Bai Q, Zhao W. Influence of Underground Excavation Expansion on Surrounding Rock Characteristics at Intersection of Ventilation Shaft and Tunnel: A Case Study. Buildings. 2023; 13(2):388. https://doi.org/10.3390/buildings13020388
Chicago/Turabian StyleDong, Jiachao, Xin Wang, Qian Bai, and Wen Zhao. 2023. "Influence of Underground Excavation Expansion on Surrounding Rock Characteristics at Intersection of Ventilation Shaft and Tunnel: A Case Study" Buildings 13, no. 2: 388. https://doi.org/10.3390/buildings13020388