
Investigation of an Empirical Creep Constitutive Model of Changsha Red Loam


Abstract
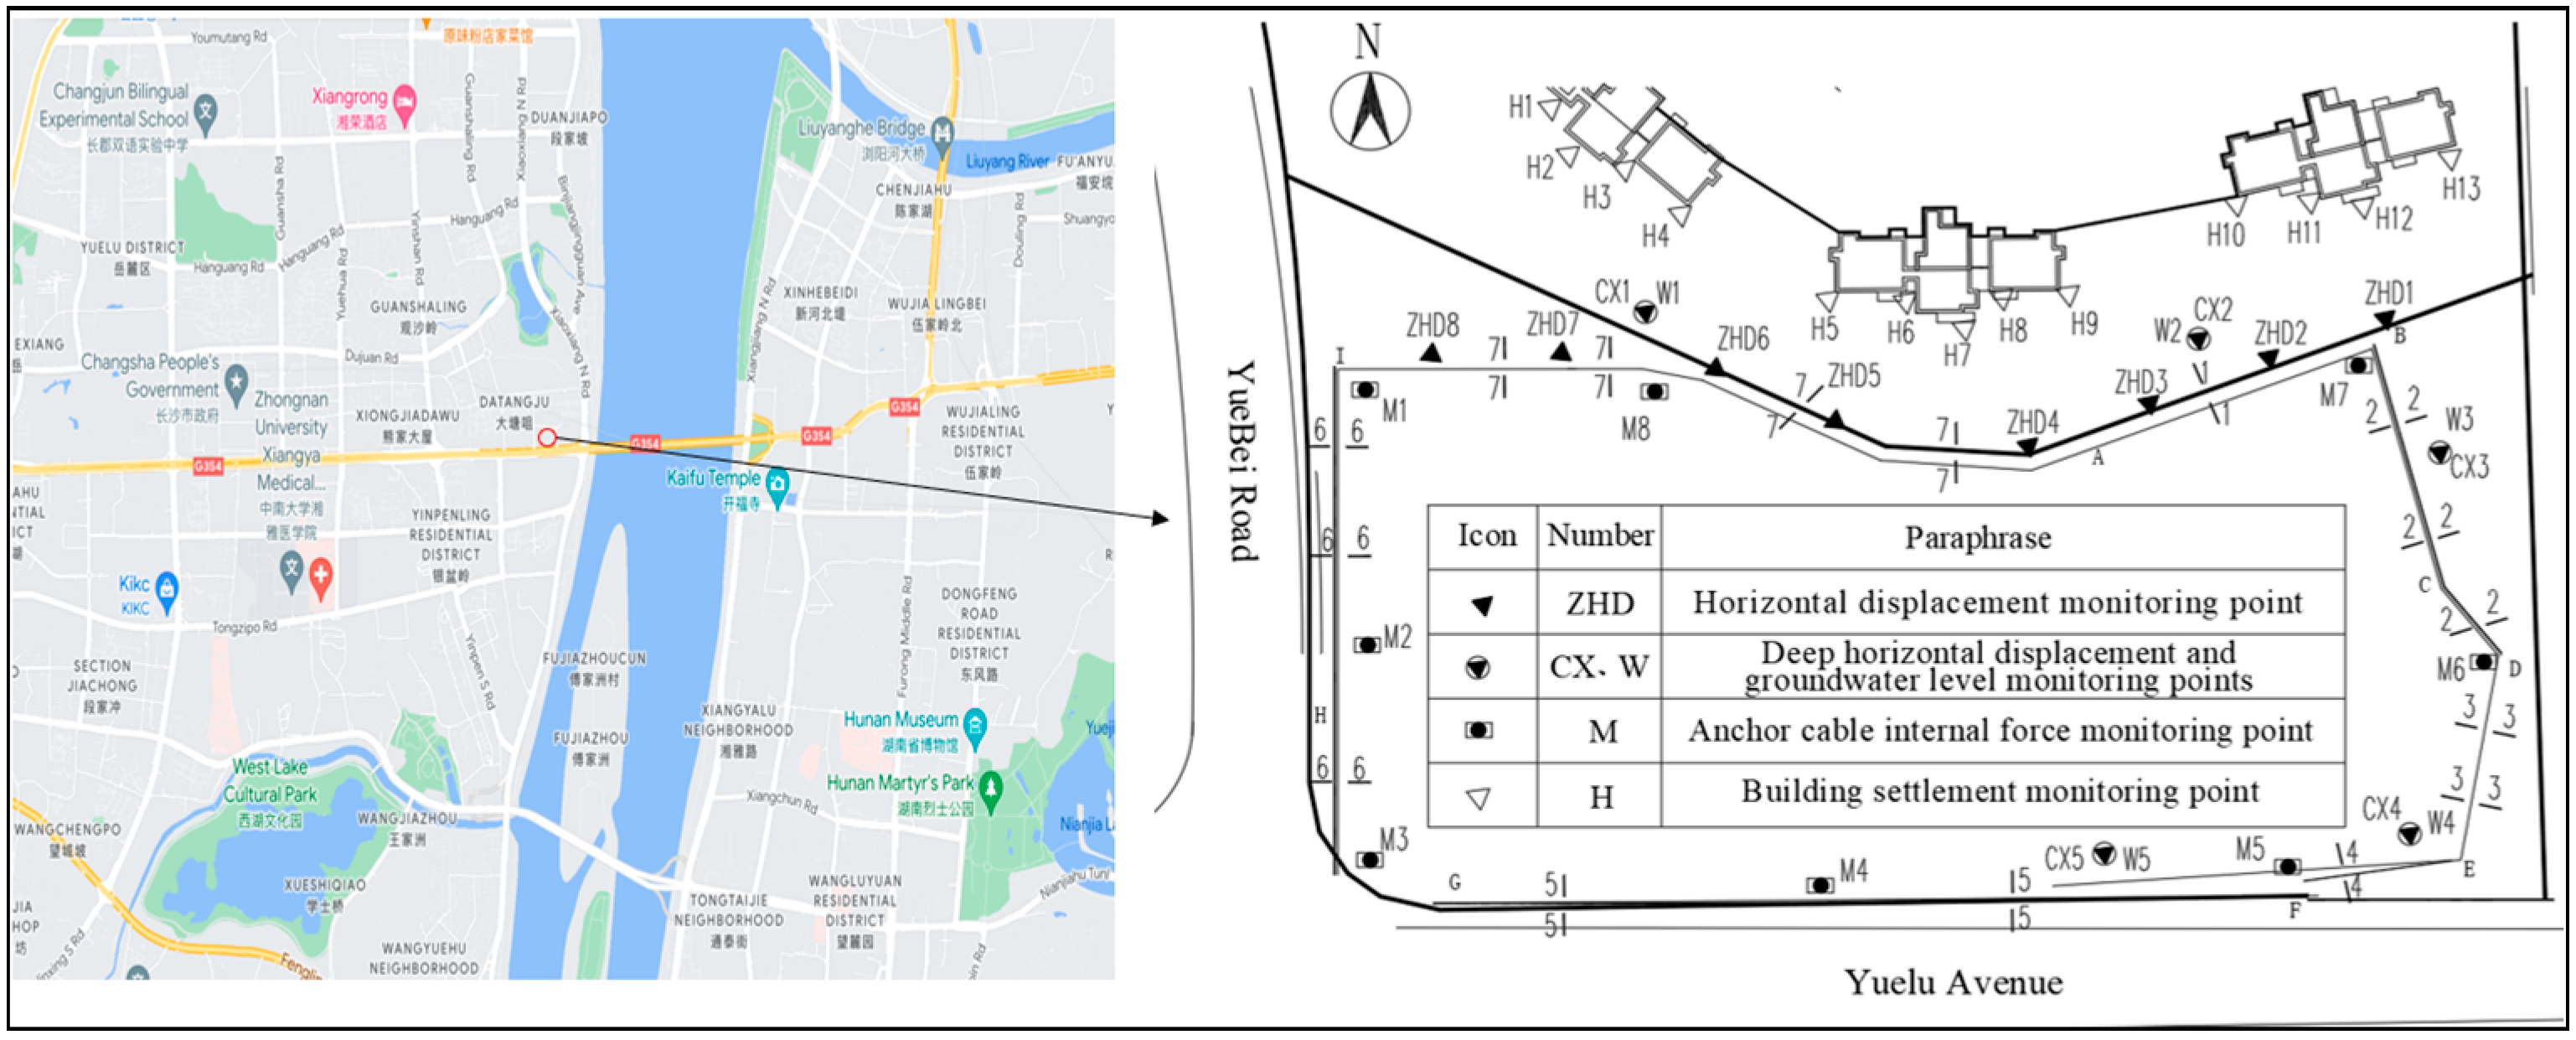
:1. Introduction
2. Consolidation Creep Test of Changsha Red Loam
2.1. Test Sample
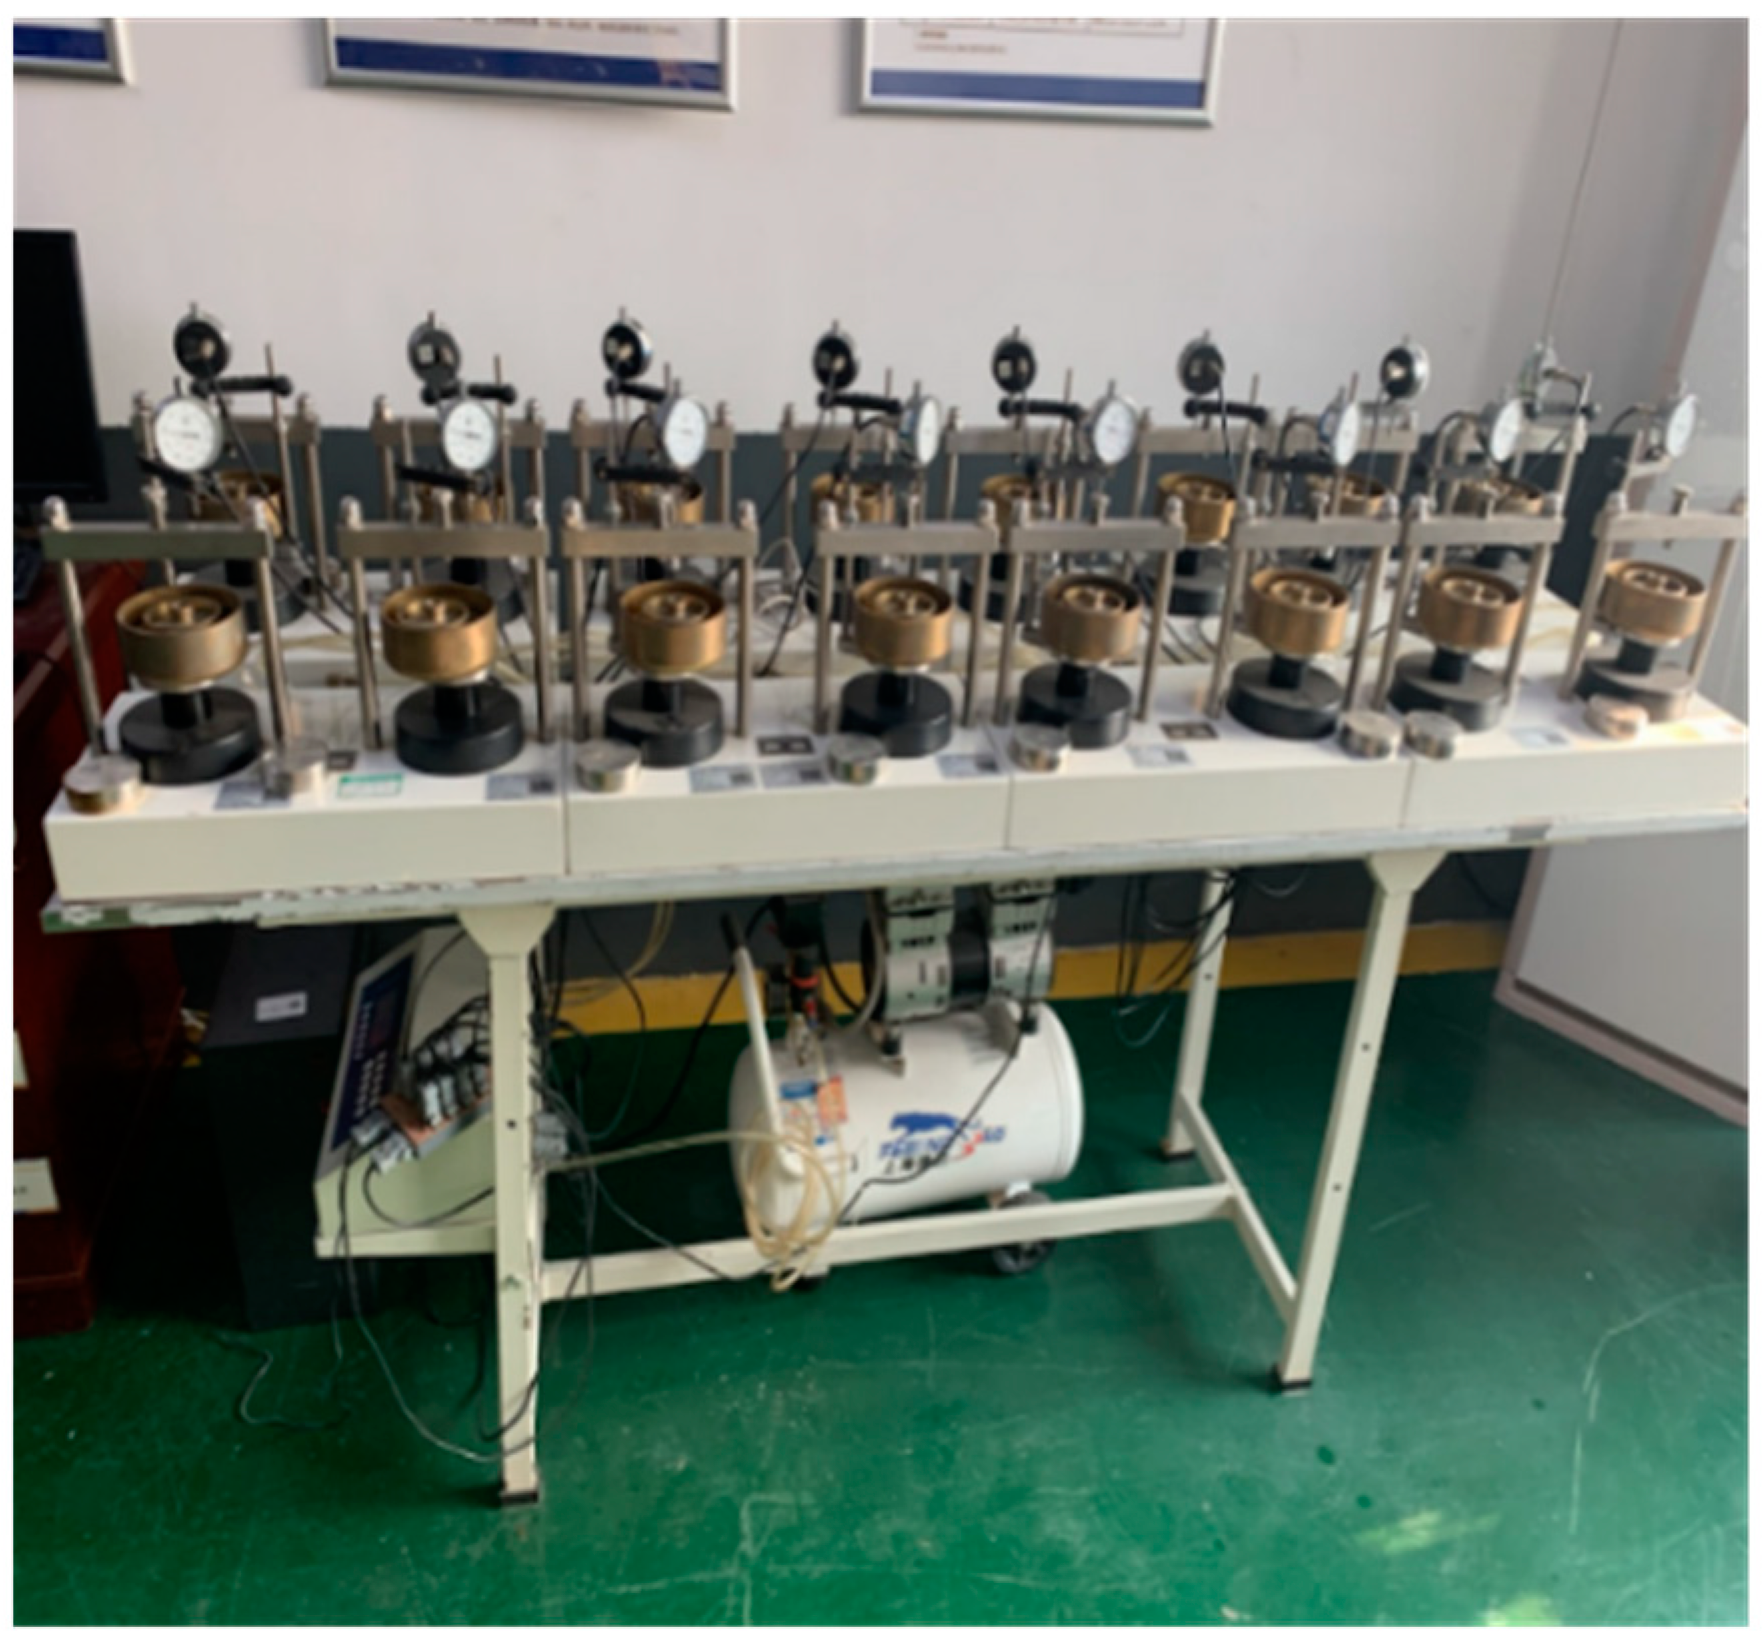
2.2. Test Instrument
2.3. Testing Program
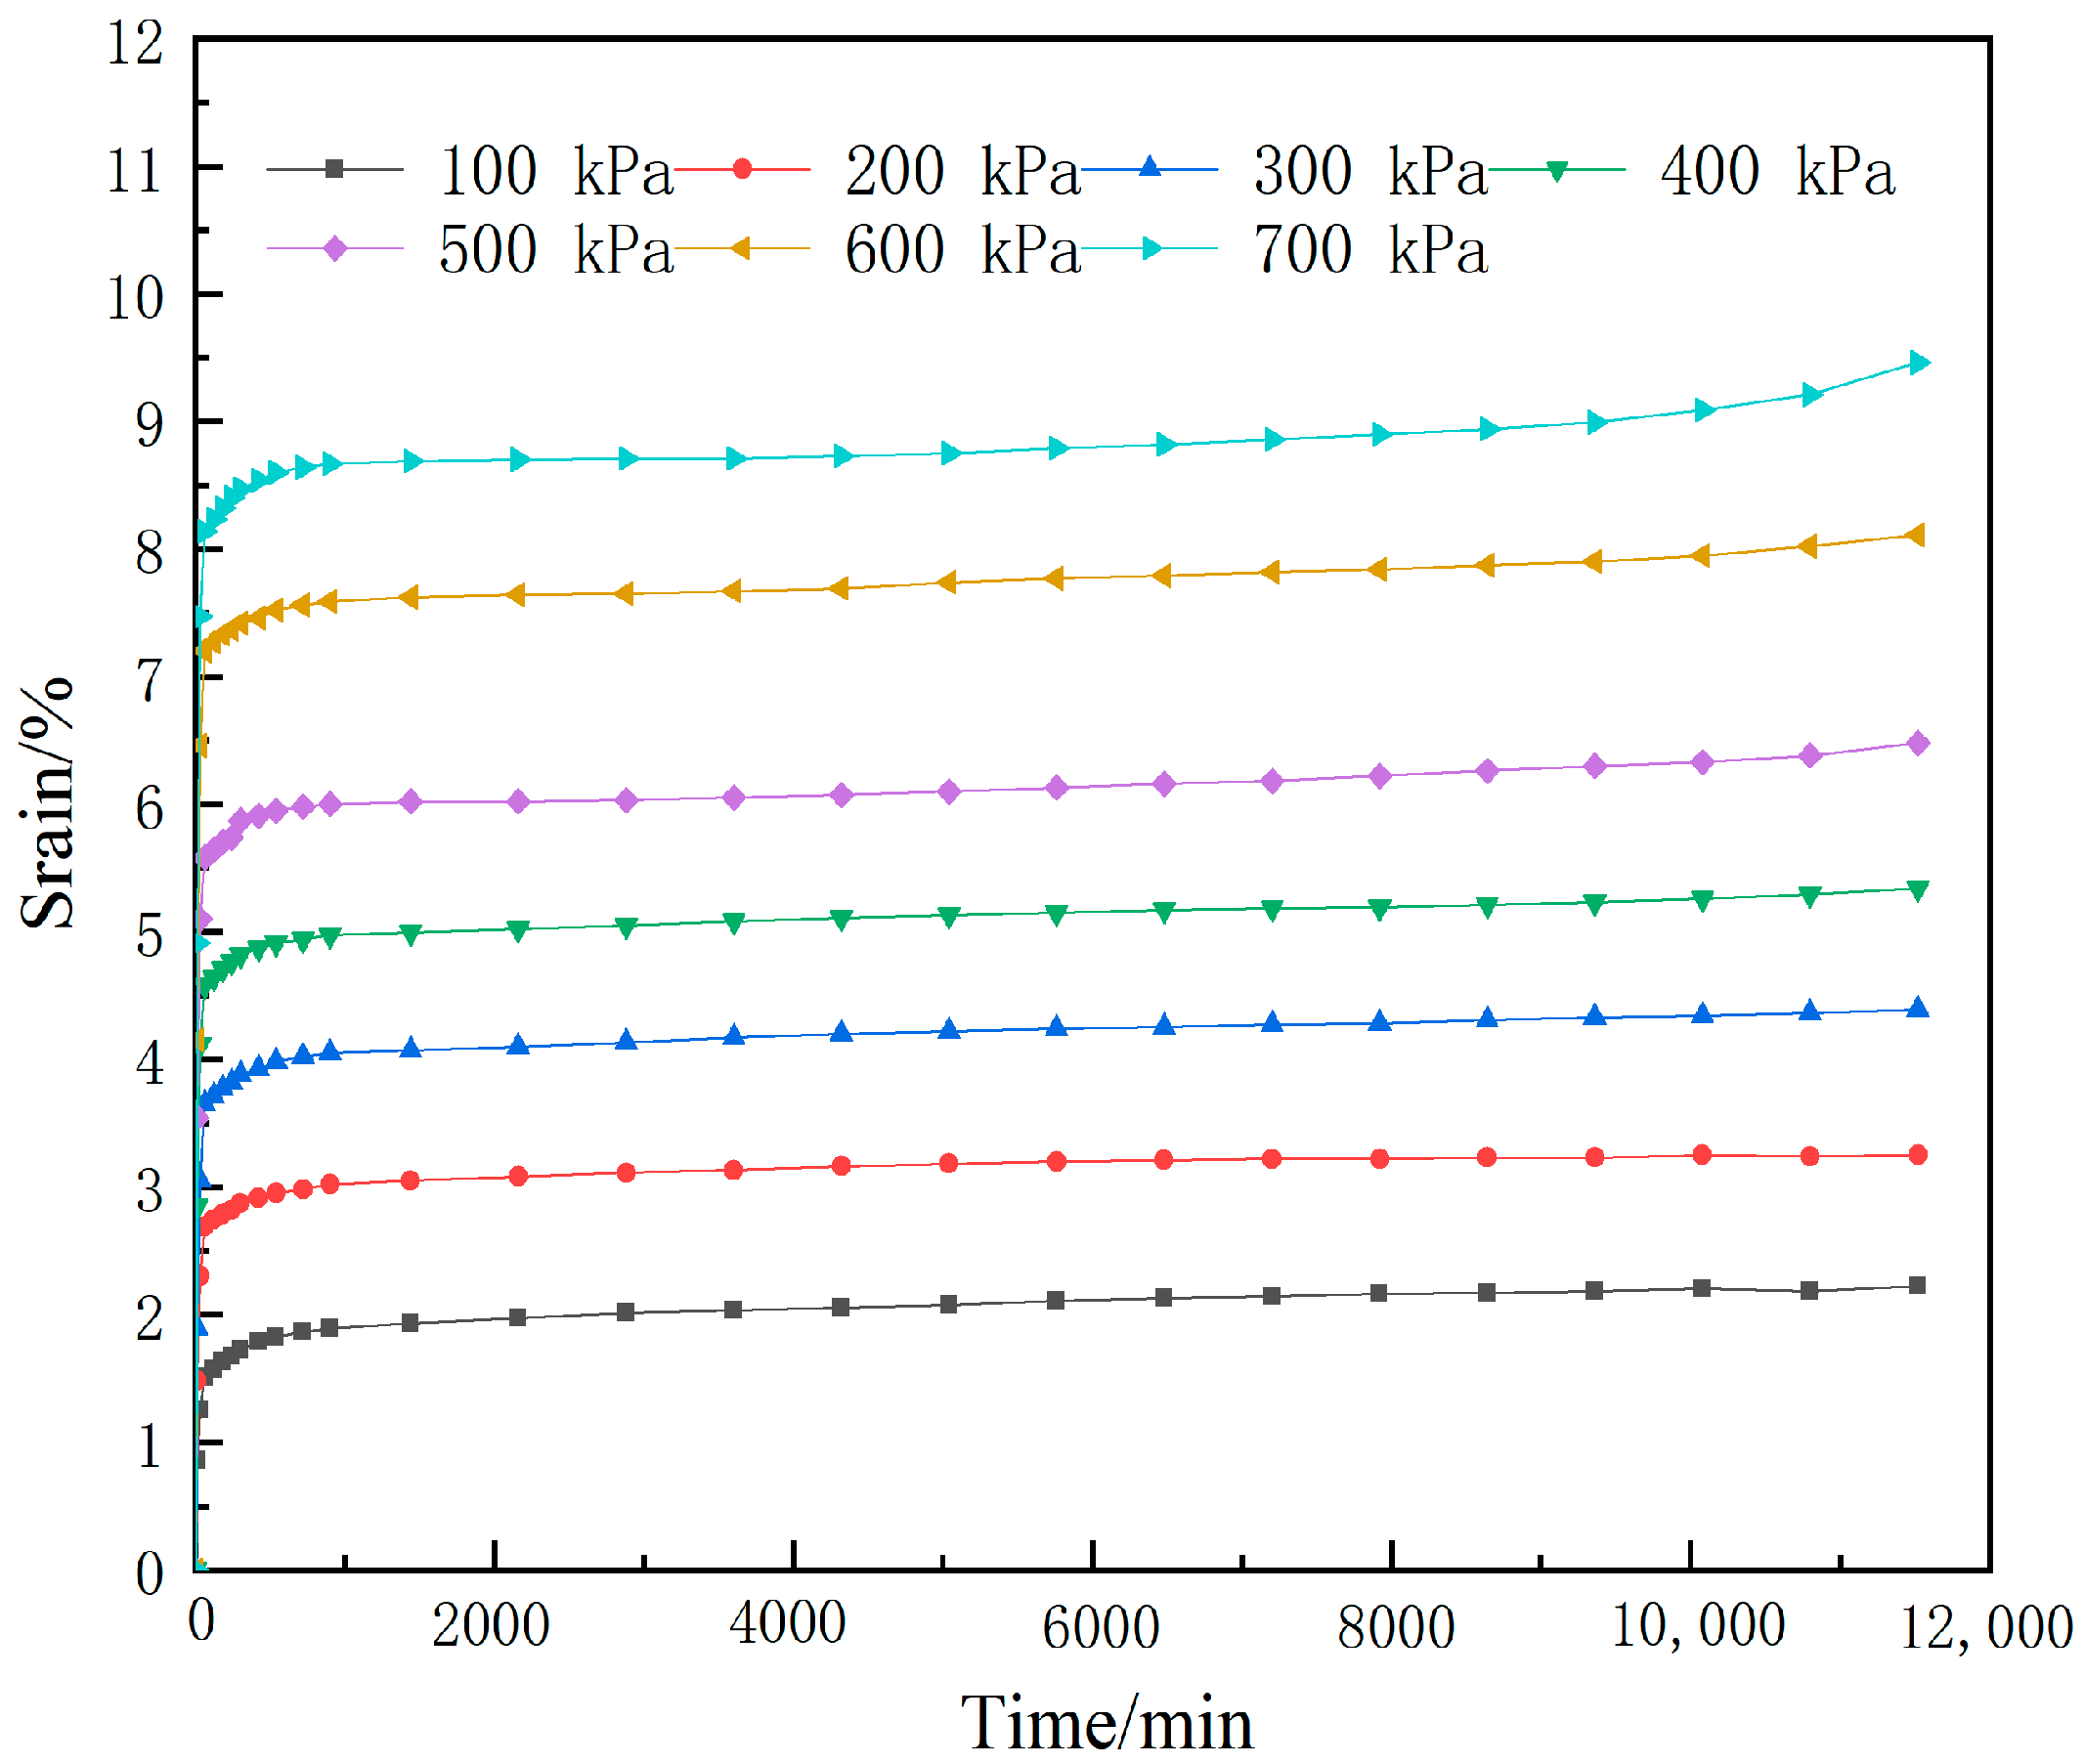
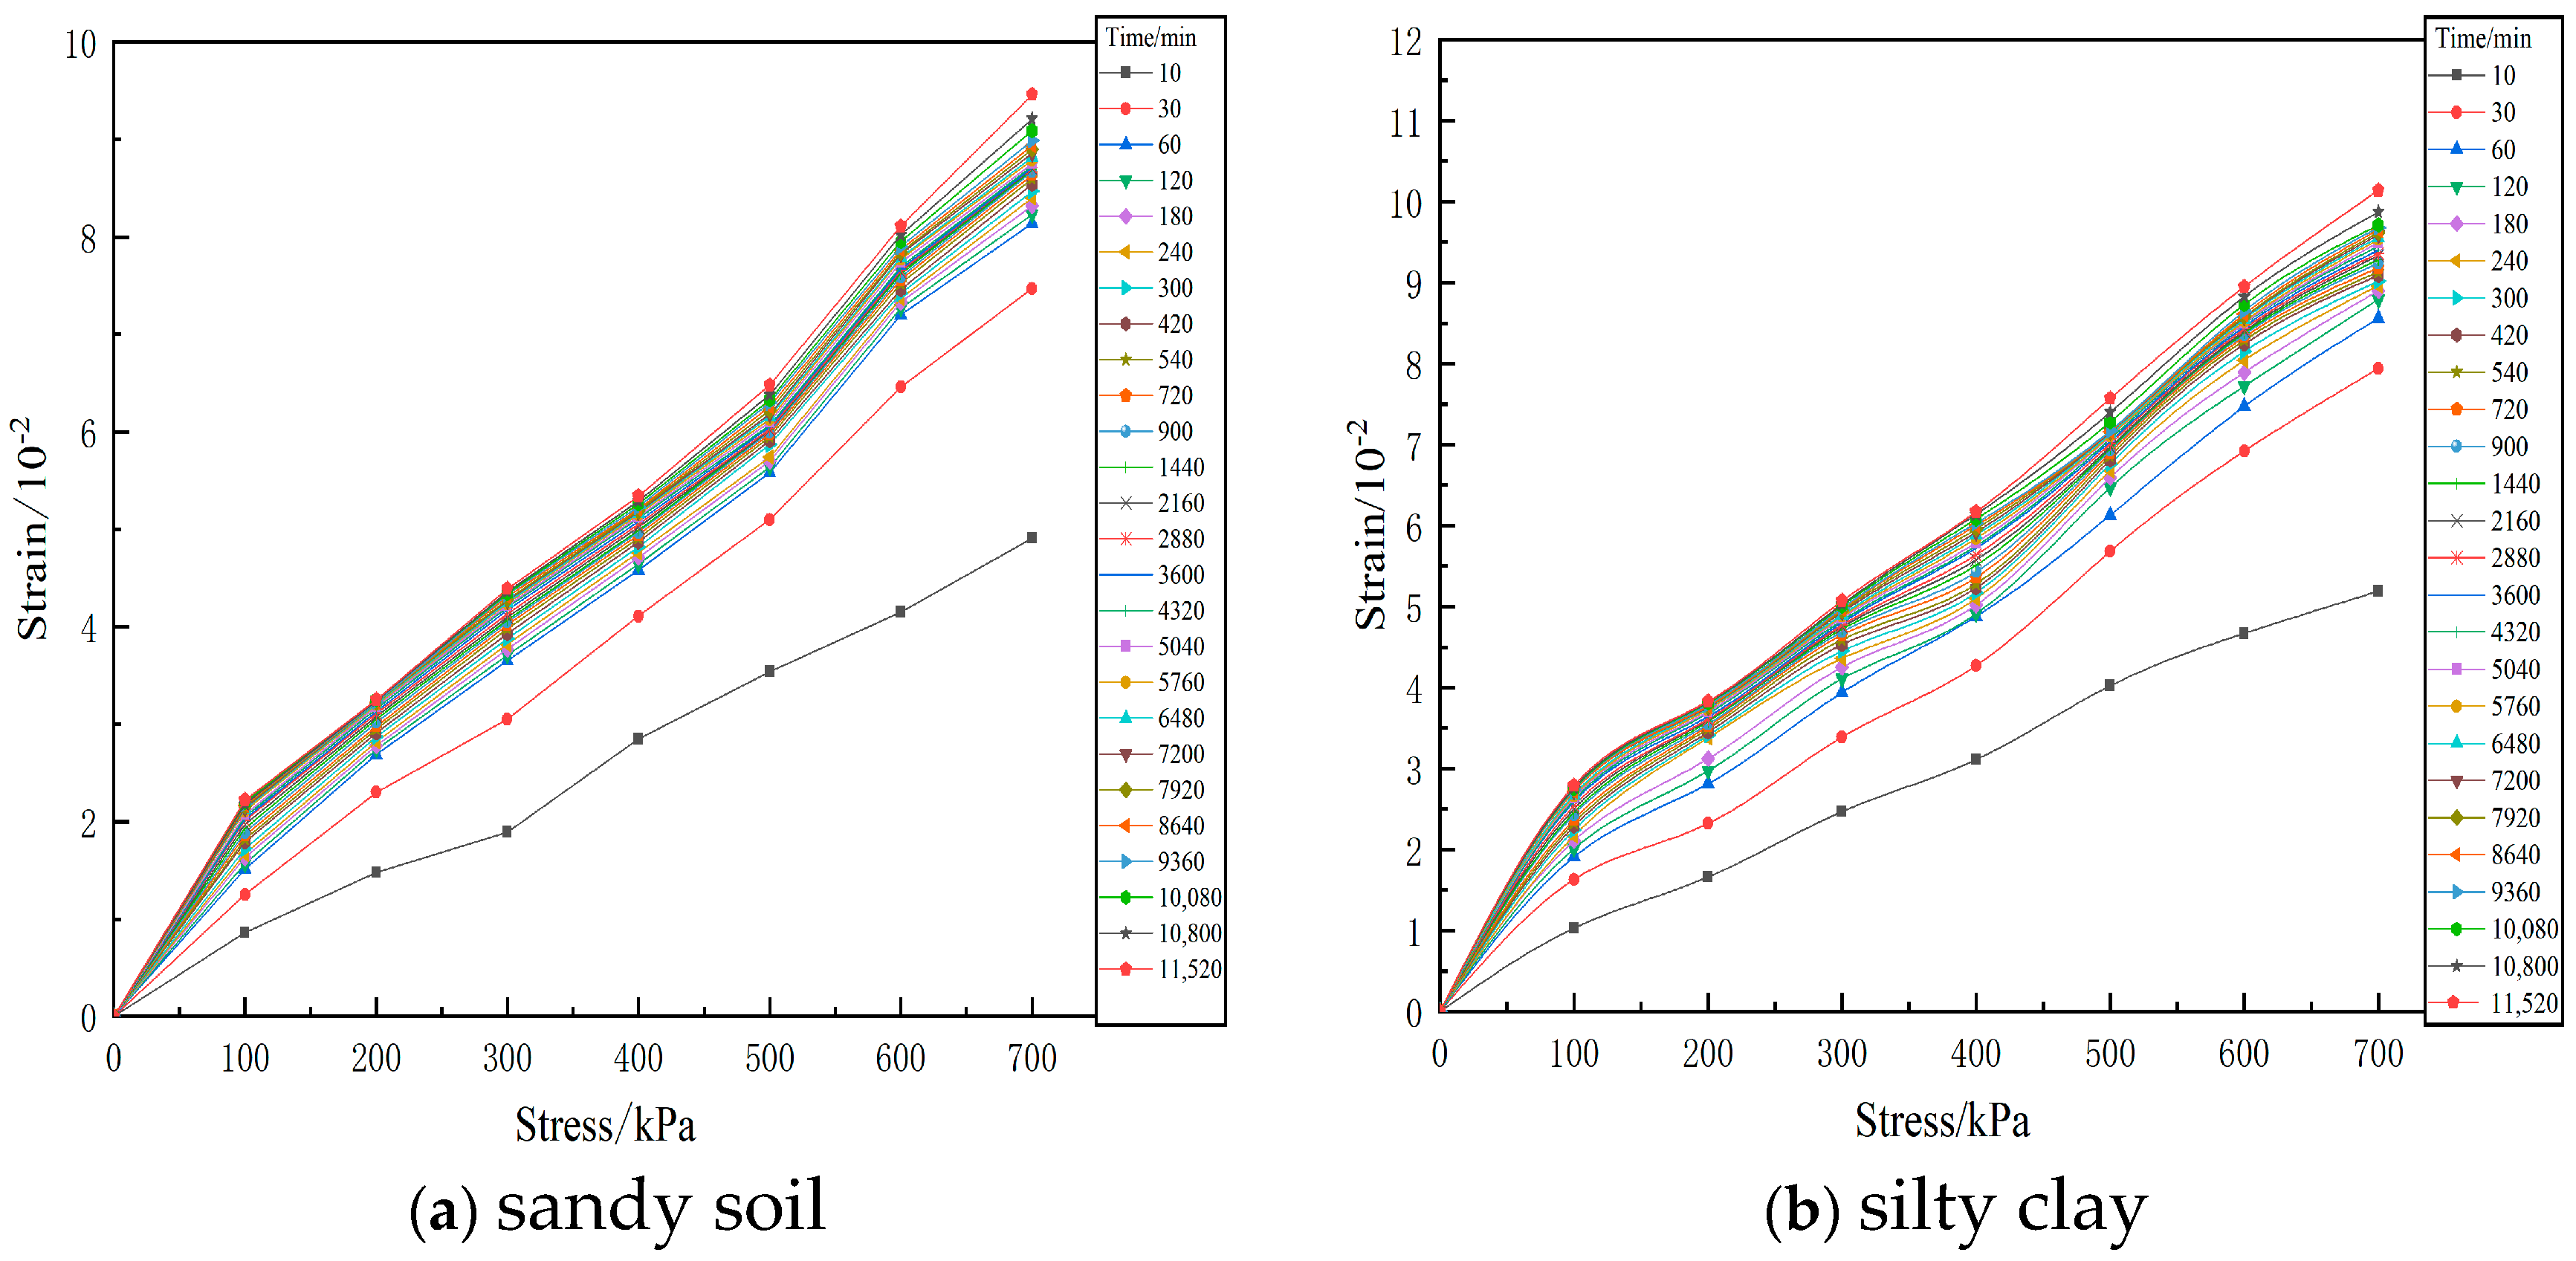
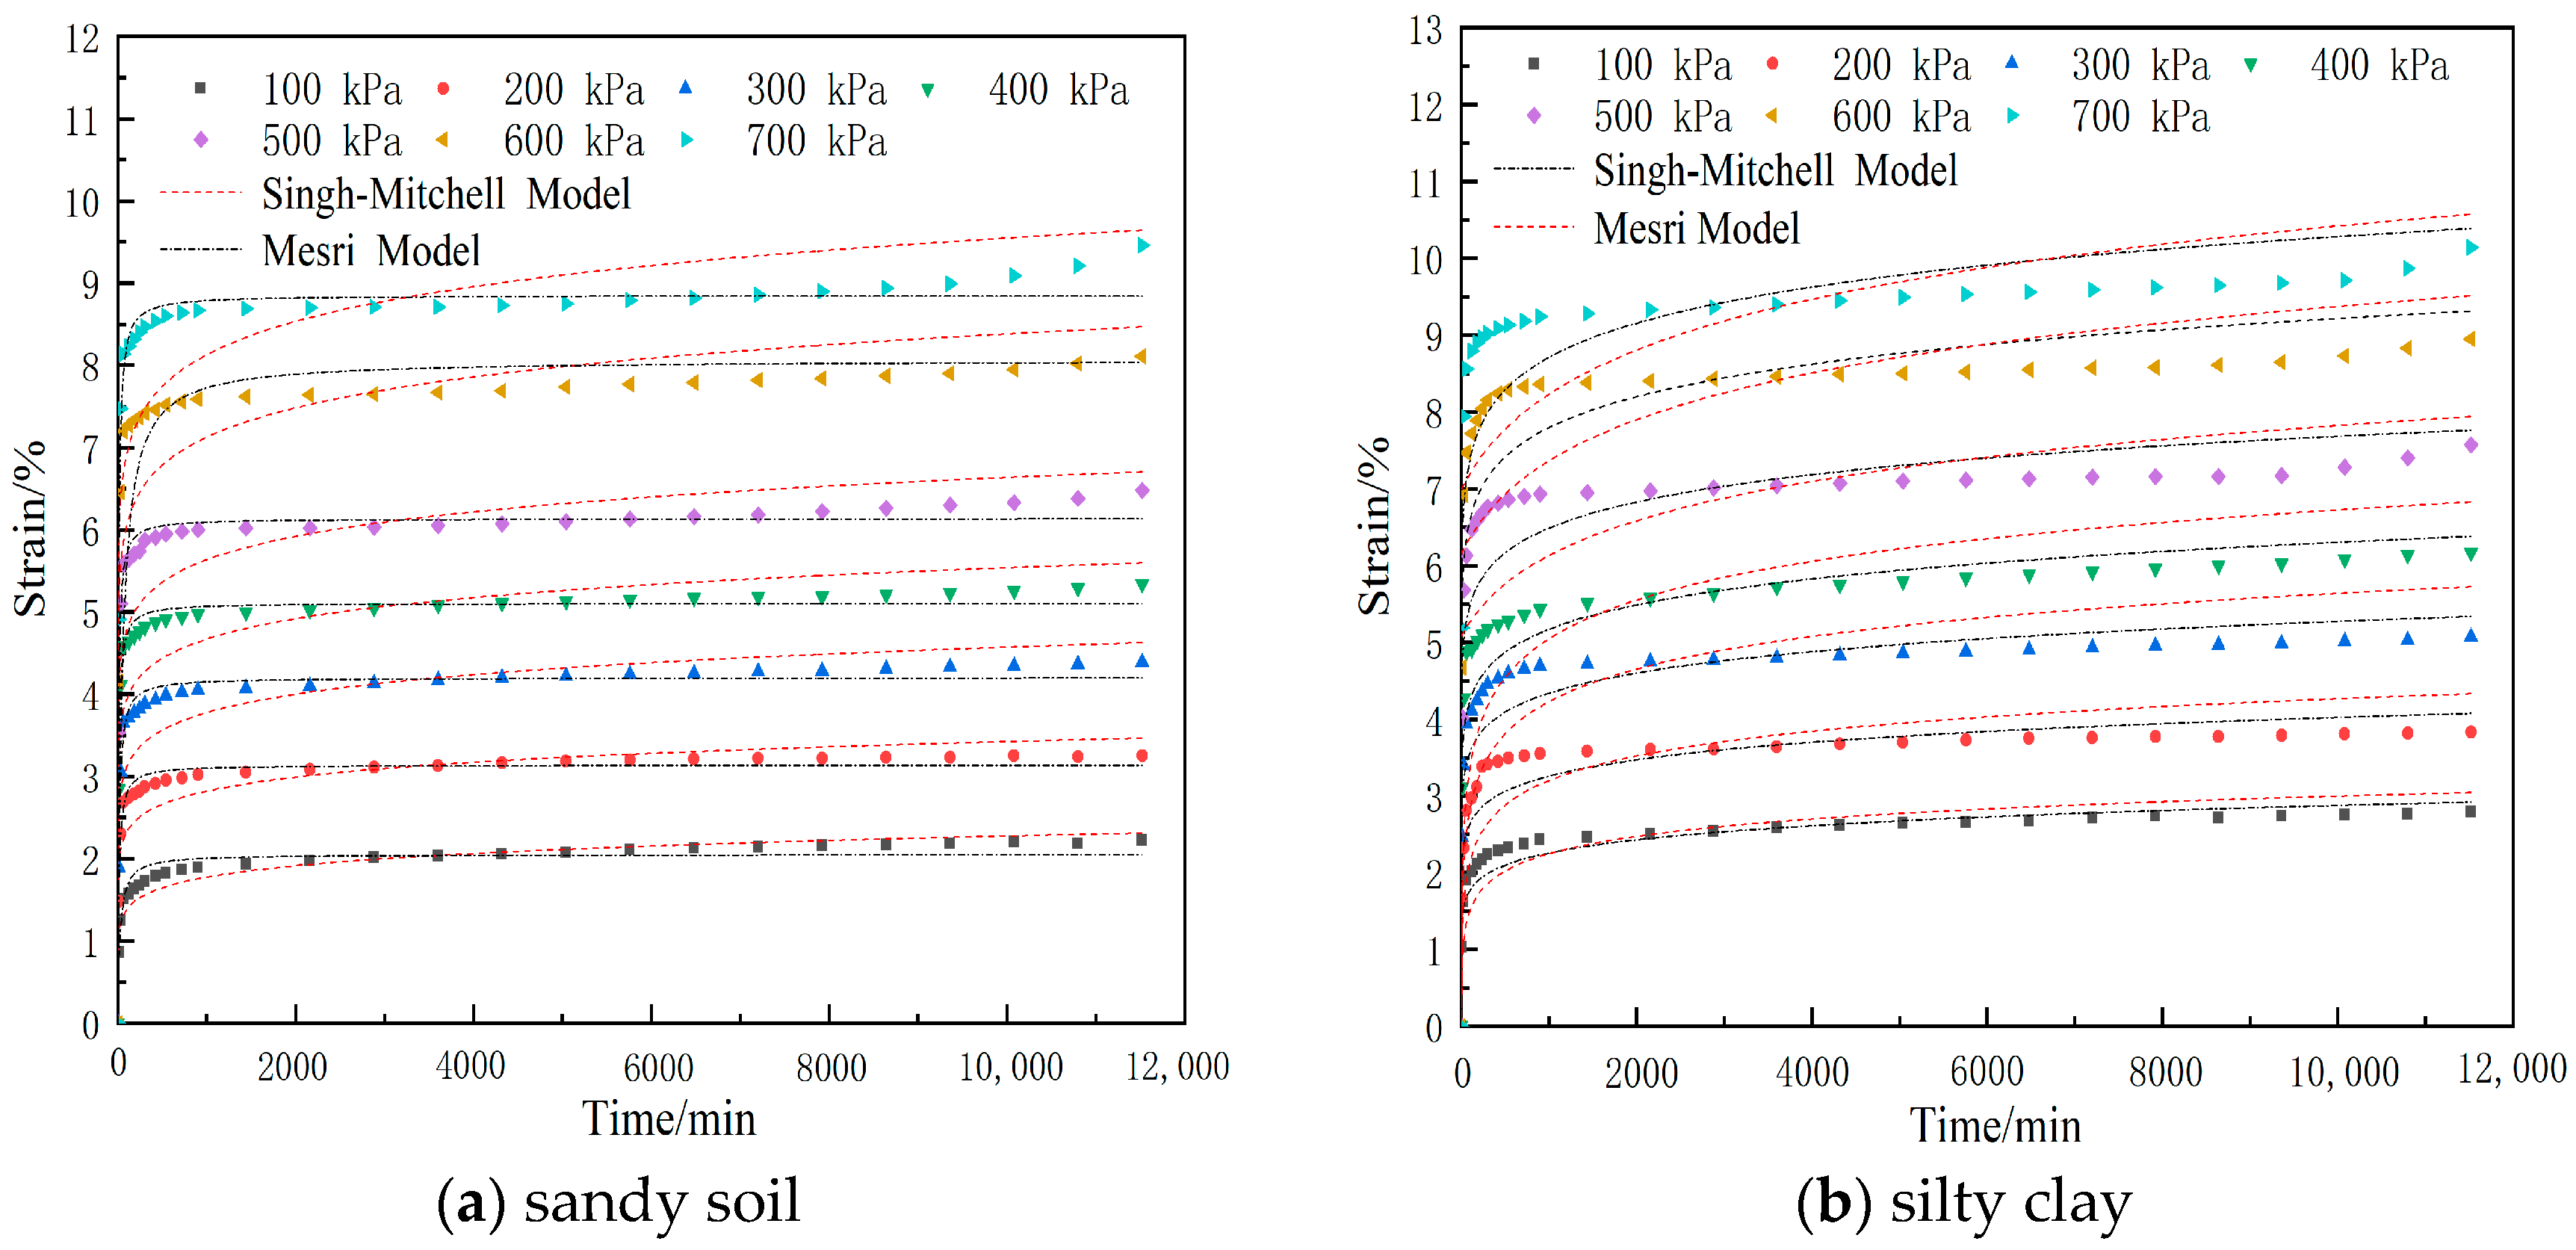
2.4. Experimental Results and Analysis
3. Empirical Creep Model Theory
4. Establishment of Empirical Creep Constitutive Model
- (1)
- Strain–time relationship
- (2)
- Stress–strain relationship
- (3)
- Stress–strain–time relationship
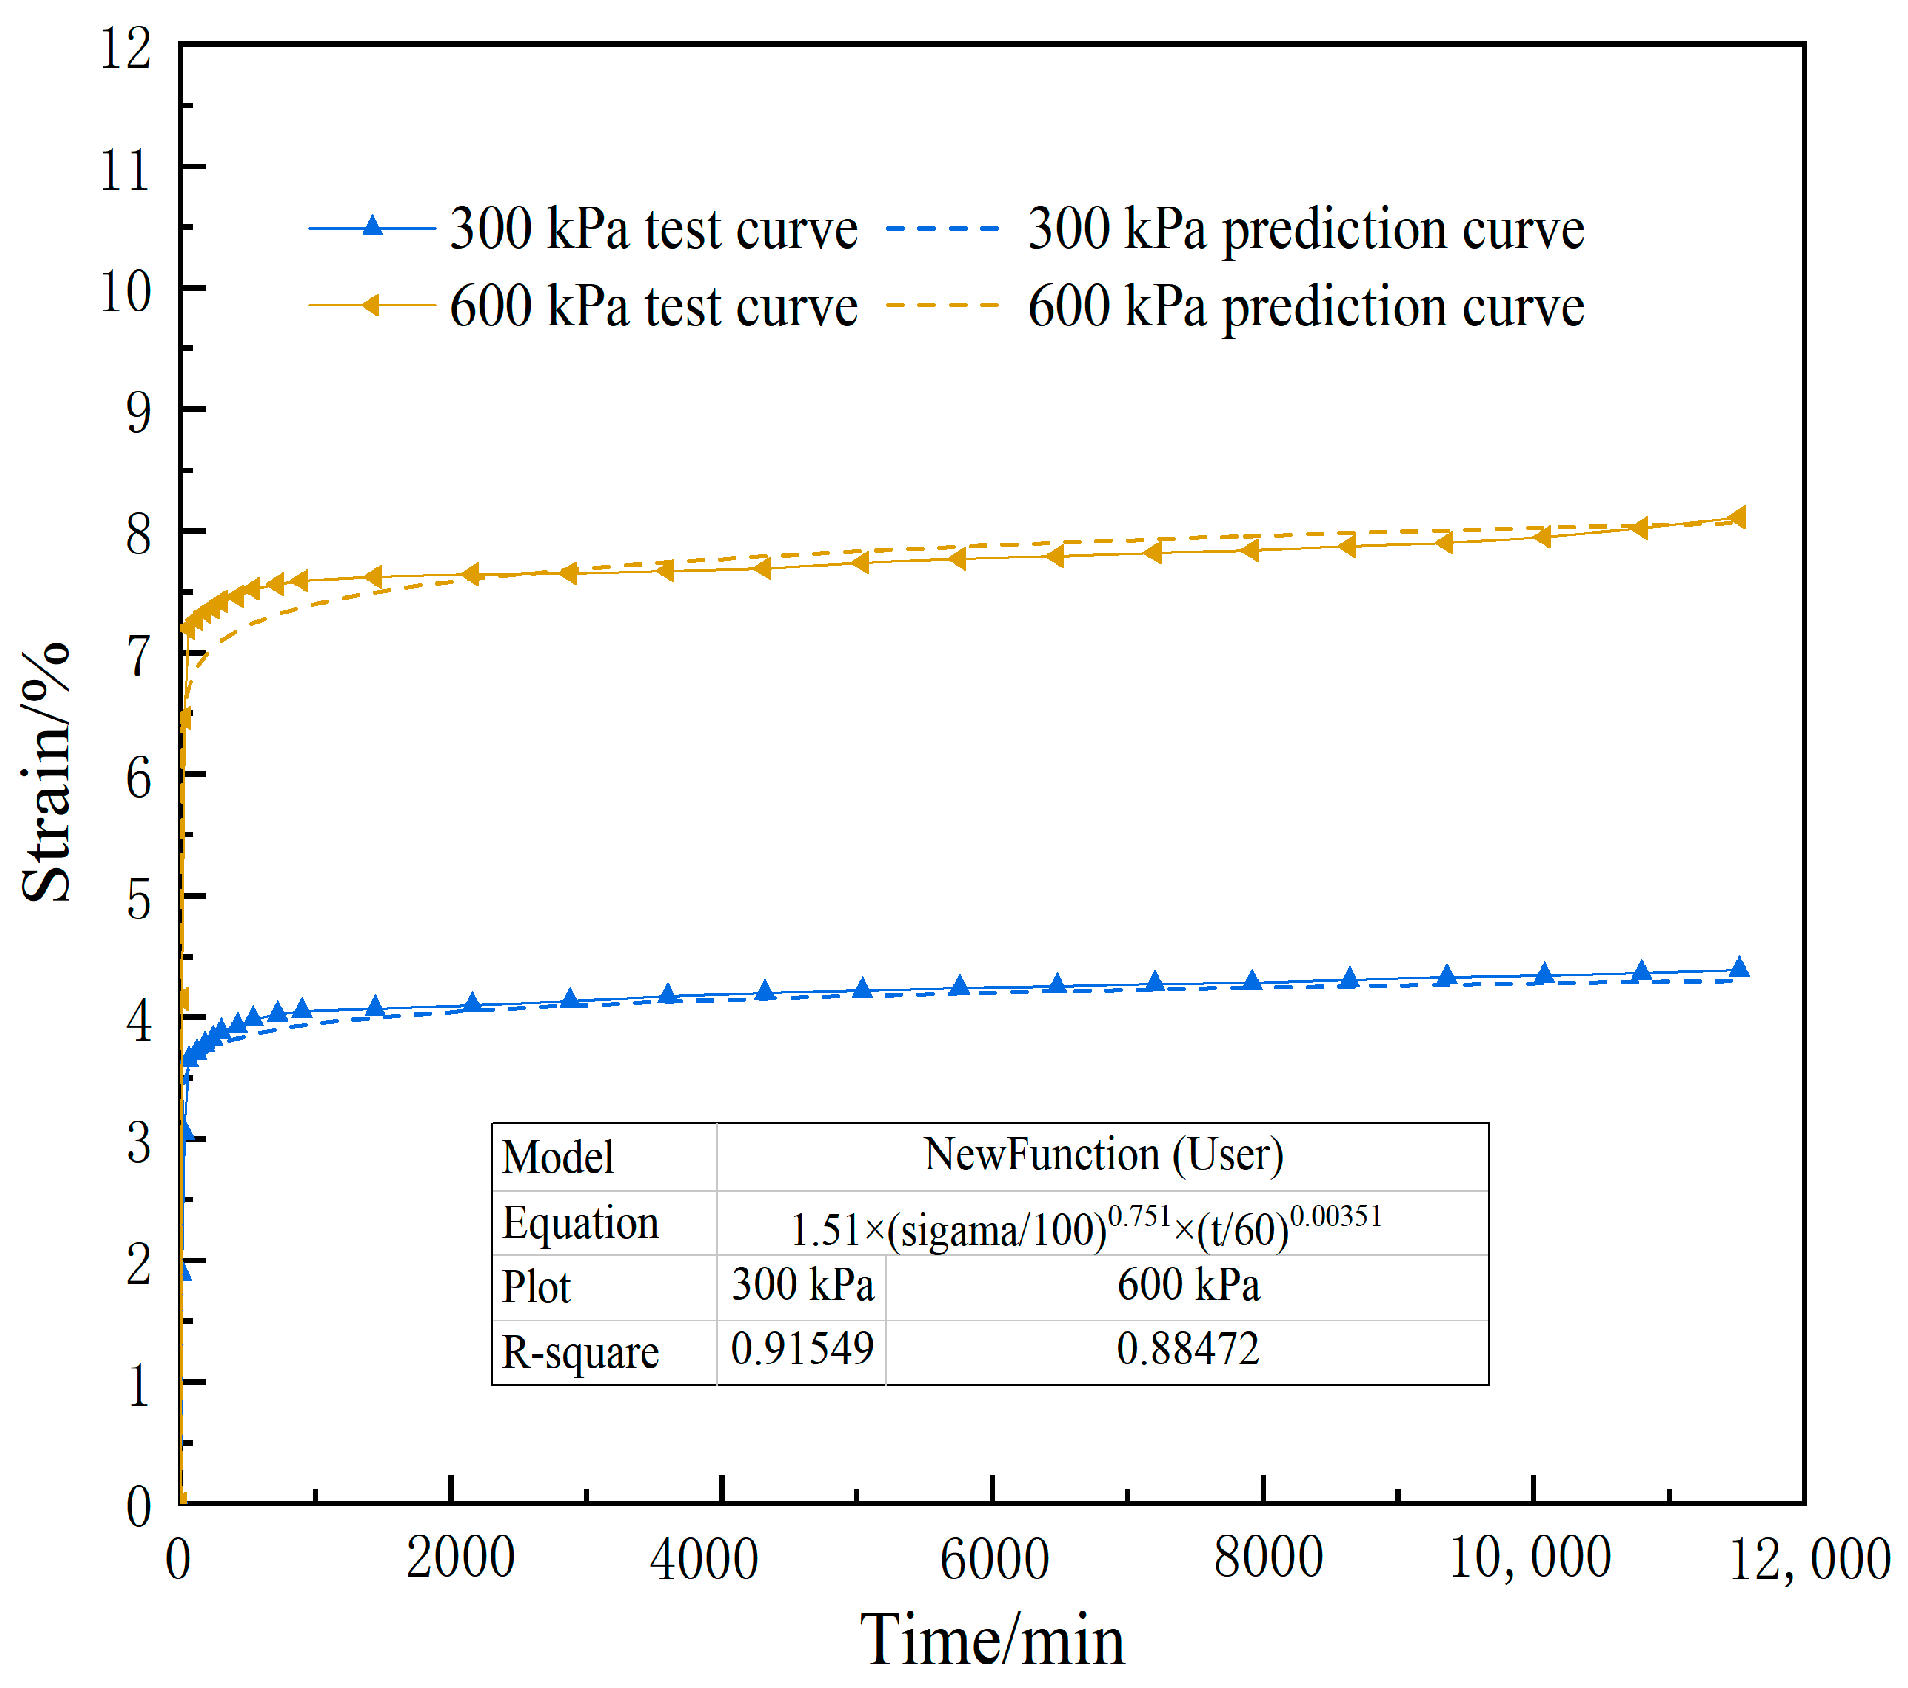
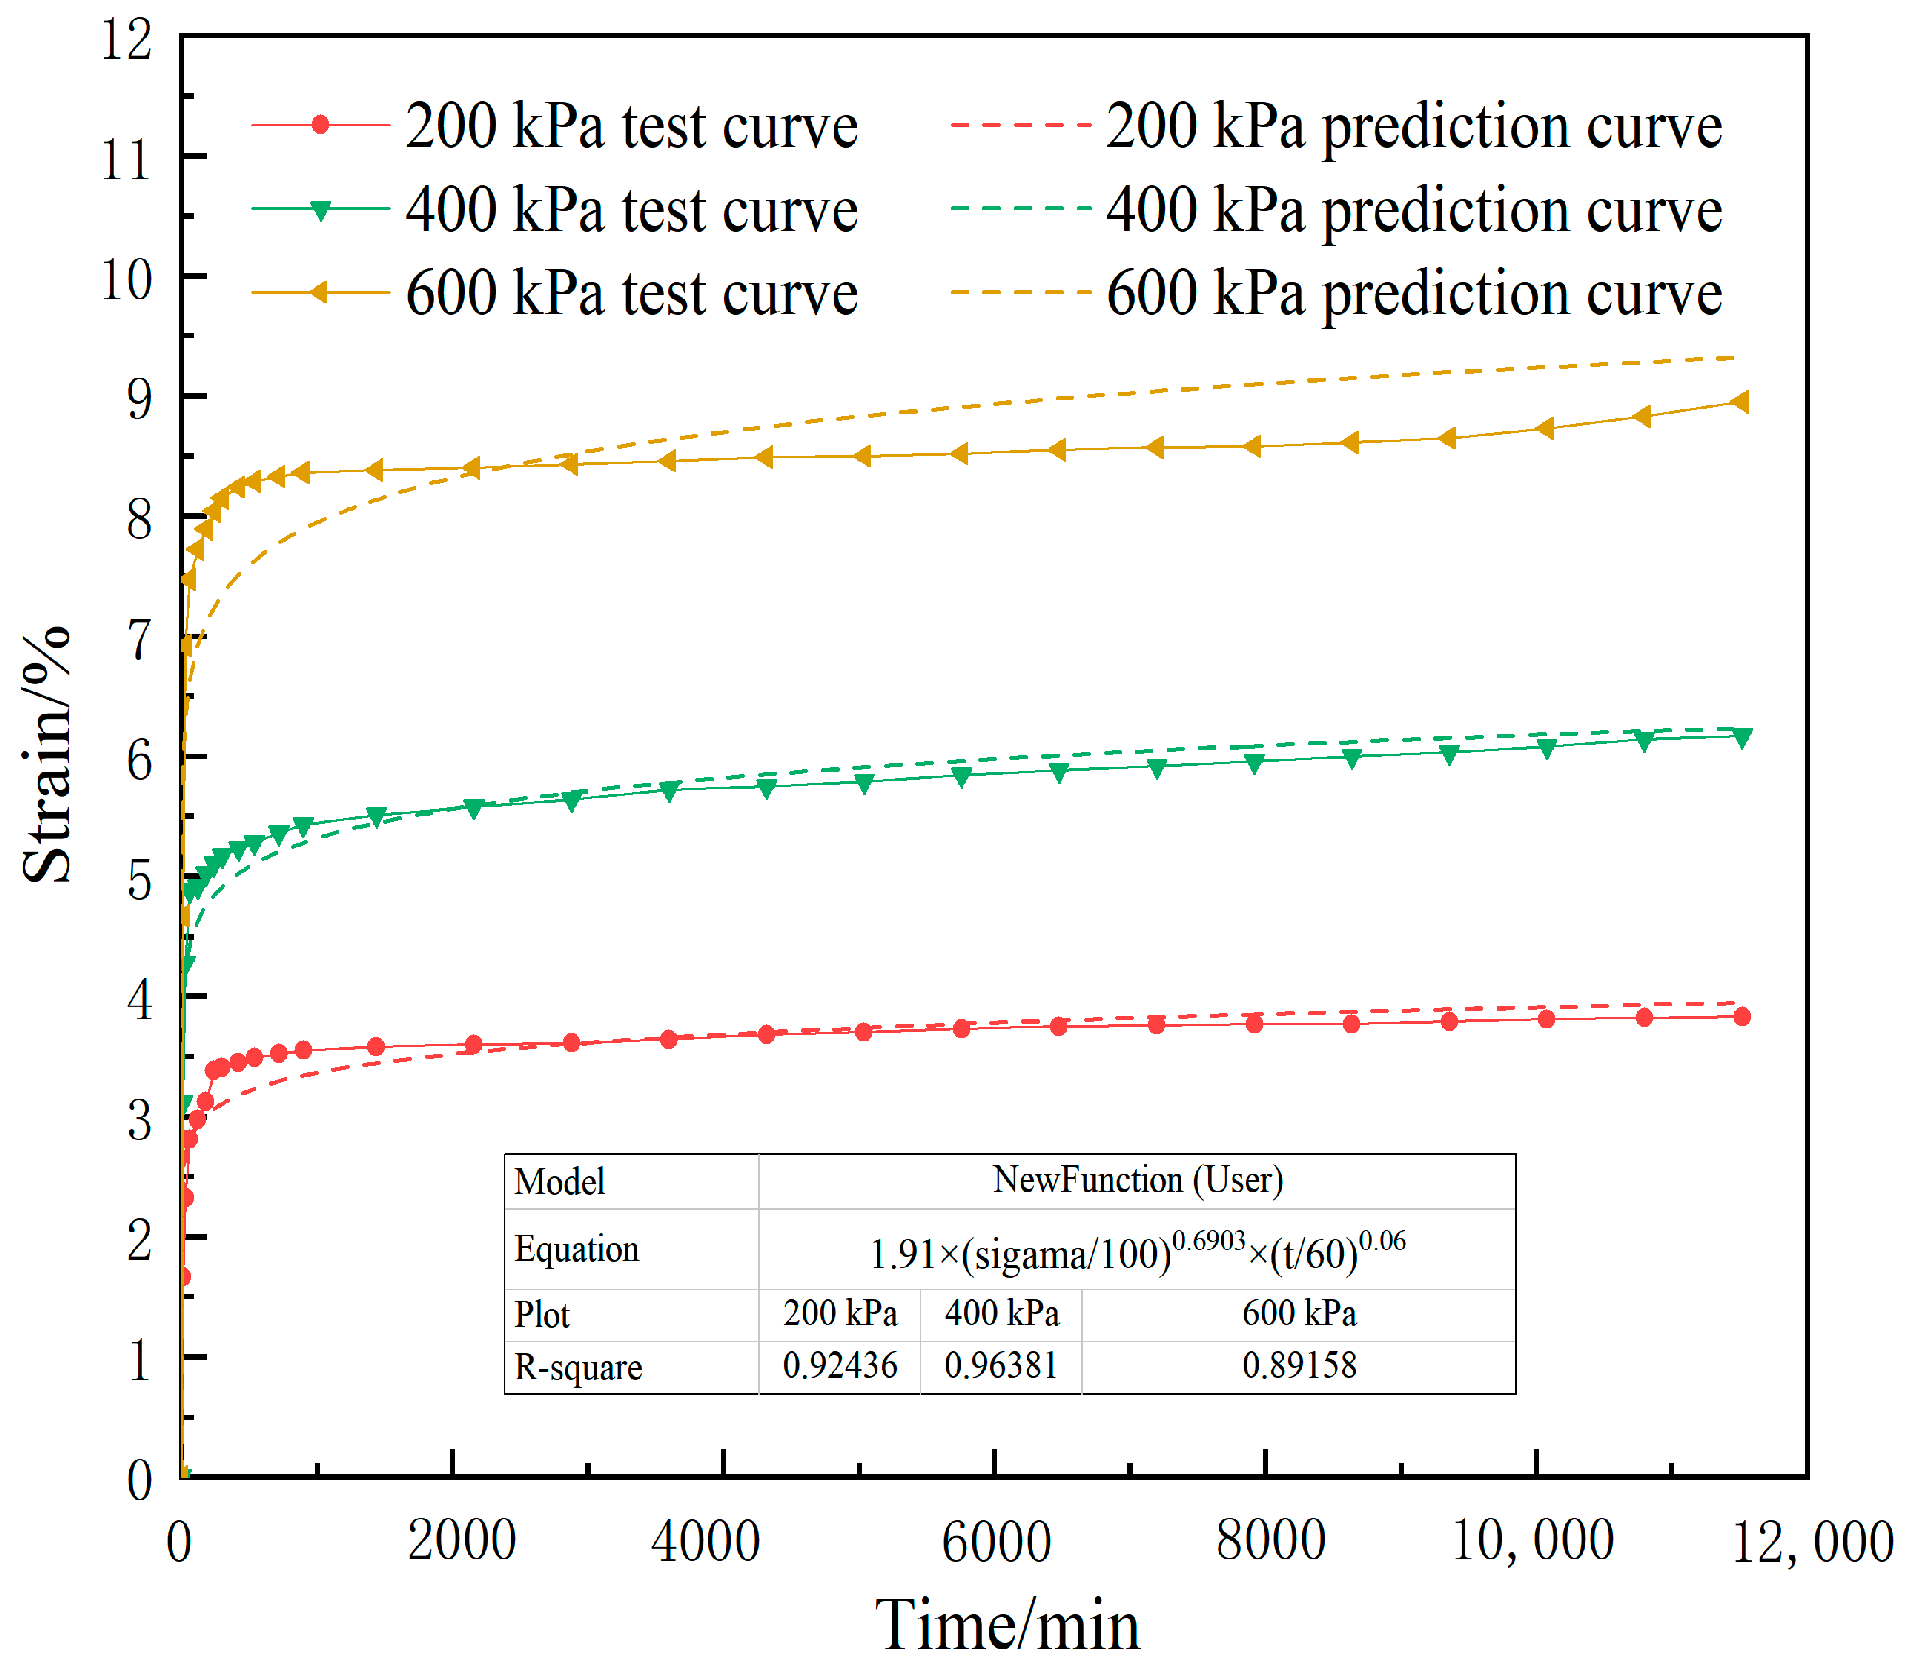
5. Model Verification and Application
6. Conclusions
Author Contributions
Funding
Data Availability Statement
Acknowledgments
Conflicts of Interest
References
- Huang, W.X. Engineering Properties of Soil; Water Resources and Electric Power Press: Beijing, China, 1983. [Google Scholar]
- Li, A.; Deng, H.; Zhang, H.; Jiang, M.; Liu, H.; Xiao, Y.; Wen, J. Developing a two-step improved damage creep constitutive model based on soft rock saturation-loss cycle triaxial creep test. Nat. Hazards 2021, 108, 2265–2281. [Google Scholar] [CrossRef]
- Long, M.; Grimstad, G.; Trafford, A. Prediction of embankment settlement on Swedish peat using the Soft Soil Creep model. Proc. Inst. Civ. Eng.-Geotech. Eng. 2020, 175, 507–522. [Google Scholar] [CrossRef]
- Ofrikhter, V.G.; Ofrikhter, Y.V. Prediction of stress-strain state of municipal solid waste with application of soft soil creep model. Vestn. MGSU 2017, 9, 82–92. [Google Scholar]
- Huang, W.; Wen, K.; Deng, X.; Li, J.; Jiang, Z.; Li, Y.; Li, L.; Amini, F. Constitutive model of lateral unloading creep of soft soil under excess pore water pressure. Math. Probl. Eng. 2020, 2020, 5017546. [Google Scholar] [CrossRef]
- Zhang, Z.; Huang, C.; Jin, H.; Feng, W.; Jin, D.; Zhang, G. A creep model for frozen soil based on the fractional Kelvin-Voigt’s model. Acta Geotech. 2022, 17, 4377–4393. [Google Scholar] [CrossRef]
- Wang, P.; Liu, E.; Zhi, B.; Song, B.; Kang, J. Creep characteristics and unified macro–meso creep model for saturated frozen soil under constant/variable temperature conditions. Acta Geotech. 2022, 17, 5299–5319. [Google Scholar] [CrossRef]
- Hou, F.; Lai, Y.; Liu, E.; Luo, H.; Liu, X. A creep constitutive model for frozen soils with different contents of coarse grains. Cold Reg. Sci. Technol. 2018, 145, 119–126. [Google Scholar] [CrossRef]
- Hu, Z.Q.; Wang, K.; Li, H.R.; Liang, Z.C.; Jiao, H.W.; Wu, P.; Chen, Z.P. Nonlinear creep constitutive model for artificially prepared site soil. Chin. J. Geotech. Eng. 2021, 43, 13–18. [Google Scholar]
- Yu, H.D.; Cui, J.C.; Chen, W.Z. Characterization of the long-term hydro-mechanical response in the host rock of a potential nuclear waste disposal repository. Chin. J. Rock Mech. Eng. 2022, 41, 2639–2648. [Google Scholar]
- Liu, J.; Tang, Y.; Yi, L.; Peng, Y.C.; Zhou, Y.F. Creep Constitutive Model of Cobbly Soil and Its Engineering Application. J. Yangtze River Sci. Res. Inst. 2022, 39, 107–112. [Google Scholar]
- Chen, C.F.; Liu, J.B.; Xu, Y.L.; Zhang, G.B. Tests on shearing creep of anchor-soil interface and its empirical model. Chin. J. Geotech. Eng. 2016, 38, 1762–1768. [Google Scholar]
- Singh, A.; Mitchell, J.K. General stress-strain-time function for soils. Geotech. Spec. Publ. ASCE 1968, 94, 21–46. [Google Scholar] [CrossRef]
- Mesri, G.R.E.S.; Febres-Cordero, E.; Shields, D.; Castro, A. Shear stress-strain-time behavior of clays. Géotechnique 1981, 31, 537–552. [Google Scholar] [CrossRef]
- Long, L.; Li, Z.D. An assessment model of monitoring risk in deep excavation based on fuzzy theory. Indoor Built Environ. 2020, 29, 221–229. [Google Scholar] [CrossRef]
- Long, L.; Li, Z.D. Monitoring and deformation law research of a deep foundation pit project in Changsha. Build. Struct. 2020, 50, 133–137. [Google Scholar]
- GB/T 50123-2019; Standard for Geotechnical Test Methods. China Planning Press: Beijing, China, 2019.
- Chen, X.P.; Zhu, H.H.; Zhang, F.Z.; Zhang, B. Experimental study on time dependent deformation of soft soil. Chin. J. Rock Mech. Eng. 2005, 24, 2142–2148. [Google Scholar]
- Jing, G.; Li, S.; Chen, G.; Wei, J.; Sun, S.; Zhang, J. Research on creep test of compacted graphite cast iron and parameter identification of constitutive model under wide range of temperature and Stress. Appl. Sci. 2022, 12, 5032. [Google Scholar] [CrossRef]
- Bobyleva, T.S.; Ma, W.G.; Yang, K.X. One-dimensional compression creep characteristics of light weight soil mixed with Weihe River mud and EPS particles. Geotech. Geol. Eng. 2021, 39, 4341–4353. [Google Scholar]
- Bobyleva, T.N.; Shamaev, A.S. An efficient algorithm for calculating rheological parameters of layered soil media composed from elastic-creeping materials. Soil Mech. Found. Eng. 2017, 54, 224–230. [Google Scholar] [CrossRef]
- Zou, S.; Li, J.; Xie, X.; Wang, Z. Study of the 1-D consolidation behavior of two-layered soft soils: Parametric studies using a rheological model with viscoplastic body. Int. J. Numer. Anal. Methods Geomech. 2019, 43, 501–518. [Google Scholar] [CrossRef]
- Han, K.Y.; Liu, Q.; Song, X.D. Research on tests of the influence factors on creep property of sandy slate coarsegrained soil. J. Railw. Eng. Soc. 2014, 11, 63–67. [Google Scholar]
- Zhu, Y.B.; Yu, H.M. Unsaturated creep behaviors of weak intercalated soils in soft rock of Badong formation. J. Mt. Sci. 2015, 12, 1460–1470. [Google Scholar] [CrossRef]
- Cai, Y.; Chen, Y.; Cao, Z.; Ren, C. A combined method to predict the long-term settlements of roads on soft soil under cyclic traffic. Acta Geotech. 2018, 13, 1215–1226. [Google Scholar] [CrossRef]
- Liao, H.Y.; Wang, W.; Gao, Y. Experimental study on creep characteristics of slip soil. J. Chengdu Univ. (Nat. Sci.) 2016, 35, 90–94. [Google Scholar]


| Soil Layer | Modulus of Compression Es/MPa | Natural Gravity γ/(kN/m3) | Soil Thickness /m | Internal Friction Angle φ/° | Cohesion c/kPa | Poisson’s Ratio |
|---|---|---|---|---|---|---|
| No. Ⅲ Sandy soil | 10.93 | 21.1 | 5.90–11.20 | 35 | 30 | 0.32 |
| No. Ⅳ Silty clay | 8.60 | 20.3 | 10.70–14.78 | 20 | 30 | 0.30 |
| Soil Type | Number | Stress σ/kPa | Loading Method |
|---|---|---|---|
| Sandy soil (A) | A1 | 100 | Independent loading |
| A2 | 200 | ||
| A3 | 300 | ||
| A4 | 400 | ||
| A5 | 500 | ||
| A6 | 600 | ||
| A7 | 700 | ||
| Silty clay (B) | B1 | 100 | |
| B2 | 200 | ||
| B3 | 300 | ||
| B4 | 400 | ||
| B5 | 500 | ||
| B6 | 600 | ||
| B7 | 700 |
| Stress (kPa) | 100 | 200 | 300 | 400 | 500 | 600 | 700 | ||
|---|---|---|---|---|---|---|---|---|---|
| Deformation (mm) | |||||||||
| Time (min) | |||||||||
| 10 | 0.172 | 0.296 | 0.378 | 0.570 | 0.708 | 0.830 | 0.982 | ||
| 30 | 0.250 | 0.460 | 0.610 | 0.822 | 1.020 | 1.292 | 1.494 | ||
| 60 | 0.302 | 0.538 | 0.730 | 0.916 | 1.116 | 1.440 | 1.628 | ||
| 120 | 0.314 | 0.548 | 0.742 | 0.928 | 1.128 | 1.454 | 1.646 | ||
| 180 | 0.326 | 0.556 | 0.754 | 0.942 | 1.140 | 1.466 | 1.664 | ||
| 240 | 0.334 | 0.564 | 0.764 | 0.952 | 1.148 | 1.474 | 1.680 | ||
| 300 | 0.344 | 0.574 | 0.776 | 0.964 | 1.174 | 1.484 | 1.694 | ||
| 420 | 0.358 | 0.582 | 0.786 | 0.974 | 1.182 | 1.492 | 1.708 | ||
| 540 | 0.364 | 0.590 | 0.796 | 0.982 | 1.190 | 1.504 | 1.720 | ||
| 720 | 0.372 | 0.596 | 0.804 | 0.988 | 1.196 | 1.512 | 1.728 | ||
| 900 | 0.378 | 0.604 | 0.810 | 0.994 | 1.200 | 1.518 | 1.734 | ||
| 1440 | 0.386 | 0.610 | 0.814 | 0.998 | 1.204 | 1.524 | 1.738 | ||
| 2160 | 0.394 | 0.616 | 0.820 | 1.004 | 1.204 | 1.528 | 1.740 | ||
| 2880 | 0.402 | 0.622 | 0.826 | 1.010 | 1.206 | 1.530 | 1.742 | ||
| 3600 | 0.406 | 0.626 | 0.834 | 1.016 | 1.210 | 1.534 | 1.742 | ||
| 4320 | 0.410 | 0.632 | 0.840 | 1.022 | 1.214 | 1.538 | 1.746 | ||
| 5040 | 0.414 | 0.636 | 0.844 | 1.026 | 1.220 | 1.548 | 1.750 | ||
| 5760 | 0.422 | 0.640 | 0.848 | 1.030 | 1.226 | 1.554 | 1.758 | ||
| 6480 | 0.426 | 0.642 | 0.850 | 1.034 | 1.232 | 1.558 | 1.764 | ||
| 7200 | 0.428 | 0.644 | 0.854 | 1.036 | 1.236 | 1.564 | 1.772 | ||
| 7920 | 0.432 | 0.644 | 0.856 | 1.038 | 1.244 | 1.568 | 1.780 | ||
| 8640 | 0.434 | 0.646 | 0.862 | 1.042 | 1.252 | 1.574 | 1.788 | ||
| 9360 | 0.436 | 0.646 | 0.866 | 1.046 | 1.260 | 1.580 | 1.798 | ||
| 10,080 | 0.440 | 0.650 | 0.868 | 1.052 | 1.266 | 1.590 | 1.818 | ||
| 10,800 | 0.436 | 0.648 | 0.872 | 1.058 | 1.276 | 1.604 | 1.842 | ||
| 11,520 | 0.444 | 0.650 | 0.878 | 1.068 | 1.296 | 1.622 | 1.892 | ||
| Number | Stress σ/kPa | Total Strain ε/% | Primary Consolidation Strain εz/% | Creep Strain εc/% |
|---|---|---|---|---|
| A1 | 100 | 2.22 | 1.51 | 0.61 |
| A2 | 200 | 3.25 | 2.69 | 0.56 |
| A3 | 300 | 4.39 | 3.65 | 0.74 |
| A4 | 400 | 5.34 | 4.58 | 0.76 |
| A5 | 500 | 6.48 | 5.58 | 0.90 |
| A6 | 600 | 8.11 | 6.93 | 1.18 |
| A7 | 700 | 9.46 | 8.14 | 1.32 |
| Stress (kPa) | 100 | 200 | 300 | 400 | 500 | 600 | 700 | ||
|---|---|---|---|---|---|---|---|---|---|
| Deformation (mm) | |||||||||
| Time (min) | |||||||||
| 10 | 0.206 | 0.332 | 0.494 | 0.622 | 0.804 | 0.934 | 1.038 | ||
| 30 | 0.326 | 0.464 | 0.678 | 0.854 | 1.136 | 1.384 | 1.588 | ||
| 60 | 0.382 | 0.562 | 0.788 | 0.976 | 1.226 | 1.494 | 1.712 | ||
| 120 | 0.402 | 0.594 | 0.822 | 0.982 | 1.294 | 1.544 | 1.758 | ||
| 180 | 0.422 | 0.624 | 0.850 | 1.004 | 1.318 | 1.578 | 1.780 | ||
| 240 | 0.434 | 0.676 | 0.872 | 1.020 | 1.336 | 1.608 | 1.792 | ||
| 300 | 0.448 | 0.682 | 0.890 | 1.034 | 1.352 | 1.630 | 1.804 | ||
| 420 | 0.458 | 0.690 | 0.906 | 1.046 | 1.362 | 1.648 | 1.818 | ||
| 540 | 0.466 | 0.698 | 0.918 | 1.056 | 1.372 | 1.658 | 1.826 | ||
| 720 | 0.474 | 0.704 | 0.930 | 1.072 | 1.380 | 1.666 | 1.836 | ||
| 900 | 0.486 | 0.710 | 0.938 | 1.086 | 1.386 | 1.672 | 1.848 | ||
| 1440 | 0.492 | 0.716 | 0.944 | 1.102 | 1.390 | 1.676 | 1.856 | ||
| 2160 | 0.500 | 0.720 | 0.950 | 1.116 | 1.394 | 1.680 | 1.866 | ||
| 2880 | 0.508 | 0.722 | 0.954 | 1.128 | 1.402 | 1.686 | 1.872 | ||
| 3600 | 0.518 | 0.728 | 0.960 | 1.144 | 1.408 | 1.692 | 1.880 | ||
| 4320 | 0.522 | 0.736 | 0.966 | 1.150 | 1.414 | 1.698 | 1.890 | ||
| 5040 | 0.528 | 0.740 | 0.972 | 1.158 | 1.420 | 1.700 | 1.898 | ||
| 5760 | 0.532 | 0.746 | 0.976 | 1.168 | 1.422 | 1.704 | 1.906 | ||
| 6480 | 0.536 | 0.750 | 0.980 | 1.176 | 1.426 | 1.710 | 1.912 | ||
| 7200 | 0.544 | 0.752 | 0.986 | 1.184 | 1.430 | 1.714 | 1.918 | ||
| 7920 | 0.548 | 0.754 | 0.990 | 1.192 | 1.432 | 1.716 | 1.924 | ||
| 8640 | 0.544 | 0.754 | 0.994 | 1.200 | 1.432 | 1.722 | 1.930 | ||
| 9360 | 0.548 | 0.758 | 0.996 | 1.206 | 1.434 | 1.730 | 1.936 | ||
| 10,080 | 0.550 | 0.762 | 1.002 | 1.216 | 1.456 | 1.746 | 1.942 | ||
| 10,800 | 0.552 | 0.764 | 1.006 | 1.228 | 1.480 | 1.766 | 1.974 | ||
| 11,520 | 0.558 | 0.766 | 1.014 | 1.234 | 1.514 | 1.790 | 2.028 | ||
| Number | Stress σ/kPa | Total Strain ε/% | Primary Consolidation Strain εz/% | Creep Strain εc/% |
|---|---|---|---|---|
| B1 | 100 | 2.79 | 1.91 | 0.88 |
| B2 | 200 | 3.83 | 2.81 | 1.02 |
| B3 | 300 | 5.07 | 3.94 | 1.13 |
| B4 | 400 | 6.17 | 4.88 | 1.29 |
| B5 | 500 | 7.57 | 6.13 | 1.44 |
| B6 | 600 | 8.95 | 7.47 | 1.48 |
| B7 | 700 | 10.14 | 8.56 | 1.58 |
| Press σ/kPa | Fitting Parameters | Correlation Index |
|---|---|---|
| 100 | 0.0709 | 0.9951 |
| 200 | 0.0367 | 0.9951 |
| 400 | 0.0258 | 0.9895 |
| 500 | 0.0226 | 0.9557 |
| 700 | 0.0193 | 0.9158 |
| Time t/min | Fitting Parameters | Correlation Index | Time t/min | Fitting Parameters | Correlation Index |
|---|---|---|---|---|---|
| 60 | 0.8430 | 0.9980 | 3600 | 0.7286 | 0.9949 |
| 120 | 0.8288 | 0.9977 | 4320 | 0.7244 | 0.9950 |
| 180 | 0.8162 | 0.9974 | 5040 | 0.7209 | 0.9949 |
| 240 | 0.8082 | 0.9971 | 5760 | 0.7139 | 0.9943 |
| 300 | 0.7999 | 0.9972 | 6480 | 0.7114 | 0.9941 |
| 420 | 0.7842 | 0.9965 | 7200 | 0.7111 | 0.9939 |
| 540 | 0.7786 | 0.9963 | 7920 | 0.7098 | 0.9935 |
| 720 | 0.7699 | 0.9960 | 8640 | 0.7103 | 0.9935 |
| 900 | 0.7626 | 0.9959 | 9360 | 0.7117 | 0.9933 |
| 1440 | 0.7530 | 0.9955 | 10,080 | 0.7117 | 0.9928 |
| 2160 | 0.7427 | 0.9951 | 10,800 | 0.7230 | 0.9929 |
| 2880 | 0.7330 | 0.9948 | 11,520 | 0.7272 | 0.9912 |
| Soil Layer | k | m | n |
|---|---|---|---|
| No. Ⅲ Sandy soil | 1.5100 | 0.0351 | 0.7510 |
| Press σ/kPa | Fitting Parameters | Correlation Index |
|---|---|---|
| 100 | 0.0971 | 0.9641 |
| 300 | 0.0666 | 0.9386 |
| 500 | 0.0493 | 0.9083 |
| 700 | 0.0480 | 0.8825 |
| Time t/min | Fitting Parameters | Correlation Index | Time t/min | Fitting Parameters | Correlation Index |
|---|---|---|---|---|---|
| 60 | 0.7820 | 0.9829 | 3600 | 0.6719 | 0.9808 |
| 120 | 0.7692 | 0.9806 | 4320 | 0.6693 | 0.9811 |
| 180 | 0.7491 | 0.9805 | 5040 | 0.6654 | 0.9809 |
| 240 | 0.7294 | 0.9826 | 5760 | 0.6627 | 0.9813 |
| 300 | 0.7201 | 0.9816 | 6480 | 0.6606 | 0.9813 |
| 420 | 0.7136 | 0.9811 | 7200 | 0.6555 | 0.9801 |
| 540 | 0.7073 | 0.9811 | 7920 | 0.6533 | 0.9799 |
| 720 | 0.7019 | 0.9819 | 8640 | 0.6583 | 0.9816 |
| 900 | 0.6930 | 0.9811 | 9360 | 0.6563 | 0.9810 |
| 1440 | 0.6887 | 0.9822 | 10,080 | 0.6587 | 0.9819 |
| 2160 | 0.6834 | 0.9820 | 10,800 | 0.6659 | 0.9811 |
| 2880 | 0.6789 | 0.9813 | 11,520 | 0.6736 | 0.9780 |
| Soil Layer | k | m | n |
|---|---|---|---|
| No. Ⅳ Silty clay | 1.9100 | 0.0653 | 0.6903 |
Disclaimer/Publisher’s Note: The statements, opinions and data contained in all publications are solely those of the individual author(s) and contributor(s) and not of MDPI and/or the editor(s). MDPI and/or the editor(s) disclaim responsibility for any injury to people or property resulting from any ideas, methods, instructions or products referred to in the content. |
© 2023 by the authors. Licensee MDPI, Basel, Switzerland. This article is an open access article distributed under the terms and conditions of the Creative Commons Attribution (CC BY) license (https://creativecommons.org/licenses/by/4.0/).
Share and Cite
Long, L.; Li, Z.; Li, Y. Investigation of an Empirical Creep Constitutive Model of Changsha Red Loam. Buildings 2023, 13, 1064. https://doi.org/10.3390/buildings13041064
Long L, Li Z, Li Y. Investigation of an Empirical Creep Constitutive Model of Changsha Red Loam. Buildings. 2023; 13(4):1064. https://doi.org/10.3390/buildings13041064
Chicago/Turabian StyleLong, Lin, Zhida Li, and Yunyu Li. 2023. "Investigation of an Empirical Creep Constitutive Model of Changsha Red Loam" Buildings 13, no. 4: 1064. https://doi.org/10.3390/buildings13041064
APA StyleLong, L., Li, Z., & Li, Y. (2023). Investigation of an Empirical Creep Constitutive Model of Changsha Red Loam. Buildings, 13(4), 1064. https://doi.org/10.3390/buildings13041064