

A Comparative Case Study of Certified and Non-Certified Green Buildings and Their Response to Climate Change

School of Engineering, Design and Built Environment, Western Sydney University, Penrith, NSW 2751, Australia
*
Author to whom correspondence should be addressed.
Buildings 2023, 13(4), 977; https://doi.org/10.3390/buildings13040977
Submission received: 1 March 2023
/
Revised: 30 March 2023
/
Accepted: 2 April 2023
/
Published: 6 April 2023
(This article belongs to the Special Issue Cities and Buildings as Drivers for Climate Change Adaptation and Mitigation: New Models and Computational Tools)
Abstract
:Green buildings (GBs) employ a wide range of passive and active energy-saving strategies to improve buildings’ energy performance. The suitability and performance of some of these strategies depend on outdoor climate conditions and may change over time due to global warming. Therefore, a GB may not retain its performance in the future. To address this issue and explore how much GB performance may be affected by climate change, this research aims to (1) evaluate the energy performance and thermal comfort of a GB and non-GB under present climate conditions; (2) predict the impact of climate change on these buildings, and (3) evaluate the climate resilience of a GB as opposed to a non-GB. To this end, a university GB and non-GB are simulated using DesignBuilder and calibrated with measured data. Future weather files based on Representative Concentration Pathways (RCPs) are used to predict climate conditions in the 2050s and 2090s. A comparison between the GB and non-GB revealed that the GB would save 15.1% and up to 21.9% of site energy under present and future climate conditions, respectively. It was also found that the thermal comfort level in the GB will remain significantly higher than in the non-GB in the future. The overheating issue in non-GBs will deteriorate in the future, with an increase of nearly 70% by the 2090s. The GB produces approximately 15% and up to 22% fewer GHG emissions than the non-GB under present and future climate conditions (RCP 8.5), respectively.
1. Introduction
Climate change is a global problem affecting all countries. Its mitigation urgency is contemplated under the measures integrated into the United Nations Sustainable Development Goals (SDGs) [1]. The Intergovernmental Panel on Climate Change (IPCC) report states that greenhouse gas (GHG) emissions caused by anthropogenic activities are responsible for virtually 1.1 °C of the global temperature rise from 1850 to 1900. It is projected that this temperature rise will reach or exceed 1.5 °C (within the next thirty years) between 2030 and 2052 if GHG emissions continue to increase at the current rate [2]. As a consequence of global warming, extreme weather events such as heatwaves will occur more often and become more intense in the future [2]. To mitigate climate change risks, affordable and scalable low-emissions solutions are required, particularly in energy-intensive sectors, at both national and international levels.
The building sector is one of the major global energy consumers and GHG emitters, contributing to approximately 32% of global final energy use and more than 30% of black carbon emissions [3]. These emissions are related to the energy needs for cooling, heating, ventilation, hot water, lighting, and other process-related activities [1]. It is expected that energy demand in this sector will increase in the future due to several reasons, such as population growth, rapid urbanization, and increased access of people to electricity and housing [3]. Climate change promotes uncertainty in a building’s performance, especially when facing inefficient building construction and equipment with an increased toll on GHG emissions. These uncertainty factors are related to a large part of the building stock built before the implementation of mitigation or adaptation standards and regulations [4]. Despite its large role in global warming, the building sector has significant potential to deliver quick and cost-effective GHG mitigation opportunities through the application of state-of-the-art construction and appropriate retrofit solutions [3]. Green buildings, which have become popular in recent years, with the incorporation of sustainable building design, can play a significant role in climate change mitigation [4].
1.1. Green Buildings Background
The green building (GB) concept appeared first in 1990 in the United Kingdom under the Building Research Establishment’s Environmental Assessment Method (BREEAM) tool [5]. A GB encompasses a holistic approach towards a sustainable design that aims for continuous enhancement within the built environment, making today’s best practices tomorrow’s standard ones [6,7]. The emphasis on planning, design, construction, operations, and end-of-life of buildings aims to create environmental, social, and economic communities [8]. GBs contribute to mitigating global warming by reducing GHG emissions through the implementation of energy conservation measures and, consequently, the creation of buildings more resilient to climate change [9].
1.2. Green Buildings Performance
According to the GBCA and International Energy Agency (IEA), until 2050, there will be a 50% increase in energy demand due to an extra 1.1 million homes and 400 million non-residential square meters being built. GBs can offer a solution to partly address this increased energy demand [10]. According to the GBCA [11], GBs emit 50–55% fewer GHG emissions (66% less energy) when compared to conventional ones, which is the equivalent of removing 260,000 cars from roads each year.
GBs’ energy performance has been widely examined by researchers. For example, Lin et al. [12] applied a smart optimization algorithm to optimize both the construction cost and GHG emissions of GBs. Results showed that a significant improvement in GHG emissions could be achieved with relatively small construction costs. Filippini and Obrist [13] investigated the energy consumption of green-certified buildings in Switzerland and found that households living in GBs saved approximately 25% of their total energy use. Zhao et al. [14] studied the financial benefits achieved from reduced energy usage in GBs for low-income households in the United States. Financial benefits were estimated to be between 3.5% and 9.3% of the annual income of low-income households. Post-occupancy evaluation was conducted to evaluate the operating performance of a commercial green building [13]. It was found that the building consumed 18.6% more energy than the design target. Scofield et al. [15] investigated the energy performance of LEED-certified commercial office buildings using 2016 energy use data in ten different major cities in the United States. It was found that site and source energy use in LEED-certified offices are 11% and 7% lower than in non-LEED-certified office buildings. Zhang and Li [16] studied the energy and environmental performance of green buildings using the weighted regression model in Seattle, USA. Their results showed that green-certified buildings would save 13.2% of energy and reduce 3.24% of GHG emissions. However, according to Capeluto [17], it is not clear that the adoption of GB strategies has improved the energy performance in buildings when compared to non-certified buildings. It was found that buildings assessed with the LEED rating tool used more 28–35% energy. Almeida et al. [18] investigated the impacts of occupant behavior on the energy performance of green and non-green buildings. The authors found that green buildings were inefficiently managed during the operational stage. Despite the green rating, this fact led the building to operate similarly to a non-green building. If green buildings are not maintained according to the best practices for which they were certified, they may operate as a conventional building [7]. A review study by Geng and Ji [19] concerning the energy use of GBs, concluded that, on average, GBs perform better than conventional buildings in the same region. However, their actual energy consumption may vary significantly.
GBs also aim to improve indoor environmental quality (IEQ) and enhance occupants’ satisfaction levels compared to conventional buildings [7]. Newsham et al. [20] conducted a post-occupancy evaluation of 12 green and non-green buildings. Their results showed that GBs have better indoor environment performance compared to non-GBs. On the other hand, many studies showed that GBs may not enhance occupants’ satisfaction or indoor thermal conditions. For example, He et al. [21] investigated the impact of green building rating systems on indoor thermal comfort. It was concluded that green systems may not necessarily improve user indoor thermal comfort. With regard to occupants’ satisfaction, Altomonte et al. [22] assessed occupant satisfaction with indoor environmental quality. It was revealed that GBs did not substantively improve occupant satisfaction. Nkini et al. [23] and Schiavon and Altomonte [24] found that green buildings do not outperform non-green buildings in terms of occupants’ satisfaction. Geng and Ji [19] concluded that GBs generally have higher occupant satisfaction levels than conventional buildings. However, this may vary greatly in different countries.
As previous studies revealed, the energy and thermal comfort evaluation of GBs is an open research area requiring more investigation to better understand the influence of different green rating systems on energy use and indoor thermal conditions in green buildings as opposed to conventional buildings. According to Kim et al. [25], rating systems promote energy savings in buildings. However, the extra investment for the rating process still needs additional investigation as opposed to being an obstacle to certify a building as green.
1.3. Global Warming Impact in Buildings
Additionally, previous studies have shown that global warming can significantly influence energy use and thermal comfort conditions in buildings [26,27,28,29]. According to Pajek and Košir [30], the overheating vulnerability of the building stock will have less impact on buildings that have energy-efficient strategies implemented. For example, Haji Ismail et al. [27] simulated a prefabricated case study building in the UK and found out that the heating energy use in 2030 and 2080 is estimated to be up to 12% and 34% lower, respectively, than in 2017. Bamdad et al. [28] showed that there will be a considerable rise in the cooling energy demand in office buildings by 2080, ranging from 24% in Darwin to 56% in Melbourne, Australia. In another study, the author presented the climatic potential of natural ventilation (CPNV) and the climatic potential of extended natural ventilation (CPENV) index to evaluate the impact of global warming on natural ventilation in buildings. The study has shown that there is a significant potential for passive cooling in a mild to a warm type of climate, such as Sydney [31]. Global warming’s impacts on the energy performance of non-green buildings have been widely investigated in different climate zones [29,32]. However, its impacts on GBs have not been fully explored yet, and there exist limited studies that evaluate the performance of GBs in the future. In GBs, a wide range of passive and active energy-saving strategies are employed to meet the energy and comfort requirements of green rating systems [33]. The effectiveness of these strategies (e.g., natural ventilation, PV systems) are often dependent on outdoor climate conditions and may change over time. Thus, an energy-efficient solution in a GB under present climate conditions may not retain its effectiveness in the future due to climate change [28,34]. This may significantly influence the overall energy performance of GBs. Therefore, it is necessary to understand how much GBs’ performance may be affected by climate change over time.
1.4. Scientific Problem and Goals
This research intends to understand the implications of climate change in a building that has implemented sustainable strategies and if these provide a better resilience to global warming. Then, the research compares a GB to a similar conventional building. As mentioned previously, there is little information in the literature on the impacts of global warming on GBs and their comparison to conventional ones. No studies have yet fully explored how the performance of university GBs may change over time as a function of climate change scenarios and how much these buildings are more resilient compared to similar non-GBs. Therefore, this paper presents a novel study by analyzing a GB’s resilience to future climate changes and comparing its performance to a building without any green classification. Accordingly, this research aims to (1) evaluate the energy and thermal comfort performance of a green-certified university building (certified by Green Star) as opposed to a non-certified green university building and (2) predict the performance of the GB under climate change impact to determine to what extent a GB will remain green in the future.
The research program of this study is structured as follows: the introduction includes a literature review on the impact of climate change on buildings and the concept of GBs and their energy performance. Section 2 discusses the research design and methods, which include case study descriptions of both buildings, the software used for building simulation, the building calibration method used to ensure the models were an actual representation of the buildings, and the future weather files used to predict the impact of climate change in the two buildings. Section 3 presents the results and discusses them under each subsection, covering future climate data, predicted energy use in the GB and non-GB, peak loads, solar energy production, unmet load hours, and environmental impacts of the GB. Finally, Section 4 draws a conclusion, followed by future work.
2. Methods
To perform this research several methods were used. The first consideration was performing a literature review to find any gaps related to the intended research topic. Then, the type of buildings that would be accounted for in the case studies were selected according to their similar characteristics, to be comparable, and for the easier availability of data. The data were collected through several visits and audits of the buildings, as well as actual stored and monitored data. To be able to analyze the energy performance of the GB and non-GB and study the impact of climate change, a building simulation with weather files with lower-, medium-, and high-impact scenarios was used. The models were calibrated against monitored data to translate to the actual buildings. The weather files used in the simulation process were created using the morphing method [35]. Finally, the results from the simulations were carefully analysed and discussed in Section 3. Therefore, in this section the case study buildings are first presented. Then, the building calibration process with measured data is discussed. Finally, the weather files used in this research to predict future climate conditions are presented.
2.1. Case Studies Description
Building simulations were carried out in two university buildings from Western Sydney University (WSU). These buildings are a representation of the conventional type of construction in Australia, built in 1989 and 2016, and have similar characteristics in terms of building material, occupancy schedules and rates, activity type, systems, and energy intensity rates. Figure 1 presents these buildings and simulated models and Table 1 shows the main features of the buildings. The first building is a 5696 m2 green-rated building from 2016 that was certified as six-star, the highest classification from the Green Star Australian certification system [10]. To achieve the green rating, the building had to comply with land use and ecology requirements, management, emissions, energy, indoor environmental quality (IEQ), water, materials, and transport. The building has installed LED lights, motion sensors, efficient air conditioning equipment, permanent external shading devices, internal shading, and 25 km of hydronic pipework to provide heating and cooling in common areas. Additionally, there is a system with 374 photovoltaic modules which produces 134 MWh of electricity annually, there is a 95% reduction in potable water with the implementation of water-efficient features, 15% of students and staff are provided with cyclist facilities, materials were evaluated from a lifecycle perspective, and there is an aim to achieve more than 98% recycling rates.
The second building, from 1989, has no rating. The building material is typical of the region where it stands, with brick on the outer layer of the external walls. Since the building was built in 1989, some envelope information was missing, and assumptions were made in line with Australia’s National Construction Code (NCC) [36]. Both buildings had U values for roofs, walls, and glazing that vary from 0.16 to 0.25 W/m2-K, 0.35 to 1.78 W/m2-K, and 3.50 to 5.40 W/m2-K, respectively. The air conditioning system was retrofitted in 2003, and similar to the green-rated building (GB), it comprised a chiller (EER = 5.2) for the cooling function and a gas boiler heater for heating (90% efficiency). There were some split and multisplit units in a few rooms too. However, for the non-GB building, since the air conditioning system was installed over ten years ago, the efficiencies and performances were adjusted to account for the expected efficiency loss [37].
2.2. The Simulation Parameters
The buildings operate from 6:30 a.m. to 8 p.m., and the air conditioning system from 8 a.m. to 6 p.m. The set-points were considered as per the information provided by the WSU management system. Generally, the air conditioning system is managed centrally by the WSU management system in both buildings with set-point temperatures of 23 °C for cooling and 22 °C for heating. However, wherever occupants are able to control their set-point temperatures locally, these would vary from 18 °C to 24 °C, especially in the green building, which was reflected in the simulation model. The buildings have a system with several air handling units (AHU) to provide fresh air and control the levels of humidity inside rooms. This system has motion, carbon dioxide (CO2), and volatile organic compound (VOC) monitors in the green building. These ensure that the AHUs operate only when the building is occupied and comply with the indoor air quality requirements from the Green Star rating system [11]. An instant hot water system provides all other hot water for human consumption. The infiltration rate was estimated to be 0.6 in the green and 0.7 in the non-rated building. In both buildings, the minimum outdoor air per occupant was assumed to be 10 L/s [38].The building simulations were carried out using DesignBuilder as a 3D interface to EnergyPlus. EnergyPlus is used worldwide and complies with the ANSI/ASHRAE Standard 140-2017, which defines the requirements for building energy simulations, and the National Construction Code in Australia (NCC) [39,40]. The models were divided into 32 thermal zones in the green and 52 in the non-green buildings (Figure 2), considering internal loads, type of activity, and orientation as key factors for the thermal zones’ selection.
For the prediction of the impact of climate change on the photovoltaic system, the photovoltaic software PVsyst was used.
2.3. Calibration
The procedure adopted was a whole building calibration simulation approach, where the simulated model outputs were targeted according to actual monitored data [41]. The simulations were calibrated to ensure that the models could be used as a reliable representation of an actual building and validate their outputs. For the calibration, an error-based analysis (Equations (1) and (2)) was used according to the proposed benchmark from ASHRAE Guideline 14, aligned with other research in the literature. The electricity outputs from the simulations were compared to monitored data from the WSU building management system, accepting a deviation within a range of ±10% [42,43].
In the equations above, CV represents the root-mean-square error coefficient of variation, Esim,i is the simulated energy from period i, Eactual,i corresponds to the actual energy use during period i, nm is the number of measurements, Eactual refers to the average actual energy use during period i, and MBE represent the mean bias error.
The calibration targets deviations between the simulation outputs and the actual monitored data (electricity and natural gas usages). It is an iterative process described in Figure 3 and stops when an acceptable deviation between the monitored data and the simulated model is obtained (similar to this study [44]). The actual information collected from the buildings related to the climate, location, orientation, as-built data, equipment, HVAC, lighting, and occupancy is represented in the starting model (Sim1) [43].
The models were tuned based on a manual calibration approach and the available monitored data, where parameters related to the usability of systems and equipment were refined. To ensure the calibration process is accurate, the error must be within a range of ±10% [42,43]. This was achieved after 20 iterations for the green building model, with error deviations of less than 1% and −8%, targeting the overall and HVAC electricity uses, respectively. The non-GB model was calibrated after 18 iterations, with an error deviation below +10% error related to HVAC electricity use.
2.4. Present and Future Climates
In this research, projected future weather files developed by the Commonwealth Scientific and Industrial Research Organisation (CSIRO) were used [45] to evaluate the impact of climate change on the energy performance of the non-GB and GB. These future weather files were developed based on scenarios introduced in the IPCC fifth assessment report [46], called The Representative Concentration Pathways (RCPs), which project a range of possible future climates with different levels of GHG concentrations, resulting in different radiative forcing levels (i.e., the difference between incoming and outgoing radiation in the atmosphere relative to the pre-industrial era, 1750). The pathways introduced were RCP 2.6, RCP 4.5, RCP 6, and RCP 8.5. RCP 2.6 is a mitigation pathway with a peak of approximately 3 W/m2 before 2100, followed by a decline to approximately zero emissions before the end of the century. RCP 4.5 and RCP 6 correspond to medium stabilization pathways in which radiative forcing values are stabilized at approximately 4.5 W/m2 and 6 W/m2 after 2100. RCP 8.5 pathway is a high emission scenario representing a future with a continuous rise in GHG concentration, reaching a radiation forcing level of 8.5 W/m2 by the end of the 21st century. Figure 4 shows the present annual and projected temperature and radiation evolution for Parramatta and Richmond.
To generate future weather files, the morphing method developed by Belcher et al. [47] along with different global climate models were used [45]. The morphing method is well-established and the most commonly used method to predict future climate conditions [34]. The typical meteorological year (TMY) data sets derived from historical weather data from 1990 to 2015 were used as the baseline weather files in the morphing method. Please refer to Ren et al. [45] for more details.
3. Results
In this section, the impact of climate change on the present climate conditions is first presented. Then, the results of energy use, peak load, solar production, and thermal comfort for the GB and non-GB are discussed in Section 3.2, Section 3.3 and Section 3.4. Finally, the contribution of the GB and non-GB to global warming is presented.
3.1. Future Climates
The GB and non-GB buildings are located in the cities of Parramatta and Kingswood, respectively. These cities have similar climate conditions, including a mild temperate climate with mild to cool winters with low humidity, and hot to very hot summers with moderate humidity. In this study, since the weather file for Kingswood was not available, the closest available weather file (Richmond) was used to represent the climate conditions in Kingswood, NSW.
Figure 5 shows the present monthly mean temperatures and the projected temperature rises for these cities. Under present climate conditions, Richmond and Parramatta have an annual mean temperature of approximately 17 °C, with a maximum monthly mean temperature of 23.1 °C and 22.2 °C in January, respectively. The minimum monthly mean temperature is in July, and is 10.1 °C and 11 °C for Richmond and Parramatta, respectively. As can be seen, under future climate conditions, the increase in monthly mean temperature varies throughout the year.
The minimum monthly temperature rise for both cities is around 1 °C and the maximum rise is around 1.3 and 1.6 °C under the low emissions scenario (RCP 2.6) for Richmond and Parramatta, respectively. The maximum monthly temperature rise is approximately 2.1 °C for both cities under the high emissions scenario (RCP 8.5) in 2050. It is predicted that the temperature rise will be between 3.9 and 4.3 °C under RCP 8.5 in 2090 for these cities.
3.2. Simulation Results: Energy Performance
The simulation results of the GB and non-GB are presented in Figure 6. As can be seen, the cooling energy use is the largest energy consumer in both buildings, followed by fans, heating, and pumps.
The cooling energy use in the GB is 32 kWh/m2, which is approximately 40% lower than the non-GB (53.6 kWh/m2). The second biggest energy consumer in both buildings is fans. As shown, fans consume more energy in the non-GB than the GB. This is in part due to the higher cooling demand in the non-GB. Regarding heating energy use, the GB consumes 12.8 kWh/m2, which is almost 25% lower than the non-GB, with nearly 17 kWh/m2 under present climate conditions. As can be seen in this figure, the energy use of pumps in the GB is higher than in the non-GB. This figure also shows the impact of climate change on the energy requirements for cooling, heating, fans, and pumps under RCP 2.6, RCP 4.5, and RCP 8.5 pathways in 2050 and 2090. These impacts are also quantified in percentages and shown in Figure 6. As expected, due to the global warming effect in the future, heating energy use will decrease, and cooling energy use will increase. As shown, there will be a significant increase in cooling energy use in the future in both buildings. However, the predicted increase in the GB is noticeably lower than in the non-GB under all climate change scenarios. It is expected that the cooling energy use will increase between 15.6% and 60.7% for the non-GB and 6.7% and 27.3% for GB under the low and high emission scenarios in 2090, respectively.
On the other hand, the projected changes in the future for heating energy use follow a similar trend in both buildings. It is anticipated that heating energy use would decrease by 26.8% and 23.5% under the low emissions scenario and 70.9% and 68.1% under the high emissions scenario for the non-GB and GB in 2090, respectively. Fans and pumps will experience fewer impacts. It is estimated that fans’ energy use will increase up to approximately 5% under the high emission scenario by 2090. The modest increase in the annual energy use of fans which results from higher cooling use, will be partly offset by a decrease in heating use in these buildings in the future.
3.3. Peak Loads
Figure 7 presents the heating and cooling peak loads of simulation results for the GB and non-GB under present and future climate conditions. As shown, the peak cooling load in the non-GB is much higher than in the GB and is more sensitive to climate change. The peak cooling load in the non-GB increases up to 2.8% under the high emission scenario by 2050. However, this increase in the GB is just below 1%. It is also predicted that by 2090, the peak cooling load in the non-GB will rise by 3.6%, 4.2%, and 8.7% under the low, medium, and high emissions scenarios, respectively. These rises are only 0.2%, 2.1%, and 1.9% under the RCP 2.6, 4.5, and 8.5 emissions scenarios in the GB, respectively, indicating that the peak cooling load in the non-GB is almost four times more sensitive to climate change than the one in the GB. As discussed in the previous section, this is due in part to the higher energy efficiency of the cooling system in the GB. On the other hand, the peak heating load value in both buildings is very close to each other, and its reduction follows an approximately similar trend in the future. It is estimated that the peak heating load in the non-GB and GB will decrease up to 20% and 18.8% under the high emission scenario by 2050. It is also predicted that by 2090, the peak heating load will be reduced by approximately 4.4% and 7.8%, 21.6% and 20.8%, and 35% and 40% under RCP 2.6, 4.5, and 8.5 by 2090 in the non-GB and GB, respectively.
3.4. Solar Production
The green building, located in Parramatta, has had a photovoltaic system (PV) installed on the roof. The system has 374 photovoltaic modules overall, with a total area of 625 m2. The modules are divided into three different arrays with a 3° tilt. The first array is oriented towards a 2° azimuth, the second array towards a 37° azimuth, and the third array towards a 65° azimuth. The whole system has a nominal power of 99.1 kWp with a 100 kWac inverter. Figure 8 represents the normalized production and performance ratio for the present situation.
Table 2 represents the predicted PV production for the three pathways introduced in this study, for the GB. The minimal solar production is registered, as expected, with the present climate.
The future climate conditions do not represent a significant improvement in the production of electricity. However, it is possible to see that the highest increase in solar production is verified for the pathways in 2090. Electricity production will increase by 4430 kWh and 4200 kWh annually under pathways RCP 2.6 and RCP 8.5, respectively, compared to the present scenario. It should be noted that the PV production will decrease slightly from pathway RCP 2.6 to RCP 4.5 in both 2050 and 2090, increasing again in pathway RCP 8.5
3.5. Unmet Load Hours
The unmet hours metric indicates the number of hours in a year that one or more conditioned zones in a building are outside of the thermostat set-points with a throttling range. If unmet hours for multiple zones coincide, one unmet hour is counted for the building.
This metric gives an overall thermal comfort performance of buildings and the total summation of unmet hours per year should not exceed 300 h in a building, as per ASHRAE standard 90.1-2004. In this study, the unmet hours for the heating and cooling periods are shown separately in Table 3 for both the GB and non-GB under present and future climate conditions. The thermostat throttling range is 0.5 °C. As can be seen, unmet load hours when heating is required are well below the threshold of 300 h, indicating that the heating system in both buildings is able to maintain the temperature at the desired level for almost all zones. It is predicted that the unmet heating hours will decline in the future for both buildings under all climate change scenarios. However, this trend is different for the cooling set-point unmet hours. Under present climate conditions, the non-GB fails to meet the ASHRAE maximum allowable limit and suffers from overheating, while the overall thermal comfort performance in the GB is noticeably high. In the future, the cooling set-point unmet hours will be significantly increased in both buildings under all scenarios. The overheating issue in the non-GB will deteriorate in the future, reaching up to 1429.5 h under the high emissions scenario. In the GB, the cooling set-point unmet hours will increase significantly from 24 h to 247 h under RCP 8.5 in 2090. However, these unmet hours (summation of cooling and heating unmet hours) are still below the ASHRAE threshold and considerably lower than in the non-GB.
3.6. GB and Non-GB Emissions
Table 4 represents the impacts of these buildings on the environment. As shown under the present climate conditions, the GB produces 14.7% fewer GHG emissions when compared to the non-GB. The projected future climate pathways RCP 2.6, RCP 4.5, and RCP 8.5 contribute to an increase in the total energy use and greenhouse gas emissions in both buildings. The GB, however, in all six future climate scenarios, has less impact on the environment when compared to the non-GB. It is possible to see a variation of 4% and 12% in the GHG emissions in the GB and non-GB, respectively. The GHG emissions increase on average by 4% among the three pathways in 2050 and 7% in 2090 in the non-GB. In the GB, for the same previous scenarios, the GHG emissions increase on average by less than 1% and 2%, respectively.
In the high emission scenario, RCP 8.5 in 2090, the GB uses 21.9% less (46.5 kWh/m2-yr) energy and emits 22% fewer (39.1 kgCO2/m2-yr) GHG emissions. This is in contrast with the non-GB which uses and emits on average 18% more energy and GHG emissions, respectively, for each of the different pathways analysed. Additionally, it is possible to ascertain that the present case scenarios for both buildings have the lowest energy use and GHG emissions: 165.5 kWh/m2-yr and 195.90 kWh/m2-yr for energy, and 133.5 kgCO2/m2-yr and 156.6 kgCO2/m2-yr for GHG emissions. As expected, there is an increasing trend for energy use in both buildings throughout the different pathways. In contrast, for the same pathway, the GB sees an increased demand for energy compared to the following RCP 8.5 in 2050.
Table 5 shows the greenhouse gas emissions for combined energy use for cooling and heating in both buildings. As it is possible to see, the GB in the highest emissions scenario emits 51% fewer GHG emissions when compared to the non-GB. There is an increase of 5 kgCO2/m2-yr (15%) when comparing the highest emissions scenario with the present one. In the non-GB, the rise is around 20 kgCO2/m2-yr (30%). Overall, the GB produces between 40 to 50% fewer emissions, when considering the impacts of climate change on heating and cooling energy use.
4. Discussion
This paper illustrates a novel, comparative, resilience to climate change case study, comparing a green and conventional building. The novelty of this research relates to comparing a green-rated university building with a conventional one from a perspective of global warming analysis. The two buildings used in this comparative study have similar characteristics in terms of types of activities, systems, building material, and occupancy. The non-GB was built in 1989 and some architectural and technical data were unavailable. Additionally, some measurement points were lacking when translating an appropriate end-use distribution. As it was impossible for the authors to install data meters for all energy end-uses, this led to some uncertainty in the calibration process in the non-GB. To address this, on-site measurements and several inspections were performed, and resources, such as ASHRAE standards [48,49] and Australian regulations and standards [50,51,52], were used to enhance the models’ reliability. Importantly, three years of electricity-monitored data were used for the calibration process to improve the accuracy of the calibrated model. The model was calibrated with less 10% error. However, with more measured data, higher accuracy can be achieved. On the other hand, since more data meters (including the overall monitored energy) were available in the GB, an accurate calibrated model was possible to be achieved with eight months of measured data. However, with a longer monitoring period, the calibrated model can be improved as well.
After performing the building simulations, the results have shown that for the present conditions, cooling and heating energy uses in the GB are 40% and 25% lower, respectively, when compared to the conventional building. Fans and pumps represent a residual impact on energy use. Fans consume more energy in the conventional building; however, the energy used for pumps is slightly higher in the GB.
When analyzing the impact of climate change through the three RCP pathways in 2050 and 2090, the energy used for heating will decrease, and increase for cooling, in both buildings, as expected. Generally, the non-GB displays an increase in cooling that is around 2.5 times more significant when compared to the GB. This underlines that the cooling energy used in the non-GB is two times more sensitive to global warming than in the GB. This is due in part to the cooling system with higher efficiency installed in the GB. In contrast, heating energy use follows a similar trend in both buildings. The highest impact on the energy used in both buildings and the production through the photovoltaic system installed in the GB is verified for the 2090 scenarios, as expected due to the higher levels of solar radiation, as seen in Figure 4.
Comparing the peak loads for cooling and heating, the non-GB presents lower resilience to climate change. The cooling peak load is almost four times higher when compared to the GB. The sustainable strategies implemented in the GB, such as the highly energy-efficient equipment for heating and cooling, appear to have a significant impact on the resilience of the GB. However, there are no significant differences in the peak heating load between the buildings. This fact is verified by the levels of thermal comfort that are able to be maintained in the two buildings for the heating system. It is predicted that the number of hours that are not able to maintain the set-point temperatures with a throttling range will decrease by a factor of three in the GB and seven in the non-GB. In contrast, the non-GB suffers from overheating for all scenarios, including the present one, because the cooling system is not able to maintain comfortable temperatures. In both buildings, a significant increase is noticeable in the unmet hours for the cooling system set-points. However, even in the worst-case scenario (RCP8.5), the GB is able to maintain its levels of comfort, emphasizing the higher resiliency of the GB to climate change in providing thermal comfort.
When analyzing the environmental impact for both buildings over time due to climate change, the GB has a lower impact when compared to the non-GB. When accounting only for the impact from the heating and cooling systems, the non-GB emits two times more GHG emissions than the GB.
5. Conclusions
This study compared the impact of climate change on the energy performance of two university buildings, a green and non-green building which were both located near Sydney, Australia. Under present climate conditions, the energy use for cooling and heating in the GB is 40% and 25% lower, respectively, than in the non-GB. To predict future climate conditions, the RCP 2.6, RCP 4.5, and RCP 8.5 pathways for the 2050s and 2090s were used. As expected, in both buildings, heating energy use will decrease, and cooling energy use will increase in the future due to global warming. However, the predicted increase in the GB is significantly lower than the non-GB. In fact, the non-GB is much more sensitive to global warming, so cooling energy use and its peak load in the non-GB can reach up to more than two times and almost four times higher, respectively, than in the GB. In contrast, the predicted changes in heating will be similar in both buildings and will decrease by 70.9% and 68.1% under the high emissions scenario for the non-GB and GB, respectively, in 2090.
The results showed that under the present climate scenario, the non-GB suffers from overheating, which will be intensified in the future. In the GB, the unmet hours increase in future scenarios. However, it will remain at an acceptable level in the future. The results also show an increasing trend in GHG emissions in the non-GB, with a more than 30% increase in the future. However, this increase will be approximately 15.1% under the high emission scenario in the GB.
When comparing the future climate scenarios with present conditions, the results show an increasing trend in the non-GB, with a more than 30% increase in GHG emissions. However, in the GB, the GHG emissions increase by 15.1% when compared to the present scenario.
The GB produces approximately 15.1% and up to 21.9% fewer GHG emissions than the non-GB under present and future climate conditions (RCP 8.5), respectively. It was also found that in our case study, the GB would be between 40 and 50% more resilient to climate change than the non-GB. This research can help designers evaluate the performance of GBs and implement strategies to enhance the climate resilience of GBs. Future research is encouraged to investigate the impact of climate change on (1) different types of GBs (e.g., commercial, school buildings), and (2) different climates. In addition, in this study, RCP scenarios were employed; however, the impact of different climate change scenarios (e.g., shared socioeconomic pathways (SSPs)) on GBs can be investigated.
Author Contributions
Conceptualization, L.A. and K.B.; methodology, L.A. and K.B.; simulation software, L.A.; validation, L.A.; writing—original draft preparation, L.A., K.B. and M.R.R.; writing—review and editing, L.A., K.B. and M.R.R.; visualization, L.A. and K.B. All authors have read and agreed to the published version of the manuscript.
Funding
This research received no external funding.
Data Availability Statement
The data presented in this study are available on request from the corresponding author.
Conflicts of Interest
The authors declare no conflict of interest.
References
- Röck, M.; Saade, M.R.M.; Balouktsi, M.; Rasmussen, F.N.; Birgisdottir, H.; Frischknecht, R.; Habert, G.; Lützkendorf, T.; Passer, A. Embodied GHG emissions of buildings–The hidden challenge for effective climate change mitigation. Appl. Energy 2020, 258, 114107. [Google Scholar] [CrossRef]
- Ipcc (Ed.) Summary for Policymakers. In Global Warming of 1.5 °C: IPCC Special Report on Impacts of Global Warming of 1.5 °C above Pre-Industrial Levels in Context of Strengthening Response to Climate Change, Sustainable Development, and Efforts to Eradicate Poverty; Cambridge University Press: Cambridge, UK, 2022; pp. 1–24. [Google Scholar] [CrossRef]
- Ürge-Vorsatz, D.; Lucon, O.; Akbari, H.; Bertoldi, P.; Cabeza, L.F.; Eyre, N.; Gadgil, A.; Harvey, D.; Jiang, Y.; Liphoto, E.; et al. Climate Change 2014: Mitigation. Chapter 9: Buildings. Report by the Intergovernmental Panel on Climate Change; Intergovernmental Panel on Climate Change: Geneva, Switzerland, 2014. [Google Scholar]
- Yassaghi, H.; Hoque, S. An Overview of Climate Change and Building Energy: Performance, Responses and Uncertainties. Buildings 2019, 9, 166. [Google Scholar] [CrossRef] [Green Version]
- He, Y.; Kvan, T.; Liu, M.; Li, B. How green building rating systems affect designing green. Build. Environ. 2018, 133, 19–31. [Google Scholar] [CrossRef]
- USGBC. Green Building and LEED Core Concepts. In Green Building and LEED Core Concepts Guide, n.d., 2nd ed.; USGBC: Washington, DC, USA, 2014. [Google Scholar]
- Almeida, L.M.M.C.E.; Tam, V.W.Y.; Le, K.N. Quantification of the energy use due to occupant behaviour collected in surveys: A case study of a green and non-green building. J. Build. Perform. Simul. 2020, 13, 777–803. [Google Scholar] [CrossRef]
- Ching, F.D.K.; Shapiro, I.M. Green Building Illustrated; John Wiley & Sons: Hoboken, NJ, USA, 2021. [Google Scholar]
- He, B.-J. Green building: A comprehensive solution to urban heat. Energy Build. 2022, 271, 112306. [Google Scholar] [CrossRef]
- GBCA. Green Star in Focus: The Business Case; Green Building Council of Australia: Barangaroo, Australia, 2020. [Google Scholar]
- GBCA. Introducing Green Star|Together, We Can Build a Sustainable Future; Green Building Council of Australia: Barangaroo, Australia, 2020. [Google Scholar]
- Lin, Y.-H.; Lin, M.-D.; Tsai, K.-T.; Deng, M.-J.; Ishii, H. Multi-objective optimization design of green building envelopes and air conditioning systems for energy conservation and CO2 emission reduction. Sustain. Cities Soc. 2021, 64, 102555. [Google Scholar] [CrossRef]
- Filippini, M.; Obrist, A. Are households living in green certified buildings consuming less energy? Evidence from Switzerland. Energy Policy 2022, 161, 112724. [Google Scholar] [CrossRef]
- Zhao, D.; McCoy, A.P.; Agee, P.; Mo, Y.; Reichard, G.; Paige, F. Time effects of green buildings on energy use for low-income households: A longitudinal study in the United States. Sustain. Cities Soc. 2018, 40, 559–568. [Google Scholar] [CrossRef]
- Scofield, J.; Brodnitz, S.; Cornell, J.; Liang, T.; Scofield, T. Energy and Greenhouse Gas Savings for LEED-Certified U.S. Office Buildings. Energies 2021, 14, 749. [Google Scholar] [CrossRef]
- Zhang, L.; Li, R. Impacts of green certification programs on energy consumption and GHG emissions in buildings: A spatial regression approach. Energy Build. 2022, 256, 111677. [Google Scholar] [CrossRef]
- Capeluto, I.G. The Unsustainable Direction of Green Building Codes: A Critical Look at the Future of Green Architecture. Buildings 2022, 12, 773. [Google Scholar] [CrossRef]
- Almeida, L.; Tam, V.W.Y.; Le, K.N.; She, Y. Effects of occupant behaviour on energy performance in buildings: A green and non-green building comparison. Eng. Constr. Archit. Manag. 2020, 27, 1939–1962. [Google Scholar] [CrossRef]
- Geng, Y.; Ji, W.; Wang, Z.; Lin, B.; Zhu, Y. A review of operating performance in green buildings: Energy use, indoor environmental quality and occupant satisfaction. Energy Build. 2019, 183, 500–514. [Google Scholar] [CrossRef]
- Newsham, G.R.; Birt, B.J.; Arsenault, C.; Thompson, A.J.L.; Veitch, J.A.; Mancini, S.; Galasiu, A.D.; Gover, B.N.; Macdonald, I.A.; Burns, G.J. Do ‘green’ buildings have better indoor environments? New evidence. Build. Res. Inf. 2013, 41, 415–434. [Google Scholar] [CrossRef]
- He, Y.; Wong, N.H.; Kvan, T.; Liu, M.; Tong, S. How green building rating systems affect indoor thermal comfort environments design. Build. Environ. 2022, 224, 109514. [Google Scholar] [CrossRef]
- Altomonte, S.; Schiavon, S.; Kent, M.G.; Brager, G. Indoor environmental quality and occupant satisfaction in green-certified buildings. Build. Res. Inf. 2019, 47, 255–274. [Google Scholar] [CrossRef] [Green Version]
- Nkini, S.; Nuyts, E.; Kassenga, G.; Swai, O.; Verbeeck, G. Evaluation of occupants’ satisfaction in green and non-green office buildings in Dar es Salaam-Tanzania. Build. Environ. 2022, 219, 109169. [Google Scholar] [CrossRef]
- Schiavon, S.; Altomonte, S. Influence of factors unrelated to environmental quality on occupant satisfaction in LEED and non-LEED certified buildings. Build. Environ. 2014, 77, 148–159. [Google Scholar] [CrossRef]
- Kim, S.; Lim, B.T.H.; Oo, B.L. Energy Consumption and Carbon Emissions of Mandatory Green Certified Offices in Australia: Evidence and Lessons Learnt across 2011–2020. Sustainability 2022, 14, 13773. [Google Scholar] [CrossRef]
- Nguyen, A.T.; Rockwood, D.; Doan, M.K.; Dung Le, T.K. Performance assessment of contemporary energy-optimized office buildings under the impact of climate change. J. Build. Eng. 2021, 35, 102089. [Google Scholar] [CrossRef]
- Ismail, F.H.; Shahrestani, M.; Vahdati, M.; Boyd, P.; Donyavi, S. Climate change and the energy performance of buildings in the future–A case study for prefabricated buildings in the UK. J. Build. Eng. 2021, 39, 102285. [Google Scholar] [CrossRef]
- Bamdad, K.; Matour, S.; Izadyar, N.; Omrani, S. Impact of climate change on energy saving potentials of natural ventilation and ceiling fans in mixed-mode buildings. Build. Environ. 2022, 209, 108662. [Google Scholar] [CrossRef]
- Zhou, Y. Climate change adaptation with energy resilience in energy districts—A state-of-the-art review. Energy Build. 2023, 279, 112649. [Google Scholar] [CrossRef]
- Pajek, L.; Košir, M. Exploring Climate-Change Impacts on Energy Efficiency and Overheating Vulnerability of Bioclimatic Residential Buildings under Central European Climate. Sustainability 2021, 13, 6791. [Google Scholar] [CrossRef]
- Bamdad, K.; Matour, S.; Izadyar, N.; Law, T. Introducing extended natural ventilation index for buildings under the present and future changing climates. Build. Environ. 2022, 226, 109688. [Google Scholar] [CrossRef]
- Guo, S.; Yan, D.; Hu, S.; An, J. Global comparison of building energy use data within the context of climate change. Energy Build. 2020, 226, 110362. [Google Scholar] [CrossRef]
- Zhang, C.; Xi, C.; Feng, Z.; Wang, J.; Cao, S.-J. Passive design for green buildings by using green glass space and earth air tunnel. Energy Build. 2022, 273, 112367. [Google Scholar] [CrossRef]
- Bamdad, K.; Cholette, M.E.; Omrani, S.; Bell, J. Future energy-optimised buildings—Addressing the impact of climate change on buildings. Energy Build. 2021, 231, 110610. [Google Scholar] [CrossRef]
- Moazami, A.; Nik, V.M.; Carlucci, S.; Geving, S. Impacts of future weather data typology on building energy performance–Investigating long-term patterns of climate change and extreme weather conditions. Appl. Energy 2019, 238, 696–720. [Google Scholar] [CrossRef]
- ABCA. National Construction Code Building Code of Australia 2019–Volume One; Board, A.B.C., Ed.; ABCA: Greensboro, NC, USA, 2019; Volume One. [Google Scholar]
- MAOTESESS. Portaria n.º 349-D/2013. Diário Da República 1.ª Série N.º 233; MAOTESESS: McLean, VA, USA, 2013. [Google Scholar]
- ASHRAE. ASHRAE Standard 62.1-2013: Ventilation for Acceptable Indoor Air Quality. American Society of Heating; Refrigerating and Air-Conditioning Engineers: Atlanta, GA, USA, 2013. [Google Scholar]
- ANSI/ASHRAE. ANSI/ASHRAE Standard 140-2017: Standard Method of Test for the Evaluation of Building Energy Analysis Computer Programs; American Society of Heating, Refrigerating and Air-Conditioning Engineers, Inc., Eds.; ANSI/ASHRAE: Peachtree Corners, GE, USA, 2017. [Google Scholar]
- ABCA. Handbook Energy Efficiency: NCC Volume One; Australian Building Codes Board: Canberra, Australia, 2019.
- ASHRAE. ASHRAE Guideline 14-2002–Measurement of Energy and Demand Savings; American Society of Heating, Refrigerating and Air-Conditioning Engineers, Inc.: Atlanta, GA, USA, 2002. [Google Scholar]
- Yoon, J.-H.; Lee, E.-J. Calibration Procedure of Energy Performance Simulation Model for a Commercial Building. Division of New and Renewable Energy Research; Korea Institute of Energy Research: Taejon, Republic of Korea, 1999; pp. 305–343. [Google Scholar]
- Gucyeter, B. Calibration of a building energy performance simulation model via monitoring data. In Proceedings of the 2018 Building Performance Analysis Conference and SimBuild Co-Organized by ASHRAE and IBPSA-USA, Chicago, IL, USA, 26–28 September 2018; pp. 542–549. [Google Scholar]
- Raftery, P.; Keane, M.; Costa, A. Calibration of a Detailed Simulation Model to Energy Monitoring System Data: A Methodology and Case Study. In Proceedings of the Building Simulation 2009, Eleventh and I.I. Conference, Editors, Glasgow, Scotland, 27–30 July 2009. [Google Scholar]
- Ren, Z.; Tang, Z.; James, M. Projected Weather Files for Building Energy Modelling User Guidel; CSIRO: Canberra, Australia, 2021. [Google Scholar]
- IPCC. Climate Change 2014: Synthesis Report. Contribution of Working Groups I, II and III to the Fifth Assessment Report of the Intergovernmental Panel on Climate Change; Core Writing Team, Pachauri, R.K., Meyer, L.A., Eds.; IPCC: Geneva, Switzerland, 2014; p. 151. [Google Scholar]
- Belcher, S.E.; Hacker, J.N.; Powell, D.S. Constructing design weather data for future climates. Build. Serv. Eng. Res. Technol. 2005, 26, 49–61. [Google Scholar] [CrossRef]
- ASHRAE. ASHRAE 90-1: Energy Standard for Buildings Except Low-Rise Residential Buildings; American Society of Heating, Refrigerating and Air-Conditioning Engineers, Inc.: Atlanta, GA, USA, 2007; I-P Edition. [Google Scholar]
- ASHRAE. Nonresidential Cooling and Heating Load Calculations. ASHRAE Handbook—Fundamentals; ASHRAE: Peachtree Corners, GE, USA, 2009; Chapter 18; p. 9. [Google Scholar]
- ABCB. Protocol for Building Energy Analysis Software, for Class 3, 5, 6, 7, 8 and 9 Buildings; Australian Building Codes Board: Canberra, Australia, 2006.
- GBCA. Energy Consumption and Greenhouse Gas Emissions Calculator Guide. In Green Star–Design & As Built and in Green Star–Interiors, 4th ed.; GBCA: Barangaroo, Australia, 2015; p. 4. [Google Scholar]
- ABCB. National Construction Code, Building Code of Australia, Class 2 to Class 9 Buildings; ABCB: Canberra, Australia, 2016; Volume One.
Figure 1.
The real buildings and simulated models: (a) GB; (b) non-GB.
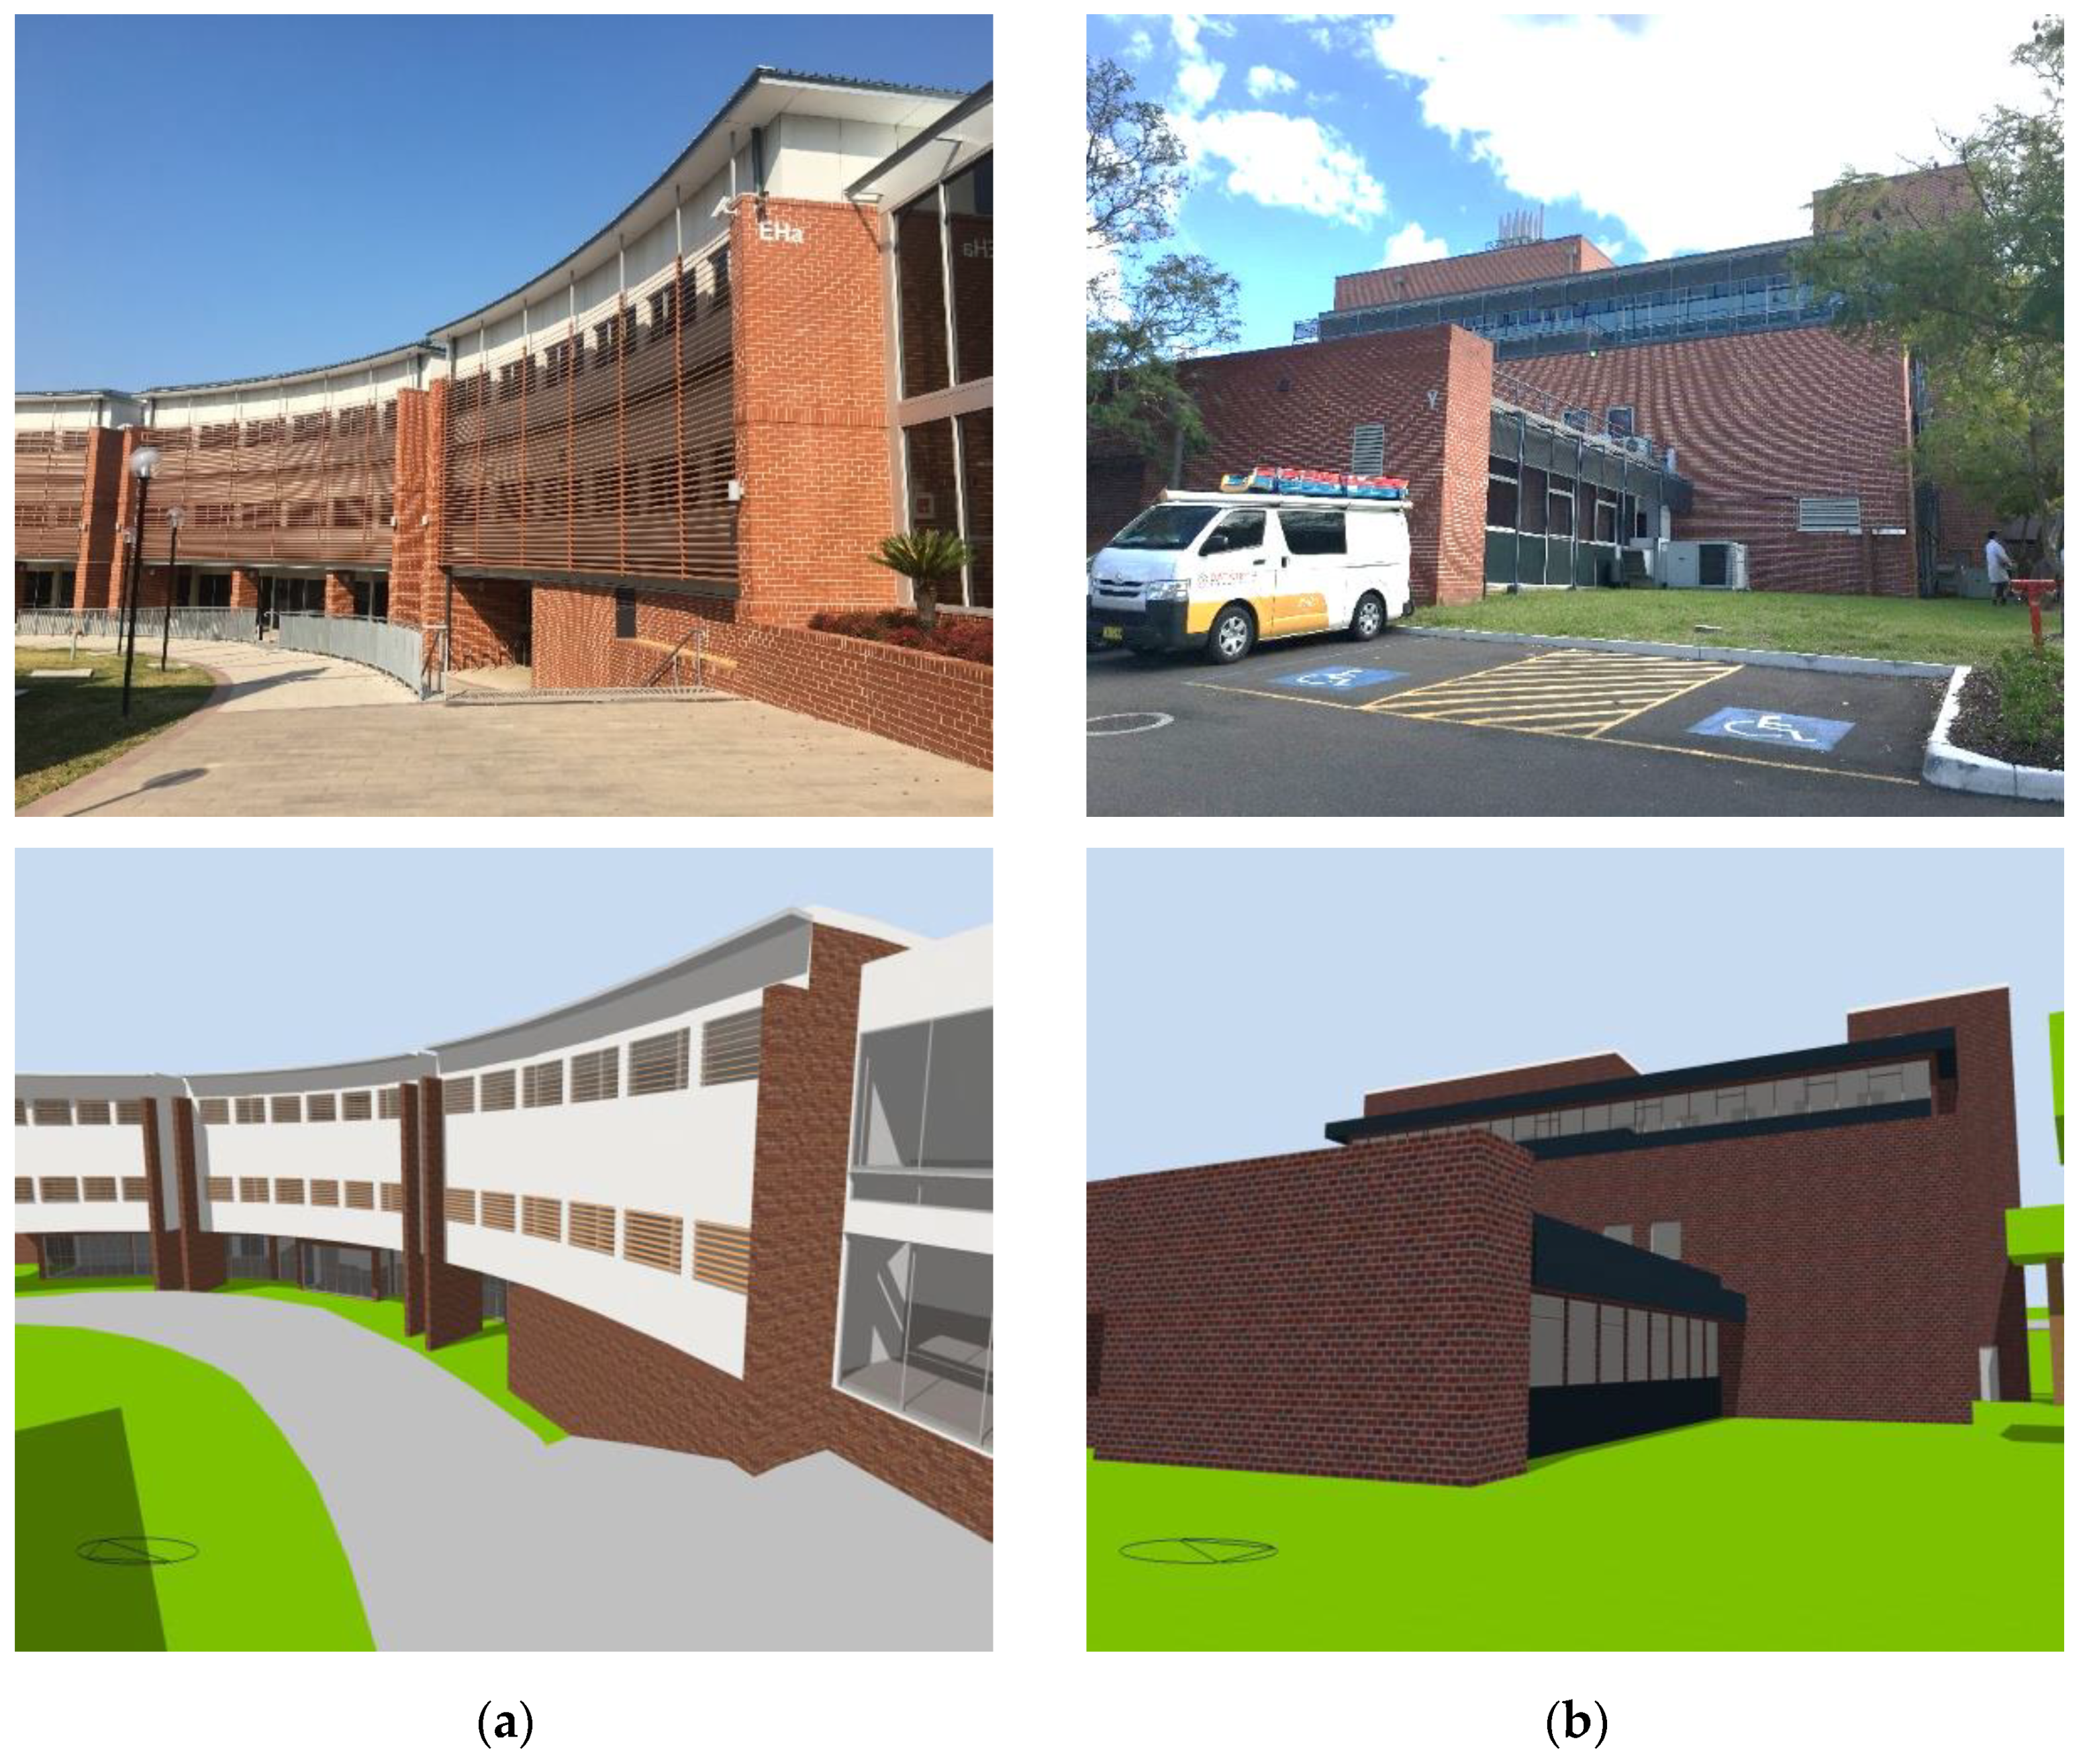
Figure 2.
Example of thermal zones: (a) GB; (b) non-GB.

Figure 3.
Iterative calibration process (partly adopted from [43]), where Mj corresponds to the simulation model at iteration j and Rj represents the results from the simulation at iteration j.
Figure 3.
Iterative calibration process (partly adopted from [43]), where Mj corresponds to the simulation model at iteration j and Rj represents the results from the simulation at iteration j.

Figure 4.
Annual present and projected temperature and radiation: (a) Parramatta; (b) Richmond.

Figure 5.
The impact of climate change on (a) Parramatta; (b) Richmond.

Figure 6.
Simulation results expressed in (a) energy intensity (kWh/m2); (b) percentage for the GB and non-GB.
Figure 6.
Simulation results expressed in (a) energy intensity (kWh/m2); (b) percentage for the GB and non-GB.

Figure 7.
Simulation results of the peak loads for the GB and non-GB: (a) cooling; (b) heating.

Figure 8.
PV production: (a) normalized production per kWp installed; (b) performance ratio.


Table 1.
Characteristics of the proposed buildings.
| GB | Non-GB | |
|---|---|---|
| Building type | University building | |
| Main activities | Laboratories, computer-/classrooms, offices, and corridors | |
| Building dimensions | 5696 m2 (20,563 m3) of a 3- storey 5181 m2 (18,868 m3) conditioned area | 5242 m2 (19,757 m3) of a 5-storey 4667 m2 (17,012 m3) conditioned area |
| Walls | 2749 m2 R2.34 insulated extruded polystyrene (XPS) masonry walls (0.35 to 1.78 W/m2-K) | 3228 m2 R2.30 Insulated extruded polystyrene (XPS) masonry walls (0.35 to 1.78 W/m2-K) |
| Windows | 707 m2 with double glass (3.63 W/m2-K; SHGC 0.43) with permanent external shading and dark-colored drapes | 620 m2 with single glass (5.90 W/m2-K; SHGC 0.86) with permanent external shading and pink-colored drapes |
| Roof | 2373 m2 R3.6 insulated glass wool (0.16 to 0.25 W/m2-K) | 1986 m2 R3.5 insulated glass wool (0.16 to 0.25 W/m2-K) |
| Skylights | 52 m2 with double glass (3.63 W/m2-K; SHGC 0.43) | 8 m2 with single glass (5.90 W/m2-K; SHGC 0.86) |
| Heating | Natural gas condensation boiler (90%) | Natural gas boiler (72%) |
| Cooling | Chiller EER 5.5 | Chiller EER 4.7 |
| Mechanical ventilation and infiltration | Minimum 150 L/s with 70% efficient ERV with heat recovery; temperature and humidity (50%) control; motion, CO2, and VOC sensors (infiltration 0.6 ACH) | Average 200 L/s with 70% efficient ERV; temperature and humidity (50%) control (infiltration 0.7 ACH) |
| Indoor climate control strategy | Fully air-conditioned | |
| Hot water | Instant electric hot water boiler supplying water at 55 °C | Instant electric hot water boiler supplying water at 55 °C |
| Lighting | LED lighting with motion sensors | Generally fluorescent tubular and compact lighting; some areas have been recently retrofitted with LED lighting with motion sensors |
| Appliances and equipment | Computers, monitors, printers, laboratory equipment, data centres * | |
| PV | 99.1 kWp (374 modules; 625 m2) with polycrystalline silicon modules 15% nominal efficiency, 95% efficient inverter (100 kWac) | N.A. |
| Average equipment intensity | 16.04 W/m2 | 23.15 W/m2 |
| Average light intensity | 6.07 W/m2 | 10.85 W/m2 |
| Average occupancy intensity ** | 0.16 occ/m2 | 0.11 occ/m2 |
| Performance indicators | Annual energy | |
| Temporal resolution (simulations) | Annual | |
* Per conditioned area. ** Additional equipment such as speakers, fridges, dishwashers, toasters, microwaves, TVs, video camaras, and coffee machines, among others, were also taken into account for the purpose of this study.
Table 2.
Predicted PV production for the GB.
| 2050 | 2090 | |||||||
|---|---|---|---|---|---|---|---|---|
| GB | Present | RCP 2.6 | RCP 4.5 | RCP 8.5 | RCP 2.6 | RCP 4.5 | RCP 8.5 | |
| PV system | Production (MWh/yr) Changes (%) | 137.2 | 140.1 | 138.5 | 138.5 | 141.7 | 141.1 | 141.4 |
| -- | 2.06% | 0.90% | 0.94% | 3.23% | 2.83% | 3.06% | ||
Table 3.
Unmet hours for heating and cooling periods for both GB and non-GB.
| 2050 | 2090 | |||||||
|---|---|---|---|---|---|---|---|---|
| Time setpoint not met during: | Present | RCP 2.6 | RCP 4.5 | RCP 8.5 | RCP 2.6 | RCP 4.5 | RCP 8.5 | |
| Occupied heating | non-GB | 37.5 | 25 | 24 | 20 | 29 | 16 | 4.5 |
| GB | 55.5 | 35.5 | 36.5 | 31.5 | 37.5 | 29 | 13.5 | |
| Occupied cooling | non-GB | 842 | 1050.5 | 1001 | 1092.5 | 1025 | 1160.5 | 1429.5 |
| GB | 24 | 69 | 66 | 80.5 | 71.5 | 107 | 246.5 | |
Table 4.
Total energy use and greenhouse gas emissions for both GB and non-GB.
| 2050 | 2090 | |||||||
|---|---|---|---|---|---|---|---|---|
| Present | RCP 2.6 | RCP 4.5 | RCP 8.5 | RCP 2.6 | RCP 4.5 | RCP 8.5 | ||
| Total Energy (kWh/m2yr) | Non-GB | 195.0 | 198.6 | 197.5 | 199.6 | 198.0 | 202.1 | 212.2 |
| GB | 165.5 | 164.2 | 164.6 | 164.2 | 164.0 | 164.0 | 165.8 | |
| Changes (%) | −15.1% | −17.3% | −16.7% | −17.7% | −17.2% | −18.9% | −21.9% | |
| GHG Emissions * (kgCO2-eq/m2yr) | Non-GB | 156.5 | 161.9 | 161.1 | 163.7 | 161.5 | 166.6 | 177.7 |
| GB | 133.5 | 134.3 | 134.7 | 135.0 | 133.9 | 135.3 | 138.6 | |
| Changes (%) | −14.7% | −17.1% | −16.4% | −17.6% | −17.1% | −18.8% | −22.0% | |
* The GHG emissions were calculated for the natural gas and electricity end uses based on the report by the Commonwealth of Australia [41].
Table 5.
Greenhouse gas emissions for the combined energy use for cooling and heating for the GB and non-GB.
Table 5.
Greenhouse gas emissions for the combined energy use for cooling and heating for the GB and non-GB.
| 2050 | 2090 | |||||||
|---|---|---|---|---|---|---|---|---|
| Present | RCP 2.6 | RCP 4.5 | RCP 8.5 | RCP 2.6 | RCP 4.5 | RCP 8.5 | ||
| GHG Emissions (kgCO2-eq/m2yr) | non-GB | 46.4 | 50.3 | 49.5 | 52.2 | 49.5 | 55.1 | 66.3 |
| GB | 27.5 | 28.5 | 28.6 | 28.9 | 28.5 | 29.6 | 32.4 | |
| Changes (%) | −40.7% | −43.2% | −42.1% | −44.6% | −42.5% | −46.3% | −51.1% | |
Disclaimer/Publisher’s Note: The statements, opinions and data contained in all publications are solely those of the individual author(s) and contributor(s) and not of MDPI and/or the editor(s). MDPI and/or the editor(s) disclaim responsibility for any injury to people or property resulting from any ideas, methods, instructions or products referred to in the content. |
© 2023 by the authors. Licensee MDPI, Basel, Switzerland. This article is an open access article distributed under the terms and conditions of the Creative Commons Attribution (CC BY) license (https://creativecommons.org/licenses/by/4.0/).
Share and Cite
MDPI and ACS Style
Almeida, L.; Bamdad, K.; Razavi, M.R. A Comparative Case Study of Certified and Non-Certified Green Buildings and Their Response to Climate Change. Buildings 2023, 13, 977. https://doi.org/10.3390/buildings13040977
AMA Style
Almeida L, Bamdad K, Razavi MR. A Comparative Case Study of Certified and Non-Certified Green Buildings and Their Response to Climate Change. Buildings. 2023; 13(4):977. https://doi.org/10.3390/buildings13040977
Chicago/Turabian StyleAlmeida, Laura, Keivan Bamdad, and Mohammad Reza Razavi. 2023. "A Comparative Case Study of Certified and Non-Certified Green Buildings and Their Response to Climate Change" Buildings 13, no. 4: 977. https://doi.org/10.3390/buildings13040977
Note that from the first issue of 2016, this journal uses article numbers instead of page numbers. See further details here.