1. Introduction
Cities are increasingly unsuited to the changing climate and vulnerable to it due to their settlement patterns, constructive practices and living habits. In all cities and urban areas, the risks faced by people and assets from hazards associated with climate change have increased, and global urbanisation offers a time-limited opportunity to work towards widespread and transformational adaptation and climate-resilient development [
1].
Scientifically addressing the issue of climate-proof design requires the development of knowledge models and processes capable of managing the complexity of information needed to guide the transformation of the built environment in a way that integrates the diverse demands of environmental design, including those related to social and economic conditions.
In general, the term resilience is used to describe the ability of a system to return quickly to its initial state of equilibrium following a disturbance generated by an external phenomenon [
2].
Climate resilience corresponds to the system’s ability to quickly stabilise following phenomena related to climate change processes, such as climate impact/risk scenarios. Climate resilience studies focus on the reduction in the system vulnerability as a measure of adaptation to climate change [
3,
4,
5].
The Sixth Assessment Report of the Intergovernmental Panel on Climate Change (IPCC) points out that climate change impacts and risks can be reduced and managed through adaptation and mitigation actions, assessing—together with needs, options, opportunities, constraints, limits and other aspects related to adaptation—resilience as a qualifying factor. In the report, climate resilience is defined as the capacity of social, economic and environmental systems to cope with a harmful event or trend, or a disruption generated by climatic phenomena, responding or reorganising themselves without losing their essential function, identity and structure, and also maintaining the capacity to adapt, learn and transform [
1].
Climate resilience thus represents the capacity to respond to unpredictable socio-economic, environmental, physical–functional and organisational hazard-specific and site-specific stresses. In relation to the relationship between urban systems and climate change, resilience represents the capacity to respond to unforeseen climate impacts in terms of the prevention, adaptation, reorganisation and evolution of systems. This capacity can be measured in terms of the response towards the minimisation of the impacts/risks of intense and extreme climatic events, linking to spatial and functional environmental conditions, as well as to processual, governance or technical/constructive aspects, which require the implementation of forecasting and prevention strategies, adaptation to impacts, reductions in vulnerabilities and the planning of mitigation measures.
This research aims to measure the resilience capacity of an urban system through appropriate climate-proof adaptation and mitigation actions on the built environment to reduce the vulnerability and climate impacts/risks of the system. The model is implemented in a framework developed with the support of a Geographic Information System (GIS) that integrates the hierarchical model proposed in [
6] for estimating the vulnerability of the urban system and the impacts generated by the heatwave phenomenon, along with the process of the optimal selection of adaptation and mitigation actions for residential buildings that increase the perceived comfort and reduce CO
2 emissions. Resilience is then measured in terms of the vulnerability and impact reduction.
We therefore developed a model for assessing climate resilience scenarios for the heatwave phenomenon by implementing a database of multi-scalar technical and design solutions for climate adaptation and CO2 mitigation for buildings. The GIS-based model developed was tested in the context of the city of Naples and can potentially be implemented in all Italian urban contexts using open data available from institutional bodies.
The goals of the research are as follows:
The implementation, in a GIS-based framework, of a model for assessing urban climate impacts and measuring the resilience of the built environment, focussed on selecting optimal building design climate-proof solutions;
The development of a process for identifying and selecting optimal climate-proof solutions by measuring the thermal comfort and reduction in CO2 emissions in residential buildings;
The measurement of the resilience effectiveness of climate-proof actions by assessing their effects on reducing the vulnerability of the built environment and climate impacts generated by heatwave scenarios;
The replicability of the model on an urban scale by partitioning the urban study area into census zones, making up the atomic information units. Reducing the scale to the census-area level simplifies data gathering and allows the model to be implemented in different urban contexts.
State of the Art
Studies on the resilience of the built environment can be divided into research assessing the resilience of the built environment at the urban scale and building scale.
Some researchers have proposed definitions of resilience at the urban scale independently of a specific disruptive phenomenon. In [
7], the resilience of the urban environment is assessed in terms of ecosystem services. In [
8], it is defined in terms of the adaptability of the urban system, rather than the adaptation to a specific phenomenon, and the urban system is organised as a complex and adaptive system composed of socio-ecological and socio-technical networks modelled at different scales. In [
9], the resilience of an urban system or its entity is defined as the ability to provide adequate performance and services under a wide range of circumstances. A more articulated definition of the resilience of an urban system is undertaken in [
10], in which the authors divide urban resilience into five dimensions: natural, economic, social, physical and institutional, and establish eleven characteristics of the urban system that must be evaluated in order to estimate its resilience: redundancy, robustness, connectivity, independence, efficiency, resources, diversity, adaptation, innovation, inclusion and integration.
Other authors have explored the concept of urban resilience as the adaptability to external perturbations. In [
11], it is defined as the ability of the urban system to dynamically respond and effectively withstand the impacts generated by unforeseen phenomena and events due to climate change while maintaining an acceptable level of daily liveability. The authors of [
12] define urban resilience as the ability of the urban system to adapt to destructive and extreme events, such as earthquakes. An assessment of urban resilience in terms of optimally managing water flows generated by climatic phenomena is made in [
13].
Studies on the resilience of the built environment at the building scale simulate external perturbations on buildings to test their response and adaptability to the absorption of the disturbing phenomenon. In [
14], the resilience of the built environment is assessed by measuring the robustness of the building with respect to perturbations produced by seismic events. An assessment of building resilience in terms of robustness to external disturbances produced by extreme weather phenomena from occupant behaviour or policy change is made in [
15]. In [
16], a hybrid approach integrating an urban-scale fluid dynamics model of microclimate modelling and an energy model of urban buildings is used to assess the resilience of the urban system in cases of energy crisis. The authors tested this approach by simulating a snowstorm on an island near the city of Montreal, Canada, in order to measure the resilience of buildings to the risk of a three-day storm-related power outage.
Recent work has focussed on assessing the resilience of the built environment to disturbances caused by climate change phenomena. In [
17,
18], the behaviour of buildings in response to intense rainfall is simulated. In [
19], an approach is proposed to determine optimal energy retrofit solutions for buildings in the presence of disturbances generated by climate change. A summary of recent studies evaluating the climate resilience of buildings is given in [
20].
The main limitation of models for estimating the climate resilience of the built environment at the building scale is their low degree of replicability due to both the difficulty of gathering information at a detailed scale and the dependence of the model on too many intrinsic and environmental parameters that depend on local characteristics.
Urban-scale models may produce inaccurate estimates of the vulnerability and impacts, especially in metropolitan urban contexts in which there are multiple urban fabrics and different morphological and technological characteristics.
In this study, a GIS-based framework for assessing the resilience effectiveness of climate-proof actions in urban contexts is proposed as an optimal trade-off between fine-scale models, which are not very replicable in different contexts, and urban-scale models, which may produce inaccurate results. The choice of the census area as an atomic spatial entity not only guarantees the availability of the data in different urban contexts, but also allows for the provision of results with acceptable accuracy; in fact, the census area represents an area of the urban study context that is homogeneous in terms of urban, morphological and technological characteristics, and it is the minimum territorial reference unit for which census data are available on the resident population, dwellings and presence of industries and services.
The following section presents our framework, describing its architectural and functional characteristics. The results of the experimental tests performed on the study area of the municipality of Naples (Italy) to select the optimal climate-proof actions are presented in
Section 3.
Section 4 presents the thematic synthesis maps of climate resilience, adaptation and mitigation. Discussions on the benefits and limitations of the proposed model and future research perspectives are outlined in
Section 5.
2. The Proposed Heatwave Climate Resilience Model
In order to ensure a trade-off between the accuracy of the results and the availability of data, the atomic spatial element considered in our model is the census area, used both for the generation of vulnerability maps and for hazard and impact scenarios.
Starting from the vulnerability maps of the urban subsystems and from the hazard and impact scenario maps, a process was tested to assess the levels of resilience, classifying the census areas by building type in order to select the most effective actions to reduce the impacts/risks of heatwave scenarios and increase the adaptation and mitigation capacities. The actions were chosen from a set of technical alternatives implemented in a database.
The model of [
6] is a hierarchical model applied for the assessment of the vulnerability of the urban fabric and the impact scenarios generated by the heatwave phenomenon. It subdivides the physical urban system into two subsystems: buildings and open spaces, and it determines the vulnerabilities of the two subsystems from indexes measuring the parameters that characterise them. Focussing on the heatwave phenomenon, the vulnerabilities of the building subsystems are assessed from four intermediate indicators: phase shift, attenuation, volume and solar radiation, and the vulnerabilities of the open spaces are determined from four indicators: the sky-view factor, albedo, Normalized Difference Vegetation Index (NDVI) and solar radiation.
Following the AR6 model, the impact scenario on the resident population generated by a hazard scenario of the heatwave phenomenon is determined from the vulnerabilities of the physical components, residential buildings and open spaces (Intrinsic Vulnerability), the exposure and the hazard scenario (
Figure 1). The combination of the exposures and vulnerabilities of the two physical systems generates a combined vulnerability, which takes into account the relevance of the value exposed to the hazard and the vulnerabilities of the two subsystems.
In the framework, this model is applied to determine the vulnerabilities of the two subsystems and the impact scenarios; all indicators are determined for all the census zones into which the study area is partitioned.
The selection of the optimal climate-proof action is performed by selecting from a database of climate-proof technical solutions for the built environment those that provide the greatest reduction in the level of CO2 emissions of buildings and increase indoor comfort.
In order to select the optimal climate-proof action for buildings in a census section, a classification algorithm of the census sections by recurring building typologies is performed. The climate-proof action applied to the census section is the one that optimises the indoor comfort and CO2 emission reduction for the recurring building typologies in that section. Outputs of the process of selecting optimal climate-proof solutions are indoor comfort maps (climate-adaptive maps) and CO2 emission maps (mitigation maps).
The resilience effectiveness of the selected climate-proof solutions is measured by generating a new impact scenario map, called a climate resilience map, which shows for each census section the new impact class values.
The new impact scenario is obtained by reassessing the vulnerabilities of the buildings and rerunning the model for generating the impact scenario described in
Figure 1.
The framework is schematised in
Figure 2.
The census section classification algorithm for recurring building typologies classifies buildings according to the following dimensional parameters: floor area, number of floors, total height and window-to-wall ratio (WWR). The set of building typologies is developed according to the urban context to which the study area refers, and typical average values of the four dimensional parameters for each building typology are assigned for that building. Once the complete set of building typologies has been constructed by assigning typical values of the floor area, number of floors, total height and window-to-wall ratio (WWR) to each building type, the algorithm assigns the census section to the building typologies for which the values of the dimensional parameters are closest to those of the majority of the buildings in the census section.
The climate-proof technical solutions database includes the different climate-proof solutions organised by building typology, construction period and construction technique. After classifying each census section by the prevailing building type, construction period and related construction techniques, the climate-proof solution that optimises the indoor comfort and CO2 reduction values is selected from the database of technical solutions for that building typology.
Indoor comfort and CO2 emission indicators corresponding to those assessed for the section’s prevailing building type are assigned to each census section; finally, the related climate adaptation and mitigation maps are generated.
Moreover, the climate resilience map corresponding to the new impact scenario map (climate resilience map) constructed from the new vulnerability values of the building’s subsystem calculated from the new values of the phase shift, attenuation, solar radiation and volume indicators attributed to the buildings in the section is generated. The climate resilience map provides information on the spatial distribution of the resilience capacity of the applied climate-proof actions, measured by comparing it with the ex ante-generated impact scenario map.
The database of climate-proof technical solutions and the set of building typologies need to be tailored to the type of urban fabric that characterises the study area.
The framework proposed in this article has been realised for its application to Italian urban settlements. As a demonstrative example, its application to the case of the city of Naples is reported. The following section describes in detail both the test environment and the results of the application test of the framework carried out on the dense urban fabric that constitutes the city of Naples (Italy).
3. Testing on a Case Study: The Municipality of Naples (Italy)
The model for generating the adaptive- and mitigating-capacity maps was tested on the area of the municipality of Naples (Italy). The reasons for choosing this urban fabric are the complexity and diversity of the urban forms that characterise it. In fact, the city of Naples represents a dense urban fabric characterised by different urban settings, ranging from historical consolidated urban areas to recently built-up settlement fabrics.
The municipality of Naples is segmented into 4301 census zones; for each residential census zone, the Italian National Institute of Statistics (ISTAT) provides all the information on the resident population and built environment.
The first step of the testing activity was the construction of vulnerability and impact scenario maps of the heatwave phenomenon. For this purpose, the following datasets were gathered from various institutional sources:
Light Detection and Ranging (LIDAR) high-resolution Digital Terrain Model (DTM) and Digital Surface Model (DSM) raster datasets of the study areas with a cell size of 1 m × 1 m provided by the Italian Ministry of Environment;
A topographic database of the study areas on a spatial scale of 1:5000;
An ISTAT last-census dataset on a spatial scale of 1:10,000;
The satellite NDVI, albedo and sky-view factor in raster format with a cell size of 1 m × 1 m;
Satellite soil temperature data measured in day and night hours during a heatwave period in raster format with a cell extension equal to 1 m × 1 m.
To obtain the vulnerability and impact scenario maps, the model of [
6] was implemented. All features required for the calculation of the subsystem vulnerability indicators were aggregated by census area.
In the test, the exposure is constituted by the density of the low-end population residing in the census area, where low-end is defined as the resident population consisting of pre-school children and the elderly.
The hazard scenario refers to a medium-term period (2041–2070) and the Representative Concentration Pathway (RCP) 4.5 climate change model provided by the Intergovernmental Panel on Climate Change, which provides for a constant concentration of greenhouse gases until 2100 [
21].
Figure 3 shows the final map for the medium-term impact scenario.
On the impact scenario map, the most critical census areas (classified as High or Medium–High) are 43% of all the residential census areas; in addition, 34% of the residential census areas are classified as Medium and 23% as Medium–Low or Low.
The next step of the testing activity involved defining the set of building typologies and the database of climate-proof technical solutions.
The climate-proof solutions database contains retrofit solutions for the building envelope aimed at reducing energy consumption and improving thermal comfort, including the use of efficient systems and photovoltaic systems. These were identified with respect to the most popular solutions found in the literature [
22,
23,
24].
For each climate-proof solution included in the database, both the phase-shift and attenuation values and the impact of the technical solutions on CO2 emissions and indoor comfort were evaluated with the aid of simulation tools.
After the database of climate-proof solutions was built, an algorithm for classifying the census zones by the prevailing building typology and construction period of the buildings located in the sections was tested.
The classification of the census areas by building typology and prevalent construction period enabled the assessment of the CO2 emission and indoor comfort values of the buildings located in the sections and the identification of climate-proof solutions that optimise the improvement in indoor comfort and the reduction in CO2 emissions. Finally, the new impact maps for the medium-term heatwave scenario were generated.
The following paragraphs describe the steps used for the construction of the climate-proof solution database and the generation of the new impact scenario summarised below:
Identification of the recurring building typologies in the urban study area and selection for each building type of a sample of buildings covering the different combinations of construction periods and building envelope techniques;
Taking into account the climatic characteristics of the study area, the set of sample buildings was assessed using energy simulation software in order to determine the behaviour of each combination in terms of CO2 emissions and indoor comfort;
Identification of climate-proof solutions that impact on sample buildings in terms of CO2 emissions and indoor comfort;
Classification of census zones by prevailing building typology and construction period;
Generation of new CO2 emission and indoor comfort maps per census area;
Generation of the new impact scenario map.
3.1. Identification of Recurring Building Typologies and Selection of the Sample of Buildings
To assess the levels of CO2 emissions and indoor comfort of buildings, both the recurring building typologies in the urban context and commonly used construction techniques were identified.
The recurring residential building typologies were defined on the basis of the literature [
25,
26,
27]. They refer to four categories (detached houses (one/two-family), in-line buildings, block buildings and tower buildings) to which are associated specific dimensional characteristics (surface area, number of floors, total height and window-to-wall ratio), as shown in
Figure 4.
The intersection and comparison of the data obtained from the literature and current Italian legislation [
25,
28,
29] allowed for the identification of the construction techniques most used in the Italian climatic macro-region of Naples. Thus, the set of commonly used techniques was created, and the thermophysical parameters, such as the transmittance, phase shift and attenuation, were determined with the help of simulation software validated by the Italian Thermotechnical Committee. An example of prevailing construction technique is in
Figure 5.
Moreover, the most widespread construction periods were classified taking into account the entry into force of restrictive requirements on the energy efficiency of buildings in the Italian national legislation, the main historical events that have occurred in Italy and caused changes in the world of building production and, finally, the periods identified by the National Institute of Statistics (ISTAT) in the permanent population and housing census.
The classification of the construction periods is as follows:
Until 1945: period from the beginning of the 20th century to the period between the two world wars;
From 1946 to 1975: phase of the Reconstruction and the economic boom in Italy;
From 1976 to 1990: first Italian legislative provisions on the energy efficiency of buildings;
From 1991 onwards: restrictive requirements on energy performance for new buildings.
The construction techniques identified were correlated to the four recurring building typologies in urban fabrics; each recurring building type has been characterised in each of the four periods with specific commonly used construction techniques (the only exception is the tower building, not present in Italy before 1945). In
Figure 6 is shown the classification of the prevailing construction techniques with respect to the building typologies.
3.2. Simulations of Energy Demand, CO2 Emissions and Indoor Comfort of Buildings
The simulations of the energy demand and CO2 emissions were performed on sample buildings using energy certification software (MasterClima MC 1130) and considering the construction techniques of the sample of buildings.
In the simulations, the heating and cooling systems’ characteristics were identified, analysing the most widespread solutions in the residential sector, which refer to the following plants:
For heating and domestic hot water, a standard 24 kW gas boiler with distribution via radiators positioned on the external wall;
For cooling, the use of three cold air-only splits with a nominal power of 2.5 kW;
The input of envelope data and systems data allowed for the simulation of CO2 emissions and primary energy demand for heating, hot water and cooling.
The assessment of indoor comfort was instead performed with the use of a parametric tool (Grasshopper), and the metrics used were the Predicted Mean Vote (PMV) and the Operative Temperature (OT).
The simulations concerning indoor comfort were carried out by selecting the average climatic values of the city of Naples during summer periods. The three-dimensional models of the buildings were carried out with the aid of dynamic simulation software (EnergyPlus), breaking down a building into homogeneous thermal zones to optimise the reading of its components. These thermal zones were assigned dispersing surfaces, physical–thermal characteristics of the stratigraphies (thickness, specific heat (C [J/kg·K]), density (ρ [kg/m3]), thermal conductivity (λ [W/m·K]), occupancy schedule and the data relative to the systems.
The structure with which these data were organised, with the intention of reflecting the logical relationships between them, is known as a data tree, which arranges the data into branches, each corresponding to a list of values or a series of further branches.
3.3. Construction and Implementation of the Database of Climate-Proof Technical Solutions
With regard to climate-proof buildings, one of the key challenges lies in the ability to ensure adequate comfort conditions during extreme events or protracted climatic stresses. A crucial role is played in this case by the building envelope, which, in terms of resilient response, plays the role of mediator between the external climatic conditions and internal environmental conditions. Action on the envelope and, secondarily, on the systems of residential buildings makes it possible to optimise energy consumption and guarantee a reduction in CO2 emissions.
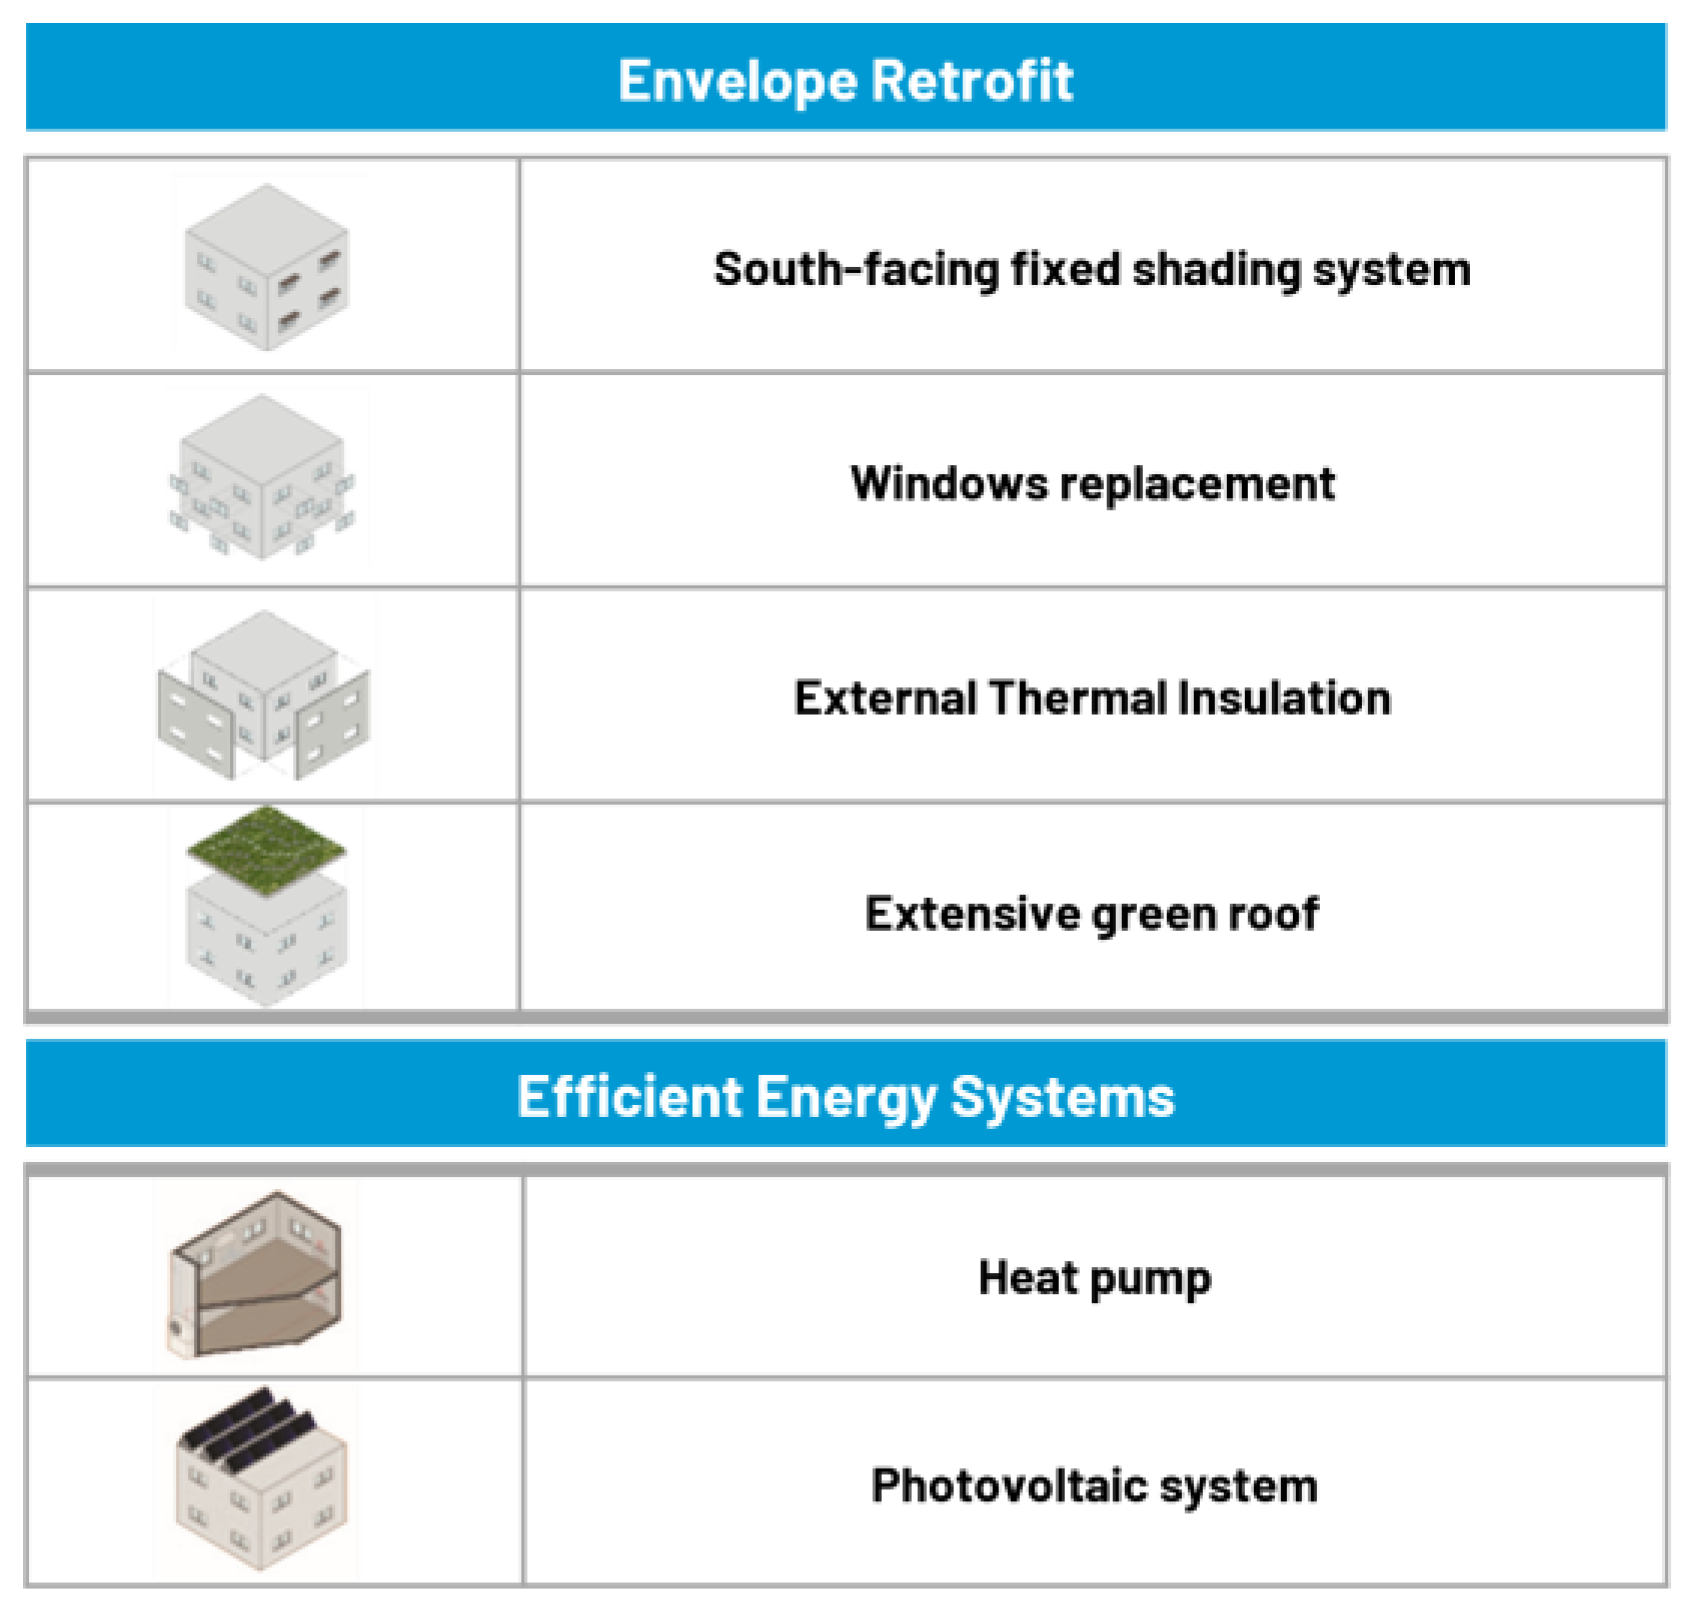
Among the solutions now consolidated and in line with the most widespread best practices at the European level, specific technical solutions have been identified and divided into two categories: envelope retrofit and efficient energy systems (
Figure 7).
The following interventions fall under the category retrofit of the envelope:
South-facing fixed-shading systems: these allow for the creation of shaded areas in summer on windows, allowing a reduction in the thermal impact of solar radiation and improving indoor comfort;
Window replacement: high-thermal-performance windows and doors enable the reduction in heat loss and, thus, in energy requirements and CO2 emissions;
External thermal insulation: this reduces thermal bridges and heat loss, improves thermal transmittance, phase shifting and attenuation, reduces the building’s energy requirements and, consequently, CO2 emissions, as well as enhances indoor comfort;
Extensive green roofs: just as thermal insulation reduces heat loss by positively influencing the building’s energy demand, the presence of vegetation allows for the absorption of carbon dioxide and an increase in solar reflectance;
As far as efficient energy systems are concerned, two solutions were selected: (1) Reversible heat pumps, which are systems that enable heating and cooling without combustion phenomena, greatly reducing CO2 emissions, by extracting heat from a natural source (air, water, earth) and transferring it indoors with the help of electricity. Combined with photovoltaic systems, they guarantee the reduction in energy requirements; (2) Photovoltaic systems, which are systems that use solar energy to produce electricity without any emissions of CO2 or other pollutants.
The definition of climate-proof technical solutions to be applied to sample buildings allowed for the development of a database on climate mitigation and adaptation. The database arose from the need to evaluate the technical alternatives that can be considered most effective in the energy efficiency of residential buildings, the mitigation of CO2 emissions and the improvement in indoor comfort.
The simulations carried out constitute the knowledge base against which to evaluate the effectiveness of the single technical alternatives and the categories of considered intervention, as well as the improvement that would occur if all the climate-proof alternatives identified were applied.
In the climate mitigation database, sheets were constructed for each building type and for each building period that return the values obtained from the simulations per single intervention and per set of actions. Each sample building is characterised by the following features:
For each solution, the new energy demand and CO
2 reduction values, both expressed as kg/m
2 per year and in percentage terms, are assigned for a given building type and construction period (
Figure 8).
Similarly, the database for the climate adaptation of residential buildings was constructed (
Figure 9). Starting from the same input data described above and the same climate-proof intervention categories, current and medium-term comfort values were simulated (2050s).
3.4. The GIS-Based Classification Method Applied to Detect the Prevailing Building Types
A classification of each census area into which the municipality of Naples is subdivided by building typology and prevalent construction period was implemented on the GIS platform.
For each of the recurring building typologies, the value ranges of its prevailing characteristics were defined: surface area, height and shape index. They are shown in
Figure 10.
To assign the prevailing building typology to each residential census area, the polygonal spatial dataset representing the buildings included in the topographic database was used; the DTM and DSM rasters were used for the assessment of building heights and volumes. The shape index of each building was estimated by calculating the ratio between the surface area and the square of the building perimeter. This value varies in a range between 0 and 1: the closer it is to 1, the more regular the shape of the building; conversely, the closer it is to 0, the more irregular the shape of the building.
Each census area is classified with the most prevalent building typology among those to which the buildings located in it are assigned.
Census areas in which there is no specific prevalence of one or two building types are labelled ‘Not identifiable’, as they are not assigned to a specific building type. ‘Mixed’ is used to classify those census areas where there is more than one prevalent building type.
Figure 11 shows the thematic map with the distribution of the prevailing building types by census areas. Empty census zones are non-residential census zones with no buildings, which are excluded from the classification.
In order to assign to each census area the prevalent construction period of the buildings located in it, a breakdown of the construction period was made into four epochs (Until 1945; From 1946 to 1980; From 1981 to 1990; From 1991 onwards) by grouping the construction periods according to the entry into force of restrictive requirements on the energy efficiency of buildings in Italian legislation and the main periods of change in the world of building production in Italy.
The census area was assigned the construction period of most of the buildings located in it. A further class of construction period labelled ‘Mixed’ was added to the census areas in which there is no prevalence of buildings constructed in the same period.
Figure 12 shows the thematic map of the prevailing construction periods per census area.
The analysis of the two thematic maps of building typologies and construction periods shows that the Historic Centre of the city of Naples is characterised by a prevalence of block buildings built in a historical period prior to 1946. Furthermore, the recurring census zones in areas of the city where there has been building expansion since the end of World War II fall mainly in the From 1946 to 1980 and From 1981 to 1990 classes, and the prevalent building types are detached houses and in-line buildings.
3.5. Construction of the Indoor Comfort and CO2 Emission Thematic Maps
The classification of the census areas by recurring building typology and period of construction allowed for an assessment of the indoor comfort and CO2 emission levels of the buildings located in each section, based on the values resulting from the simulations.
In particular, regarding the CO2 emission levels, each section was classified according to the range of CO2 values estimated for buildings of the same building type and construction period as the prevailing ones located in the section. Where the section is classified as a ‘Mixed’ building type, it is assigned the average comfort and CO2 values attributed to the prevailing building types for the construction period to which the section is assigned. This average is carried out for all building types if the census section is classified with the building type ‘Not identifiable’.
This allowed for the generation of the thematic map of the CO
2 emissions of buildings per census area shown in
Figure 13.
It shows that in the great majority of the peripheral census areas of the city of Naples, which are mainly characterised by single-house buildings, the level of CO2 emissions is high, with emissions exceeding 34 kg/m2 per year. Furthermore, in the most densely populated census areas in the city centre, which are characterised by block or in-line buildings, the level of CO2 emissions from the buildings varies between 20 and 34 kg/m2 per year.
A similar process was carried out to generate the thematic map of indoor comfort. This process was implemented by considering the estimated values of the PMV (Predicted Mean Vote) indexes of buildings by building typology and construction period in a medium-term heatwave hazard scenario.
Each census area was assigned the estimated PMV value based on the prevailing building type and construction period of the buildings located in the census area.
The thematic map in
Figure 14 shows the distribution of the PMV values per census zone in a medium-term heatwave hazard scenario.
The thematic map shows high discomfort conditions, with PMV values above 2, particularly in census areas where single-house building types are predominantly located.
4. Test Results: New Impact Scenario and Climate Resilience Map of Residential Buildings
Each census area was assigned the optimal climate-proof intervention category for the buildings considering the prevailing building typology and construction period. The new PMV and CO2 values were assigned to the sections in order to generate the new thematic maps of indoor comfort and CO2 emissions.
Figure 15 shows the thematic map of the new indoor comfort values in a medium-term heatwave scenario.
The map shows an improvement in indoor comfort values in the PMV range between 1.625 and 1.750, showing how a retrofitting intervention on the built environment allows for the preservation of adequate comfort conditions in the 2050s (PMV < 1.76). We can therefore understand how systemic retrofitting interventions are necessary to ensure the holding of adequate PMV levels in the face of significant increases in outdoor temperatures.
The two pie charts in
Figure 16 show in detail the percentages of census zones belonging to the individual PMV classes in a medium-term heatwave scenario downstream and upstream of climate-proof interventions.
The two pie charts show that the climate-proof interventions increased the PMV values so that there are no longer any census sections with PMV values above 1.875.
Figure 17 shows the thematic map of the new CO
2 levels per census area. It shows that no census sections have CO
2 values above 34, and the majority of census sections (over 80 percent) are classified with CO
2 values below 21 kg/m
2 per year.
The thematic map shows how ‘passive’ retrofit interventions on residential buildings—i.e., referring only to the improvement in the thermophysical characteristics of the envelope—allow for a considerable reduction in CO2 emissions, especially for buildings in dense areas characterised by block or row buildings.
The two pie charts in
Figure 18 detail the percentages of census areas belonging to each of the CO
2 emission classes of buildings before and after climate-proof interventions.
A comparison of the two pie charts shows a significant reduction in the percentages of census zones with CO2 values greater than 20 kg/m2 per year (from 95% to 8%). Following the application of the climate-proof solutions, in no census zone is the level of CO2 emissions greater than 34 kg/m2 per year.
These results show that the tested process of selecting optimal climate-proof interventions for buildings according to building type and construction period improves indoor comfort and lowers the average CO2 emission level in the whole city of Naples.
In order to evaluate the resilience effectiveness of these climate-proof solutions, the process of generating the medium-term impact scenario was rerun considering the weak population density as the exposure.
In fact, the application of the climate-proof solutions generates variations in the physical characteristics of the built environment that affect the calculations of the vulnerability indicators of the building subsystem, thus altering the impact scenario classes.
Figure 19 shows the resulting map of climate resilience against medium-term heatwave scenarios, consisting of the new medium-term heatwave impact scenario map for the weak population.
The comparison with the ex ante impact scenario shown in
Figure 3 shows an increase in the number of census tracts classified as Low- or Medium–Low-Impact classes.
The two pie charts in
Figure 20 show the distribution of the census areas in percentages by heatwave impact class in the medium-term scenario before and after the climate-proof interventions, respectively.
They show an increase in the percentage of census areas classified as Medium–Low- and Low-Impact (from 23% to 35%), and a decrease in the number of census areas classified as Medium-, Medium–High- and High-Impact (from 77% to 65%).
These results demonstrate that the application of climate-proof solutions aimed at increasing indoor comfort and reducing CO2 emission levels in buildings generates an improvement in the medium-term heatwave impact scenario on the weaker sections of the population.
5. Discussion
In this research, a GIS-based framework was tested to assess the resilience to heatwave phenomena generated by the application of climate-proof solutions aimed at optimising the indoor comfort conditions and CO2 emissions of buildings.
In order to guarantee the portability of the framework, the atomic spatial entity of the urban fabric analysed was the census area. Through the construction of a database of climate-proof technical solutions and the application of a classification method of the census zones according to the prevailing building typology and construction period of the buildings located in them, the new maps of indoor comfort and CO2 emissions were generated, and the process of the construction of the new impact scenario map, which constitutes the climate resilience map for the phenomenon, was reprocessed.
The framework was implemented on a GIS platform and tested on the urban fabric of the municipality of Naples (Italy). In the test, a medium-term hazard scenario in the period 2041–2070 and, as an exposed value, the weak population were taken into account.
The results show that the adoption of the retrofit solutions significantly improves the perceived indoor comfort, reducing, at the same time, the levels of CO2 emissions, and reduces the levels of the impact of the phenomenon on the weakest part of the resident population, determining a positive impact on the resilience of the climate-proof interventions selected.
The proposed GIS-based framework could be applied in future local climate adaptation plans or as a knowledge resource to achieve resilient built environments.
The spread of easy-to-consult and user-friendly tools able to assess the impact of climate-proof design solutions could enable policymakers and involved stakeholders in urban transformation processes to better define the actions to be implemented at the urban scale.
Further research is needed in the future to evaluate the performance of the framework applied to different urban contexts under different climatic conditions. In addition, we intend to conduct further research aimed at determining a synthetic indicator of climate resilience that can be used to improve the choice of urban planning and design strategies. Finally, we intend to experiment with deep learning image pattern recognition algorithms in the future to improve the performance of the building classification process by building types, using a massive training set of building samples with different characteristics.


