Article

Exploring the Effect of Varying Fiber Dosages as Stirrup Substitutes in Torsion-Loaded Concrete Beams

1
Department of Civil Engineering, College of Engineering, University of Babylon, Babylon 51002, Iraq
2
Department of Civil Engineering, Ohio University, Athens, OH 45701, USA
*
Author to whom correspondence should be addressed.
Buildings 2023, 13(7), 1865; https://doi.org/10.3390/buildings13071865
Submission received: 4 June 2023 / Revised: 16 July 2023 / Accepted: 19 July 2023 / Published: 22 July 2023
(This article belongs to the Special Issue High-Performance Reinforced Concrete Structures and Composites)

Abstract

:
Over the past few decades, numerous studies have explored the use of steel fiber (SF) as an alternative to transverse reinforcement rebars in reinforced concrete beams, either partially or completely replacing them. However, there are limited studies that have investigated the effect of fiber dosage and length on reinforced concrete beam performance under torsional loads without the use of transverse reinforcement rebars. In this study, experimental investigations were conducted to examine the performance of reinforced SF concrete beams subjected to torsional load, utilizing SFs as a complete substitution of transverse reinforcement rebars. Ten different concrete mixes with varying dosages of SFs, namely 0%, 0.5%, 1.0%, and 1.5%, were examined while maintaining the same aspect ratio for fiber length and diameter. The results revealed that the addition of SFs in the concrete mix had an impact on its properties, reducing workability but increasing flexural, tensile, and compressive strengths. By incorporating 1.0% of SFs in the concrete mix, the missing torsional strength resulting from the absence of stirrups was adequately compensated. Moreover, the presence of SFs significantly influenced the ductile behavior beyond the point of cracking in the tested beams. Hence, it is recommended that SFs are incorporated with dosages of 1.0% and 1.5% in the concrete mixture, particularly for beams subjected to torsion, as a viable substitute for stirrups.

1. Introduction

Fiber-reinforced concrete (FRC) is a cement-based composite renowned for its exceptional material properties, which encompass high strength, durability, ductility, and energy absorption. These characteristics make it an ideal choice for constructing lightweight structures with extensive spans and thin walls, such as bridge decks and box girders [1,2]. However, the utilization of FRC faces a challenge due to its expensive materials [3]. While previous research has explored the behavior of FRC under shear and flexural loads [4,5], there remains a lack of comprehension regarding its response to torsional loads, as well as a deficiency in a definitive design approach for implementing FRC in torsion-resistant structures. This knowledge gap represents a critical issue that necessitates attention in order to broaden the application of FRC in such structures.
Torsion refers to the twisting effect that occurs when a structural element experiences an eccentric force. This phenomenon commonly affects different components in buildings and bridges, such as edge beams and curved beams, when subjected to various loading conditions. Understanding and considering the impact of torsion on structural behavior are crucial in the design and analysis of diverse structures. In statically determinate structures, torsion leads to equilibrium torsion, while in indeterminate structures, it results in compatibility torsion [6]. Inadequate torsional stiffness and strength in edge beams can lead to excessive deflection during serviceability limit states [7]. The ultimate strength capacity of a reinforced concrete member depends on both its maximum resistance and its ductility. Insufficient ductility can cause a failure mode that reduces the ultimate strength of a reinforced concrete beam [8]. In contrast, FRC exhibits exceptional ductility and strength, enabling it to fully utilize its load-bearing capacity [9]. Consequently, investigating the torsional performance of FRC beams is vital to harness their enhanced properties effectively in structural design.
Extensive research has been conducted on the torsional behavior of different types of reinforced concrete materials, including normal concrete (NC), high-strength concrete, and prestressed concrete [10,11,12,13,14]. These materials are characterized by brittleness and low tensile strength, leading to the disregard of their tensile strength in structural standards and design codes [15,16,17]. To address the challenges associated with brittleness and low tensile strength, steel FRC has been developed, incorporating steel fibers (SFs) into the concrete mix to enhance the performance of structural elements. Consequently, the current design codes and theoretical approaches may not be appropriate for concrete exhibiting high tensile strength.
Previous studies have conducted experimental investigations on the torsional behavior of steel FRC beams, considering different cross-sectional shapes such as solid or hollow sections [18,19,20,21,22,23]. Additionally, several theoretical models have been proposed to predict the occurrence of the ultimate torques of steel FRC beams subjected to torsional loading [22,23,24,25,26]. These models typically incorporate the concrete’s tensile strength and the dimensions of the member’s cross-section to estimate the torque at which cracking occurs, while also accounting for a reduction factor that varies depending on the concrete type [22]. However, when it comes to calculating the torsional strength of FRC members, the formulas may vary due to the notably high strength and toughness exhibited by FRC.
Several experimental studies have focused on examining the torsional characteristics of FRC beams with different cross-sectional configurations, encompassing solid beams [27,28], T-shaped beams [29], and hollow beams [30,31]. The addition of SFs enhanced the torsional ductility and resistance of FRC when combined with both transverse and longitudinal rebars, along with an appropriate dosage of SFs [27,28]. Yang et al. [27] conducted experimental investigations on FRC beams, comparing those with and without SFs. Results revealed that the inclusion of SFs improved the postcracking behavior and torsional strength of FRC beams. Oettel et al. [30] carried out experiments to examine the behavior of FRC box beams subjected to combined torsional and bending loads, aiming to develop design methodologies for their implementation in structural design. Additionally, Kwahk et al. [31] developed a formula for predicting the torsional strength of hollow FRC beams, considering the contribution of FRC’s tensile strength to the beams’ torsional resistance. Kwahk et al. [30] also observed that incorporating SFs proved to be more effective in enhancing the strength of the torsional capacity of the beams compared to using a greater number of stirrups. Zou [32] conducted tests on an FRC thin-walled box beam to investigate its torsional behavior, finding that the distortion effect of the box girder could be significantly enhanced by increasing the number of transverse diaphragms. AlKhuzaie et al. [29] explored the torsional behavior of T-beams made of reactive power concrete, noting that the incorporation of SFs enhanced the torsional ductility, energy absorption, and postcracking loading capacity of the concrete T-beams. Xie et al. [33] conducted experimental and theoretical investigations on curved FRC beams subjected to concentrated loads. Moreover, Mohammed et al. [34] suggested that the torsional performance could be enhanced by applying a thin layer of FRC to conventional concrete members.

2. Research Significance

Previous studies have indicated that incorporating SFs into reinforced concrete members can enhance their torsional strength, postcracking behavior, and ductility [35]. However, there are still certain aspects related to the torsional response of FRC beams that necessitate further investigation. These aspects encompass the effectiveness of SFs as torsional stirrups, improvements in the torsional mechanism of FRC beams, and the identification of failure modes. Understanding these aspects is crucial for developing design methodologies that incorporate FRC in torsion-resistant structures. Therefore, the objective of this research was to investigate the performance of reinforced SF concrete beams subjected to torsional load, utilizing SFs as a complete substitution of transverse reinforcement rebars. Ten different concrete mixes with varying dosages of SFs, namely 0%, 0.5%, 1.0%, and 1.5%, were examined while maintaining the same aspect ratio for fiber length and diameter.

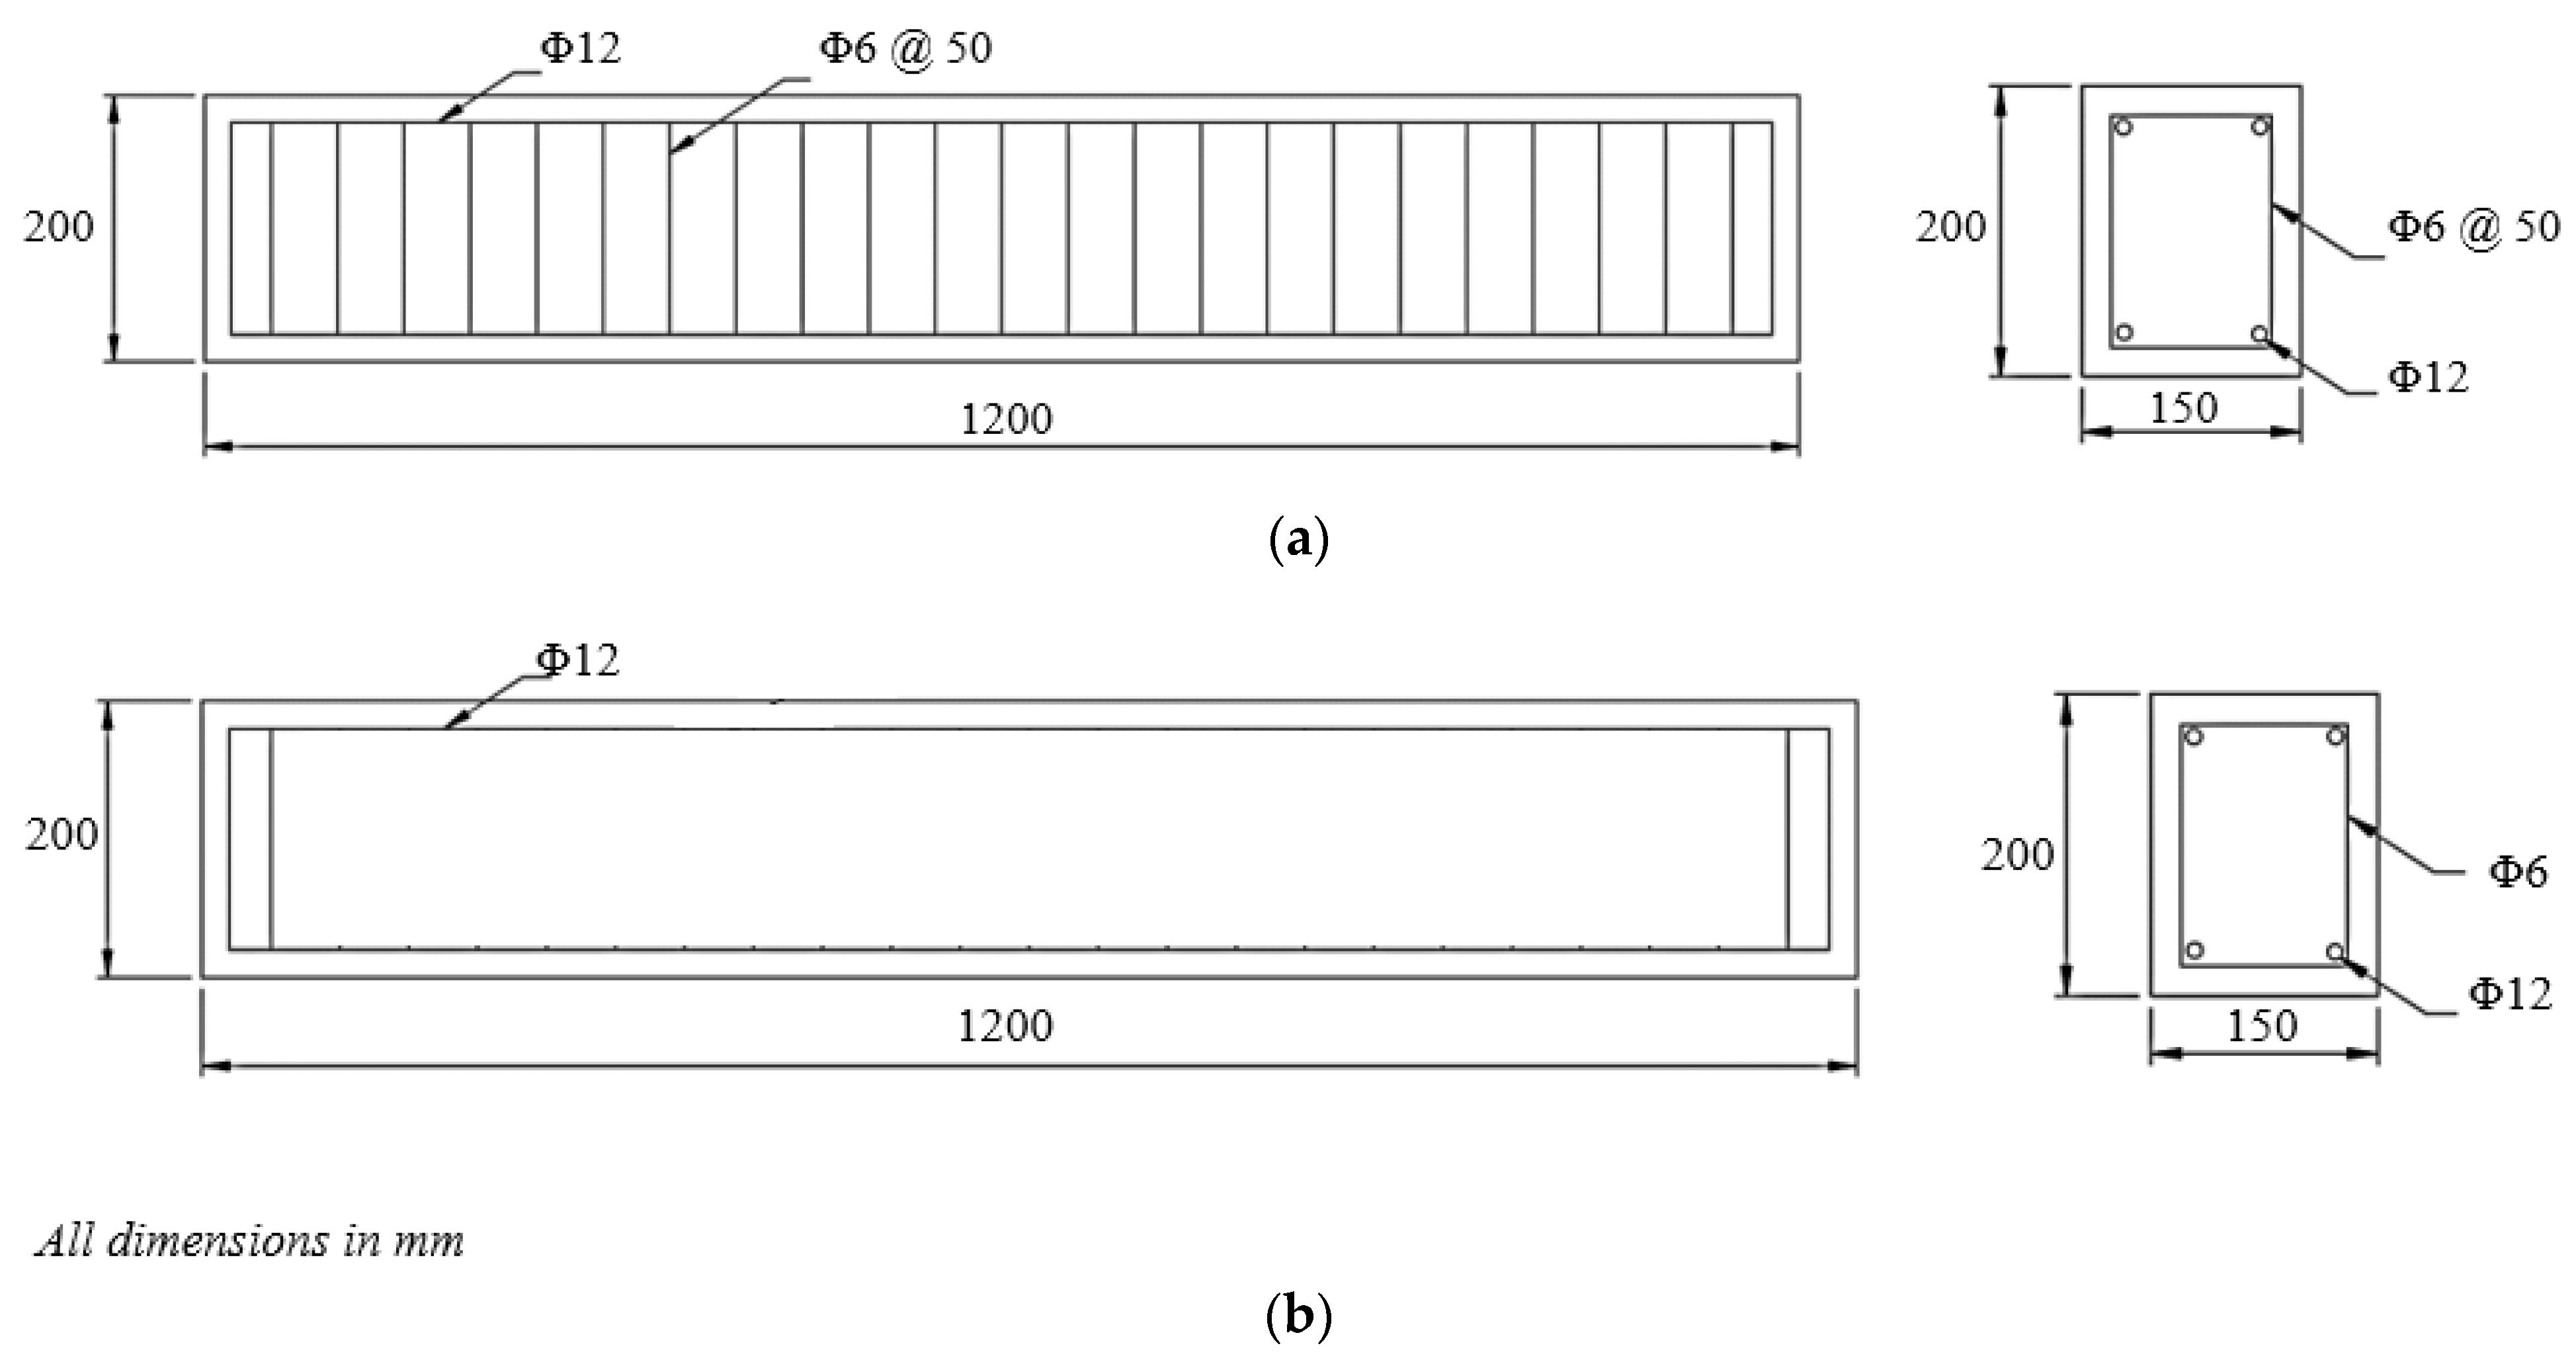
3. Experimental Program
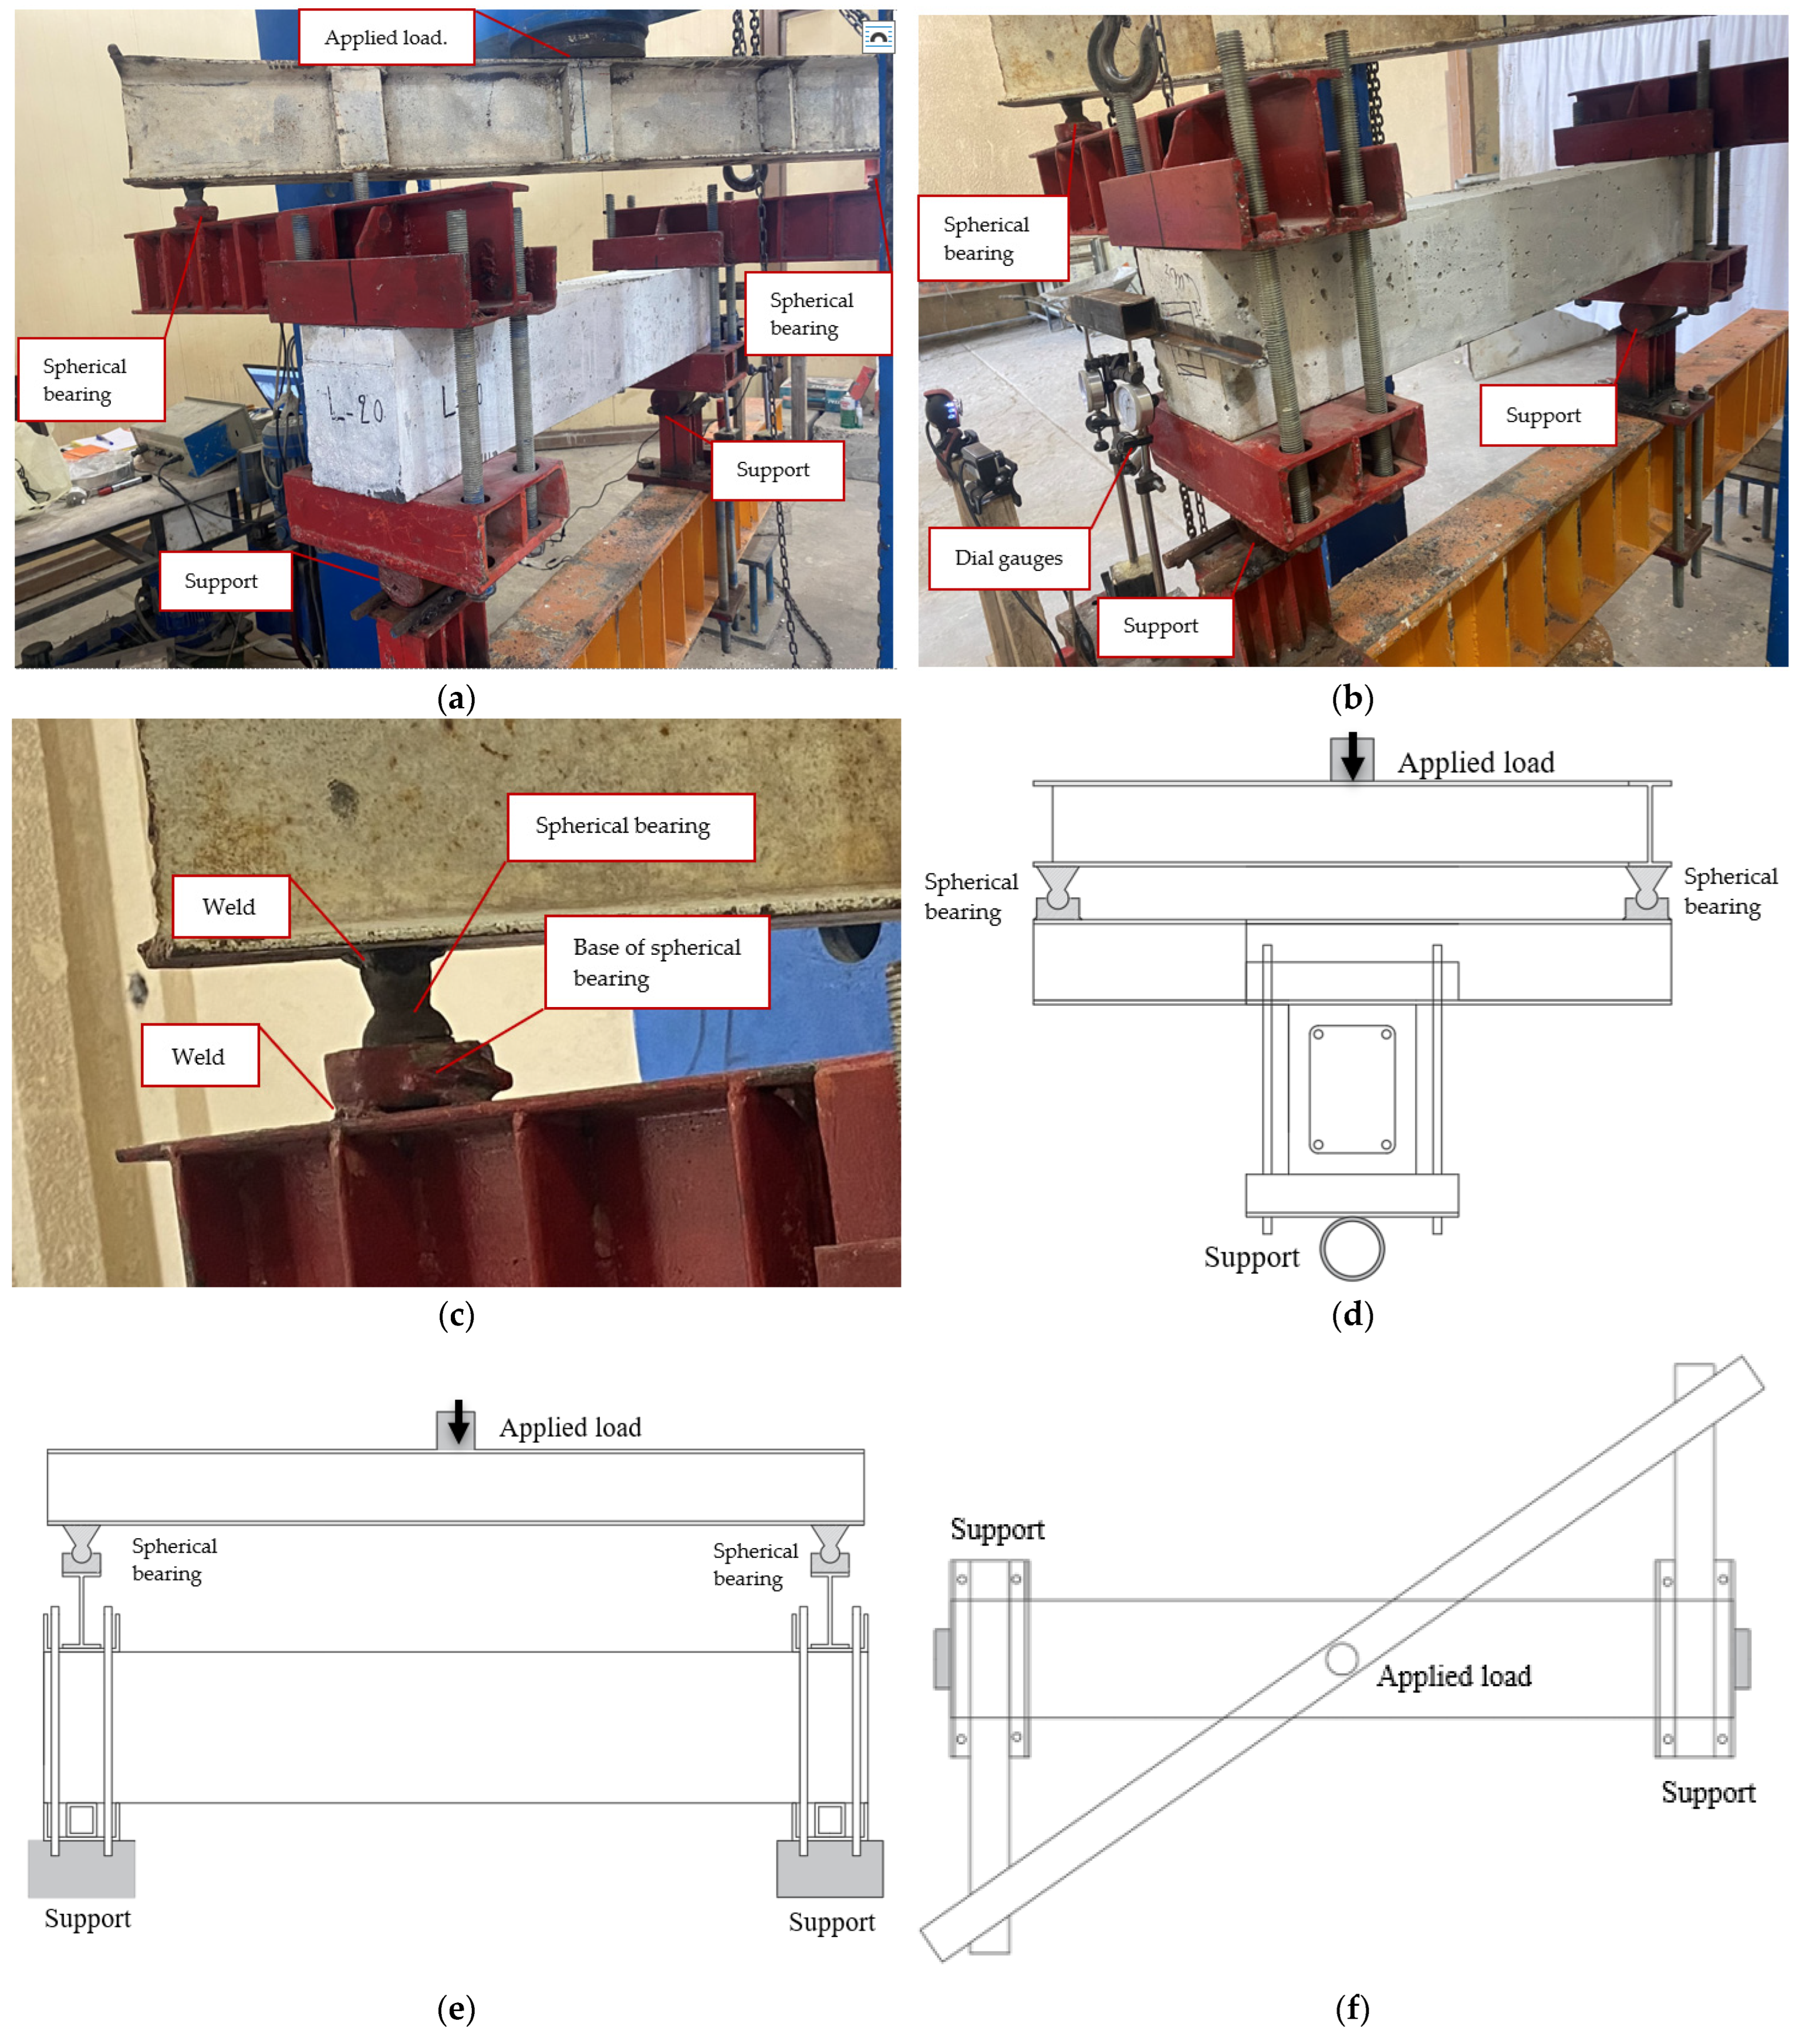
3.1. Apparatus

A total of ten beam specimens having the same exterior dimensions of 150 mm width, 200 mm height, and 1200 mm length were cast and tested in this study. One specimen was cast with the NC reinforced with both longitudinal and transverse steel bars, while the other nine beams were cast with the steel FRC reinforced with longitudinal steel bars only. For the steel FRC beams, the test parameters examined in this study were the SF dosages with approximately a 65 aspect ratio. In the longitudinal direction of the beam, four steel bars of Ø 12 mm diameter were used for all of the reinforced specimens’ beams. For the NC beam, the transverse reinforcement with Ø 6 mm was used as closed secondary bars, as indicated in Figure 1. Figure 1b shows nine FRC beams which were without stirrups. The FRC beams include patterns of three SF dosages of 0.5%, 1%, and 1.5%, while the lengths and diameters of fibers were 13 mm × 0.2 mm, 35 mm × 0.55 mm, and 60 mm × 0.9 mm, respectively. The aspect fiber ratios in Table 1 were determined using Equation (1):
A . R = L f D f
where A . R is the aspect ratio, Lf is the length of the fiber, and Df is the diameter of the fiber. The longitudinal rebar ratio greater than 1% was used by dividing the total area of longitudinal steel reinforcement by the cross-section area of the beam according to the ACI 318 minimum torsion provisions [15]. In Figure 2, a flowchart of this research approach is depicted.
In Table 1, the tested beams were named to identify the type of concrete, SF dosage, and SF length. For example, T-NCon indicates that the beam was cast with a T-NCon beam. Beam T-FRC0.5-13 refers to the beam being cast with FRC, an SF dosage of 0.5%, and a fiber length of 13 mm. Beam T-FRC1.5-35 refers to the beam being cast with FRC, an SF dosage of 1.5%, and a fiber length of 35 mm.

3.2. Materials and Mix Proportions

Three different lengths of hook SFs, namely H13, H35, and H60, were utilized in this study. These fibers had diameters and lengths of 0.2 mm × 13 mm, 0.55 mm × 35 mm, and 0.9 mm × 60 mm, respectively, as illustrated in Figure 3. The physical properties of the hook SFs, as supplied by the manufacturer, are listed in Table 2.
A total of ten experimental mixtures were employed in this investigation. The initial mix was designed for the NC beam, while the remaining nine mixes were formulated for FRC beams, incorporating three different SF dosages (0.5%, 1.0%, and 1.5% by volume) for each fiber length. The mixes consisted of coarse aggregate with a 14.0 mm maximum size, fine aggregate with a 4.75 mm maximum size, and Portland cement. The particle size distribution of the fine aggregate is presented in Table 3, while Table 4 illustrates the sieve analysis results for the coarse aggregate. An assessment of the physical properties and chemical composition of Portland cement was carried out in accordance with IQS No.5/1984 [36]. The findings from this analysis are documented in Table 5 and Table 6.
In this investigation, a total of ten mixtures were prepared, and their details can be found in Table 7. The beams under testing were reinforced using longitudinal bars and stirrups. The longitudinal bars exhibited a yield strength of 445 ± 13 MPa and an ultimate strength of 724 ± 14 MPa. On the other hand, the stirrups had a yield strength of 465 ± 16 MPa and an ultimate strength of 624 ± 12 MPa, as per the specifications outlined in ASTM A615/A615M [38].

3.3. Mechanical Properties

Three specimens were cast and tested after 28 days for each concrete mix. In Table 8, the average tested results are listed. The compressive strength of each mix was obtained by testing concrete cubes with a dimension of 100 mm as shown in Figure 4a. The test sequences were conducted to obtain the concrete splitting tensile strength for each mix of steel FRC cylinder specimens as shown in Figure 4b. To determine the flexural strength, prism specimens with 100 mm height × 100 mm width × 500 mm length were tested, as shown in Figure 4c. The brittleness ratios of the steel FRC were determined by dividing the compressive strength of each mix by the flexural strength of the same mix [39,40,41]. A high brittleness ratio is associated with low flexural strength, while a low value refers to high flexural strength.
Upon reviewing Table 8, it is evident that the NC control mixture exhibited the lowest compressive, splitting tensile, and flexural strengths when compared to the steel FRC mixtures. The inclusion of SFs in the concrete mixtures resulted in enhanced mechanical properties, specifically in terms of splitting tensile strength, surpassing that of the NC control mixture. The highest enhancement of 141% was observed in the H13-1.5 mix. The flexural test results also aligned with the splitting tensile strength outcomes, demonstrating a similar trend as the fiber dosage increased. This increase in splitting tensile strength and flexural strength can be attributed to factors such as the fiber pattern, the number of fibers per mixture, and the surface area. It is worth noting that the 13 mm SF exhibited a higher number of fibers per mix and a larger surface area compared to the 35 mm and 60 mm SF lengths, leading to a stronger bond between the SF and the concrete matrix.

3.4. Test Procedure

To subject the beam specimens to torsional loading, steel arms were utilized at both ends of the beam, following the methodology outlined in previous studies conducted by Hassan et al. [22,23]. Figure 5a depicts a reinforced concrete specimen positioned within a hydraulic testing machine with a maximum capacity of 450 kN. To ensure that the load remained centered throughout the testing process, a spherical bearing ball was welded at the bottom of the steel diagonal beam, and the base of the spherical bearing ball was welded at the top of the steel arm, precisely aligned with the center of the arm (see Figure 5c). This connection between the steel diagonal beam and the steel arm eliminated the slipping of the rollers once the load was applied. The clear torsional arm spanned a length of 500 mm from the centroidal axis of the tested beam to the loading point, thus ensuring the application of pure torsional loads onto the beam, as shown in Figure 5d–f. Additionally, in order to measure the torsional angle at the end of the tested beam, two dial gauges were strategically positioned to measure the upward and downward deflection values. The two dial gauges, located at opposite edges of the tested beams, were spaced 150 mm apart. The readings of the torsional angle were recorded at regular load intervals.

4. Results and Discussion

In this research, ten rectangular concrete beams were tested under pure torsion to explore the ability of fiber dosage and its length to substitute the absence of transverse reinforcement. All the tested beams had been cured prior to testing. The test results are discussed in terms of several factors cracking pattern, torque–rotation diagrams, cracking, and ultimate torque capacity and failure modes.

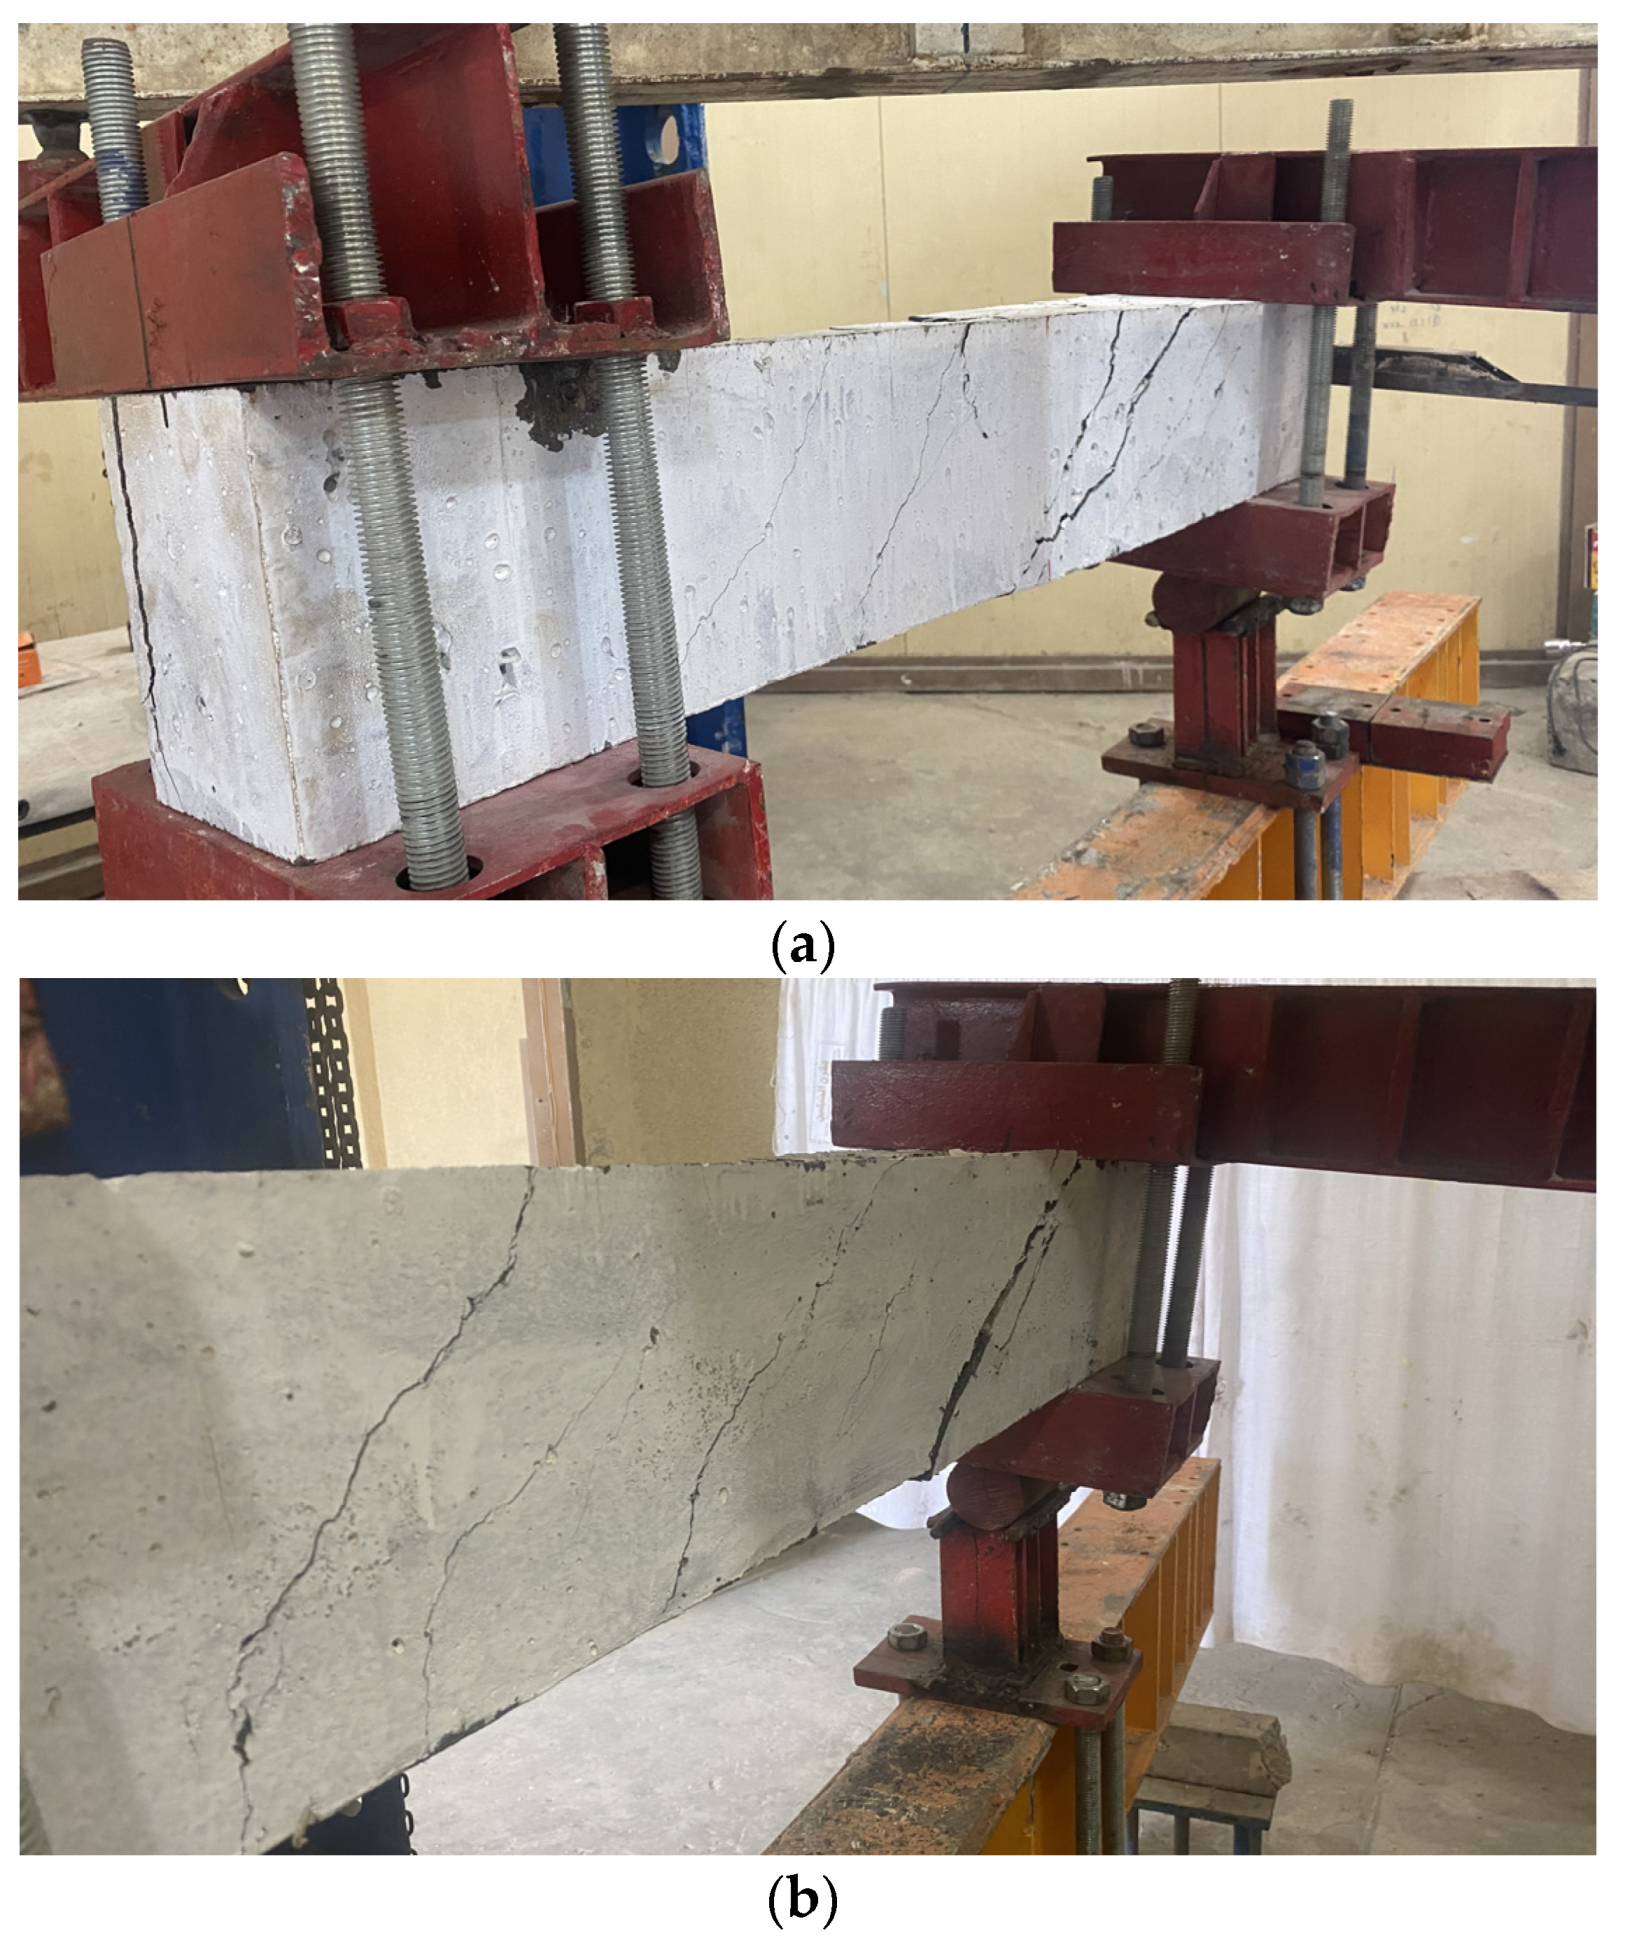
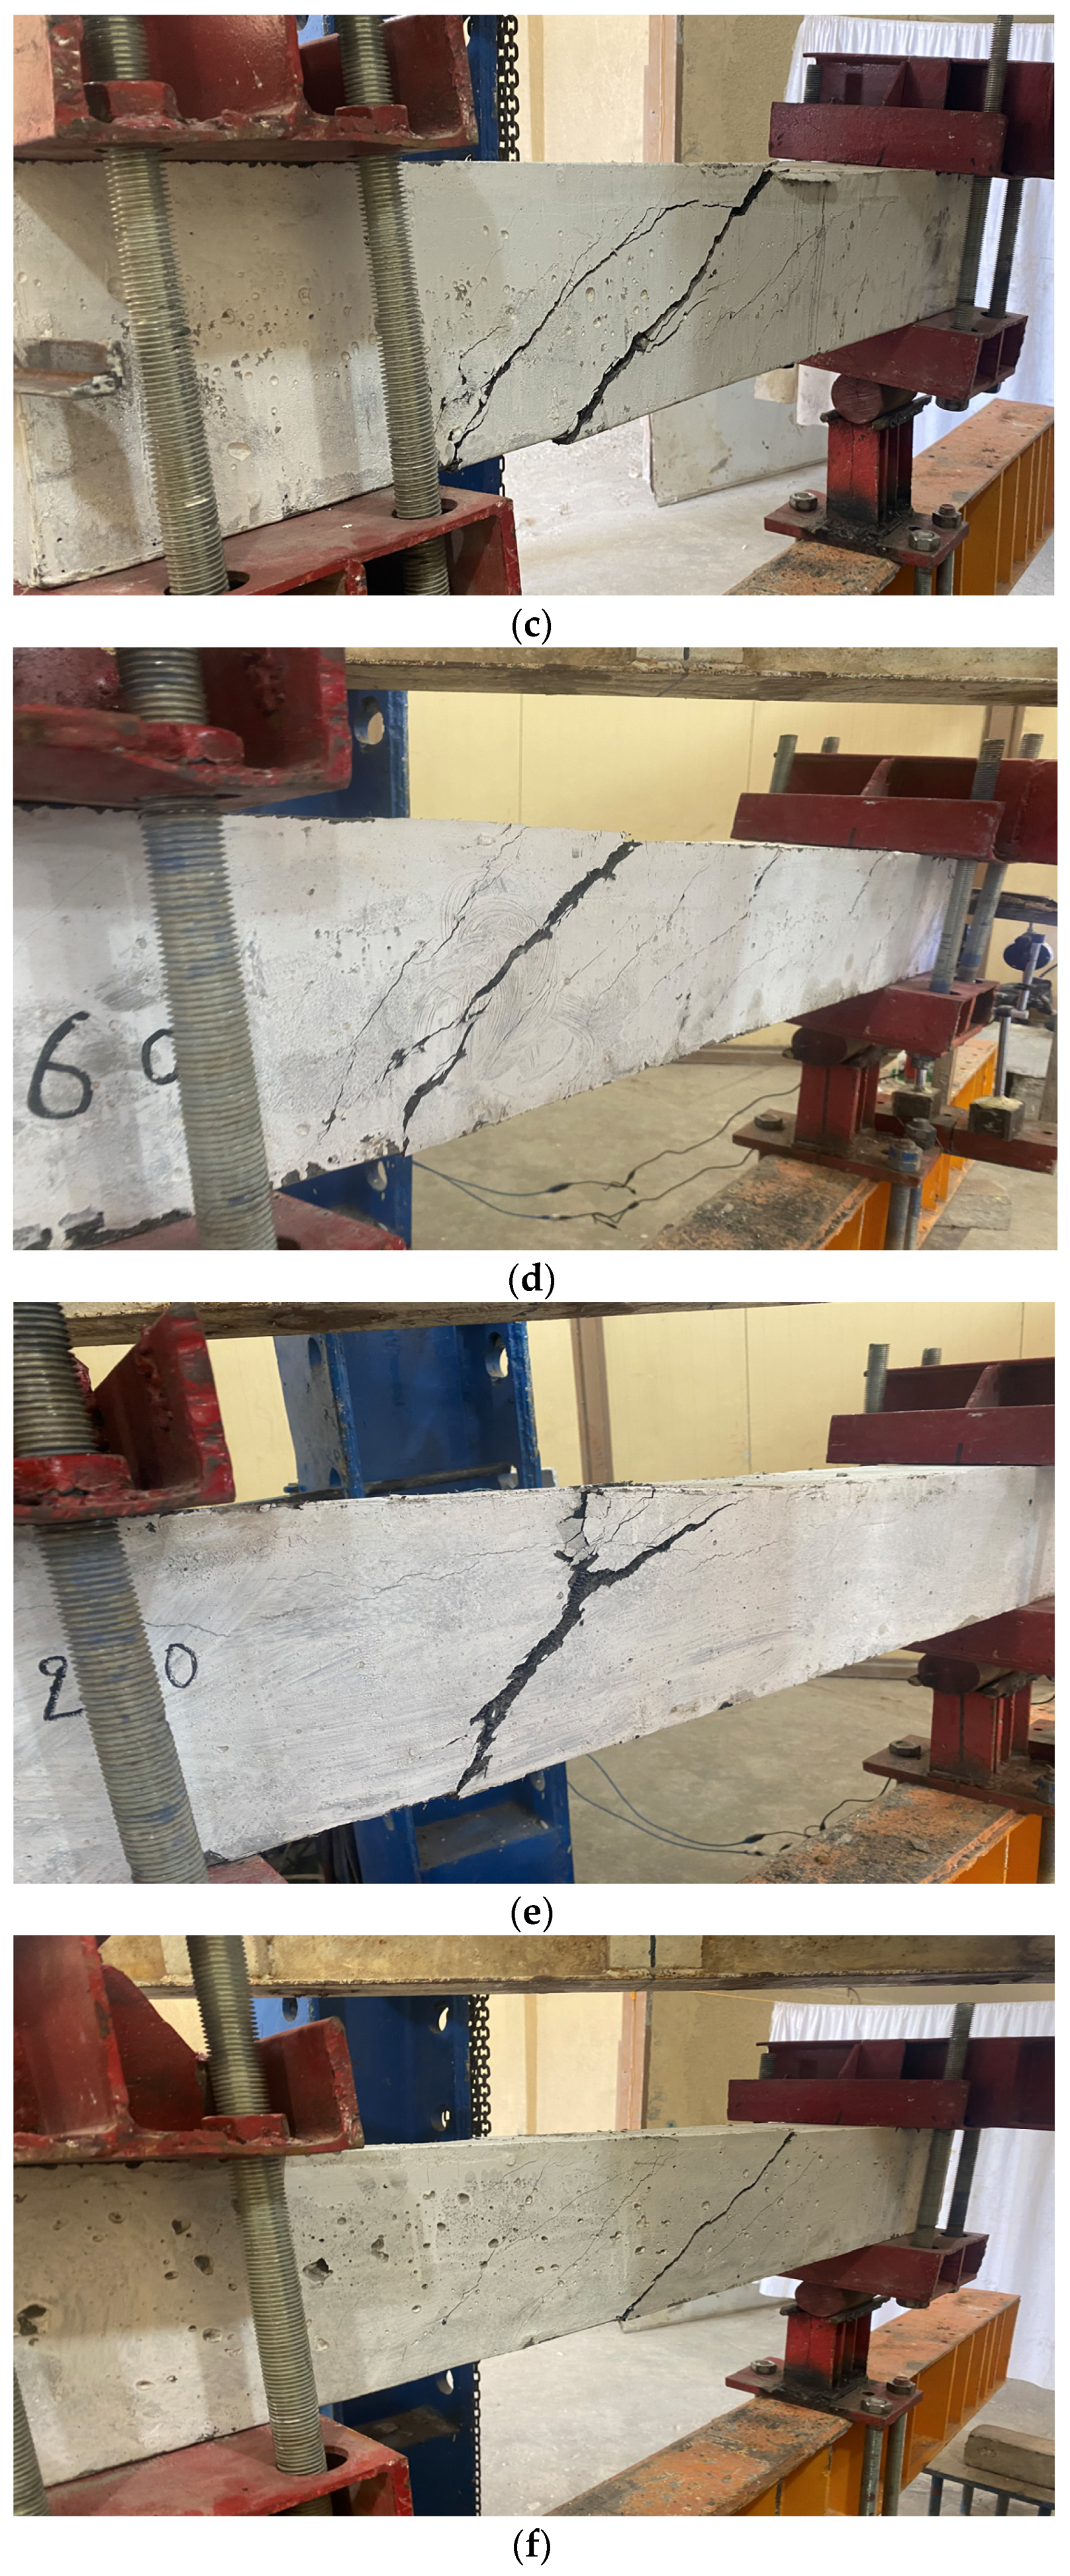
4.1. Cracking Patterns and Failure Modes

The T-NCon beam exhibited a normal torsional failure mode (see Figure 6a). The initial crack appeared diagonally and spiraled around the tested section of the beam near the mid-span, with crack angles measuring approximately 45 degrees. In the T-NCon beam, significant transverse cracks were observed on all sides of the tested beam. Subsequently, these cracks extended widely in two opposite directions until the beams failed, showcasing ductile behavior.
In contrast, the steel FRC beams displayed different crack patterns and failure characteristics compared to the T-NCon beam. This can be attributed to the restraining effect of the SF, which impeded crack propagation in the FRC beams, resulting in distinct failure criteria. The steel FRC beams had one major crack, contrariwise the T-NCon beam, which had more major cracks, as shown in Figure 6b–d. For beams with a fiber dosage of 0.5% and fiber lengths of 35 mm and 60 mm (T-FRC0.5-35 and T-FRC0.5-60), the crack width was very wide, and the failure was brittle. On the other hand, the beam T-FRC0.5-60 showed less crack width and failed in a ductile manner. This fiber effect is due to the number of fibers per volume, which means that a fiber length of 13 mm has more fibers than the other fiber lengths of 35 mm and 60 mm. As is known, one fiber of 35 mm length balances roughly 20 fibers of 13 mm length, and one fiber of 60 mm length compensates for roughly 93 fibers of 13 mm length.
Figure 6e–j depict the crack patterns of the rest of the steel FRC beams T-FRC1.0-13, T-FRC1.5-13, T-FRC1.0-35, T-FRC1.5-35, T-FRC1.0-60, and T-FRC1.5-60. After the first cracking occurred, the cracks developed along the tested beam, and the SFs acted to stop the crack width increasing. With the increase in the applied torque, diagonal cracks emerged, and a prominent main crack was observed along the tested beam. The width of this crack progressively widened as the torque was amplified. When the torque reached its maximum value, the width of the main crack significantly expanded. Subsequently, after reaching the peak torque, the torque gradually decreased, while the width of the main crack continued to enlarge. The failure mode observed in the steel FRC beams was characterized by diagonal tensile failure, accompanied by the pulling out of SFs along the diagonal crack. These distinctive failure modes and crack patterns underscore the importance of recognizing the effectiveness of SFs in influencing the torsional behavior of steel FRC beams.

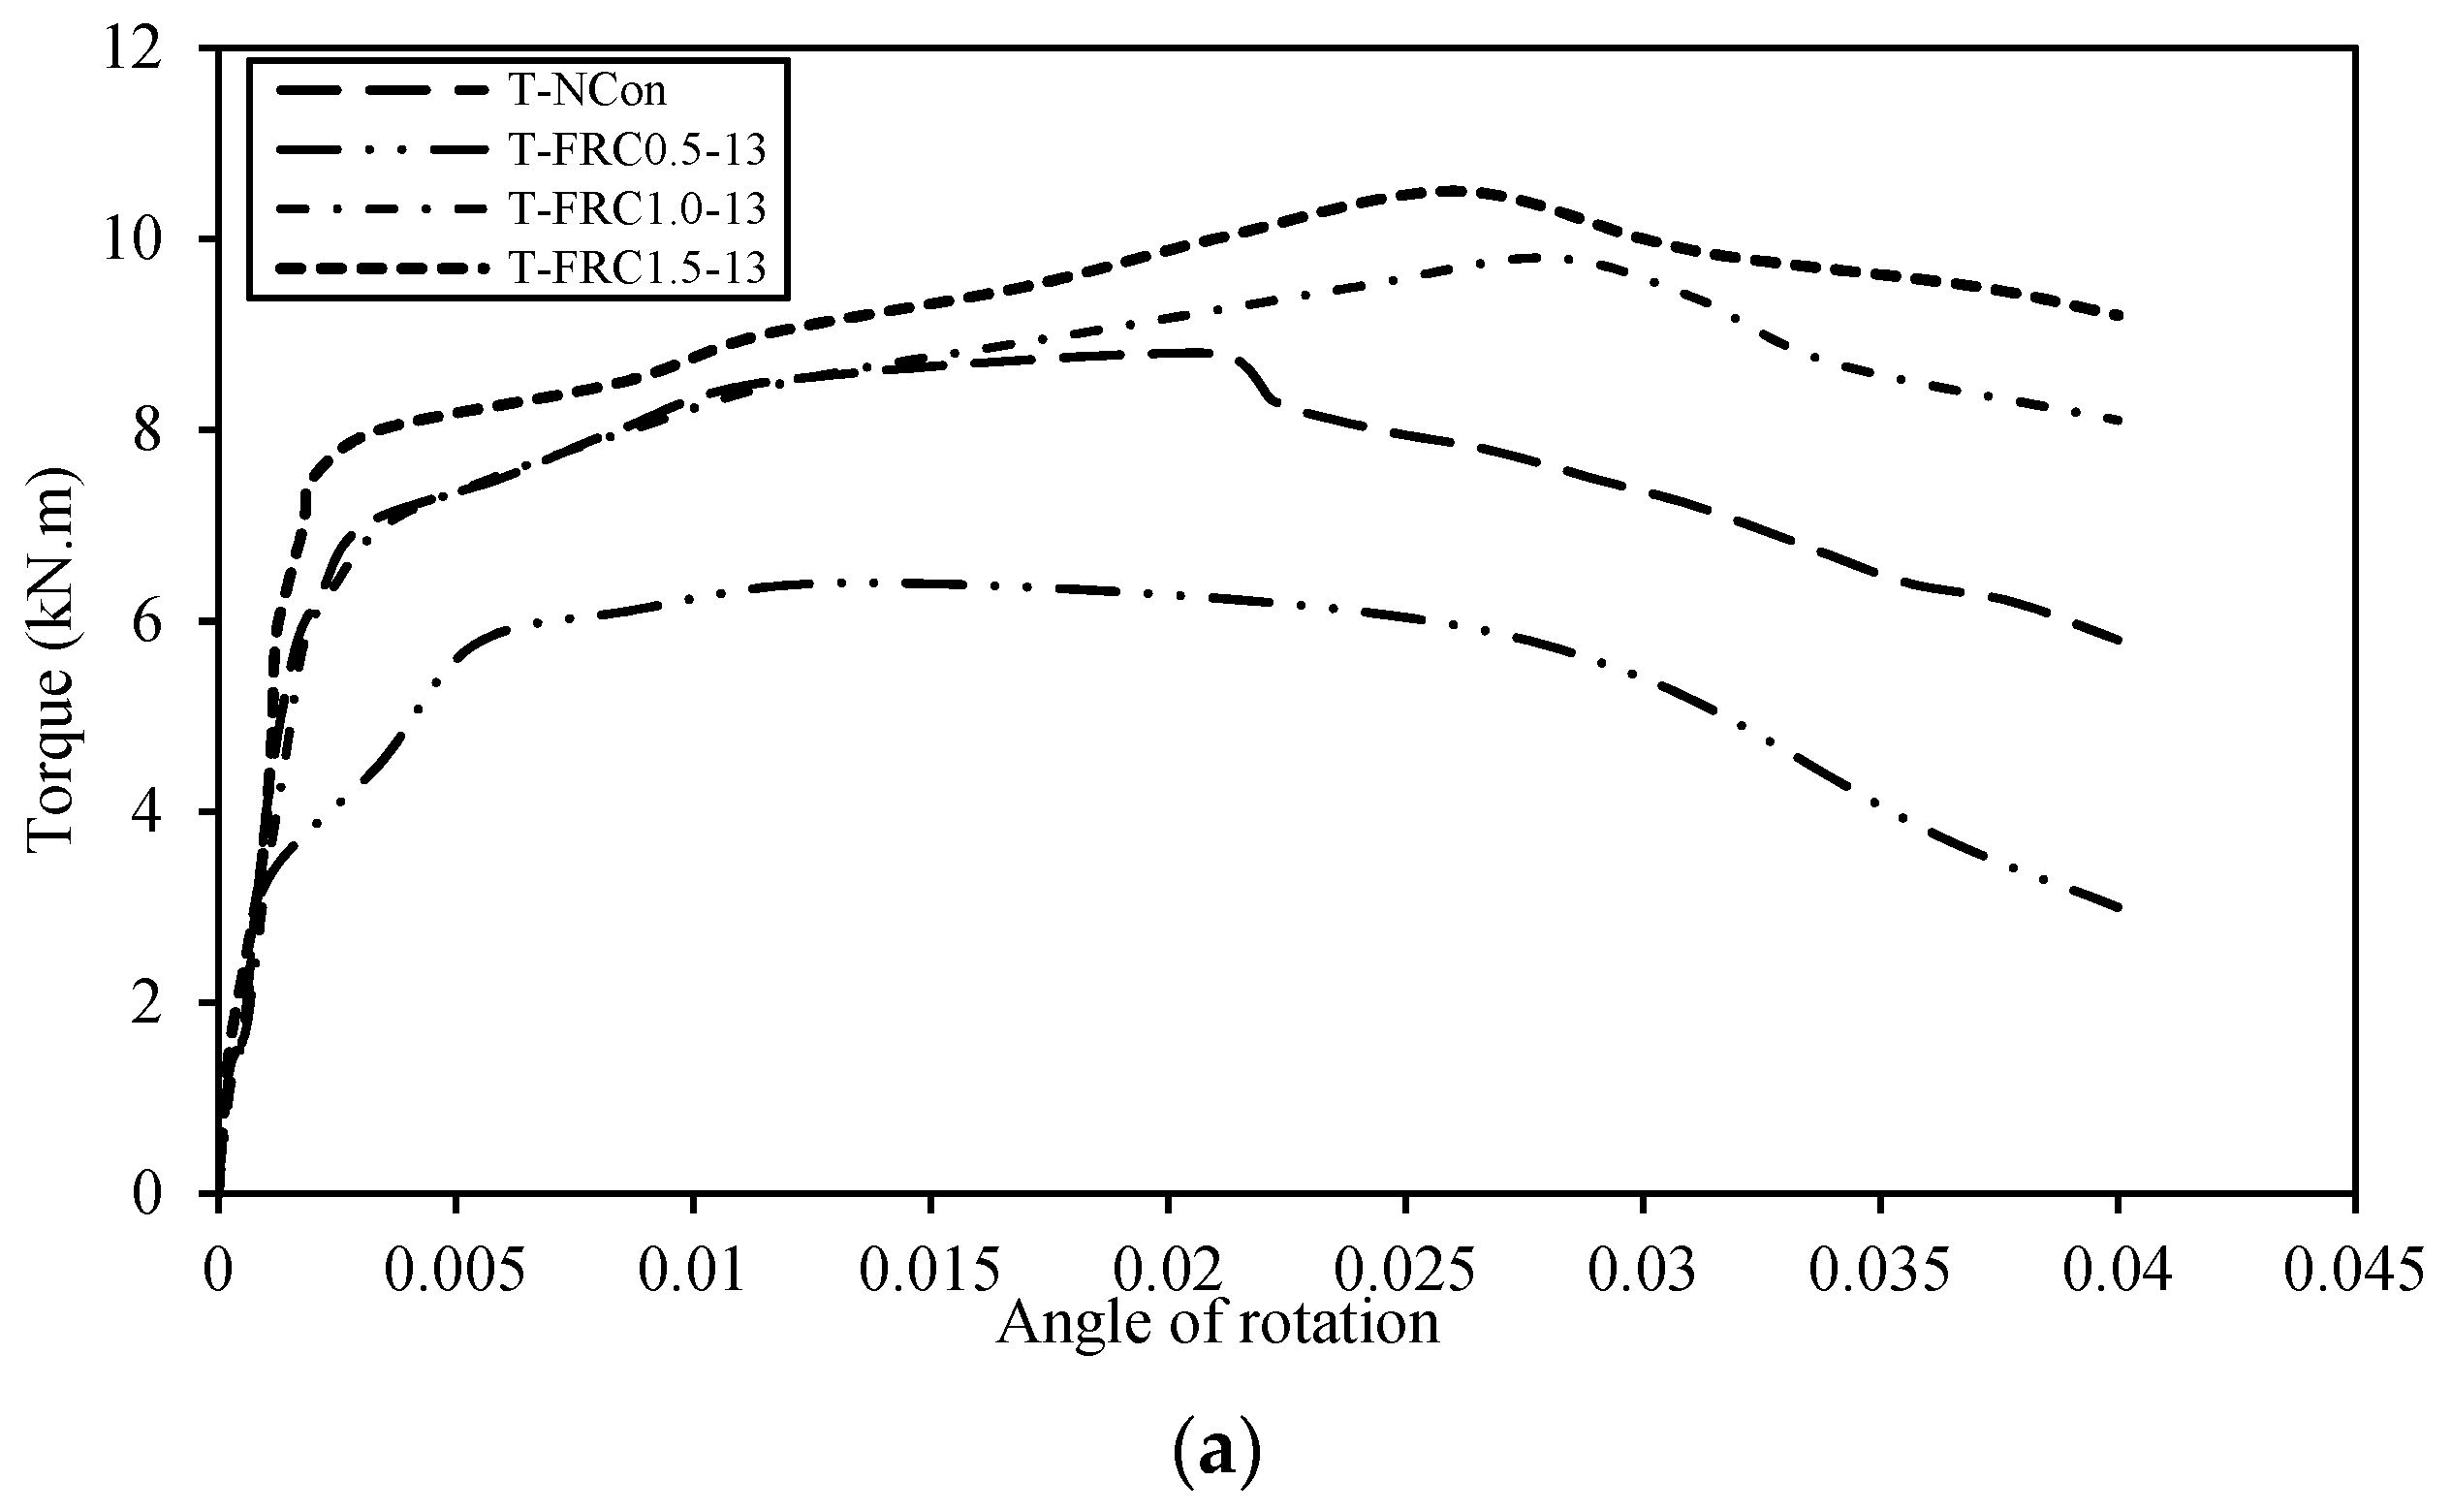
4.2. Torsional Strength and Torque–Twist Angle Performance

A comparison of torsional behavior between the steel FRC beams of 13 mm, 35 mm, and 60 mm lengths and the T-NCon beam is presented in Figure 7a–c, respectively, illustrating the relationship between the end torsional moment (Torque kN·m) and angle of twist (rad per length). Figure 7a–c compare the torsional response of the T-NCon beam (a beam with transverse reinforcement but without fibers) and the corresponding steel FRC beams (beams without transverse reinforcement but with 0.5%, 1.0%, and 1.5% fiber dosages).
Additionally, Figure 7 displays the torsional behavior curves until the point of failure. In Table 9, the first cracking torsional moment (T_cr) and postcracking ultimate torsional moment (T_u), as well as the precracking initial torsional stiffness (K) and the subsequent angles of rotation, are listed. The elastic torsional stiffness (K) was determined using the elastic portions of the torque–rotation curves. It is important to note that the initial torsional rigidity was comparable for both the steel FRC beams and the T-NCon beam. Moreover, the steel FRC beams showed higher first-crack torsional torque (T_cr) compared to the T-NCon beam, and the magnitude of this increase varied depending on the dosage and the SF configuration, as indicated in Table 9.
The twist angle at which the cracking torque occurred was influenced by the SF content and its length. Thus, steel FRC beams with higher fiber dosages demonstrated increased first-crack torque strengths due to the inclusion of SFs. Once cracking occurred, the bonding between the SFs and the concrete matrix started to improve the postcracking behavior of the steel FRC beams. Additionally, as depicted in Figure 7, the ultimate moments of steel FRC beams with fiber dosages of 1% and 1.5% of the total volume were either equal to or greater than that of the T-NCon beam. However, the steel FRC beams with a fiber dosage of 0.5% exhibited lower torque strength compared to the T-NCon beam. Among the different fiber lengths, the steel FRC beams with a fiber dosage of 0.5% and a length of 13 mm demonstrated superior torsional performance. This can be attributed to the higher number of fibers per volume for the 13 mm length fibers, resulting in better fiber distribution. In general, the steel FRC beams with a fiber dosage of 1.5% and a fiber length of 60 mm exhibited higher torque capacities due to the strong bond between this length of fiber and other components in the mix.

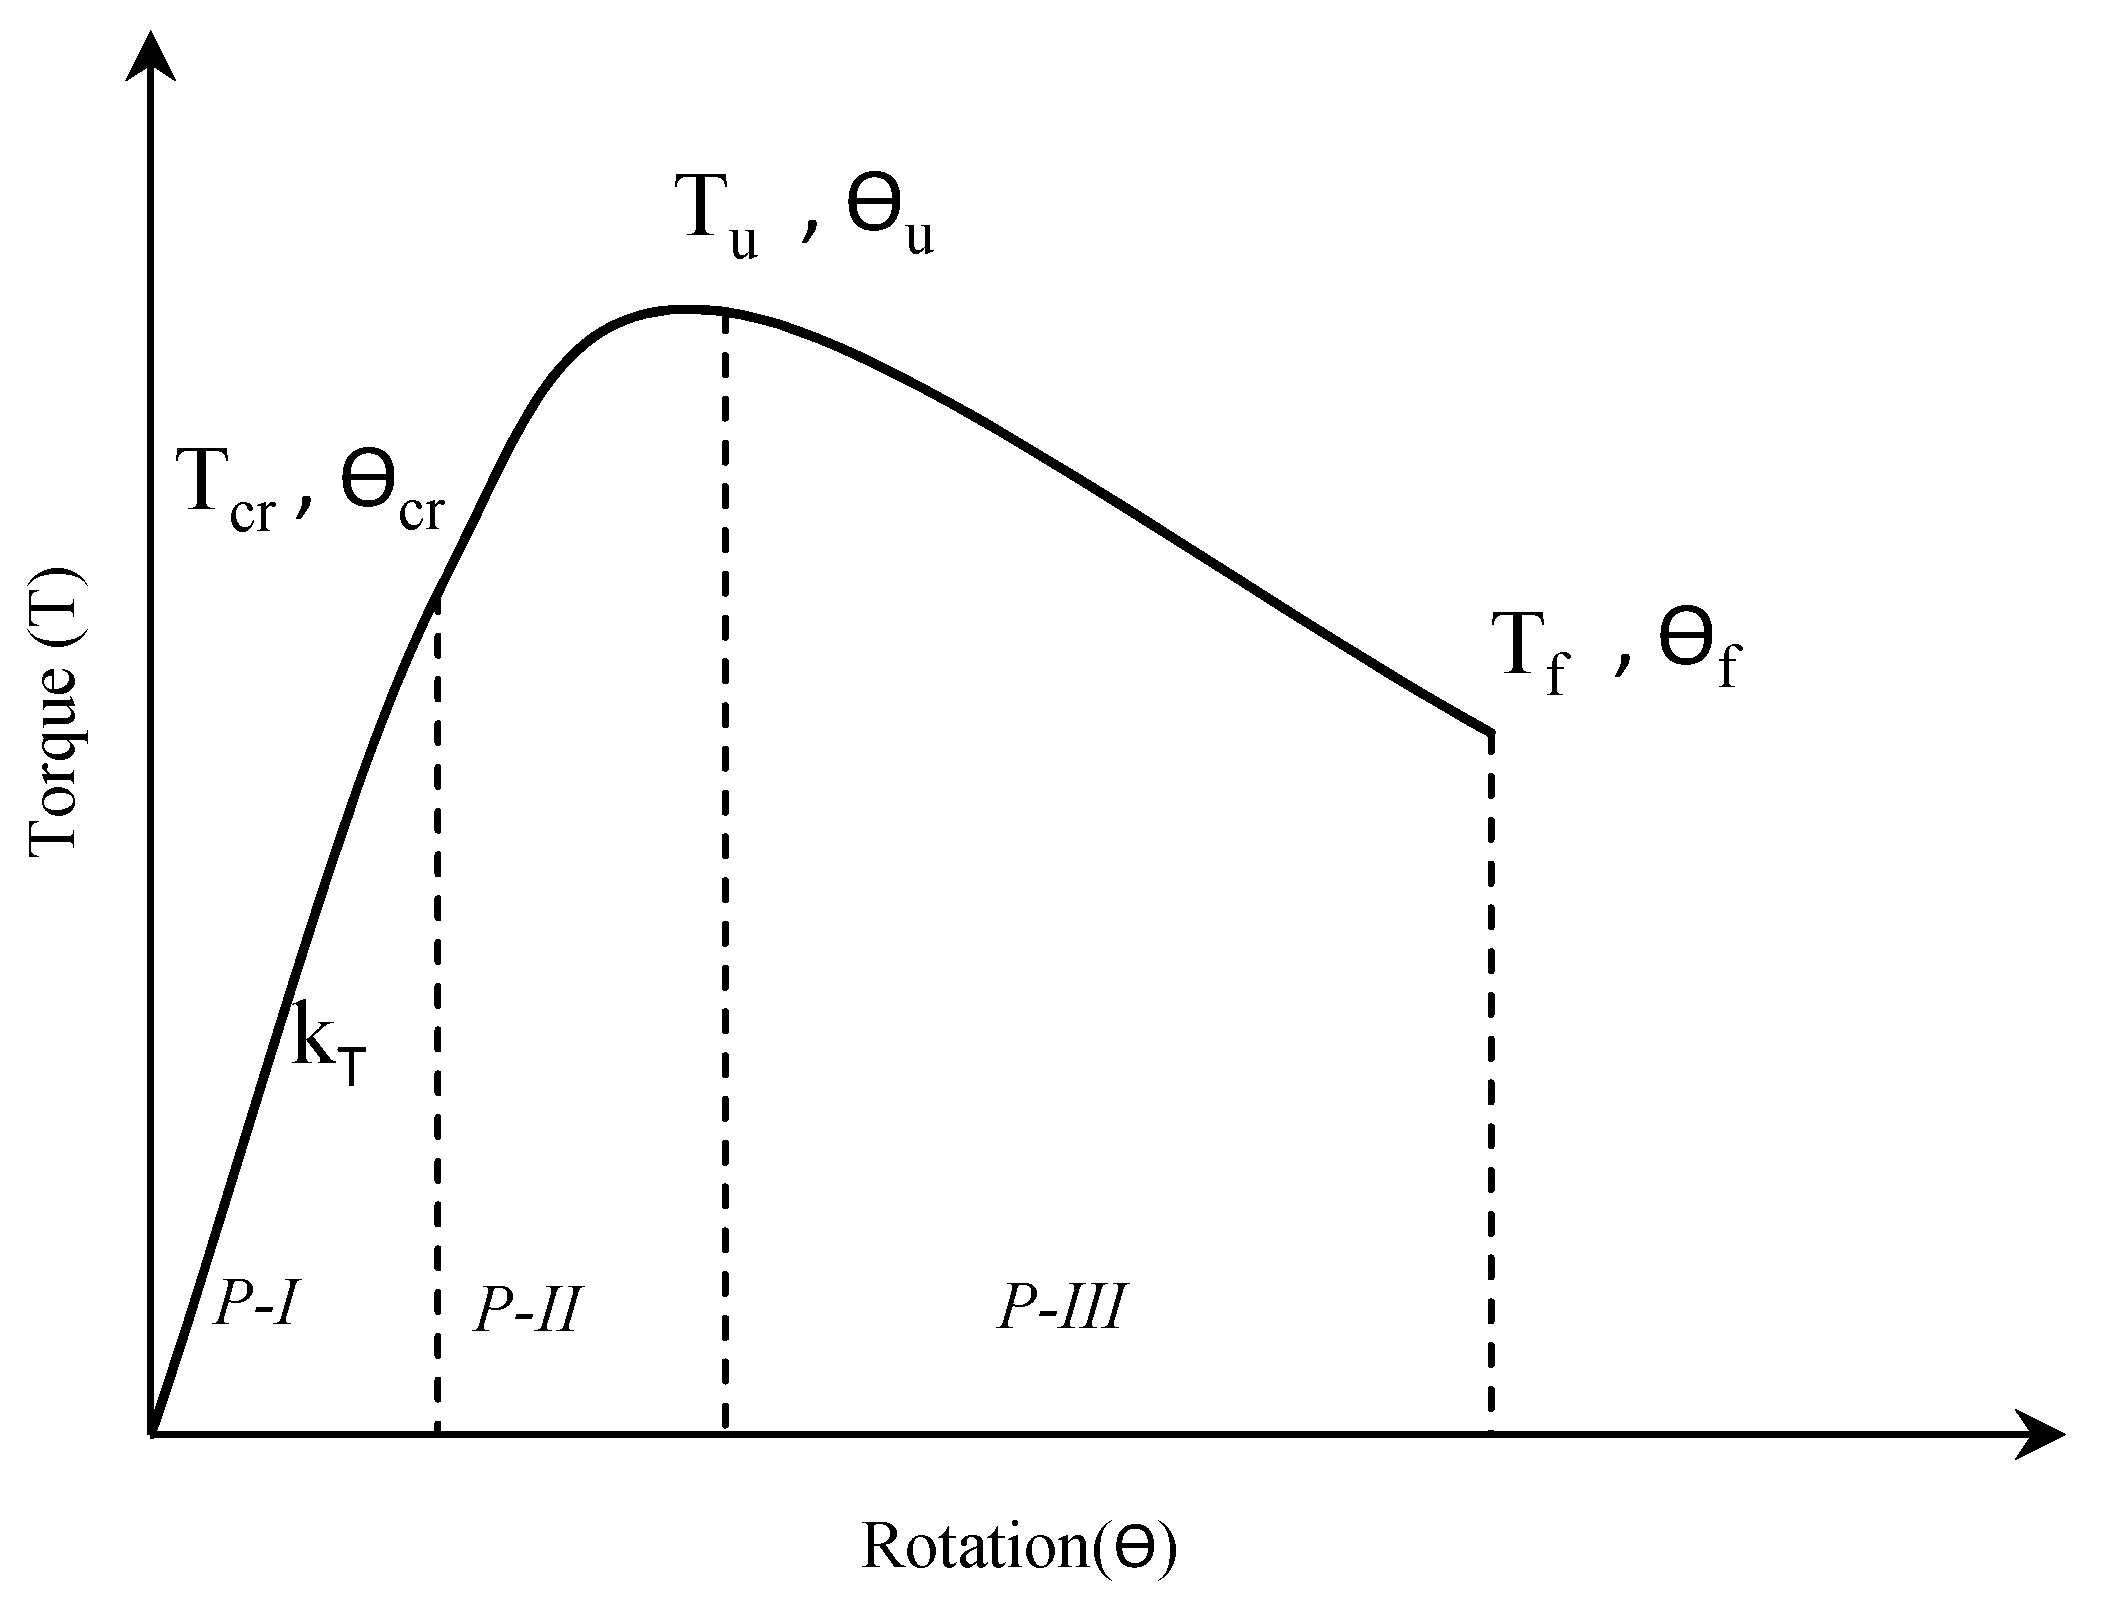
4.3. Torsional Toughness and Ductility Index

The torque angle of the rotation curve shows three parts: the precracking, ultimate, and failure areas (P-I area, P-II area, and P-III area, respectively), as shown in Figure 8 Okay and Engin [21]. The areas under the curves of the P-I area, P-II area, and P-III area represent the torsional toughness, in which energy is absorbed by the tested specimens. Therefore, the P-I area, P-II area, and P-III area are the precracking torsional toughness of the beam, cracked toughness before achieving the ultimate torque strength, and postcracking toughness, respectively. Using the torque–angle of rotation curves, the three portions of toughness were calculated.
Table 10 shows that the steel FRC beams with fiber dosages 1% and 1.5% demonstrated structural toughness under torsion load comparable to the T-NCon beam, especially P-II, and the total toughness reached two times as much. The enhancement in toughness is credited to the posthardening behavior and energy absorption of the steel FRC beams. Using SFs in the concrete mix, the crack width decreased due to the interfacial bond strength between the SFs and the concrete components. The steel FRC beams of 0.5% fiber content exhibited low torsional toughness in the three parts compared with the T-NCon beam. This reduction in torsional toughness was due to the missed reparation of 0.5% SF dosage in the absence of transverse reinforcement. Also, 60 mm fiber length with 1.5% SF content showed higher torsional toughness as a result of the matrix bond strength restricting the expansion of cracks and preventing the concrete matrix from separation via the crack-bridging effect.
Also, the torsional ductility of the tested T-NCon and steel FRC beams was estimated using the description based on a form of torsional ductility (μ = θu/θy) recognized and utilized by Bernardo and Lopes [11], where θu and θy are the ultimate angle of rotation and yielding angle of rotation corresponding to the ultimate torque load and yielding torque load, respectively. The elastic angle of rotation θy is represented by the yielding position by Hadi et al. [42]. The structural characteristics of the torsional ductility index are listed in Table 11. The results show that the rising SFs ratio increased ductility for steel FRC beams. Also, transverse reinforcement contributed to ductility in the case of the T-NCon beam. The 60 mm SF length with SF dosages 1% and 1.5% exhibited higher ductility due to the bond strength of the 60 mm SFs with cement paste resulting in a restriction of crack propagation.

5. Conclusions

This study presents experimental investigations conducted on ten beams subjected to pure torsion, including one beam without SF and nine beams with different SF additions. The following conclusions can be drawn from the test results:
  • The addition of SFs to the concrete mixture affects workability by reducing the concrete slump. Workability decreases with increasing SF length and dosage.
  • Diagonal and twisting cracks were observed around the tested beam spans as the torsional load increased. In the steel FRC beams, one main crack was wider than the others, whereas the T-NCon beam exhibited multiple major cracks with increasing torque.
  • The SF dosage of 0.5% failed to compensate for the absence of transverse reinforcement, leading to a reduction in ultimate torque capacities by 27%, 39%, and 42% for fiber lengths of 13 mm, 35 mm, and 60 mm, respectively, compared to the T-NCon beam.
  • The optimal SF dosage for improving torsional behavior in the absence of transverse reinforcement was found to be 1.0% of the volume. This resulted in torque strength improvements of 11%, 6.8%, and 4.5% for fiber lengths of 13 mm, 35 mm, and 60 mm, respectively, compared to the T-NCon beam.
  • With an SF dosage of 1.5%, the ultimate torque capacity increased by 19%, 32%, and 41% for fiber lengths of 13 mm, 35 mm, and 60 mm, respectively, compared to the T-NCon beam.
  • The initial torsional rigidity of the steel FRC beams was comparable to that of the T-NCon beam, and it was dependent on the SF dosage and the presence of transverse reinforcement.
  • The resistance to torsional cracking and crack width at failure in the steel FRC beams were influenced by the SF dosage and fiber length.
  • For the SF dosage of 0.5%, increasing the number of SFs per volume for the 13 mm fiber length demonstrated greater improvement in torsional characteristics compared to fiber lengths of 35 mm and 60 mm.

Author Contributions

Methodology, M.H.J., A.A.I. and H.H.H.; Formal analysis, B.I.A.A.-Z. and N.H.A.-S.; Investigation, M.H.J., R.F.H. and H.H.H.; Resources, B.I.A.A.-Z.; Data curation, N.H.A.-S.; Writing—original draft, R.F.H.; Writing—review & editing, H.H.H.; Supervision, A.A.I.; Project administration, A.A.I. All authors have read and agreed to the published version of the manuscript.

Funding

This research received no external funding.

Data Availability Statement

The data presented in this study are available on request from the corresponding author.

Conflicts of Interest

The authors declare no conflict of interest.

References

  1. Zhou, M.; Lu, W.; Song, J.; Lee, G.C. Application of ultra-high performance concrete in bridge engineering. Constr. Build. Mater. 2018, 186, 1256–1267. [Google Scholar] [CrossRef]
  2. Yoo, D.-Y.; Yoon, Y.-S. A review on structural behavior. Design, and application of ultra-high-performance fiber-reinforced concrete. Int. J. Concr. Struct. Mater. 2016, 10, 125–142. [Google Scholar] [CrossRef] [Green Version]
  3. Yoo, D.-Y.; Banthia, N. Mechanical properties of ultra-high-performance fiber reinforced concrete: A review. Cem. Concr. Compos. 2016, 73, 267–280. [Google Scholar] [CrossRef]
  4. Zhu, Y.; Zhang, Y.; Hussein, H.H.; Chen, G. Flexural strengthening of reinforced concrete beams or slabs using ultra-high performance concrete (FRC): A state of the art review. Eng. Struct. 2020, 205, 110035. [Google Scholar] [CrossRef]
  5. Al-Salim, N.H.; Jaber, M.H.; Hassan, R.F.; Mohammed, N.S.; Hussein, H.H. Experimental Investigation of Compound Effect of Flexural and Torsion on Fiber-Reinforced Concrete Beams. Buildings 2023, 13, 1347. [Google Scholar] [CrossRef]
  6. Rahal, K.N.; Collins, M.P. Compatibility torsion in spandrel beams using modified compression field theory. ACI Struct. J. 2006, 103, 318–338. [Google Scholar]
  7. Foraboschi, P. Structural layout that takes full advantage of the capabilities and opportunities afforded by two-way RC floors, coupled with the selection of the best technique, to avoid serviceability failures. Eng. Fail. Anal. 2016, 70, 387–418. [Google Scholar] [CrossRef]
  8. Foraboschi, P. Bending load-carrying capacity of reinforced concrete beams subjected to premature failure. Materials 2019, 12, 3085. [Google Scholar] [CrossRef] [PubMed] [Green Version]
  9. Yoo, D.-Y.; Yoon, Y.-S.; Banthia, N. Flexural response of steel-fiber-reinforced concrete beams: Effects of strength, fiber content, and strain-rate. Cem. Concr. Compos. 2015, 64, 84–92. [Google Scholar] [CrossRef]
  10. Hsu, T. Torsion of Structural Concrete Behavior of Reinforced Concrete Rectangular Members; Torsion of Structural Concrete, SP-18; American Concrete Institute: Indiana, IA, USA, 1968; pp. 261–306. [Google Scholar]
  11. Mahdi, H.M. Behavior of High Strength Self Compacted Hollow Section Reinforced Concrete Beams under Pure Torsion. Tikrit J. Eng. Sci. 2015, 22, 9–23. [Google Scholar] [CrossRef]
  12. Bernardo, L.; Lopes, S.; Teixeira, M. Experimental study on the torsional behavior of prestressed HSC hollow beams. Appl. Sci. Spec. Issue Archit. Struct. 2020, 10, 14. [Google Scholar]
  13. Rahal, K.N. Torsional strength of normal and high strength reinforced concrete beams. Eng. Struct. 2013, 56, 2206–2216. [Google Scholar] [CrossRef]
  14. Bernardo, L.F.A.; Lopes, S.M.R. Plastic analysis and twist capacity of high-strength concrete hollow beams under pure torsion. Eng. Struct. 2013, 49, 190–201. [Google Scholar] [CrossRef]
  15. ACI 318–14; Building Code Requirements for Structural Concrete and Commentary. Farmington Hills, American Concrete Institute: Indiana, IA, USA, 2014.
  16. GB 50010-2010; Code for Design of Concrete Structures. Beijing, General Administration of Quality Supervision, Inspection and Quarantine of the People’s Republic of China and Standardization Administration of the People’s Republic of China (AQSIQSAC): Beijing, China, 2015. (In Chinese)
  17. Ahmed, A.K.; Al-Sulayvany, B.J.; Jomma’h, M.M. Mechanical Characteristics of Lightweight Concrete Enhanced by Fly-Ash and Steel Fiber. Tikrit J. Eng. Sci. 2019, 26, 16–25. [Google Scholar] [CrossRef]
  18. Rao, T.D.G.; Seshu, D.R. Torsion of steel fiber reinforced concrete members. Cem. Concr. Res. 2003, 33, 1783–1788. [Google Scholar] [CrossRef]
  19. Rao, T.D.G.; Seshu, D.R. Torsional response of fibrous reinforced concrete members: Effect of single type of reinforcement. Constr. Build. Mater. 2006, 20, 187–192. [Google Scholar] [CrossRef]
  20. Chalioris, C.; Karayannis, C. Effectiveness of the use of steel fibers on the torsional behaviors of flanged concrete beams. Cem. Concr. Compos. 2009, 31, 331–341. [Google Scholar] [CrossRef]
  21. Okay, F.; Engin, S. Torsional behavior of steel fiber reinforced concrete beams. Constr. Build. Mater. 2012, 28, 269–275. [Google Scholar] [CrossRef]
  22. Hassan, R.F.; Jaber, M.H.; Al-Salim, N.H.; Hussein, H.H. Experimental research on torsional strength of synthetic/steel fiber-reinforced hollow concrete beam. Eng. Struct. 2020, 220, 110948. [Google Scholar] [CrossRef]
  23. Hassan, R.F.; Al-Salim, N.H.; Mohammed, N.S.; Hussein, H.H. Experimental study and theoretical prediction on torsional strength with different steel fiber reinforced concretes and Cross-Section areas. Eng. Struct. 2022, 251, 113559. [Google Scholar] [CrossRef]
  24. Rao, T.D.G.; Rama Seshu, D. Analytical model for the torsional response of steel fiber reinforced concrete members under pure torsion. Cem. Concr. Compos. 2005, 27, 493–501. [Google Scholar] [CrossRef]
  25. Ju, H.; Lee, D.H.; Hwang, J.-H.; Kang, J.W.; Kim, K.S.; Oh, Y.H. Torsional behavior model of steel-fiber-reinforced concrete members modifying fixed-angle softened-truss model. Compos. Part B 2013, 45, 215–231. [Google Scholar] [CrossRef]
  26. Bernardo, L.F.A.; Teixeira, M.M. Modified softened truss-model for prestressed concrete beams under torsion. J. Build. Eng. 2018, 19, 49–61. [Google Scholar] [CrossRef]
  27. Yang, I.-H.; Joh, C.; Lee, J.W.; Kim, B.-S. Torsional behavior of ultra-high performance concrete squared beams. Eng. Struct. 2013, 56, 372–383. [Google Scholar] [CrossRef]
  28. Ismail, M. Behavior of FRC Structural Members Subjected to Pure Torsion. Ph.D. Dissertation, Kassel University, Kassel, Germany, 2015. [Google Scholar]
  29. Al Khuzaie, H.; Atea, R. Investigation of torsional behaviors and capacity of reactive powder concrete (RPC) of hollow T-beam. J. Mater. Res. Tech. 2019, 8, 199–207. [Google Scholar] [CrossRef]
  30. Oettel, V.; Empelmann, M. UHPFRC box girders under torsion. In Proceedings of the Hipermat 2012 3rd International Symposium on FRC and Nanotechnology for High Performance Construction Materials, Kassel, Germany, 7–9 March 2012; pp. 517–524. [Google Scholar]
  31. Kwahk, I.; Joh, C.; Lee, J.W. Torsional behavior design of FRC box beams based on thin-walled tube theory. Engineering 2015, 7, 101–114. [Google Scholar] [CrossRef] [Green Version]
  32. Zhou, J.-L.; Li, C.-X.; Feng, Z.; Yoo, D.-Y. Experimental investigation on torsional behaviors of ultra-high-performance fiber-reinforced concrete hollow beams. Cem. Concr. Compos. 2022, 129, 104504. [Google Scholar] [CrossRef]
  33. Zou, T. Analysis on Torsion Effect and Distortion Effect of Extra-Long-Span FRC Continuous Girder Bridge. Ph.D. Dissertation, Hunan University, Changsha, China, 2015. [Google Scholar]
  34. Xie, T.; Mohamed Ali, M.S.; Elchalakani, M.; David, M. Experimental and analytical study of ultrahigh-performance fiber-reinforced concrete curved beams. J. Struct. Eng. 2020, 146, 04019192. [Google Scholar] [CrossRef]
  35. Mohammed, T.J.; Abu Bakar, B.H.; Muhamad Bunnori, N. Torsional improvement of reinforced concrete beams using ultra high-performance fiber reinforced concrete (UHPFC) jackets—Experimental study. Constr. Build. Mater. 2016, 106, 533–542. [Google Scholar] [CrossRef]
  36. Iraqi Specification Standards IQS No. (5); Portland Cement. Central Agency for Standardization and Quality Control, Planning Council: Baghdad, Iraq, 1984. (In Arabic)
  37. ASTM C33-03; Standard Specification for Concrete Aggregates. ASTM International: West Conshohocken, PA, USA, 2003.
  38. ASTM Designation A615/A615M-01b; Standard Specifications for Deformed and Plain Billet-Steel Bars for Concrete Reinforcement. Annual Book of ASTM Standards. American Society for Testing and Materials: Philadelphia, PA, USA, 2001; Volume 1.04.
  39. ASTM C496; Standard Test Method for Splitting Strength for Cylindrical Concrete Specimens. American Society for Testing and Materials: Philadelphia, PA, USA, 2004.
  40. ASTM C78C78M–18; Standard Test Method for Flexural Strength of Concrete (Using Simple Beam with Third-Point Loading). ASTM: West Conshohocken, PA, USA, 2018.
  41. BSI. BS EN 12390-3; Testing Hardened Concrete. Compressive Strength of Test Specimen. BSI: London, UK, 2009.
  42. Hadi, M.N.; Khan, Q.S.; Sheikh, M.N. Axial and flexural behavior of unreinforced and FRP bar reinforced circular concrete filled FRP tube columns. Constr. Build. Mater. 2016, 122, 43–53. [Google Scholar] [CrossRef] [Green Version]
Figure 1. Details of the tested beams (a) NC beam and (b) FRC beams.
Buildings 13 01865 g001
Figure 2. Flowchart of the research approach.
Buildings 13 01865 g002
Figure 3. Physical form of hooked-end SF: (a) Hook SF (H60), (b) Hook SF (H35), and (c) Hook SF (H13).
Buildings 13 01865 g003
Figure 4. Tested specimens of concrete mixes: (a) compression test, (b) splitting test, and (c) flexural test.
Buildings 13 01865 g004
Figure 5. (a) Test setup without instrumentation, (b) test setup with instrumentation, (c) spherical bearing ball with welded base, (d) front view, (e) side view, and (f) top view.
Buildings 13 01865 g005
Figure 6. Cracks of tested beams after failure. (a) T-NCon., (b) T-FRC0.5-13, (c) T-FRC0.5-35, (d) T-FRC0.5-60, (e) T-FRC1.0-13, (f) T-FRC1.0-35, (g) T-FRC1.0-60, (h) T-FRC1.5-13, and (i) T-FRC1.5-35, and (j) T-FRC1.5-60.
Buildings 13 01865 g006aBuildings 13 01865 g006bBuildings 13 01865 g006c
Figure 7. Torque–angle of rotation plots of (a) 13 mm fiber length, (b) 35 mm fiber length, and (c) 60 mm fiber length.
Buildings 13 01865 g007aBuildings 13 01865 g007b
Figure 8. Torsion model (Okay and Engin [21]).
Buildings 13 01865 g008
Table 1. Test beam indexes experimental variables.
Sample IDFiber Dosage Vf (%)Fiber Length (mm)
T-NCon00
T-FRC0.5-130.513
T-FRC1.0-131.013
T-FRC1.5-131.513
T-FRC0.5-350.535
T-FRC1.0-351.035
T-FRC1.5-351.535
T-FRC0.5-600.560
T-FRC1.0-601.060
T-FRC1.5-601.560
Table 2. The manufacturer provided information regarding the hook SFs.
FiberDiameter (mm)Length (mm)L/DTensile Strength (MPa)
Hook SF (H13)0.2013652500
Hook SF (H35)0.553564900–2200
Hook SF (H60)0.906067900–2200
Table 3. Sieve analysis of fine aggregate.
Sieve Size (mm)Cumulative Passing %% Passing of the Overall Limit of ASTM C33-03 [37]
9.5100100–100
4.759895–100
2.368980–100
1.187450–85
0.63925–60
0.3125–30
0.1520–10
Table 4. Sieve analysis of coarse aggregate.
Sieve Size (mm)Cumulative Passing %% Passing of the Overall Limit of ASTM C33-03 [37]
25100100
1910090–100
12.58040–85
9.53710–40
4.540–15
Table 5. Chemical analysis of Portland cement.
Compound CompositionChemical CompositionPercentage by WeightLimits of IQS No. 5/1984 [36]
Lime oxideCaO63.4------------
Silica dioxideSiO218.7------------
Alumina oxideAl2O33.8------------
Iron oxideFe2O33.86------------
Lime saturation factorLSF0.8730.66–1.02
Magnesia oxideMgO0.43≤5.00%
Tricalcium aluminateC3A1.714------------
Sulfate trioxideSO32.24≤2.5% if C3A ≤5%
Loss on ignitionLOI2.2≤2.8% if C3A >5%
Insoluble residueIR0.89≤1.50%
Table 6. Physical Properties of Portland Cement.
Physical PropertiesTest ResultsLimits of IQS No.5/1984 [36]
Fineness (Blaine) (m2/kg)280≥230
Time of setting (Vicat) (minutes)Initial time98≥45
Final time406≤600
Compressive strength for cement paste cube mold (50 mm) (MPa)3 days22.07≥15
7 days35.23≥23
Table 7. Concrete Mix Details.
MaterialQuantity
Cement (kg·m−3)480
Fine aggregate (kg·m−3)784
Coarse aggregate (kg·m−3)832
Water (kg·m−3)216
Table 8. Mechanical properties of concrete mixes.
Mix IDSlump (mm)COV %Diff. (%)Compressive Strength (MPa)COV %Diff. (%)Tensile Strength (MPa)COV %Diff. (%)Flexural Strength (MPa)COV %Diff. (%)Brittleness Ratio
Con.1284.10%0%34.253.62%0%2.686.25%0%3.325.24%0%10.3
H13-0.51204.70%−6%40.323.35%18%4.223.25%57%5.673.66%71%7.1
H13-1.0953.80%−26%45.364.36%32%5.475.14%104%6.154.82%85%7.4
H13-1.5905.20%−30%51.28.54%49%6.454.55%141%8.258.25%148%6.2
H35-0.51096.10%−15%38.446.27%12%3.418.36%27%4.816.32%45%8.0
H35-1.0962.40%−25%42.335.62%24%5.226.54%95%5.867.22%77%7.2
H35-1.5874.60%−32%49.657.62%45%6.252.55%133%7.893.66%138%6.3
H60-0.51025.00%−20%36.143.52%6%3.14.45%16%4.125.39%24%8.8
H60-1.0903.60%−30%40.255.51%18%4.256.33%59%5.244.15%58%7.7
H60-1.5826.10%−36%45.434.62%33%6.334.32%136%7.687.32%131%5.9
Table 9. Torsional features layout of T-NCon and FRC beams.
Sample IDFirst CrackingUltimate Stage K (kN m)
Torque (kN·m)Rotation (rad)Torque (kN·m)Rotation (rad)
T-NCon3.50.00228.80.0211590
T-FRC0.5-134.50.0036.40.0131500
T-FRC1.0-135.20.00359.80.0281485
T-FRC1.5-136.70.004110.50.0261634
T-FRC0.5-353.60.00225.40.00241636
T-FRC1.0-354.80.00319.40.0261548
T-FRC1.5-356.50.004311.60.0281512
T-FRC0.5-603.50.00235.10.00251522
T-FRC1.0-603.90.00249.20.0311625
T-FRC1.5-606.10.003812.40.0431605
Cracking torque ( T c r ); ultimate torque ( T u ); initial torsional stiffness ( K ).
Table 10. Torsional toughness for all models in three parts.
Sample IdentificationTorsional Toughness (kN·m·rad)
P-IP-IIP-IIITotal
T-NCon0.0070.1720.120.299
T-FRC0.5-130.0070.070.1350.212
T-FRC1.0-130.0080. 2280.10.336
T-FRC1.5-130.0070.2290.130.366
T-FRC0.5-350.0070.0070.0330.047
T-FRC1.0-350.0030.2120.120.335
T-FRC1.5-350.0060.2630.130.399
T-FRC0.5-600.0070.0070.0020.016
T-FRC1.0-600.0250.2360.0530.314
T-FRC1.5-600.0280.3970.2110.636
Table 11. Torsional ductility of beams.
Sample IdentificationTorsional Ductility μ
T-NCon9.07
T-FRC0.5-134.12
T-FRC1.0-137.60
T-FRC1.5-136.02
T-FRC0.5-351.04
T-FRC1.0-357.97
T-FRC1.5-356.19
T-FRC0.5-601.03
T-FRC1.0-6010.27
T-FRC1.5-6012.75
Disclaimer/Publisher’s Note: The statements, opinions and data contained in all publications are solely those of the individual author(s) and contributor(s) and not of MDPI and/or the editor(s). MDPI and/or the editor(s) disclaim responsibility for any injury to people or property resulting from any ideas, methods, instructions or products referred to in the content.

