Article

Optimization Model of Maintenance Scheduling Problem for Heritage Buildings with Constraint Programming

by
Shu-Shun Liu
1,*,
Putri Utami
1,
Agung Budiwirawan
2,
Muhammad Faizal Ardhiansyah Arifin
2 and
Fernanda Sarwatatwadhika Perdana
1
1
Department of Civil and Construction Engineering, National Yunlin University of Science & Technology, Yunlin 640, Taiwan
2
Department of Civil Engineering, Universitas Negeri Semarang, Semarang 50229, Indonesia
*
Author to whom correspondence should be addressed.
Buildings 2023, 13(7), 1867; https://doi.org/10.3390/buildings13071867
Submission received: 7 June 2023 / Revised: 8 July 2023 / Accepted: 19 July 2023 / Published: 23 July 2023
(This article belongs to the Special Issue Health and Sustainability in Buildings)

Abstract

:
The preservation and maintenance of ancient buildings, particularly heritage buildings, is a complex process that requires careful consideration of several aspects, including maintenance plans and budget availability. An effective long-term maintenance plan is crucial for preserving the historical value and condition of these buildings. The primary purpose of such a plan is to limit building deterioration, maintain optimal building performance, minimize operational costs and ensure budget constraints are met. This study introduces an innovative methodology to optimize maintenance strategies for heritage buildings in various scenarios, including normal conditions and the aftermath of possible catastrophic events. The proposed methodology compares different parameters, such as building conditions, building service life and various types of maintenance interventions. However, budget availability poses a significant challenge in many case studies, and addressing budgetary constraints is notoriously difficult. Limited budgets may hinder the implementation of desired maintenance activities, necessitating optimization of the maintenance plan to overcome these issues. To address these challenges, this study utilizes constraint programming (CP) as an optimization tool. Constraint programming is a powerful optimization methodology that addresses combinatorial problems by formulating them as mathematical models and handling the associated constraints. By representing the problem as one or more instances of the Constraint Satisfaction Problem (CSP), constraint programming enables efficient and effective problem solving. The proposed CP model proves to be a valuable tool in solving maintenance scheduling problems for heritage buildings. The results of this study are intended to assist decision makers in developing long-term maintenance plans for heritage building preservation.

1. Introduction

Effective maintenance methods play a crucial role in controlling a building’s deterioration from its early phase and in preventing the failure of its components. Proper maintenance action can effectively manage the inevitable process of deterioration and significantly extend the physical life of the structure [1,2]. Maintaining aging heritage buildings is particularly challenging [3]. Practitioners are frequently faced with tough decisions in maintaining heritage buildings because of their fragile structures. Several studies [4,5,6,7] have emphasized the significance of preserving heritage buildings, taking into account their architectural value, historical traditions, scientific importance [8], aesthetic appeal for tourism [9] and cultural significance [10]. However, there is a lack of comprehensive studies addressing the improvement of the decision-making process for determining the most suitable renovation time. This poses significant challenges for heritage building managers in developing cost-effective maintenance plans and implementing appropriate maintenance operations [11].
Maintenance plans in heritage buildings serve as a strategic tool to achieve various objectives, such as controlling degradation, sustaining optimal building performance, reducing the operational cost and meeting budget requirements [12,13]. Therefore, there is a need for a cost-effective method to create maintenance plans.
According to Riley and Cotgrave [14], faulty maintenance can be divided into two categories, i.e., poorly performed maintenance and, more frequently, no maintenance performed at all over the lifetime of the system. Inadequate funding can eventually lead to the failure of a building, highlighting the importance of proper planning and budget allocation. Agapiou et al. [15] mentioned that heritage building maintenance, in particular, is expensive, and financial constraints may hinder the implementation of appropriate long-term planning, especially in older structures with ancient components. Considering the fragile structures of heritage buildings, a catastrophic event may lead to significant deterioration [3,16]. Therefore, these buildings require continuous and substantial maintenance and restoration efforts [17,18]. Inefficient and inappropriate maintenance operations, coupled with the lack of decision-making tools for optimizing preventive maintenance activities in heritage buildings, can result in excessive and even needless expenses [19]. As mentioned by Farahani et al. [9], these issues become even more complicated when maintenance and restoration budgets are restricted, with socioeconomic issues abound.
When defining maintenance policies, it is crucial to consider both objective factors and the availability of financial resources in the decision-making process [20]. The alternative solution to solving those challenges in building maintenance management is the adoption of a preventive maintenance approach [1,5,21]. This approach plays a crucial role in calculating and accumulating cost usage effectiveness [22]. By allocating the projected cost to the building maintenance budget, proactive maintenance measures can be developed to prevent the deterioration of the building’s condition [6,23]. Kwon et al. and Chan et al. [23,24] mentioned that this proactive approach helps mitigate future issues and ensures the longevity and sustainability of the building.
Supported by Prieto et al. [3], the latest collected data are fresh input that support stakeholders in making better decisions related to heritage building maintenance activities. In this study, the building condition data were collected from the Central Java Cultural Heritage Conservation Center in Indonesia [25] and categorized based on thorough field surveys and expert assessments. The objective of this study is to formulate a heritage building preventive maintenance plan using the available data. The primary focus lies in formulating a long-term maintenance strategy that maximizes the lifetime of these valuable structures while adhering to the constraints posed by budget availability. This strategy also considers several building condition levels, which can be normal or low-level resulting from catastrophic events. In normal conditions, real-time data obtained from the current state of the buildings are utilized, assuming the absence of unforeseen events such as catastrophic incidents. However, in the case of catastrophic conditions, we simulate a deteriorated state, in which the buildings are expected to be in a worse condition than their current state. When such circumstances occur, it becomes crucial to address the urgent needs of the buildings, as activities that could impact the buildings may potentially lead to significant deterioration. To tackle this challenge, an optimization approach is adopted within the framework of the building maintenance life cycle, enabling the development of a comprehensive maintenance plan.

2. Literature Review

Many issues related to historical preservation have been documented, particularly regarding heritage buildings in urban areas. Several aspects are important, considering that the historical value of the building must be preserved [24,26]. Therefore, maintenance should be prioritized, as it not only safeguards the original structure’s functionality but also enhances the socio-economic environment in its vicinity [27]. The deterioration of heritage buildings not only incurs high maintenance costs but also reduces their usability and safety, which is primarily caused by their age.
The adaptive reuse of heritage buildings has been a subject of interest among researchers, aiming to maximize the utilization of the remaining structures. Sanchez et al. [28] used Life Cycle Analysis (LCA) to select the deconstruction programming approach for adaptive reuse and obtained a heuristic solution that was close to optimal. Adaptive reuse in heritage buildings is accomplished by considering both economic and environmental factors. According to Foster [29], the concept of adaptive reuse can provide economic benefits, wherein heritage buildings should be preserved not only for cultural reasons but also for economic reasons, as stated by Forster et al. [30]. Yung and Chan [31] emphasized the importance of preserving heritage buildings by reusing their existing facilities and extending their lives through sustainable concept development. This can be achieved through various methods, such as reusing, repairing, refurbishing, remanufacturing and repurposing the building’s structure. Munarim and Ghisi [32] demonstrated LCA in their research as a predictive indicator of environmental impact. Frey et al. [33] utilized LCA to analyze various maintenance operations and their impact on the ecosystem. Their findings demonstrate that each operation had an impact on the ecosystem. Msrlsoy and Günçe [34], on the other hand, investigated the variables that affect the decision-making process for establishing a holistic model for heritage buildings that includes an adaptive reuse approach.
In order to effectively maintain heritage buildings, proper strategies and tools are essential in assisting with the management of maintenance activities in accordance with the standards. Cho and Yoon [11] used mathematical modeling as a tool to simplify the building maintenance management process. They discussed the comparison of effective financing for conditions before and after the renovation of the building. Moreover, they considered cumulative life cycle cost analysis (LCCA), including initial cost (IC), operational cost (OC) and demolition cost (DO). Thus, it can be a reference for predicting the cost-effective renovation time. In their research, they developed an algorithm to determine the cost-effective renovation time. Flores-Colen and de Brito [1] applied the Life Cycle Cost (LCC) method and developed several scenarios in the building maintenance strategy as a preventive effort against the possible degradation of building conditions. They considered several parameters such as service life, performance, minimum level of quality, the maintenance operation frequency of maintenance activities, and costs. Grant and Ries [35] generated a building service life prediction in order to represent service life in an LCA framework and to consider the environmental effect. This study focused on the connection between the material and the system in the building’s maintenance operations. As a result, the predicted building life cycle is more precise and thorough. Morcous and Lounis [36] proposed a maintenance strategy by providing an alternative to network infrastructure facilities using a genetic algorithm. Their objective was to minimize life cycle costs while meeting global plan requirements and functionality. Lounis and Vanier [13] conducted a study on roof maintenance systems, which aimed to achieve multiple objectives, such as reducing repair and maintenance costs, maximizing network performance and minimizing the risk of errors in the maintenance process. To achieve these objectives, they employed the compromise programming method with the concept of a life cycle, using the Markov chain. In previous studies, as previously presented, the utilization of Life Cycle Cost Analysis (LCCA) has generally been observed, as conducted by Cho et al., Flores-Colen et al., Grant et al. and Morcous et al. Consequently, in this research, the LCCA calculations can be leveraged as the logical basis for determining the inflation rate in the estimation of future cost values.
The maintenance system of old buildings, in particular, is often inadequate due to the decline in the building’s condition [37]. Kalman and Létourneau [26] stated that the maintenance of heritage buildings is necessary to preserve their value. Munarim and Ghisi [32] conducted research related to heritage building maintenance to minimize significant negative impacts on the environment. They considered the impact of heritage building improvement on the surrounding environment. Kwon et al. [23] used old buildings in urban areas as a case study. In their paper, they developed a model by adopting case-based reasoning (CBR) as a methodology, in which the weighting of several similar cases was carried out, and a genetic algorithm (GA) was used to optimize the weighting of the values generated from the CBR. The analysis included Monte Carlo simulation based on the GA results to predict the maintenance costs for multi-family old buildings. Thus, the results of the model were used concerning proactive long-term planning during the maintenance phase.
Farahani et al. [12] proposed a multi-objective optimization technique for maintenance and renovation schedules, which uses a modified degradation function for life expectancy studies. The technique was combined with a service life cycle cost analysis (LCCA) to plan maintenance and renovations for two identical buildings of varying ages and to demonstrate the effectiveness of the approach. Several previous studies [38,39,40,41,42] have focused on prioritizing and implementing predictive maintenance based on the building’s condition level. Furthermore, previous studies [7,43,44,45] have proposed research on the assessment of priorities for the preservation of historic buildings by utilizing the ARAS and AHP methods. These studies considered some of the values contained in historic buildings, such as archaeological, historical, architectural, economic, social and other arguments. As a result, these investigations have generated multiple assessment criteria for alternative renovation projects of cultural heritage buildings.
Several researchers have developed fuzzy logic to classify and determine building condition levels into several classifications based on multiple aspects. Previously, fuzzy logic has been utilized to analyze the service lives of historic buildings. Prieto et al. [46] developed a new computational approach based on fuzzy systems that is focused on historic building management and that considers primarily variables related to the inherent risk of structures in a given local environment. In another study Prieto et al., [47] proposed the improved use of the Mamdani fuzzy model (MFM) to assess the serviceability of architectural historic structures. This method is particularly suitable for establishing priorities for preventive conservation in groups of similar historic structures, based on their functional criteria. In addition, statistical techniques have been employed to estimate the functional service lives of architectural heritage [48]. A fuzzy inference method was used to rank architectural heritage in terms of functional service life, allowing for the prioritization of maintenance and preventive conservation activities in homogenous groups of buildings, as well as the optimization of maintenance costs.
Furthermore, some studies have focused on developing multi-scenario analyses to assess potential future scenarios that may affect heritage buildings. Prieto et al. [49] proposed an approach for estimating the functional service lives of historic structures in a given area. This study provided a multi-scenario analysis, assessing environmental risks based on the building’s intended use. This analysis considered static structural risks as well as historical data related to the building’s life cycle, based on historical records, evaluating the building’s degree of vulnerability over time. The findings from these studies using fuzzy logic methods have provided valuable parameters for predicting and prioritizing interventions for heritage buildings. According to several statements made by A.J. Prieto et al., [46,47,48,49] heritage value is a crucial factor to consider in the preservation of historic buildings. However, none of these prior studies have addressed the catastrophic condition in the preservation strategy.

3. Model Development

The method used in this study involves the application of Constraint Programming (CP), which has proven to be effective and efficient in solving schedule problems at different application areas in previous research. CP is an optimization methodology used for solving combinatorial issues. Defining these combinatorial optimization issues into one or more cases of the Constraint Satisfaction Problem (CSP) is a common way to solve the problem [50]. Scheduling, in particular, has been recognized as one of the areas where constraint programming (CP) demonstrates its effectiveness [51]. Liu et al. [21,52] proposed the concept of maintenance scheduling problems utilizing the constraint programming (CP) method. Their study explored a novel approach to structural maintenance planning by utilizing a preventive maintenance strategy based on historical data from a prior study. They used the Constraint Programming (CP) approach to construct an optimization framework that considers the budget constraint. Considering the effectiveness and efficiency of CP in solving combinatorial problems, it was chosen as the methodology for the current research. To solve the scheduling optimization model developed in this study, IBM ILOG CPLEX Optimization Studio IDE 12.10.0 was utilized as the optimization platform.

3.1. Problem Definition

The first step in developing a historic building maintenance plan is to define the problem to be solved. This problem is defined as follows:
  • Many historic buildings need maintenance to function properly.
  • Before the implementation of the maintenance plan, these buildings have different initial conditions.
  • The condition of the building deteriorates as its lifetime increases. Therefore, in the event of a catastrophic event, its condition worsens.
  • The use of heritage buildings can be worthwhile when the buildings meet the required conditions.
  • Building maintenance enhances its condition continuously.
  • Building preservation is limited by budget restrictions.
  • It is necessary to have a maintenance plan that can sustain the building’s adequate condition for the longest possible period.
Based on these issues, increasing the maintenance level can significantly improve the building’s condition. However, it also comes with an increase in the required budget. This historic building maintenance model is intended to reach the longest historic building life by considering the available budget. Given these concerns, we aim to propose an enhanced concept that effectively addresses these issues.

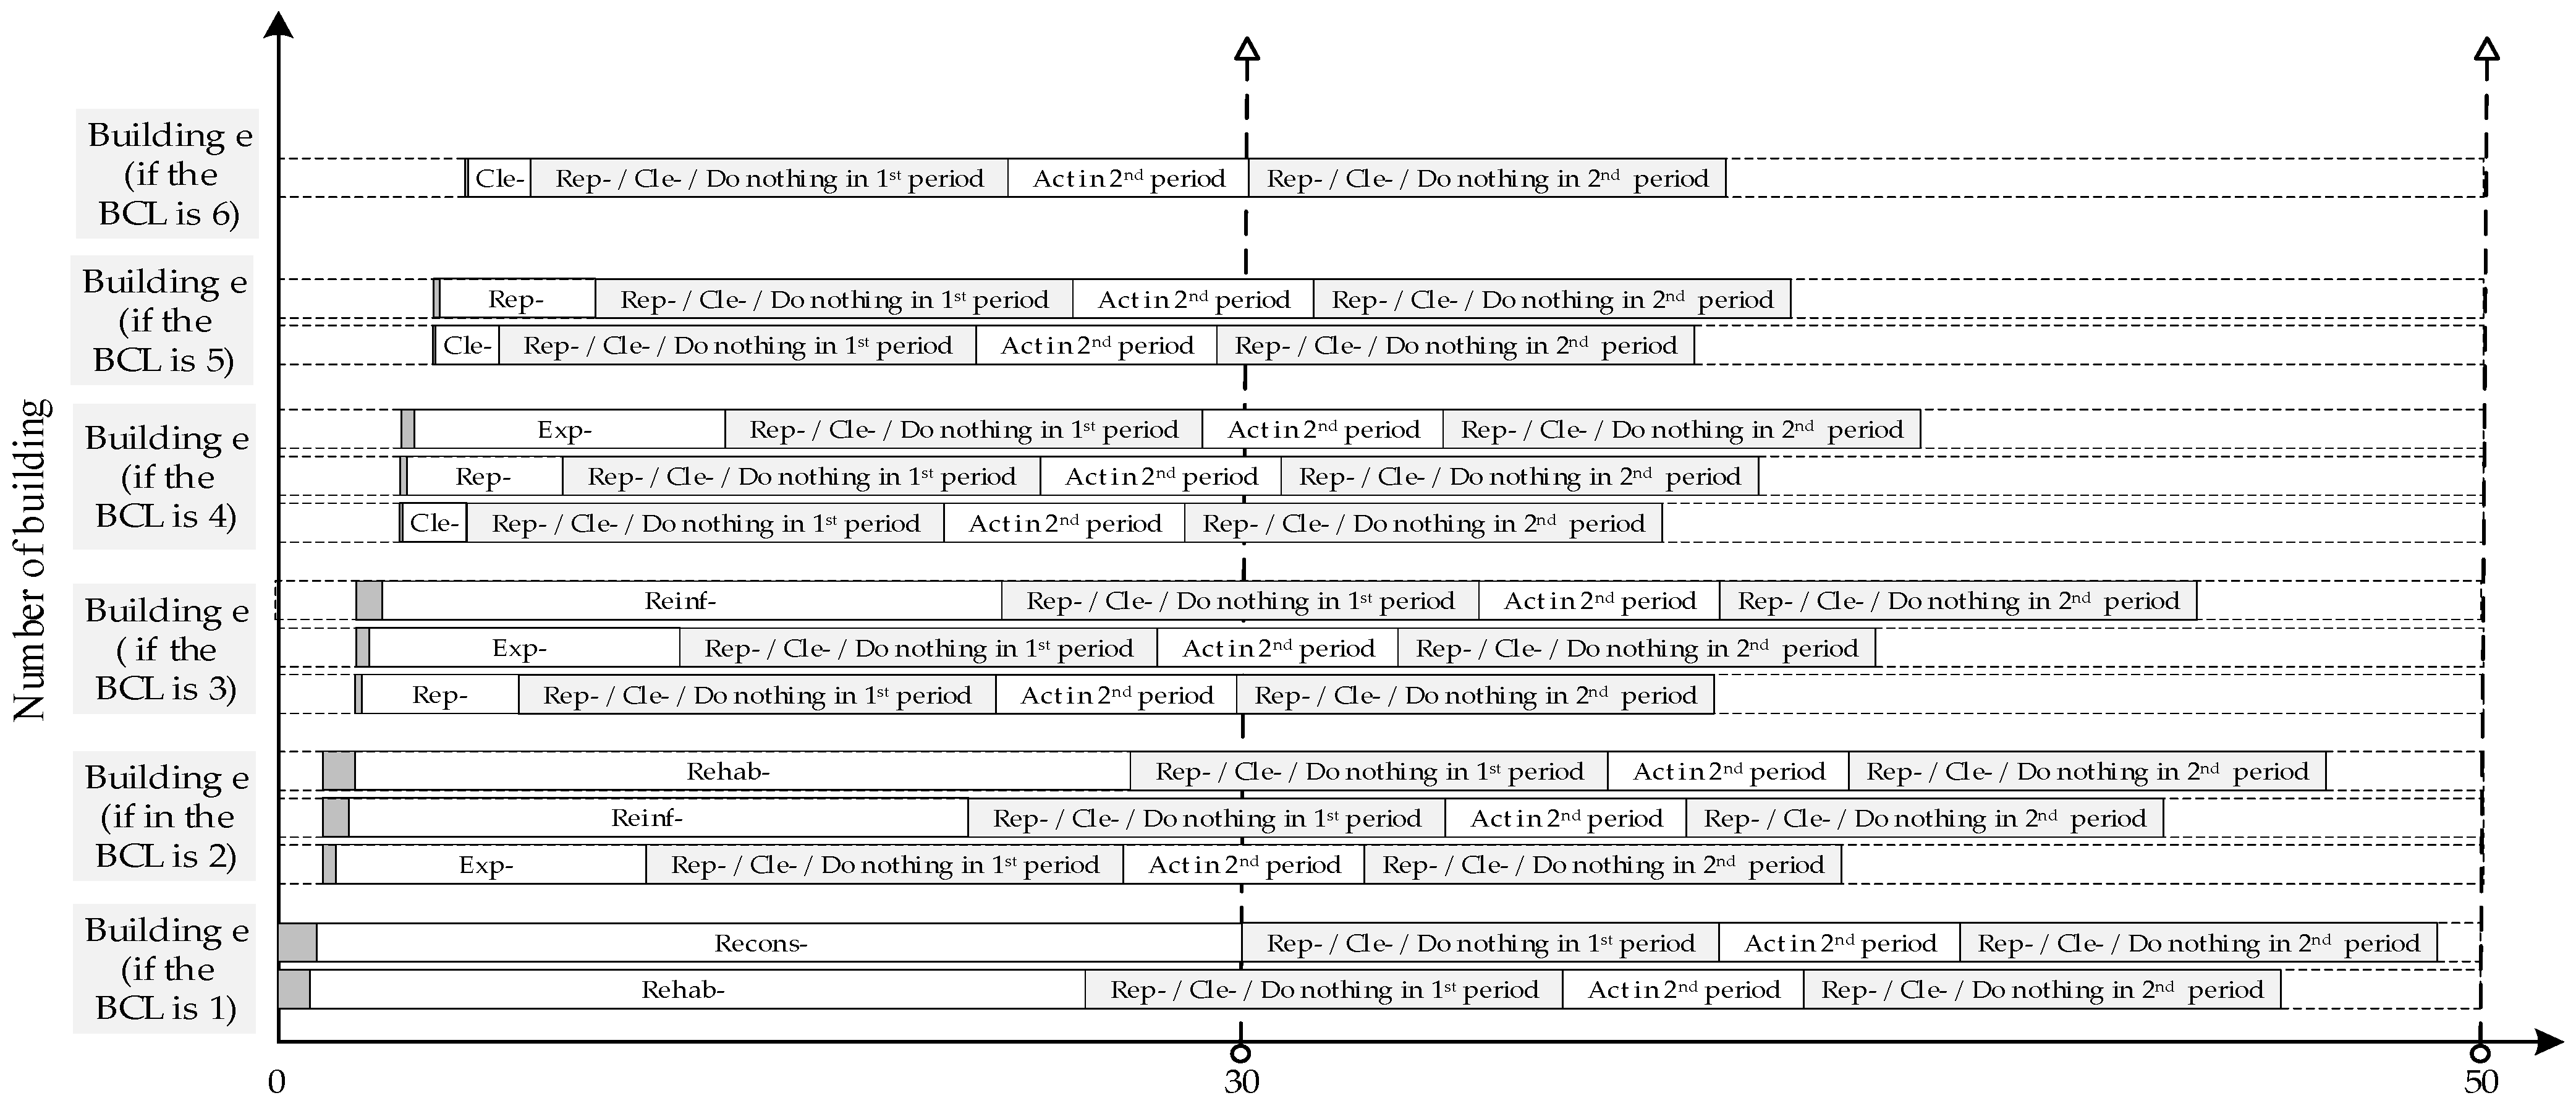
3.2. Model Formulation

In order to solve the problem as defined previously, we identified and categorized the key components that require attention. In this section, we aim to summarize the problems that are required to be solved, and the model proposed in the methodology is as follows:
  • The building conditions are classified into several levels.
  • The building can be reused if its condition is at an acceptable level under the standard required.
  • The planned maintenance of heritage buildings consists of several packages of maintenance activity. The packages of activity require that the amounts of the costs are separate and generate the enhancement of building conditions for every heritage building individually.
Related to these principles, when the condition of the heritage building is weak, it is essential to undertake major interventions immediately to prevent exponential deterioration of the building. However, for heritage buildings that are initially in good condition and have been well-maintained, major maintenance actions may not be necessary right from the start of the intervention.
To establish the proposed model, we consider different building condition levels (BCL) for each building at the beginning of the period, as shown in Table 1. Based on the BCL, the model adjusts the appropriate type of maintenance required for each building, as shown in Table 2. According to Kalman et al. [26], heritage building maintenance activities should be carried out as much as possible to minimize major repairs, which aim to maintain the value contained in the heritage building. Therefore, there are various options related to the maintenance type.
The survey assessment involved the standards of heritage building preservation regulations of the Old Town Area Building and Environmental Planning (BEP), Semarang [53]. In this study, the building condition data were collected from a field survey conducted in 2019, focusing on a list of heritage buildings in the Old City Area of Semarang, Indonesia [25]. The building condition classifications are shown in Table 1.
In addition, the type of maintenance action is determined using data from previous maintenance actions. The types of maintenance action are presented in Table 3. The classification of major and minor maintenance activities indicates that they have a varying impact on increasing the building’s service life value, from the highest to the lowest. Each intervention influences the estimated increase in service life, which is indicated by the growing building age after major and minor activities. The cost of each intervention type is also determined based on the expert’s experience, as shown in Table 3. In this model, which utilizes several concepts from a sequence of building maintenance activities as indicated in Table 2, the preliminary selection is based on the initial building condition level (BCL).
From the information above, we formulated a model to determine the appropriate maintenance action based on the building condition level (BCL) classification. This means that, when a specific BCL is identified, the corresponding maintenance action is selected. The subsequent activity follows the required action, such as replacement or cleaning. As shown in Table 2, maintenance activities should be carried out without any gaps between the long-term planning activities. Additionally, the remaining lifespan of each building needs to be considered when determining the start time for maintenance activities. The interactivity relationship in this research indicates that, once the predecessor activity ends, the next activity commences immediately. With no gaps between maintenance activities, the initial maintenance needs to be conducted in order to increase the BCL significantly. It is important to note that, in some cases, the model may recommend a major intervention alone instead of a combination of minor interventions. The following period in that building directly chooses the next major intervention associated with the building’s lifetime capability that the intervention can increase significantly, such as reconstruction, rehabilitation, reinforcement and expansion. The model also considers the budget availability throughout the period to assess the possibilities of selection. Figure 1 further illustrates the concept of the activity sequence among different BCLs, where shadow areas represent the construction duration of maintenance activities.
All model parameters and variables are shown in Table 4. To solve the maintenance scheduling problem, the model is designed to maximize the service lives of heritage buildings within a given planning period. To achieve this goal, the concept of long-term maintenance scheduling is applied, and the associated constraints are outlined below.
M a x i m i z e b = 1 e w b ×   D b
The objective function is presented in Equation (1), where the primary goal is to maximize the lifetime of each heritage building with the prioritized importance weight of each building, as required by the heritage building preservation regulations in the case study.
s r b = 0 d r b = 0
According to Equation (2), if the building condition is heavily damaged, it means that the remaining lifetime of the building is zero, and there is no further time left. Therefore, as described in Equation (7), the maintenance activities must be carried out continuously.
s r b = 0     s r b = S J a p b
As mentioned previously, when Equation (2) is triggered, it activates the implementation of Equation (3). In reality, when the remaining lifetime is zero, the start time of the remaining time is equivalent to the start time of the initial major activity.
e r b = s r b + d r b
To define the end time of the remaining time in each heritage building individually, an approach is used that takes into account both the start and length of the remaining time in each building. This approach is outlined in Equation (4) for a clearer understanding.
e r b = S J a p b
The constraint related to the end of the remaining time based on the building condition level from the field survey conducted by the government is presented in Equation (5). When the remaining time runs out, this equation indicates that the major intervention or small intervention should be started. As a result, there is no idling maintenance action throughout the entire building. Consequently, the entire structure is adequately maintained.
SI ipb = dr b + DJ apb
Equation (6) defines the minor maintenance activity conducted since the remaining time and major maintenance activity completed. When the duration is finished, the minor activity needs to be undertaken further. Therefore, in the following discussion, it is important to note that the start time of minor activities is determined based on the start time, duration of the remaining time and duration of the major intervention.
D R b = 0 1 S J a p b 2
When the remaining lifetime is 0 in Equation (7), the next major activity must be major activity 1 or 2, which is building reconstruction or rehabilitation action to be undertaken.
1 D R b 5 2 S J a p b 4
Equation (8) presents that, when the remaining lifetime has a duration between 1 and 5, the next major activity is a rehabilitation, reinforcement or expansion intervention for the building.
5 D R b 10 3 S J a p b 5
On the other hand, if the remaining lifetime duration is between 5 and 10, as per Equation (9), the next major activity should be a reinforcement, expansion or replacement intervention.
10 D R b 15 4 S J a p b 6
When the duration of the remaining lifetime is between 10 and 15, the next major activity must conduct expansion, replacement or cleaning of the building, as stated in Equation (10).
15 D R b 20 5 S J a p b 6
Similarly, if the remaining lifetime is between 15 and 20, the next major activity must be conducted as per Equation (11) to examine the replacement or cleaning of the building.
20 D R b 25 S J a p b = 6
When the duration of the remaining lifetime is equal to or greater than 20 but less than or equal to 25, Equation (12) dictates that the next major intervention should involve cleaning the building. As a result of the above statements, when the remaining lifetime is between 5 and 10 years, the building is classified as level 6. In such cases, a visual assessment of the building serves as an alternative to conducting a physical inspection. The recommended maintenance intervention for buildings at this level is minimal, as the building’s condition is consistently excellent. The focus should be on maintaining the stability of the building level rather than undertaking extensive interventions.
a = 0 e c j a [ 1 + r y ] y ×   J apb = CJ a p b i = 0 h c i i [ 1 + r y ] y ×   i ipb = CI i p b b = 1 e p = 1 f a = 0 g i = 0 h CJ a p b +   CI ipb     p = 1 f y = 0 m p b b p p [ 1 + r ] y
Equation (13) illustrates the expense that must be considered. It represents a requirement that the maintenance cost in period p must be less than or equal to the budget capacity.
er b     SJ apb     SI ipb
Equation (14) indicates that the remaining lifetime needs to be finished; then, the major activity and the minor activity are conducted after the previous activity finishes.
a = 0 g d a ×   J apb = DJ a p b i = 0 h d i ×   i ipb = DI i p b a = 0 g i = 0 h p = 0 f [ dr b + DJ apb + DI ipb ] = D b
It is crucial to determine the expected timeframe for budget allocation when planning maintenance activities. The service goal time can be calculated by adding the remaining time, major activity time and minor activity time. This formula is represented in Equation (15).
r p b   D b   m p b
In order to analyze the appropriate budget, it is essential to calculate the expected time to be accomplished in building maintenance while creating a plan. Budget allocation needs to consider the maintenance needs of the building and ensure that the desired maintenance goals can be achieved within the available budget. Equation (16) is used to establish the model’s constraints, specifically determining the minimum time required to meet the maintenance targets. In this case, the total time of the activity must be accomplished in less than or equal to the planning budget allocation time from the authorities, which is 30 years. In addition, based on [35], regarding the approximate life cycle, the estimated maximum duration in one cycle of maintenance planning is 50 years.

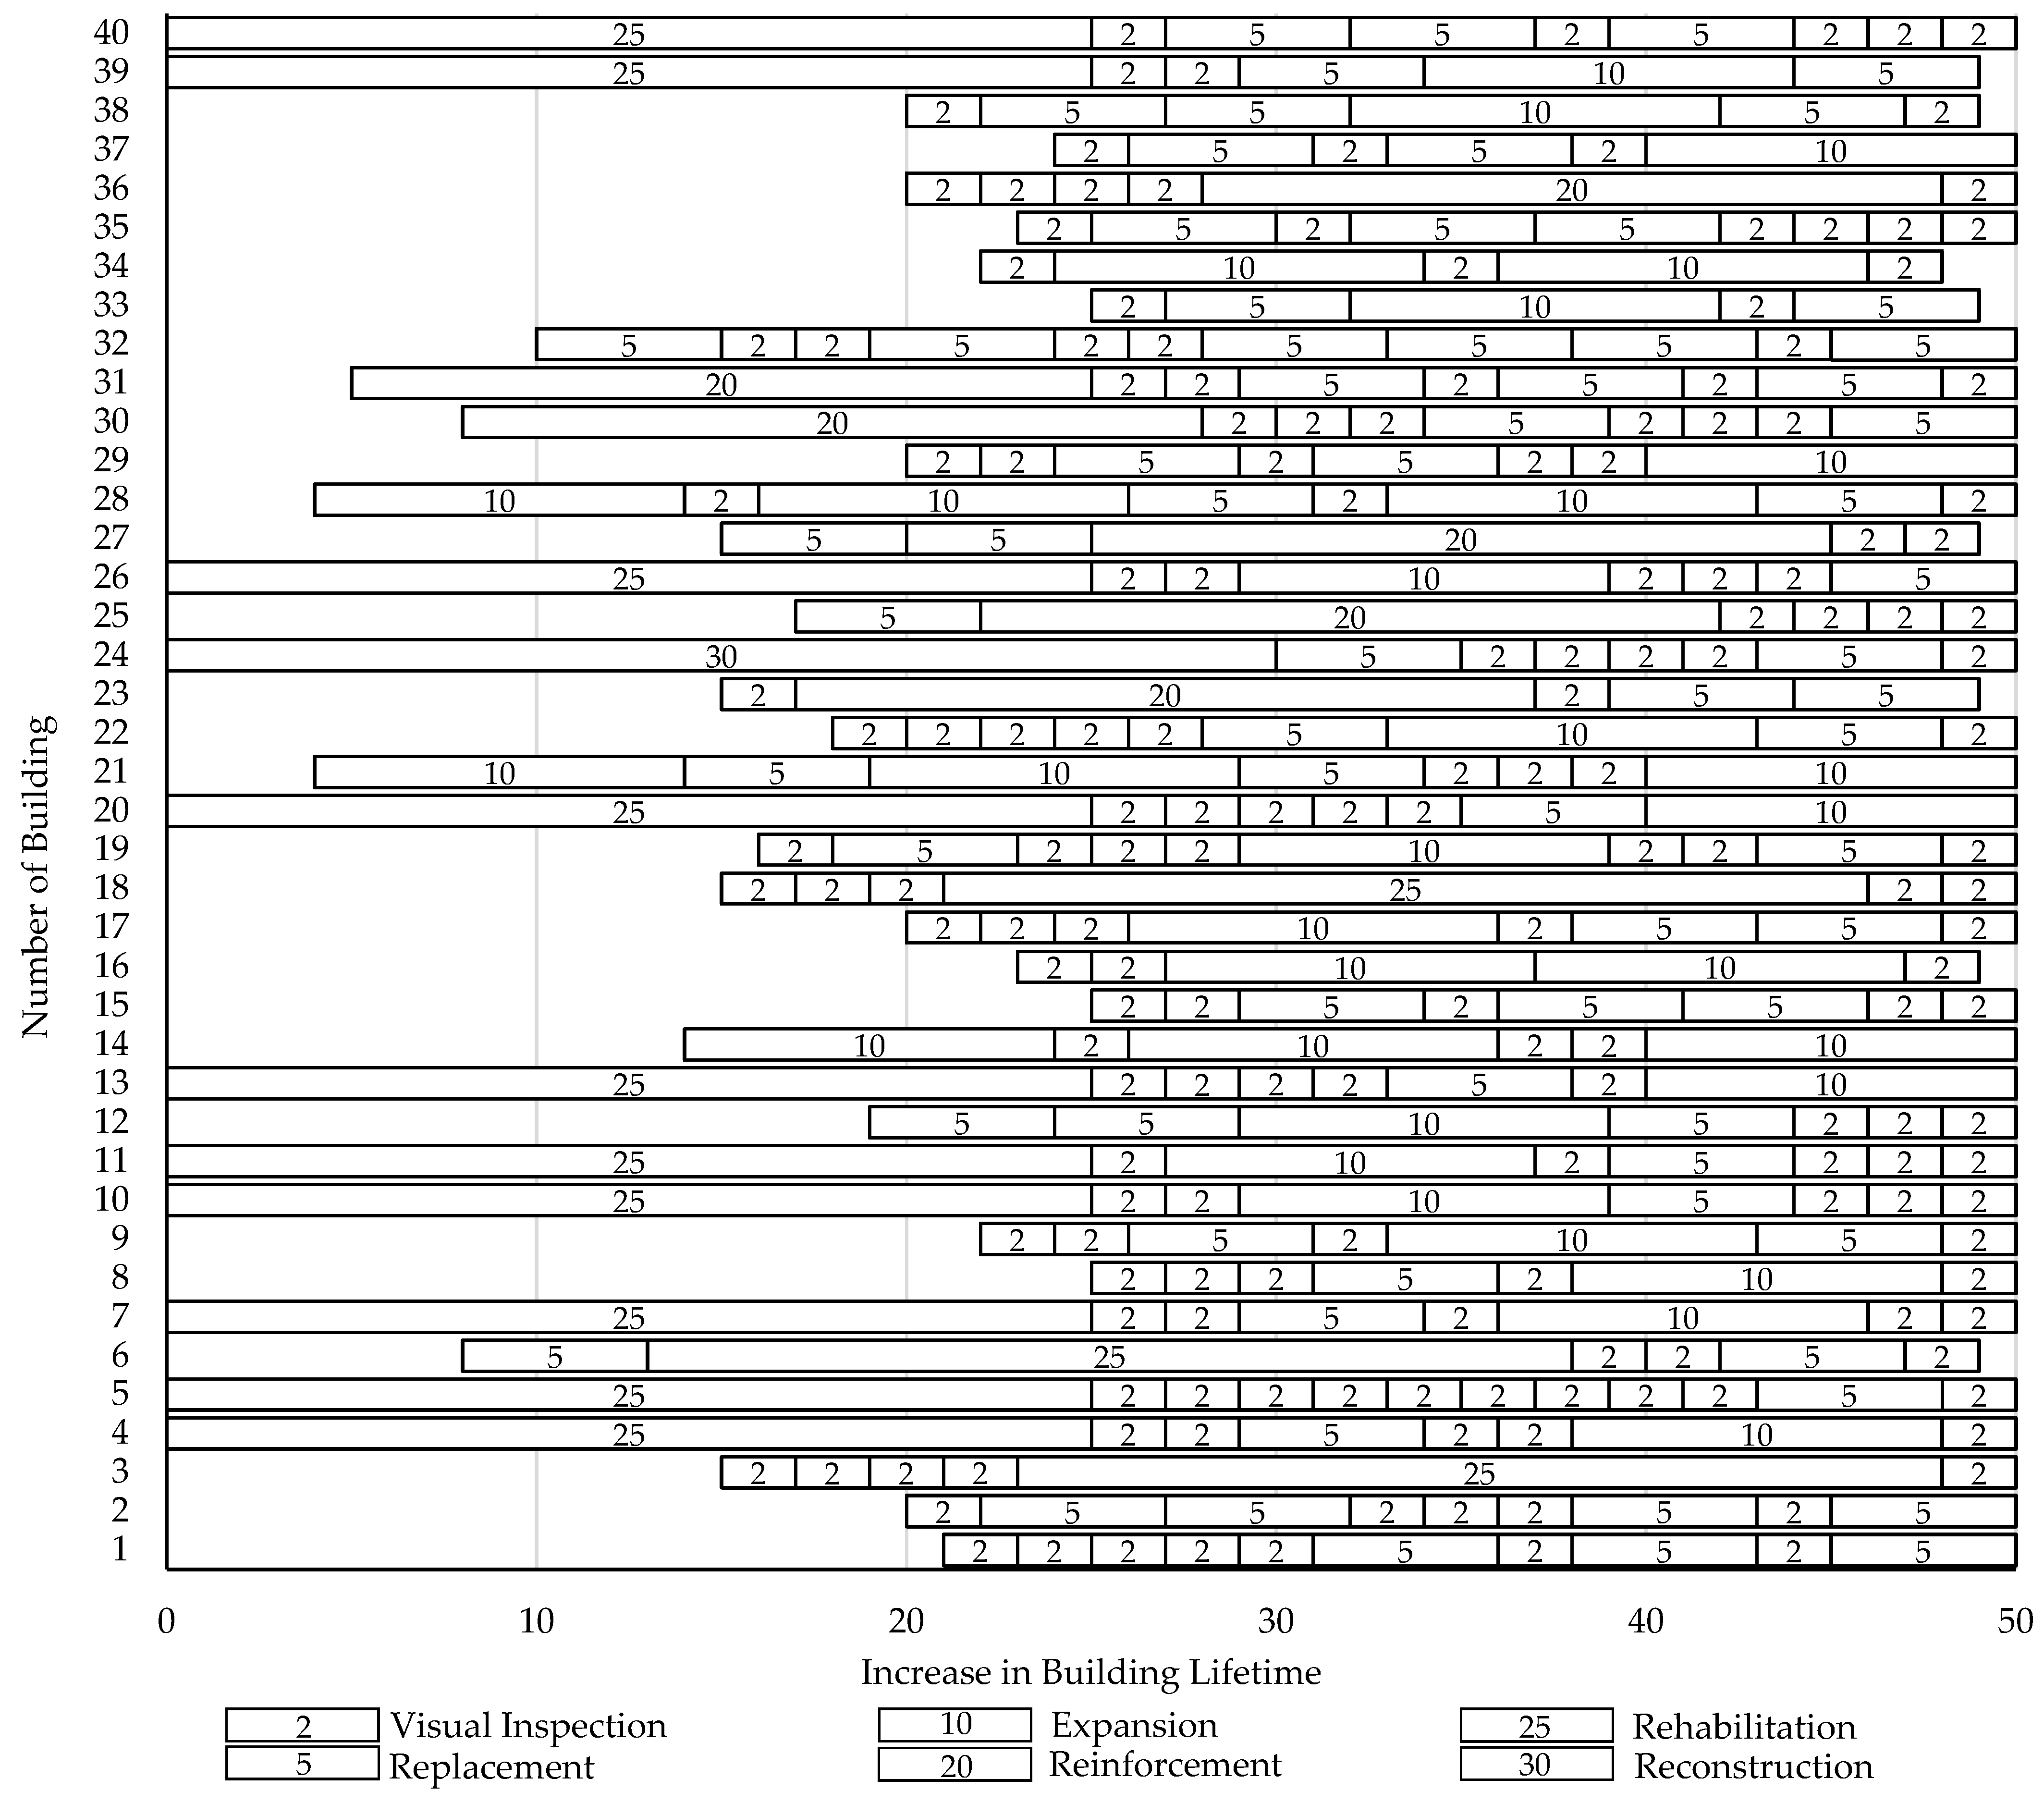
3.3. Implementation Scenario

In order to effectively address the preservation of heritage building clusters, it is important to consider various scenarios that may arise during the preservation process. This research aims to simulate these scenarios and develop a maintenance plan that accounts for both normal and catastrophic occurrences.
Various scenarios, such as the evaluation of the condition, are simulated and restricted to the fund procurement issue. Constraint programming (CP) is used as a technique to handle objective optimization challenges. Furthermore, the objective is intended to assist stakeholders, practitioners, clients and decision makers in adopting a heritage building preservation planning strategy using a long-term planning intervention, such as budget allocation and life expectancy. Figure 2 depicts the framework for the research that was conducted.
This study presents a systematic phase methodology intended to provide technical support for inspection and maintenance management by integrating datasets associated with various alternative maintenance strategies. In this study, three scenarios are performed, and their arguments are explained as follows.

3.3.1. Scenario 1: Preventive Maintenance Based on the Current Condition

Based on the current condition and considering appropriate procedures and methodical approaches, proactive management is crucial for heritage structures. To extend the lifetime of a building, preventive maintenance should be planned before major maintenance or repairs become necessary [24]. In this case, parameters related to the expected lifetime of the building and the availability of budget procurement from previous periods need to be considered. In scenario 1, the objective attempts to preserve the building’s sustainability for a longer period. It is essential to maximize the building’s lifetime along with consideration of budget availability.

3.3.2. Scenario 2: Maintenance Intervention When the Catastrophic Condition Occurs

Unforeseen events can have a significant impact on the conditions of heritage buildings, leading to catastrophic events occurring over time. To manage the effects caused by natural deterioration and to maintain the condition level of heritage buildings, preventive maintenance needs to be implemented in a systematic manner [54]. Catastrophic events, when they occur, can cause severe damage to heritage buildings in the same area simultaneously, often prompting stakeholders to recognize the need for urgent intervention and appropriate actions [3,5]. This is especially important in areas prone to frequent natural disasters and catastrophic events. Thus, it is crucial to establish appropriate procedures and standards to manage potential failures in the future [55]. In scenario 2, it is quite challenging for managers to obtain the optimal result regarding the building’s condition, which needs emergency repairs. However, to accumulate the costs that need to be expensed, we attempt to use the total cost in scenario 1 as a budget ceiling. This approach results in an impact on the final outcome, as it helps prioritize and allocate the available resources effectively.

3.3.3. Scenario 3: Adjustment of Deficient Budget

The feasibility of each maintenance plan depends on the sufficiency of the budget. It is important to evaluate the duration required to maintain all the structures in a fully serviceable condition with minimum expenditure over the planning cycle [44,45]. In scenario 3, the primary concern revolves around achieving comprehensive maintenance of the buildings to fulfill the expected timeframe. However, the main objective is to achieve comprehensive maintenance of the buildings while considering the limited budget to meet the expected lifetime. If the outcomes of scenario 2 are deemed unsatisfactory, where the budget limitation is established based on scenario 1, it may be necessary to make adjustments concerning the budget capacity in order to ensure comprehensive maintenance of the buildings. In such instances, scenario 3 can be occasionally implemented, entailing interventions in a majority of the building components until the expected lifetime is achieved.

4. Case Study

The approach proposed in this study contributes to the decision-making processes for planning preventive strategies for heritage buildings. This approach takes into account historical records and leverages them to make informed decisions. It is worth noting that the selection of the Old Town Area as a case study was based on its proximity to the city’s economic center. However, it is important to acknowledge that the Old Town Area of Semarang is geographically susceptible to the occurrence of catastrophic events [25].
Additionally, the data include information on various maintenance and repair activities conducted on heritage buildings in Indonesia, individually. In this study, the dataset was taken from a list of heritage buildings in the Old City Area, Semarang, Indonesia. There are 40 heritage buildings that are divided into 6 classifications of building conditions. The data were collected from a field survey conducted in 2019 [25]. In this study, we simulate various scenarios that could occur under different conditions. For normal conditions, we utilize real-time data obtained from the current state of the buildings. In contrast, for catastrophic conditions, we simulate a deteriorated state, in which the buildings are expected to be in a worse condition than the current state. The survey data are evaluated by field experts based on the specific conditions of each building. Consequently, each heritage building included in the list has a distinct value for the initial building condition level, lifetime remaining and corresponding expenses, as shown in Table 5.

5. Result and Discussion

To evaluate the model’s performance regarding the distribution of costs under normal conditions, the standard deviation estimation technique is employed to assess each scenario on the graph. It is crucial to verify whether the optimization results exhibit a satisfactory distribution. A desirable outcome is indicated when the average value during the majority of the completion periods on the graph closely aligns with the maximum expected lifetime of 50 years, meeting the desired timeframe. If the graph demonstrates that more than 80% of the total building duration falls within the upper control limit (UCL) or lower control limit (LCL) range, and if it is positioned near the mean line, this indicates that the results are not significantly disordered. This suggests that the model successfully achieves a balanced distribution and allocation of the budget across each building. It is crucial to evaluate whether the results are acceptable or rejected. These findings indicate a stable long-term strategy and can be considered as a robust plan. Therefore, they can be regarded as a solid long-term plan, as each structure can be completed within the specified timeframe, as depicted in Figure 3 and Figure 4 for scenario 1, Figure 5 and Figure 6 for scenario 2, and Figure 7 and Figure 8 for scenario 3.

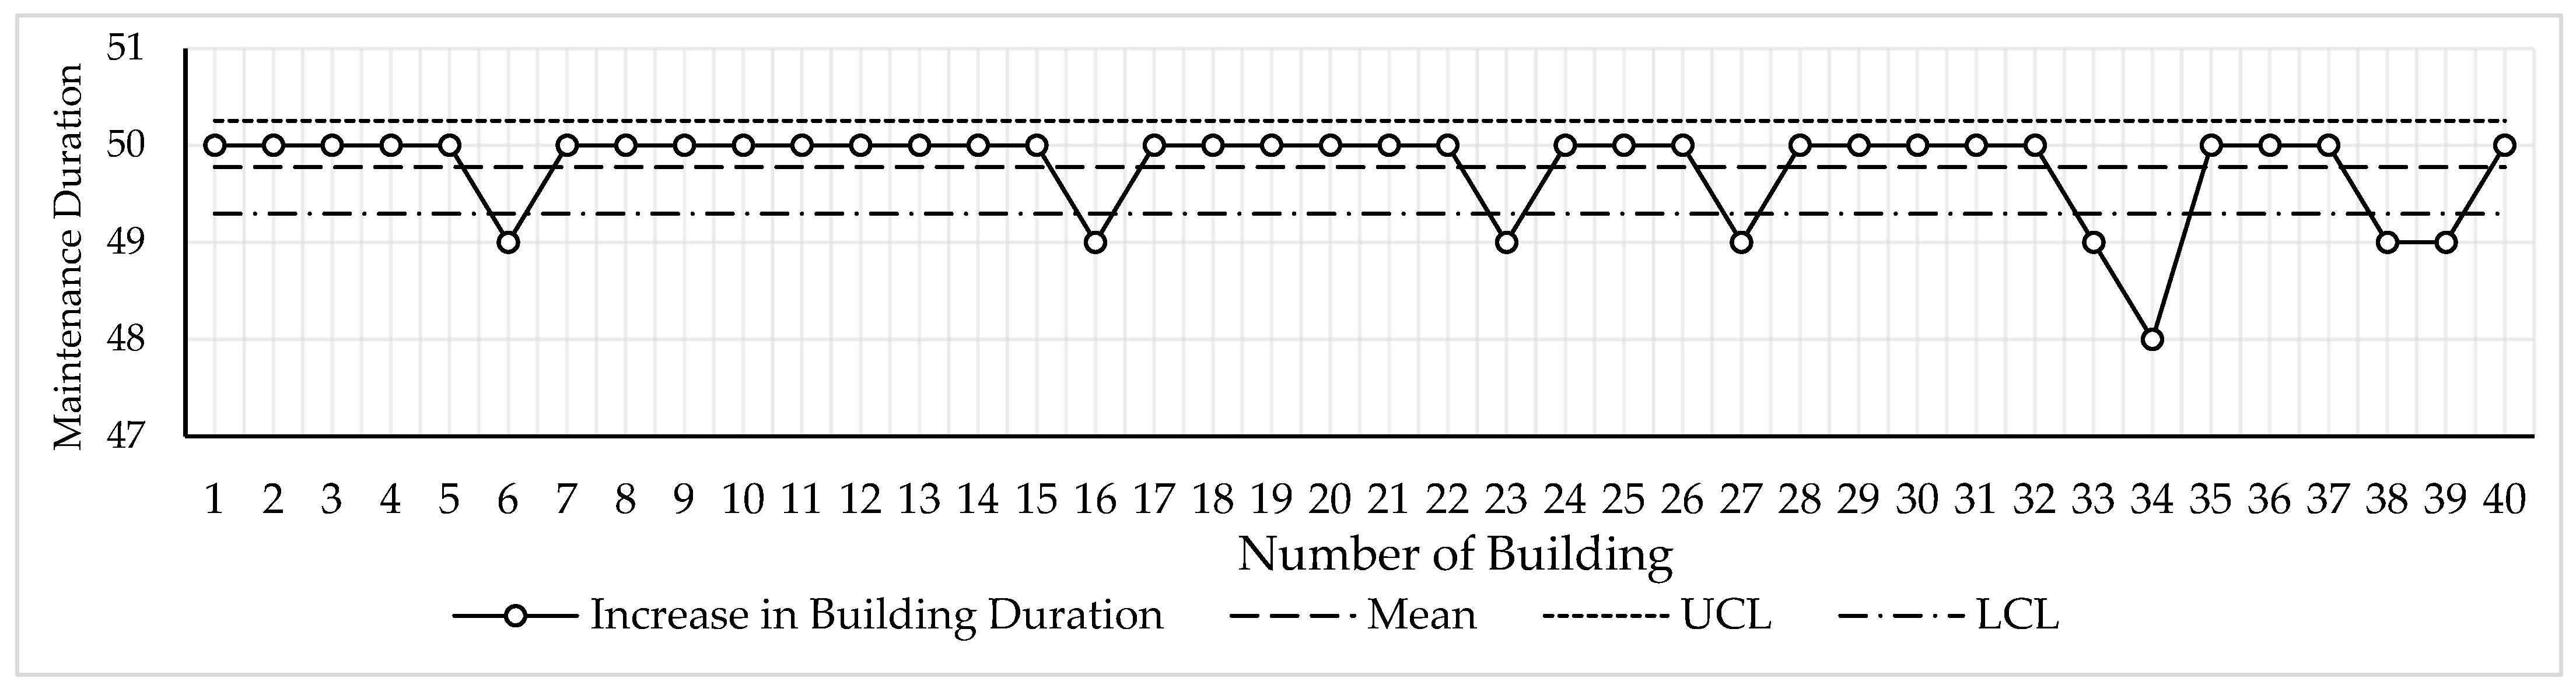
5.1. Results of Scenario 1

The objective in this scenario is to maximize the lifespan of heritage buildings comprehensively, leveraging field survey assessments and input from experts in the heritage field. The results, depicted in Figure 3, illustrate the completion time of maintenance actions within the estimated planning period. Based on the findings presented in Figure 3, it is worth highlighting that 80% of the total buildings meet the expected lifespan of 50 years. This outcome signifies the successful achievement of the proposed model’s objective, which is to maximize the lifetime of the buildings by efficiently distributing the available budget among them. Figure 4 illustrates a comprehensive schedule of all maintenance activities obtained through the optimization model. The model incorporates the concept of a precedence relationship, enabling it to prioritize certain actions based on the building’s condition. In cases in which a building is in a poor condition and requires substantial improvement, the model gives priority to options such as reconstruction or rehabilitation during the initial stages of the building’s lifespan. This approach ensures that critical actions are undertaken early to address significant maintenance needs. The results displayed in Figure 4 demonstrate the adjusted start times for maintenance activities based on the building’s condition, as indicated in Table 1. Notably, buildings such as b4, b5, b7, b10, b11, b13, b20, b24, b26, b39 and b40 are given priority for major repair activities in the first year. This proactive approach is aimed at maximizing the lifespan of these buildings, ensuring that they reach the expected timeframe of 50 years, while achieving the management goal of maximizing lifespan.
Furthermore, based on the results obtained in scenario 1, specific maintenance actions are recommended for different buildings. Building number b24 requires reconstruction, with an estimated lifetime of 30 years. Under the same conditions, buildings with condition level 1, namely b4, b5, b7, b10, b11, b13, b20, b26, b39 and b40, are recommended for rehabilitation, with an expected lifetime of 25 years. Building numbers b30 and b31 would benefit from reinforcement maintenance actions, which can extend their lifetimes by 20 years. Repair actions are suggested for building numbers b14, b21 and b28, resulting in an estimated increase in their lifetimes by 10 years. On the other hand, building numbers b6, b12, b25, b27 and b32 require replacement repairs, which can extend their lifetimes by 5 years. Finally, building numbers b1, b2, b3, b8, b9, b15, b16, b17, b18, b19, b22, b23, b29, b33, b34, b35, b36, b37 and b38 would benefit from light repairs in the form of cleaning, which can extend their lifetimes by 2 years. These maintenance actions form the initial stage of the maintenance plan, and subsequent actions are determined based on the remaining funding conditions. The long-term schedule, reflecting these actions, is presented in Figure 4. Therefore, it can be concluded that, with the building conditions in scenario 1, the model successfully meets the desired lifetime year expectations and allocates the budget evenly among the 40 buildings in the case study.

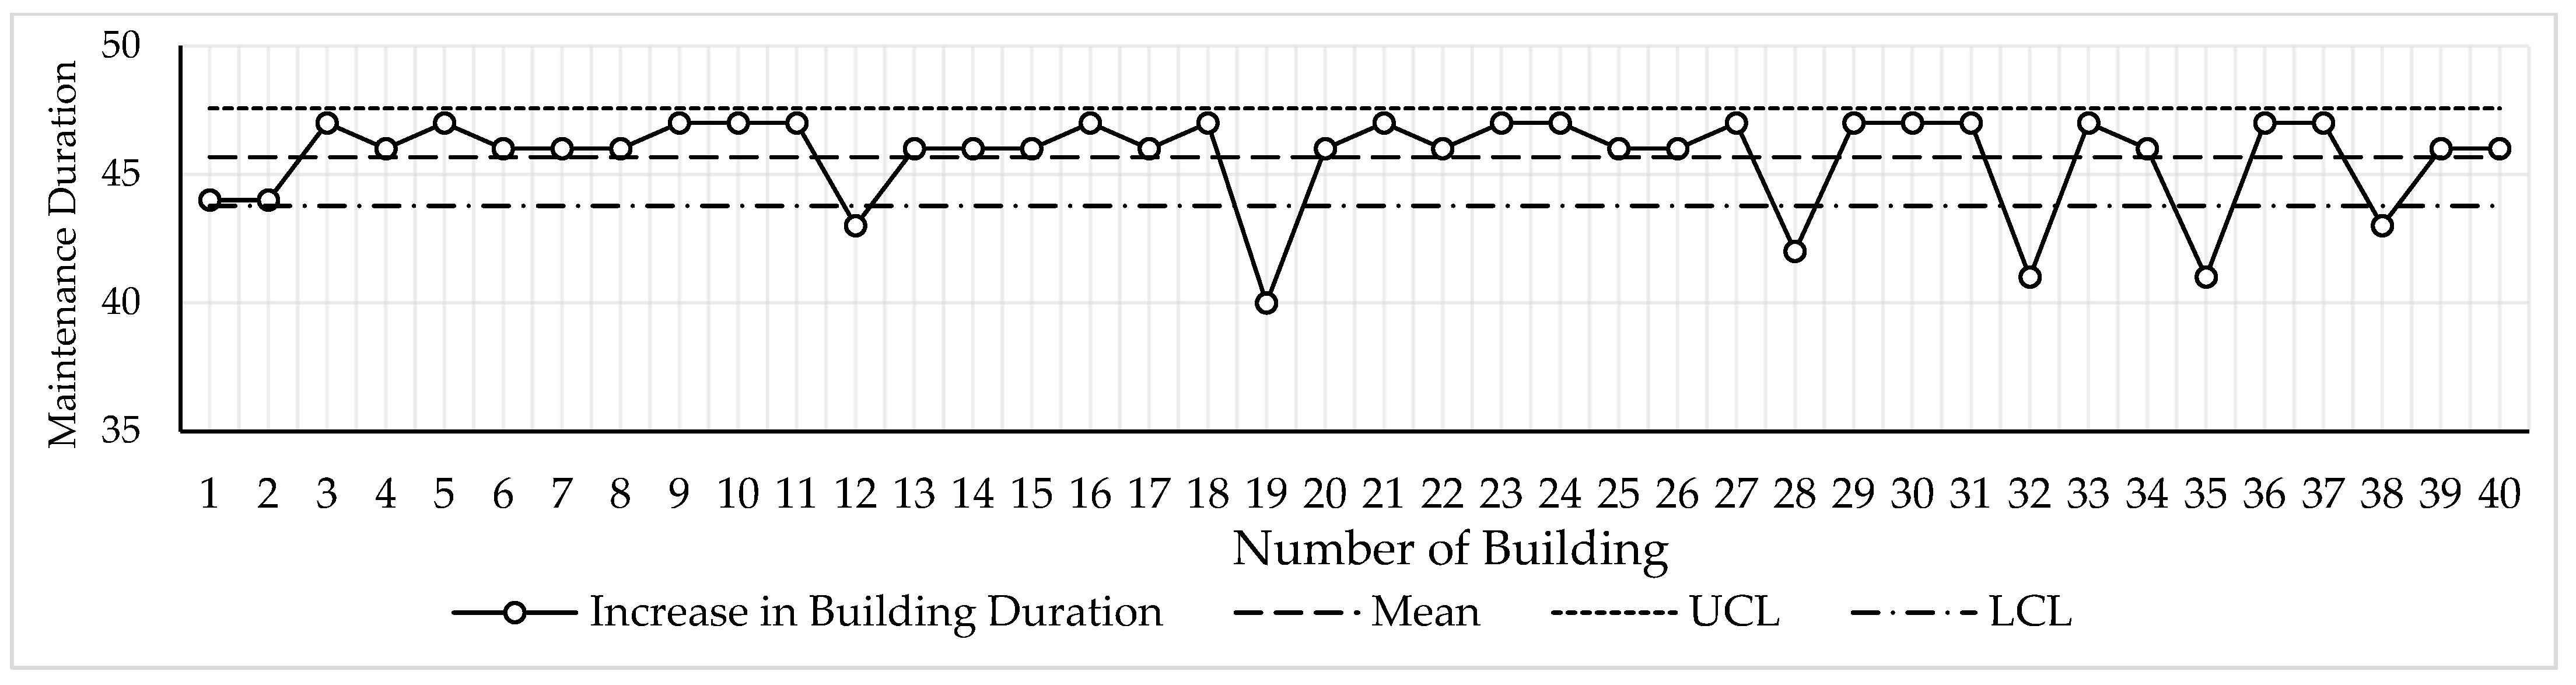
5.2. Results of Scenario 2

In scenario 2, the urgency of maintenance actions increases due to the deterioration of building conditions caused by catastrophic events. In this scenario, the buildings tend to have the lowest condition level. The simulation reveals that the majority of buildings have a medium to low building condition level (BCL). These deteriorations are assumed to be the result of potential catastrophic events, such as natural disasters or human-induced risks such as vandalism. These events have a significant impact on the initial BCL of each heritage building, which in turn affects several variables assessed in the model. Consequently, these adjustments have a notable influence on the outcomes of the proposed model.
In scenario 2, the allocated budget from the previous scenario 1 is adjusted to accommodate the total cost generated by the model. The buildings, most of which have fallen below the acceptable level due to catastrophic events, require immediate and decisive action to restore their conditions. This scenario highlights a significant reduction in the remaining time for each building, emphasizing the urgency of the situation. Moreover, the average improvement required leans toward major interventions, presenting a challenge for the model to demonstrate its ability to maximize the buildings’ lifetimes within the long-term plan while adhering to the budget constraints established in scenario 1. In this scenario, a considerable number of buildings require major interventions right from the beginning to significantly improve their building condition levels (BCLs). The simulated building conditions in scenario 2 have a significant impact on the coverage of the lifespan, as depicted in Figure 6. This, in turn, has a profound effect on the budget allocation for each building. As a result, the dominance of the results presented in scenario 2, in which a maximum lifespan of 47 years is achieved, is highly logical and justifiable. The model’s ability to adapt to the deteriorated building conditions and optimize the allocation of resources contributes to the reasonableness of these outcomes.
Based on the results depicted in Figure 5, it is observed that the majority of buildings fail to meet the expected lifespan of 50 years, and 85% of the total buildings fall within the range of the upper control limit (UCL) and lower control limit (LCL). This indicates that the proposed model is adept at adjusting and distributing the available budget evenly across each building. This adaptability is crucial in emergency situations in which there are budgetary restrictions. Based on the results depicted in Figure 6, it is evident that specific intervention types are required to address the deteriorated conditions of several buildings. For example, building numbers b4, b7, b13, b14, b22 and b26 necessitate reconstruction interventions, which are projected to increase their lifetimes by 30 years. Building numbers b5, b10, b11, b20, b24, b39 and b40 require rehabilitation maintenance actions to extend their lifespans by 25 years. Additionally, building numbers b9, b12, b21, b23, b29 and b30 would benefit from reinforcement actions, offering an estimated increase in their lifetimes of 20 years. For building numbers b6, b18, b19, b25, b27, b28 and b33, expansion work is essential to improve their conditions and extend their lifetimes by 10 years. Furthermore, building numbers b1, b2, b8, b9, b15, b16, b17, b31, b32, b34, b35, b36, b37 and b38 necessitate replacement actions, which are expected to increase their lifetimes by 5 years. However, it should be noted that, in order to prevent further degradation and quickly improve the BCL, repair actions are necessary, and therefore, cleaning is not included as an initial activity.
Therefore, based on the findings presented in Figure 6, it is evident that several buildings are not adequately maintained to achieve the estimated lifespan of 50 years. This deficiency can be primarily attributed to budget limitations, as illustrated in the figure, which ultimately results in a reduced expected lifespan for these specific buildings. The results obtained in scenario 2, which demonstrate the model’s ability to effectively maximize the lifespans of buildings and allocate the budget evenly, can be considered a successful long-term maintenance planning approach.

5.3. Results of Scenario 3

In scenario 3, with limited funds available, adjustments need to be made to address the unsatisfactory conditions of the buildings, similar to scenario 2. In this scenario, the building’s condition is assumed to be similar to that of scenario 2, with a tendency toward unsatisfactory conditions. However, in response to this situation, decision makers simulate a budget negotiation process that compels them to strive for greater optimization in order to achieve comprehensive long-term preservation planning for all buildings. This negotiation process is common in the development of long-term plans within government or authoritative bodies. Consequently, the budget allocation should prioritize a sequence of maintenance actions, with the proposed model providing the best possible performance.
The results presented in Figure 7 indicate that 97% of the total buildings fall within the range of the upper control limit (UCL) and lower control limit (LCL), demonstrating that the model effectively allocates the available budget evenly to each building. This achievement signifies the model’s success in optimizing budget allocation and fulfilling its objective of maximizing building lifetimes while operating within the constraints of a limited budget. The developed model has proven its capability to optimize fund allocation, ensuring the maximum lifespan of the long-term maintenance action plan within the specified timeframe.
In scenario 3, for the schedule shown in Figure 8, specific maintenance actions are recommended for various buildings. Rehabilitation maintenance is required for building numbers b4, b5, b7, b10, b11, b13, b14, b20, b22, b24, b26, b28, b39 and b40, with an estimated lifetime increase of 25 years. Due to budget constraints, no reconstruction work is initially planned in this scenario. Building number b25 needs reinforcement action to extend its lifetime by 20 years. Building numbers b2, b3, b6, b12, b17, b18, b19, b21, b23, b27, b29, b30, b33, b34 and b36 require expansion maintenance action, increasing their lifetimes by 10 years. Furthermore, replacement work is needed for building numbers b1, b8, b9, b15, b16, b31, b32, b35, b37 and b38, resulting in a building lifetime extension of 5 years. As the main focus is on preventing further degradation and rapidly improving the building condition level (BCL), cleaning actions are not prioritized in this scenario due to the significant repairs required by most buildings. In scenario 3, the provision of additional funding becomes a crucial consideration in order to meet the expected lifespan of the buildings, especially in the face of simulated catastrophic events that have significantly impacted their conditions. The results of scenario 3 highlight the importance of allocating additional funds to address urgent maintenance needs and ensure the longevity of the buildings. By considering the potential challenges posed by deteriorated conditions, decision makers must carefully evaluate the option of providing additional funding to achieve the desired lifespan and maintain the buildings in a satisfactory state.
Table 6 provides an overview of the fluctuation in the total cost throughout the estimated 50-year lifetime. The costs are accumulated periodically every 5 years, from P1 to P10, a total ten usage periods, offering insight into the long-term financial implications of comprehensive maintenance activities. These findings highlight the significant impact of individual building conditions, as represented by the building condition level (BCL), and the total maintenance area. The specific type of maintenance intervention required, regardless of whether it is reconstruction, rehabilitation, reinforcement, expansion, replacement or cleaning, is determined based on the unique needs of each building. The proposed model effectively adapts to these constraints, ensuring that the most optimal and cost-effective outcomes are achieved.
Table 6 summarizes the total cost for maintenance in Scenario 1, which amounts to USD 7,780,350.88. The budget allocation for the maintenance plan is based on the budget ceiling carried over from previous plans. The maintenance activities, as derived from the model, align to create a comprehensive 50-year maintenance plan, as depicted in Figure 4. The cost fluctuation is illustrated across the P1 to P10 usage periods.
In scenario 2, in which the building conditions are significantly impacted by catastrophic events and the budget ceiling is based on the budget capacity from scenario 1, the model showcases its ability to generate optimal solutions despite these challenging constraints. Despite the difficulties in determining these constraints, the model successfully addresses the urgent maintenance needs that arise from catastrophic events. The total cost in scenario 2 is USD 7,810,526.32, as indicated in the analysis. Upon evaluating Figure 6, it becomes evident that the maintenance planning falls short of achieving the estimated lifetime for several buildings, even though the minimum duration in the life cycle is set at 30 years.
Furthermore, scenario 3 is introduced to cater to the common demand from decision makers for a comprehensive long-term maintenance plan. By comparing scenario 2 and scenario 3, various factors that need to be taken into account can be thoroughly considered. It is crucial to determine the total cost based on scenario 2, in which the buildings are fully maintained until their estimated lifespan of 50 years. In scenario 3, the total cost amounts to USD 8,348,771.93, which is higher than the total cost in scenario 2. This higher cost in Scenario 3 reflects the comprehensive nature of the long-term maintenance plan, encompassing all necessary interventions to ensure the longevity of the buildings.
Although acquiring a higher budget can be challenging, it is worth considering the proposed allocation of additional funds to the maintenance scheduling problem based on the results. The comparison of average maintenance cost in Table 7 indicates that the average building cost in scenario 3 is lower than that in scenario 2. This finding suggests that occasional increases in the fund allocation can be a wise decision. By doing so, not only can the expected lifetime of the buildings be significantly fulfilled, but it can also lead to cost savings in the long run. Therefore, taking into account occasional increases in the fund allocation is a prudent action to ensure the comprehensive and sustainable maintenance of the buildings, even though it may involve requesting a higher budget.

6. Conclusions

The maintenance of heritage buildings presents complex and critical challenges due to the increasing number of deteriorating structures. Degradation significantly impacts these buildings, making the rehabilitation of aging structures costly, time-consuming and challenging. To address these challenges, proactive building maintenance management practices should be adopted from the construction phase. Accurate estimation of the building’s total lifetime and an assessment of the associated maintenance costs are crucial for developing sustainable maintenance plans.
To tackle these challenges, this study introduces a predictive model that aims to maximize the lifespans of heritage buildings while considering maintenance costs. This study focuses on 40 heritage buildings in Semarang, Indonesia, aiming to identify specific maintenance actions for each building. The proposed method involves the development of predictive models based on the building condition level (BCL). The BCLs are determined through collaborative discussions with experts, considering standardized assessment criteria for heritage buildings. Each building is assigned a numerical level based on its condition, facilitating the categorization and prioritization of maintenance interventions. This study employs the constraint programming method, explained through a mathematical model, to handle the various constraints involved in the problem.
Based on the aforementioned considerations, the comprehensive scenario results indicate that the model offers several notable advantages, as follows:
  • Adaptability: The model showcases its ability to adapt to different conditions, encompassing both normal and severe circumstances. It can effectively address various building conditions and prioritize maintenance actions accordingly.
  • Budget Management: The model demonstrates its effectiveness in handling budget limitations, as evidenced by its performance in scenario 2. Despite constrained budgets, the model optimizes the allocation of funds to address urgent maintenance needs and ensure the longevity of the buildings.
  • Even Budget Allocation: In scenario 3, the model excels in allocating the available budget evenly among each building. This ensures a fair distribution of resources and enables comprehensive maintenance planning for all buildings.
  • Lifespan Maximization: The model successfully maximizes the lifespan of the buildings within the allocated budget. By optimizing maintenance actions and considering the specific needs of each building, it effectively extends their lifespans and enhances their overall conditions.
Overall, the model’s adaptability, budget management capabilities, even budget allocation and lifespan maximization highlight its effectiveness in supporting long-term maintenance planning for heritage buildings. It offers valuable insight and guidance to decision makers for efficiently allocating resources and preserving the historical value and integrity of these structures.

Author Contributions

Conceptualization, S.-S.L., M.F.A.A. and P.U.; formal analysis, S.-S.L., P.U. and M.F.A.A.; investigation, S.-S.L. and P.U.; methodology, S.-S.L. and P.U.; writing—original draft preparation, S.-S.L. and P.U.; writing—review and editing, S.-S.L. and A.B.; visualization, A.B. and F.S.P.; supervision, S.-S.L. All authors have read and agreed to the published version of the manuscript.

Funding

This research received no external funding.

Data Availability Statement

Not applicable.

Conflicts of Interest

The authors declare no conflict of interest.

References

  1. Flores-Colen, I.; de Brito, J. A Systematic Approach for Maintenance Budgeting of Buildings Façades Based on Predictive and Preventive Strategies. Constr. Build. Mater. 2010, 24, 1718–1729. [Google Scholar] [CrossRef]
  2. Chew, M.Y.L.; Tan, S.S.; Kang, K.H. Building Maintainability—Review of State of the Art. J. Archit. Eng. 2004, 10, 80–87. [Google Scholar] [CrossRef]
  3. Prieto, A.J.; Macías-Bernal, J.M.; Chávez, M.-J.; Alejandre, F.J.; Silva, A. Impact of Maintenance, Rehabilitation, and Other Interventions on Functionality of Heritage Buildings. J. Perform. Constr. Facil. 2019, 33, 4019011. [Google Scholar] [CrossRef]
  4. İpekoğlu, B. An Architectural Evaluation Method for Conservation of Traditional Dwellings. Build. Environ. 2006, 41, 386–394. [Google Scholar] [CrossRef] [Green Version]
  5. Silva, H.E.; Henriques, F.M.A. Preventive Conservation of Historic Buildings in Temperate Climates. The Importance of a Risk-Based Analysis on the Decision-Making Process. Energy Build. 2015, 107, 26–36. [Google Scholar] [CrossRef]
  6. Lorenzoni, F.; Casarin, F.; Caldon, M.; Islami, K.; Modena, C. Uncertainty Quantification in Structural Health Monitoring: Applications on Cultural Heritage Buildings. Mech. Syst. Signal Process. 2016, 66–67, 268–281. [Google Scholar] [CrossRef]
  7. Kutut, V.; Zavadskas, E.K.; Lazauskas, M. Assessment of Priority Alternatives for Preservation of Historic Buildings Using Model Based on ARAS and AHP Methods. Arch. Civ. Mech. Eng. 2014, 14, 287–294. [Google Scholar] [CrossRef]
  8. Embaby, M.E. Heritage Conservation and Architectural Education: “An Educational Methodology for Design Studios”. HBRC J. 2014, 10, 339–350. [Google Scholar] [CrossRef] [Green Version]
  9. Mcdonald, M. Tourism, Heritage Buildings, and Tax Relief. J. Travel Res. 2000, 38, 282–291. [Google Scholar] [CrossRef]
  10. Gholitabar, S.; Alipour, H.; da Costa, C.M.M. An Empirical Investigation of Architectural Heritage Management Implications for Tourism: The Case of Portugal. Sustainability 2018, 10, 93. [Google Scholar] [CrossRef] [Green Version]
  11. Cho, K.; Yoon, Y. Decision Support Model for Determining Cost-Effective Renovation Time. J. Manag. Eng. 2016, 32, 4015051. [Google Scholar] [CrossRef]
  12. Farahani, A.; Wallbaum, H.; Dalenbäck, J.-O. Cost-Optimal Maintenance and Renovation Planning in Multifamily Buildings with Annual Budget Constraints. J. Constr. Eng. Manag. 2020, 146, 4020009. [Google Scholar] [CrossRef]
  13. Lounis, Z.; Vanier, D.J. A Multiobjective and Stochastic System for Building Maintenance Management. Comput. Civ. Infrastruct. Eng. 2000, 15, 320–329. [Google Scholar] [CrossRef] [Green Version]
  14. Riley, M.; Cotgrave, A. Construction Technology 3: The Technology of Refurbishment and Maintenance; Macmillan International Higher Education: New York, NY, USA, 2011; ISBN 0230346170. [Google Scholar]
  15. Agapiou, A.; Lysandrou, V.; Alexakis, D.D.; Themistocleous, K.; Cuca, B.; Argyriou, A.; Sarris, A.; Hadjimitsis, D.G. Cultural Heritage Management and Monitoring Using Remote Sensing Data and GIS: The Case Study of Paphos Area, Cyprus. Comput. Environ. Urban Syst. 2015, 54, 230–239. [Google Scholar] [CrossRef]
  16. Indirli, M.; Kouris, L.A.S.; Formisano, A.; Borg, R.P.; Mazzolani, F.M. Seismic Damage Assessment of Unreinforced Masonry Structures after the Abruzzo 2009 Earthquake: The Case Study of the Historical Centers of L’Aquila and Castelvecchio Subequo. Int. J. Archit. Herit. 2013, 7, 536–578. [Google Scholar] [CrossRef]
  17. Kwon, N.; Song, K.; Park, M.; Jang, Y.; Yoon, I.; Ahn, Y. Preliminary Service Life Estimation Model for MEP Components Using Case-Based Reasoning and Genetic Algorithm. Sustainability 2019, 11, 3074. [Google Scholar] [CrossRef] [Green Version]
  18. Ighravwe, D.E.; Oke, S.A. A Multi-Criteria Decision-Making Framework for Selecting a Suitable Maintenance Strategy for Public Buildings Using Sustainability Criteria. J. Build. Eng. 2019, 24, 100753. [Google Scholar] [CrossRef]
  19. Silva, A.; De Brito, J.; Gaspar, P.L. Methodologies for Service Life Prediction of Buildings: With a Focus on Façade Claddings; Springer: Berlin/Heidelberg, Germany, 2016; ISBN 3319332902. [Google Scholar]
  20. Alba-Rodríguez, M.D.; Martínez-Rocamora, A.; González-Vallejo, P.; Ferreira-Sánchez, A.; Marrero, M. Building Rehabilitation versus Demolition and New Construction: Economic and Environmental Assessment. Environ. Impact Assess. Rev. 2017, 66, 115–126. [Google Scholar] [CrossRef]
  21. Liu, S.-S.; Faizal Ardhiansyah Arifin, M. Preventive Maintenance Model for National School Buildings in Indonesia Using a Constraint Programming Approach. Sustainability 2021, 13, 1874. [Google Scholar] [CrossRef]
  22. Frangopol, D.M.; Liu, M. Maintenance and Management of Civil Infrastructure Based on Condition, Safety, Optimization, and Life-Cycle Cost∗. Struct. Infrastruct. Eng. 2007, 3, 29–41. [Google Scholar] [CrossRef]
  23. Kwon, N.; Song, K.; Ahn, Y.; Park, M.; Jang, Y. Maintenance Cost Prediction for Aging Residential Buildings Based on Case-Based Reasoning and Genetic Algorithm. J. Build. Eng. 2020, 28, 101006. [Google Scholar] [CrossRef]
  24. Chan, D.W.M. Sustainable Building Maintenance for Safer and Healthier Cities: Effective Strategies for Implementing the Mandatory Building Inspection Scheme (MBIS) in Hong Kong. J. Build. Eng. 2019, 24, 100737. [Google Scholar] [CrossRef]
  25. Balai Pelestarian Cagar Budaya Jawa Tengah Pemutakhiran Data Cagar Budaya Kawasan Kota Lama Semarang Tahap IV; Ministry of Education and Culture: Semarang, Indonesia, 2019; p. 178.
  26. Kalman, H.; Létourneau, M.R. Heritage Planning: Principles and Process; Routledge: Abingdon, UK, 2020; ISBN 0429431694. [Google Scholar]
  27. van den Boomen, M.; Spaan, M.T.J.; Shang, Y.; Wolfert, A.R.M. Infrastructure Maintenance and Replacement Optimization under Multiple Uncertainties and Managerial Flexibility. Constr. Manag. Econ. 2020, 38, 91–107. [Google Scholar] [CrossRef] [Green Version]
  28. Sanchez, B.; Rausch, C.; Haas, C. Deconstruction Programming for Adaptive Reuse of Buildings. Autom. Constr. 2019, 107, 102921. [Google Scholar] [CrossRef]
  29. Foster, G. Circular Economy Strategies for Adaptive Reuse of Cultural Heritage Buildings to Reduce Environmental Impacts. Resour. Conserv. Recycl. 2020, 152, 104507. [Google Scholar] [CrossRef]
  30. Forster, A.M.; Carter, K.; Banfill, P.F.G.; Kayan, B. Green Maintenance for Historic Masonry Buildings: An Emerging Concept. Build. Res. Inf. 2011, 39, 654–664. [Google Scholar] [CrossRef]
  31. Yung, E.H.K.; Chan, E.H.W. Implementation Challenges to the Adaptive Reuse of Heritage Buildings: Towards the Goals of Sustainable, Low Carbon Cities. Habitat Int. 2012, 36, 352–361. [Google Scholar] [CrossRef]
  32. Munarim, U.; Ghisi, E. Environmental Feasibility of Heritage Buildings Rehabilitation. Renew. Sustain. Energy Rev. 2016, 58, 235–249. [Google Scholar] [CrossRef]
  33. Frey, P.; Dunn, L.; Cochran, R.; Spataro, K.; McLennan, J.F.; DiNola, R.; Heider, B. The Greenest Building: Quantifying the Environmental Value of Building Reuse; Preservation Green Lab, National Trust for Historic Preservation: Washington, DC, USA, 2011. [Google Scholar]
  34. Mısırlısoy, D.; Günçe, K. Adaptive Reuse Strategies for Heritage Buildings: A Holistic Approach. Sustain. Cities Soc. 2016, 26, 91–98. [Google Scholar] [CrossRef]
  35. Grant, A.; Ries, R. Impact of Building Service Life Models on Life Cycle Assessment. Build. Res. Inf. 2013, 41, 168–186. [Google Scholar] [CrossRef]
  36. Morcous, G.; Lounis, Z. Maintenance Optimization of Infrastructure Networks Using Genetic Algorithms. Autom. Constr. 2005, 14, 129–142. [Google Scholar] [CrossRef]
  37. Silva, A.; Prieto, A.J.; Goulouti, K.; Giorgi, M.; Favre, D.; Lasvaux, S.; Brandt, E.; Morelli, M.; De Belie, N.; Van Belleghem, B. Probabilistic Approach to the Service Life Prediction of Timber Claddings. In Proceedings of the XV International Conference on Durability of Building Materials and Components (DBMC 2020), Barcelona, Spain, 30 June–3 July 2020. [Google Scholar]
  38. Flores-Colen, I.; de Brito, J.; Freitas, V. Discussion of Criteria for Prioritization of Predictive Maintenance of Building Façades: Survey of 30 Experts. J. Perform. Constr. Facil. 2010, 24, 337–344. [Google Scholar] [CrossRef]
  39. Pitt, T.J. Data Requirements for the Prioritization of Predictive Building Maintenance. Facilities 1997, 15, 97–104. [Google Scholar] [CrossRef]
  40. Ruiz-Jaramillo, J.; Muñoz-González, C.; Joyanes-Díaz, M.D.; Jiménez-Morales, E.; López-Osorio, J.M.; Barrios-Pérez, R.; Rosa-Jiménez, C. Heritage Risk Index: A Multi-Criteria Decision-Making Tool to Prioritize Municipal Historic Preservation Projects. Front. Archit. Res. 2020, 9, 403–418. [Google Scholar] [CrossRef]
  41. Mehdizadeh Saradj, F. Prioritization of Historic Buildings Based on Their Values. Iran Univ. Sci. Technol. 2011, 10, 17–26. [Google Scholar]
  42. Lazar, N.; Chithra, K. Prioritization of Sustainability Dimensions and Categories for Residential Buildings of Tropical Climate: A Multi-Criteria Decision-Making Approach. J. Build. Eng. 2021, 39, 102262. [Google Scholar] [CrossRef]
  43. Turskis, Z.; Zavadskas, E.K.; Kutut, V. A Model Based on ARAS-G and AHP Methods for Multiple Criteria Prioritizing of Heritage Value. Int. J. Inf. Technol. Decis. Mak. 2013, 12, 45–73. [Google Scholar] [CrossRef]
  44. Hans, L.; Henry, M. Building Maintenance Strategies: Planning under Uncertainty. Prop. Manag. 2012, 30, 14–28. [Google Scholar] [CrossRef]
  45. Gade, A.N.; Jensen, R.L.; Larsen, T.S.; Nissen, S.B.; Andresen, I. Value-Based Decision Making in the Pre-Design Stage of Sustainable Building Renovation Projects–Exploring Two Methods for Weighting Criteria. Int. J. Constr. Manag. 2021, 21, 648–663. [Google Scholar] [CrossRef]
  46. Prieto, A.J. Fuzzy Systems in the Digital Management of Heritage Timber Buildings in South Chile. Build. Res. Inf. 2021, 49, 878–892. [Google Scholar] [CrossRef]
  47. Prieto, A.J.; Macías-Bernal, J.M.; Chávez, M.-J.; Alejandre, F.J. Fuzzy Modeling of the Functional Service Life of Architectural Heritage Buildings. J. Perform. Constr. Facil. 2017, 31, 4017041. [Google Scholar] [CrossRef]
  48. Prieto, A.J.; Silva, A.; de Brito, J.; Macías-Bernal, J.M.; Alejandre, F.J. Multiple Linear Regression and Fuzzy Logic Models Applied to the Functional Service Life Prediction of Cultural Heritage. J. Cult. Herit. 2017, 27, 20–35. [Google Scholar] [CrossRef]
  49. Prieto, A.J.; Macías-Bernal, J.M.; Silva, A.; Ortiz, P. Fuzzy Decision-Support System for Safeguarding Tangible and Intangible Cultural Heritage. Sustainability 2019, 11, 3953. [Google Scholar] [CrossRef] [Green Version]
  50. Rossi, F.; van Beek, P.; Walsh, T. Chapter 4 Constraint Programming. In Handbook of Knowledge Representation; van Harmelen, F., Lifschitz, V., Porter, B., Eds.; Foundations of Artificial Intelligence; Elsevier: Amsterdam, The Netherlands, 2008; Volume 3, pp. 181–211. [Google Scholar]
  51. Laborie, P.; Rogerie, J.; Shaw, P.; Vilím, P. IBM ILOG CP Optimizer for Scheduling. Constraints 2018, 23, 210–250. [Google Scholar] [CrossRef]
  52. Liu, S.-S.; Huang, H.-Y.; Risna Dyah Kumala, N. Two-Stage Optimization Model for Life Cycle Maintenance Scheduling of Bridge Infrastructure. Appl. Sci. 2020, 10, 8887. [Google Scholar] [CrossRef]
  53. Daerah, B.P.P.; Nomor, P.D.K.S. Tahun 2003 Tentang Rencana Tata Bangunan Dan Lingkungan (RTBL) Kawasan Kota Lama; Bappeda: Semarang, Indonesia, 2003. [Google Scholar]
  54. Park, M.; Kwon, N.; Lee, J.; Lee, S.; Ahn, Y. Probabilistic Maintenance Cost Analysis for Aged Multi-Family Housing. Sustainability 2019, 11, 1843. [Google Scholar] [CrossRef] [Green Version]
  55. Prieto, A.J.; Vásquez, V.; Silva, A.; Horn, A.; Alejandre, F.J.; Macías-Bernal, J.M. Protection Value and Functional Service Life of Heritage Timber Buildings. Build. Res. Inf. 2019, 47, 567–584. [Google Scholar] [CrossRef]
Figure 1. Activity sequence schema of maintenance actions.
Buildings 13 01867 g001
Figure 2. Conceptual flowchart of maintenance scheduling problem for heritage building with three scenarios.
Buildings 13 01867 g002
Figure 3. Completion time of building maintenance actions (Scenario 1).
Buildings 13 01867 g003
Figure 4. Gantt chart schedule for scenario 1.
Buildings 13 01867 g004
Figure 5. Completion time of building maintenance actions (Scenario 2).
Buildings 13 01867 g005
Figure 6. Gantt chart schedule for scenario 2.
Buildings 13 01867 g006
Figure 7. Completion time of building maintenance actions (Scenario 3).
Buildings 13 01867 g007
Figure 8. Gantt chart schedule for scenario 3.
Buildings 13 01867 g008
Table 1. Building condition level (BCL) classification [25].
Building Condition LevelBuilding Condition Estimated Remaining Lifetime (Years)
1Heavily damaged0
2Damaged1–5
3Poorly maintained5–10
4Less-maintained10–15
5Maintained15–20
6Well-maintained20–25
Table 2. Precedence relationship of maintenance activities between BCLs.
Building Condition Level
(BCL)
Activity Sequence
PredecessorSuccessor
1ReconstructionReplacement/
Cleaning/the major activity in the next period
Rehabilitation
2RehabilitationReplacement/
Cleaning/the major activity in the next period
Reinforcement
Expansion
3ReinforcementReplacement/
Cleaning/the major activity in the next period
Expansion
Replacement
4ExpansionReplacement/
Cleaning/the major activity in the next period
Replacement
Cleaning
5Replacement
Cleaning
Replacement/
Cleaning/the major activity in the next period
6CleaningReplacement/
Cleaning/the major activity in the next period
Table 3. Type of maintenance action for heritage building [3].
Scale of ActivityType of InterventionEstimated Increased Service Life (Years)Cost
(USD/m2)
Major activityReconstruction30210.45
Rehabilitation25140.30
Reinforcement20105.22
Expansion1070.15
Minor activityReplacement542.09
Cleaning228.06
The cost is converted from Indonesian rupiah (IDR) to US dollars (USD); exchange rate: IDR/USD = 14,250 (prevailing rate on 17 September 2021).
Table 4. Parameters and variables of the proposed model.
IndicesDefinition
bIndex of buildings
pIndex of periods
aIndex of major interventions
iIndex of minor interventions
yIndex of years that interventions were conducted
SetsDefinition
BSet of building numbers, where B = 1,2, 3, …, e
PSet of period numbers, where P = 1, 2, 3, …, f
ASet of type of major intervention numbers, where A = 1, 2, 3, …, g
ISet of type of minor intervention numbers, where I = 1, …, h
WSet of building weight
ParametersDefinition
eTotal of buildings
fTotal of periods
gTotal of major interventions
hTotal of minor interventions
wbImportance weight of building b
upBudget limit in period p
drbDuration of remaining lifetime for building b
srbStart time of remaining lifetime for building b, where srb = 0
erbEnd time of remaining lifetime of building b
djapbEstimated lifetime of major activity a
diipbEstimated lifetime of minor activity i
cjaCost of major activity a
rpbMinimum time target of planning in building b
mpbMaximum time target of maintenance planning in building b
ciiCost of minor activity i
rInflation rate annually in year y
VariablesDefinition
DbTotal lifetime of building b
JapbDemand of activity type a in period p for building b
IapbDemand of activity type i in period p for building b
SJapbStart time of major activity a in period p for building b
DJapbEstimated lifetime of major activity a in period p for building b
EJapbEnd time of major activity a in period p for building b
SIipbStart time of minor activity i in period p for building b
DIipbEstimated lifetime of minor activity i in period p for building b
EIipbEnd time of minor activity i in period p for building b
CJapbCost of major activity a for building b
CIipbCost of major activity i for building b
Table 5. Heritage building data on the survey list.
Number of BuildingsConditionScenario 1 Initial Condition Scenario 1 Lifetime RemainingScenario 2 Initial ConditionScenario 2 Lifetime RemainingLand AreaIntervention Cost (USD Millions)
ReconsRehabReinforceExpandReplaceCleaning
1Maintained62337279m20.0590.0390.0290.0200.0120.008
2Maintained62231053m20.0110.0070.0060.0040.0020.001
3Well-Maintained51724344m20.0720.0480.0360.0240.0140.010
4Heavily Damaged1010296m20.0620.0410.0310.0210.0120.008
5Heavily Damaged1010138m20.0290.0190.0140.0100.0060.004
6Poorly maintained31035201m20.0420.0280.0210.0140.0080.006
7Heavily Damaged101059m20.0120.0080.0060.0040.0020.002
8Maintained62438244m20.0510.0340.0260.0170.0100.007
9Maintained6223693m20.0200.0130.0100.0070.0040.003
10Heavily Damaged1010250m20.0530.0350.0260.0180.0110.007
11Heavily Damaged1010327m20.0690.0460.0340.0230.0140.009
12Well-Maintained51822279m20.0590.0390.0290.0200.0120.008
13Heavily Damaged1010752m20.1580.1050.0790.0530.0320.021
14Less-maintained41210190m20.0400.0270.0200.0130.0080.005
15Maintained62039486m20.1020.0680.0510.0340.0200.014
16Maintained621381754m20.3680.2460.1840.1230.0740.049
17Maintained62236899m20.1890.1260.0940.0630.0380.025
18Well-Maintained517241044m20.2190.1460.1100.0730.0440.029
19Well-Maintained519252379m20.5000.3330.2500.1670.1000.067
20Heavily Damaged1010188m20.0390.0260.0200.0130.0080.005
21Damaged2123374m20.0790.0520.0390.0260.0160.010
22Well-Maintained51920111m20.0230.0160.0120.0080.0050.003
23Well-Maintained51522242m20.0510.0340.0250.0170.0100.007
24Heavily Damaged1010268m20.0560.0380.0280.0190.0110.008
25Well-Maintained51625142m20.0300.0200.0150.0100.0060.004
26Heavily Damaged1010256m20.0540.0360.0270.0180.0110.007
27Well-Maintained51825422m20.0890.0590.0440.0300.0180.012
28Damaged 2224254m20.0530.0360.0270.0180.0110.007
29Maintained6233561m20.0130.0090.0060.0040.0030.002
30Poorly maintained3935315m20.0660.0440.0330.0220.0130.009
31Poorly maintained3637199m20.0420.0280.0210.0140.0080.006
32Poorly maintained38310363m20.0760.0510.0380.0250.0150.010
33Maintained62035714m20.1500.1000.0750.0500.0300.020
34Maintained621310161m20.0340.0230.0170.0110.0070.005
35Maintained623310202m20.0430.0280.0210.0140.0090.006
36Maintained62231097m20.0200.0140.0100.0070.0040.003
37Maintained62439211m20.0440.0300.0220.0150.0090.006
38Maintained62138707m20.1480.0990.0740.0490.0300.020
39Heavily Damaged1010346m20.0730.0480.0360.0240.0150.010
40Heavily Damaged1010552m20.1160.0770.0580.0390.0230.015
The cost is converted from Indonesian rupiah (IDR) to US dollars (USD); exchange rate: IDR/USD = 14,250 (prevailing rate on 17 September 2021).
Table 6. Maintenance cost summary for three scenarios.
Maintenance PeriodScenario 1
($USD)
Scenario 2
($USD)
Scenario 3
($USD)
P1546,947.37 873,684.21 730,385.96
P269,824.56 566,877.19 585,824.56
P384,631.58 496,421.05 349,473.68
P4566,245.61 589,894.74 1,187,228.07
P5895,929.82 926,807.02 655,017.54
P61,719,789.47 1,047,789.47 1,278,596.49
P7620,350.88 956,701.75 602,736.84
P81,083,929.82 1,091,157.89 1,272,842.11
P91,270,035.09 1,010,385.96 868,491.23
P10922,666.67 250,807.02 818,175.44
Total cost7,780,350.88 7,810,526.32 8,348,771.93
The cost is converted from Indonesian rupiah (IDR) to US dollars (USD); exchange rate: IDR/USD = 14,250 (prevailing rate on 17 September 2021).
Table 7. Average cost comparison among three scenarios for all buildings.
Number of BuildingType of Scenario Number of BuildingType of Scenario
Scenario 1 Scenario 2Scenario 3Scenario 1 Scenario 2Scenario 3
B141.3649.6444.18B2159.5451.4949.88
B27.567.148.76B2216.4616.7418.12
B338.7852.9649.52B2326.0439.7931.06
B446.2244.7447.28B2444.6244.8543.80
B526.0222.5121.98B2517.2921.1519.35
B625.1031.4629.62B2639.0038.7837.33
B79.208.879.20B2747.0260.4057.66
B829.6232.3334.28B2839.6239.1036.96
B911.4412.8313.59B298.287.8310.72
B1039.8840.5741.42B3050.3149.3638.78
B1152.2855.0952.46B3131.7229.5125.50
B1237.2239.8640.45B3261.9647.9051.08
B13117.24114.09115.96B3371.32120.45120.46
B1425.2028.7629.92B3416.7819.7621.27
B1563.6255.4660.82B3529.4023.4929.96
B16186.36264.11260.82B3610.5613.3213.10
B17122.88124.83116.72B3723.8633.0425.30
B18121.80164.96183.78B3884.88112.7789.45
B19381.94395.48346.76B3947.9249.3055.44
B2029.2428.1730.36B4089.6878.7687.61
Average cost in each scenario (in USD)55.7361.7960.02
The cost is converted from Indonesian rupiah (IDR) to U.S. dollars (USD); exchange rate: IDR/USD = 14,250 (prevailing rate on 17 September 2021).
Disclaimer/Publisher’s Note: The statements, opinions and data contained in all publications are solely those of the individual author(s) and contributor(s) and not of MDPI and/or the editor(s). MDPI and/or the editor(s) disclaim responsibility for any injury to people or property resulting from any ideas, methods, instructions or products referred to in the content.

