
Optimal Design of Crossbeam Stiffness Factor in Bridge Towers Using a Reliability-Based Approach

1
College of Civil Engineering and Architecture, Zhejiang University, Hangzhou 310058, China
2
Center for Balance Architecture, Zhejiang University, Hangzhou 310028, China
3
Architectural Design and Research Institute of Zhejiang University Co., Ltd., Hangzhou 310028, China
4
Key Laboratory of Space Structures of Zhejiang Province, Hangzhou 310058, China
5
Future City Laboratory, Innovation Center of Yangtze River Delta, Zhejiang University, Jiaxing 314100, China
*
Author to whom correspondence should be addressed.
Buildings 2023, 13(8), 2095; https://doi.org/10.3390/buildings13082095
Submission received: 2 July 2023
/
Revised: 11 August 2023
/
Accepted: 12 August 2023
/
Published: 17 August 2023
(This article belongs to the Special Issue Novel Steel and Steel-Concrete Composite Structures)
Abstract
:Optimal design of the crossbeam is essential for the economical design of bridge towers as the crossbeam could considerably enhance the lateral stiffnesses of these towers by providing a special bracing for the tower columns. By using a reliability-based approach, this paper studies the optimal design of the crossbeam stiffness factor in bridge towers; this is defined as a dimensionless crossbeam stiffness relative to the tower column stiffness. A novel second-order matrix stiffness method (MSM) is applied to obtain a closed-form solution of the lateral stiffness of the bridge tower. The structural second-order stiffness matrix consists of combinations of the second-order element stiffness matrices and coordinate transformations. Subsequently, a reliability analysis to study the optimal design of the bridge tower is performed by considering the uncertainties arising from the design and construction of the bridge tower. The lateral stiffness of the bridge tower is set as an objective function while the total usage of materials is set as a constraint condition. Then, the influence of the crossbeam stiffness factor on the lateral stiffness of the bridge tower, including the fragility curve and the probabilistic behavior, is examined. Based on the reliability analysis, optimal design recommendations on the crossbeam stiffness of the bridge tower are presented.
1. Introduction
The load-carrying capacities and design approaches of novel structural systems have been the attention of engineers and researchers for a long time. Structural bracings are often used to enhance the lateral load transferring mechanism of beam–column systems [1,2,3,4,5]. In guyed tower designs (Figure 1a), pre-tensioned cables are used as lateral bracings. The lateral bracing effect of the cables has been studied by several researchers [6,7,8,9]. In recent years, lateral bracings based on pre-tensioned cables have also been introduced in some novel types of structural systems, including the pre-tensioned cable stayed buckling-restrained braces [10,11,12] (Figure 1b) and pre-tensioned cable braced inverted-Y-shaped support system for Ferris wheels [13] (Figure 1c).
The crossbeam in bridge towers is also used to enhance the lateral stiffness by providing a special bracing for the tower columns. As shown in Figure 2 (variables to be defined in Section 2), the two columns are connected by the crossbeam in the bridge tower in order to form a frame mechanism, and this mechanism can also be considered as a special bracing [14,15]. The design of the crossbeam is therefore significant for an economical design of the bridge tower. Pan et al. [15] studied the influence of the crossbeam stiffness on the lateral stiffness of the bridge tower. It was found that as the stiffness of the crossbeam increases, the structural performance is effectively improved, thus reducing the material usage in the columns.
However, when considering the balance between the costs of the tower and crossbeam in economical bridge tower designs, optimal design recommendations on the relative stiffness between the crossbeam and the tower column are required. In order to provide such design recommendations, two issues still require further investigation: (1) a method for analyzing the exact lateral load-carrying capacity of bridge towers, considering the effect of axial force, is required, and (2) the influence of the crossbeam stiffness on the lateral stiffness of bridge towers and the optimal design of the crossbeam require a more systematic study.
For the first issue, new analytical methods are essential for conducting detailed research on bridge towers by considering the axial force effect. Widely-used methods, such as the finite element method [16,17,18] and the Hencky bar-chain model [3,19,20,21], may be suitable for solving the problem. In this paper, an effective and easy-to-use method, the matrix stiffness method (MSM), is used for analyzing the exact lateral load-carrying capacity of bridge towers. The MSM has some advantages because it can provide the exact second-order solution directly by using an exact second-order element stiffness matrix of beam–columns that considers the axial force effect. This paper will adopt this MSM in order to establish an exact lateral stiffness analysis of bridge towers.
For a systematic study on the optimal design of the crossbeam, the optimal design problem should be defined more properly. The lateral stiffness of the bridge tower should be set as an objective function while the total usage of materials should be set as a constraint condition. Then, the influence of the relative stiffness of crossbeam to tower column on the lateral stiffness of bridge towers may be examined. To examine the lateral stiffness behavior of the bridge tower, the uncertainties may be taken into consideration, and a reliability approach may be adopted to evaluate the fragility curves and probability density functions (PDFs).
In light of the foregoing, this paper examines and compares the lateral stiffnesses of bridge towers by using a reliability analysis approach. A second-order matrix stiffness method is adopted to derive a closed-form solution of the lateral stiffness of the bridge tower. Then, a Monte Carlo simulation-based reliability method is established using the derived design formulas. In the proposed analytical model, the uncertainties of structural geometrical dimensions, material properties, and loading conditions are taken into consideration. Two typical bridge tower models with different height-to-width ratios are analyzed, and the fragility curves and probability density functions are obtained in order to evaluate the lateral stiffnesses. Finally, recommendations for optimal designs of bridge towers are proposed.
2. Problem Definition
Consider a single crossbeam bridge tower under the axial load P and the lateral load Ph (perpendicular to P) on each column, as shown in Figure 2. The two columns with the length L and the inclination angle φ are connected by a crossbeam with length 2l at their upper ends. The flexural rigidities of the columns and the crossbeam are EI and EIc, and the axial rigidities of the columns and the crossbeam are EA and EAc, respectively, where E is the Young’s modulus. The axial force effect (P-Delta effect) may result in considerably larger lateral displacements of the bridge tower than the case with no axial force effect. Therefore, the problem at hand is to develop an exact solution method for the lateral stiffness of the bridge tower by considering the axial force effect and to investigate the optimal crossbeam stiffness design for enhancing the lateral stiffness of the bridge tower.
3. Lateral Stiffness of Bridge Tower Considering Axial Force Effect
3.1. Method for Analyzing Behaviors of Beam-Column Systems Considering Axial Force Effect
For analyzing the structural performances of beam-column systems considering axial force effect, numerous methods may be used, including the general finite element method (FEM), the Hencky bar-chain model (HBM) for beams, columns, and arches, and the matrix stiffness method.
The finite element method has been coded in many general-purpose pieces of computer software that are readily available to researchers and engineers, including OpenSees, ANSYS, ABAQUS, and MSC.Marc. As a result, the FEM is more suited to dealing with general structural problems that may be analyzed by finite elements. As an emerging structural analyzing method, the Hencky bar-chain model analyzes a continuum member as a finite number of rigid bars connected by hinges with elastic rotational springs. As the rigid bar number (i.e., member divisions) increases, the solution by the Hencky bar-chain model converges to the continuum solution (i.e., exact solution) quickly. However, for conducting the Monte Carlo simulation, which requires a large number of analyses, the traditional finite element method and the Hencky bar-chain model may be time consuming. Therefore, a direct method for the exact second-order solution should be used.
The matrix stiffness method analyzes each frame member as one element. For the exact solution by considering the axial force effect, the exact second-order element stiffness matrix of beam–columns can be used, and the matrix shows the relationship between the element-end displacements/rotational angles and the corresponding forces (axial force, shear force and bending moment). After transforming the element stiffness matrices of the frame members in the global coordinate system, the global structural stiffness matrix can be assembled and used for analyzing the structural performances. Since each frame member is modeled as one element, it is easy to conduct a more efficient analysis by obtaining a closed-form exact solution or coding personalized programs for the corresponding problems with customized features. In this problem, the Monte Carlo simulation and parametric analysis can be easily conducted by using the closed-form exact solution obtained from the matrix stiffness method with the exact second-order element stiffness matrix of beam–columns. Detailed analysis procedure using the matrix stiffness method will be presented in the next section.
3.2. Lateral Stiffness of Bridge Tower
To consider the axial force effect on the tower columns, the second-order matrix stiffness method [22,23,24] using the exact second-order element stiffness matrix (i.e., stability stiffness matrix) [6,13,15,18,24,25,26,27,28,29,30] is applied.
The element stiffness matrix of the crossbeam with no axial force can be given by the traditional six-order elastic element stiffness matrix [24,31,32], which shows the relationship between the element-end displacements/rotational angles and the corresponding forces (axial force, shear force and bending moment) of a beam-column system subject to no axial force.
The element stiffness matrix of the tower columns with the axial force P can be given by the second-order element stiffness matrix (i.e., stability stiffness matrix) in Equation (2) [24,31,32], which shows the relationship between the element-end displacements/rotational angles and the corresponding forces (axial force, shear force, and bending moment) of an axially loaded beam-column system. The axial forces on the tower columns are assumed to be constant values as the influence of the lateral load on the axial forces is not the same magnitude as the vertical load P [13,15,26].
where λ denotes the axial load parameter defined by Equation (3) and PE = π2EI/L2 denotes the Euler buckling axial load for pinned-pinned columns.
It is noted that the element stiffness matrices in Equations (1) and (2) are defined in their corresponding local coordinate systems, i.e., the coordinate system xaya for the left column, xbyb for the right column, and the coordinate system xcyc for the crossbeam. The global structural stiffness matrix is, however, assembled in the global coordinate system. For simplicity, and by considering the symmetric conditions, the global coordinate system is defined as a combined coordinate system of xaya for the left node of the crossbeam and xbyb for the right node of the crossbeam. Therefore, the unconstrained element-end displacements in the global coordinate system are (ua1, δa1, θa1, ub1, δb1, θb1), as shown in Figure 2.
Then, the global structural stiffness matrix [K] can be assembled. The stiffness matrix of the crossbeam element in the global coordinate system associated with the element-end displacement vector (ua1, δa1, θa1, ub1, δb1, θb1) should be derived using the coordinate transformation matrix [D] from the global coordinate system to the local coordinate system xcyc, i.e., vector (uc, δc, θc).
where φ is the inclination angle of the columns.
The stiffness matrix of the crossbeam element in the global coordinate system can be derived as [22,23,24]:
To consider the left column element, the upper left 3 × 3 submatrix Ke,sub of [Ke] (Equation (2)) is assembled into the upper left 3 × 3 submatrix of the global structural stiffness matrix [K]; similarly, for the right column element, the upper left 3 × 3 submatrix of [Ke] is assembled into the bottom right 3 × 3 submatrix of [K]. Therefore, the global structural stiffness matrix [K] can be formulated as Equation (6), showing the relationship between the global unconstrained structural displacements and the corresponding forces. The assembling rule is that the submatrix of each element stiffness matrix in the global coordinate system is added to the corresponding row/columns of the structural stiffness matrix by considering the unconstrained member-end displacements and rotational angles.
where K1 and K2 are submatrices of Kg,c.
Considering the lateral load Ph and the anti-symmetric deformation mode of the bridge tower, the global element-end displacement vector can be solved as:
The lateral stiffness of the bridge tower can then be analyzed. The tower top lateral displacement is solved as Equation (8). It is noted that in deriving Equation (8) from Equation (7), the axial rigidity EA/L can be assumed to be infinite by comparing with the flexural rigidity EI/L3, which indicates that the axial stiffness of a beam is much greater than the flexural stiffness.
where Rc = 3(EIc/l)/(EI/L) is a dimensionless crossbeam stiffness factor and Rinc = Lsinφ/l is a dimensionless column inclination factor.
To discuss the satisfaction of the lateral displacement limit of the bridge tower, a generalized lateral stiffness is defined:
4. Lateral Stiffness of Bridge Tower with Varying Crossbeam Stiffnesses
4.1. Uncertainty of Lateral Stiffness of the Bridge Tower
For bridge tower design in the transverse direction of the bridge, this lateral stiffness should be examined against a required lateral stiffness, as given by
where Kreq = 1/δmax and δmax denotes the lateral displacement limit of the bridge tower in the transverse direction [15,33].
According to the design formulas Equations (9) and (10), the reliability analysis of the bridge tower can be performed. The limit state function is given as in Equation (10), corresponding to the limit state of the lateral stiffness, which is greater than the predefined threshold Kreq. Considering the uncertainties arising from the parameters in Equation (9), the structural failure probability Pf is given by Equation (11). The Monte Carlo method is adopted in the reliability analysis, in which the uncertainties of the variables, including geometrical dimensions, material properties, and loading conditions, are taken into consideration.
In the present study, the tower column and crossbeam are designed to have rectangular hollow sections with the cross-sectional width b (or bc), the cross-sectional height h (or hc), and the thickness t (or tc). The geometrical dimensions of the bridge tower, including the length L of the tower column, the length l of the crossbeam, the inclination angle φ of the tower column, the cross-sectional width b (or bc), the cross-sectional height h (or hc), and the thickness t (or tc) of the tower column (or crossbeam), are assumed to follow normal distributions with a mean value of the nominal value and a coefficient of variation (COV) of 0.05 [34]. The Young’s modulus E is assumed to follow a lognormal distribution with a mean value of the nominal value and a COV of 0.04 [35]. The vertical load P and the horizontal load Ph are assumed to follow an Extreme Type I distribution with COVs of 0.3 and 0.4, respectively [36]. These statistical values are representative of the typical cases in practical engineering and will be used in the subsequent discussions.
4.2. Bridge Tower with Medium Height-to-Width Ratio (L/l)
An example of the design of a single crossbeam bridge tower was presented by Pan et al. [15] and is adopted herein. The structural parameters and loading information are summarized as follows: (i) bridge tower geometry L = 40 m, φ = π/12, l = 15 m; (ii) elastic modulus of steel material E = 2 × 10¹¹ N/m2; (iii) loads P = 2000 kN and Ph = 200 kN. An outer cross-sectional dimensions of h × b = 0.94 m × 0.94 m and a thickness of 20 mm are designed for the tower column, and an outer cross-sectional dimensions of hc × bc = 1.20 m × 0.94 m and a thickness of 20 mm are designed for the crossbeam. This bridge tower has a crossbeam stiffness factor Rc = 3(EIc/l)/(EI/L) = 14.1.
In order to examine the influence of the relative stiffness of crossbeam to tower column on the bridge tower lateral stiffness, five models are analyzed with the unchanged material volume Vtotal as the original design:
Noting that the thicknesses of the structural members are the same, this volume constraint could be satisfied by changing the cross-sectional height hc of the crossbeam to 1.2(1 + ε%) and the cross-sectional height h of the tower column to (0.94−1.2ε% × l/L) = (0.94−0.45ε%). This modification means that the analyzed structure uses a crossbeam with an ε% increase in the cross-sectional height hc and an associated tower column cross-section to ensure a constant volume of material. The five analyzed models are associated with five ε% values of −59.61%, −32.93%, −15.76%, 10.43%, and 32.22%. These five models correspond to varying crossbeam stiffness factors Rc = 3(EIc/l)/(EI/L) = 1, 4, 8, 20, and 40, respectively. In addition, as the cross-sectional heights of the crossbeam and the tower column change, the axial load level (which reflects the extent of P-Delta effect in the tower column) varies as P/PE = 0.087, 0.111, 0.132, 0.176, and 0.229, respectively.
Figure 3 shows the fragility curves of the “generalized” lateral stiffness of the bridge tower for varying crossbeam stiffness factors Rc = 3(EIc/l)/(EI/L) = 1, 4, 8, 20, and 40. These fragility curves show the influence of the uncertainties arising from the design and construction of the bridge tower on the bridge tower lateral stiffness. It can be seen from Figure 3 that the bridge tower lateral stiffness increases with the increasing crossbeam stiffness factor when Rc = 1, 4, and 8, whereas the lateral stiffness decreases with the increasing crossbeam stiffness factor when Rc = 8, 20, and 40. For the case with a crossbeam stiffness factor Rc = 8, the analyzed bridge tower has the best lateral stiffness.
Figure 4 shows the probability density functions (PDFs) of the “generalized” lateral stiffness of the bridge tower for varying crossbeam stiffness factors Rc. These PDFs are obtained from the fragility curves in Figure 3. From Figure 4 it is also clear that the analyzed bridge tower would have the best lateral stiffness when the crossbeam stiffness factor Rc = 8, whereas it would have a considerably lower lateral stiffness when the crossbeam stiffness factor is too small (Rc = 1) or too large (Rc = 40).
Table 1 presents the comparisons of varying parameters and lateral stiffnesses of the analyzed bridge tower models. The expected value of Klateral also shows that the lateral stiffness of the bridge tower increases with the increasing crossbeam stiffness factor from Rc = 1 to 4 and then to 8, and the lateral stiffness decreases as the crossbeam stiffness factor further increases from Rc = 8 to 20 and then to 40.
4.3. Bridge Tower with Large Height-to-Width Ratio (L/l)
The second examined example of a bridge tower is associated with a larger height-to-width ratio (L/l). The changed structural parameter with respect to the problem presented in Section 4.1 is the tower column length L = 80 m. The tower column has an outer cross-sectional dimensions of h × b = 1.2 m × 1.2 m and a thickness of 20 mm. The crossbeam is designed to have an outer cross-sectional dimensions of hc × bc = 1.4 m × 1.2 m and a thickness of 20 mm. This bridge tower has a crossbeam stiffness factor Rc = 3(EIc/l)/(EI/L) = 22.8.
In order to examine the influence of the relative stiffness of crossbeam to tower column on the bridge tower lateral stiffness, five models are analyzed with the unchanged material volume Vtotal as the original design, as before. This is achieved by changing the cross-sectional height hc of the crossbeam to 1.4(1 + ε%) and the cross-sectional height h of the tower column to (1.2 − 1.4ε% × 15/80) = (1.2 − 0.2625ε%).
To discuss the relative stiffness of crossbeam to tower column, the reliability analysis of the structural responses associated with five ε% values of −43.79%, −26.24%, −4.59%, 21.41%, and 51.74% are carried out. These five models correspond to varying crossbeam stiffness factors Rc = 3(EIc/l)/(EI/L) = 5, 10, 20, 40, and 80, respectively. In addition, as the cross-sectional heights of the crossbeam and the tower column change, the axial load level (which reflects the extent of P-Delta effect in the tower column) varies as P/PE = 0.240, 0.260, 0.289, 0.330, and 0.389, respectively.
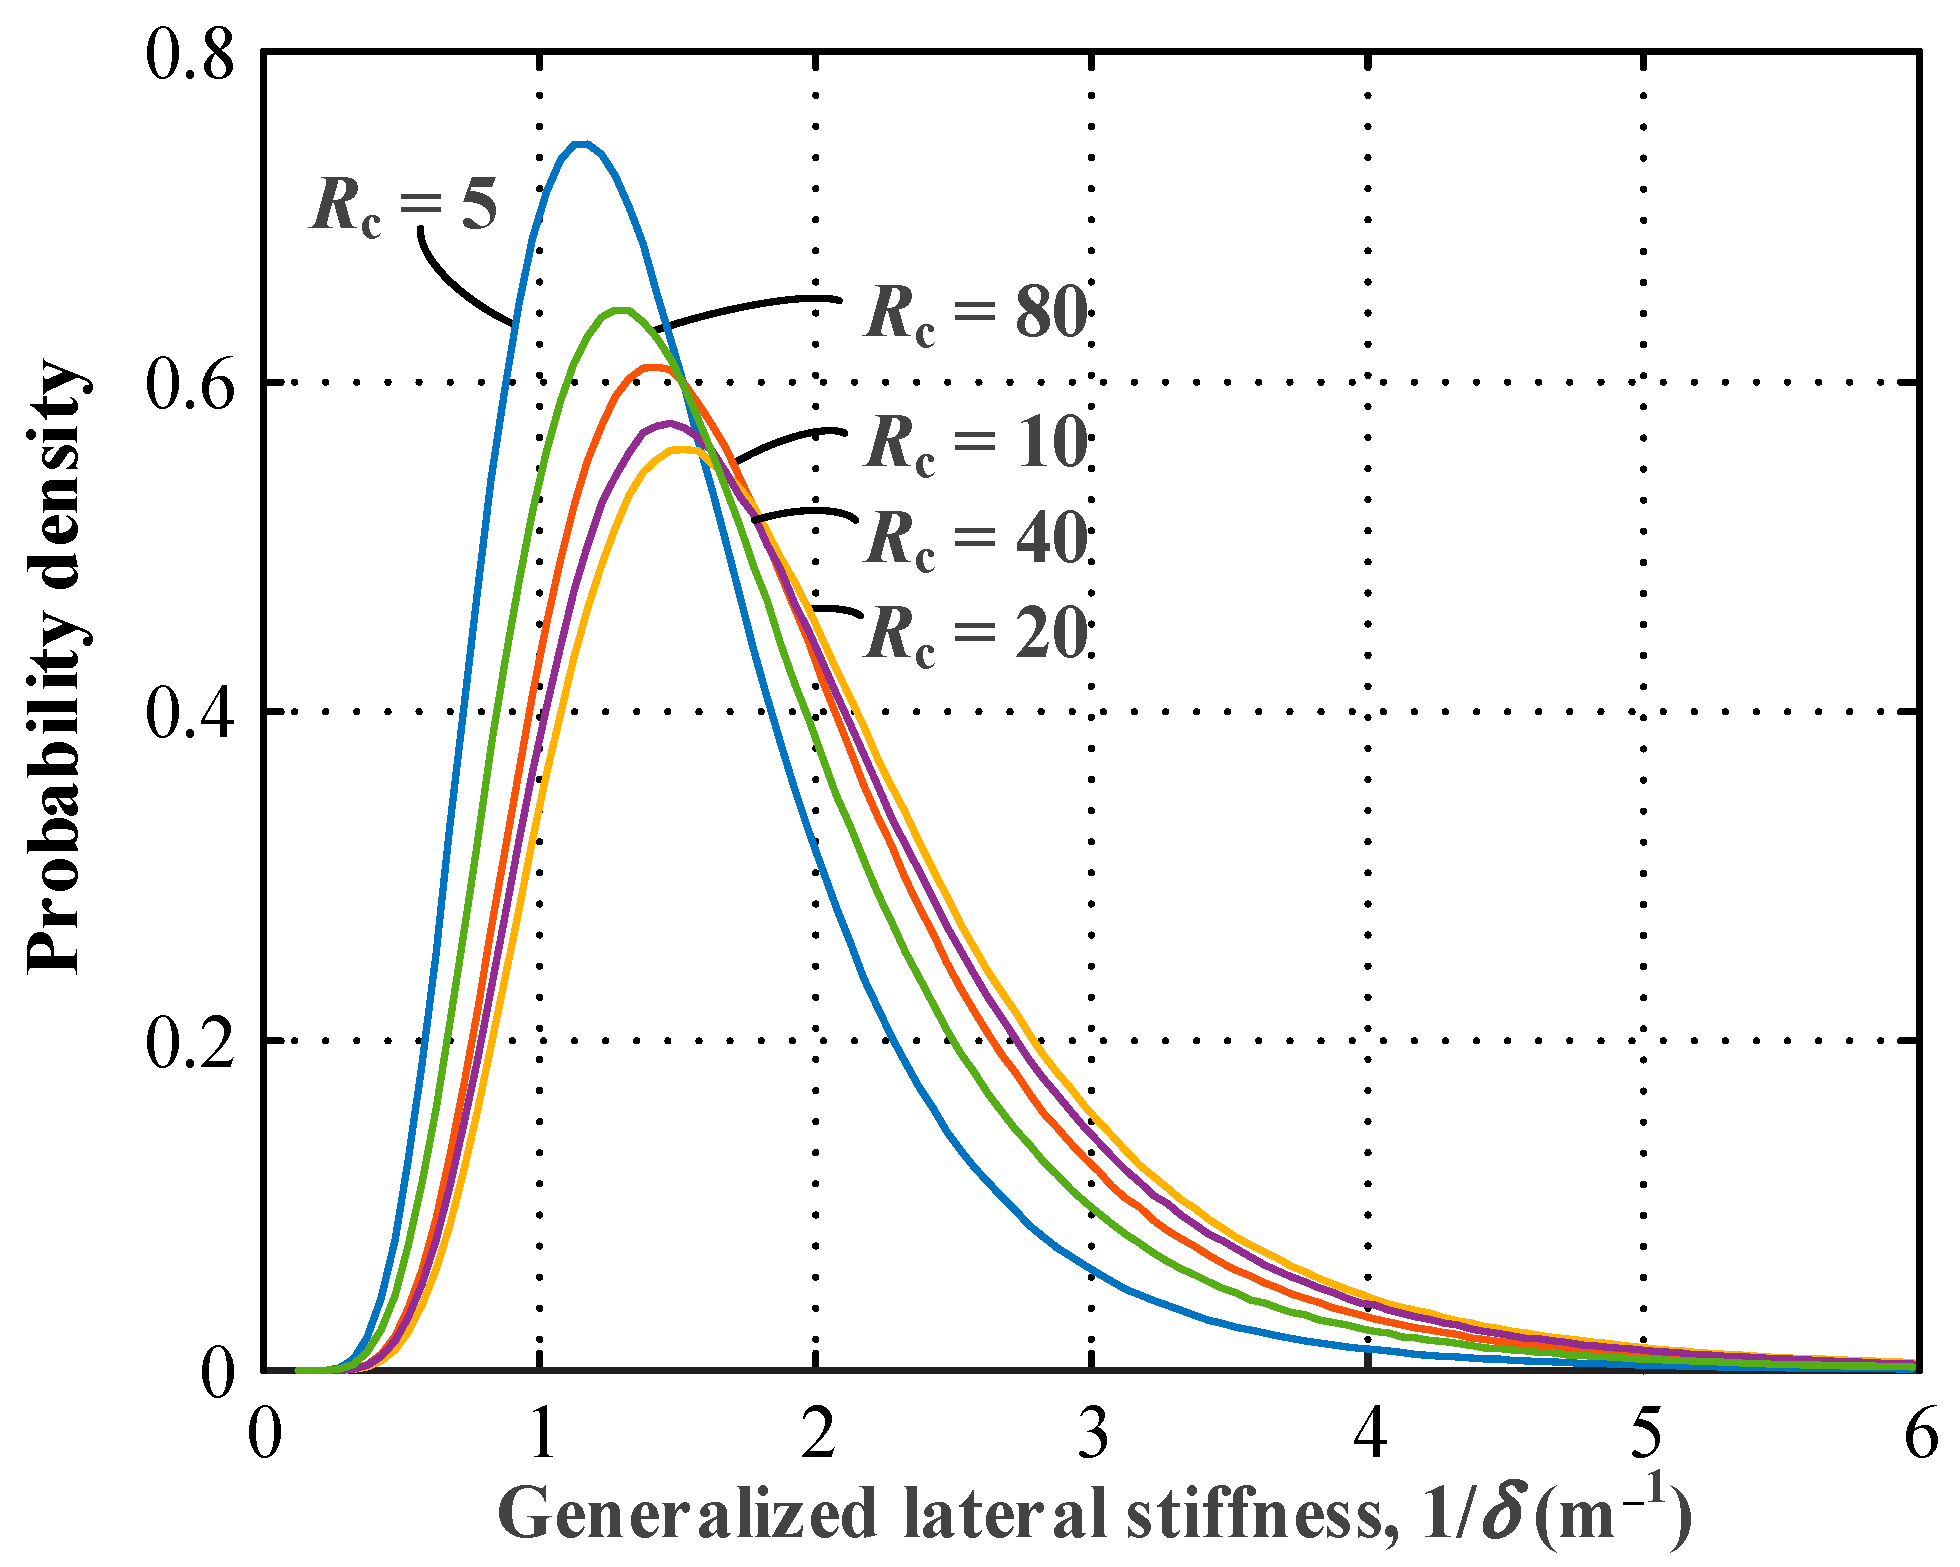
Figure 5 shows the fragility curves of the “generalized” lateral stiffness of the bridge tower for varying crossbeam stiffness factors Rc = 3(EIc/l)/(EI/L) = 5, 10, 20, 40, and 80. Based on Figure 5, one could obtain Figure 6, which shows the PDFs of the “generalized” lateral stiffness of the bridge tower for varying crossbeam stiffness factors Rc. It can be seen from Figure 5 and Figure 6 that the bridge tower lateral stiffness increases with the increasing crossbeam stiffness factor when Rc = 5, 10, and 20, whereas the lateral stiffness decreases with the increasing crossbeam stiffness factor when Rc = 20, 40, and 80. For the case with a crossbeam stiffness factor Rc = 20, the analyzed bridge tower has the best lateral stiffness.
Table 2 presents the comparisons of varying parameters and lateral stiffnesses of the analyzed bridge tower models. From Table 2 it is also clear that the analyzed bridge tower would have the largest lateral stiffness when the crossbeam stiffness factor Rc = 20, whereas it would have a considerably lower lateral stiffness when the crossbeam stiffness factor is too small (Rc = 5) or too large (Rc = 80).
5. Optimal Design Recommendation on Crossbeam Stiffness Factor
For the economical design of a bridge tower, one may specify a total material volume Vtotal. A key parameter in the economical design is the crossbeam stiffness factor Rc, which reflects the relative stiffness between the crossbeam and the tower column. On one hand, Rc should not be too small, so that the crossbeam could provide “adequate bracing” for the tower column [15]; on the other hand, Rc should not be too large because this would lead to weaker tower columns by considering the constant material volume. Based on the examples of the analyzed bridge towers, it is clear that there exists an optimal crossbeam stiffness factor Rc = 3(EIc/l)/(EI/L) for the bridge tower to exhibit the best lateral stiffness behavior. For a medium height-to-width ratio of the bridge tower (e.g., L/l = 8/3 in Section 4.1), the optimal crossbeam stiffness factor to achieve the best lateral stiffness of the bridge tower is around Rc = 8. It is recommended to use a crossbeam stiffness factor Rc in the range of 4~20. For a relatively large height-to-width ratio of the bridge tower (e.g., L/l = 16/3 in Section 4.2), the optimal crossbeam stiffness factor to achieve the best lateral stiffness of the bridge tower is about Rc = 20. It is recommended to use a crossbeam stiffness factor Rc in the range of 10~40.
6. Conclusions
This paper studies the optimal design of bridge towers with crossbeam by using analytical solutions obtained from the second-order matrix stiffness method and adopting a reliability-based approach. The main findings and conclusions are summarized as follows:
- The second-order matrix stiffness method using the exact second-order element stiffness matrix with stability functions facilitates the analysis of axially-loaded beam–column systems significantly. Closed-form exact solutions can be obtained after formulating the global structural stiffness matrix.
- The crossbeam could serve as a special bracing of the columns, thereby significantly enhancing the lateral stiffness of the bridge tower. Therefore, a key parameter in the economical design of bridge towers is the crossbeam stiffness factor Rc, which reflects the relative stiffness between the crossbeam and the tower column.
- An optimal crossbeam stiffness factor could be obtained for the bridge tower to exhibit the best lateral stiffness behavior. The optimal crossbeam stiffness factor in bridge tower designs is related to the height-to-width ratio of the bridge tower. For a medium height-to-width ratio of the bridge tower (e.g., L/l = 8/3), it is recommended to use a crossbeam stiffness factor Rc in the range of 4~20, and the optimal Rc of about 8. For a relatively large height-to-width ratio of the bridge tower (e.g., L/l = 16/3), it is recommended to use a crossbeam stiffness factor Rc in the range of 10~40, with the optimal Rc being about 20.
Author Contributions
Conceptualization, W.P. and J.T.; methodology, W.P. and J.T.; software, W.P. and Y.Z.; validation, J.T.; formal analysis, W.P. and J.T.; investigation, Y.Z. and C.Z.; resources, W.P. and J.T.; data curation, Y.Z. and C.Z.; writing—original draft preparation, Y.Z. and C.Z.; writing—review and editing, W.P. and J.T.; visualization, Y.Z. and C.Z.; supervision, W.P. and J.T.; project administration, W.P. and J.T.; funding acquisition, W.P. and J.T. All authors have read and agreed to the published version of the manuscript.
Funding
This research was funded by the National Natural Science Foundation of China (grant No. 52108181) and Zhejiang Provincial Natural Science Foundation of China (grant No. LQ21E080020). This work was also supported by the Center for Balance Architecture of Zhejiang University (grant No. K20212746).
Data Availability Statement
The data presented in this study are available on request from the corresponding author.
Conflicts of Interest
The authors declare no conflict of interest.
References
- Tong, J.Z.; Guo, Y.L.; Pan, W.H.; Shen, M.H.; Zhou, P. Global buckling prevention of reduced-core-length buckling-restrained braces: Theoretical and numerical investigations. Bull. Earthq. Eng. 2020, 18, 1777–1804. [Google Scholar] [CrossRef]
- Tong, J.Z.; Guo, Y.L.; Pan, W.H.; Zhou, P.; Wang, M.Z. Hysteretic performance of inverted-V patterned BRB systems considering vertical pre-compression effects. Bull. Earthq. Eng. 2019, 17, 3197–3232. [Google Scholar] [CrossRef]
- Pan, W.H.; Wang, C.M.; Zhang, H. Matrix method for buckling analysis of frames based on Hencky bar-chain model. Int. J. Struct. Stab. Dyn. 2019, 19, 1950093. [Google Scholar] [CrossRef]
- Yao, S.S.; Peng, B.; Wang, L.Y.; Chen, H.D. Structural performance and reasonable cross-ratio of cross-cable multi-tower cable-stayed bridges. Buildings 2022, 12, 764. [Google Scholar] [CrossRef]
- Gao, H.Y.; Zhang, K.; Wu, X.Y.; Liu, H.J.; Zhang, L.Z. Application of BRB to seismic mitigation of steel truss arch bridge subjected to near-fault ground motions. Buildings 2022, 12, 2147. [Google Scholar] [CrossRef]
- Pan, W.H.; Eatherton, M.R.; Tao, M.X.; Yang, Y.; Nie, X. Design of single-level guyed towers considering interrelationship between bracing strength and rigidity requirements. J. Struct. Eng. 2017, 143, 04017128. [Google Scholar] [CrossRef]
- Chajes, A.; Chen, W.S. Stability of guyed towers. J. Struct. Div. 1979, 105, 163–174. [Google Scholar] [CrossRef]
- Irvine, H.M.; O’Sullivan, M.J. Elastic stability of simple guyed towers. Appl. Ocean Res. 1979, 1, 203–207. [Google Scholar] [CrossRef]
- Gantes, C.; Khoury, R.; Connor, J.J.; Pouangare, C. Modeling, loading, and preliminary design considerations for tall guyed towers. Comput. Struct. 1993, 49, 797–805. [Google Scholar] [CrossRef]
- Guo, Y.L.; Fu, P.P.; Zhou, P.; Tong, J.Z. Elastic buckling and load resistance of a single cross-arm pre-tensioned cable stayed buckling-restrained brace. Eng. Struct. 2016, 126, 516–530. [Google Scholar] [CrossRef]
- Guo, Y.L.; Zhou, P.; Bradford, M.A.; Pi, Y.L.; Tong, J.Z.; Fu, P.P. Theoretical and numerical studies of elastic buckling and load resistance of double cross-arm pre-tensioned cable stayed buckling-restrained braces. Eng. Struct. 2017, 153, 674–699. [Google Scholar] [CrossRef]
- Pan, W.H.; Eatherton, M.R.; Nie, X.; Fan, J.S. Design of pre-tensioned cable stayed buckling-restrained brace considering interrelationship between bracing strength and stiffness requirements. J. Struct. Eng. 2018, 144, 04018169. [Google Scholar] [CrossRef]
- Pan, W.H.; Eatherton, M.R.; Nie, X.; Fan, J.S. Stability and adequate bracing design of pretensioned cable-braced inverted-Y-shaped Ferris wheel support system using matrix structural second-order analysis approach. J. Struct. Eng. 2018, 144, 04018194. [Google Scholar] [CrossRef]
- Ziemian, R.D. (Ed.) Guide to Stability Design Criteria for Metal Structures, 6th ed.; Wiley: Hoboken, NJ, USA, 2010. [Google Scholar]
- Pan, W.H.; Wang, J.J.; Nie, X.; Tong, J.Z. Adequately rigid cross beams for bridge tower designs. J. Bridge Eng. 2019, 24, 04019120. [Google Scholar] [CrossRef]
- Xu, F.; Pan, W.H.; Chan, T.M.; Sheehan, T.; Gardner, L. Fracture prediction for square hollow section braces under extremely low cycle fatigue. Thin. Wall. Struct. 2022, 171, 108716. [Google Scholar] [CrossRef]
- Wang, C.M.; Pan, W.H.; Zhang, J.Q. Optimal design of triangular arches against buckling. J. Eng. Mech. 2020, 146, 04020059. [Google Scholar] [CrossRef]
- Hu, Z.P.; Pan, W.H.; Tong, J.Z. Exact solutions for buckling and second-order effect of shear deformable Timoshenko beam–columns based on matrix structural analysis. Appl. Sci. 2019, 9, 3814. [Google Scholar] [CrossRef]
- Wang, C.M.; Zhang, H.; Challamel, N.; Pan, W.H. Hencky Bar-Chain/Net for Structural Analysis; World Scientific: Singapore, 2020. [Google Scholar] [CrossRef]
- Pan, W.H.; Wang, C.M.; Zhang, H. Hencky bar-chain model for buckling analysis of non-symmetric portal frames. Eng. Struct. 2019, 182, 391–402. [Google Scholar] [CrossRef]
- Zhang, H.; Wang, C.M.; Challamel, N.; Pan, W.H. Calibration of Eringen’s small length scale coefficient for buckling circular and annular plates via Hencky bar-net model. Appl. Math. Model. 2020, 78, 399–417. [Google Scholar] [CrossRef]
- McGuire, W.; Gallagher, R.H.; Ziemian, R.D. Matrix Structural Analysis, 2nd ed.; John Wiley & Sons: New York, NY, USA, 2014. [Google Scholar]
- Przemieniecki, J.S. Theory of Matrix Structural Analysis; McGraw-Hill Book Company: New York, NY, USA, 1968. [Google Scholar]
- Yuan, S. Programming Structural Mechanics, 2nd ed.; Higher Education Press: Beijing, China, 2008. [Google Scholar]
- Ekhande, S.G.; Selvappalam, M.; Madugula, M.K.S. Stability functions for three-dimensional beam–columns. J. Struct. Eng. 1989, 115, 467–479. [Google Scholar] [CrossRef]
- Munoz, H.R. Elastic Second-Order Computer Analysis of Beam–Columns and Frames. Master’s Thesis, University of Texas at Austin, Austin, TX, USA, 1991. [Google Scholar]
- Aristizabal-Ochoa, J.D. Elastic stability of beam–columns with flexural connections under various conservative end axial forces. J. Struct. Eng. 1997, 123, 1194–1200. [Google Scholar] [CrossRef]
- Yang, Y.B.; McGuire, W. Stiffness matrix for geometric nonlinear analysis. J. Struct. Eng. 1986, 112, 853–877. [Google Scholar] [CrossRef]
- Zhou, J.S.; Pan, W.H.; Zhang, H.; Wang, C.M. Modeling joints with multiple members in Hencky bar-chain model for buckling analysis of frames. Int. J. Mech. Sci. 2019, 164, 105165. [Google Scholar] [CrossRef]
- Ling, M.X.; Zhou, H.; Chen, L.G. Dynamic stiffness matrix with Timoshenko beam theory and linear frequency solution for use in compliant mechanisms. J. Mech. Robot. 2023, 15, 061002. [Google Scholar] [CrossRef]
- Hibbeler, R.C. Structural Analysis, 7th ed.; Prentice Hall: Upper Saddle River, NJ, USA, 2008. [Google Scholar]
- Long, Y.Q.; Bao, S.H.; Kuang, W.Q.; Yuan, S. Structural Mechanics, 2nd ed.; Higher Education Press: Beijing, China, 2006. [Google Scholar]
- AISC. AISC 303-10 Code of Standard Practice for Steel Buildings and Bridges; AISC: Chicago, IL, USA, 2010. [Google Scholar]
- Ellingwood, B.; MacGregor, J.G.; Galambos, T.V.; Cornell, C.A. Probability based load criteria: Load factors and load combinations. J. Struct. Div. 1982, 108, 978–997. [Google Scholar] [CrossRef]
- Bartlett, F.M.; Dexter, R.J.; Graeser, M.D.; Jelinek, J.J.; Schmidt, B.J.; Galambos, T.V. Updating standard shape material properties database for design and reliability. Eng. J. AISC 2003, 40, 2–14. [Google Scholar]
- Melchers, R.E. Structural Reliability Analysis and Prediction; John Wiley & Sons: New York, NY, USA, 1999. [Google Scholar]
Figure 1.
Lateral bracings based on pre-tensioned cables for beam–column systems: (a) guyed towers; (b) pre-tensioned cable stayed buckling-restrained braces; (c) pre-tensioned cable braced inverted-Y-shaped support systems.
Figure 1.
Lateral bracings based on pre-tensioned cables for beam–column systems: (a) guyed towers; (b) pre-tensioned cable stayed buckling-restrained braces; (c) pre-tensioned cable braced inverted-Y-shaped support systems.
Figure 2.
Bridge tower with a crossbeam.
Figure 3.
Fragility curves of “generalized” lateral stiffness of bridge tower with medium height-to-width ratio.
Figure 3.
Fragility curves of “generalized” lateral stiffness of bridge tower with medium height-to-width ratio.
Figure 4.
PDFs of “generalized” lateral stiffness of bridge tower with medium height-to-width ratio.
Figure 4.
PDFs of “generalized” lateral stiffness of bridge tower with medium height-to-width ratio.
Figure 5.
Fragility curves of “generalized” lateral stiffness of bridge tower with large height-to-width ratio.
Figure 5.
Fragility curves of “generalized” lateral stiffness of bridge tower with large height-to-width ratio.
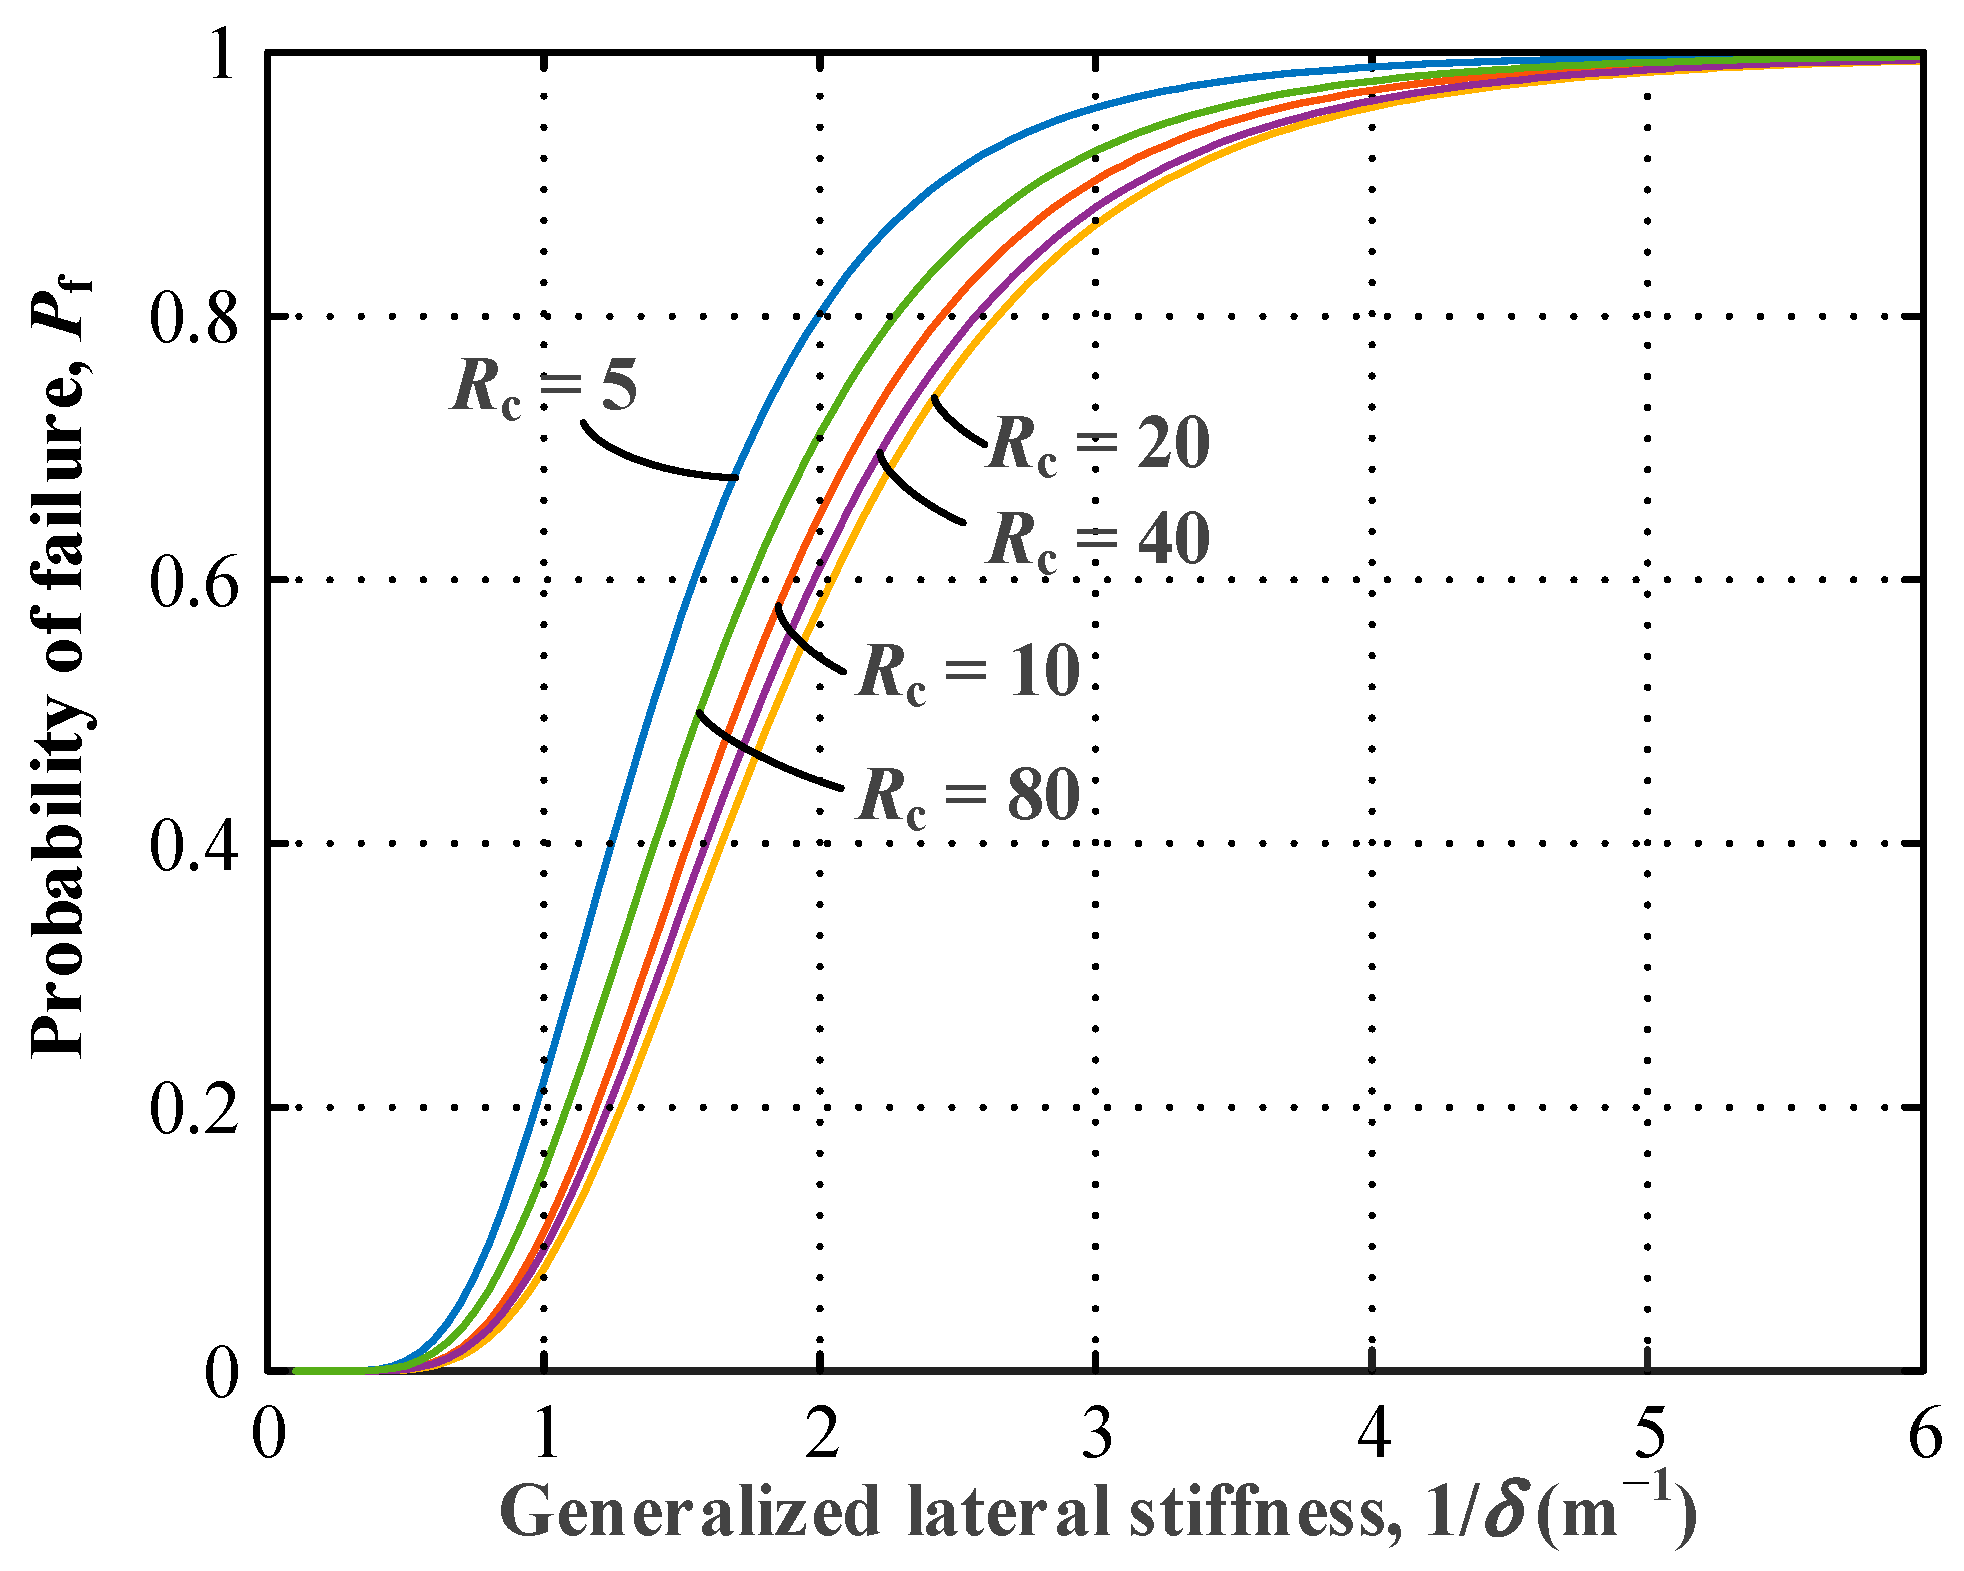
Figure 6.
PDFs of “generalized” lateral stiffness of bridge tower with large height-to-width ratio.

Table 1.
Comparisons of varying parameters and lateral stiffnesses of the bridge tower models with medium height-to-width ratio.
Table 1.
Comparisons of varying parameters and lateral stiffnesses of the bridge tower models with medium height-to-width ratio.
| Crossbeam Stiffness Factor Rc | Variations in the Cross-Sectional Height | Axial Load Level P/PE | Expected Value of Klateral (m−1) | COV of Klateral |
|---|---|---|---|---|
| 1 | −59.61% | 0.087 | 1.843 | 0.483 |
| 4 | −32.93% | 0.111 | 2.754 | 0.469 |
| 8 | −15.76% | 0.132 | 2.866 | 0.470 |
| 20 | 10.43% | 0.176 | 2.490 | 0.483 |
| 40 | 32.22% | 0.229 | 1.962 | 0.497 |
Table 2.
Comparisons of varying parameters and lateral stiffnesses of the bridge tower models with large height-to-width ratio.
Table 2.
Comparisons of varying parameters and lateral stiffnesses of the bridge tower models with large height-to-width ratio.
| Crossbeam Stiffness Factor Rc | Variations in the Cross-Sectional Height | Axial Load Level P/PE | Expected Value of Klateral (m−1) | COV of Klateral |
|---|---|---|---|---|
| 5 | −43.79% | 0.240 | 1.535 | 0.469 |
| 10 | −26.24% | 0.260 | 1.876 | 0.462 |
| 20 | −4.59% | 0.289 | 2.026 | 0.460 |
| 40 | 21.41% | 0.330 | 1.963 | 0.466 |
| 80 | 51.74% | 0.389 | 1.739 | 0.477 |
Disclaimer/Publisher’s Note: The statements, opinions and data contained in all publications are solely those of the individual author(s) and contributor(s) and not of MDPI and/or the editor(s). MDPI and/or the editor(s) disclaim responsibility for any injury to people or property resulting from any ideas, methods, instructions or products referred to in the content. |
© 2023 by the authors. Licensee MDPI, Basel, Switzerland. This article is an open access article distributed under the terms and conditions of the Creative Commons Attribution (CC BY) license (https://creativecommons.org/licenses/by/4.0/).
Share and Cite
MDPI and ACS Style
Pan, W.; Zhu, Y.; Zhao, C.; Tong, J. Optimal Design of Crossbeam Stiffness Factor in Bridge Towers Using a Reliability-Based Approach. Buildings 2023, 13, 2095. https://doi.org/10.3390/buildings13082095
AMA Style
Pan W, Zhu Y, Zhao C, Tong J. Optimal Design of Crossbeam Stiffness Factor in Bridge Towers Using a Reliability-Based Approach. Buildings. 2023; 13(8):2095. https://doi.org/10.3390/buildings13082095
Chicago/Turabian StylePan, Wenhao, Yi Zhu, Chuanhao Zhao, and Jingzhong Tong. 2023. "Optimal Design of Crossbeam Stiffness Factor in Bridge Towers Using a Reliability-Based Approach" Buildings 13, no. 8: 2095. https://doi.org/10.3390/buildings13082095
Note that from the first issue of 2016, this journal uses article numbers instead of page numbers. See further details here.