
Potential for Net-Zero Energy Communities in Kuwait: An Empirical Techno-Economic Modeling and Optimization Approach


1
Department of Engineering, Kuwait Municipality, Kuwait City P.O. Box 10, Kuwait
2
Department of Civil and Environmental Engineering, Carleton University, Ottawa, ON K1S 5B6, Canada
*
Author to whom correspondence should be addressed.
Buildings 2023, 13(8), 2096; https://doi.org/10.3390/buildings13082096
Submission received: 19 July 2023
/
Revised: 8 August 2023
/
Accepted: 12 August 2023
/
Published: 17 August 2023
(This article belongs to the Special Issue Building Energy Retrofit for Sustainable Urban Renewal)
Abstract
:A net-zero energy community (NZEC) is a promising paradigm that can directly contribute to a sustainable building sector and infrastructure. This research presents a unique empirical techno-economic optimization and evaluation approach for NZEC potential and enablers through its application to the understudied context of Kuwait. The proposed approach is unique, as it integrates data-driven and physics-based modelling capabilities, captures the impact of urban form on NZEC techno-economic performance, and quantifies through sensitivity analyses the impact of potential enablers in overcoming financial barriers to adoption. Results indicate that NZECs are far from being competitive in Kuwait compared to the business-as-usual scenario of electricity grid purchase at highly subsidized tariffs. Increasing electricity rates to a minimum of 0.03 $/kWh is recommended, coupled with investing in energy efficiency and enabling grid sell-back capabilities. Finally, results indicate that the energy demand profiles of office and multi-family buildings are more advantageous for efficient NZEC design and performance than villas, the most predominant building type in Kuwait. Limiting the share of NZEC energy demand from villas to 25% helps avoid excessive energy generation and storage capacities and costs.
Keywords:
net-zero energy community; energy demand; renewable energy; modeling; optimization; Kuwait1. Introduction
1.1. Background
Kuwait is considered one of the world’s wealthiest countries but also among the most energy-intensive [1]. A report by the International Energy Agency (IEA) ranks Kuwait fifth globally in electricity usage per capita, estimating consumption at 15.7 MWh/person/year (a 91% increase from 1990 levels) [2]. A main driver behind this growth is the building sector, especially residential buildings, which account for approximately 67% of the country’s electricity demand [3]. Moreover, with Kuwait experiencing historical population growth and an influx of international workers, the building sector is under immense pressure to expand rapidly while meeting the projected energy demand [4].
As a result, there is a growing focus on implementing energy-conservation strategies, policies, and research initiatives to enhance the energy efficiency of both commercial and residential buildings. This need has been coupled with research efforts covering various facets of energy efficiency, including low-energy building systems (e.g., [5,6]), passive design strategies (e.g., [7,8]), urban-scale retrofits (e.g., [9]), and building codes and demand-side management strategies (e.g., [10,11]).
In parallel to the demand-side challenges and efforts, a growing emphasis is put on the supply-side dimension of the problem, namely, producing and supplying energy at lower carbon footprints [1]. Kuwait currently has a minimal share of renewable energy sources in its energy mix, estimated at around 1%. However, the country has set aggressive targets to increase its share of renewables from 1% to 15% by the year 2030 as part of Kuwait’s commitment to the United Nations’ Sustainable Development Goals (SDGs) (Goal SDG7: Affordable and clean energy) [12]. Given the size and energy demand of the building sector, it is critical to evaluate and quantify the sector’s readiness to adopt and integrate renewable sources of energy generation.
Globally, significant efforts have been made to research and deploy renewable energy technology to supply buildings’ energy demand. The concept of a net-zero energy building (NZEB) has been particularly studied, representing a building that produces at least as much energy as it consumes [13]). Nuances exist in the definition of an NZEB based on the system’s physical boundary (e.g., on-site versus off-site energy generation), type of balance (e.g., self-sufficiency versus net metering through buying/selling from the grid), and period of balance (e.g., daily versus yearly), among other factors [14]. Independently of the definition or the exact scope of analysis, NZEBs have been effectively researched, developed, and applied in several parts of the world [15].
On the other hand, the literature on NZEBs in the Kuwaiti context is somewhat limited, with only a few studies conducting feasibility analyses on Kuwaiti buildings. A study by Alajmi et al. [13] simulated converting a public building from an “inefficient energy consumer into a net-zero energy building”. The authors confirm the feasibility of NZEBs, especially when coupled with energy-efficient retrofits. Krarti and Ihm [15] evaluated the premise of NZEB single-family buildings in different countries in the Middle East and North Africa (MENA) region. The study concludes that in addition to adopting energy-efficient measures, MENA countries should phase current energy subsidies out to make NZEBs cost-effective. Despite their promising findings, the above studies cannot be generalized to other building types (e.g., typical office or multi-family buildings) as both studies were particular to the buildings they represented.
1.2. From Net-Zero Energy Buildings to Communities
In recent years, there have been increasing trends and research efforts to extend the scope of net-zero energy/emissions from single buildings to clusters or “communities” of buildings. A net-zero energy community (NZEC) is a cluster of neighboring buildings that have their own renewable energy generation units that supply their grouped energy demand. A single entity (e.g., developer or group of owners) typically owns and operates the community energy system [14]. Research indicates that NZECs have significant advantages over NZEBs, including technical, economic, environmental, and social benefits [14,16,17,18,19,20,21]. For instance, grouping buildings with different demand profiles (e.g., commercial and residential buildings) reduces differences between on-peak and off-peak loads, minimizing the mismatch between energy supply and demand [21]. Similarly, larger energy generation and storage systems (e.g., batteries) can benefit from economies of scale with techno-economic advantages over smaller systems [22].
To the authors’ knowledge, no studies have assessed the premise of NZEC in the Kuwaiti context, which is confirmed by a review of 20 recent NZEC studies conducted by Charani Sandiz et al. [14]. The study identified economic and environmental goals as the main drivers for NZEC projects. It also highlighted key challenges, including the lack of data, potentially conflicting interests of different stakeholders, and fragmented energy master-planning approaches. It is also worth noting that none of the reviewed studies were conducted in the Gulf Cooperation Council (GCC), reiterating the scarcity of research efforts originating from (and catered to) the region.
Moreover, beyond the Kuwaiti context, the methods used to evaluate NZECs, particularly building energy demand, typically rely on one of two approaches and rarely integrate them to overcome their limitations. The first approach is data-driven, using data collected from buildings and statistical models to understand the relationship between inputs (e.g., building characteristics and weather conditions) and outputs (e.g., energy consumption estimates) [23]. Despite its advantages, such an approach relies on high-quality data that are not always publicly available to researchers. The second approach is physics-based, using mathematical equations or computer models to simulate building systems’ performance and predict energy performance. Standard inputs to such equations or models include the physical characteristics of a building, its operational patterns, and external factors, such as weather conditions. While physics-based approaches are powerful and flexible, enabling experimenting with building conditions and solutions (e.g., retrofits), they are prone to significant estimation errors when not validated with actual building data [24]. NZEC studies rarely combine the two stated approaches to harness their strengths and mitigate their risks [14]; such a hybrid approach is particularly critical when access to data is challenging [23].
1.3. Objectives and Expected Contributions
This work proposes an empirical techno-economic optimization and evaluation approach to NZEC potential, considering different urban configurations and forms while leveraging the strengths of data-driven and physics-based modelling approaches. The approach also features sensitivity analyses of key techno-economic factors that are known to impact NZEC potential, namely the renewable energy system mix (e.g., solar, wind, and batteries), capital costs, grid connection availability, energy prices, and energy efficiency scenarios. The proposed integrated framework is demonstrated through a case study to evaluate the potential for NZECs in the Kuwaiti context. The application helps answer the following research questions:
- Is the NZEC concept techno-economically viable in typical Kuwaiti communities/cities?
- What combinations of urban form (e.g., villas, multi-family, and office) present the most favorable conditions for an effective NZEC development?
- What are the main enablers for NZEC adoption and deployment?
2. Materials and Methods
A three-stage methodology is proposed, as shown in Figure 1: (i) data gathering of building energy-consumption data and building performance simulation models; (ii) NZEC modeling, which covers urban energy demand, energy supply, and NZEC design optimization; and (iii) an experimental stage with scenario analyses designed to answer the research questions stated in the previous section. The three stages comprise distinct phases detailed in the following Section 2.1, Section 2.2, Section 2.3, Section 2.4, Section 2.5 and Section 2.6.
2.1. Phase I—Data Gathering and Building Performance Simulation Models
The research team previously collected the primary data needed for this study from local entities, including the Kuwait Municipality and the Ministry of Electricity and Water [23]. A total of 463 buildings were surveyed, spanning commercial, multi-family residential, and single-family residential buildings. The sample was chosen randomly from the list of buildings registered with the Kuwait Municipality. The primary parameters surveyed are shown in Table 1. These include building characteristics and annual energy consumption levels (bottom row).
The research team also developed three building performance simulation models that mimic the performance of archetypal (i.e., typical) Kuwaiti commercial (i.e., office) and residential (i.e., multi-family and single-family) buildings. The models were developed using the EnergyPlus software (version 22.1.0) developed by the United States Department of Energy [25]. Using archetype buildings instead of actual ones allows us to draw conclusions generalizable to the stock of buildings they represent [26]. The sources of data include Kuwaiti building codes [27,28], international building codes [29,30], a database of prototype energy models for the United States and other locations [31], and local academic peer-reviewed publications (e.g., [6,11,32,33]).
The three BPS models were calibrated to minimize errors with actual monitored buildings (i.e., benchmarks). Calibration consisted of an iterative approach where uncertain model inputs were manually varied to bring the models’ energy estimates as close as possible to the benchmarks. The final energy-use intensities predicted by the three models (post-calibration) were within 1.5% of the average values observed in the actual buildings, confirming the models’ validity. More details can be found in Azar et al. [23]. Finally, the models were used to generate energy estimates on an hourly basis, predicting the energy consumed by each building type for the 8760 h of the year.
2.2. Phase II—Hourly Energy Demand Profile Generation
This phase aims to generate an hourly profile (from hour 0 to hour 8760) for each of the 463 buildings surveyed in the previous step, which is needed for the renewable energy analysis presented later. More specifically, hourly energy data help capture peak demand loads that determine the capacity of the energy-generation and -storage systems to meet that demand. As discussed earlier, the only energy data available for the monitored building were related to the electrical use intensity, expressed in kWh/m2/year (see Table 1), hence the need to distribute it over the different hours in a year. Spreading an annual energy value over the different hours of the year cannot be performed randomly, as energy demand varies between seasons, months of the year, days of the week, and hours of the day.
In this phase, the building performance simulation models from Phase I to create a normalized distribution of energy consumption over the hours of a year for the different archetypal building types (office, multi-family, and single-family). For each model, this is achieved by dividing the energy consumed at each hour of the year by the total yearly energy consumption, creating a “weight” for each year with the sum of all weights equal to one. Equations (1)–(3) illustrate the calculation process for each building model.
Following this, the annual energy consumption of each of the 463 buildings surveyed is multiplied by the hourly weights for its particular type, generating an hourly demand profile for that building. A simplified process is illustrated in Figure 2, showing the multiplication of the monitored annual energy-consumption levels (left side) by normalized hourly demand profiles (center) to obtain hourly demand profiles for individual buildings (right side).
2.3. Phase III—Urban Energy Demand and Community Configurations
In this study, the scale of analysis is set to an urban community with an annual energy demand of 10 GWh. Different urban form combinations are considered to determine the potential impact of building types and corresponding energy-demand profiles on NZEC potential. Six configurations are considered, covering different proportions of villa, multi-family, and office buildings, as shown in Table 2. The configurations were generated by selectively drawing from the building dataset described earlier to achieve the desired shares of energy demand from different building types while still meeting the desired community size (i.e., 10 GWh ± 1%). The advantages of the proposed approach are twofold. First, varying the mix and proportions of commercial and residential buildings helps quantify the impact of building type on NZEC performance. Second, using and combining actual building data to create the chosen configurations increases their validity and representativeness (compared to purely hypothetical scenarios).
Figure 3 illustrates a heat map of the hourly energy demand for the scenarios considered for one year. The first two residential building scenarios highlight a high density in the later hours of the day, representing typical after-work or after-school activities often observed in households. For office buildings (third scenario), the density is centered around standard working hours (e.g., 8 am to 5 pm), which was also expected. Given the mix of residential and commercial energy-use patterns, the last three scenarios exhibit a wider spread of energy consumption over the hours of the day. The consequences of such spreads on NZEC performance are evaluated in detail in the results section.
2.4. Phase IV—Renewable Energy Generation and Storage Modeling
In this study, energy accounting is conducted at the site level, which means producing enough energy in the community to meet its buildings’ yearly demand, accounted for at the site (as opposed to the source) [34]. Furthermore, it is assumed that energy can be produced on buildings’ premises or within the community (e.g., unusable brownfield or usable greenfield sites).
The modeling of renewable energy systems is conducted using the Hybrid Optimization of Multiple Energy Resources (HOMER) Pro software (version 3.16.1), a tool dedicated to the design optimization and feasibility of renewable energy systems [35]. Typically inputs to a HOMER model include weather data, system demand specifications (e.g., hourly energy demand profiles), system supply specifications (e.g., technology choice, size, and storage), and financial information (e.g., capital costs). Typical outputs include technical performance metrics (e.g., hourly energy-generation profile, efficiency) and financial metrics (e.g., net present value, levelized cost of electricity, payback period).
Three energy-generation and -storage systems are considered in this study: solar photovoltaic (PV) panels, wind turbines, and lithium-ion (LI) batteries for storage. Figure 4 illustrates the system’s configuration, including the electric load, grid, energy generation and storage systems, and converter. Given the goal to optimize the number and size of these systems (see next section for more details), the generic (1 kW) configurations provided by HOMER were used for each of the systems to ease the scaling of their sizes and meet the different energy-demand scenarios considered. The stated configurations and performance ratings are provided by HOMER as typical averages for the chosen technologies.
Classical equations and methods are then used to calculate the power outputs and performance. For instance, the power turbine output is calculated following a three-stage process. First, the wind speed at the hub height of the wind turbine, , is calculated using Equation (4), where is the windspeed at the anemometer height, and represent the heights of the wind turbine and anemometer, and is the surface roughness length.
Second, the calculated value is used to extract the power output of the turbine at standard temperature and pressure, , from the generic wind turbine power curve shown in Figure 5.
Third, the final wind turbine power output is calculated using Equation (5) to adjust for actual air density, where is the actual air density and is the air density at standard conditions. Additional information on PV power generation, cell temperature calculations, battery charge, and discharge power can be found in [36].
2.5. Phase V—Financial Modeling and Optimization
In this work, the optimization objective is to minimize the net present costs () of the combination of systems needed to supply the energy demand. The is calculated using Equation (6), which estimates the present value of all costs incurred over the evaluation period of 25 years for all systems () considered (grid, solar PV, wind turbines, batteries, and converters). The costs include the capital or replacement costs (), operation and maintenance costs (), and energy costs () (mainly grid purchased for gid-connected systems), which are all discounted to present value; is the time period in years and the discount rate, assumed at 5% for this study [38]. Moreover, the costs are constantly adjusted at an inflation rate of 2.9%, which is the average inflation rate observed in Kuwait over the last 25 years [39]. Finally, the electricity utility rates are $0.0065/kWh for residential, and $0.0164/kWh, respectively [40]. The rates are the currently subsidized tariffs, which are significantly lower than the estimated actual costs of energy generation ($0.12/kWh) [41].
In parallel to , the levelized cost of energy () is also calculated using Equation (7), which represents the average cost per kWh of useful electrical energy produced by the system [36].
2.6. Phase VI—Experimental Design, Scenario, and Analysis
Two main scenarios are evaluated, as shown in Figure 6. Scenario A does not allow any electricity exchange with the general grid. Such a case represents the current status quo in the Kuwaiti grid, where no sell back of excessive electricity is possible. In parallel, Scenario B represents a hypothetical future scenario of grid connectivity with net metering accounting. In such a scenario, any excess energy generated is sold back to the grid, and the net zero status is achieved when the total energy generated equals or exceeds energy demand on a monthly basis. This scenario helps explore the path towards carbon neutrality, exploring a range of renewable energy fraction values, defined as the ratios of the energy delivered to the load originating from renewable power sources [35].
For each of the stated scenarios, the six urban configurations described earlier (Section 2.3) are simulated with the objective of minimizing costs. More specifically, the optimization is implemented in HOMER which explores numerous combinations of systems (PV, wind, and batteries) and sizing, identifying the optimal combinations that minimize the net present costs. Moreover, as shown in Figure 6, sensitivity analyses are conducted to quantify the impact of capital costs, efficiency measures, and electricity tariffs on the results.
3. Results
This section presents the results of scenarios A (Section 3.1) and B (Section 3.2) from Figure 6. A synthesis then follows in Section 4 with a reflection on the research questions outlined in Section 1.3.
3.1. “No Grid Exchange” Results: Scenario A
Table 4 presents the optimal techno-economic configurations for the scenarios without grid exchange. While the optimization algorithm explored an extensive number of solutions, only the optimal solution for each urban configuration is presented. The last two rows provide benchmarking values using the current electricity costs in Kuwait for comparison purposes; these represent a grid-only setup (i.e., not NZEC), which is the current status in the Kuwaiti building sector.
As shown in the table, all scenarios required a combination of solar PV, wind, and battery storage to meet the community’s 10 GWh/year electricity demand. The sizing of the systems varied between the scenarios, which was expected given the differences in their energy profiles, as seen earlier in Figure 3. For instance, the “all office buildings” scenario shows the highest PV capacity (16,856 kW) since the peak of energy demand coincides with solar availability during typical working hours. At the same time, the low energy demand of office buildings after-hours results in the lowest battery-storage capacity (14,725 kW) compared to other configurations.
All configurations are significantly more expensive than the current business-as-usual grid-only setup (the last two rows of the table). More specifically, the NPC and LCOE values of the optimal NZEC configurations are 25 to 92 times more expensive, which is in large part due to the highly subsidized electricity tariffs in Kuwait combined with the inability to sell back excess energy generated to the grid; the results of such a scenario are presented in the following section.
Comparing the different configurations, results show that having a single building type in the community is not inherently inefficient for NZEC performance. For instance, the “all office” and “all multi-family” configurations resulted in the two lowest NZEC and LCOE values, as shown in Table 4. For instance, and as discussed earlier, the concentration of energy loads of office buildings during solar availability helped reduce the need for battery-storage capacity; introducing different load profiles into the mix might reduce this advantage. The latter is confirmed by the results of the mixed-use scenarios (shown in the last three columns of the table), which are, on average, more expensive than single-use scenarios. In particular, the “Mix: majority villas” configuration resulted in the highest NPC and LCOE values among all considered configurations.
Overall, the all-villa or villa-dominant configurations performed worse than single-use configurations or ones predominantly composed of office or multi-family buildings. Therefore, it can be concluded that the load profiles of villas are not advantageous for NZEC performance in Kuwait, which motivates the need to introduce office and multi-family buildings in the NZEC community mix in sufficient numbers (e.g., 75% of the load) to take advantage of reduced-energy systems’ capacities and costs.
Figure 7 presents the results of the sensitivity analysis performed on the NPC values by varying the energy demand (y-axis) and capital costs of energy systems (PV, wind, and batteries) (x-axis). Both parameters were varied using a multiplier; for instance, a multiplier value of 0.8 for energy demand presents a future scenario where the community’s energy demand is reduced by 20%. The range of variation included multiplier values as low as 0.5 (i.e., a 50% reduction in demand). While such values may seem extreme, previous studies indicate that they could be realized by introducing aggressive low-energy building codes, energy-efficiency retrofits [9], and less energy-intensive building operation practices. For instance, a 2 °C increase in the thermostat cooling setpoint temperature was estimated to single-handedly reduce building energy demand by more than 10% [23].
The results of Figure 7 confirm the high dependence of NPC on the two varied parameters. Reduced energy demand and capital costs could lead to more than a fourfold decrease in the NPC of the NZEC community. The color change in the heat map is more witnessed along vertical lines, indicating the major role of energy efficiency in achieving more affordable NZEC designs. This finding is consistent with the results of previous studies (e.g., [13,14,15]) highlighting the vital role of energy efficiency in the energy transition.
3.2. “Grid Connection and Net-Metering” Results: Scenario B
This section presents the results of scenarios where the NZEC community is connected and can sell back any excess energy to the grid with net metering. Unlike Scenario A, which only explored pure NZEC performance (i.e., 100% renewable energy fraction), the current results cover various renewable energy faction levels to explore and discuss a more progressive and realizable path towards NZECs.
Figure 8 illustrates the NPC optimization results of the different urban configurations considered, presented for various renewable energy fraction levels. A level of 0 presents the current business-as-usual scenario without renewable energy sources and all required energy purchased from the grid. Each point on the graph shows the NPC for a scenario considered by the optimization algorithms, with the lowest points forming the Pareto front of optimal solutions. A similar trend is seen for all urban configurations, with the NPC values increasing exponentially with higher renewable energy fractions. The considered renewable energy and storage systems are not economically attractive, mainly due to the current subsidized energy tariffs that make grid purchases more affordable than renewable energy investments.
Figure 9 presents a sensitivity analysis showing the dominant energy-source choice for different configurations function of the capital costs (x-axis) and electricity prices (y-axis). Such an analysis sheds light on the conditions that make renewable energy systems financially attractive. As shown in the figure, increasing electricity costs promotes renewable energy penetration at the expense of grid purchases. Interestingly, a threshold of 0.03 $/kWh is observed in all urban configurations, which seems to be the minimum electricity tariff needed for the renewable options to become more competitive than grid purchases. While 0.03 $/kWh is significantly higher than current tariffs ($0.0065/kWh for residential and $0.0164/kWh for commercial [40]), it is still considerably lower than the actual unsubsidized cost of electricity, estimated at 0.12 $/kWh [41]. This result motivates the need for an in-depth discussion and further research on the interaction between subsidies and the business case for renewable energy systems for buildings and communities. Figure 9 also shows that reducing capital costs positively contributes to increasing renewable adoption. A cost multiplier of 0.7 (i.e., 30% price reduction) appears to be another threshold or inflection point, although less significant than the electricity price threshold (0.03 $/kWh).
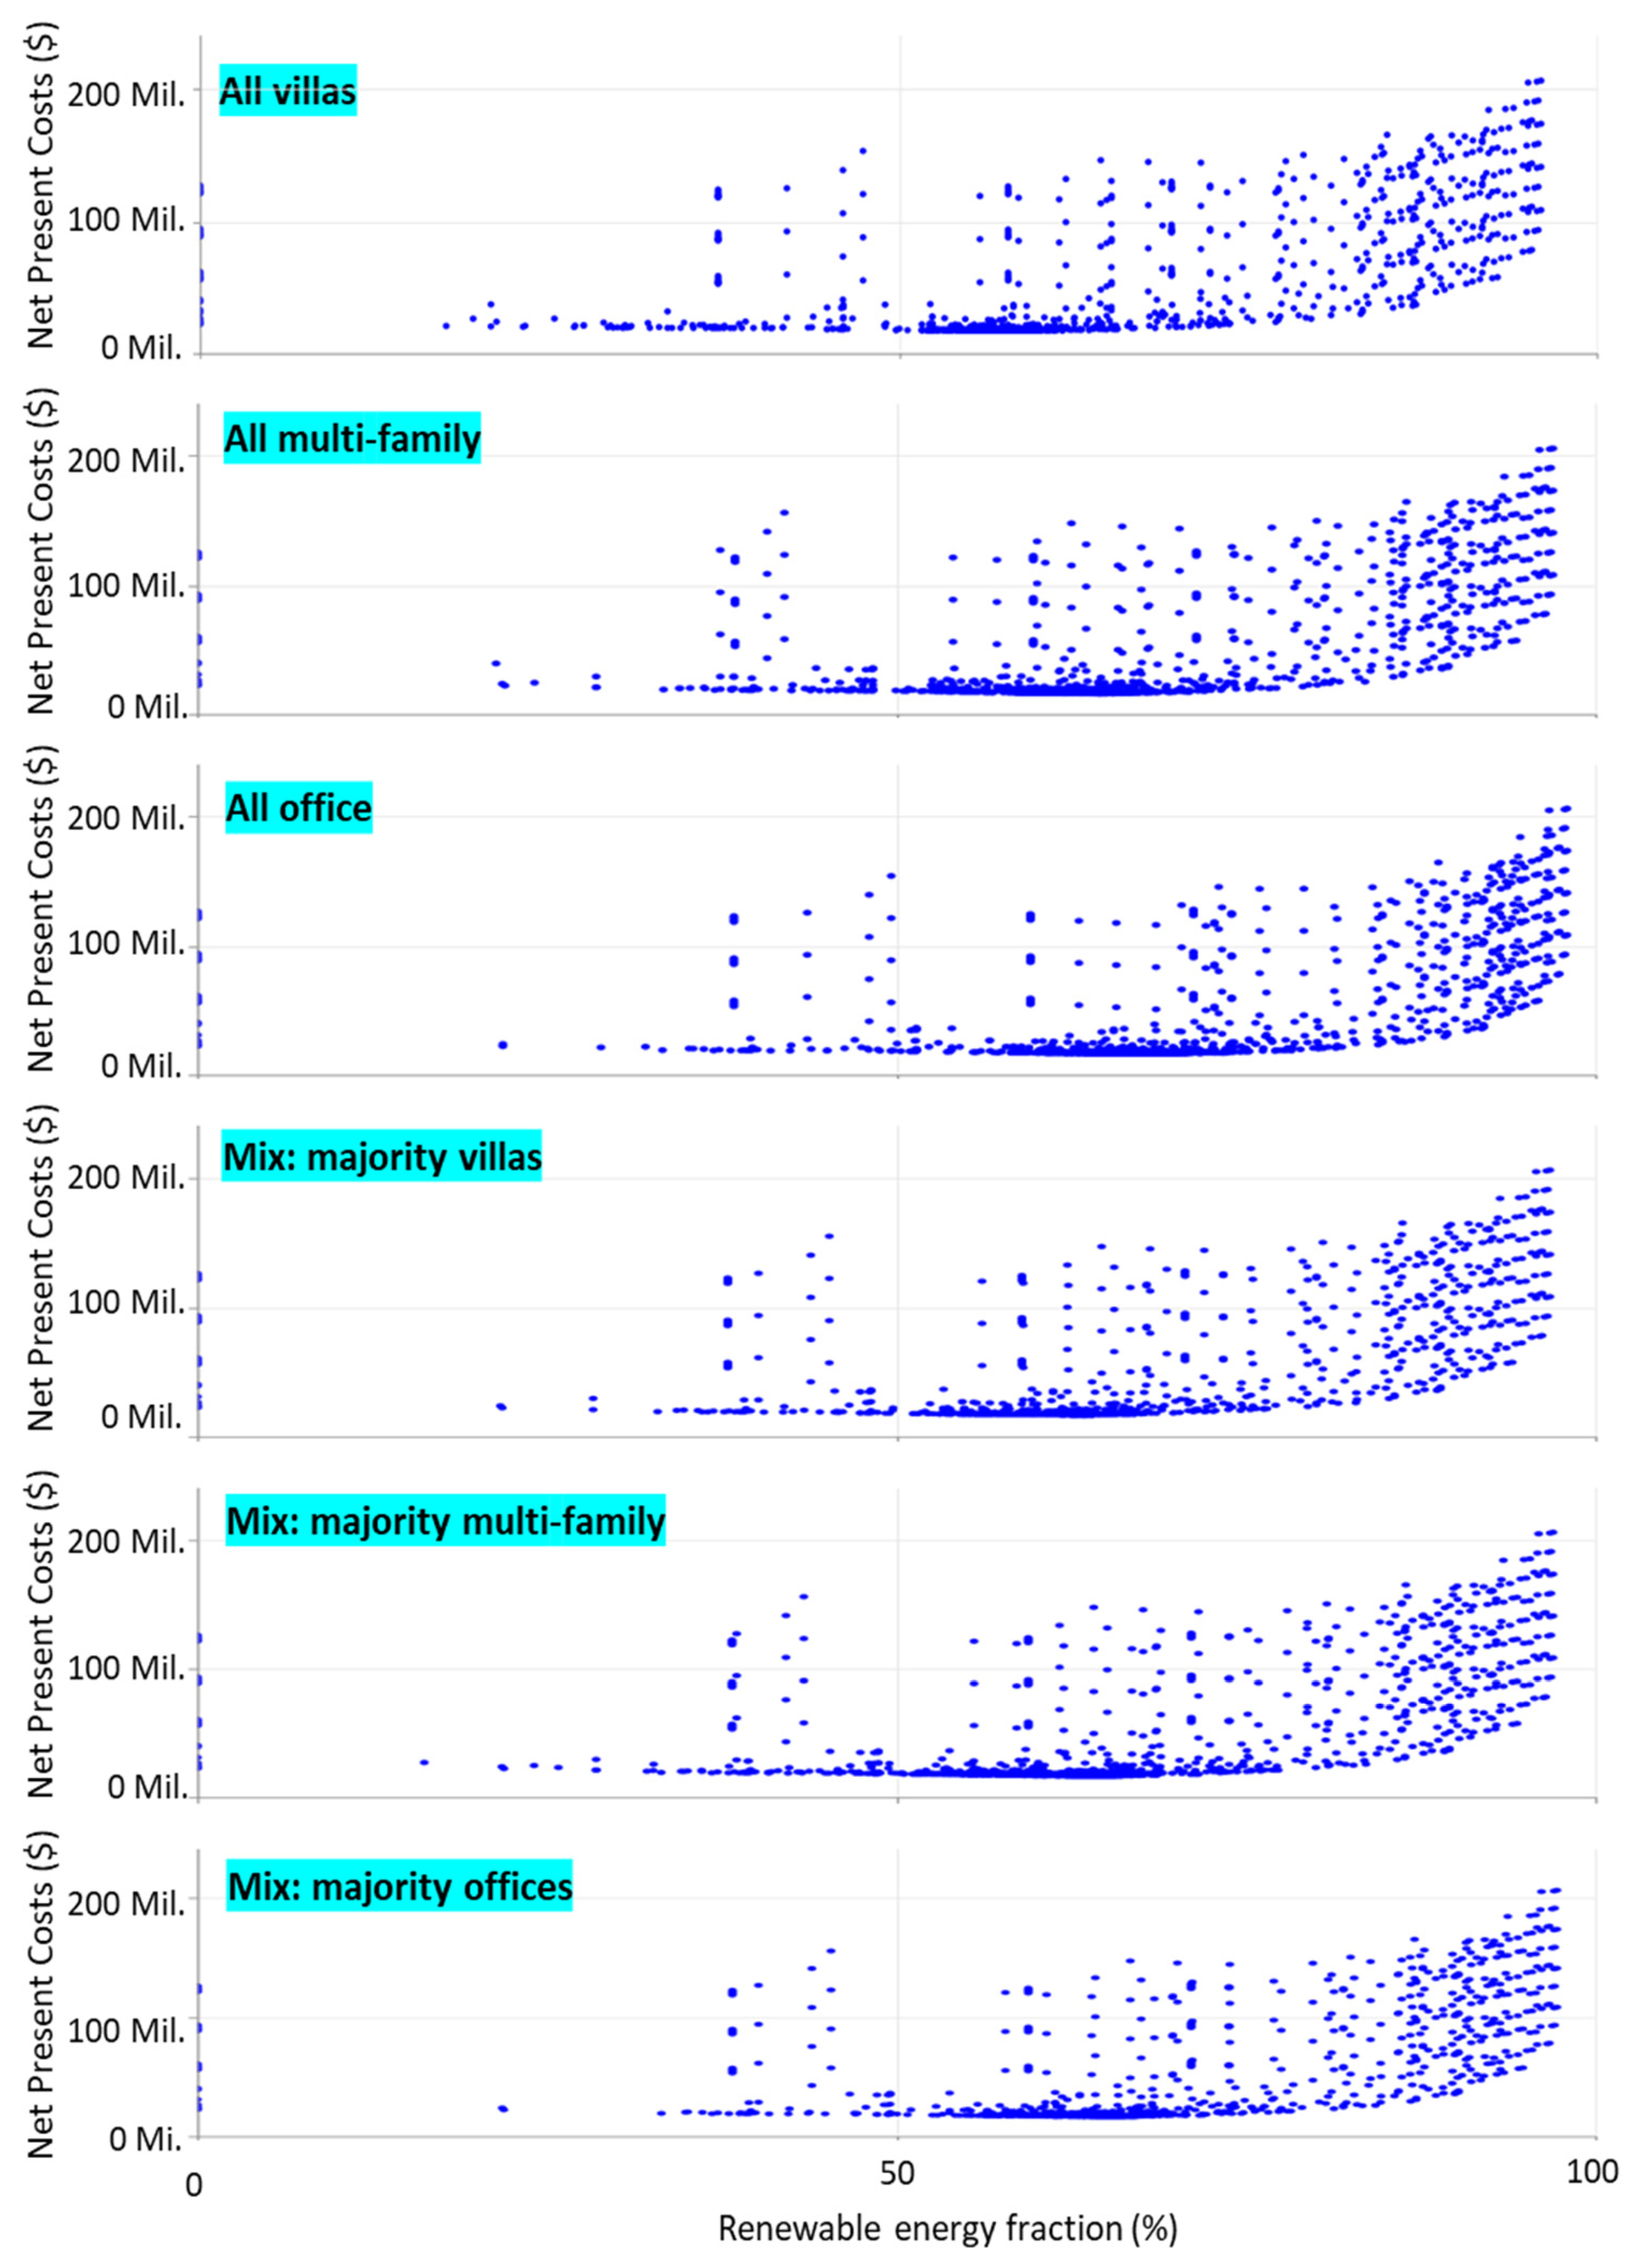
To shed further light on the impact of electricity costs on NZEC feasibility, Figure 10 presents the results of the NPC optimization under the assumption of unsubsidized electricity tariffs. Unlike the results of Figure 8 (which use current subsidized tariffs), the least expensive scenarios occur for renewable energy fractions between 60% and 70%, confirming that significant renewable energy adoption can immediately become an economically viable option if energy subsidies are removed. While not directly comparable due to the difference in research scope and context, the findings align with those of [14], who also found an optimal renewable energy fraction mix between 67% and 77% for different residential areas in Saudi Arabia, a context comparable to Kuwait. The authors acknowledge that reaching such high fractions could be challenging to achieve due to socio-economic-political considerations beyond the scope of this paper. Nonetheless, the findings motivate the need for a systematic evaluation of the role of de-subsidization in the transition towards NZEC and carbon neutrality in Kuwait.
4. Discussion
The results help answer the following research questions of this research, followed by corresponding recommendations:
- Research question #1: Is the NZEC concept techno-economically viable in typical Kuwaiti communities/cities?
The short answer to this question is no, especially given the current inability to sell back excess energy to the grid and highly subsidized electricity tariffs. As shown in Section 3.1, the estimated LCOE of a full NZEC operation (100% renewable energy fraction) is 25 to 92 times more expensive than the current business-as-usual scenario with 100% electric purchase from the grid. A two-way energy exchange with the grid would enable NZEC to significantly reduce energy storage needs and help gradually increase the renewable energy share in low-carbon communities to transition towards NZECs. While the Kuwaiti grid currently does not support electricity sellback and net metering, neighboring countries, such as the United Arab Emirates (UAE), have adopted such mechanisms [42] and can serve as blueprints for future upgrades to the Kuwaiti energy infrastructure and related policies.
- Recommendation #1: Prioritize strategies and advanced feasibility assessments to enable consumers to sell back excessive energy generated from renewable energy sources to the grid.
- Research question #2: What combinations of urban form (e.g., villas, multi-family, and office) present the most favorable conditions for an effective NZEC development?
Results indicate that the energy demand profiles of office and multi-family buildings provide more advantageous techno-economic conditions for NZEC development than villas, the most predominant building type in Kuwait; the villa-dominant scenarios performed the worst. The results could be attributed to the higher mismatch between energy demand and renewable energy supply in villas compared to other building types, necessitating large energy production and storage capacities. As explained in [43], as solar energy supply decreases at dusk, commercial energy demand also decreases while residential energy consumption typically increases. The findings also confirm that the efficiency of mixed-use urban forms highly depends on their composition, which is recommended not to exceed 25% for the studied Kuwaiti context. While previous studies demonstrated the benefits of NZEC compared to single-building approaches, they often explored one urban area with unique characteristics of urban form that cannot be generalized to other locations or areas (see review by [14]). To the authors’ knowledge, this is the first paper explicitly quantifying the influence of urban form and topologies on NZEC performance and potential.
- Recommendation #2: Prioritize NZEC developments with a strategic mix of different building types, avoiding communities predominantly composed of single-family villas.
- Research question #3: What are the main enablers for NZEC adoption and deployment?
In addition to enabling energy sell-back, the sensitivity analyses identified three main NZEC enablers, which are consistent with recommendations found in previous studies. The following paragraph discusses those enablers by order of importance and feasibility in the Kuwaiti context, supported by previous investigations in the literature. The first enabler is promoting energy efficiency through progressive building codes and large-scale retrofit programs [9]; a kWh of energy saved is a kWh that does not need to be produced or stored. The second enabler is eliminating or reducing energy subsidies to gradually reach energy prices between 0.03 and 0.12 $/kWh, the latter being the estimated unsubsidized cost of electricity [41]. An evaluation of net-zero energy potential in the Middle East and North Africa region concluded that eliminating energy subsidies would be the optimal strategy to enable energy-efficient net-zero energy buildings. The third enabler is reducing the capital costs of renewable energy and storage systems (by a minimum of 30%). While global markets typically drive such prices, current subsidies could be shifted to provide immediate support for investments in green technology towards NZEC development while ensuring socio-economic and political stability [44].
- Recommendation #3: Prioritize large-scale energy-efficiency programs in parallel to subsidy re-allocation strategies to reduce the capital costs of renewable energy generation and storage systems by a minimum of 30%.
5. Conclusions
This research presented a unique empirical techno-economic optimization and evaluation approach to NZEC potential, demonstrated through a case study of actual buildings in Kuwait. Compared to previous studies, the proposed research features three main unique aspects directly contributing to state-of-the-art research in the field. First, the developed modeling approach integrates the capabilities of data-driven and physics-based modelling, which helps convert annual building data to hourly demand profiles used to optimize NZEC design. Second, the experimental design analysis explored different combinations of urban form, capturing their impact on NZEC techno-economic performance; previous studies were often limited to a single mix of buildings, limiting the generalization of their results. Third, the case study covered the Kuwaiti building context, which is largely understudied in the literature. Therefore, the findings provide unique insights into the status and potential of NZEC in Kuwait and the broader GCC region.
The case study’s findings confirmed that NZEC potential under the current energy and pricing infrastructure is minimal, with the LCOE of the optimal NZEC configurations at least 25 times higher than the current business-as-usual scenario. Results also indicate that reduced energy loads (e.g., through energy efficiency programs) coupled with capital cost reductions (e.g., through re-allocating existing subsidies) could lead to more than a fourfold decrease in the NPC of the NZEC communities. In parallel, while currently unavailable in Kuwait, it is essential to develop grid sell-back capabilities to reduce the needed capacity and costs of renewable energy generation and storage systems. It is recommended to couple such a measure with increases in electricity prices to a minimum of 0.03 $/kWh, which seems to be an inflection beyond which developing renewable energy capacity becomes economically justified. Finally, the case study presents a unique comparative analysis of urban form configuration on NZECs. It was found that office and multi-family buildings are better candidates for NZEC designs than villas, which should not exceed 25% of the community’s total energy demand.
The study also presents limitations that motivate the need for future research on the topic. One such limitation is the lack of focus on NZEC implementation barriers, such as the availability of data and local expertise, delays in approval processes, conflicts of interest, and lack of holistic master-planning strategies [14]. Moreover, additional energy systems (e.g., geothermal, district cooling, liquid-based storage technology) could be considered, in addition to grid integration control systems and strategies for grid stability [21], which are particularly critical for higher renewable energy ratios. While not directly covered in the current study, the abovementioned dimensions could be easily integrated into the proposed modeling framework, which is highly modular and scalable. Such features are timely and needed to enable comprehensive evaluations of NZEC potential and inform pathways for effective NZEC applications.
Author Contributions
Conceptualization, E.A. and B.A.; Methodology, E.A. and B.A.; Software, E.A.; Validation, E.A. and B.A.; Formal Analysis, E.A. and B.A.; Investigation, E.A. and B.A.; Resources, B.A.; Data Curation, B.A.; Writing—Original Draft Preparation, E.A. and B.A.; Writing—Review and Editing, B.A. and E.A.; Visualization, E.A.; Supervision, E.A. and B.A.; Project Administration, B.A. and E.A.; Funding Acquisition, B.A. All authors have read and agreed to the published version of the manuscript.
Funding
This research was funded by the Kuwait Foundation for the Advancement of Sciences (KFAS), grant number PN21-35EM-1406.
Data Availability Statement
The data presented in this study are available on request from the corresponding author. The data are not publicly available due to privacy restrictions.
Conflicts of Interest
The authors declare no conflict of interest.
References
- Kuwait Institute for Scientific Research (KISR). Kuwait Energy Outlook 2019; Kuwait Institute for Scientific Research (KISR): Kuwait City, Kuwait, 2019. [Google Scholar]
- IEA. IEA Atlas of Energy. International Energy Agency (IEA), 2017. Available online: http://energyatlas.iea.org/#!/tellmap/-1118783123/1 (accessed on 15 July 2023).
- IEA. Data and Statistics. International Energy Agency (IEA), 2018. Available online: https://www.iea.org/data-and-statistics?country=KUWAIT&fuel=Energyconsumption&indicator=Electricityfinalconsumptionbysector (accessed on 15 July 2023).
- U. ESCWA. Analysis of Economic and Environmental Benefits of Promoting Energy Efficiency in Buildings. Case Study. United Nations Economic and Social Commission for West Asia (UN ESCWA), 2015. Available online: http://www.unece.org/fileadmin/DAM/energy/se/pdfs/gee21/projects/others/Kuwait.pdf (accessed on 15 July 2023).
- Al-Hadban, Y.; Sreekanth, K.J.; Al-Taqi, H.; Alasseri, R. Implementation of Energy Efficiency Strategies in Cooling Towers—A Techno-Economic Analysis. J. Energy Resour. Technol. 2017, 140, 012001. [Google Scholar] [CrossRef]
- Darwish, M.A. Building air conditioning system using fuel cell: Case study for Kuwait. Appl. Therm. Eng. 2007, 27, 2869–2876. [Google Scholar] [CrossRef]
- Sedaghat, A.; Alkhatib, F.; Oloomi, S.A.A.; Sabri, F.; Salem, H.; Sabati, M.; Zafar, W.J.; Malayer, M.A.; Negahi, A. Experimental study on the performance of solar window films in office buildings in Kuwait. J. Nanoparticle Res. 2020, 22, 85. [Google Scholar] [CrossRef]
- AlAnzi, A.; Seo, D.; Krarti, M. Impact of building shape on thermal performance of office buildings in Kuwait. Energy Convers. Manag. 2009, 50, 822–828. [Google Scholar] [CrossRef]
- Krarti, M. Evaluation of large scale building energy efficiency retrofit program in Kuwait. Renew. Sustain. Energy Rev. 2015, 50, 1069–1080. [Google Scholar] [CrossRef]
- Alasseri, R.; Tripathi, A.; Rao, T.J.; Sreekanth, K. A review on implementation strategies for demand side management (DSM) in Kuwait through incentive-based demand response programs. Renew. Sustain. Energy Rev. 2017, 77, 617–635. [Google Scholar] [CrossRef]
- Ameer, B.; Krarti, M. Impact of subsidization on high energy performance designs for Kuwaiti residential buildings. Energy Build. 2016, 116, 249–262. [Google Scholar] [CrossRef]
- U. Nations (UN). Kuwait Voluntary National Review 2019. United Nations (UN), 2019. Available online: https://www.undp.org/kuwait/publications/kuwait-voluntary-national-review-2019 (accessed on 15 July 2023).
- AlAjmi, A.; Abou-Ziyan, H.; Ghoneim, A. Achieving annual and monthly net-zero energy of existing building in hot climate. Appl. Energy 2016, 165, 511–521. [Google Scholar] [CrossRef]
- Shandiz, S.C.; Rismanchi, B.; Foliente, G. Energy master planning for net-zero emission communities: State of the art and research challenges. Renew. Sustain. Energy Rev. 2020, 137, 110600. [Google Scholar] [CrossRef]
- Krarti, M.; Ihm, P. Evaluation of net-zero energy residential buildings in the MENA region. Sustain. Cities Soc. 2016, 22, 116–125. [Google Scholar] [CrossRef]
- Chicco, G.; Mancarella, P. Distributed multi-generation: A comprehensive view. Renew. Sustain. Energy Rev. 2009, 13, 535–551. [Google Scholar] [CrossRef]
- Fleischhacker, A.; Lettner, G.; Schwabeneder, D.; Auer, H. Portfolio optimization of energy communities to meet reductions in costs and emissions. Energy 2019, 173, 1092–1105. [Google Scholar] [CrossRef]
- He, D.; Xiong, Q.; Shi, X. Modeling of the renewable energy system of an net zero energy community. In Proceedings of the 29th Chinese Control and Decision Conference (CCDC), Chongqing, China, 28–30 May 2017; pp. 3590–3595. [Google Scholar] [CrossRef]
- Jank, R. Annex 51: Case studies and guidelines for energy efficient communities. Energy Build. 2017, 154, 529–537. [Google Scholar] [CrossRef]
- Sharifi, A.; Yamagata, Y. Principles and criteria for assessing urban energy resilience: A literature review. Renew. Sustain. Energy Rev. 2016, 60, 1654–1677. [Google Scholar] [CrossRef]
- Huang, P.; Wu, H.; Huang, G.; Sun, Y. A top-down control method of nZEBs for performance optimization at nZEB-cluster-level. Energy 2018, 159, 891–904. [Google Scholar] [CrossRef]
- Roberts, M.B.; Bruce, A.; MacGill, I. Impact of shared battery energy storage systems on photovoltaic self-consumption and electricity bills in apartment buildings. Appl. Energy 2019, 245, 78–95. [Google Scholar] [CrossRef]
- Azar, E.; Alaifan, B.; Lin, M.; Trepci, E.; El Asmar, M. Drivers of energy consumption in Kuwaiti buildings: Insights from a hybrid statistical and building performance simulation approach. Energy Policy 2021, 150, 112154. [Google Scholar] [CrossRef]
- Crawley, D.B.; Hand, J.W.; Kummert, M.; Griffith, B.T. Contrasting the capabilities of building energy performance simulation programs. Build. Environ. 2008, 43, 661–673. [Google Scholar] [CrossRef]
- U.S. Department of Energy’s (DOE). EnergyPlus Software. 2019. Available online: https://energyplus.net/ (accessed on 29 October 2022).
- Deru, M.; Field, K.; Studer, D.; Benne, K.; Griffith, B.; Torcellini, P.; Liu, B.; Halverson, M.; Winiarski, D.; Rosenberg, M.; et al. U.S. Department of Energy Commercial Reference Building Models of the National Building Stock. National Renewable Energy Laboratory (NREL). 2011. Available online: http://www.nrel.gov/docs/fy11osti/46861.pdf (accessed on 29 October 2022).
- Kuwait Ministry of Electricity and Water (MEW). Energy Conservation Program: Code of Practice—Report MEW/R-6/2014; Kuwait Ministry of Electricity and Water (MEW): Kuwait City, Kuwait, 2014.
- Kuwait Ministry of Electricity and Water (MEW). Energy Conservation Program: Code of Practice—Report MEW/R-6/2010; Kuwait Ministry of Electricity and Water (MEW): Kuwait City, Kuwait, 2010.
- ICC. IECC—International Energy Conservation Code; International Code Council (ICC): Washington, DC, USA, 2015. [Google Scholar]
- ASHRAE. ANSI/ASHRAE Standard 62.1-2010, Ventilation for Acceptable Indoor Air Quality; American Society of Heating, Refrigerating and Air-Conditioning Engineers (ASHRAE): Atlanta, GA, USA, 2007. [Google Scholar]
- DOE. Commercial Prototype Building Models. United States Department of Energy (DOE), 2018. Available online: https://www.energycodes.gov/development/commercial/prototype_models (accessed on 15 July 2023).
- Sokol, J.; Davila, C.C.; Reinhart, C.F. Validation of a Bayesian-based method for defining residential archetypes in urban building energy models. Energy Build. 2017, 134, 11–24. [Google Scholar] [CrossRef]
- Al-Mumin, A.; Khattab, O.; Sridhar, G. Occupants’ behavior and activity patterns influencing the energy consumption in the Kuwaiti residences. Energy Build. 2003, 35, 549–559. [Google Scholar] [CrossRef]
- National Renewable Energy Laboratory (NREL). Definition of a “Zero Net Energy Community”. NREL, Boulder, CO; 2009. Available online: https://www.nrel.gov/docs/fy10osti/46065.pdf (accessed on 18 September 2022).
- HOMER Energy Pro. Available online: www.homerenergy.com (accessed on 15 July 2023).
- HOMER Energy. HOMER Calculations. 2023. Available online: https://www.homerenergy.com/products/pro/docs/3.11/homers_calculations.html (accessed on 6 July 2023).
- United States Energy Information Administration (US EIA). Cost and Performance Characteristics of New Generating Technologies; United States Energy Information Administration (US EIA): Washington, DC, USA, 2022. Available online: https://www.eia.gov/outlooks/aeo/assumptions/pdf/table_8.2.pdf (accessed on 6 July 2023).
- Krarti, M.; Aldubyan, M. Role of energy efficiency and distributed renewable energy in designing carbon neutral residential buildings and communities: Case study of Saudi Arabia. Energy Build. 2021, 250, 111309. [Google Scholar] [CrossRef]
- The World Bank. Inflation and Consumer Prices. World Bank Open Data. 2023. Available online: https://data.worldbank.org/indicator/FP.CPI.TOTL.ZG?locations=KW (accessed on 6 July 2023).
- Kuwait Ministry of Electricty & Water & Renewable Energy. Website. 2023. Available online: https://www.mew.gov.kw (accessed on 6 July 2023).
- Al Mansour, M.; Krarti, M. Value engineering optimal design approach of high-performance residential buildings: Case study of Kuwait. Energy Build. 2022, 258, 111833. [Google Scholar] [CrossRef]
- Alnaser, N.W.; Albuflasa, H.M.; Alnaser, W.E. The Transition in Solar and Wind Energy Use in Gulf Cooperation Council Countries (GCCC). Renew. Energy Environ. Sustain. 2022, 7, 4. [Google Scholar] [CrossRef]
- Chen, Y.; Chen, Z.; Yuan, X.; Su, L.; Li, K. Optimal Control Strategies for Demand Response in Buildings under Penetration of Renewable Energy. Buildings 2022, 12, 371. [Google Scholar] [CrossRef]
- Poudineh, R.; Sen, A.; Fattouh, B. Advancing renewable energy in resource-rich economies of the MENA. Renew. Energy 2018, 123, 135–149. [Google Scholar] [CrossRef]
Figure 1.
Methodology.
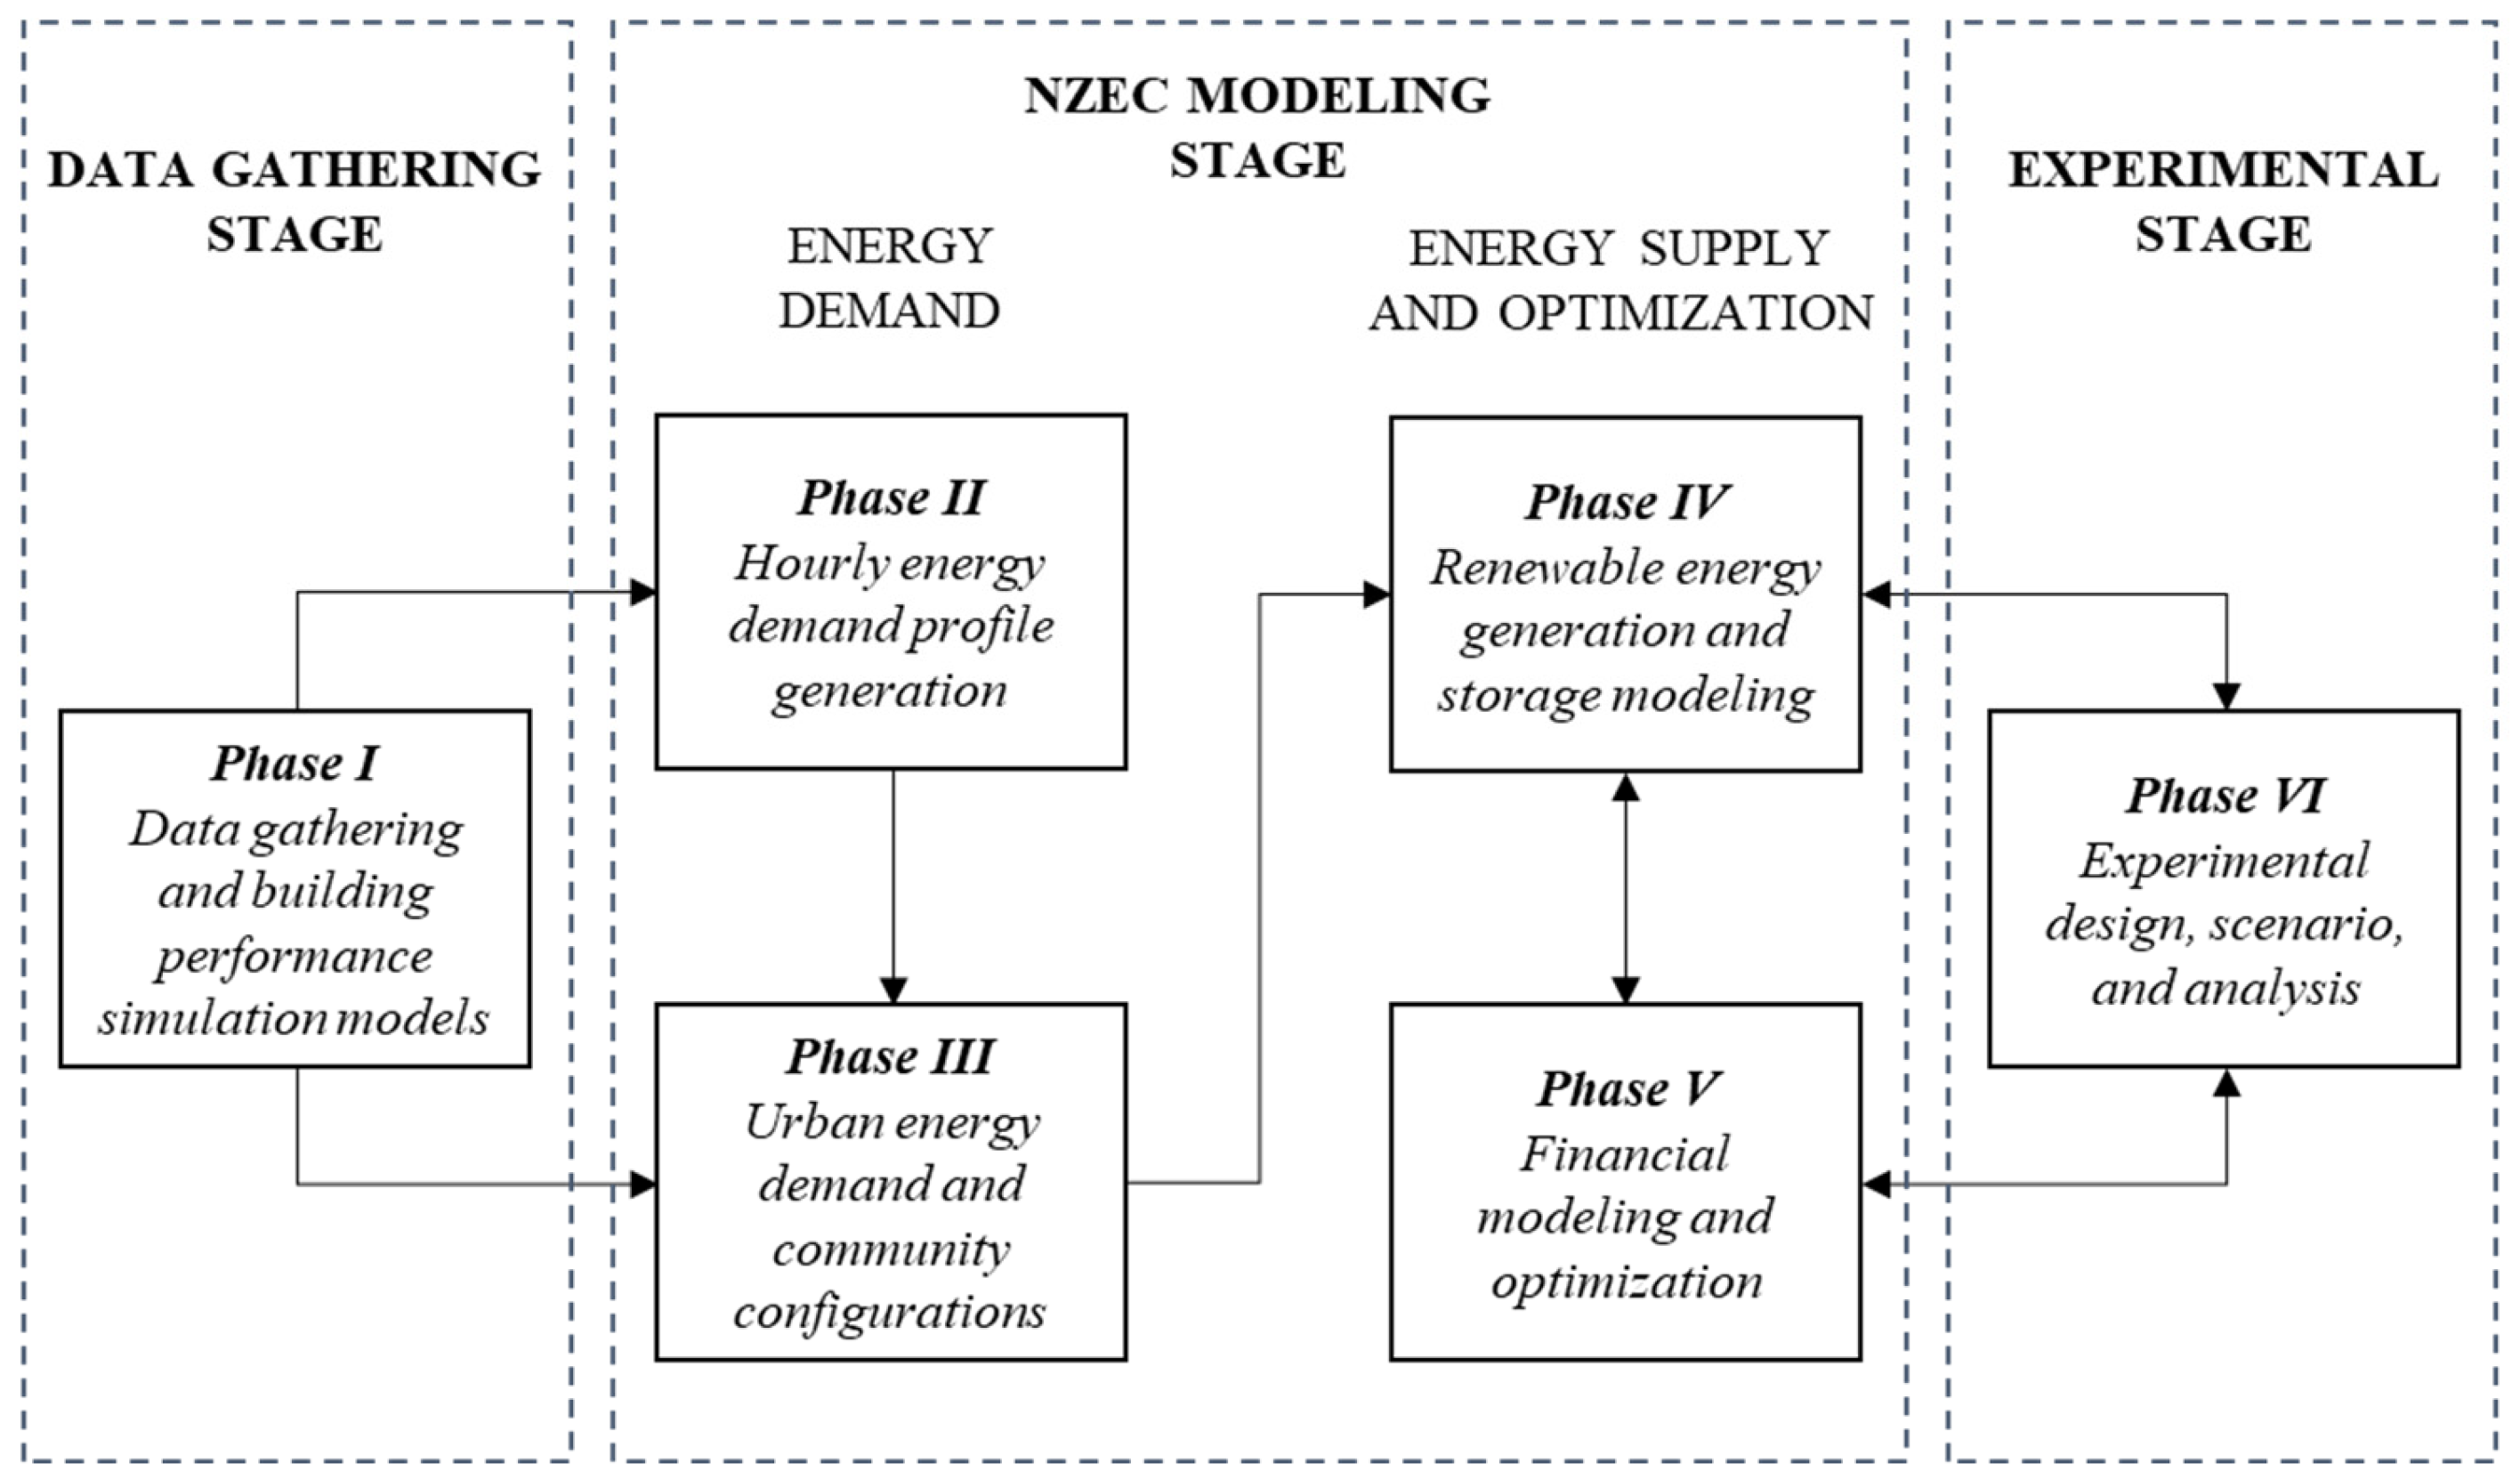
Figure 2.
Proposed process to generate hourly demand profiles for individual buildings.

Figure 3.
Heat map of hourly energy demand.

Figure 4.
Energy system design.
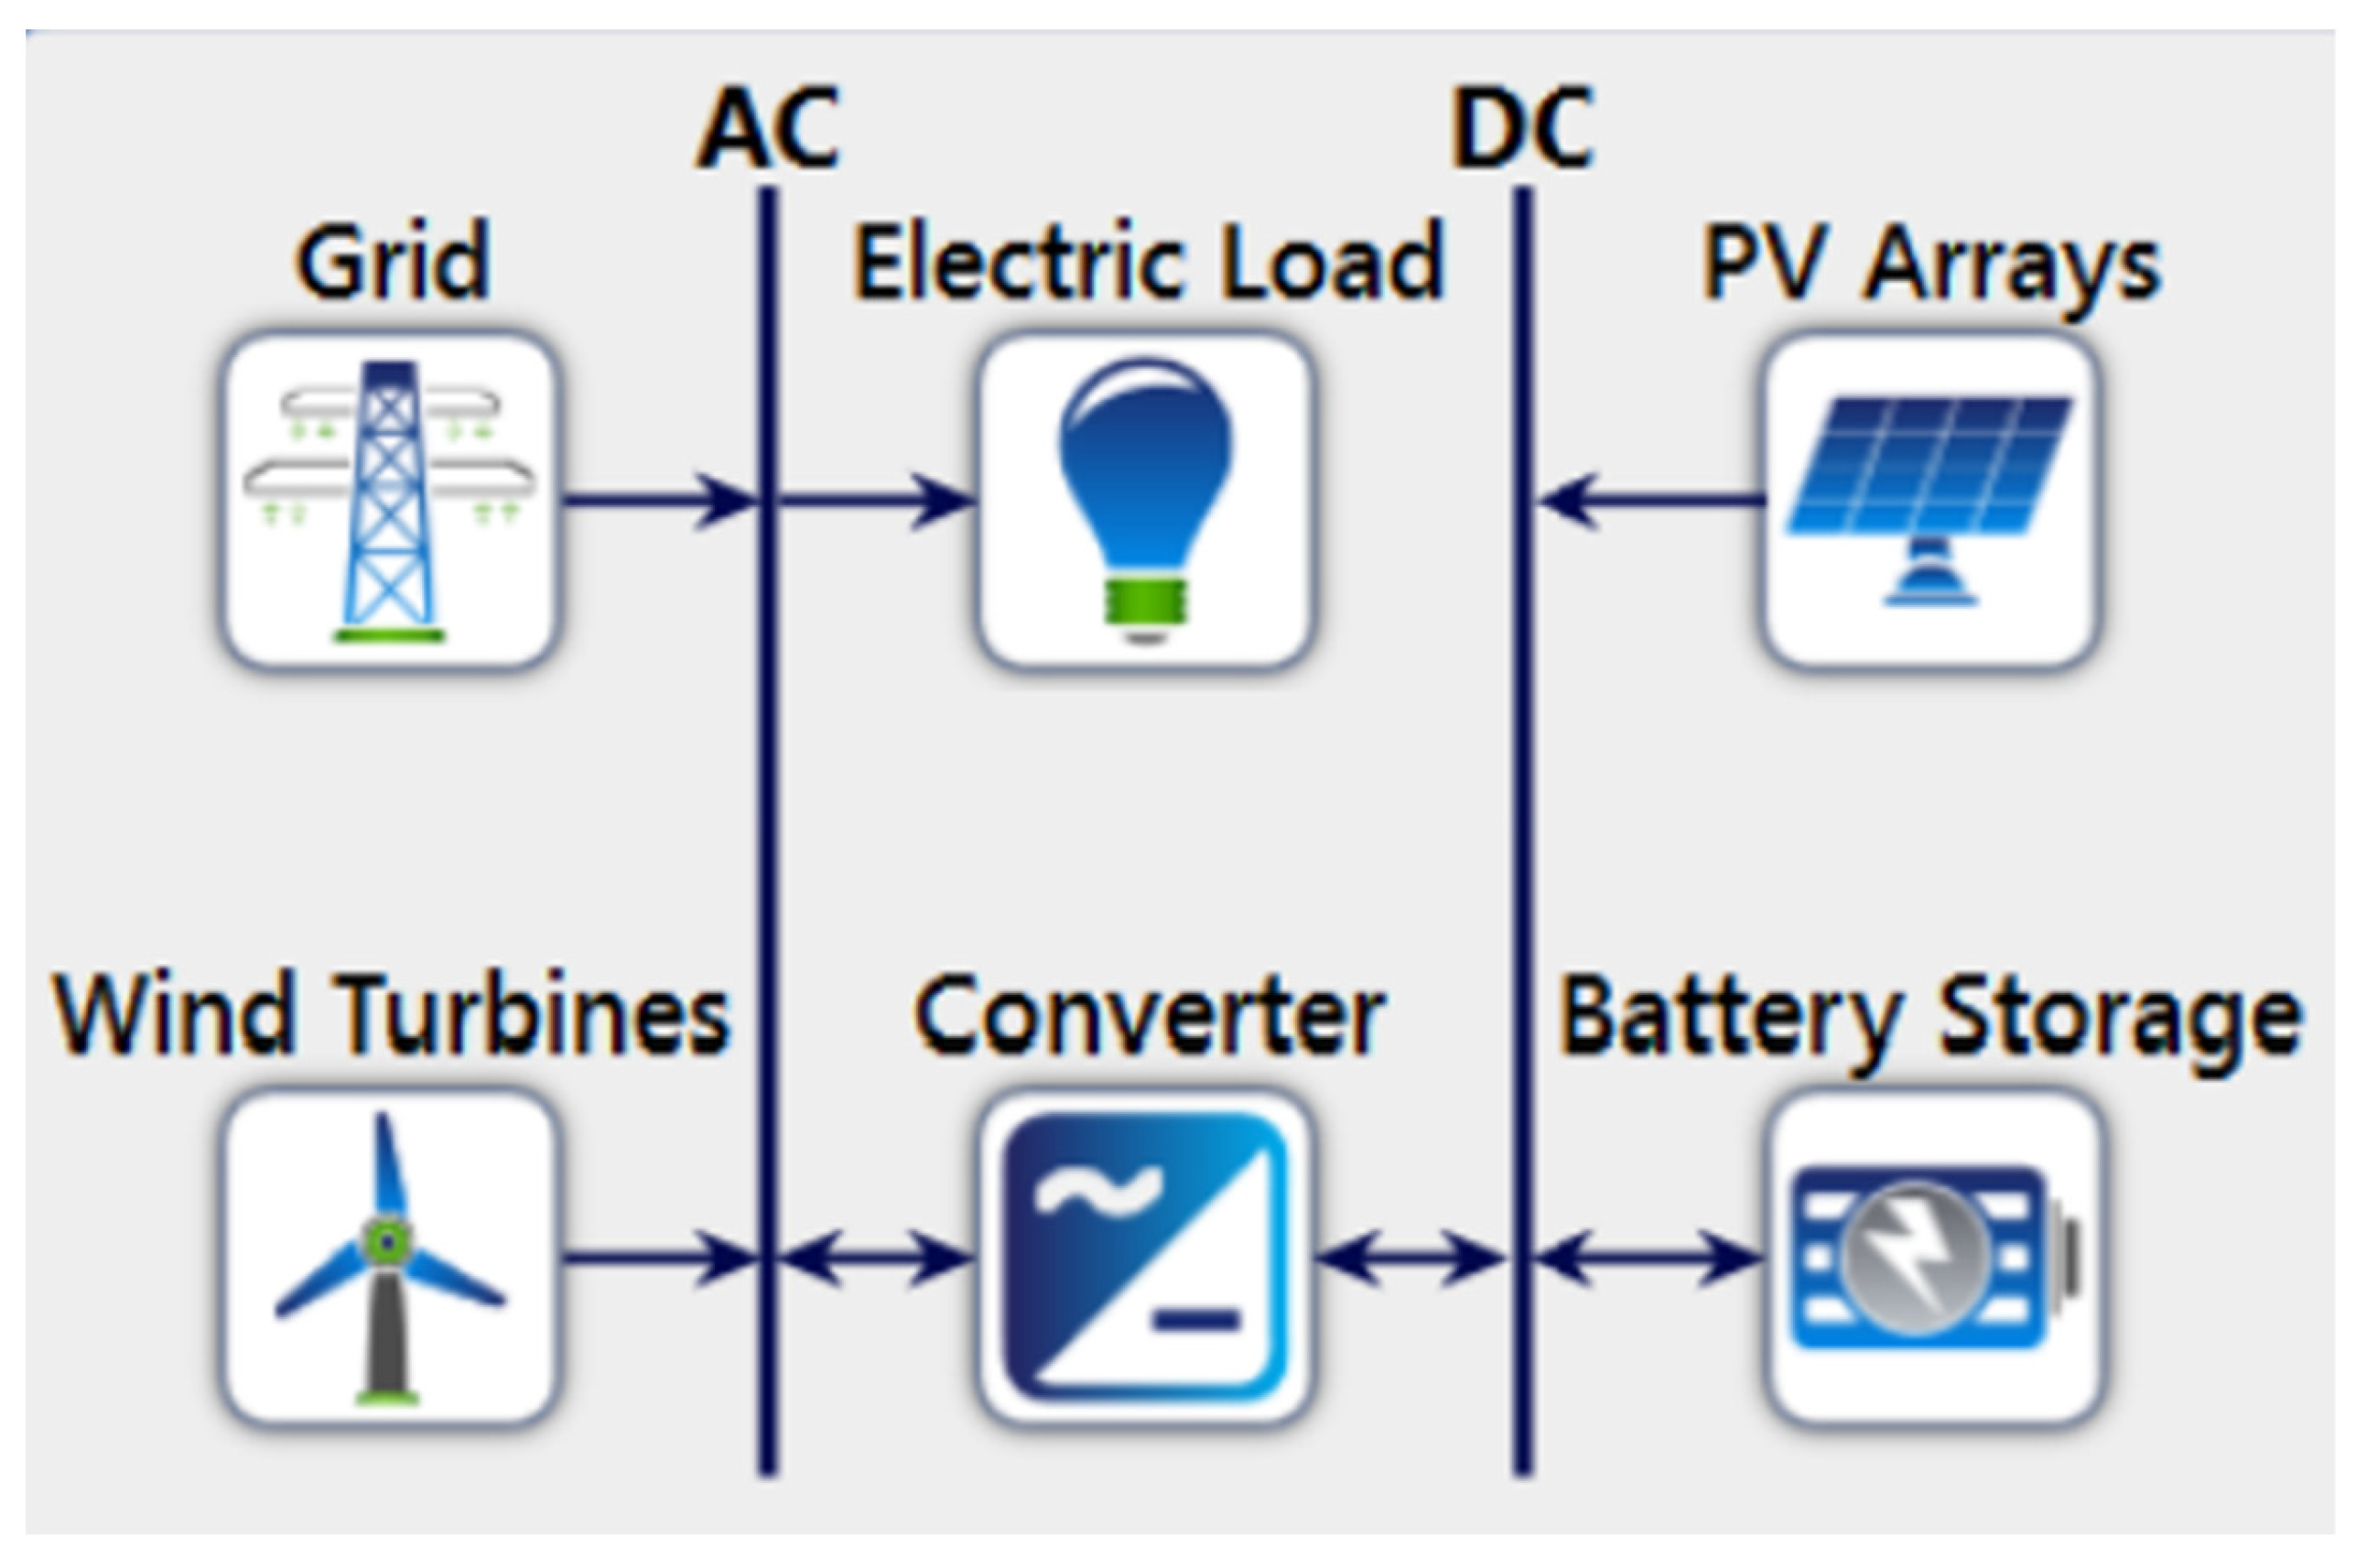
Figure 5.
Wind turbine power curve.
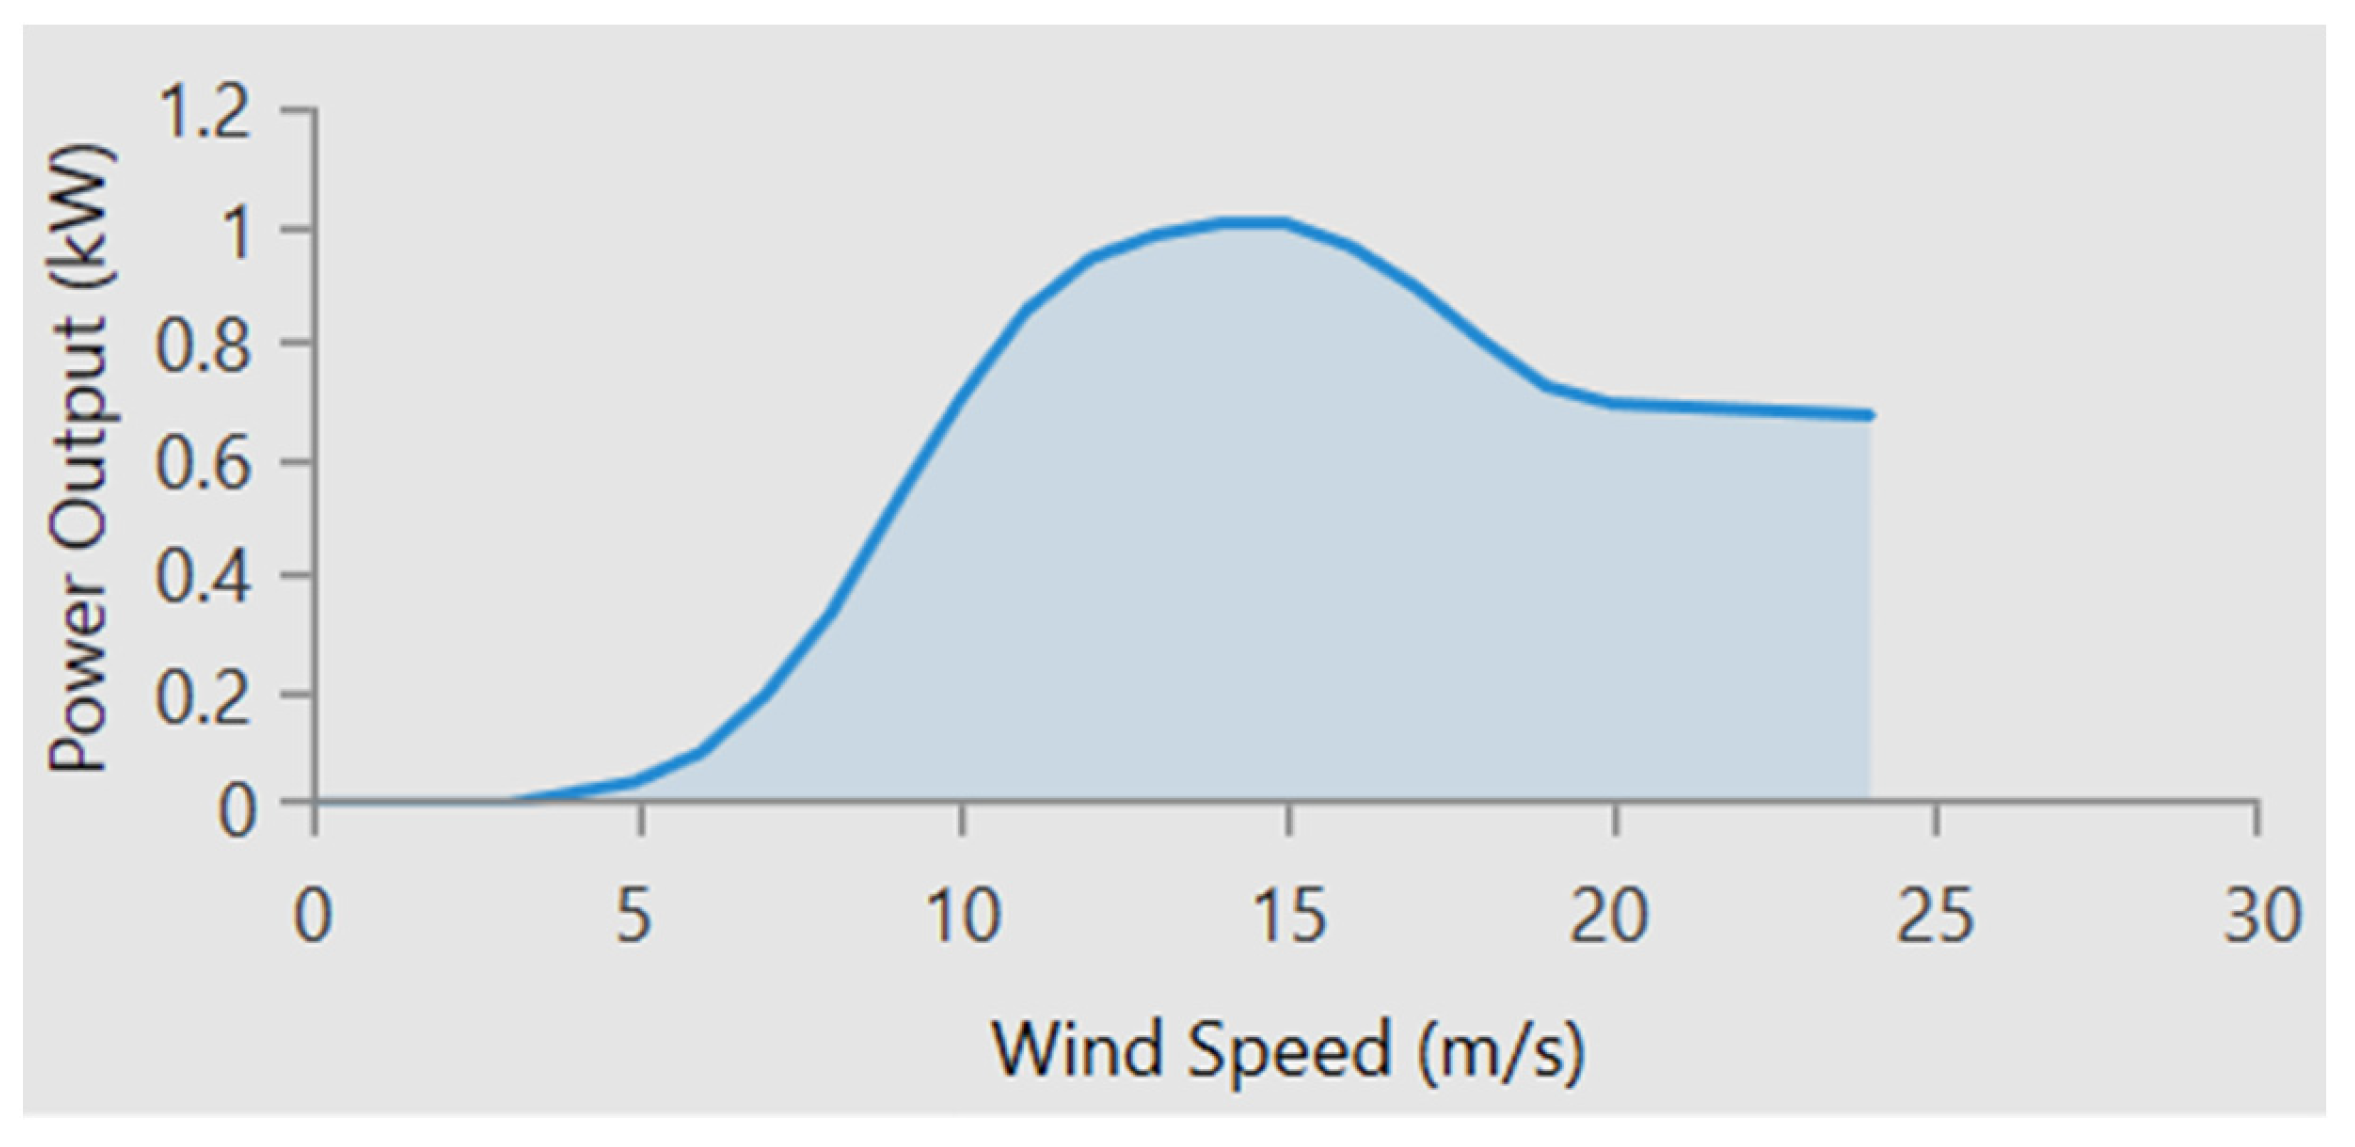
Figure 6.
Experimental design and scenarios.

Figure 7.
Sensitivity analysis for scenarios without grid exchange.
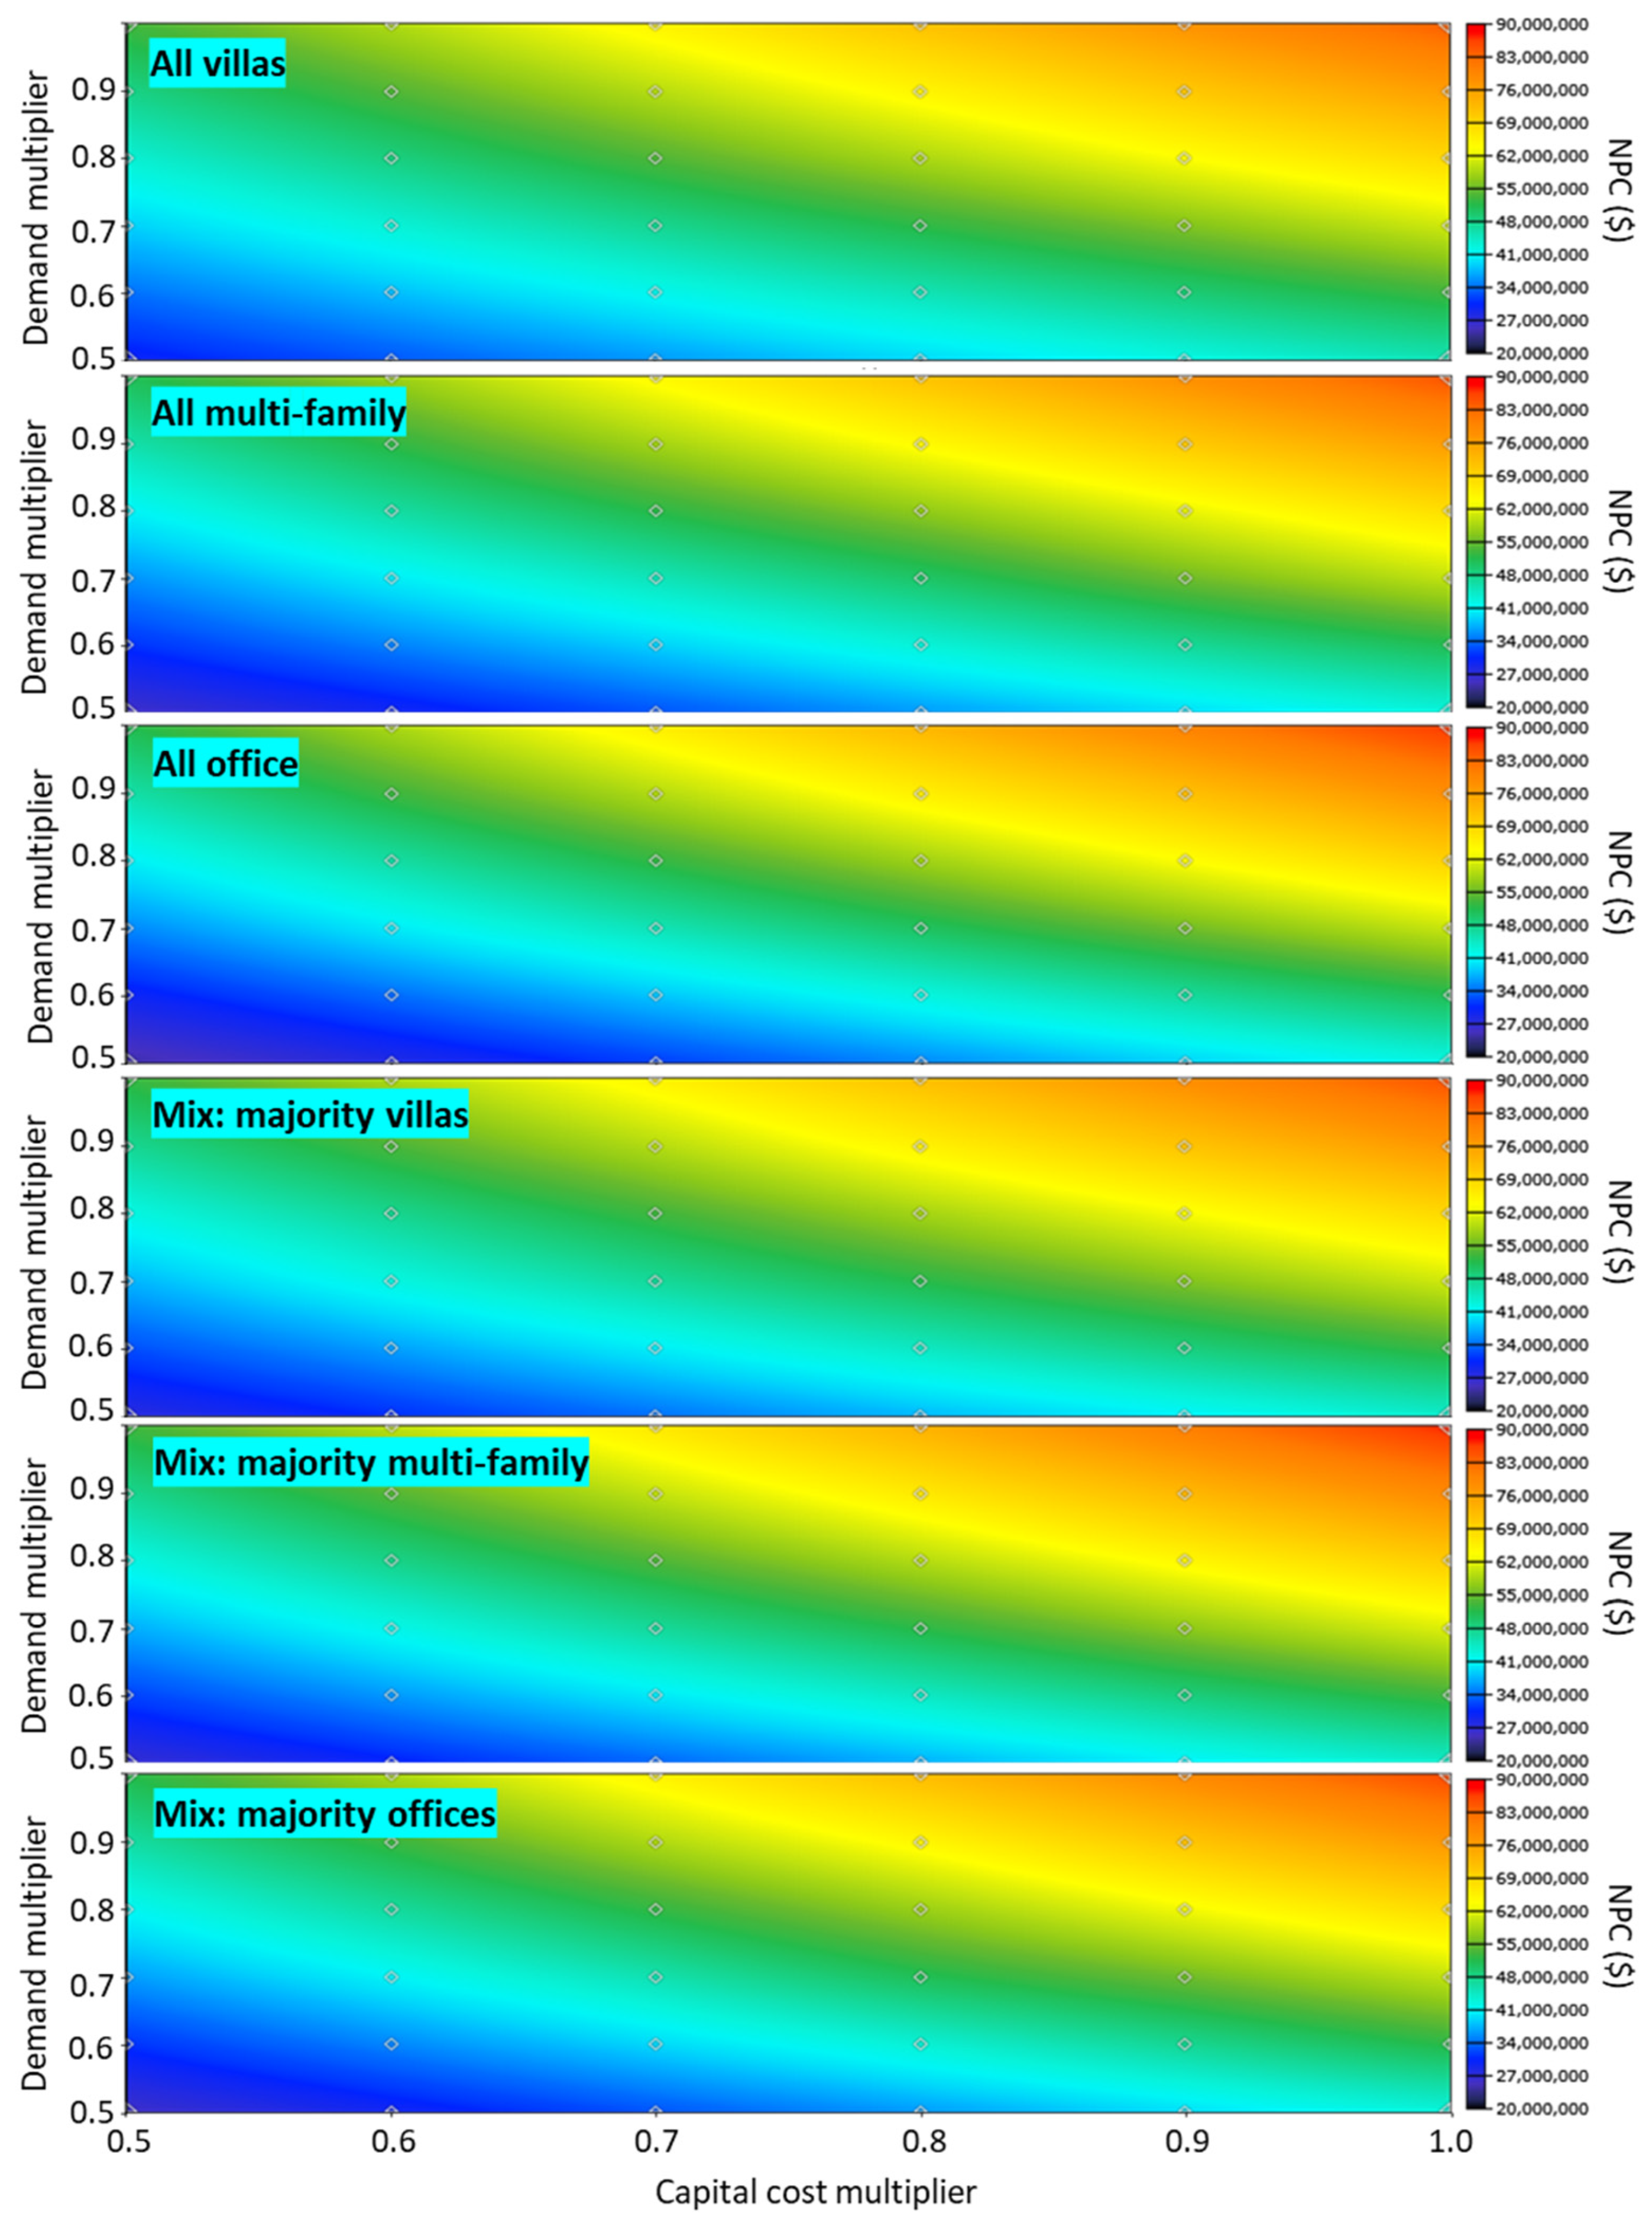
Figure 8.
NPC optimization results as a function of the renewable energy fraction.
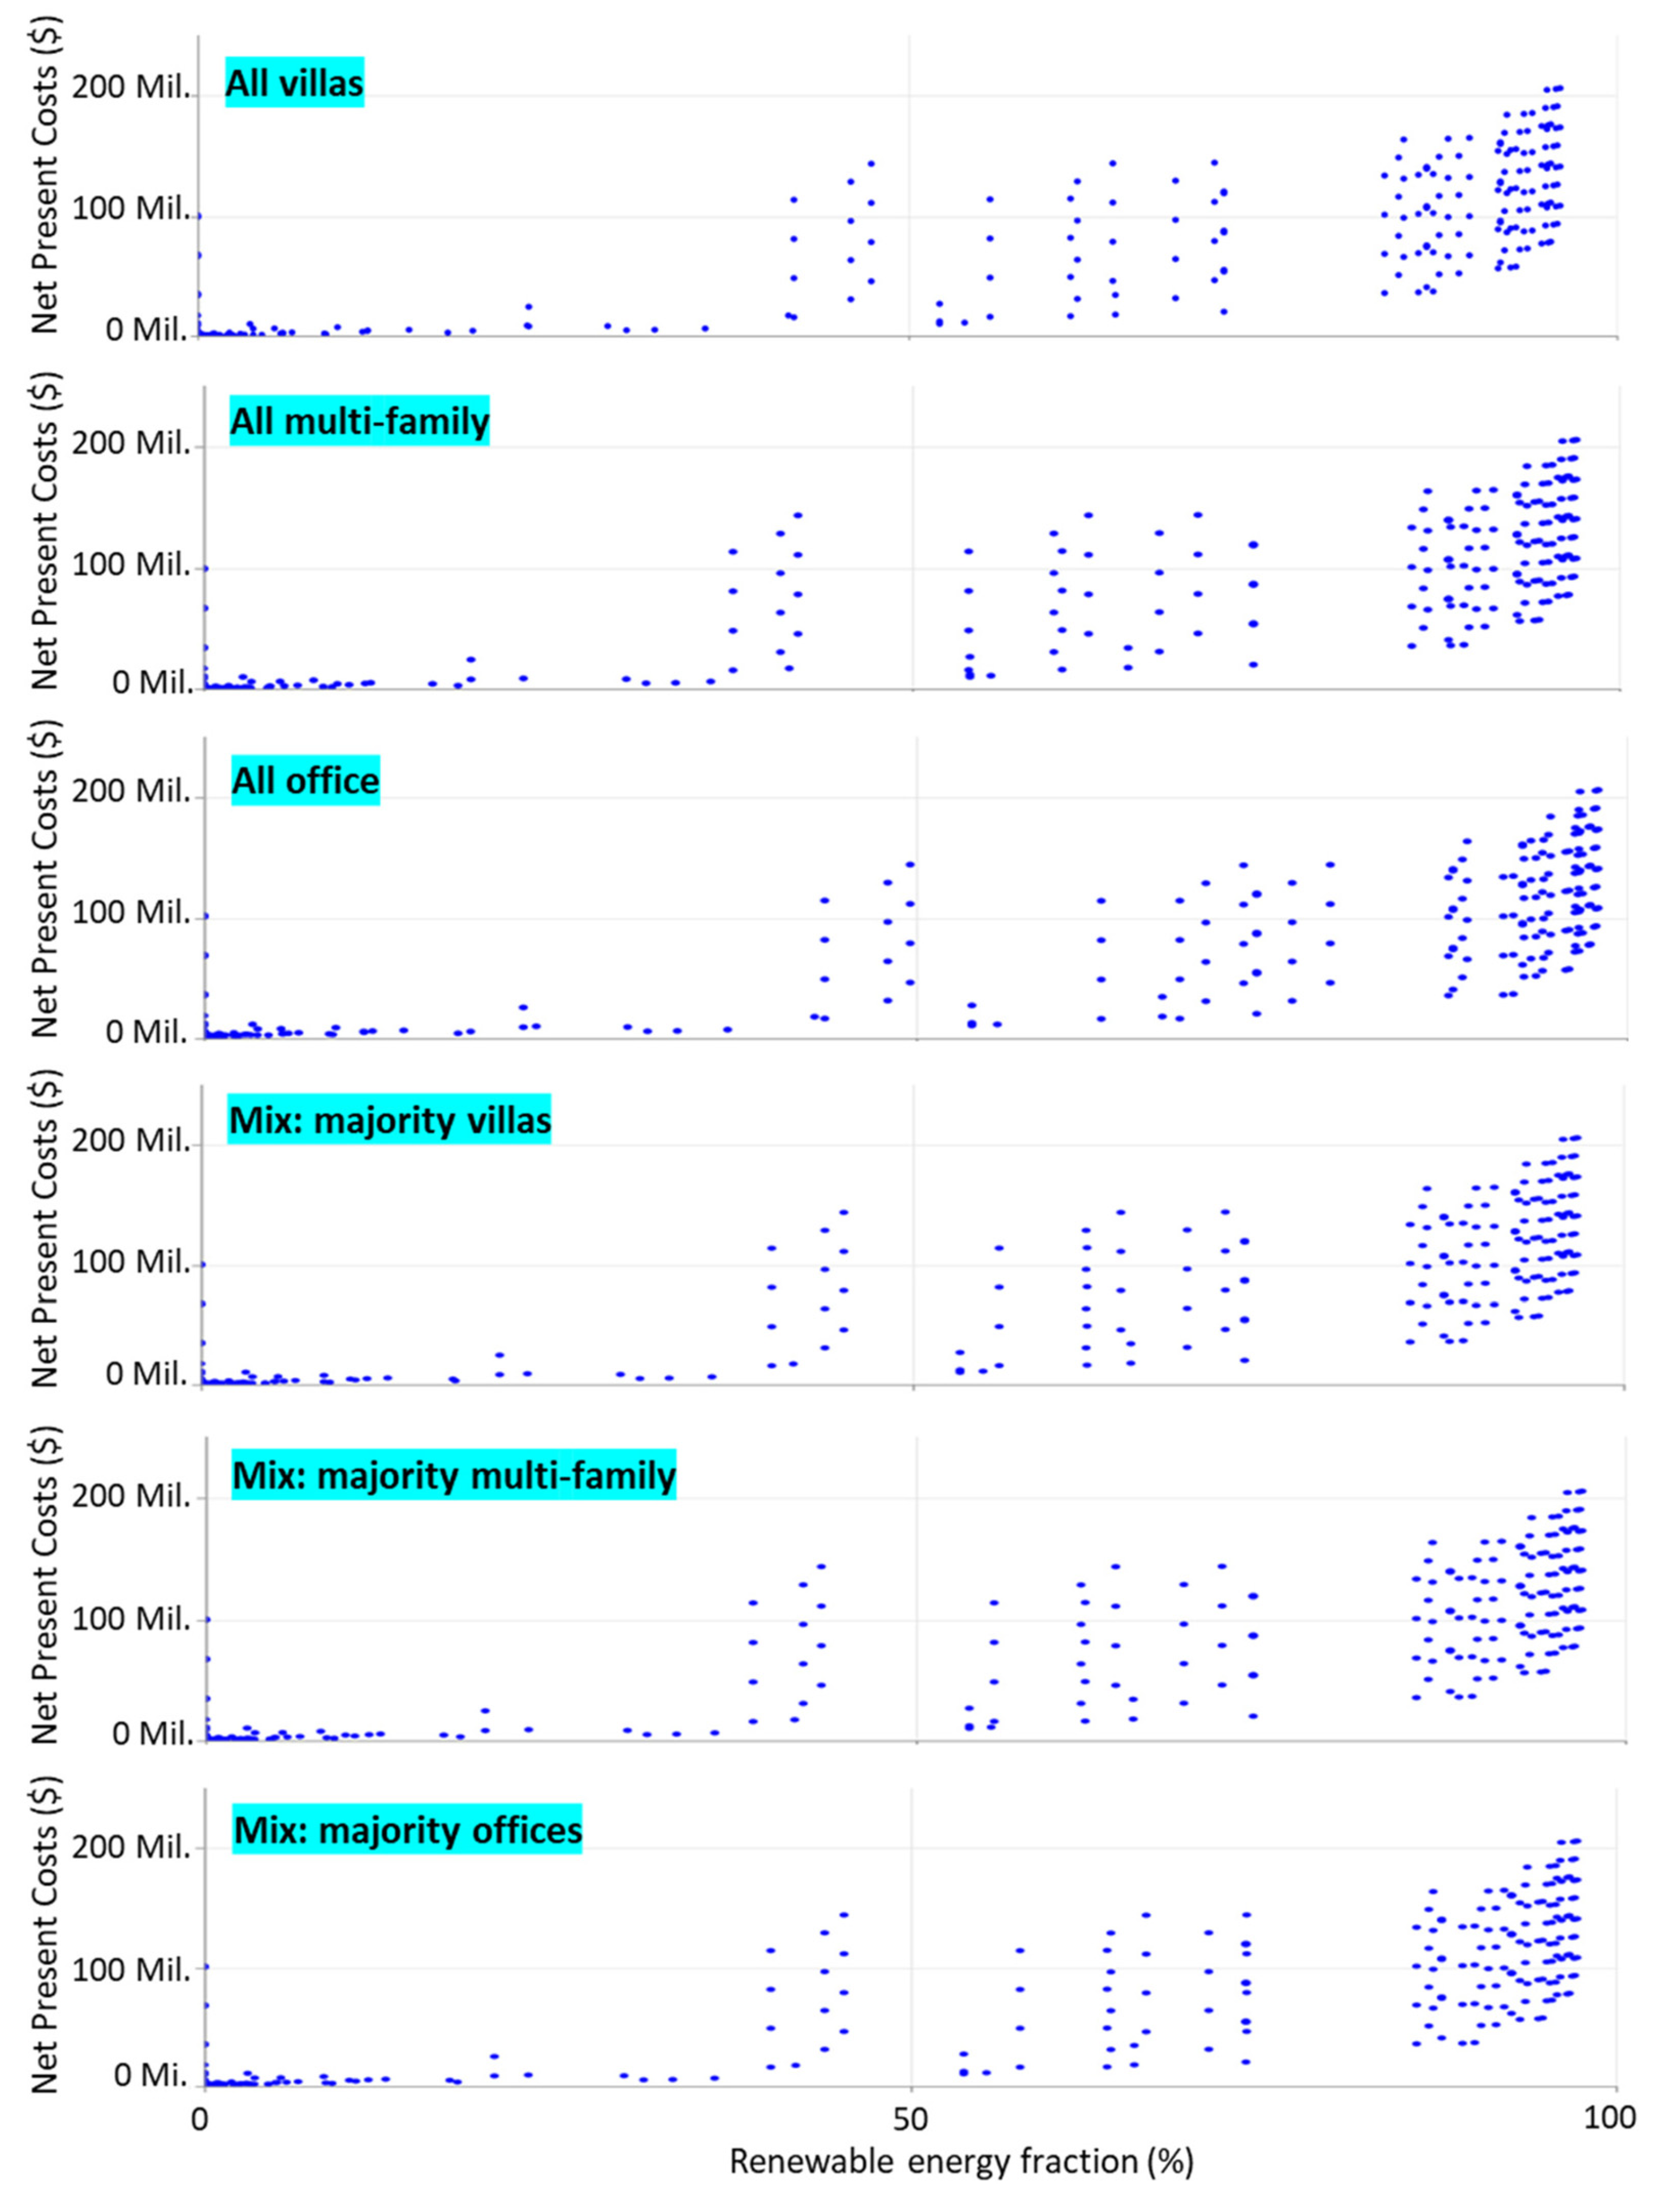
Figure 9.
Optimal energy sources as a function of capital costs and electricity prices.
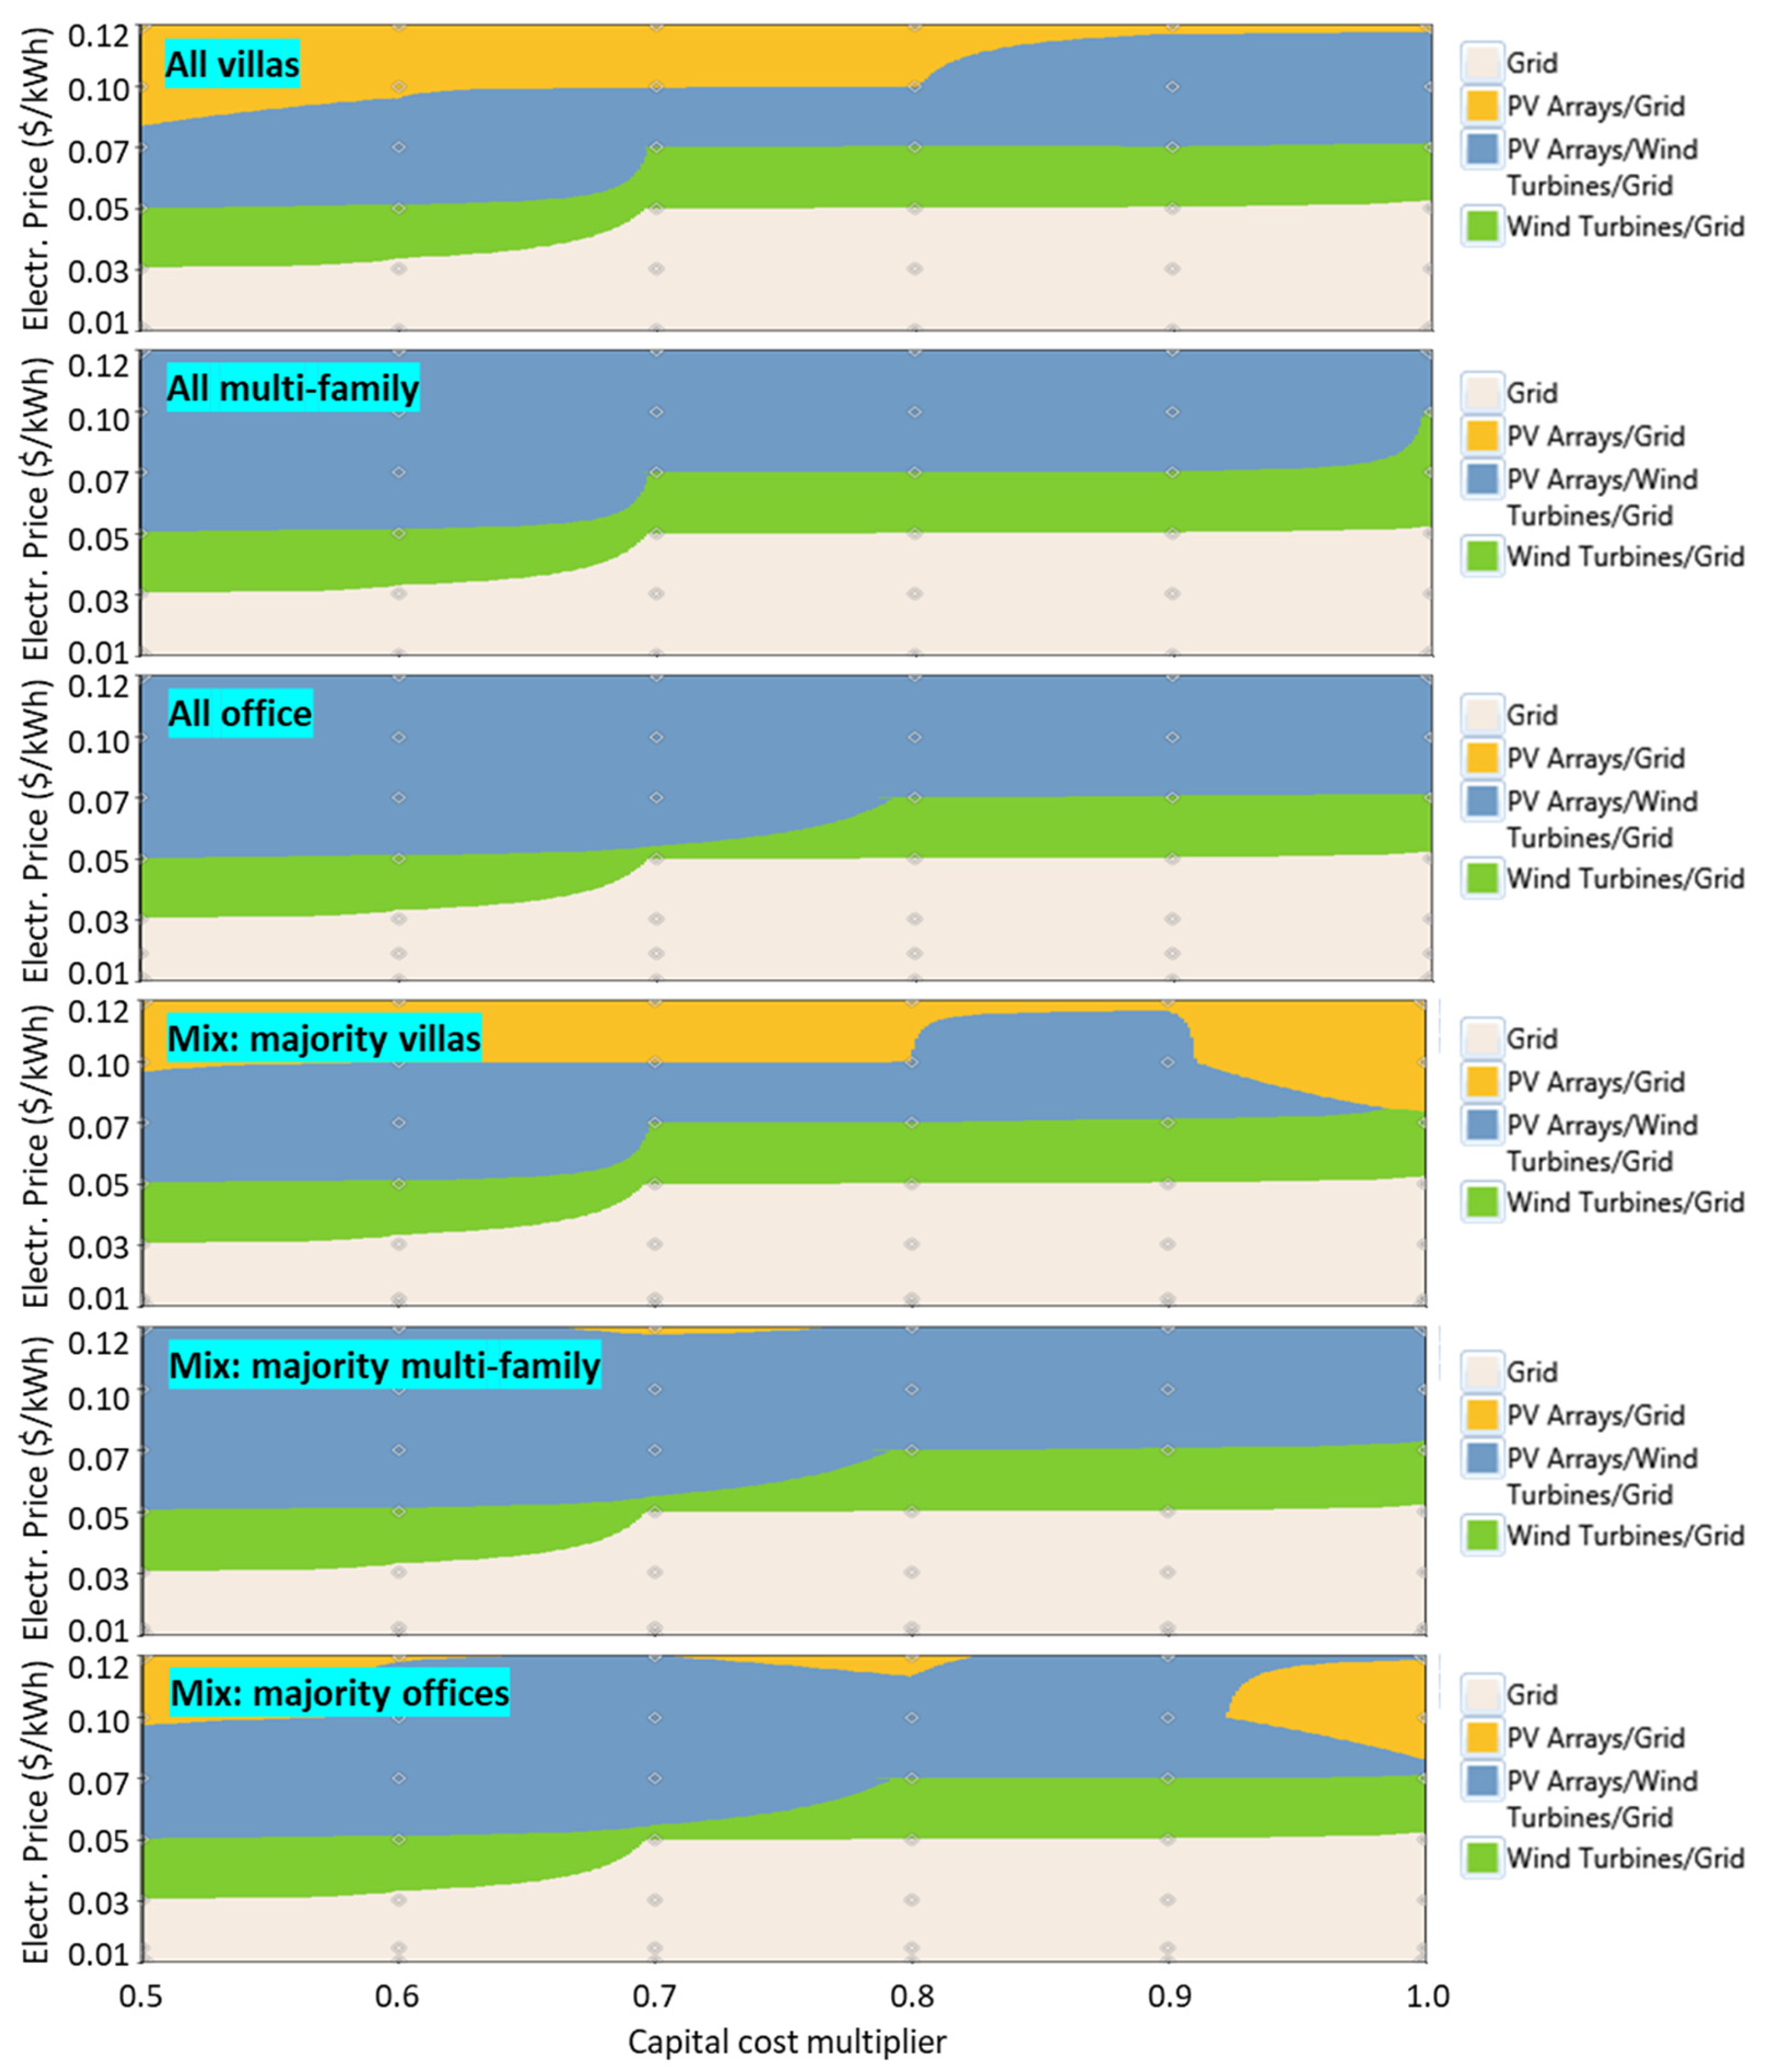
Figure 10.
NPC optimization results for unsubsidized electricity tariffs as a function of the renewable energy fraction.
Figure 10.
NPC optimization results for unsubsidized electricity tariffs as a function of the renewable energy fraction.

Table 1.
Summary of primary parameters surveyed, adapted from [23] with permissions from Elsevier, 2023.
Table 1.
Summary of primary parameters surveyed, adapted from [23] with permissions from Elsevier, 2023.
| Parameter | Range of Values |
|---|---|
| Building type | Commercial, residential (single-family), residential (multi-family) |
| Location | District name (total of 26) |
| Plot area | Numerical (m2) |
| Built-up area | Numerical (m2) |
| Number of floors | Numerical |
| Construction year | Numerical |
| Air conditioning system type | Chiller, Package, Split, Split and package |
| Building schedule | Descriptive |
| Electrical use intensity | Numerical (kWh/m2/year) |
Table 2.
Urban configurations.
| Configurations | Share of Energy Demand (# of Buildings) | ||
|---|---|---|---|
| Villas | Multi-Family | Offices | |
| All villas | 100% (186) | 0% (0) | 0% (0) |
| All multi-family | 0% (0) | 100% (13) | 0% (0) |
| All office | 0% (0) | 0% (0) | 100% (4) |
| Mix: majority villa | 50% (93) | 25% (3) | 25% (1) |
| Mix: majority multi-family | 25% (47) | 50% (6) | 25% (1) |
| Mix: majority offices | 25% (47) | 25% (3) | 50% (2) |
Table 3.
Cost assumptions for energy systems, obtained from [37].
Table 3.
Cost assumptions for energy systems, obtained from [37].
| Parameters | Generic Solar PV Panel | Generic Wind Turbine | Generic Li-Ion Battery |
|---|---|---|---|
| Capital Costs ($/kW) | 1327.00 | 1718.00 | 1316.00 |
| Operation and Maintenance ($/kW) | 15.97 | 27.57 | 25.96 |
| Lifetime (years) | 25 | 25 | 12.5 |
Table 4.
Optimal techno-economic configurations for scenarios without grid exchange.
| Metric | All Villas | All Muti-Family | All Office | Mix: Majority Villas | Mix: Majority Multi-Family | Mix: Majority Offices |
|---|---|---|---|---|---|---|
| PV capacity (kW) | 15,326 | 14,480 | 16,856 | 19,378 | 13,326 | 14,738 |
| Wind capacity (kW) | 4427 | 4577 | 3556 | 10,794 | 4177 | 3388 |
| Battery capacity (kW) | 27,010 | 18,033 | 14,725 | 23,269 | 20,034 | 22,220 |
| NPC (Mil. $) | 113.6 | 86.6 | 79.0 | 123.6 | 89.6 | 96.3 |
| LCOE ($/kWh) | 0.600 | 0.458 | 0.416 | 0.659 | 0.474 | 0.510 |
| Benchmark NPC (grid-only) (Mil. $) | 1.3 | 1.3 | 3.2 | 1.8 | 1.8 | 2.2 |
| Benchmark LCOE (grid-only) ($/kWh) | 0.0065 | 0.0065 | 0.0164 | 0.0090 | 0.0090 | 0.0115 |
Disclaimer/Publisher’s Note: The statements, opinions and data contained in all publications are solely those of the individual author(s) and contributor(s) and not of MDPI and/or the editor(s). MDPI and/or the editor(s) disclaim responsibility for any injury to people or property resulting from any ideas, methods, instructions or products referred to in the content. |
© 2023 by the authors. Licensee MDPI, Basel, Switzerland. This article is an open access article distributed under the terms and conditions of the Creative Commons Attribution (CC BY) license (https://creativecommons.org/licenses/by/4.0/).
Share and Cite
MDPI and ACS Style
Alaifan, B.; Azar, E. Potential for Net-Zero Energy Communities in Kuwait: An Empirical Techno-Economic Modeling and Optimization Approach. Buildings 2023, 13, 2096. https://doi.org/10.3390/buildings13082096
AMA Style
Alaifan B, Azar E. Potential for Net-Zero Energy Communities in Kuwait: An Empirical Techno-Economic Modeling and Optimization Approach. Buildings. 2023; 13(8):2096. https://doi.org/10.3390/buildings13082096
Chicago/Turabian StyleAlaifan, Bader, and Elie Azar. 2023. "Potential for Net-Zero Energy Communities in Kuwait: An Empirical Techno-Economic Modeling and Optimization Approach" Buildings 13, no. 8: 2096. https://doi.org/10.3390/buildings13082096
Note that from the first issue of 2016, this journal uses article numbers instead of page numbers. See further details here.