1. Introduction
A strong specific objective of both the currently in-force Energy Performance of Buildings Directive (EPBD) [
1] and the EPBD recast proposal [
2] is to increase the rate and extent of building renovations. In Europe, the annual renovation rate is currently 1%, of which 0.2% is deep renovation (with primary energy savings beyond 60%). To achieve the targets for 2030, it is required to double the actual rate to 2%, and from some estimations, to increase the annual renovation rate to 3%, with deep renovations accounting for 70% of the total [
3].
The building sector is a priority within the European Union, with significant funds allocated to achieving the climate targets, such as the regional funds under the Cohesion Policy, Just Transition Fund, and Invest EU, and with new funds under development, such as the new ETS’s Social Climate Fund [
2].
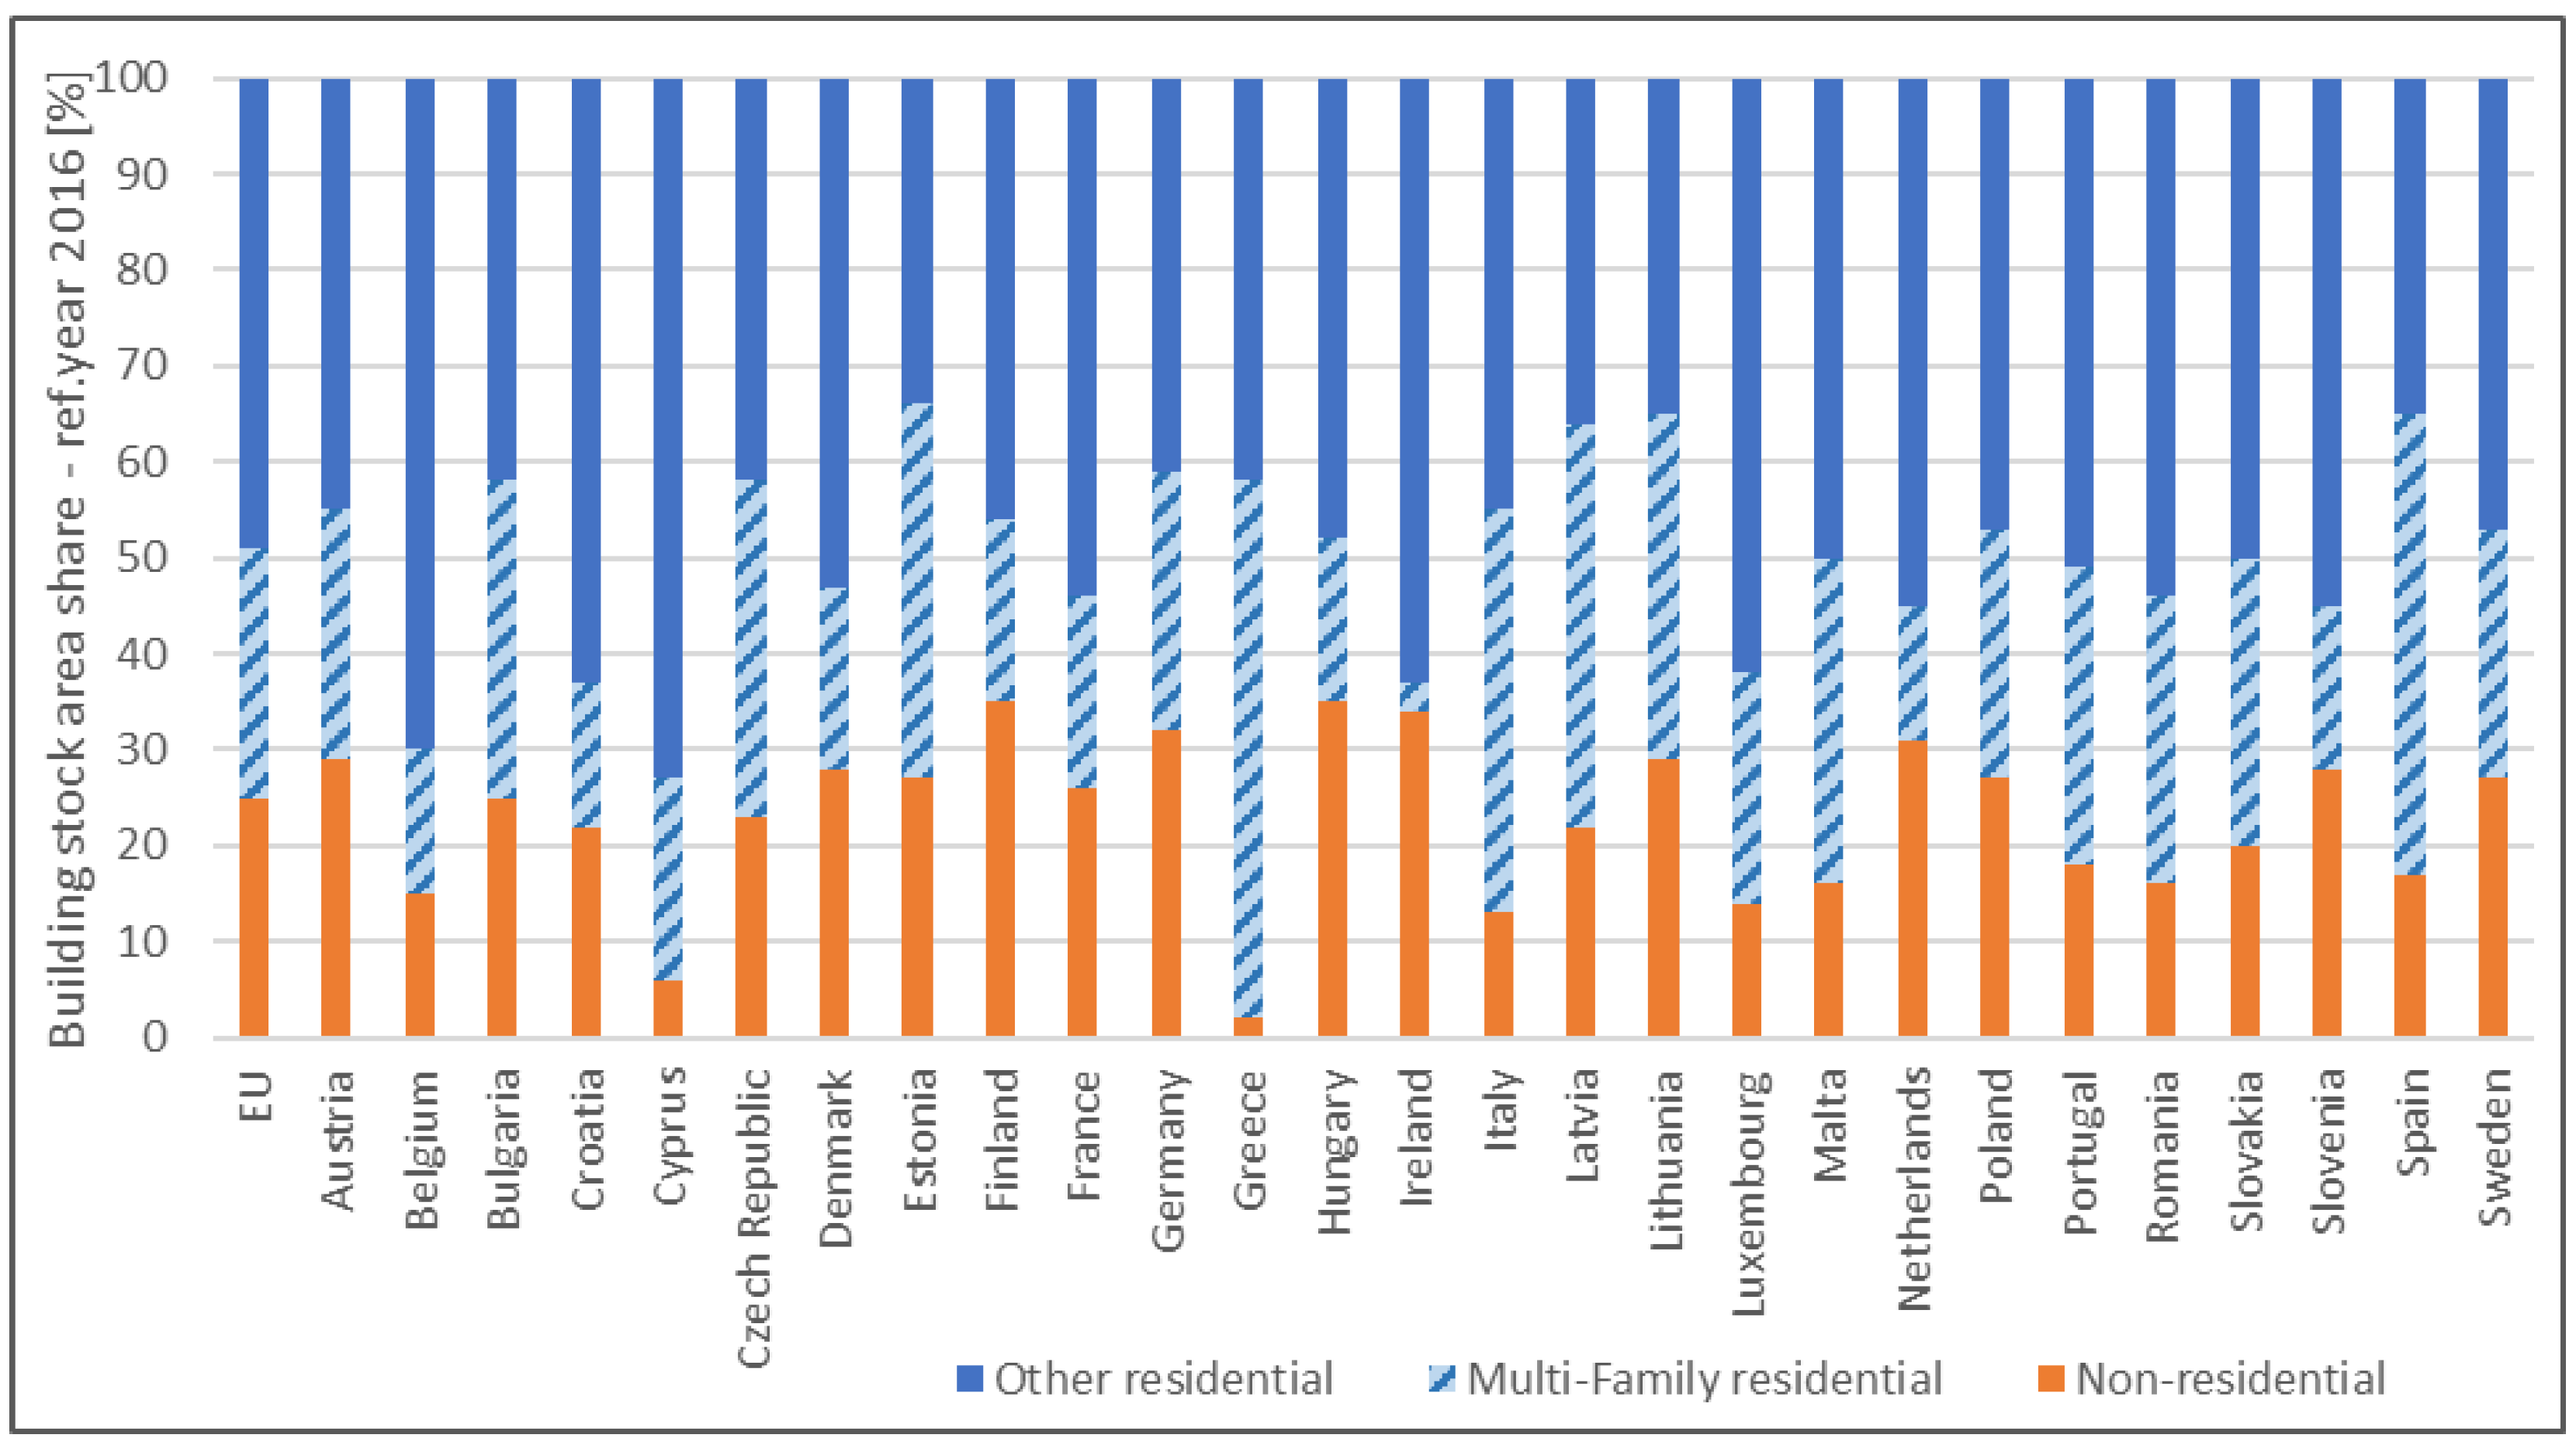
Considering the significant share of multifamily houses (MFHs) of the total existing building stock in the EU (
Figure 1; primary data extracted from [
4]), it is highlighted that the mass renovation of this sector should be carefully undertaken.
Furthermore, considering the considerable efforts and resources allocated to the renovation of the existing building stock, it is important to undertake appropriate renovations from a technical perspective.
Currently, in Europe, the renovation of apartment buildings mostly focuses on the thermal insulation of the building envelopes and on the increasing levels of airtightness, which is commonly carried out by replacing existing windows, with a limited focus on the ventilation of the building after the airtightness increases and on the replacement of the equipment for heating, domestic hot water (DHW), and cooling [
5,
6,
7,
8]. This practice leads to superficial (with primary energy savings of up to 30%) and, occasionally, moderate renovations (with primary energy savings between 30% and 60%).
Energy efficiency practices in buildings refer to passive or active measures. Passive measures contribute by reducing the energy demand (with the increased use of natural potentials for heating, cooling, and lighting), for example through the thermal insulation of the building envelope, using shadow systems or replacing the windows with ones with very specific characteristics. Active measures refer to the use of energy-efficient HVAC systems and lighting and the use of renewable energy sources.
Cholewa et al. [
5] collected operational energy data from 11 renovated multifamily buildings in Poland over several heating seasons. The renovations consisted of the addition of thermal insulation to the external walls (12–14 cm foam polystyrene) and the roof (12–16 cm blown-fiber materials). The hydraulic rebalancing of the heating systems was considered as well; however, any other measures were excluded.
Ibanez Iralde et al. [
6] provided an extended analysis of the current state of the art for the energy retrofit of residential buildings in Spain, considering 27 retrofitting action references. The most common solutions are related to façade insulation, roof insulation, the replacement of windows, measures related to heating and DHW systems, and lighting replacements. Ventilation systems made up 33% and natural ventilation devices made up 7.4% of the 27 references.
Arbulu et al. [
7] developed a toolkit for residential building renovations using a life-cycle approach, which considers the integration of passive, active, and renewable energy source (RES) solutions. High importance was given to the passive solutions (thermal insulation), and limited focus was on the active and RES solutions, without any mention of natural or mechanical ventilation within the renovation process.
In the study undertaken by Pennell et al. [
8], assessing 7328 multifamily buildings located in New York City, USA, lighting improvements were the most popular solution to increase the energy efficiency of the buildings (over 85.1% of cases), followed by measures related to DHW and HVAC (over 43.1% of cases) and building envelope solutions (over 41.9%). However, this is not the common practice in Europe.
The indoor air quality (IAQ) is an essential factor affecting the health and comfort of the occupants of a building [
9,
10,
11,
12] and the occupants’ behavior [
13]. Saidin et al. [
9] identified that the indoor concentrations of PM
2.5 and CO
2 significantly contribute to the total hazard ratio and that the ventilation system significantly affects the indoor air quality, using a case study of six bank offices located in Malaysia. Alzahrani et al. [
10] assessed the impact of the IAQ parameters (relative humidity (RH), ventilation rates, and carbon dioxide) on teachers’ performance in Saudi Arabia and used an artificial neural network (ANN) to predict the relationship between performance and IAQ. In one study [
11], three indoor air pollutants (PM
2.5, CO
2, and CO) were measured in six public health centers, and identified that ventilation is a key measure to improve the IAQ. Another study [
12] monitored several volatile compounds (VOCs)—o-xylene (ppm), acetaldehyde (ppm), 1,3 butadiene (ppm), 2-butoxietanol (ppm), n,n-dimethyl acetamide (ppm), 1,1-dichloroethene (ppm)—and other indoor air parameters (CO
2 (ppm), CO (ppm), T (°C), and RH (%)) in three residential buildings (kitchens and bedrooms), and it was identified that the indoor air parameters were within the admissible limits, except CO
2, for which the level exceeded up to three times the allowed limit. Thus, it is emphasized that measurements of CO
2 are relevant in indoor air quality assessments.
The influence of different ventilation levels on indoor air quality and energy savings were studied in a single-family house in Sweden [
14]. CO
2, relative humidity, and temperature, as indicators of IAQ, were measured, in order to determine the appropriate ventilation rates.
From the medical perspective, studies have confirmed a correlation between increased indoor CO
2 levels and their influence on the human behavior and performance. In [
15], the direct effects of increased CO
2 indoor concentrations were assessed on humans’ decision-making, indicating moderate and statistically significant decrements of decision-making performance relative to 1000 ppm CO
2 exposure, compared with 600 ppm CO
2 exposure, and large and statistically significant decrements on 2500 ppm CO
2 exposure. Percentile ranks for some performance metrics decreased to levels associated with dysfunctional performance. It has previously been shown that human well-being and the capacity to concentrate decrease when CO
2 concentrations increase up to 3000 ppm [
16].
Further research has revealed a correlation between sick building syndrome (SBS) and CO
2 levels. In [
17], CO
2 was identified as one of the factors that significantly influence the SBS complaints for 101 libraries workers in Malaysia, in addition to pollutants, RH, temperature, and bacteria. In total, 100 buildings datasets were analyzed in the USA, using the Building Assessment Survey and Evaluation (BASE); the results indicated statistically significant associations between elevated indoor CO
2 levels and increases in certain SBS symptoms [
18].
However, IAQ has been less studied when considering the post-evaluation of mass renovation for multifamily buildings, currently being intensively measured and monitored for the non-residential sector [
19,
20,
21,
22,
23]. Within a relevant study [
19], the air quality of a renovated office building in Manchester was monitored for two weeks, along with an assessment of the impact of sick building syndrome (SBS). CO
2 level, air exchange, and air velocity measurements were undertaken to identify whether the reactivated natural ventilation function of a renovated historical university building (Architecture Hall) was successful within the renovation process; it was found that it was not [
20,
23]. In [
21], CO
2 levels were monitored for a renovated school, located in the Czech Republic; it was found that the renovated classroom had a significantly high concentration of CO
2 after renovation (up to 1981 ppm), due to inadequate ventilation. In [
22], several indoor environmental parameters of a historical building located on a university campus in Košice, Slovakia, were monitored. Correlations between the measured environmental parameters and the subjective evaluation of SBS through questionnaires were addressed.
The residential function of buildings, as well as their private ownership, are factors that make undertaking this type of study difficult, due to a certain reluctance of the occupants.
Limited studies are available, however. Coggins et al. [
24] monitored 14 dwellings, deep retrofitted between 2018 and 2020, mostly detached and semi-detached houses, located across Ireland, with measurements of CO
2 levels and other indoor air parameters (IAPs), although for a very limited period of 48 h. Median CO
2 concentrations of 680 ppm and 540 ppm were detected in the 14 bedrooms in the 14 living rooms that were surveyed, respectively.
Within this study, the characterization of IAQ was performed through the measurement of indoor carbon dioxide concentrations, indoor temperature, and relative humidity, as three main parameters that define IAQ [
12].
The main purpose of the study was to analyze the CO2 level in a real environment (apartments in renovated multifamily buildings in which families live, under normal conditions), for a period of 4.5 months, during the heating season. The indoor sensors were located in different rooms of the apartments (mostly in the bedrooms and in the living rooms).
The renovation of the monitored buildings represents the common current practice of multifamily building renovation in Romania.
2. Materials and Methods
During the winter season 2022–2023, between 8 November 2022 and 20 March 2023, monitoring was performed for 16 apartments, located in five different apartment buildings, which had been renovated between 2019 and 2022, under the multiannual Romanian national program on increasing the energy performance of residential multifamily buildings. The buildings were in Zalău Municipality, Romania, which is located in climatic zone III, according to the Romanian calculation methodology of energy performance of buildings [
25], and in continental climate Dfb, according to the Köppen–Geiger climate classification.
The buildings were built between 1971 and 1985 and represent common multifamily buildings, built under the communist regime in Eastern Europe (
Figure 2), with the main intention of use as family apartments. The total number of apartments within the five monitored buildings was 134. In
Table 1, general characteristics of the monitored multifamily buildings are detailed.
The technical documentation used within the renovation was available through the Municipality of Zalău, including the energy audits of the buildings and the technical projects.
All monitored apartments were private property, predominantly owned by the families who lived in them, and rented in two cases.
The implemented renovation measures were closely directed through the national funding program guidelines, and mostly refer to the thermal insulation of the building envelope, without any solutions for heating, DHW, cooling, and lighting equipment replacements inside the apartments. Therefore, the measures consisted of thermal insulation of the building’s envelope elements, comprising 15 cm of fire-retardant expanded polystyrene (EPS) on the external walls, bordered with 60 cm continuous strips of mineral wool in front of the level slabs, 6 cm extruded polystyrene (XPS) to the base, 20 cm of fire-retardant EPS to the floor above the last level, and 10 cm of fire-retardant EPS to the floor over unheated basements. Window replacements were also considered. Provisions for the energy performance of windows were related to the maximum thermal transmittance, Uw = max 1.3 W/m2K, and for the window frames to be equipped with humidity-controlled ventilation openings.
Regarding other measures, some lighting fixtures were replaced with LED technology, but only in the communal spaces of the buildings, and only in two from the five monitored MFHs.
However, in none of the monitored buildings were ventilation measures implemented, because every family in a multifamily building independently decides whether windows should be replaced or not (most had been changed them in recent years prior to the renovation). Even for those who had replaced the windows during the building renovation, the new windows did not feature humidity-controlled ventilation openings.
The average values for the thermal transmittances of the buildings’ envelope elements, considering the thermal bridges effect, are centralized in
Figure 3.
Regarding the heating, ventilation, air conditioning (HVAC) equipment, all the monitored apartments were equipped with individual wall boilers, mounted in the period 2000–2022 (43.75% between 2000 and 2002; 12.5% between 2003 and 2019; 31.25% between 2020 and 2022; and for 12.5%, data were not available), used to provide heating and domestic hot water. Additionally, only 12.5% of the monitored apartments were equipped with air conditioning units, used for cooling. It is emphasized the high percentage of heating equipment within the households was more than 20 years old, and the lack of measures related to replacing HVAC equipment within the renovation was demonstrable.
The ventilation of these buildings was initially designed to be natural, with forced draughts in ventilation columns. However, within the energy audits, no specific measures were provided to ensure its long-term functionality; thus, it can be considered that, over time, the ventilation mostly consisted of unorganized natural ventilation (i.e., opening windows).
The measurements were undertaken with data from five Netatmo weather stations located in each monitored building, each comprising an indoor module and an outdoor module; two or three additional indoor modules were added, to monitor three or four apartments in each building. The general characteristics of the weather station modules are detailed in
Table 2.
The Netatmo weather systems were composed of 1 indoor module (station) and 1 outdoor module, with 3 additional indoor modules attached to the main station. The modules were stand-alone and fitted discreetly in the analyzed homes, with high acceptance from the owners. Netatmo Smart Home Weather Stations feature a combination of measurement sensors covering temperature, air pressure, humidity, and CO₂ concentration, which are automatically logged every 5 min into a Netatmo account over Wi-Fi 802.11 b/g/n (2.4 GHz), using a home internet router and wireless connection (radio) between modules.
The measured indoor parameters were temperature, relative humidity and CO
2 level; the measured outdoor parameters were temperature and relative humidity. The characteristics of the weather stations are detailed in
Table 2. Every indoor module recorded a median value of 37,704 values for each measured parameter, during the period from 8 November 2022 to 20 March 2023.
Table 3 presents the location of the modules in each apartment, and the number of occupants in each household.
Additionally, a survey of the household representatives was undertaken, for each monitored apartment.
3. Results and Discussion
The measured indoor parameters were temperature, relative humidity, and CO2 level; the measured outdoor parameters were temperature and relative humidity. For the indoor modules of the weather stations (the sources) extra parameters, including pressure and sound level, were recorded. The time intervals at which measurements were undertaken was five minutes throughout the whole monitoring period.
In the current study, special focus was given to the CO
2 level analysis, considering the microclimate perspective. In
Figure 4,
Figure 5 and
Figure 6, profiles of measured parameters are presented for several selected cases, i.e., different rooms, for the period from 8 November 2022 to 20 March 2023.
In
Figure 7,
Figure 8 and
Figure 9 the results of the measurements for CO
2 level, temperatures and relative humidity (three datasets for each of the 18 modules) are graphically presented, with the following interpretation for each dataset: the minimum value is on the bottom of the whisker/vertical line; the first quartile (Q1) is on the bottom of the box; the median value is on the horizontal line inside the box; the average value is on the “x” inside the box; the third quartile (Q3) is on the top of the box; and the maximum value is on the top of the whisker/vertical line. Considering the type of analyzed information, the outliers were neglected within the graphical representation. Over 2 million recorded values (3 × 18 × the median of 37,704 values for each measured parameter) are graphically represented within the three figures.
Following the analysis of the measurements recorded with the CO
2-level sensors, the results visualized in
Figure 10 and
Figure 11 were obtained. ΔCO
2 was calculated as the difference between each measured CO
2 value and the atmospheric CO
2 value, which was approximated to 415 ppm.
Thus, considering the whole monitoring period, it was found that for significant periods, the indoor air quality was above the threshold values for Indoor Environment Quality Category I (IEQcat I), as defined in EN16798-1 [
26]. For the bedrooms, the threshold ΔCO
2 concentration equals 380 ppm (above outdoors); for the living rooms, the ΔCO
2 concentration equals 550 ppm (above outdoors). For the bedrooms, the time fraction for which the threshold values were exceeded was significantly higher than for the living rooms. The median value of the time fraction which exceeded the IEQcat I threshold for adults’ bedrooms was 82.30%. For children’s bedrooms, it was 75.65%, whereas for living rooms, it was 58.78%.
Considering IEQcat IV, which corresponds to a lower comfort threshold, but no additional health risk, the values were as follows: for the bedrooms, the threshold ΔCO2 concentration equals 950 ppm (above outdoors); for the living rooms, the ΔCO2 concentration equals 1350 ppm (above outdoors). Notably, for the bedrooms, the time fraction for which the threshold values were exceeded was still significant (median values of 45.37% for the adults’ bedrooms and 50.14% for the children’s bedrooms). Basically, for almost half of the time, the bedrooms did not provide a health-safe indoor environment for the occupants, due to inadequate ventilation, with the measured indicators being above the health threshold values. For the living rooms, the median time fraction value, considering IEQcat IV, was 13.47%.
For the Z4-INT2 and Z4-INT1 modules, the lower values above the considered thresholds may be correlated with the atypical use of the apartments. In the apartment where module Z4-INT1 was located, there was a single occupant with an intensive working schedule, and the living room, where the module was located, was barely used (it had no furniture). In the apartment where module Z4-INT2 was located lived an elderly person, who was away from the residence for a key period during the monitoring (for four weeks from December 2022 to January 2023).
Module Z5-INT2 experienced some signal problems, because the bedroom where it was initially placed was screened by the walls of the apartment and the stairwell; as such, on January 10, 2023, it was moved to the kitchen, to be in greater proximity to the source module (Z5-Source).
Within the energy audits, solutions to ensure better ventilation were proposed, such as replacing the existing windows with more thermally efficient ones, equipped with controlled ventilation devices/slots within the frames. However, it was confirmed that the windows had largely been replaced over time by the owners of the apartments, in the years prior to the renovations; during the building renovations, this particular measure, although proposed within the energy audits, was not implemented as prescribed. Moreover, due to the conditions mentioned in this study, this is difficult to apply in practice.
Table 4 presents a summary of the measurements undertaken for the 16 apartments.
The survey undertaken in the study revealed that 93.75% of the household representatives perceived that the temperature in their home, during the last heating season, was comfortable. When considering the perception of the occupants under summer conditions, 75% perceived that the indoor temperature was comfortable, while 18.75% claimed that it was too hot. A fraction, 6.25%, did not answer, thus not disclosing their perceptions of either winter or summer conditions.
Therefore, this study reveals that the indoor comfort of occupants after the renovation of a building should be a crucial factor when is decided what type of solutions should be implemented in the renovation process. Other research results have confirmed that the installation of a suitable ventilation system is a key issue in the renovation of residential buildings [
27].
4. Conclusions
The indoor air quality within five renovated multifamily buildings (16 apartments) was monitored for 4.5 months, during the heating season 2022–2023, in Zalău, Romania. The analysis considered the function of the rooms within the apartment, with a focus on living rooms and bedrooms, separately for adults and for children.
Low indoor air quality was measured for long time periods, thus identifying the ventilation of the building as a key issue within the renovation process and, currently, not properly being addressed. A clear problem was identified in the bedrooms; for almost half of the time, the bedrooms did not exhibit acceptable CO2 concentrations for the occupants due to inadequate ventilation, exceeding the health threshold values recommended for a safe indoor environment.
The measured values of relative humidity and indoor air temperature were, generally, within the comfort range. Although the risk of discomfort due to dry air (respiratory membrane irritations, dry eyes, sore throats, etc.) was reduced, the high levels of relative humidity in some of the monitored dwellings could have increased the risk of condensation or mold growth on the building’s envelope internal surfaces with reduced temperatures (which is a result of insufficiently corrected thermal bridges in the application of insulation).
Regarding the mitigation of the identified problem of indoor comfort, some suggestions could be made, considering the case of already-renovated MFHs against the case of MFHs to be renovated.
For renovated buildings, informing tenants about the need to ensure natural ventilation in their homes, with suggestions for ventilation schedules relayed through the placement of notices on communal staircase in the block, for example, or information by other means, might be a solution to encourage proper occupant behavior. Natural ventilation has been identified as an effective solution to rapidly decrease indoor CO
2 concentrations [
28]; however, its effectiveness depends on outdoor conditions (in the case of advanced natural ventilation, e.g., cross- or stack-ventilation) or on occupants’ interventions (i.e., opening windows). However, there are some disadvantages, such as the cold drafts from inlets in cold periods leading to discomfort for the occupants, and heat from naturally exhausted air cannot be recovered to reduce heat demands and energy consumption during winter.
For apartment buildings that are to be renovated (in particular, in the case of deep energy renovations), the national funding guidelines must cover the provision of appropriate ventilation (either through organized natural ventilation, e.g., by ensuring that the evacuation shafts are functional, air circulation between internal spaces is ensured, and external windows are provided with humidity-controlled openings in the windows frames, or through mechanical ventilation with heat recovery), as an eligibility criterion, with the tracking of the effective implementation of ventilation solutions. This approach to effective solutions is appropriate, considering that these performance criteria may be requested by the funding authority, which, in most cases, is the public administration.
In all cases, installing a mechanical ventilation system with heat recovery (centralized or with local units) is the recommended solution in energy renovation projects because it not only ensures the healthy indoor environment criteria, but it also facilitate the achievement of deep energy renovation requirements (or maybe even the nearly Zero Energy Building criteria) by reducing heating/cooling demands through heat recovery.


