
Integrative Lighting in Classrooms: Preliminary Results from Simulations and Field Measurements

TEBE Research Group, Department of Energy ‘Galileo Ferraris’, Politecnico di Torino, 10129 Turin, Italy
*
Author to whom correspondence should be addressed.
Buildings 2023, 13(9), 2128; https://doi.org/10.3390/buildings13092128
Submission received: 27 July 2023
/
Revised: 17 August 2023
/
Accepted: 18 August 2023
/
Published: 22 August 2023
(This article belongs to the Special Issue Research on Daylight and Visual Comfort in Buildings and Cities)
Abstract
:The paper presents results from a study on integrative lighting in real middle school classrooms located in a school building in Turin, Italy. The contribution of both daylighting and electric lighting was considered. Besides the existing configuration of electric lighting systems (fluorescent luminaires), a set of six possible retrofitting solutions was considered, all using LED luminaires. The research addressed two main objectives: (i) To verify if the circadian values (melanopic equivalent daylight illuminance m-EDI) in the classrooms could meet the recommended values reported in recent literature, for instance, in the WELL protocol, (ii) to assess the influence on integrative lighting (photopic and melanopic illuminances) played by the electric lighting, as a function of the different lighting systems, and by daylighting, as a function of different room orientations and sky conditions. Results showed that the existing spaces benefit from high daylighting amount, whilst the existing lighting systems provide an insufficient m-EDI. Even when last-generation LED lighting systems were ideally used for retrofitting, no solution was able to meet the three-point WELL recommendation, while two solutions only allowed the one-point recommendation to be met. Some design implications concerned with the results were critically discussed.
1. Introduction
Over the past 25 years, research concerning the human responses to light has been largely expanded, and currently, there is strong scientific evidence that light is not only essential for vision, but it also affects the biological functioning of people and has an important impact on human health and performance [1,2]. Numerous studies have demonstrated that light also influences circadian rhythms, neuroendocrine functions, and neurobehavioral responses [3]. These types of responses have been defined as “non-visual” or “non-image-forming (NIF)” effects of light. Non-visual effects are mediated by signals from the retinal photoreceptors, i.e., from circuits of rods, cones, and intrinsically photosensitive retinal ganglion cells (ipRGCs). Particularly, ipRGCs are a type of photoreceptor cells on the retina, discovered in the mammalian eyes about two decades ago. These retinal photoreceptors are specialized ganglion cells that contain the photopigment “melanopsin” and are intrinsically sensitive to light spectrum [4,5]. Their peak sensitivity (approx. 460–480 nm [6,7]) occurs at a shorter wavelength compared to that of rods (at 507 nm) and cones (at 555 nm), suggesting the relevance of the spectral distribution as a factor that influences non-visual effects of light. Indeed, studies demonstrated that NIF effects depend on spectral power distribution, quantity, spatial distribution (directionality), the and duration of the light exposure, as well as on person-specific parameters such as circadian phases and history of light exposure [2,3,4,5,6,7,8].
Considering the relevant impact of non-visual response to light on human health and well-being, significant research has been carried out, which led to the proposition of new, dedicated circadian metrics to estimate and quantify the non-visual effects of light. Up-to-date, three main approaches have been proposed: (i) The ‘Circadian Stimulus’ (CS) model, (ii) the ‘Equivalent Melanopic Lux’ (EML), (iii) the ‘melanopic Equivalent Daylight Illuminance’ (m-EDI).
The ‘Circadian Stimulus’ model was proposed by Rea and Figueiro [9] and indicates the human response to light in terms of the percentage of melatonin suppression. CS is defined as the calculated effectiveness of the spectrally weighted irradiance at the cornea from threshold (CS = 0.1) to saturation (CS = 0.7), assuming a fixed duration of exposure of 1 h [10]. According to indications provided by Figueiro et al. [11], a CS value of 0.3 or greater at the eye during the morning is suitable for the promotion of good circadian entrainment. The target threshold values are reduced to a maximum of 0.2 in the evening and a maximum of 0.1 during the night [12].
The ‘Equivalent Melanopic Lux’ (EML) is based on the spectral sensitivity of the melanopsin photoreception of ipRGCs with reference to the illuminant E (i.e., an equal-energy illuminant) and is based on studies conducted by Lucas et al. [13] and Enezi et al. [14].
The ‘melanopic Equivalent Daylight Illuminance’ (melanopic EDI or m-EDI) is an SI-compliant ‘alfa-opic’ metric defined as illuminance produced by radiation conforming to standard daylight (D65 illuminant) that provides an equal ‘alfa-opic’ irradiance as the test source. The m-EDI was recently defined by CIE in its International Standard CIE S 026:2018 [15] to supplement the EML, which did not provide an SI unit for calculating lux. As daylighting is the most natural ‘circadian’ light, it was assumed as a reference for the definition of m-EDI, unlike EML, which refers to an equal-energy spectral power distribution. The EML and m-EDI metrics are thereby correlated through the expression: m-EDI = 0.9058 × EML. Other than the m-EDI, the CIE S 026:2018 defined the spectral sensitivity functions, quantities, and metrics to describe the ability of optical radiation to stimulate each of the five photoreceptor types that can contribute to retina-mediated non-visual effects of light in humans. Indications from the second independent expert symposium organized by the CIE in Manchester in 2019 suggested some recommended threshold values, such as at least 250 lx m-EDI throughout the daytime, a maximum of 10 lx three hours before bedtime and a maximum of 1 lx during the night [16,17].
The reported framework shows that currently no consensus on non-visual quantification has been reached in the lighting community, and no quantitative requirements adopted in a shared international standard have been defined. However, it is equally clear that the issue of health and well-being in the built environment is becoming increasingly important [18] and that light is one of the key physical factors of indoor environmental quality (along with air quality, ventilation, thermal health, moisture, noise, water quality, dust and pests, safety, and security) [19] that strongly influence occupants’ health, well-being, and perception of built spaces. In this frame, some studies have issued recommendations to promote the design of residential buildings [20], offices [21], schools [22] or factories [23], to support the definition of strategies able to respond to multiple physical, physiological, and psychological needs of occupants.
On the topic, one of the main references is the International WELL Building Institute (WELL) [24], which proposes a comprehensive approach based on a points-based system organized in Concepts (Air, Water, Nourishment, Light, Movement, Thermal Comfort, Sound, Materials, Mind, Community) and Features with distinct health intents, aimed at supporting the definition of design strategies devoted to prioritizing health and well-being of users. ‘Light’ is one of the concepts covered in the WELL Standard, both in terms of visual and circadian systems. Lighting guidelines are provided to provide appropriate photopic and melanopic light levels, to minimize disruption to the body’s circadian system, and support good sleep quality.
The awareness about the non-visual effects of lighting plays an important role in all building types, both residential and non-residential, and a new expression, ‘integrative light’, was introduced within the CIE [25,26] to combine the photopic and melanopic effects on performance, health, and comfort of the occupants of indoor spaces. In fact, it is well known nowadays that within a well-conceived lighting design, both visual and non-visual effects of light should be mutually considered, and the study of the interaction between light and architecture is fundamental to designing comfortable spaces [27,28].
Integrative lighting is particularly crucial in educational buildings, as it strongly affects the learning process along with the physiological growth of young pupils in lower education levels [29]. Regarding the Italian context, the educational building sector has become particularly strategic in terms of architecture interventions over the last decade through increasing funds for optimizing the building energy performance, as well as the comfort and health conditions for teachers and students. Previous studies demonstrated the significant impact of electric lighting and daylight on visual comfort and on the positive predisposition to learn in educational areas [30,31]. Other studies were focused on the evaluation of both visual and non-visual effects of light to stimulate a design approach that also promotes good circadian rhythm for students. Acosta et al. in 2019 [32] quantified circadian stimulus, promoted by either natural or electric lighting, in typical classroom designs with variable characteristics (window size, position, orientation, reflectance values of the inner surfaces) under three typical sky conditions. Results allowed the impact of architectural design parameters on promoting good circadian rhythm for students to be compared. Ezpeleta et al. in 2021 [33] analyzed photopic and melanopic effects of light in four variable teaching environments and optimized an improvement proposal for the classroom lighting in order to address both photopic and melanopic needs.
However, despite the growing knowledge concerning integrative light and NIF effects of light, current design approaches and standards for indoor lighting are mainly intended to ensure visual requirements and maximize energy efficiency. Consequently, they are usually expressed in terms of photopic quantities without taking non-visual responses to light into account. Additional efforts are needed to define specific and agreed recommendations that address both photopic and melanopic aspects.
In this frame, this paper presents results from a study on integrative lighting in real middle-school classrooms located in a School building in Turin, Italy. Both electric lighting and daylighting conditions were analyzed in the study. As for daylighting, three different orientations (east-, south-, and west-facing windows) and different sky conditions (clear and overcast) were considered. As for electric lighting, the existing fluorescent lighting system, designed to achieve a target workplane illuminance of 300 lx (in accordance with EN 12464-1:2011 [34]), was initially considered. Besides, a retrofitting intervention was supposed by comparing different LED lighting systems that were designed to achieve a target workplane illuminance of 500 lx. This increased target was set in consistency with the increased requirements set by the recent European Standard EN 12464-1:2021 [35].
The study relied on a combination of approaches: (i) Simulations to evaluate photopic and melanopic illuminances due to daylighting for different time step representative of different conditions over the year, (ii) field measurements to characterize photopic and melanopic illuminances in the classrooms due to the existing electric lighting system only, (iii) simulations to evaluate the photopic and melanopic illuminances in the classrooms due to different types of LED lighting systems that were considered for a potential retrofitting intervention, (iv) combination of experimental and numerical results, to analyze the classrooms lighting conditions in terms of integration of daylight and electric light.
The research was conducted with two main objectives:
- (a)
- To verify if the circadian values (melanopic equivalent daylight illuminance m-EDI) calculated or measured in the classrooms could satisfy the recommendations reported in recent literature, for instance, in the WELL protocol.
- (b)
- To assess the influence on integrative lighting (photopic and melanopic illuminances) played by electric lighting, as a function of different types of lighting systems and daylighting, as a function of different room orientation and sky conditions.
2. Case Study
A real educational building was selected as case study to analyze integrative lighting in classrooms. The case study is the school “Bernardino Drovetti”, which hosts a kindergarten and a middle school. It is in Turin, Italy (latitude: 45.1° N). The school was built in the 1970s and underwent renovation in 2016. The building consists of four floors, one of which is partially underground, and has a total area of approximately 10,000 m2, with an outdoor space of 12,500 m2 ca.
In this study, three classrooms of the middle school were selected for the analysis. They have similar geometrical and photometric properties in terms of room size, size, and materials of windows, furniture, finishing, and lighting systems. They are all located on the third floor but in different areas, thus with three different orientations (east-, south-, and west-facing windows), with a different obstructing urban setting (Figure 1).
Each classroom is 6.6 m wide and 7.4 m deep, with a floor-to-ceiling distance of 3.2 m. The electric lighting system consists of 6 luminaires, each equipped with 2 × 36 W fluorescent tubes, with a parabolic aluminum reflector and anti-glare louvers, plus 2 luminaires equipped with 1 × 36 W fluorescent tube for the blackboard. The CCT of the lamps is approximately 2880 K, and the CRI is 84. Both the CCT and the CRI values were measured using a spectrophotometer Gigahertz BTS256-EF (measurement range: 360–830 nm; measurement sensitivity: 10 nm; error: ±2.2%) by positioning the instrument as close as possible to the fluorescent tubes (almost in contact with them).
All luminaires are ceiling mounted and are located as shown in Figure 2. They are controlled through two on/off switches, one for the two blackboard luminaires and one for the other six ambient luminaires.
The transparent part of the envelope has a clerestory window equipped with double pane glazing and metal frames. The windows cover the entire width of the façade as well as one of the room corners. They are 1.85 m high, with a sill and a lintel that are 0.97 m and 2.82 above the finished floor, respectively. The resulting window-to-wall ratio is WWR = 0.55 (relative to the main façade, excluding the corner window), while the window-to-floor ratio is WFR = 0.26. The windows are also equipped with moveable blinds that are manually operated by the users.
The spaces were assumed to be occupied on weekdays, from 8:30 until 16:30.
3. Materials and Methods
The research relied on a combination of approaches: (i) Simulations to characterize photopic and melanopic illuminances for daylighting, (ii) field measurements to characterize photopic and melanopic illuminances in the classrooms for the existing electric lighting systems, (iii) simulations to evaluate the photopic and melanopic illuminances in the classrooms due to different types of proposed retrofit LED lighting systems, (iv) combination of results to analyze the integrative lighting resulting from the combination of daylight and electric light.
For the study, it was decided to refer to the indications set by WELL Building Standard, version 2 (WELL v2, Q1-Q2 2023) [24]. The document, which operates on a point-based system, provides target reference values for both visual lighting design (Feature L02) and circadian lighting design (Feature L03), which makes it suitable for an integrative lighting analysis. It is worth stressing that there is not a specific WELL protocol for educational buildings: One general, extensive protocol is issued, and t is updated on a quarterly basis, with the title ‘WELL Building Standard’.
Regarding the non-visual recommendations, the WELL recommends “providing users with appropriate exposure to light for maintaining circadian health and aligning the circadian rhythm with the day-night cycle”. In more detail, the credit provides differentiated recommended values for ‘dwellings’ and for ‘all spaces except dwelling units’: This latter section was considered for the purpose of this study. Table 1 reports the target values that are required by Feature L03 for ‘all workstations in regularly occupied spaces’ to obtain 1 or 3 points. The values need to be achieved through electric lighting for regularly occupied workstations during the daytime, for at least four hours (beginning by noon at the latest).
3.1. Daylighting
Unlike electric lighting, the daylighting amount changes over time in the three classrooms. For this reason, it was decided to simulate daylighting rather than to take measurements, as a yearly measurement campaign could not be carried out due to the use of the building. Three simulation tools were considered: (i) ALFA, a plugin for Rhinoceros 3D developed by Solemma (Cambridge, MA, USA), (ii) Lark (v2), a plugin for Grasshopper developed to evaluate circadian lighting by Inanici and ZGF Architects and then by Pierson (Oregon State University, Corvallis, OR, USA) and Gkaintatzi-Masouti (Eindhoven University of Technology, Eindhoven, The Netherlands) [36], and (iii) Owl, a plugin for Grasshopper recently developed by Maskarenj et al. [37] (Louvain-La-Neuve, Belgium). ALFA was eventually chosen as a simulation tool: Owl allows the spectral power distribution of a local sky to be simulated starting from local measurements, but it was discarded as, in its current version, it does not simulate the indirect contribution of spectral daylight that arrives at the eyes of an occupant. Besides, as pointed out by Balakrishnan and Jakubiec [38] and by Pierson et al. [39], ALFA yields a higher analysis resolution than Lark v2, as it uses an extended Radiance engine to render a space 81-color spectra (versus the 9-color spectra rendered by Lark). Furthermore, it simultaneously calculates EML (and thus m-EDI) values for a grid of points (at the eye level) and for up to 8 view directions at each point, thus allowing a full space to be analyzed. The spectral reflectance properties of opaque components, as well as the spectral transmittance properties of glazing, can be simulated, also adding user-defined materials. To use the actual reflectances of the classrooms in simulations, the spectral properties of ceiling, walls, floors, frames, and furniture were measured in situ using the contact spectrophotometer CM600d (measurement range: 400–700 nm; measurement sensitivity: 10 nm; error: ±5%) manufactured by Minolta (Tokio, Japan). For each sample, both the reflectance including the specular component (SCI) and excluding it (SCE) were acquired by the instrument for a more consistent simulation of each material in ALFA.
As for the spectral transmittance of the glazings, the corresponding component was selected from the ALFA database, while for the package glazing + blind, the spectral transmittance was measured using the above-mentioned spectrophotometer Gigahertz BTS256-EF, through the following procedure: (i) The spectral power density was measured positioning the instrument right behind the blind, with closed window, (ii) the spectral power density was measured keeping the instrument in the same position but with blinds pulled out and window open, (iii) the spectral transmittance of the package single glazing + blind was determined across the range 360–830 nm through the ratio of spectrum (i) to spectrum (ii). The spectral transmittance of the glazing + blind package was imported in Optics and then exported as a .usr file, which is a format read by ALFA to create a new transparent material. At the end of the process, it was therefore possible to simulate the package as a glazing with the same spectral transmittance as the package glazing + blind, but with a specular behavior. It was not possible to measure and to simulate the scattering property of the blind.
Figure 3 shows the light reflectance and transmittance spectral properties of the main classroom materials, which were measured in situ.
Considering the different orientations and obstruction contexts, the three classrooms under analysis were modeled in Rhino, along with the volume of the entire building and the urban settings around them. The spectral properties of the materials were modeled in ALFA, and simulations were run for the following reference time steps:
- 21 December, 8:30 through 16:30, with a time interval of 1 h
- 21 March, the same range as for 21 December
- 21 June, 07:30 through 15:30 (time interval: 1 h), with a 1-h shift back to account for daylight-saving time.
The above schedule was selected as representative of the actual occupancy profile of the classrooms, while the three reference days were selected to analyze the integrative lighting conditions in the classrooms for the two extreme situations during a year (the two solstices), plus one intermediate condition (the spring equinox, which also represents the fall equinox). Consistently with this logic, simulations were repeated for each time step assuming two extreme sky conditions: Clear sky with sun and overcast sky. For the clear sky conditions, the possibility of using the blinds to screen sunlight was also considered.
The grid of sensor points assumed for daylighting simulations was the same as the one used for in-field measurements under the existing electric lighting system. The grid points were set in accordance with a typical layout of student desks (see Figure 4).
Besides ALFA simulations, a set of annual simulations were run using ClimateStudio, with two objectives:
- To determine the shading device profile for the three considered days for each day considered in case of clear sky. For this purpose, the annual sunlight exposure ASE was calculated, consistently with the criterion set by IES LM-83-12 [40]: “blinds shall close whenever more than 2% of the analysis points receive direct sunlight”.
- To determine the annual values of the spatial daylight autonomy sDA300,50%. As mentioned in Table 1, the target m-EDI required by the WELL protocol (Feature L03) can be decreased from 250 to 163 lx, and still grant the maximum score of three points, if sDA300,50% ≥ 75% of regularly occupied floor area. For this purpose, sDA values were calculated for the same grid used for the melanopic illuminances, which covers the desk area.
3.2. Electric Lighting
Currently, the classrooms are equipped with ceiling-mounted direct light fluorescent luminaires. For the purpose of the study, both the existing lighting system and new LED-based lighting solutions (retrofitting hypothesis) were considered.
3.2.1. Existing Fluorescent Lighting System
Photopic and melanopic illuminances were measured for one classroom in the absence of daylight, using the Gigahertz spectrophotometer. The measurements were taken according to the grid shown in Figure 4. For each grid point, different quantities were acquired: photopic illuminances were measured at the desk height (horizontal plane), while melanopic and photopic illuminances were measured, at the same grid points, on a vertical plane, set 1.2 m above the finished floor, looking forward to the blackboard, so as to reproduce the most recurring view direction of the students in a classroom. Melanopic measures were taken for the same points as photopic horizontal illuminance, thus measuring the circadian contribution at students’ eyes in their position when sitting at the desk.
As the three classrooms analyzed present the same geometry, materials, and lighting systems, the measurement campaign was carried out in one room only.
3.2.2. LED Lighting Systems
For the considered classrooms, a theoretical comparative study among different retrofit hypotheses with LED lighting systems was performed through numerical simulations. The retrofit hypotheses were defined using some of the luminaire typologies currently mostly used in classrooms. The LED-based systems were designed to maintain the same luminaire position as in the layout currently installed in the classroom (six luminaires for the general lighting of the classroom, as reported in Figure 2). The two luminaires intended for the blackboard were not considered in the retrofit proposal, as the study was focused on the area occupied by the desks, and no analysis was carried out on the blackboard.
Six different luminaire typologies were identified for retrofitting, with different features: Ceiling-mounted or pendant, with different directions of light output (direct, direct-indirect), distributions of the light flux, and optical technologies. The goal of this stage of the study was to compare the various solutions and to assess the impact that these aspects may have on the melanopic illuminance that reaches the vertical plane at the eye height.
In more detail, typologies 01 and 02 (Table 2) were rectangular surface ceiling-mounted luminaires with micro-pyramidal optic, characterized by direct downlight emissions and light beam angles of 45° approx., one with tunable white technology (01) and one with a CCT of 4000 K (02). A typology of luminaire with tunable white technology was considered to include the possibility of changing the CCT at different times of the day. Besides, a suspended luminaire (typology 03) with the same micro-pyramidal optic and characterized by both direct and indirect light output (in 70:30 ratio) was selected to test different installation positions and to also include indirect light emission. Typology 04 was a square ceiling-mounted luminaire with an optic composed of minicell reflectors. It was selected to test a narrower aperture of the light beam (35° approx.) with respect to typology 05, that had the same dimensions, but a diffuser made of an acrylic micro-prismatic structure that produces a wider beam angle (45° approx.). Finally, a square ceiling-mounted luminaire (typology 06) with similar light distribution to the previous one, but with a different optic, was considered: This relies on a polycarbonate diffuser with an aluminum heatsink to redirect the light output. All LED lighting systems had a CCT equal to 4000 K (i.e., the chromaticity typically used in educational buildings), except for the luminaire typology with tunable white technology, and a CRI above 80.
All the LED lighting systems were sized to achieve a target illuminance of 500 lx over the desk area in accordance with the latest European Standard EN-12464-1:2021 [35]. All luminaires were assumed to be equipped with a constant light output (CLO) sensor that dims the light output during the lifespan of the luminaire to maintain 500 lx illuminance over the desks.
The photometric features of the luminaires that were selected are shown in Table 2, while Figure 5 plots the spectra of the light emitted by the luminaires, as provided by the manufacturers. Table 2 also shows the illuminance uniformity that was calculated on the workplane for the six lighting systems.
From the data shown in Table 2 and Figure 5, the following considerations can be pointed out regarding the melanopic content of the light output (m-DER):
- Although they are marked with the same correlated color temperature CCT of 4000 K, there is a significative difference in terms of m-DER between LED ID 01-02-03 and 04-05-06: This ranges from a maximum value of 0.72 for LED ID 01 (tunable white, ceiling-mounted) to a minimum value of 0.63 for LED ID 04-05.
- For the tunable white, ceiling-mounted lighting system (LED ID 01), the m-DER ranges from a minimum value of 0.49 (for a CCT of 2700 K) to a maximum value of 0.96 (for a CCT of 6500 K).
- Within LED ID 01-02-03, a slight difference in terms of the spectrum is observed for SPDs that yield a CCT of 4000 K, which results in a different m-DER: 0.72 for the ceiling-mounted tunable white luminaire, 0.67 for ceiling-mounted luminaire (constant CCT), and 0.68 for the suspended luminaire.
- Within LED ID 04-05-06, the melanopic content of the light output (testified by the m-DER value) is consistent between the two lighting systems considered (m-DER = 0.63 for ID 04-05 and m-DER = 0.64 for ID 06).
For all the LED systems, both photometric and melanopic quantities were determined through a set of simulations through the software ALFA.
4. Results
4.1. Daylighting
Relative to daylighting, a set of simulations was run using ALFA for the days 21 March (spring equinox), 21 June (summer solstice), and 21 December (winter solstice), for the three orientations considered, under a clear and overcast sky.
Prior to running ALFA simulations, a set of annual simulations was run using ClimateStudio to calculate the spatial Daylight Autonomy sDA300,50%: sDA was found to be as high as 99% in all three classrooms, independently of the orientation. This means that all spaces qualify for the Feature L05 according to the WELL protocol, and therefore, reduced m-EDI values of 163 lx are sufficient to get the maximum score of three points.
For ALFA simulations, an operable fabric blind was also considered under clear skies, whose utilization profile is shown in Figure 6a. As one would expect, the blinds are only required in the morning in the classroom with east-facing windows, mainly before 10:30, with the exception of the 21 December, when they are used until 12:30. Conversely, in the classroom with west-facing windows, blinds are required in the afternoon only, after 14:30. Differently, for the classroom with south-facing windows, the blinds are used for most of the day in spring and winter, while they are never necessary on the 21 June due to the high sun elevation in summer at the latitude of Turin.
For all skies, the contribution of the electric lighting system was also accounted: It was considered as switched on whenever illuminance fell below the target value of 500 lx in any point of the grid that covers the desks. Figure 6b shows the electric lighting usage profile for all the days, all the sky conditions, and all the orientations analyzed. It is possible to observe that:
- Under clear skies without blinds, the use of electric lighting is only required on 21 December in the early morning and late afternoon for classrooms facing east and south, while it is also required in the mid-day hours for the classroom facing west. This is due to the few daylight hours and low daylight availability on the winter solstice at the latitude of Turin.
- Under clear skies and when the blinds are used, the number of hours in which the electric lighting is required increases: Besides the moments already highlighted above for clear skies without blinds, the electric lighting system needs to be switched on whenever the fabric shade is closed.
- Under overcast sky conditions, the use of electric lighting in the winter solstice is required throughout the whole day, while in the summer solstice and the spring equinox, this needs to be switched on in the early morning and late afternoon hours.
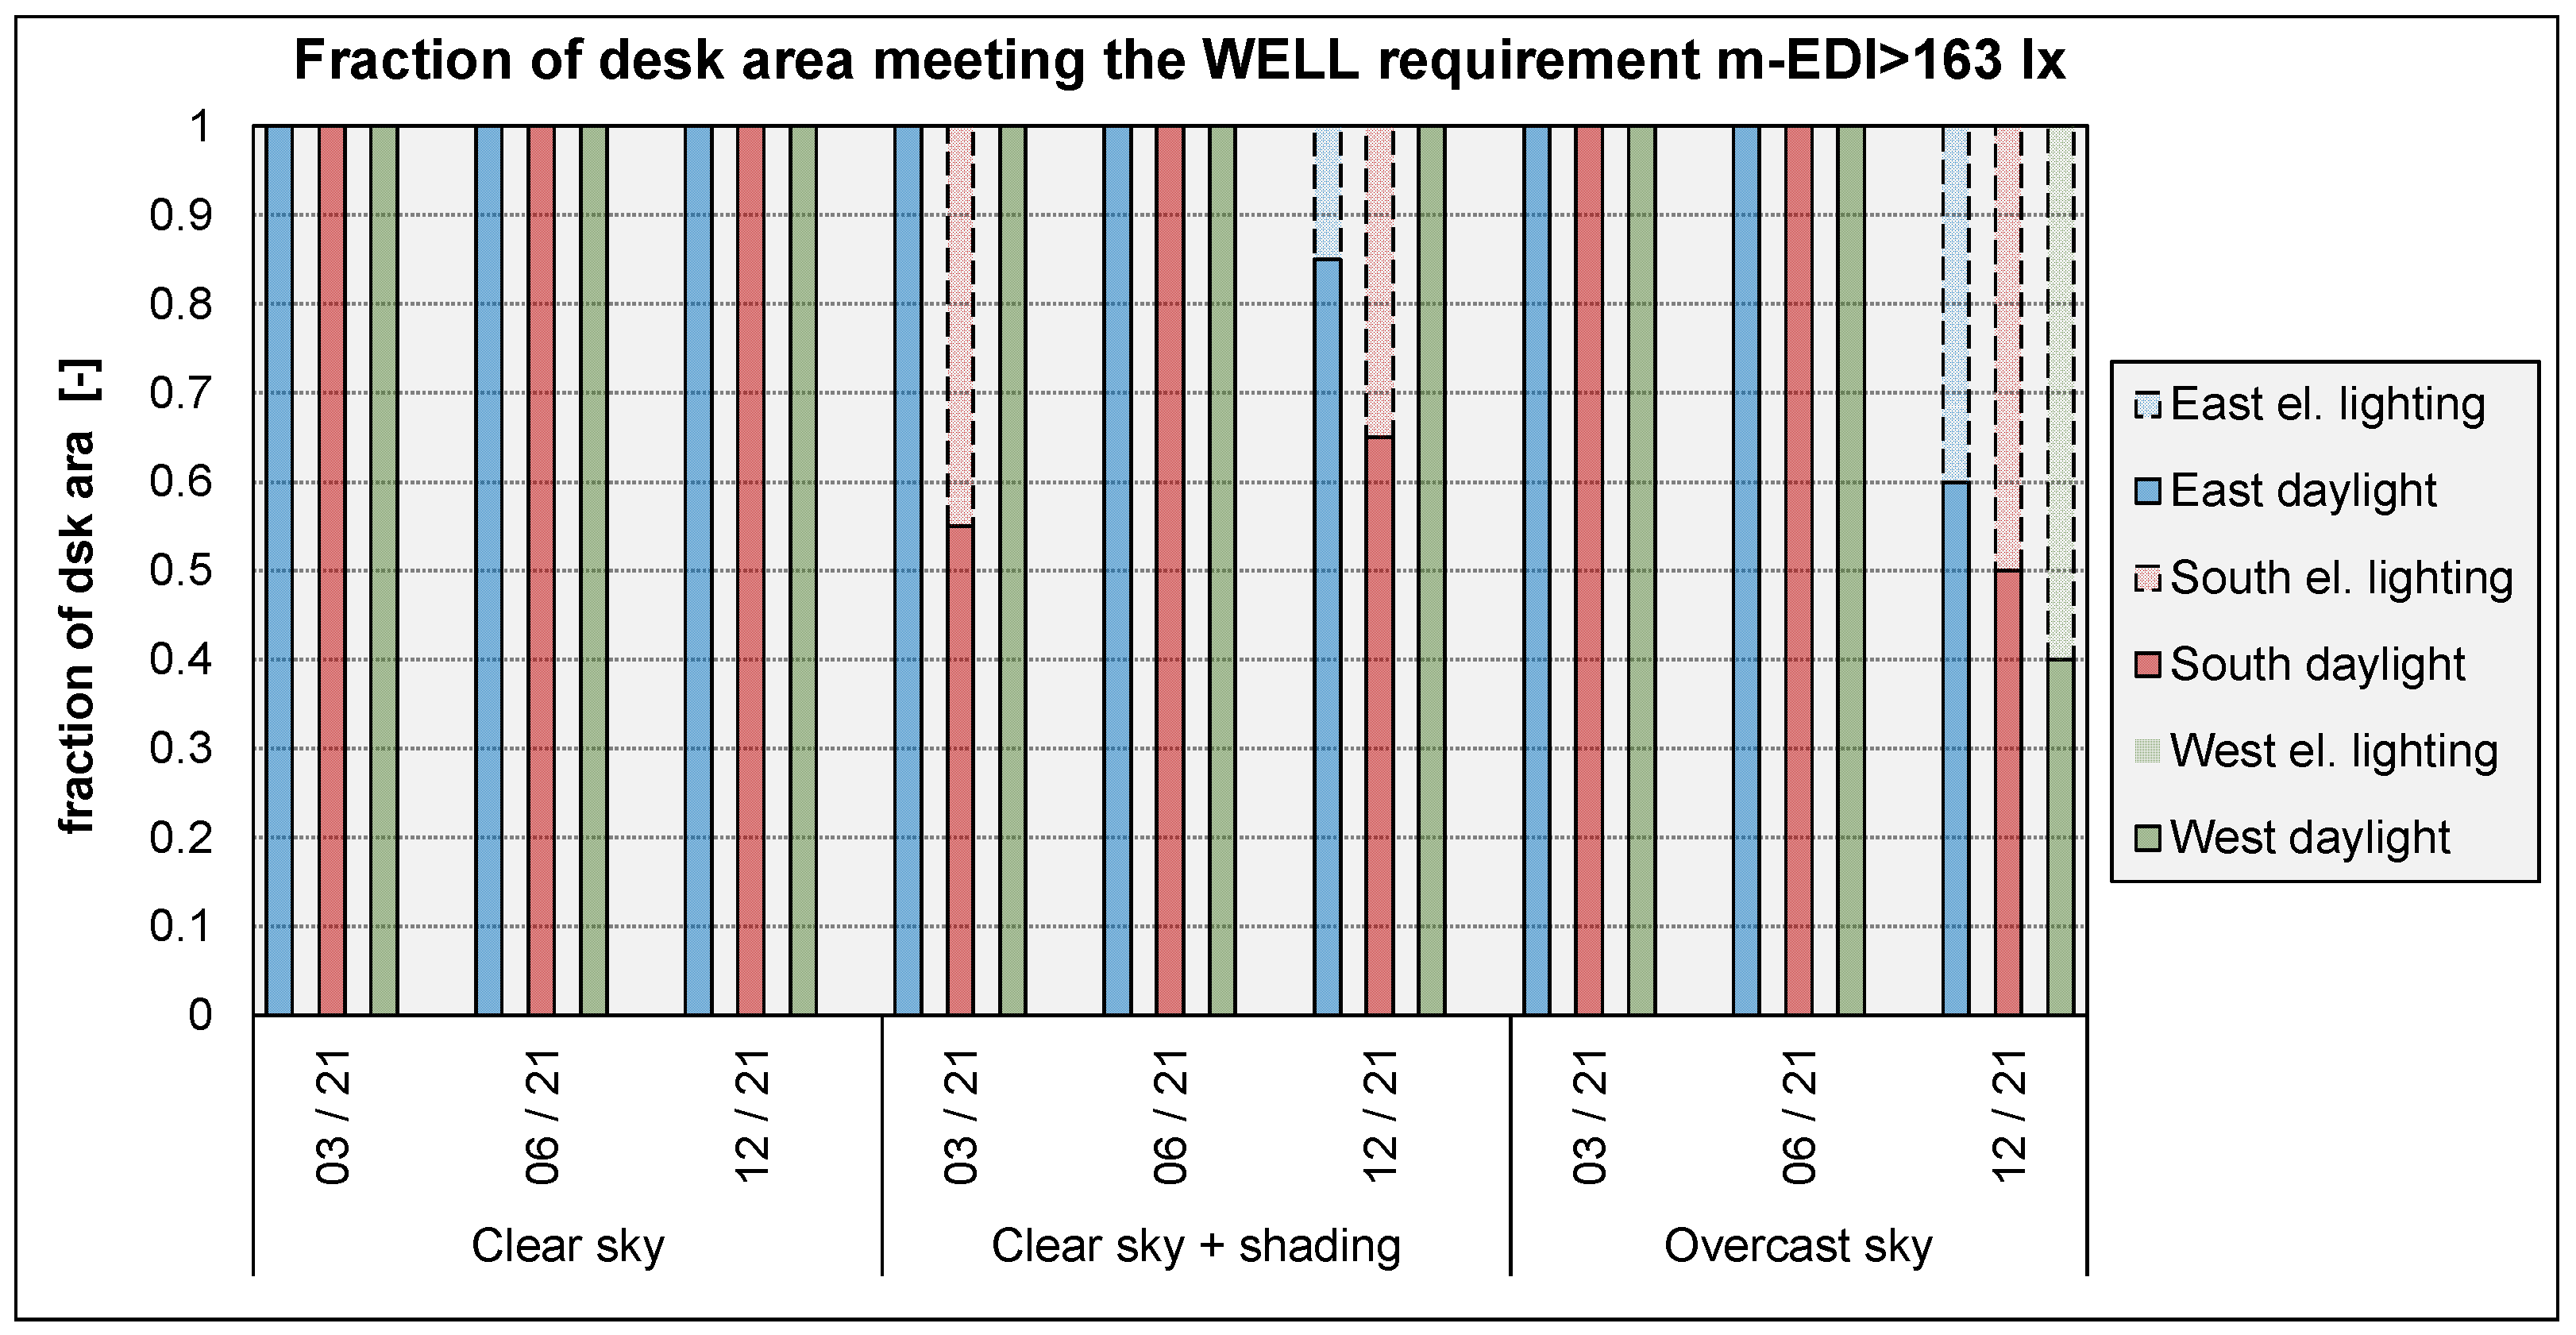
Figure 7 shows the melanopic performance in terms of fraction of desk area that meets the one-point or the three-point WELL requirements for all the days, the sky conditions, and the orientations considered. Based on the results, the following considerations can be drawn:
- The requirement m-EDI ≥ 109 lx for all workstations, for at least 4 h (one-point WELL criterion) was not met for five configurations: Three under clear skies with blinds (south-facing room in March and east- and south-facing room in December), and two under overcast skies (south- and west-facing room in December).
- The fraction of area where m-EDI ≥ 163 lx for at least 4 h (three-point WELL criterion) is clearly lower than it was for the one-point credit m-EDI ≥ 109 lx. The recommendation was not met for six configurations: The same five configurations that were observed for the one-point criterion and the east-facing room in December under overcast skies. As a result, all the configurations in December were not compliant under overcast skies. In more detail, it is possible to observe how, in a clear sky condition for all the days and orientations, daylight is sufficient to satisfy the WELL three-point requirement at all grid points. When the use of the blinds is considered, daylight alone is not sufficient to meet the requirement for the whole space in the south-oriented classroom on 21 March and in the same space, as well as in the east-oriented classroom, on 21 December. This is due to the high number of hours, especially in the central part of the day, in which the blinds are assumed closed to prevent glare. Finally, under an overcast sky, the WELL recommendations to achieve three points is not met, on the winter solstice, for all three classrooms analyzed. This is due to the few daylight hours and the scarce daylight availability around this date at the latitude of Turin (approx. 8.75 h).
Consistently with the analysis of the melanopic performance in terms of the fraction of desk area where m-EDI is above a certain threshold, a similar approach was also applied to the photopic workplane illuminance. Figure 8 shows the photopic performance in terms of the fraction of desk area where the photopic illuminance was found to be above the minimum reference value of 500 lx for at least 50% of the occupied time for each considered day, which corresponds to 4 h per day. In this way, this analysis of the workplane illuminance assumes the meaning of a daily spatial daylight autonomy sDA by accounting for all the points (fraction of desk area) where Ep_wp > 500 lx for 50% of the occupied time of the day considered.
Based on the results, the following considerations can be drawn:
- Under clear skies without blinds, 100% of the desk area was found to have a workplane illuminance over 500 lx for at least 50% of the occupied time for all the configurations analyzed, except for the west-facing classrooms in December.
- Under clear skies with blinds, the percentage of desk area where 500 lux were achieved for at least 50% of the occupied time is significantly lower in December (30% in west and east-facing rooms, 50% in south-facing rooms) and in March in the south-facing classroom (35%).
- Similar results were found under overcast skies: The percentage of desk area over 500 lux for at least 50% of occupied time is in the range 20%–35% in December, while is above 70% in March and reaches 100% in June.
4.2. Electric Lighting—Fluorescent Lighting System
Figure 9 summarizes the results that were obtained through field measurements in the existing electric lighting conditions. The following data are presented relative to the area with students’ desks: (i) Horizontal workplane illuminance, Ep_wp, (ii) vertical photopic illuminance at the eyes, Ep_eye, (iii) melanopic equivalent daylight illuminance at eyes, m-EDI_eyes, (iv) ratio of the eye vertical to the workplane horizontal illuminance, Ep_eyes/Ep_wp, and (v) the melanopic ratio at the eyes, m-DER (indicated as M/P_eyes in the figure). Besides, the CCT was also measured at the eye level at each grid point (not displayed in Figure 9): CCT values were rather warm (values in 2482–2620 K, with an average value of 2551 K) due to the combination of the spectral content of light sources and the spectral reflectance of materials (shown in Figure 3).
The following considerations can be stressed:
- As for Ep_wp: The average illuminance was 363 lx, with a minimum value of 247 lx and a uniformity of 0.68. Both values are compliant with the requirements set by EN 12464-1:2011 [33], which was the standard to refer to when these lighting systems were designed and installed. Besides, considering the spatial distribution of Ep_wp values, it was observed that 75% of the desk area showed an illuminance over the target value of 300 lx.
- As for m-EDI_eyes: The average melanopic illuminance was 52.6 lx, with a minimum value of 37.4 lx and a maximum of 66.3 lx. Therefore, all values in the classroom are far below the minimum values indicated by the WELL protocol [24].
- As for m-DER_eyes: All values are in the range of 0.30–0.32, with an average value of 0.31.
- As for the ratio Ep_eyes/Ep_wp: All values are in the range of 0.47–0.58, with an average value of 0.52. On average, the vertical illuminance at the eye level is around half of the horizontal illuminance measured at the same location, but on the workplane.
4.3. Electric Lighting—LED Lighting Systems
Focusing on electric lighting contribution, Figure 10 plots the melanopic results that were obtained through ALFA simulations for the LED lighting systems considered. In more detail, Figure 10a shows the fraction of desk area (sensor points) where either one of the WELL criteria was met (m-EDI > 163 lx or m-EDI > 109 lx). Differently, Figure 10b shows the average m-DER of all the m-DER values that were found at all the sensor points, as the ratio of the melanopic to the photopic illuminance at the eye level. Figure 10b also reports the melanopic content of the spectral light distribution emitted by the LED lighting systems considered: The difference between the two m-DER values is due to the spectral reflectance of the surfaces in the room, i.e., ceiling, walls, blackboard, windows, floor, and furniture, as well as to the spectral characteristics and light distribution of the luminaires. As a further analysis, Figure 11 shows the ratio of the photopic eye-level vertical illuminance to the photopic workplan illuminance (Ev,eye/Ewp)vis over the desk area.
- As for compliance with the WELL criteria, it is worth stressing that:
- -
- None of the LED lighting systems can meet the recommendation of m-EDI ≥ 250 lx at any point across the desk area (fraction of desk area where m-EDI ≥ 250 lx = 0). This shows that the presence of daylight is crucial to comply with the WELL recommendations in terms of melanopic lighting.
- -
- None of the LED systems qualifies for three-point recommendation in the WELL protocol. The fraction of desk area with m-EDI ≥ 163 lx is below 1 for all the systems: Only the tunable white luminaire with a cold TCC (LED ID 01_6500K) reaches 80% of the desk area able to comply with the criterion, while for all the other LED systems the fraction of desk area is below 20%.
- -
- As for the one-point WELL criterion (fraction of desk area with m-EDI ≥ 109 lx), it was observed that two LED luminaires qualify for the credit: ID 01_TW6500K and ID 06. A fraction of desk area over 80% was observed for four other LED types: ID 01_TW4000K, ID 02, ID 03, and ID 05. The remaining LED luminaires (ID 01_TW2700K, and ID 04) were far below the credit.
- As for the melanopic content (expressed through the m-DER value) of the light, this was observed to get reduced at the eye level compared to the value of the light emitted by the luminaires. In more detail, considering the 4000 K lighting systems, the average m-DER of the sources was 0.66 (standard deviation SD = 0.04), while the average m-DER at the eye level was 0.52 (SD = 0.04). The reduction in the melanopic content was found to be similar for all luminaires (average reduction equal to −21.6%, SD = 2.78), apart from the LED ID 04, for which the reduction was equal to −27%. Such peculiarity seems to be due to its specific photometric solid, which is narrower than all the other luminaires
- The ratio of the photopic eye-level vertical illuminance to the photopic workplane illuminance (Ev,eye/Ewp)vis is around 0.50 for all the LED lighting systems, with the exception of the LED type 4 (value of 0.41), which furthers confirms that the narrower photometric solid of this luminaire type results in a lower lighting level that reaches the eyes of the students.
4.4. Integration of Daylighting and Electric Lighting
4.4.1. Daylighting and Fluorescent Lighting System
Figure 12 shows the integration of daylight and supplementary fluorescent light, in terms of fraction of the desk area that meets either the one-point m-EDI ≥ 109 lx or the three-point m-EDI ≥ 163 lx WELL recommendations, for all the days, sky conditions, and orientations considered. The bars edged by a solid line represent the contribution of daylight, while the bars edged by a dashed line show the contribution of fluorescent lighting.
Considering the contribution of electric lighting, it is possible to observe that:
- The melanopic contribution provided by fluorescent light is sufficient to guarantee the one-point WELL criterion (m-EDI ≥ 109 lx) at all grid points for all the five configurations for which the daylight contribution was not sufficient.
- The melanopic contribution provided by fluorescent light is sufficient to guarantee the three-point WELL criterion (m-EDI ≥ 163 lx) at all grid points for three out of the six configurations for which the daylight contribution alone was not sufficient. The recommendation was not met for south-facing rooms in March under clear skies with blinds and south- and west-facing rooms in December under overcast skies.
4.4.2. Daylighting and LED Lighting Systems
As far as the integration of daylighting and supplementary LED electric lighting is concerned, Figure 13 reports, as an example, the results that were obtained for the LED system ID 01_TW2700K, in terms of the fraction of desk area where the three-point WELL criterion is met (m-EDI ≥ 163 lx for at least 4 h a day, including noon). Once again, the bars edged by a solid line represent the contribution of daylight, while the bars edged by a dashed line show the contribution of electric lighting.
The results reported in the figure show that, differently from the fluorescent system case, m-EDI of at least 163 lux are reached on the whole desk area (100% of points) for all the configurations analyzed thanks to the supplementary contribution of the LED systems. The same results were observed for all the other types of LED systems analyzed in this study. This is due to a combination of two factors:
- The increase of the installed lighting power density, with respect to the existing fluorescent system, needed to reach a workplane illuminance of 500 lx.
- The higher melanopic content (as expressed through the m-DER value) of the spectral power distribution of the LED lighting systems compared to the existing fluorescent system.
5. Discussion
The study presents an analysis of integrative lighting in three real classrooms (with the same layout and materials but different orientations), considering both the effects of daylighting and electric lighting (the existing fluorescent lighting system and different LED lighting systems assumed for a potential retrofitting). The photometric lighting conditions were assessed based on commonly adopted lighting standards, while the WELL protocol was assumed as a reference to evaluate the circadian aspects of the integrative lighting. For the classrooms analyzed, the study aimed at verifying what rating could be reached for the WELL circadian lighting Feature (L03), during different days of the year and under different sky conditions. For all the cases analyzed, it was always possible to reach at least a m-EDI value of 109 lux across the entire desk area, corresponding to a one-point rating, through the integration of electric lighting and daylighting. Similarly, regarding the stricter three-point rating, it was found that the requirement was always met through the integration of daylighting and the electric lighting provided by the LED lighting systems, while, with the existing fluorescent systems, the requirement corresponding to the three-point rating was not met in three cases out of the 27 combination of orientations—sky conditions—day considered, due to the lower light output and melanopic performance (m-DER) of the existing fluorescent system.
Focusing on the daylighting contribution to the circadian performance, it was found that daylight alone was always sufficient to meet the requirements under a clear sky without blinds. Conversely, the use of an operable blind with a clear sky, that is a more realistic condition at the latitude of Turin, reduced the melanopic performance in December and March for some room orientations (mainly south). December was also the case when the melanopic recommendations were not met with daylight alone under an overcast sky. A similar trend was observed from the results obtained for the horizontal workplane: For all room orientations, low fractions of desk area with Ep,wp > 500 lux for at least 50% of the occupied hours were observed in December with an overcast sky and clear sky with blind and for the south-oriented room with blinds in March (30% on average). Conversely, the daily spatial Daylight Autonomy was higher than 75% for all other combinations. In general, both the photopic and melanopic daylighting performance in the classrooms are high, thanks to the high WWR (0.55) and the low external obstructions, which allow a large amount of daylight to be admitted to the rooms, providing high daylight levels also in points away from the windows.
When considering the circadian performance of the electric lighting systems, the results demonstrated that the existing fluorescent luminaires determined very low m-EDI at the eye level on the desk area (52.6 lux on average). This could be explained by the low average m-DER value (0.31), caused by the low correlated color temperature of the lamps (2880 K), and by the impact of the environmental colors (mainly neutral or warm colors).
For the above reason, some alternative electric lighting systems (last-generation LED luminaires) were considered in the study. A CCT of 4000 K, a tunable white light system, and different light output distributions were considered. Besides, the lighting systems were sized to achieve 500 photopic lx over the workplane, according to the latest version of the standard EN 12464-1:2021 [34], while the existing fluorescent lighting system provided an average workplane illuminance of 363 lx (compliant with the standard requirements of when it was installed). The increase in the workplane photopic illuminance (+138%) and, moreover, in the m-DER of the LED lighting systems (+171% at the eye level, on average) resulted in an increased circadian performance with respect to the fluorescent system. If a CCT of 4000 K is considered, five out of six types of luminaires (ID 01_4000K-02-03-05-06) provide a m-EDI > 109 lux on more than 80% of the vertical eye-level grid points of the desk area, while a m-EDI > 163 lux was achieved on few points (0.5% up to 20% of the desk area) with luminaires ID 01-02-03-06. Only by adopting a CCT of 6500 K, the fraction of the desk area with a vertical m-EDI > 163 lux raised to 80%. Comparing the different LED lighting systems with 4000 K CCT, the worst circadian performance was obtained with the system ID 04 (ref. Figure 12a), which has the lowest m-DER (0.63) and the lowest vertical to horizontal photopic ratio (0.41) due to a more concentrated light distribution. The luminaire light distribution is a relevant feature with respect to circadian performance: In this study, luminaires with similar m-DER (ID 04-05-06) provided a better circadian performance when characterized by a wider light distribution (ID 05).
Despite the greatly improved circadian performance of the LED lighting systems with respect to the fluorescent one, the one-point credit according to the WELL protocol, that is 100% of the workstations with an m-EDI over 109 lux for at least 4 h, was achieved for two configurations only (LED ID 01_6500K and ID 06), while the three-point credit was never achieved.
5.1. Limit in the Number of Cases Analyzed
The study was conducted partly experimentally, mainly for the characterization of the room surfaces and the electric lighting system, and partly numerically, for melanopic and photopic simulations. For this latter part, the main limitation of the study is the reduced number of days (three days of the year) and of sky conditions (only extreme sky conditions were considered, i.e., completely clear and completely overcast). Such limitation is due to the impossibility of simulating intermediate sky conditions within ALFA, which makes it impossible to assess the circadian performance of a space on a yearly basis. To overcome this issue, the analysis was performed for three “reference” days of the year, i.e., the two solstices and the spring equinox, in the two extreme sky conditions described above. Nevertheless, the validity of such analysis cannot be extended to the whole year, but rather this gives an indication, for the spaces in analysis, of the limited circadian performance during days considered as representative of different seasons of the year. To overcome this limit, it is planned to extend the study at some point in the future by using the Grasshopper tool ‘LARK v2’ to run annual simulations, even though on the other hand LARK has a lower spectral resolution with respect to ALFA.
5.2. Limit in Modelling the Real Translucent Blind
Another issue to discuss is how the blind was modeled: As described in the methodology section, the fabric blind installed in the classrooms was modeled as specular glazing using the spectral data of the measured glazing + blind package. This was done because within ALFA it is not possible, to the author’s knowledge, to model a translucent material or to insert a Bi-Directional Scattering Distribution Function for a shading material. To overcome such limitation, the glazing + blind package was modeled as a specular glazing to which the spectral transmittance and reflectance were assigned based on in-situ measurements. Such modeling assumption may create a bias in the results since it does not allow the correct simulation of the diffused and specular components of the light transmitted in the indoor ambient. Consequently, the illuminance of the points further from the window may result to be lower than how this value would actually be, due to the scattering effect of the blind. Despite this difference, the authors believe that the limitation in the way the fabric blind is modeled is not such as to invalidate the general outcomes of the paper.
5.3. Effect of Spectral Reflectance of the Room Surfaces
As a further investigation aspect, the effect of the colors of the room surfaces (in terms of spectral reflectance) was explored, following an approach similar to that reported in a study by Safranek et al. (2020) [41]. This analysis was carried out considering the LED system ID 04 (ceiling mounted, with a CCT of 4000 K). The following three configurations were compared:
- The existing configuration (see Figure 3), with a yellow floor and white walls and ceiling, whose spectral reflectance was measured in situ. The average workplane illuminance over the desk area was 500 lx, while the average m-EDI at the eye level was 134 lx.
- A ‘warmer-color’ configuration, where the walls were assumed to have the same finishing as the floor (yellow).
- A ‘colder-color’ configuration, where the walls were assumed to be finished with a blue color.
It is worth stressing that both configurations (b) and (c) yield a workplane illuminance lower than the target value of 500 lx (439 lx and 424 lx, respectively) because of the lower area-weighted average photopic reflectance Rv,m (equal to 55.4% and to 50.1%, respectively, versus a value Rv,m = 71.5% for the existing configuration (a)). Therefore, it was assumed to increase the light output of the luminaires to compensate for the reduced Ewp and to restore the 500-lx minimum level. Under this condition, the melanopic illuminances m-EDI were calculated at all the sensor points (eye level) to highlight the impact that the color of the finishing materials of the room surfaces has on the spectral power distribution of the light that reaches the eyes of the students. It was found that:
- For configuration (b) (yellow walls), the average m-EDI at the eye level was 109.9 lx. Compared to the existing configuration (a), the modified colors resulted in a decrease of the average m-EDI by −18.7%.
- For configuration (c) (blue walls), the average m-EDI at the eye level was 146.2 lx. Compared to the existing configuration (a), the modified colors resulted in an increase of the average m-EDI by +9.1%.
5.4. Design Implications (Considerations)
As far as electric lighting is concerned, the design practice traditionally mainly relies on maintained horizontal illuminance over the workplane. The recent European Standard 12464 [34,35] has introduced, in the former version of 2011 [34] and to a greater extent in the recent version of 2021 [35], other requirements to also include the illuminance level in the room (average illuminance and uniformity over the walls and the ceiling) and the illuminance at the eye level of the occupants, through the cylindrical illuminance, to integrate the luminance-based unified glare rating UGR requirement. There is no melanopic requirement to also account for circadian entrainment. On the contrary, the WELL protocol introduced circadian recommendations in its rating system, through the m-EDI, in association with daylighting recommendations through the spatial daylight autonomy sDA. On the one hand, lighting designers must comply with the workplane requirement in terms of photopic illuminance., on the other hand, they may want to also meet melanopic requirements to qualify for the circadian credit of the WELL, thus considering the vertical plane at the eye level.
The preliminary results that were observed in this study showed that it is very tough to satisfy the m-EDI recommendations through electric lighting alone and that daylighting is crucial to obtain compliance. In short, it seems that a combination of factors needs to be considered to meet the three-point WELL requirement in a typical classroom and adopt LED typical luminaires and luminaires layout:
- a cold chromaticity of the light emitted (especially in the presence of surfaces with warm colors, like the yellow floor present in the existing classrooms considered in the study)
- an illuminance of 500 lx (or more) over the workplane
- luminaires with a wide photometric curve to increase the light reaching the vertical plane at the eye level. On the other hand, though, a higher glare risk could be determined through this action.
- a significant presence of daylight.
The LED lighting systems with a CCT of 4000 K considered in the study could not manage to guarantee, alone, the three-credit WELL requirement. Therefore, the results from this study seem to suggest that the targets of the WELL protocol for circadian lighting are hardly achievable through electric lighting alone when typical LED luminaires and luminaires layout are adopted in a classroom (e.g., for lighting systems retrofit projects). To overcome this limit, different solutions could be considered:
- -
- increasing the workplane illuminance level, with the consequence of increasing the lighting power density installed in the space and thus the energy demand for the lighting of the building
- -
- modifying the typical luminaires light output distribution, increasing the ratio of the vertical to horizontal illuminance (Ev,eye/Ewp), with the risk of higher direct and reflected glare probability
- -
- complementing typical lighting systems with luminaires or lighting devices specifically designed to fulfill the circadian requirements
- -
- conceiving new lighting designs with luminaires layout and features optimized for both the photometric and the circadian requirements (e.g., with the use of different luminaires, CCTs, and automatic lighting controls).
In general, further research seems to be needed to better understand human needs for proper circadian entrainment and to consequently define lighting design criteria (in terms of quantity and duration/pattern of exposure) and limits suitable to respond to both visual and non-visual requirements, in an integrative lighting perspective, without worsening the buildings energy performance.
6. Conclusions
A study on integrative lighting in existing classrooms was presented. It was conducted in three classrooms of a real middle school building in Turin. The three spaces presented the same geometry, layout, and color, and differed in the orientation (south-, east-, and west-facing windows). A combination of approaches was used in the research: (i) Field measurements to characterize photopic and melanopic illuminances in the classrooms due to the electric lighting system only (this consisted of fluorescent luminaires), (ii) ClimateStudio and ALFA simulations to evaluate photopic and melanopic illuminances due to daylighting alone. ALFA simulations were run on summer and winter solstice and on the spring equinox, from 8 h 30 until 16 h 30 (7 h 30–15 h 30 in the summer equinox), with an interval of 1 h, (iii) combination of experimental and numerical results, to analyze the classrooms lighting conditions with the combination of daylight and electric light. After the first round of analyses on the existing classrooms, potential retrofitting solutions with LED luminaires were analyzed. The LED lighting systems were chosen to have different positions (ceiling mounted or suspended) and photometric solid, with a CCT of 4000 K. A tunable white luminaire was also considered, with CCT changing in the range 2700–6500 K.
The research was conducted with two main objectives: (i) To verify if the circadian values (melanopic equivalent daylight illuminance m-EDI) calculated or measured in the classrooms could satisfy the recommendations reported in recent literature, for instance, in the WELL protocol, (ii) to assess the influence on integrative lighting (photopic and circadian illuminances) played by the electric lighting and daylighting, as a function of different room orientation and sky conditions (overcast vs. clear with the use of a blind for time-steps when the sun penetrated the room).
Although the results of the study cannot be generalized, they provide some indications about integrative lighting in an existing Italian school building. Although daylight is the primary light source in classrooms (mainly used in the morning and first part of the afternoon), it is not always sufficient to provide the recommended circadian entrainment, particularly when shading devices are used to control glare or overcast sky conditions are prevalent. The required vertical m-EDI should be achieved through the electric lighting contribution, but existing electric lighting systems, such as the one analyzed in this study, are designed to provide a target illuminance on the horizontal plane and might not be adequate to provide a sufficient vertical illuminance at the eye level. Furthermore, as shown in the study, the spectral power distribution of light sources could be poor in short wavelengths, thus further lowering the electric lighting contribution to circadian entrainment.
Based on the results that were obtained, the following considerations can be drawn:
- From ClimateStudio simulations, the daylight amount in the existing classrooms resulted in a spatial Daylight Autonomy over 99% for all three spaces analyzed. This means that the reduced target m-EDI ≥ 109 lx and m-EDI ≥ 163 lx can be applied to qualify for the one-point and three-point WELL recommendations, respectively.
- From measurements, the existing room showed an average workplane illuminance over the desk area of 363 lx, consistent with the minimum level of 300 lx required in the European standard EN 12464-1:2011 [34]. However, the average m-EDI at the students’ eye was 52.6 lx (with an average m-DER value of 0.31), far below the minimum levels recommended by the WELL protocol. This is due to the particularly warm light emitted by the fluorescent luminaires and the yellow color of the floor, which resulted in an average CCT measured at the students’ eyes of 2551 K.
- From ALFA simulations for daylighting, it was found that m-EDI was below the three-point WELL requirement in December under an overcast sky and for a pair of conditions under a clear sky when the blind was used (21 March for the south-facing room and 21 December for both the east- and south-facing rooms).
- For these time steps, the supplementary electric light provided by the existing fluorescent lighting system allowed the WELL protocol recommendation to be met in 50% of cases (three out of six).
- With the LED lighting systems assumed for a potential retrofitting intervention, the workplane illuminance was increased to 500 lx, in accordance with the latest version of the European standard (2021).
- Among the various LED systems, no solution was able to meet the three-point recommendation of the WELL protocol, while two solutions allowed the one-point recommendation to be met: The LED ID_01 tunable white LED luminaire with CCT set to 6500 K and ID 06.
In conclusion, it seems that the integrative lighting approach is of crucial importance but needs further research to be implemented in the current design practice, especially for what concerns the amount of the melanopic recommendation and the duration of the time to which to refer the application of such recommendation. This involves considering a new paradigm for the lighting design practice, which involves the following aspects: The spectral power distribution of the light output of luminaires and of the room surfaces, the light hitting the vertical plane at the eye level of the occupants, new luminaires that are specifically conceived for an integrative lighting approach, especially in terms of their photometric curve.
Author Contributions
Conceptualization, A.P. and V.R.M.L.V.; methodology, A.P. and V.R.M.L.V.; software, L.G. and V.R.M.L.V.; investigation, L.G. and L.V.; data curation, L.G.; writing—original draft preparation, review and editing, V.R.M.L.V., L.G. and L.V.; visualization, V.R.M.L.V., L.G. and L.V.; supervision, A.P. All authors have read and agreed to the published version of the manuscript.
Funding
This research received no external funding.
Data Availability Statement
Data are available upon request.
Acknowledgments
The study was carried out within the Agreement between the Department of 834 Energy of the Politecnico di Torino and ITER (Instituto Torinese per una Educazione Responsabile) of the City of Turin (IT) on educational spaces. The authors acknowledge the City of Turin and ITER for making available the spaces of the case-study. The Authors also wish to thank Zumtobel and Thorn Lighting for sharing the spectral power distributions of the LED luminaires.
Conflicts of Interest
The authors declare no conflict of interest.
References
- Xiao, H.; Cai, H.; Li, X. Non-visual effects of indoor light environment on humans: A review. Physiol. Behav. 2021, 228, 113195. [Google Scholar] [CrossRef] [PubMed]
- Vetter, C.; Morgan Pattison, P.; Houser, K.; Herf, M.; Phillips, A.J.K.; Wright, K.P.; Skene, D.J.; Brainard, G.C.; Boivin, D.B.; Glickman, G. A Review of Human Physiological Responses to Light: Implications for the Development of Integrative Lighting Solutions. Leukos 2021, 18, 387–414. [Google Scholar] [CrossRef]
- Houser, K.; Boyce, P.; Zeitzer, J.; Herf, M. Human-centric lighting: Myth, magic or metaphor? Light. Res. Technol. 2021, 53, 97–118. [Google Scholar] [CrossRef]
- Berson, D.M.; Dunn, F.A.; Takao, M. Phototransduction by retinal ganglion cells that set the circadian clock. Science 2002, 295, 1070–1073. [Google Scholar] [CrossRef] [PubMed]
- Hattar, S.; Liao, H.W.; Takao, M.; Berson, D.M.; Yau, K.W. Melanopsin-containing retinal ganglion cells: Architecture, projections, and intrinsic photosensitivity. Science 2002, 295, 1065–1070. [Google Scholar] [CrossRef]
- Brainard, G.C.; Hanifin, J.P.; Greeson, J.M.; Byrne, B.; Glickman, G.; Gerner, E.; Rollag, M.D. Action spectrum for melatonin regulation in humans: Evidence for a novel circadian photoreceptor. J. Neurosci. 2001, 21, 6405–6412. [Google Scholar] [CrossRef]
- Thapan, K.; Arendt, J.; Skene, D.J. An action spectrum for melatonin suppression: Evidence for a novel non-rod, non-cone photoreceptor system in humans. J. Physiol. 2001, 535, 261–267. [Google Scholar] [CrossRef]
- Khademagha, P.; Aries, M.B.C.; Rosemann, A.L.P.; van Loenen, E.J. Implementing non-image-forming effects of light in the built environment: A review on what we need. Build. Environ. 2016, 108, 263–272. [Google Scholar] [CrossRef]
- Rea, M.S.; Figueiro, M.G.; Bullough, J.D.; Bierman, A. A model of phototransduction by the human circadian system. Brain Res. Rev. 2005, 50, 213–228. [Google Scholar] [CrossRef]
- Rea, M.S.; Figueiro, M.G.; Bierman, A.; Hamner, R. Modelling the spectral sensitivity of the human circadian system. Light. Res. Technol. 2012, 44, 386–396. [Google Scholar] [CrossRef]
- Figueiro, M.G.; Kalsher, M.; Steverson, B.C.; Heerwagen, J.; Kampschroer, K.; Rea, M.S. Circadian-effective light and its impact on alertness in office workers. Light. Res. Technol. 2019, 51, 171–183. [Google Scholar] [CrossRef]
- Underwriters Laboratory. Design Guidelines for Promoting Circadian Entrainment with Light for Day-Active People. In UL Design Guideline 24480, 1st ed.; Underwriters Laboratories UL: Northbrook, IL, USA, 2019. [Google Scholar]
- Lucas, R.J.; Peirson, S.; Berson, D.; Brown, T.; Cooper, H.C.; Czeisler, C.A.; Figueiro, M.G.; Gamlin, P.D.; Lockley, S.W.; O’Hagan, J.B.; et al. Measuring and using light in the melanopsin age. Trends Neurosci. 2014, 37, 1–9. [Google Scholar] [CrossRef] [PubMed]
- Enezi, J.; Revell, V.; Brown, T.; Wynne, J.; Schlangen, L.; Lucas, R. A “melanopic” spectral efficiency function predicts the sensitivity of melanopsin photoreceptors to polychromatic lights. J. Biol. Rhythm. 2011, 26, 314–323. [Google Scholar] [CrossRef] [PubMed]
- CIE. CIE System for Metrology of Optical Radiation for ipRGC-Influenced Responses to Light—CIE S 026/E:2018; CIE Central Bureau: Vienna, Austria, 2018. [Google Scholar]
- Brown, T.M. Melanopic illuminance defines the magnitude of human circadian light responses under a wide range of conditions. J. Pineal. Res. 2020, 69, 12655. [Google Scholar] [CrossRef] [PubMed]
- CIE. Position statement on non-visual effects of light. In Recommendating Proper Light at the Proper Time, 2nd ed.; CIE Central Bureau: Vienna, Austria, 2019. [Google Scholar]
- Altomonte, S.; Allen, J.; Bluyssen, P.M.; Brager, G.; Heschong, L.; Loder, A.; Schiavon, S.; Veitch, J.V.; Wang, L.; Wargocki, P. Ten questions concerning well-being in the built environment. Build. Environ. 2020, 180, 106949. [Google Scholar] [CrossRef]
- Alle, J.G.; Bernstein, A.; Cao, X.; Eitland, E.S.; Flanigan, S.; Gokhale, M.; Goodman, J.M.; Klager, S.; Klingensmith, L.; Cedeno Laurent, J.G.; et al. The 9 Foundations of a Healthy Building; Healthy Buildings, Harvard T.H. Chan School of Public Health: Boston, MA, USA, 2017. [Google Scholar]
- UK Green Building Council Health and Wellbeing in Homes; UK Green Building Council, The Building Centre: London, UK, 2016.
- UK Green Building Council Health, Wellbeing & Productivity in Offices; World Green Building Council: London, UK, 2014.
- Eitland, E.; Klingensmith, L.; MacNaughton, P.; Cedeno Laurent, J.; Spengler, J.; Bernstein, A.; Allen, J.G. Schools for Health: Foundations for Student Success; Healthy Buildings Team at Harvard T.H. Chan School of Public Health: Boston, MA, USA, 2021. [Google Scholar]
- Carlin, A.; Lo Verso, V.R.M.; Invernizzi, S.; Polato, A. Optimised daylighting for comfort and energy saving for the factory of the future. Int. J. Mech. Control. 2017, 18, 15–29. [Google Scholar]
- International Well Building Institute. WELL Building Standard v2. Q1–Q2; International Well Building Institute: New York, NY, USA, 2023. [Google Scholar]
- ISO/CIE TR 21783; Light and Lighting—Integrative Lighting—Non-Visual Effects. ISO/CIE, International Standards Organization and Commission Internationale de l’Eclairage: Geneva, Switzerland, 2022.
- CIE. CIE DIS 017:2016 ILV: International Lighting Vocabulary, 2nd ed.; CIE Central Bureau: Vienna, Austria, 2016. [Google Scholar]
- Bellia, L.; Fragliasso, F. Good Places to Live and Sleep Well: A Literature Review about the Role of Architecture in Determining Non-Visual Effects of Light. Int. J. Environ. Res. Public Health 2021, 18, 1002. [Google Scholar] [CrossRef]
- Safranek, S.; Abboushi, B.; Davis, B. At the Intersection: Daylight, Electric Light and Circadian Guidelines Now Converge; Lighting Design & Application; The Magazine of the Illuminating Engineering Society: New York, NY, USA, 2023. [Google Scholar]
- Figueiro, M.G.; Overington, D. Self-luminous devices and melatonin suppression in adolescents. Light. Res. Technol. 2016, 48, 966–975. [Google Scholar] [CrossRef]
- López-Chao, V.; Lorenzo, A.A.; Martin-Gutiérrez, J. Architectural Indoor Analysis: A Holistic Approach to Understand the Relation of Higher Education Classrooms and Academic Performance. Sustainability 2019, 11, 6558. [Google Scholar] [CrossRef]
- Ricciardi, P.; Buratti, C. Environmental quality of university classrooms: Subjective and objective evaluation of the thermal, acoustic, and lighting comfort conditions. Build. Environ. 2018, 127, 23–36. [Google Scholar] [CrossRef]
- Acosta, I.; Campano, M.A.; Leslie, R.; Radetsky, L. Daylighting design for healthy environments: Analysis of educational spaces for optimal circadian stimulus. Sol. Energy 2019, 193, 584–596. [Google Scholar] [CrossRef]
- Ezpeleta, S.; Orduna-Hospital, E.; Aporta, J.; Luesma, M.J.; Pinilla, I.; Sánchez-Cano, A. Evaluation of Visual and Nonvisual Levels of Daylight from Spectral Power Distributions Considering Orientation and Seasonality. Appl. Sci. 2021, 11, 5996. [Google Scholar] [CrossRef]
- 12464-1:2011; Light and Lighting—Lighting of Work Places—Part 1: Indoor Work Places. CEN (Comité Européen de Normalisation): Brussels, Belgium, 2011.
- 12464-1:2021; Light and Lighting—Lighting of Work Places—Part 1: Indoor Work Places. CEN (Comité Européen de Normalisation): Brussels, Belgium, 2021.
- Inanici, M.; ZGF Architects. Lark Spectral Lighting. 2015. Available online: https://faculty.washington.edu/inanici/Lark/Lark_home_page.html (accessed on 15 July 2023).
- Maskarenj, M.; Deroisy, B.; Altomonte, S. A new tool and workflow for the simulation of the non-image forming effects of light. Energy Build. 2022, 262, 112012. [Google Scholar] [CrossRef]
- Balakrishnan, P.; Jakubiec, J.A. Spectral Rendering with Daylight: A Comparison of Two Spectral Daylight Simulation Platforms. In Proceedings of the 16th IBPSA Conference, Rome, Italy, 2–4 September 2019; pp. 1191–1198. [Google Scholar]
- Pierson, C.; Aarts, M.; Andersen, M. Validation of Spectral Simulation Tools for the Prediction of Indoor Daylight Exposure. In Proceedings of the 17th IBPSA Conference Building Simulation 2021, Bruges, Belgium, 1–3 September 2021. [Google Scholar]
- Illuminating Engineering Society. IES Lighting Measurements (LM) 83-12, Approved Method: IES Spatial Daylight Autonomy (sDA) and Annual Sunlight Exposure (ASE); IESNA: New York, NY, USA, 2012. [Google Scholar]
- Safranek, S.; Collier, J.C.; Wilkerson, A.; Davis, R.G. Energy impact of human health and wellness lighting recommendations for office and classroom applications. Energy Build. 2020, 226, 110365. [Google Scholar] [CrossRef]
Figure 1.
Views that show the position of the 3 classrooms analyzed, having three different orientations. (a) View from SW, (b) plan view.
Figure 1.
Views that show the position of the 3 classrooms analyzed, having three different orientations. (a) View from SW, (b) plan view.
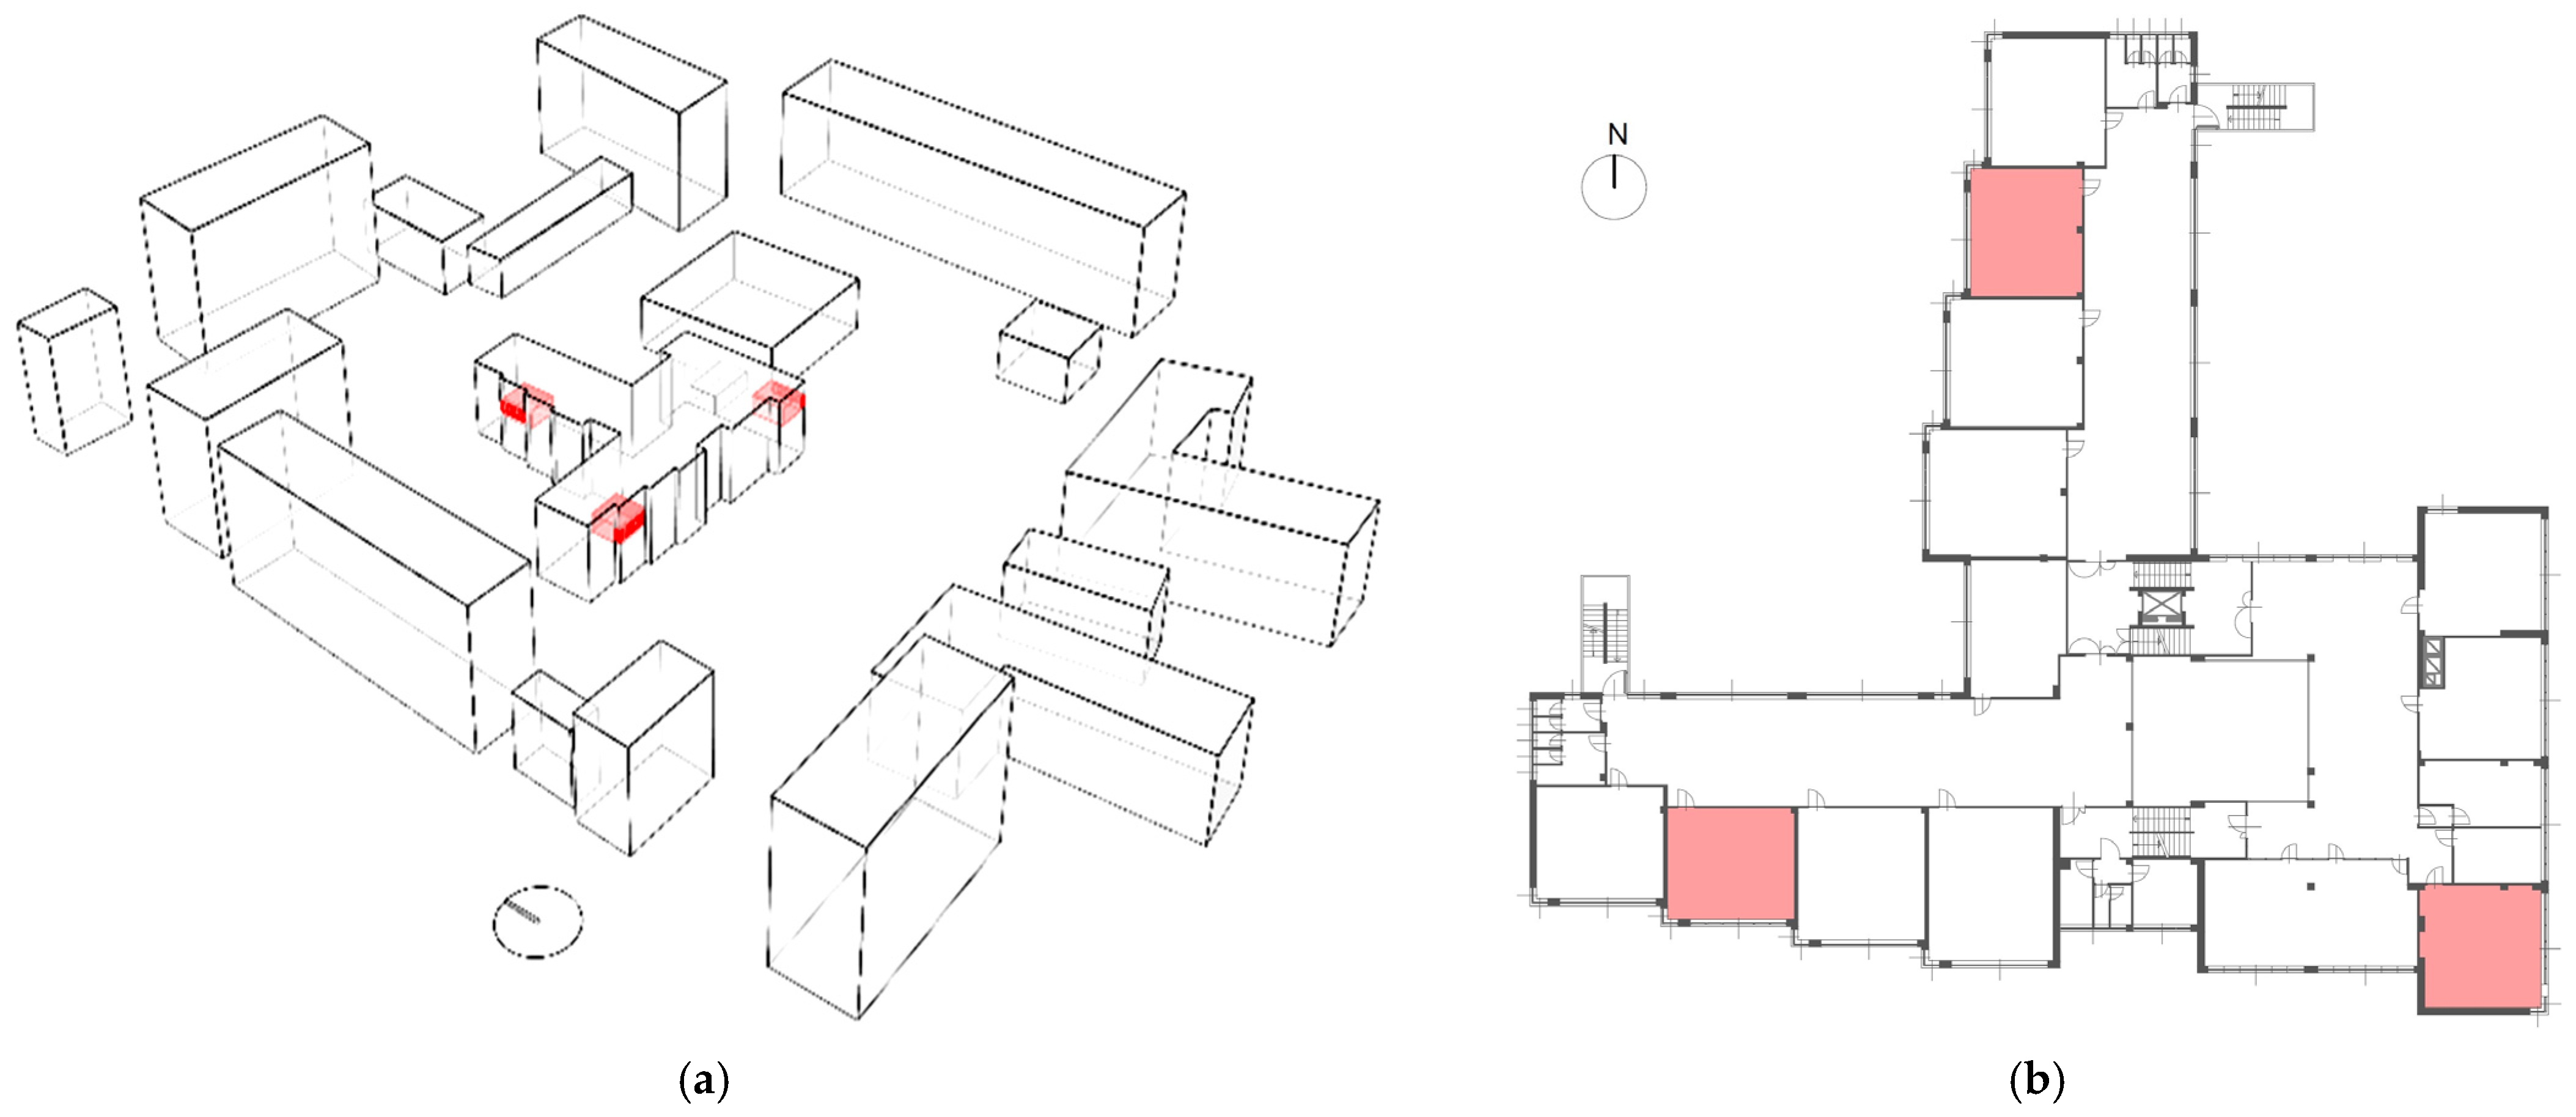
Figure 2.
Plan view of the classroom with the position of luminaires.

Figure 3.
Light reflectance/transmittance spectral properties of main materials measured in the classrooms.
Figure 3.
Light reflectance/transmittance spectral properties of main materials measured in the classrooms.

Figure 4.
Grid points and view direction assumed for both field measurements and ALFA daylighting simulations.
Figure 4.
Grid points and view direction assumed for both field measurements and ALFA daylighting simulations.

Figure 5.
Spectra of the light emitted by the LED lighting systems. It should be noted that LED types 4 and 5 have the same spectral distribution, which means that the two curves coincide.
Figure 5.
Spectra of the light emitted by the LED lighting systems. It should be noted that LED types 4 and 5 have the same spectral distribution, which means that the two curves coincide.
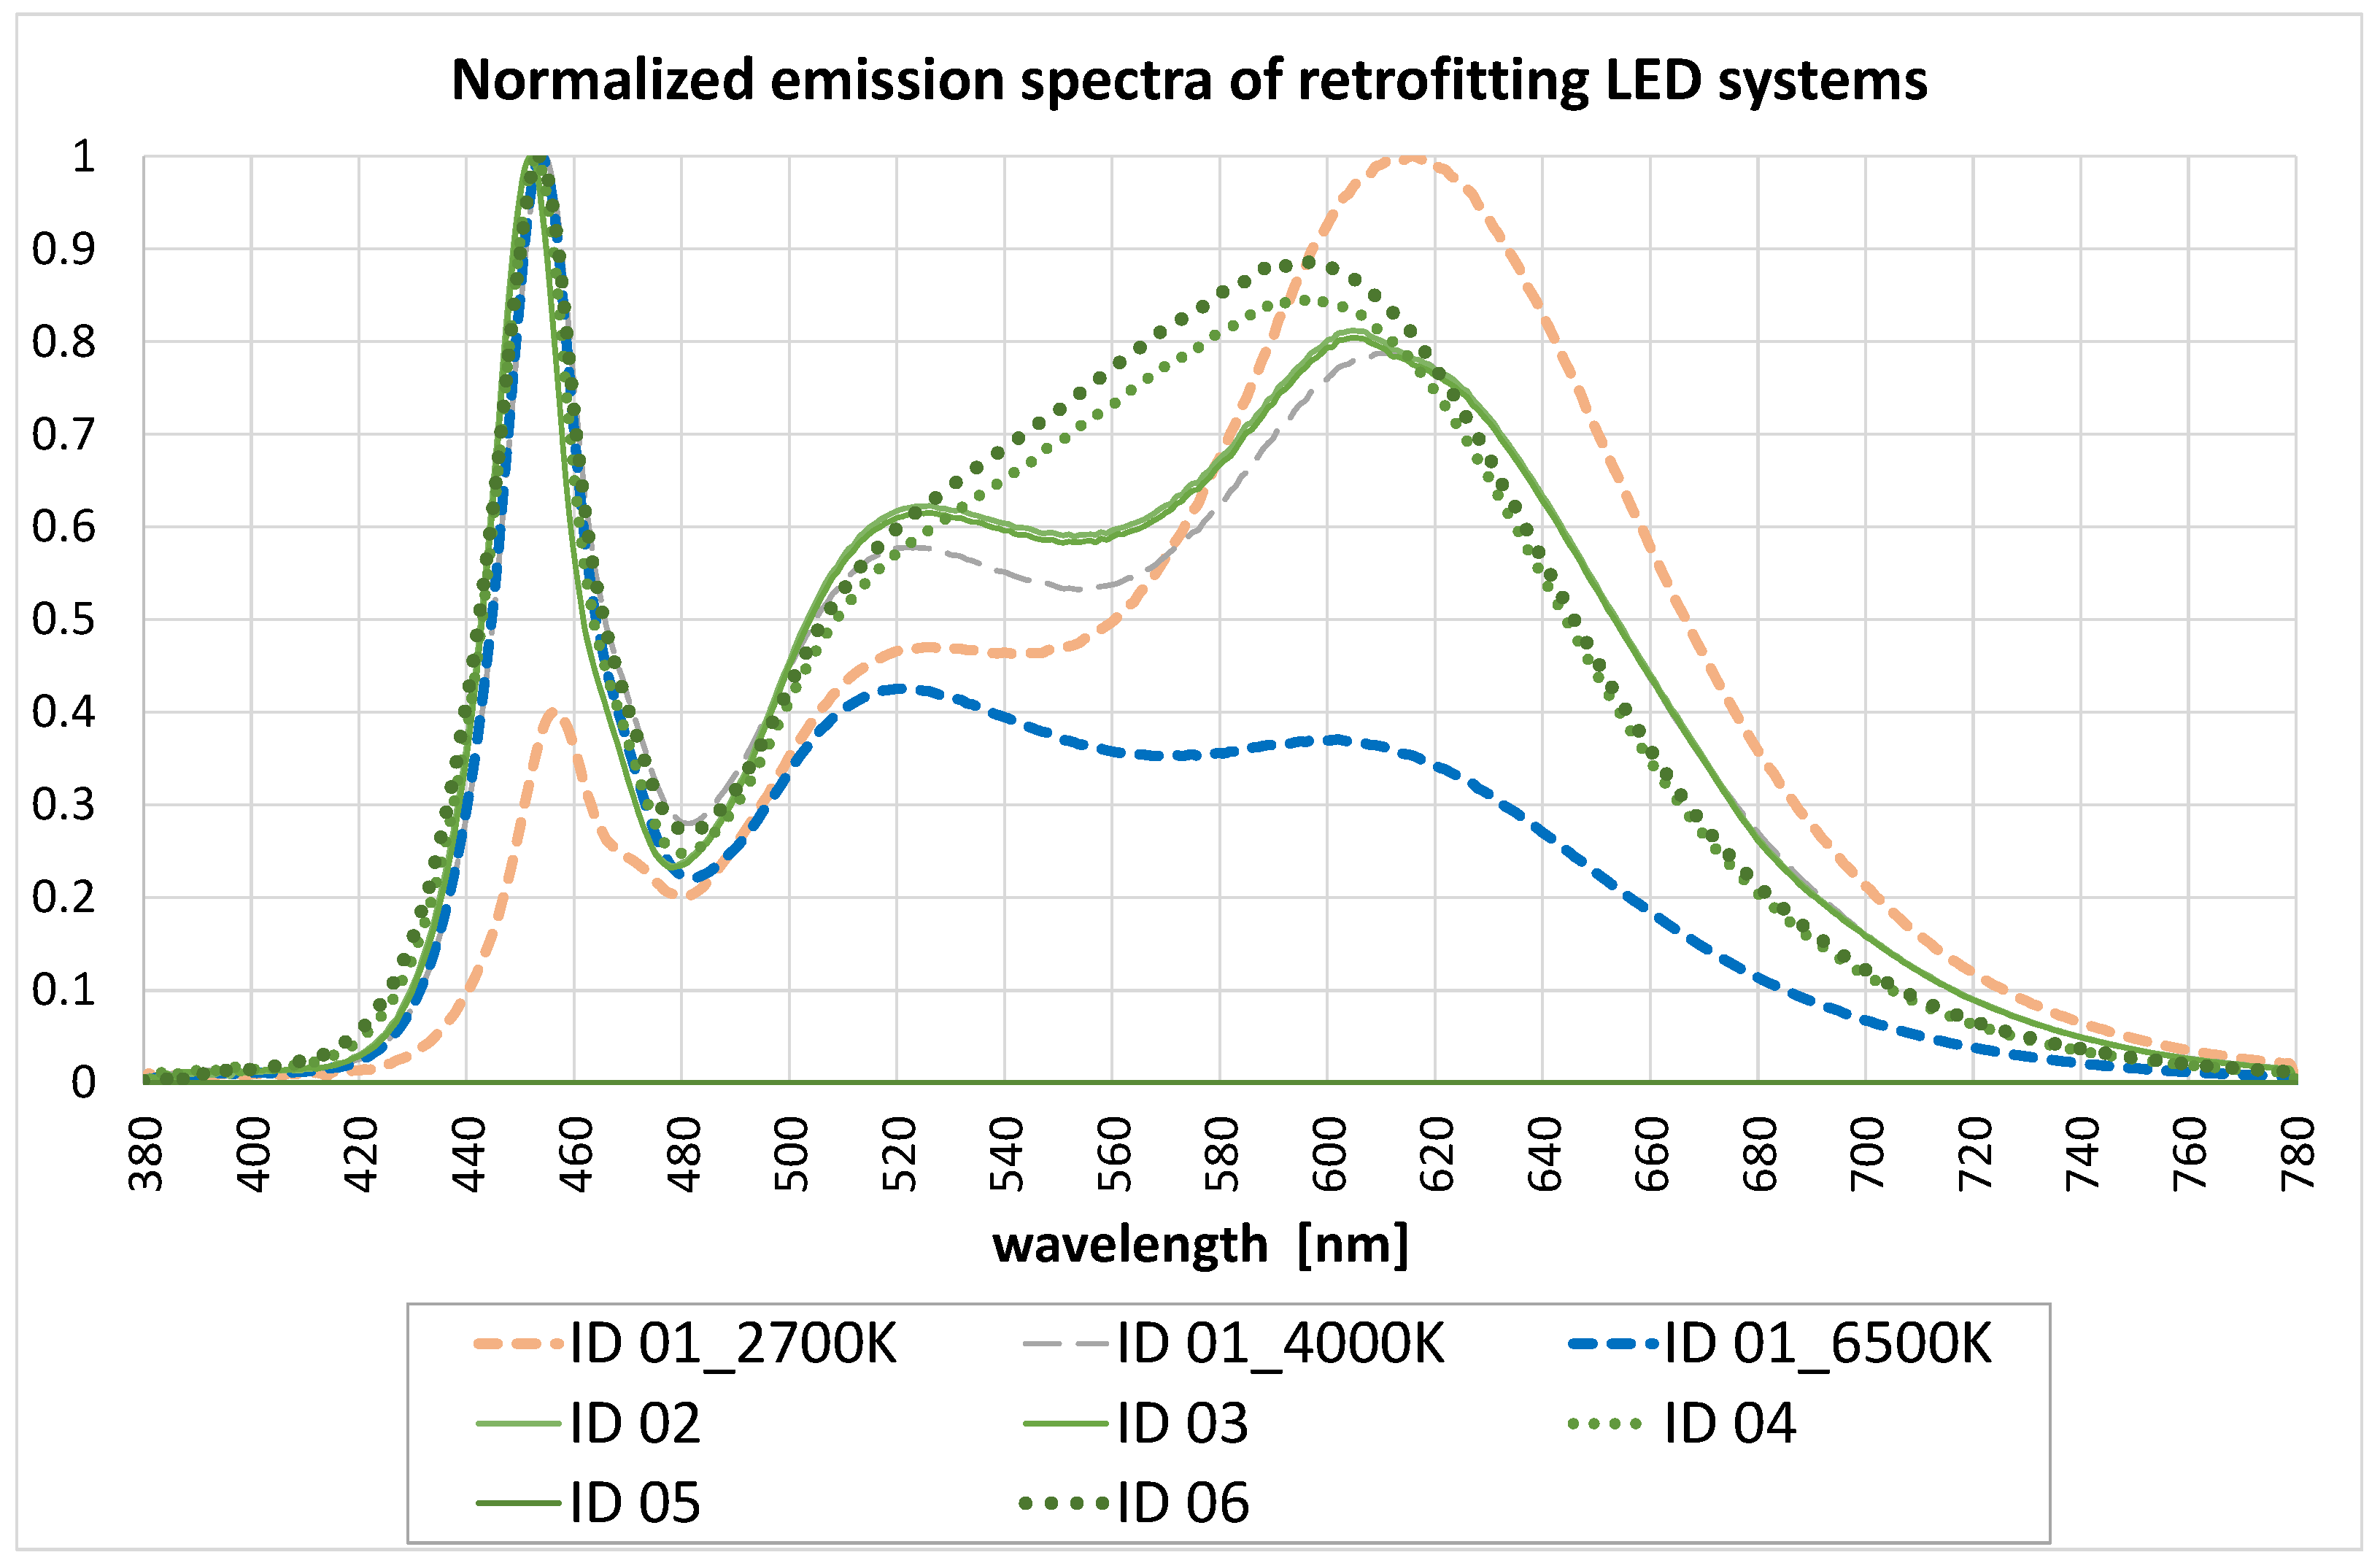
Figure 6.
(a) shading utilization profile, under clear skies, for all the days and orientations considered, (b) lighting system utilization profile for all the skies, days, and orientations considered.
Figure 6.
(a) shading utilization profile, under clear skies, for all the days and orientations considered, (b) lighting system utilization profile for all the skies, days, and orientations considered.
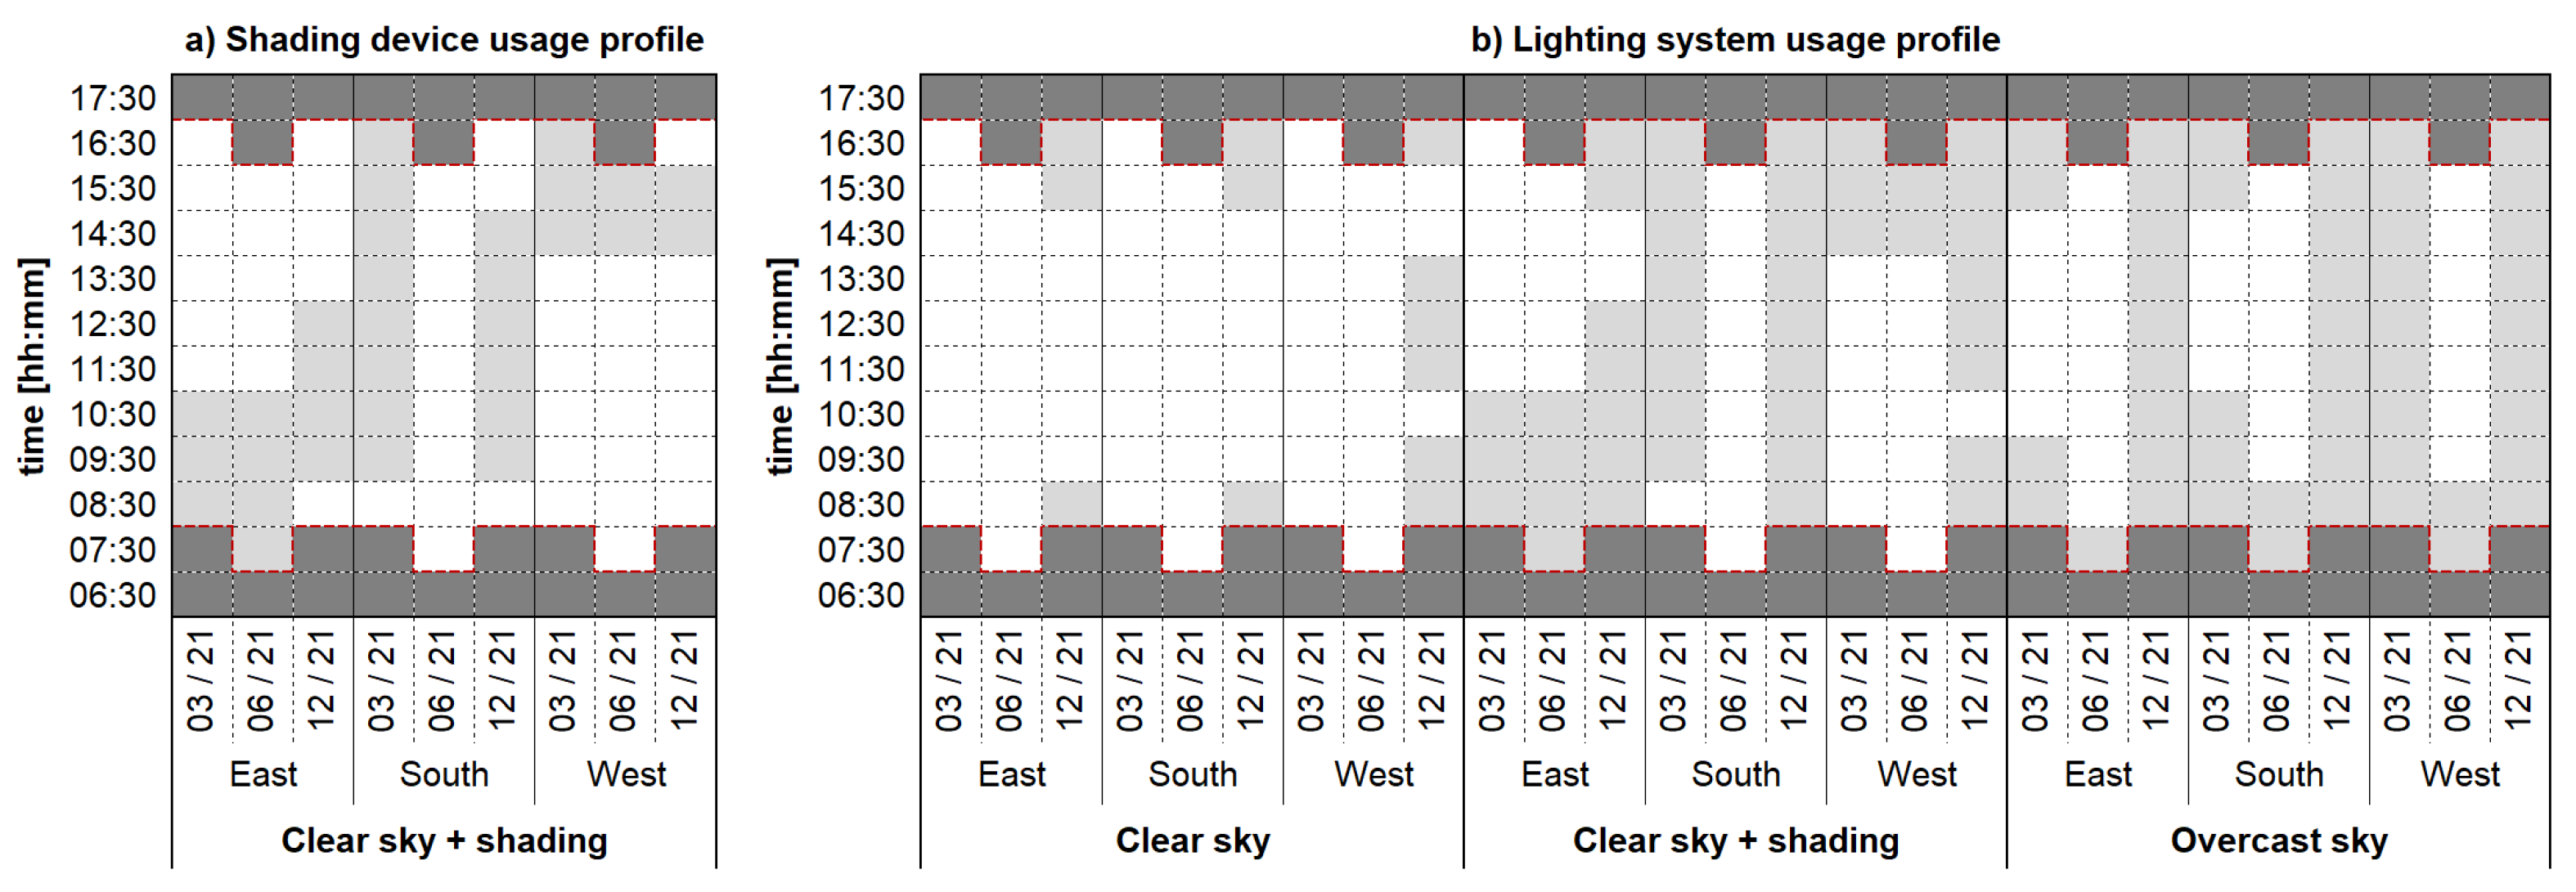
Figure 7.
Daylight contribution to the fraction of desk area that meets the WELL m-EDI daily recommendations for all the days, orientations, and sky conditions considered: (a) Fraction of desk area where m-EDI > 109 lx (one-point WELL credit), (b) fraction of desk area where m-EDI > 163 lx (three-point WELL credit).

Figure 8.
Daylight contribution to the fraction of desk area where the workplane photopic illuminance is over the reference target value Ep_wp > 500 lx for at least 50% of the occupied time (which corresponds to 4 h per day, as also required by the WELL criterion.
Figure 8.
Daylight contribution to the fraction of desk area where the workplane photopic illuminance is over the reference target value Ep_wp > 500 lx for at least 50% of the occupied time (which corresponds to 4 h per day, as also required by the WELL criterion.

Figure 9.
Results from field measurements for electric lighting: (a) Eye-level melanopic illuminance m-EDI_eye, workplane photopic illuminance Ep_eye, eye level photopic illuminance Ep_eye, (b) ratio of photopic illuminance at the eye level to photopic workplane illuminance, Ep_eye/Ep_wp; melanopic ratio. Note: M/P corresponds to m-DER.
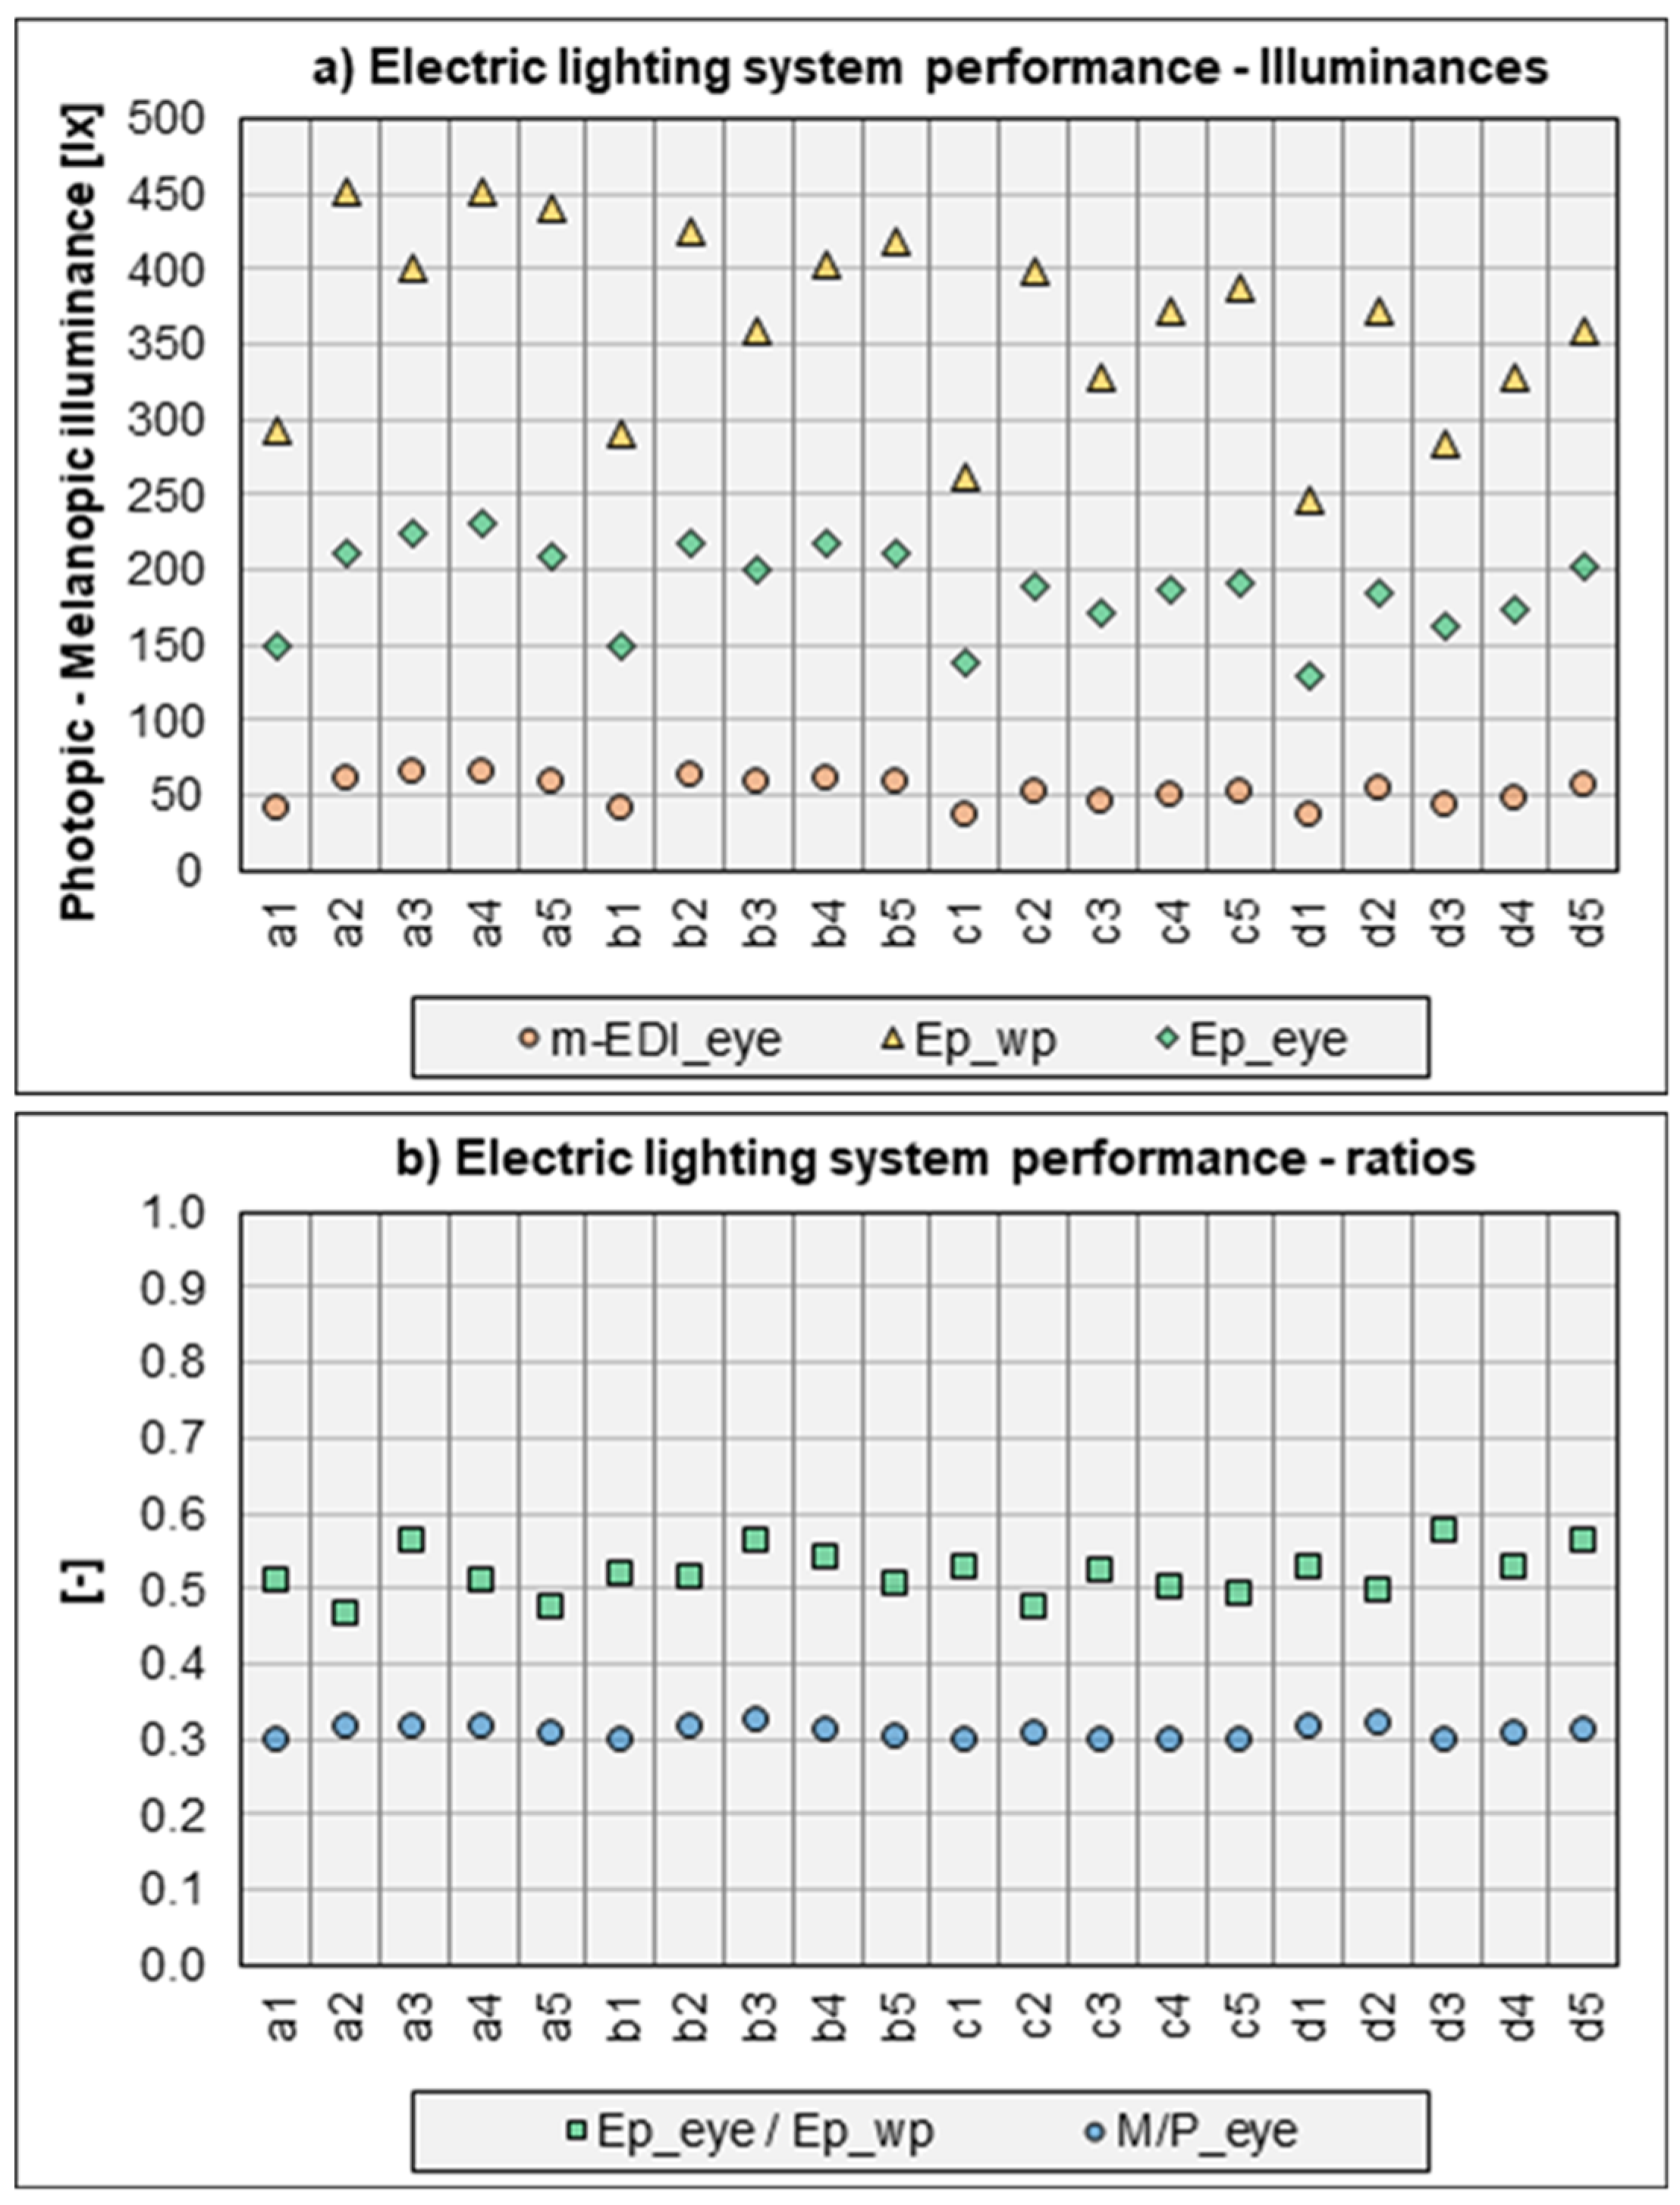
Figure 10.
Melanopic content of the lighting systems that were assumed for potential retrofitting: (a) Fraction of desk area that meets the WELL criteria m-EDI > 163 lx or m-EDI > 109 lx, (b) average m-DER value calculated by averaging the m-EDI values at all sensor points (eye level).
Figure 10.
Melanopic content of the lighting systems that were assumed for potential retrofitting: (a) Fraction of desk area that meets the WELL criteria m-EDI > 163 lx or m-EDI > 109 lx, (b) average m-DER value calculated by averaging the m-EDI values at all sensor points (eye level).
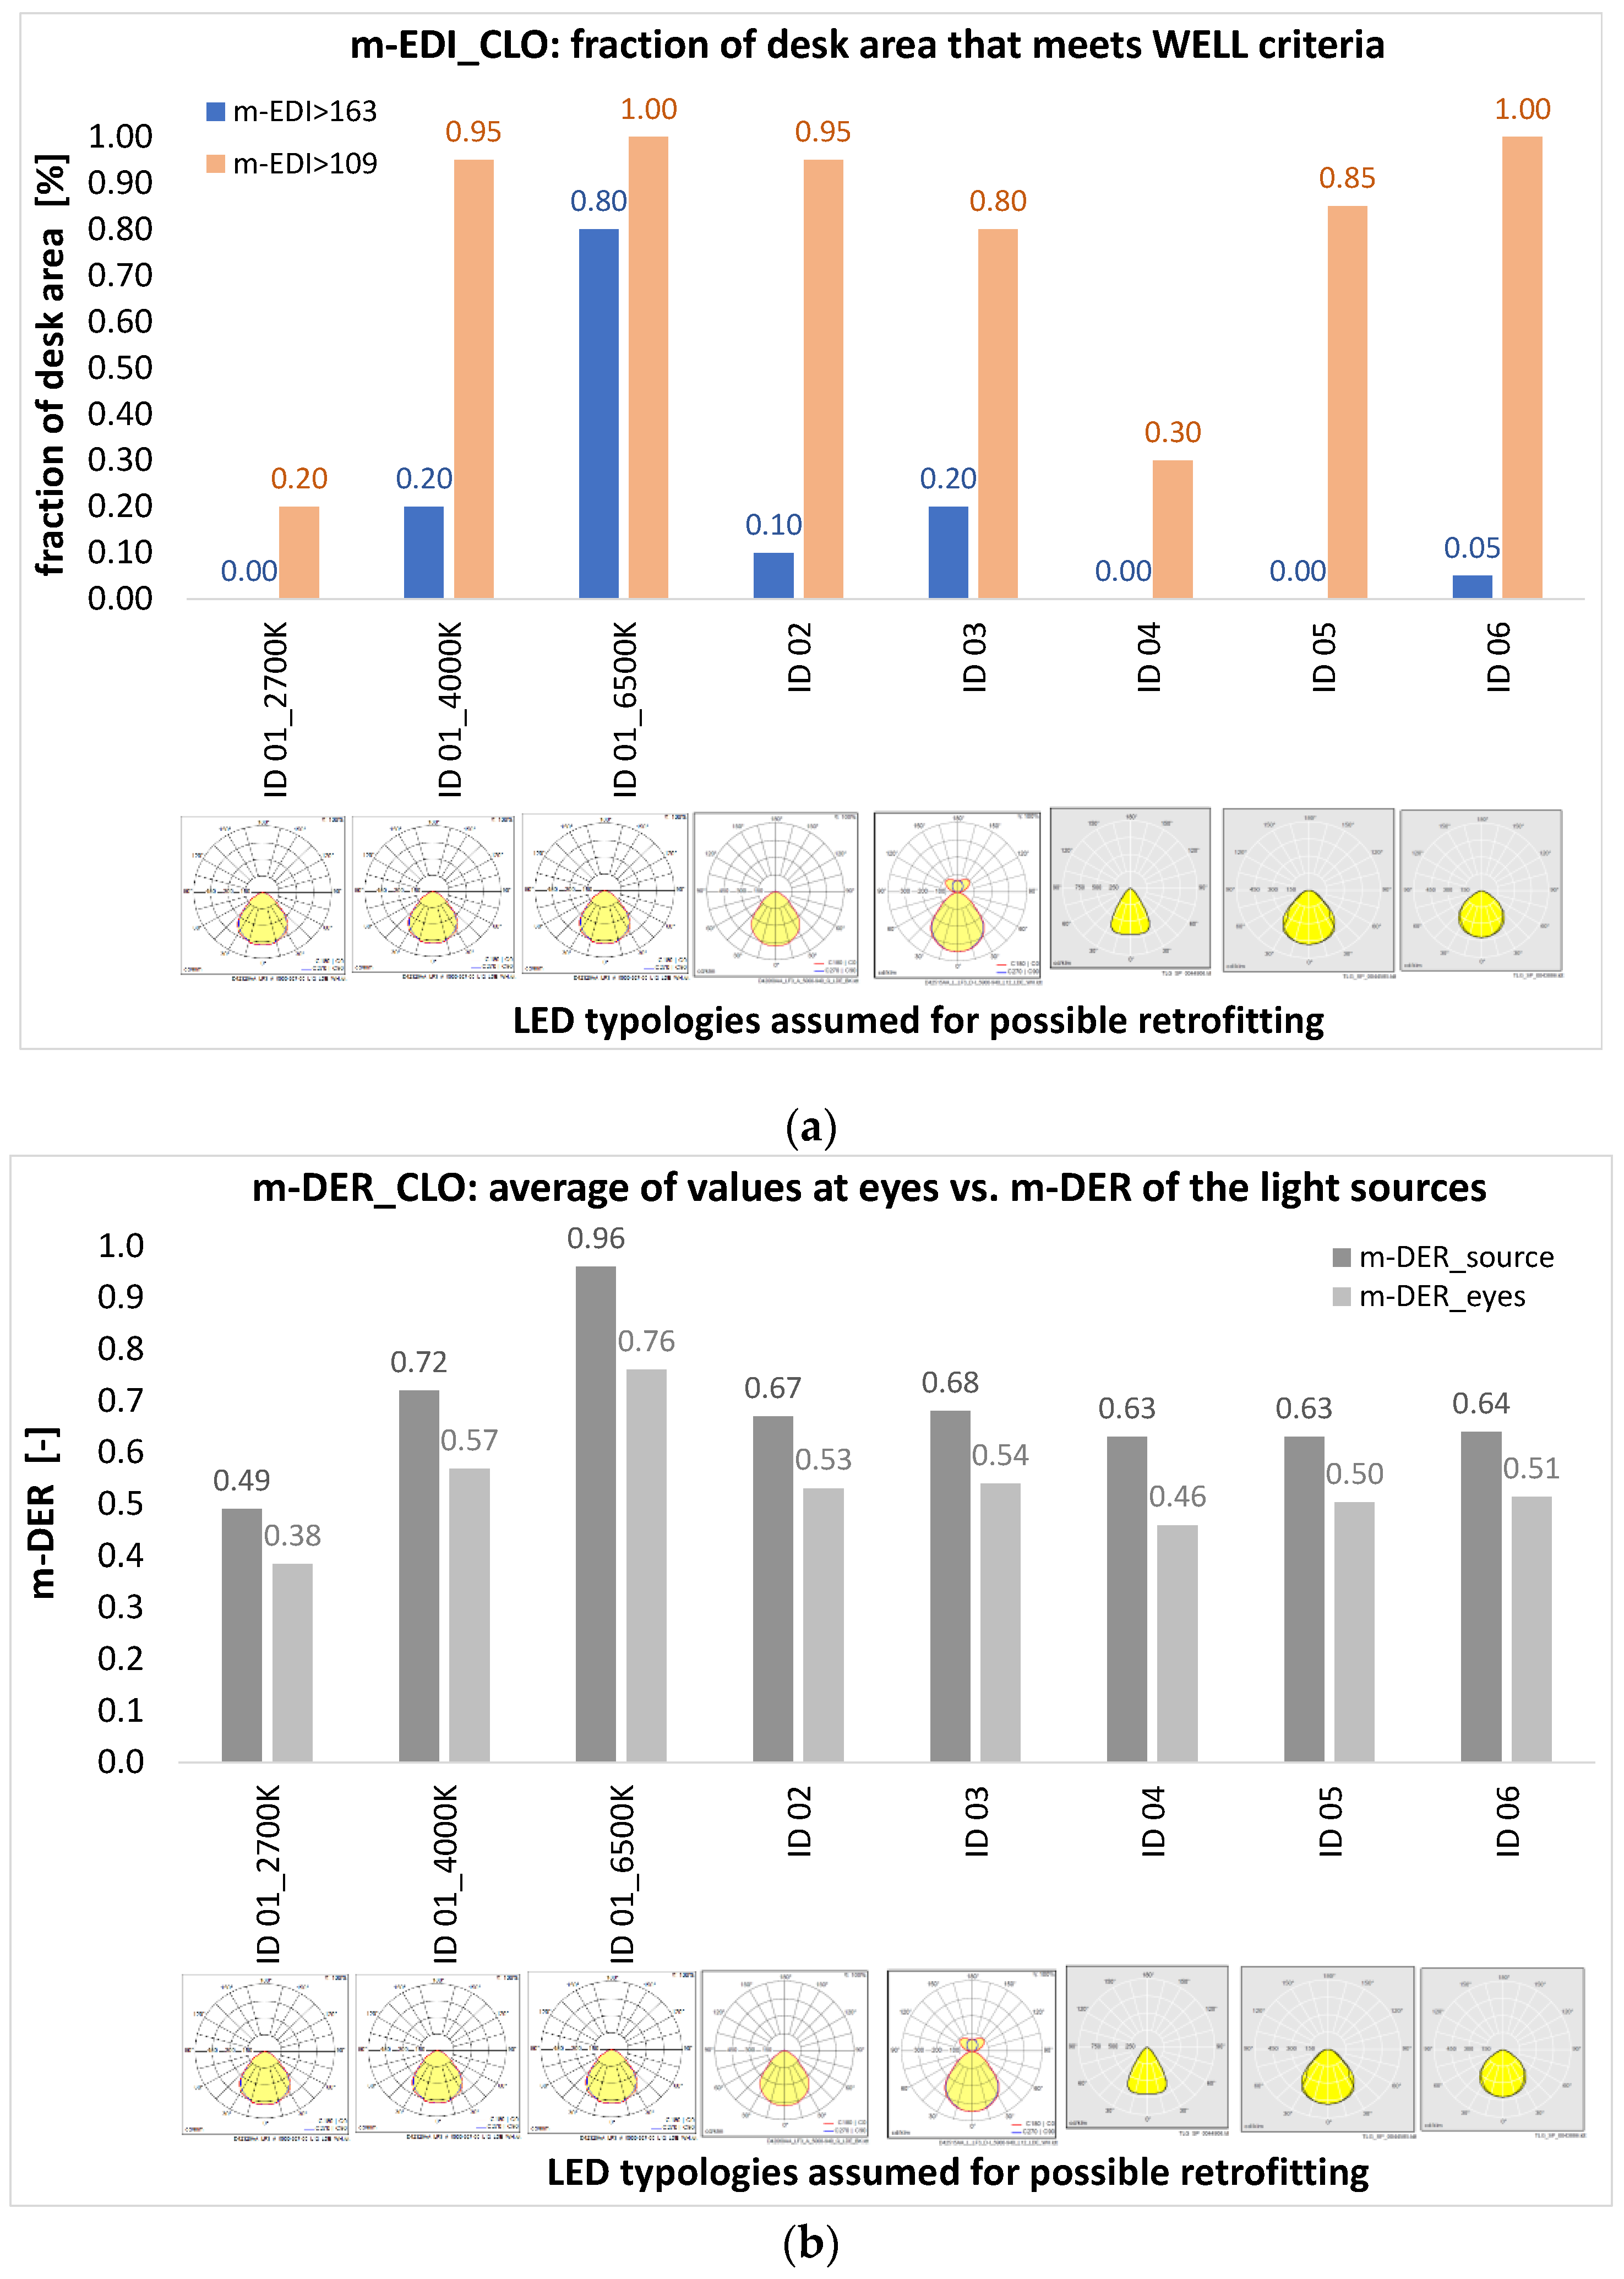
Figure 11.
Ratio of the photopic eye-level vertical illuminance to the photopic workplan illuminance (Ev,eye/Ewp)vis over the desk area.
Figure 11.
Ratio of the photopic eye-level vertical illuminance to the photopic workplan illuminance (Ev,eye/Ewp)vis over the desk area.
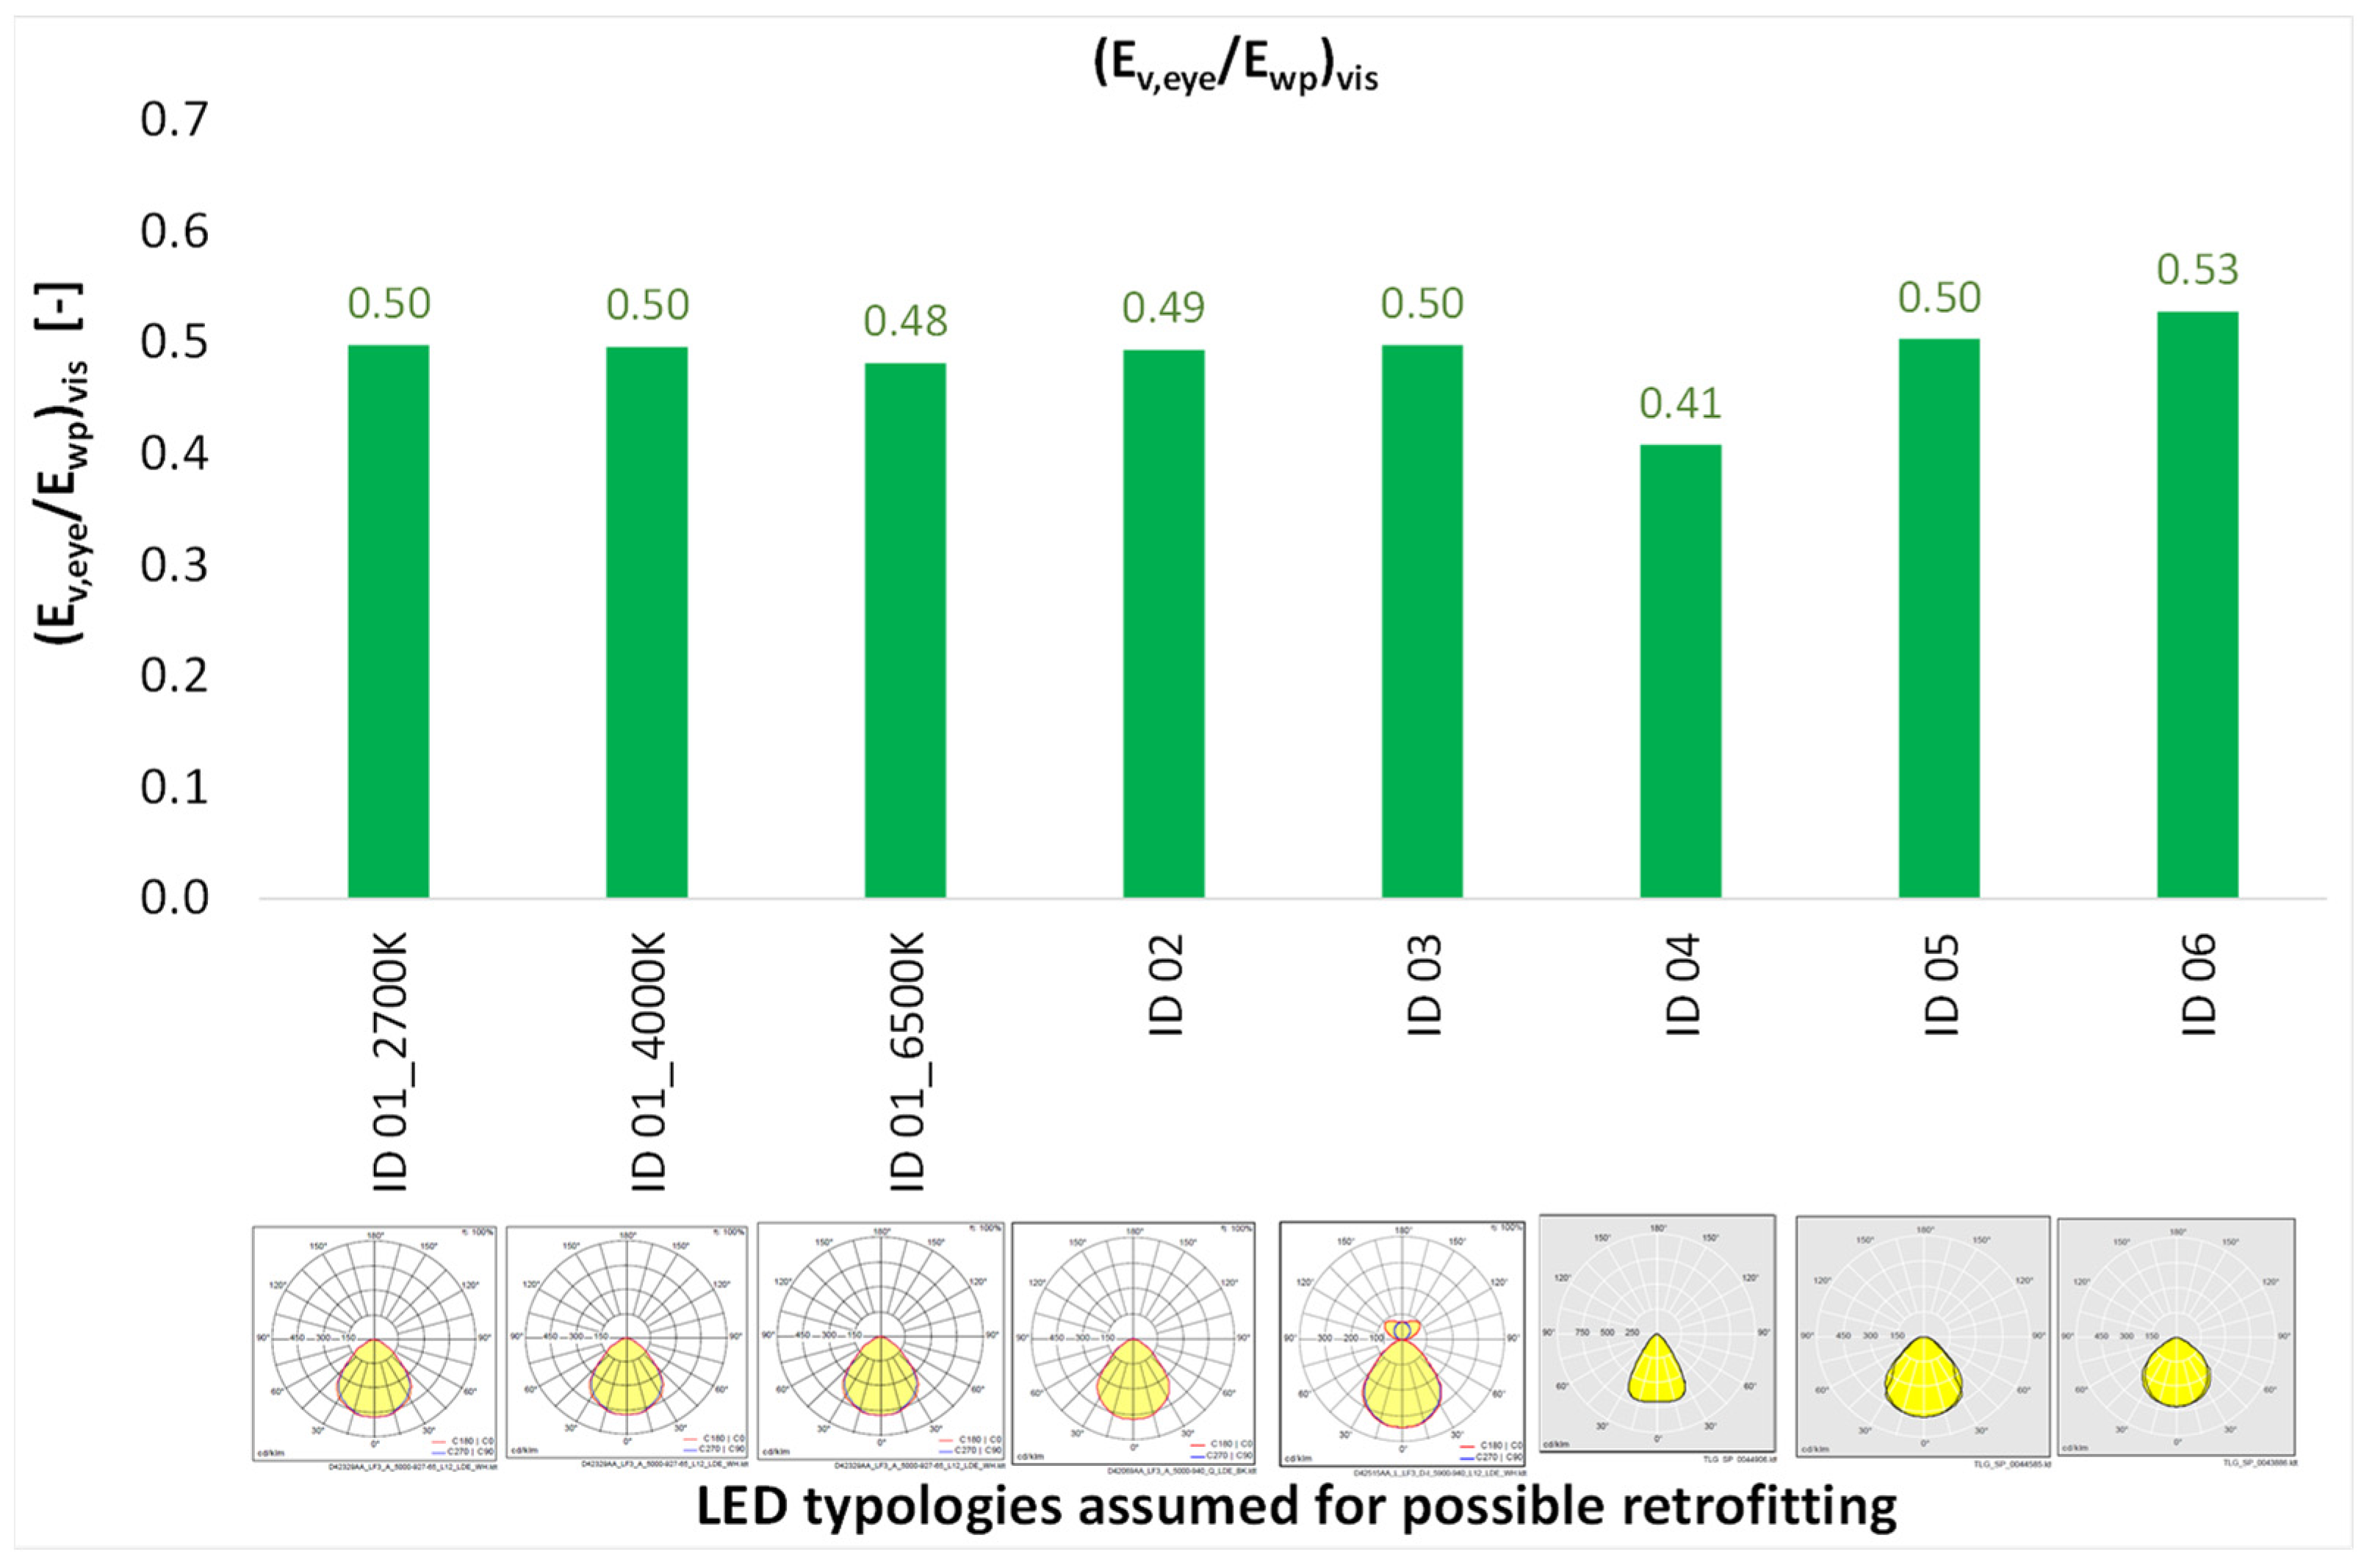
Figure 12.
Daylight and supplementary fluorescent electric lighting contributions to the fraction of desk area that meets the WELL m-EDI daily recommendation for all the days, orientations, and sky conditions considered: (a) Fraction of desk area where m-EDI > 109 lx (one-point WELL credit), (b) fraction of desk area where m-EDI > 163 lx (three-point WELL credit).

Figure 13.
Daylight and LED electric lighting contributions to the fraction of space area where the WELL m-EDI daily requirement is met. The fraction of desk area where m-EDI ≥ 163 lx is shown only.
Figure 13.
Daylight and LED electric lighting contributions to the fraction of space area where the WELL m-EDI daily requirement is met. The fraction of desk area where m-EDI ≥ 163 lx is shown only.

Table 1.
WELL protocol indications for circadian lighting. Recommendations set ‘for all spaces except dwelling units’.
Table 1.
WELL protocol indications for circadian lighting. Recommendations set ‘for all spaces except dwelling units’.
| 1 Point | 3 Points |
|---|---|
| at least 136 lux m-EDI; or at least 109 m-EDI 1 and 70% of all workstations are within 4.88 m of transparent envelope glazing. Visible light transmittance Tv ≥ 40%; or at least 109 m-EDI 1 and average sDA300,50% is achieved for >75% of regularly occupied floor area | at least 250 lux m-EDI; or at least 163 m-EDI 1 and 70% of all workstations are within 4.88 m of transparent envelope glazing. Visible light transmittance Tv ≥ 40%; or at least 163 m-EDI 1 and average sDA300,50% is achieved for >75% of regularly occupied floor area |
1 The light level must be present on the vertical plane at the eye level to simulate the light entering the eye of the occupant for at least 4 h (beginning by noon at the latest) at the height of 0.45 m above workplane.
Table 2.
LED lighting systems considered potential retrofitting solutions.
| ID 01 | ID 02 | ID 03 | ID 04 | ID 05 | ID 06 |
|---|---|---|---|---|---|
| ceiling-mounted tunable white (TW) | ceiling-mounted | suspended (2.70 m above the floor) | ceiling-mounted | ceiling-mounted | ceiling-mounted |
 |  | 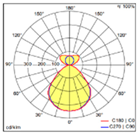 | 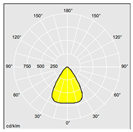 | 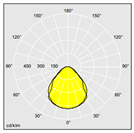 | 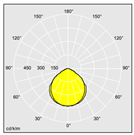 |
| Light output [lm] | |||||
| 5000 | 5000 | 5860 | 4300 | 4500 | 4250 |
| m-DER [-] | |||||
| 0.49 (2700 K) 0.72 (4000 K) 0.96 (6500 K) | 0.67 | 0.68 | 0.63 | 0.63 | 0.64 |
| Power [W] | |||||
| 59.7 | 47 | 52.4 | 35.6 | 32.2 | 40 |
| CRI [-] | |||||
| >90 | >90 | >90 | >80 | >80 | >80 |
| CCT [K] | |||||
| 2700–6500 | 4000 | 4000 | 4000 | 4000 | 4000 |
| Illuminance uniformity on workplane (average Em = 500 lx for all systems) | |||||
| 0.78 (2700 K) 0.78 (4000 K) 0.80 (6500 K) | 0.75 | 0.78 | 0.81 | 0.74 | 0.76 |
Disclaimer/Publisher’s Note: The statements, opinions and data contained in all publications are solely those of the individual author(s) and contributor(s) and not of MDPI and/or the editor(s). MDPI and/or the editor(s) disclaim responsibility for any injury to people or property resulting from any ideas, methods, instructions or products referred to in the content. |
© 2023 by the authors. Licensee MDPI, Basel, Switzerland. This article is an open access article distributed under the terms and conditions of the Creative Commons Attribution (CC BY) license (https://creativecommons.org/licenses/by/4.0/).
Share and Cite
MDPI and ACS Style
Lo Verso, V.R.M.; Giovannini, L.; Valetti, L.; Pellegrino, A. Integrative Lighting in Classrooms: Preliminary Results from Simulations and Field Measurements. Buildings 2023, 13, 2128. https://doi.org/10.3390/buildings13092128
AMA Style
Lo Verso VRM, Giovannini L, Valetti L, Pellegrino A. Integrative Lighting in Classrooms: Preliminary Results from Simulations and Field Measurements. Buildings. 2023; 13(9):2128. https://doi.org/10.3390/buildings13092128
Chicago/Turabian StyleLo Verso, Valerio R. M., Luigi Giovannini, Lodovica Valetti, and Anna Pellegrino. 2023. "Integrative Lighting in Classrooms: Preliminary Results from Simulations and Field Measurements" Buildings 13, no. 9: 2128. https://doi.org/10.3390/buildings13092128
Note that from the first issue of 2016, this journal uses article numbers instead of page numbers. See further details here.