
Quality Evaluation Approach for Prefabricated Buildings Using Ant Colony Algorithm and Simulated Annealing Algorithm to Optimize the Projection Pursuit Model
Abstract
:1. Introduction
1.1. Background of the Study
1.2. Literature Review
1.2.1. Research on Quality Assessment of Prefabricated Buildings
1.2.2. Ant Colony Algorithm
1.2.3. Projection Pursuit Methods
1.2.4. Simulated Annealing Algorithm
1.3. Problems and Main Contributions
2. Research Method
2.1. Evaluation Process
2.2. Prefabricated Component Combination Solution Method Based on Ant Colony
2.3. Simulated Annealing Algorithm to Optimize the Projection Pursuit Evaluation Model
2.4. Quality Evaluation Model of Prefabricated Component Combination
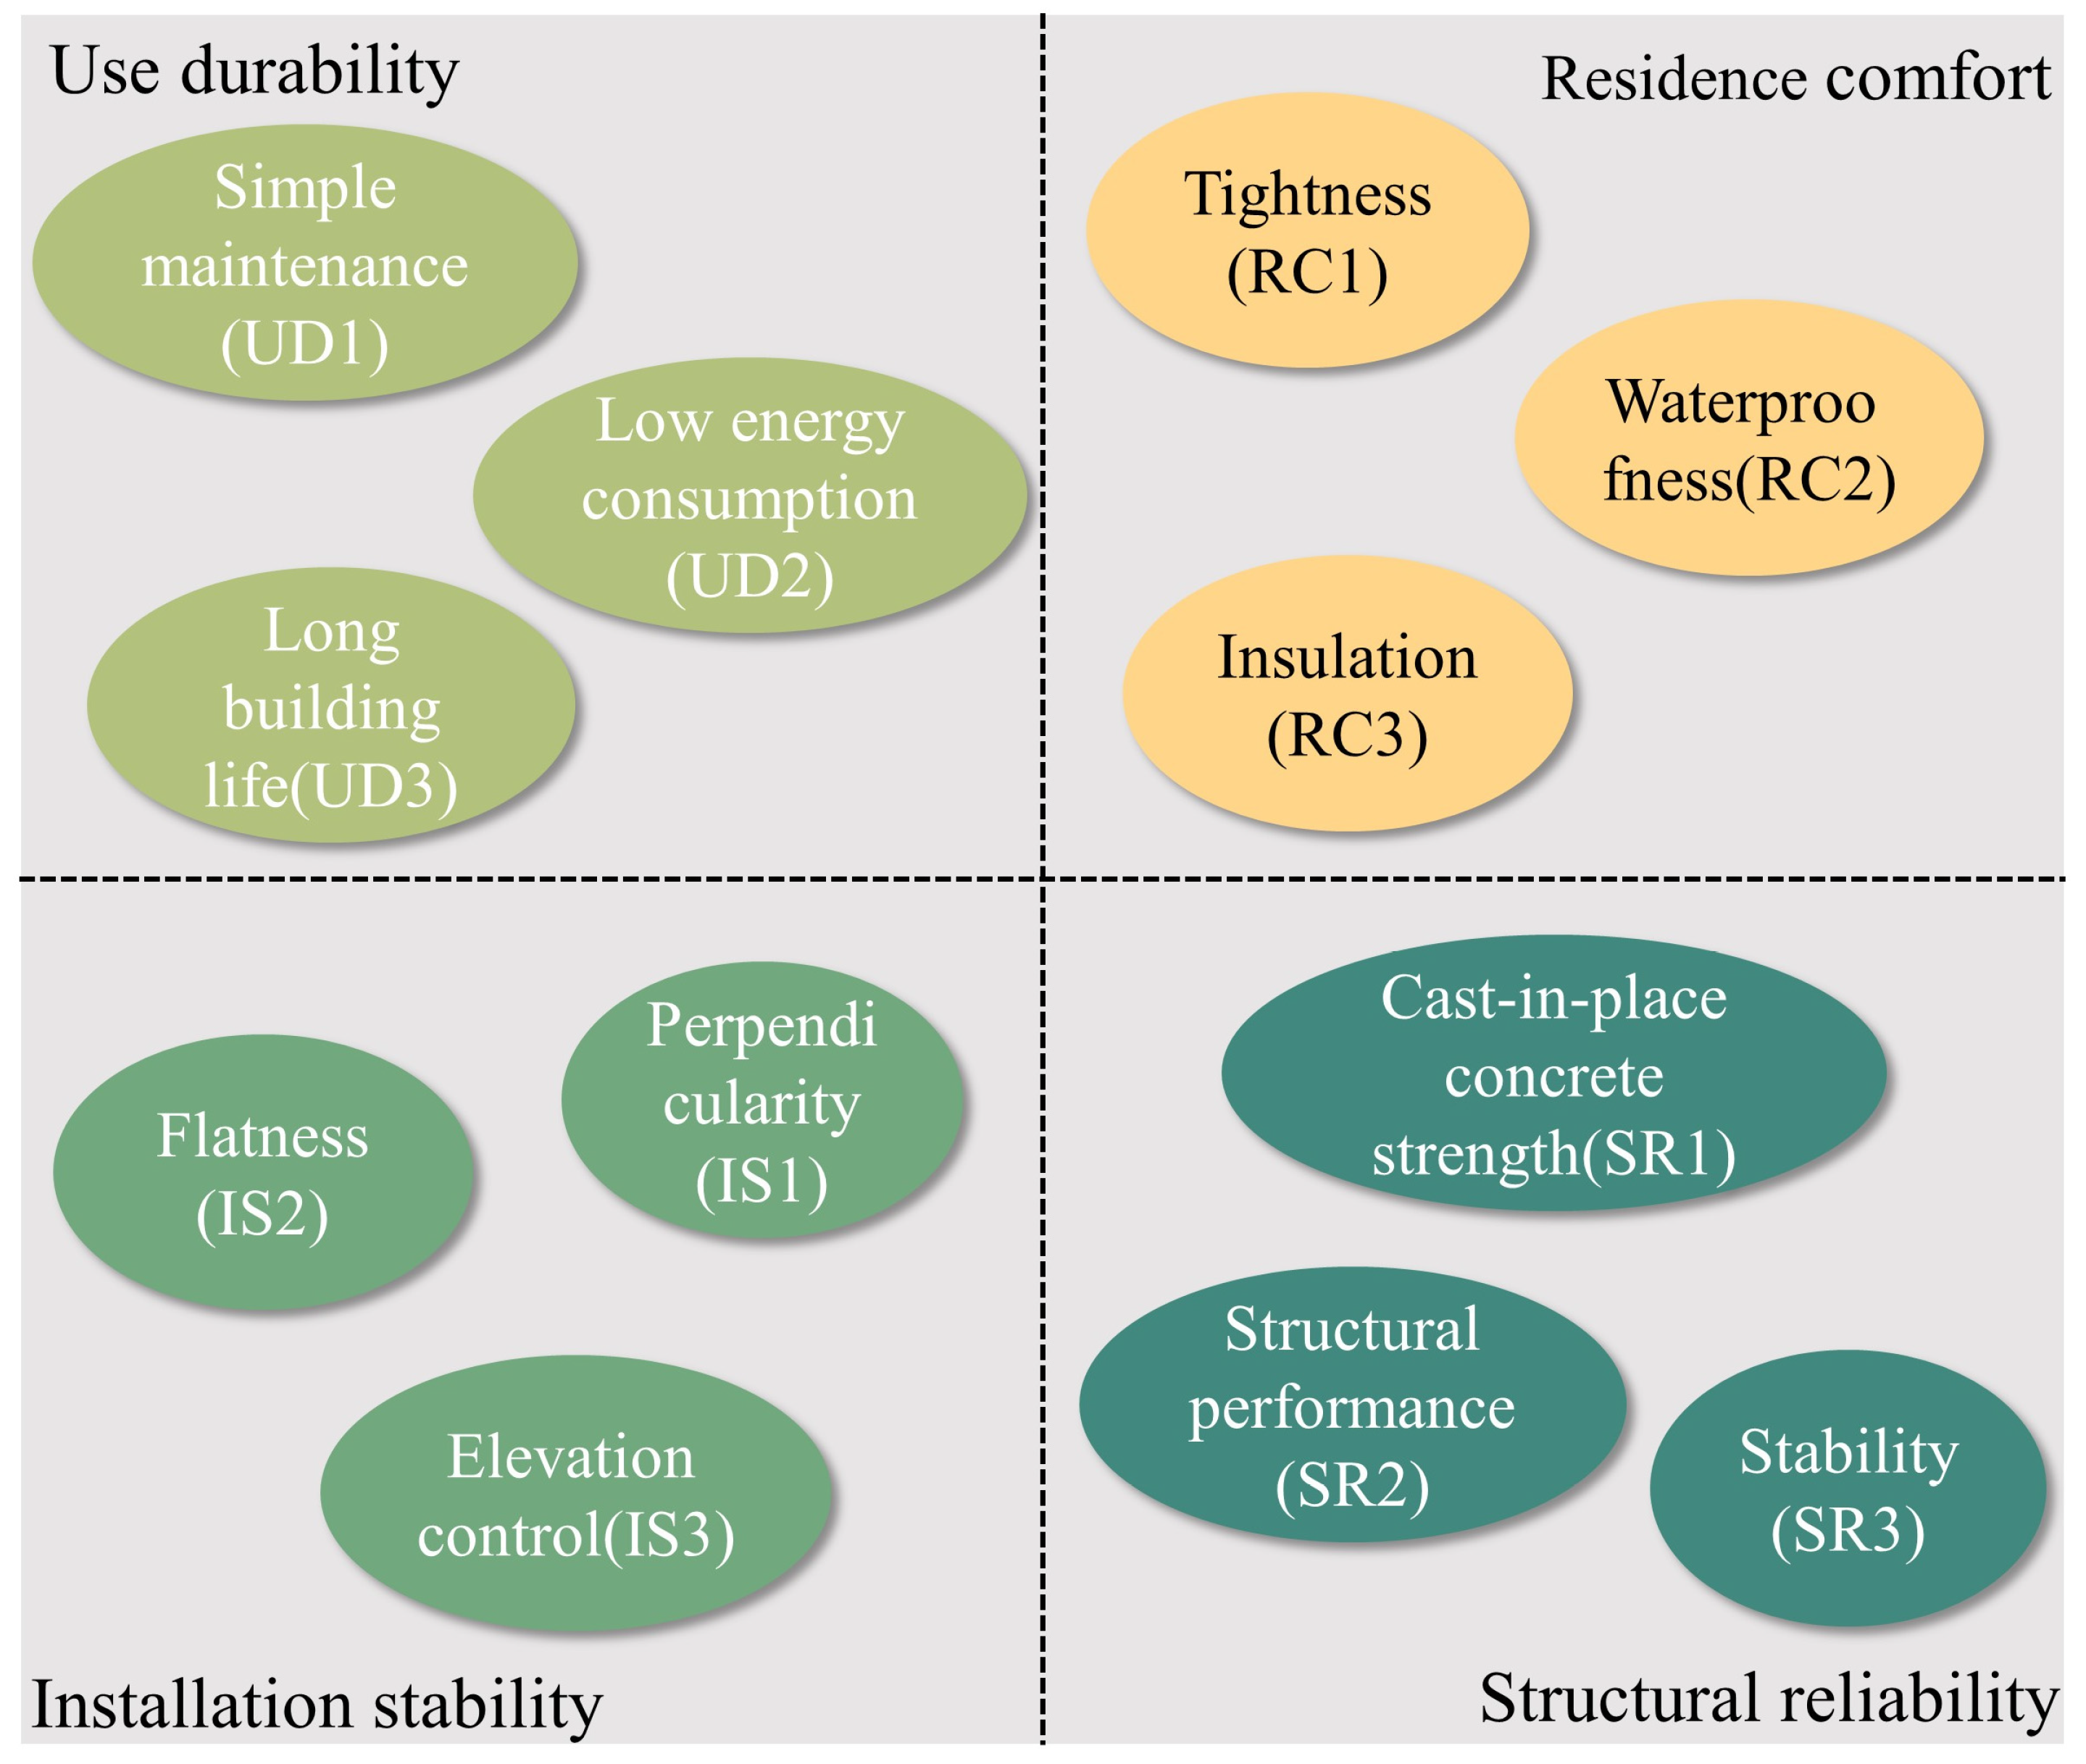
2.4.1. Quality Evaluation Index System
2.4.2. Quantification of Prefabricated Component Quality Indicators
3. Results and Discussion
3.1. Project Background
- (1)
- Since prefabricated component combinations are the primary research object for this paper’s quality evaluation, the quality optimization contribution of the prefabricated building is calculated as the sum of the quality optimization contributions of the selected components, while the foundation, door, and window components that were not chosen are not taken into account.
- (2)
- The quality issues resulting from the choice of cast-in-place or prefabricated construction procedures for the components, as well as from the order in which the various components are assembled, are not taken into account in this paper.
- (1)
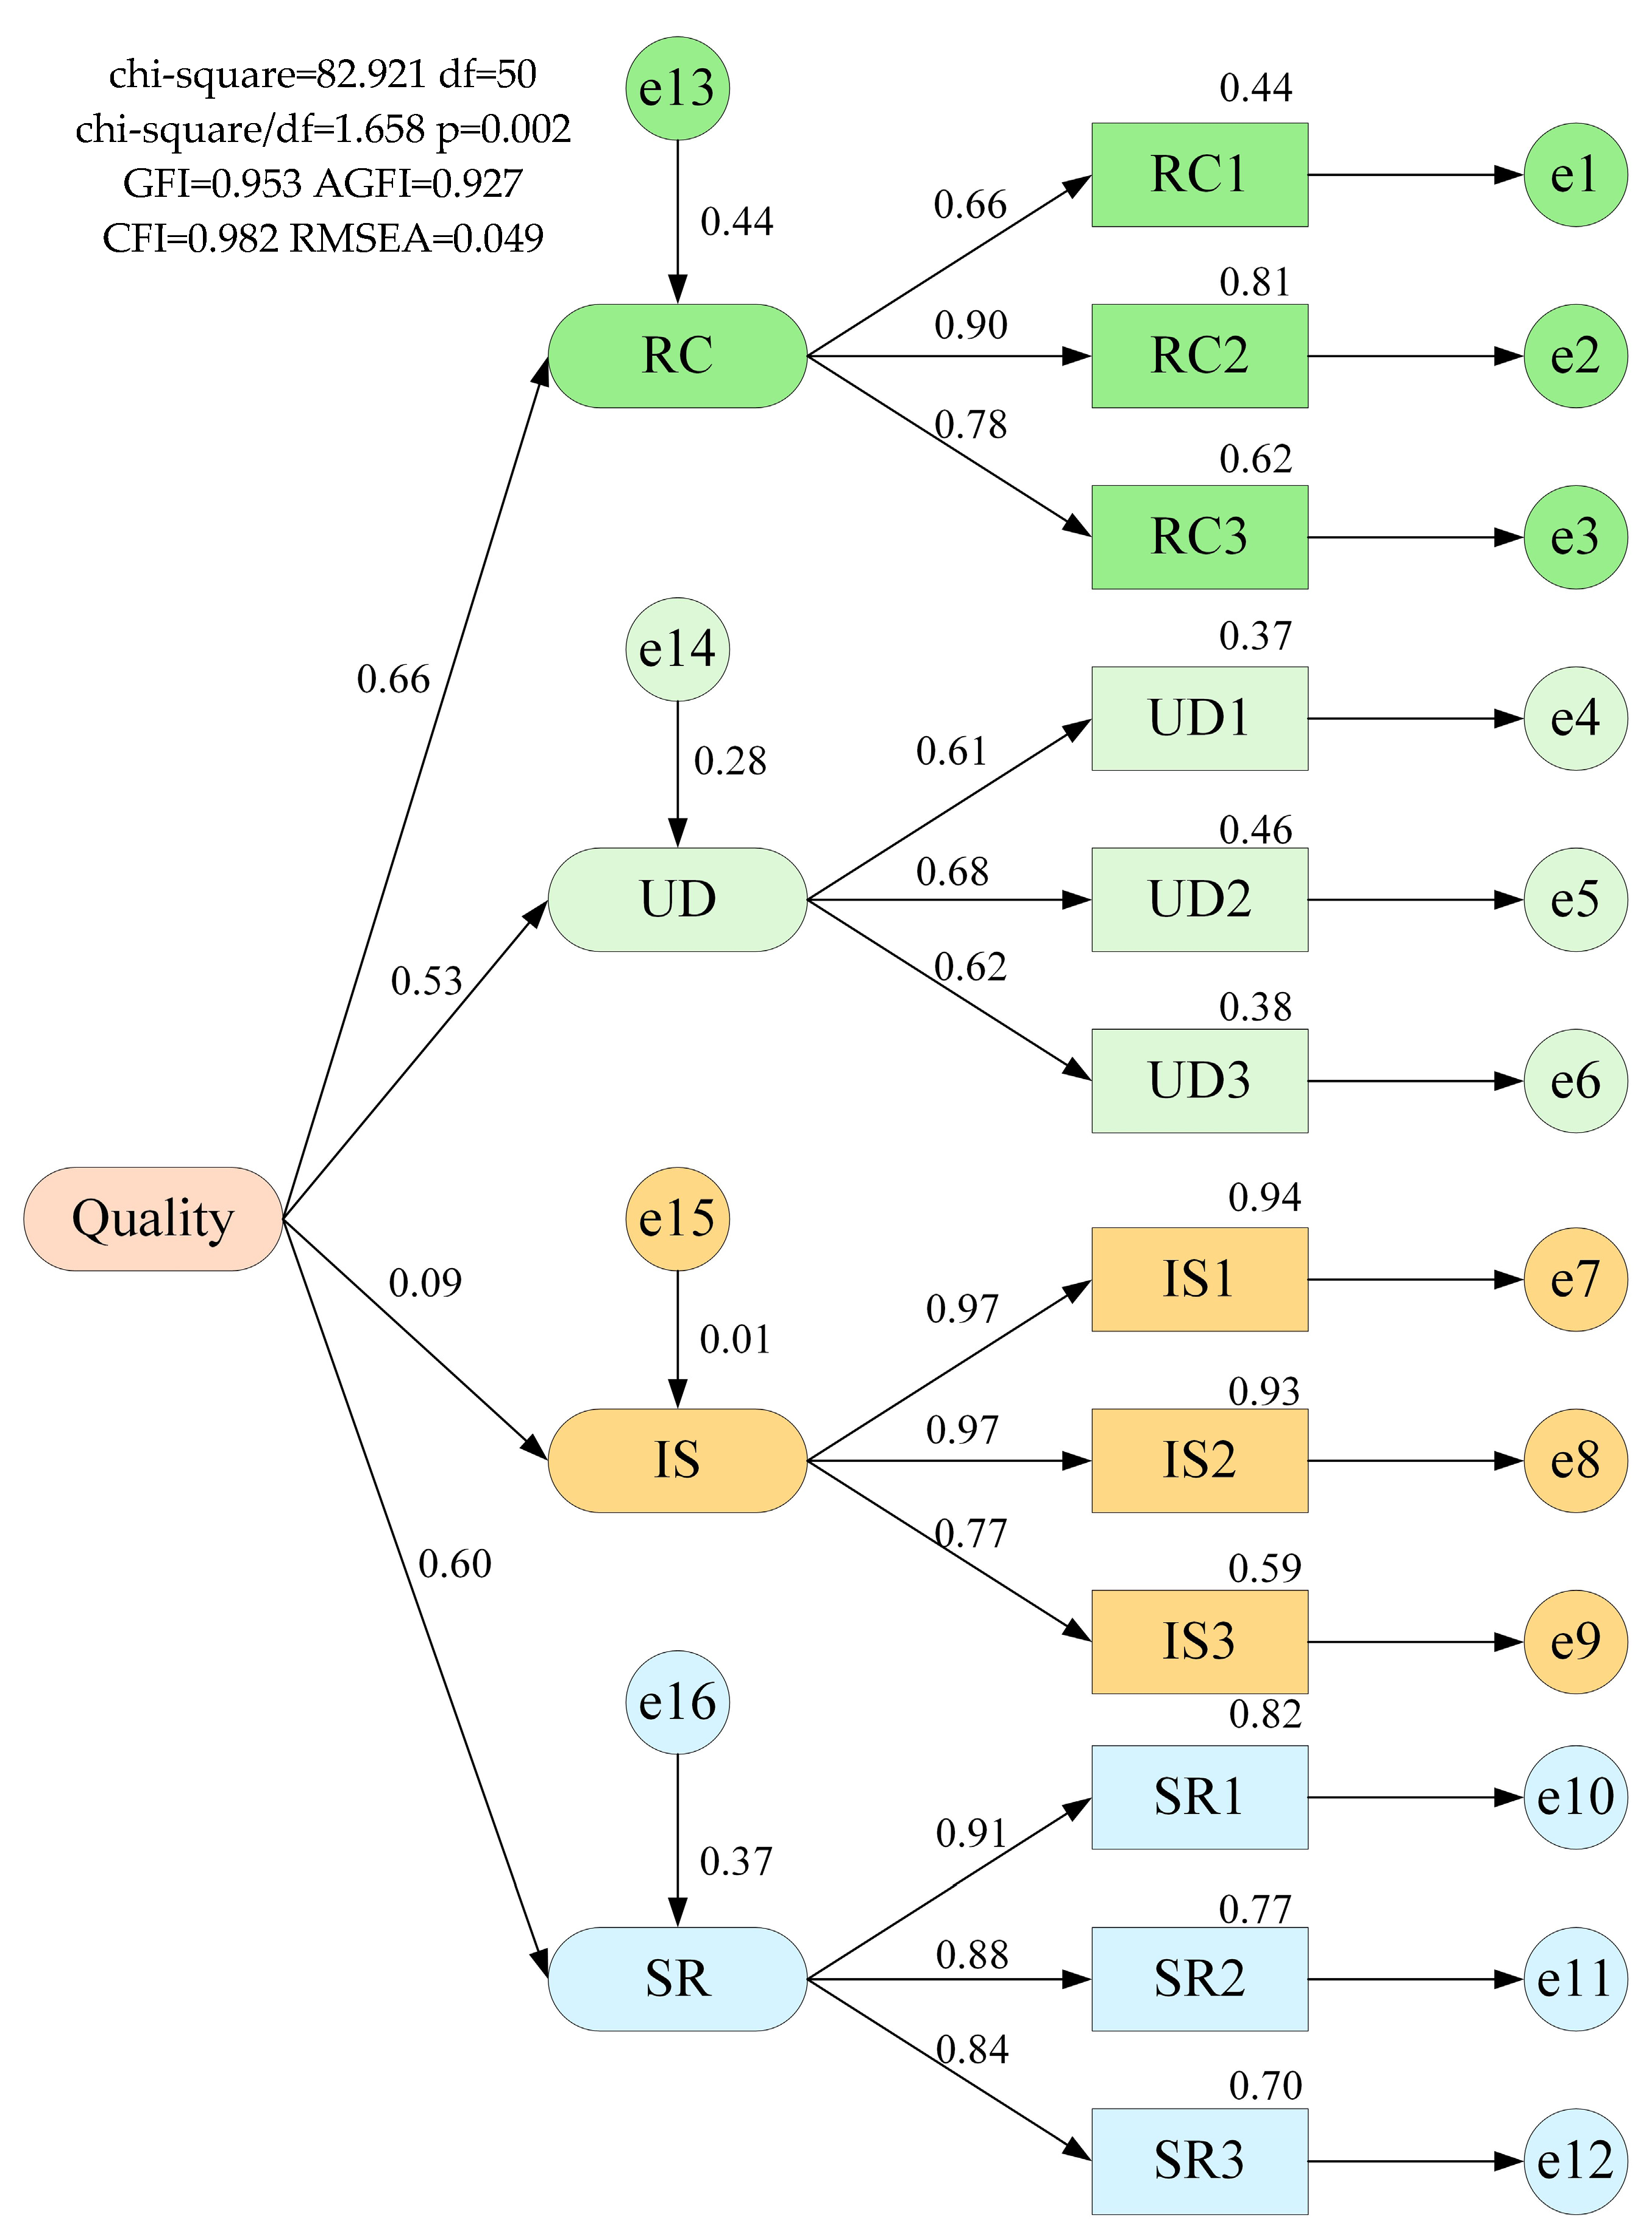
- Let be the contribution value of the first-level indicator to the research object, hereinafter referred to as weight 1, and let be the path coefficient between the research object and the first-level indicator, then the formula for calculating weight 1 is shown in Formula (3).
- (2)
- Let be the contribution value of each secondary indicator to its first-level indicator, hereinafter referred to as weight 2, and let be the path coefficient between the secondary indicator and the first-level indicator, then the formula for calculating weight 2 is shown in Formula (4).
- (3)
- Let the contribution value of secondary indicators to the research object be Aj, hereinafter referred to as the total weight, which is calculated as shown in Formula (5).
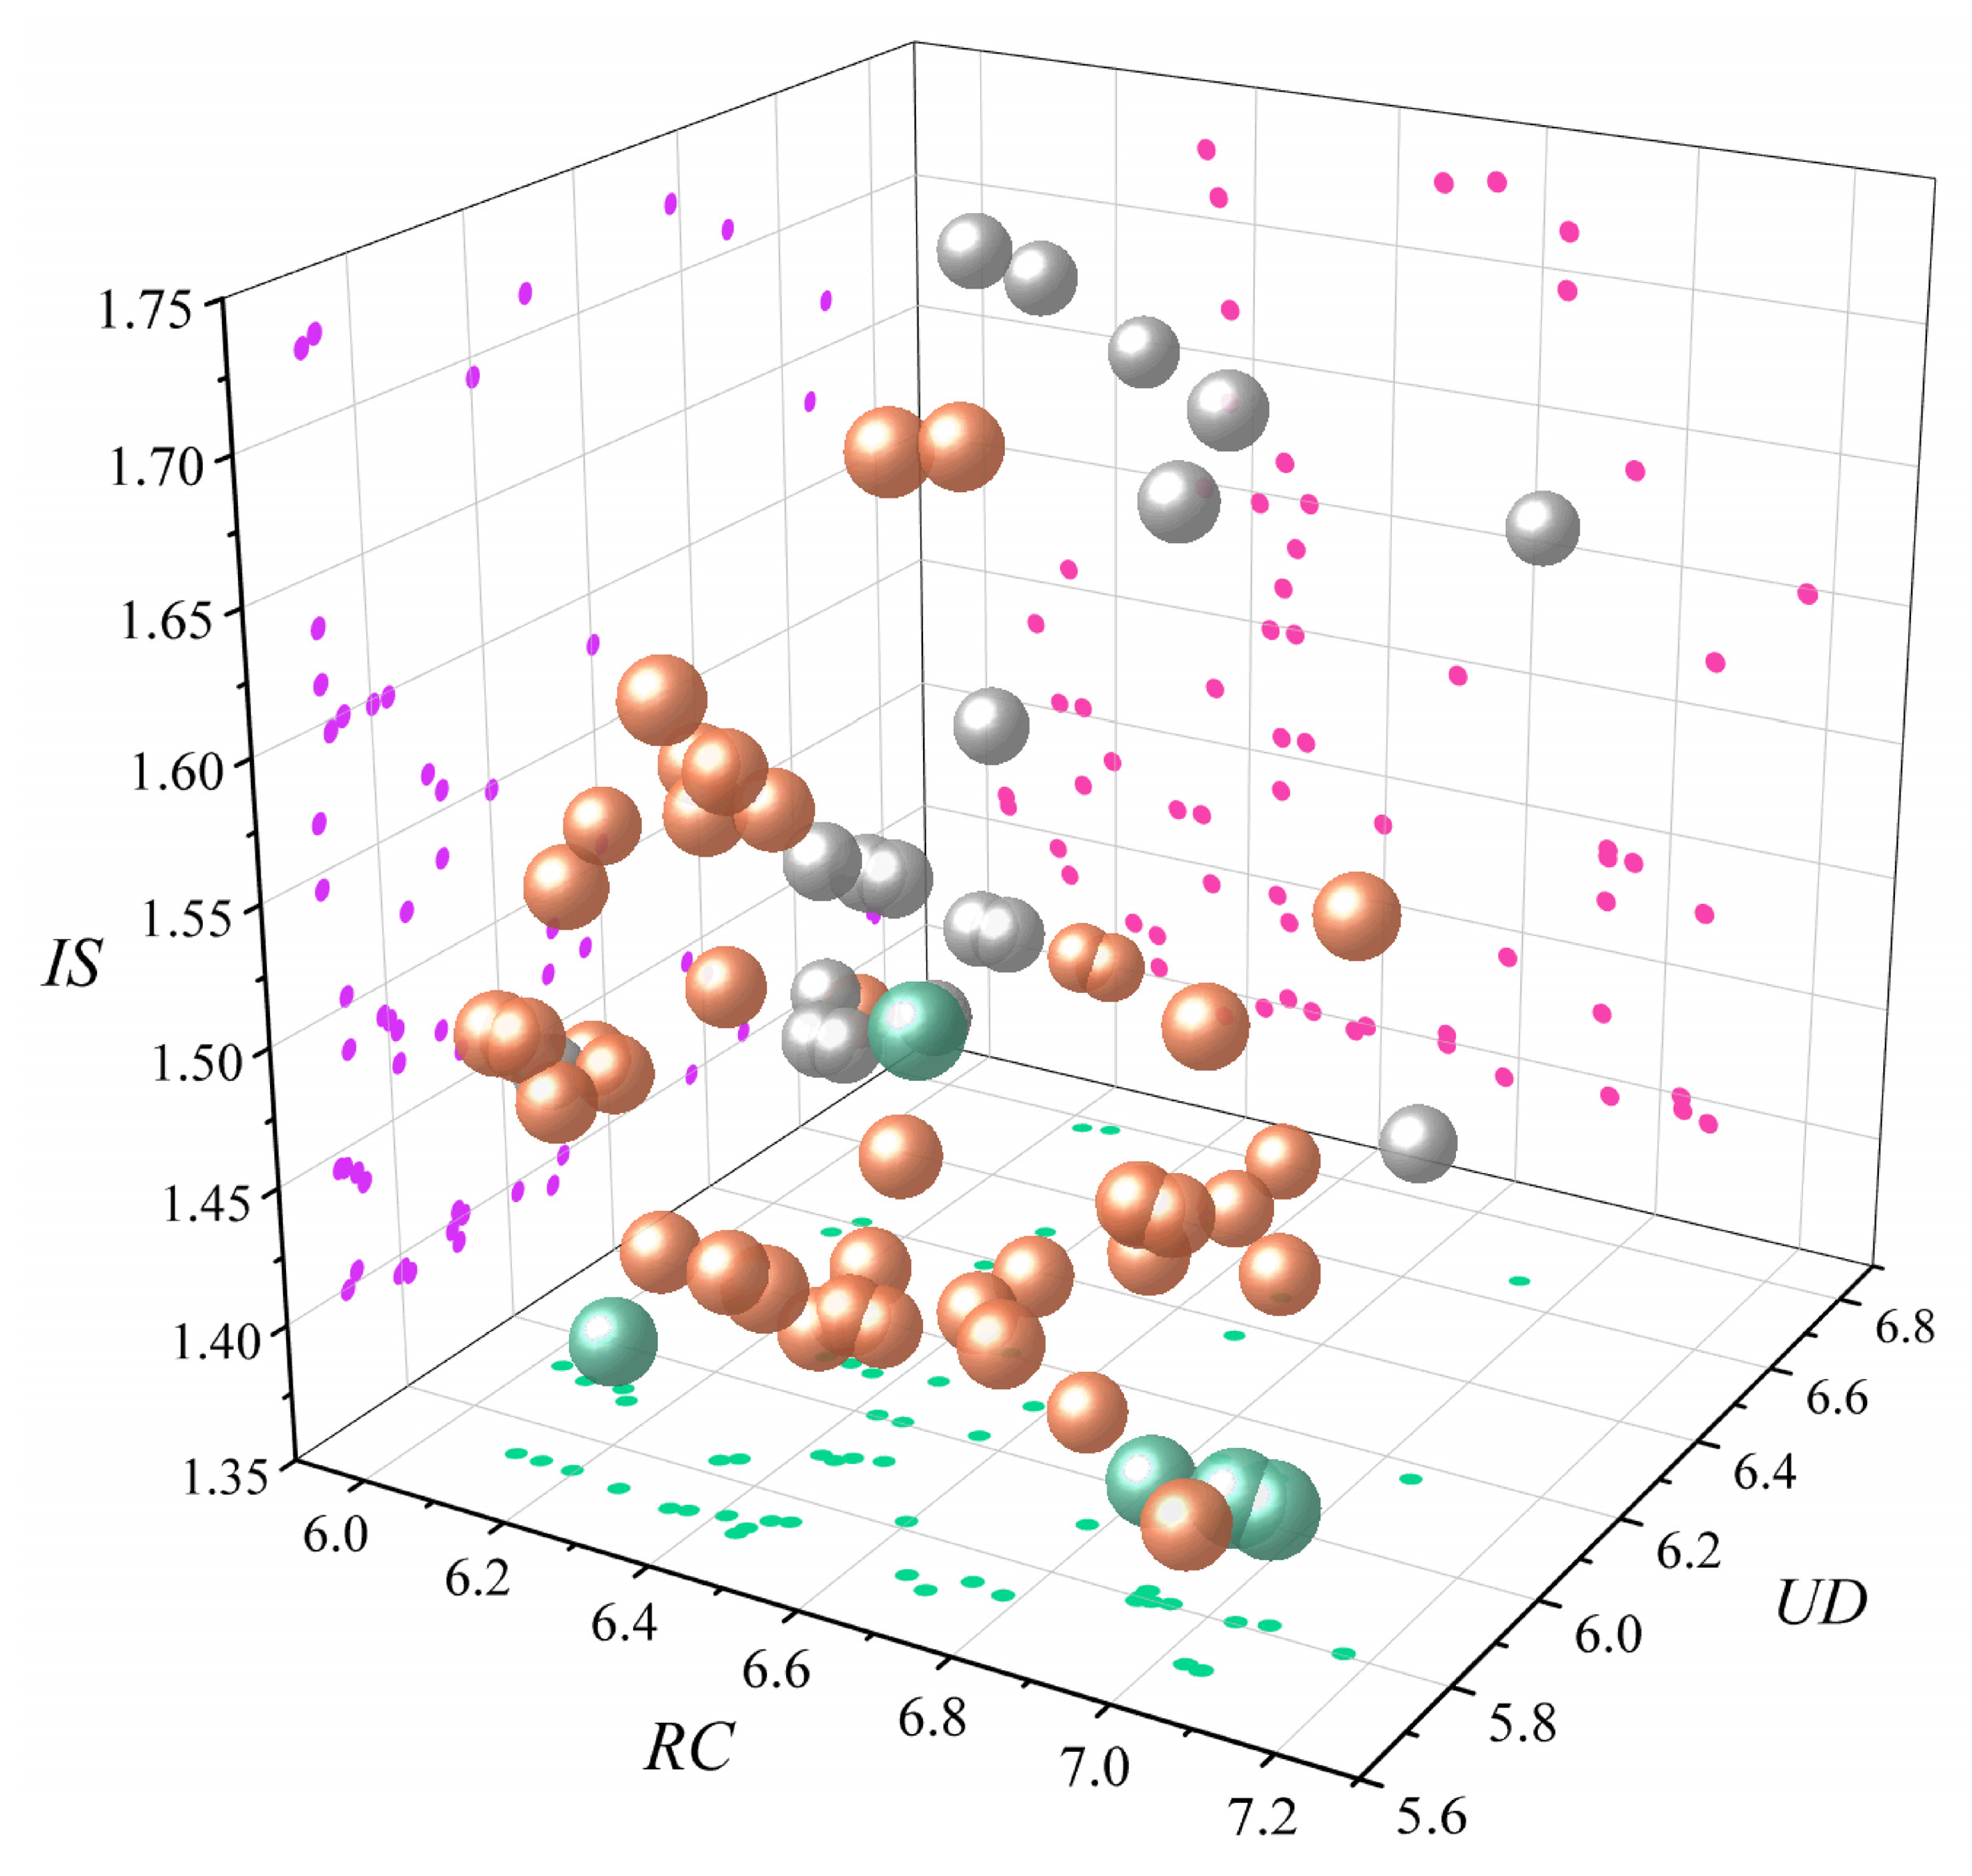
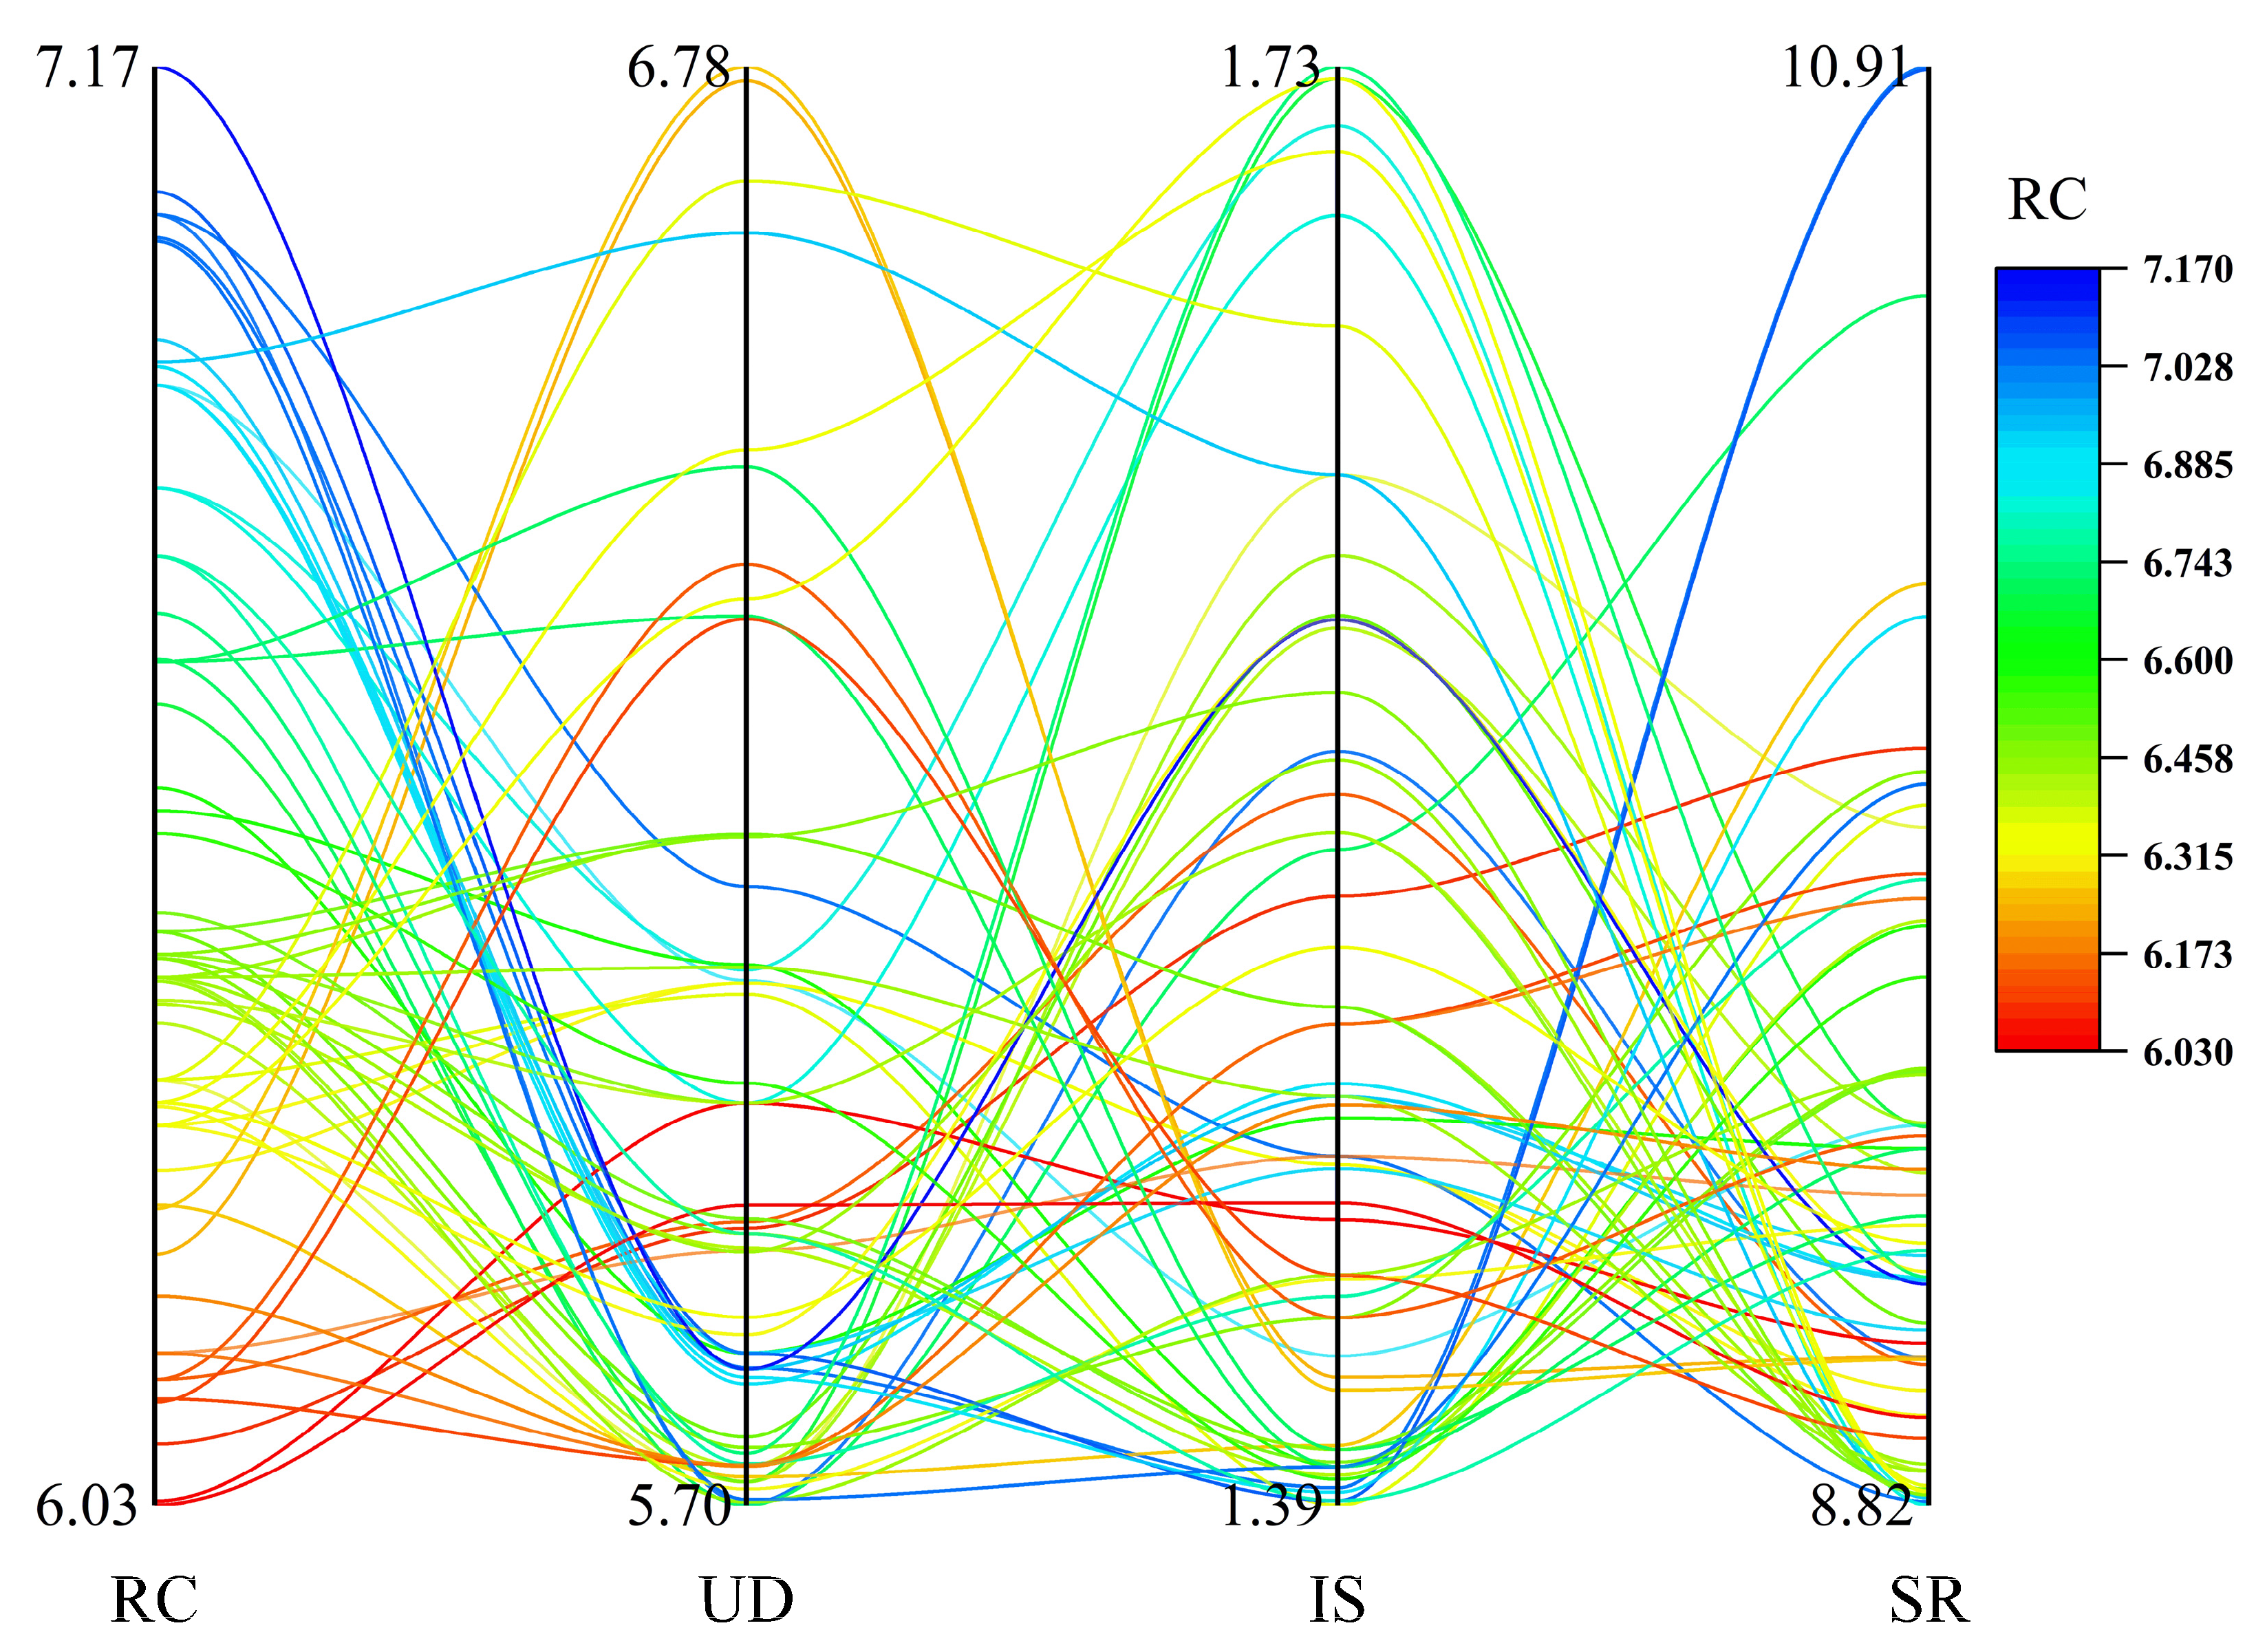
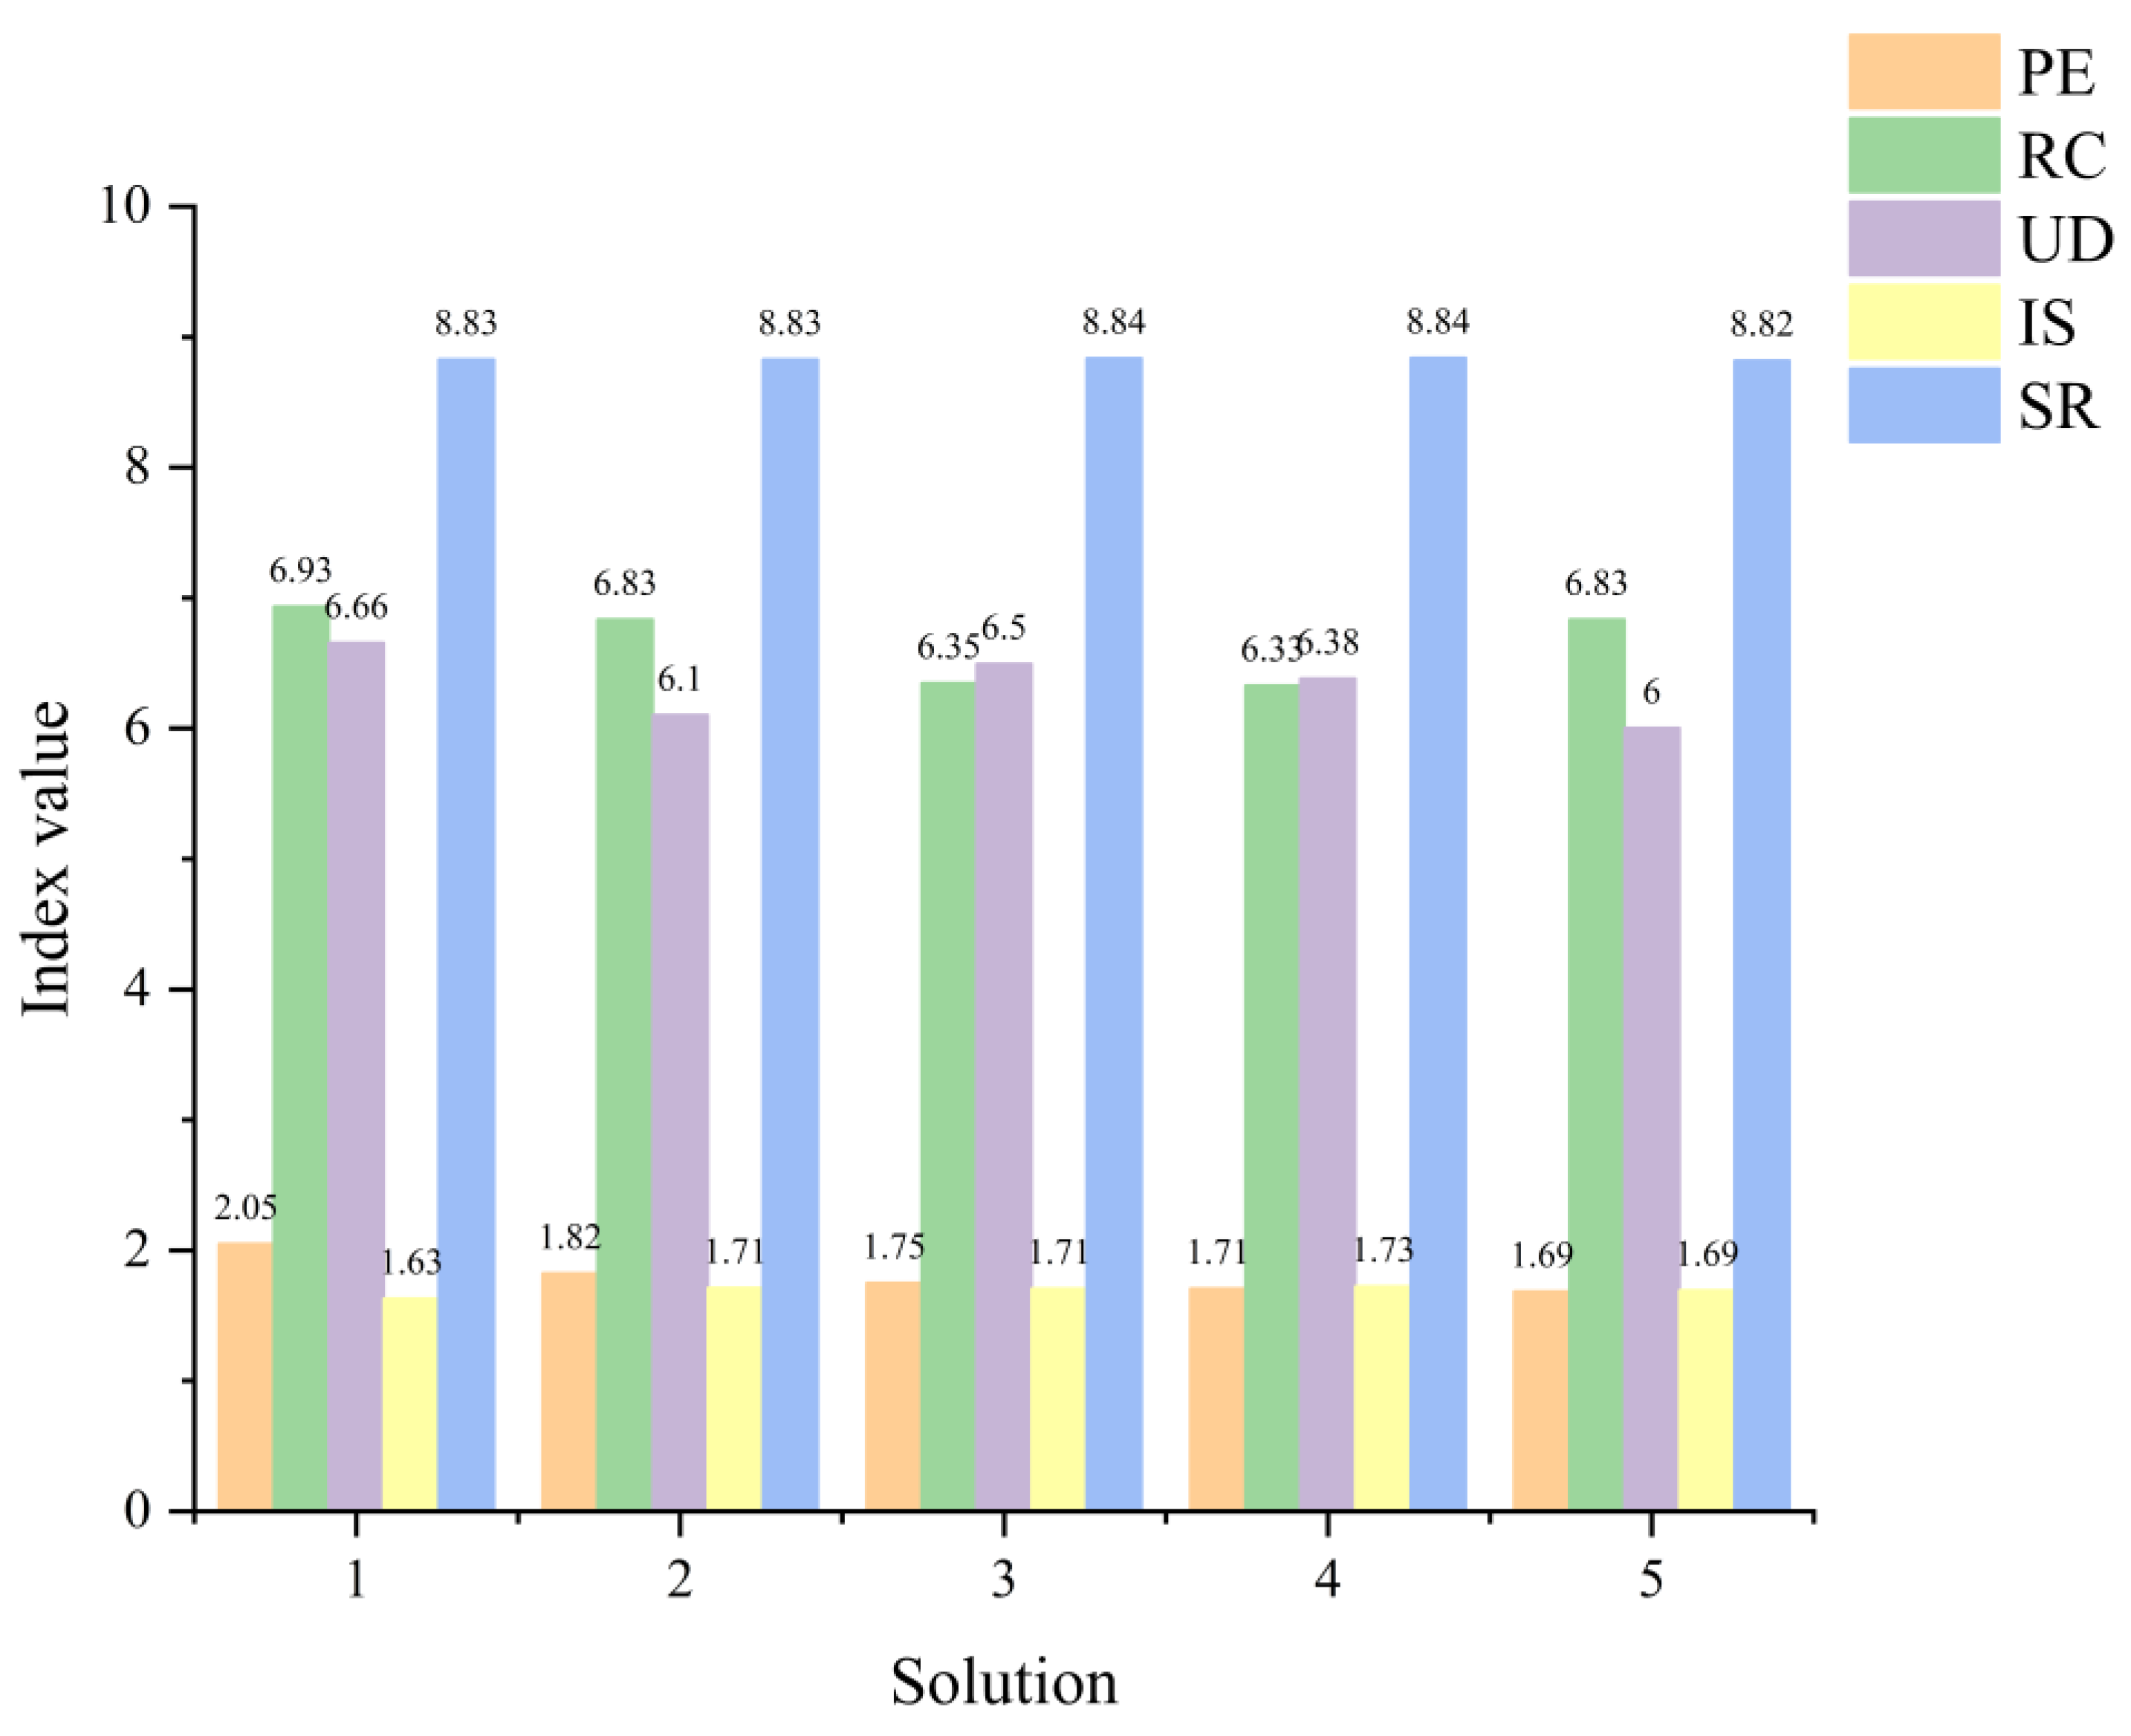
3.2. Results Analysis
4. Conclusions and Recommendations
- (1)
- When utilized to resolve the combinatorial optimization problem, the ant colony algorithm has a good solving impact and the capacity to explore the global optimal solution. By using the simulated annealing algorithm to optimize the projection pursuit method for evaluating the quality of prefabricated components of prefabricated buildings, the issue of more subjective evaluation methods can be effectively avoided, and the evaluation results can be made more scientific and reasonable.
- (2)
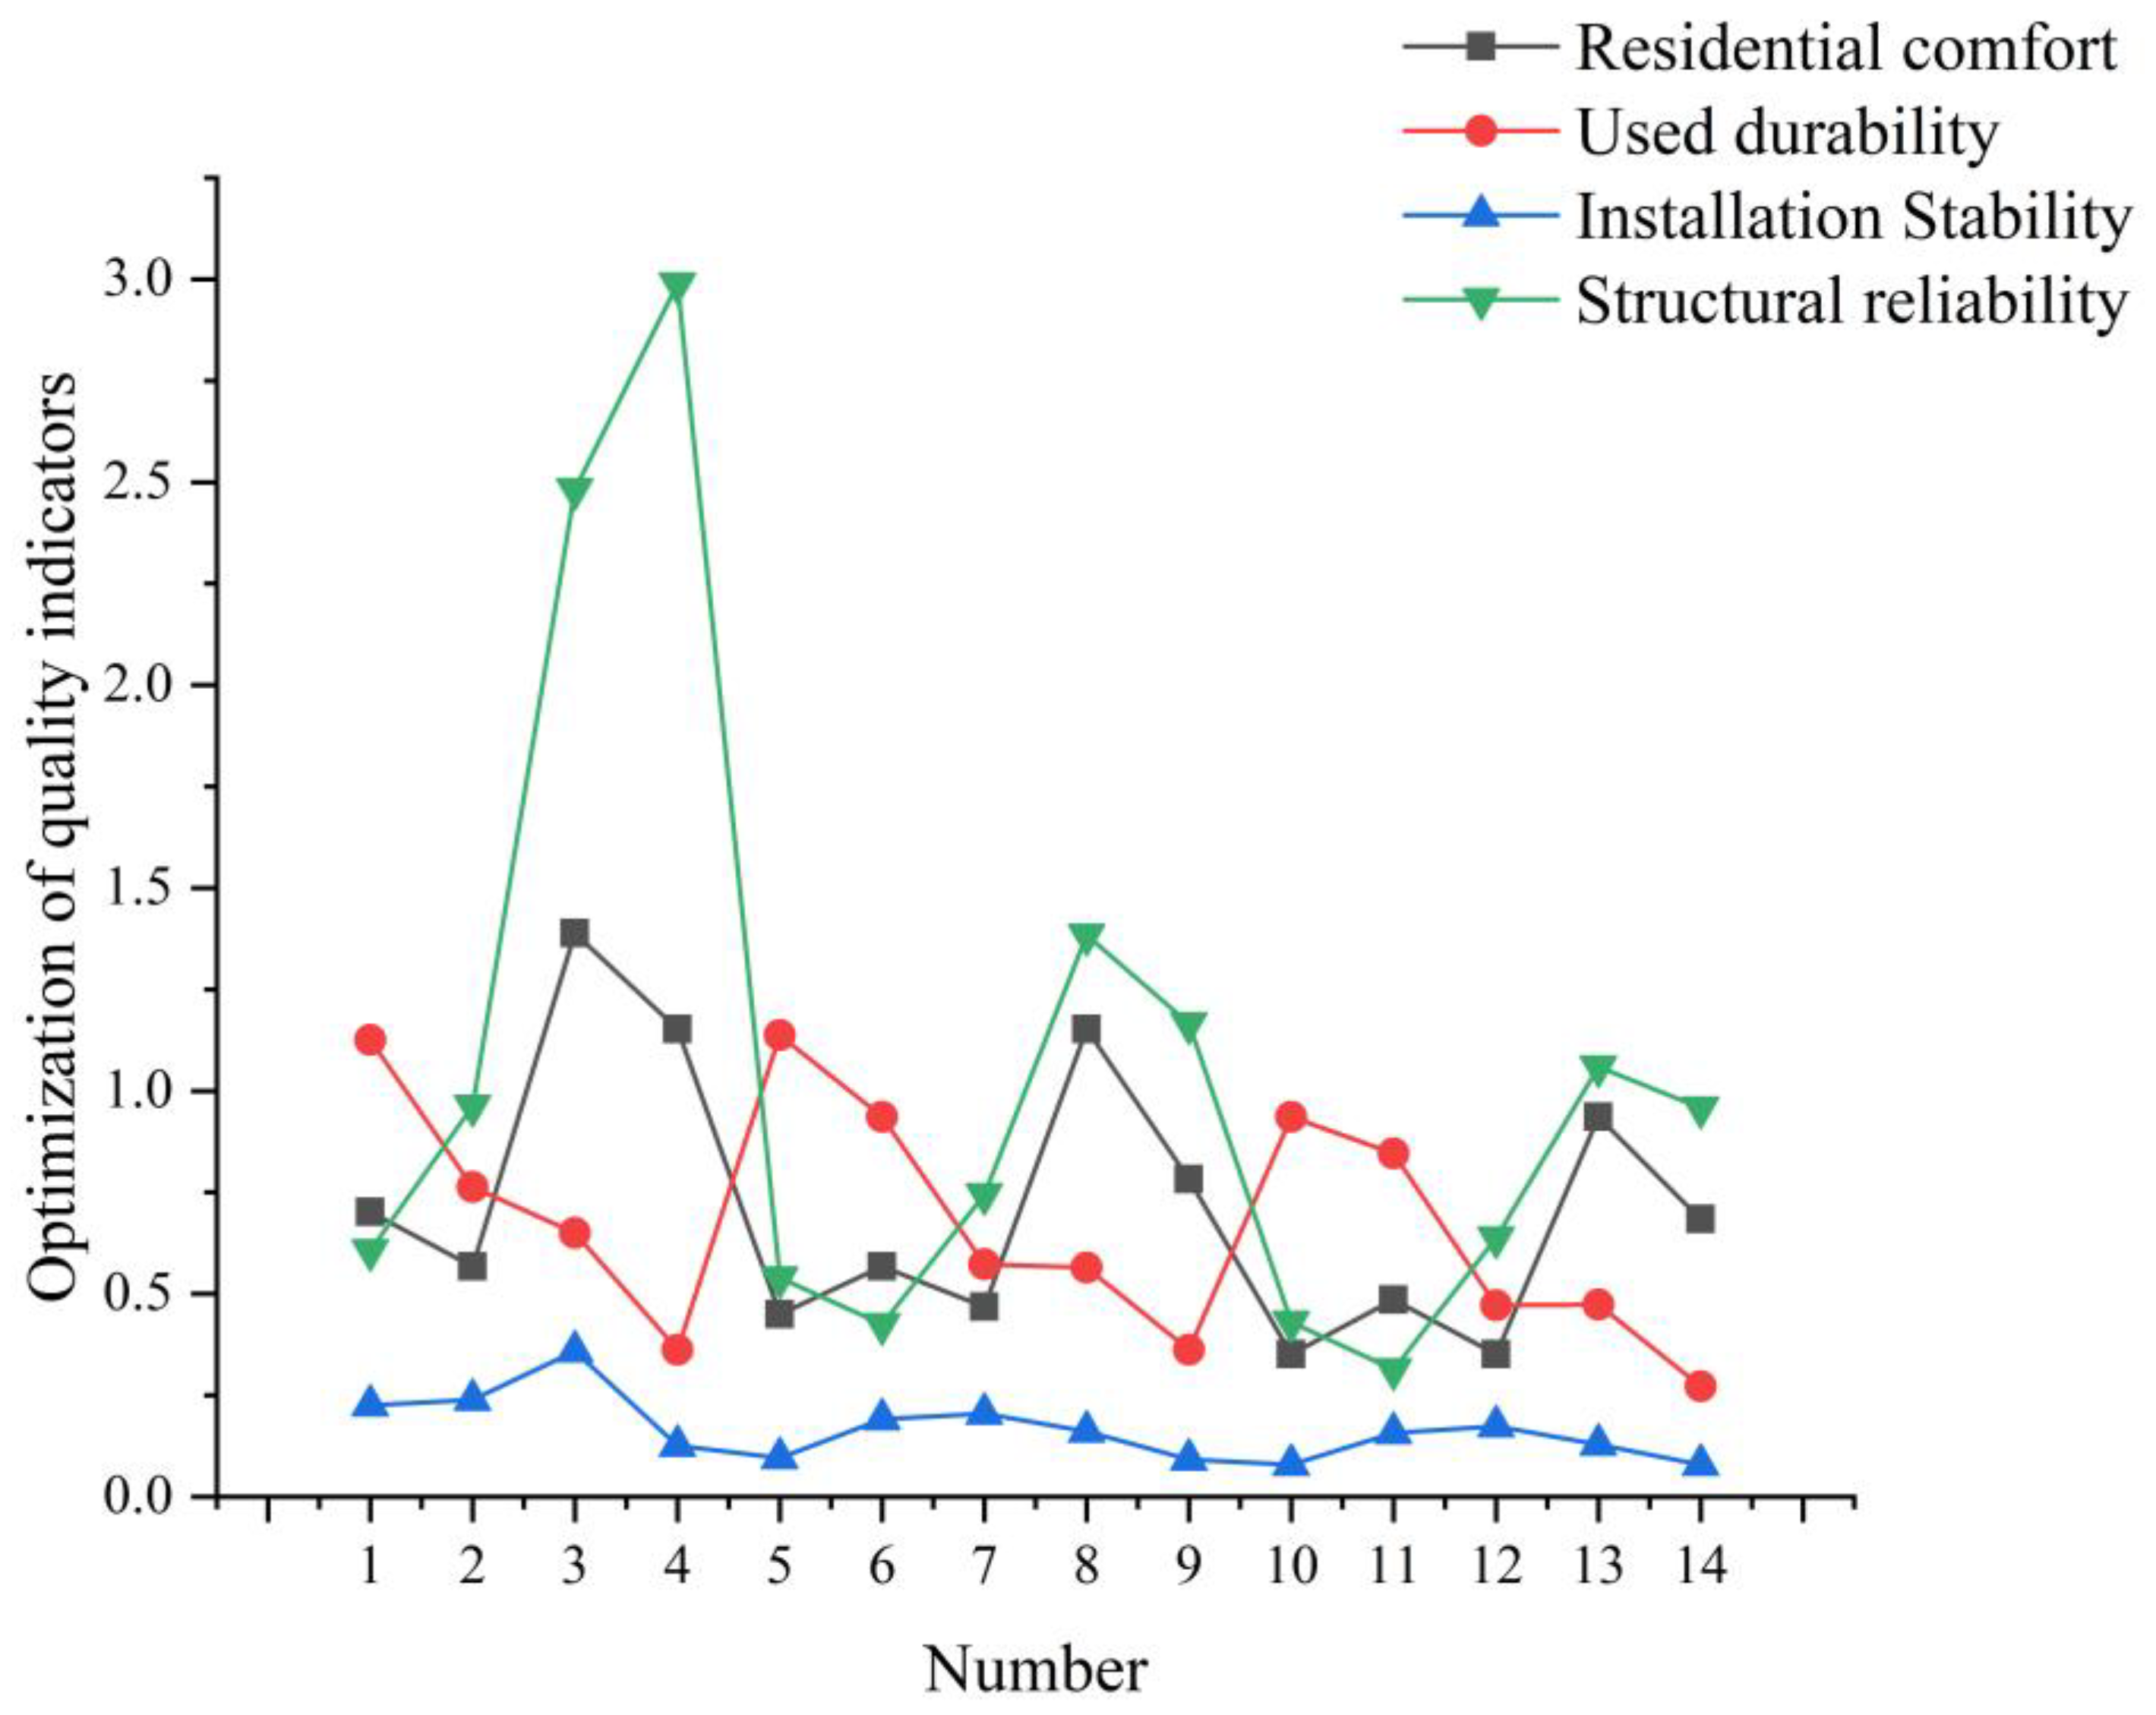
- Residential Comfort (RC) and Installation Stability (IS) have a somewhat positive correlation, whereas Residential Comfort (RC) and Usage Durability (UD) and Structural Reliability (SR) have a moderately negative correlation.
- (3)
- It is determined that the Installation Stability (IS) index has the most influence on the evaluation of the program, and the Structural Reliability (SR) index has the least influence on the program, based on the magnitude of the optimal projection direction vector.
- (1)
- We should consider the prefabricated building’s assembly stability and apply a consistent design and production technique in order to maximize accuracy and stability of assembly. Establish a quality management system and conduct quality inspections to guarantee that the quality of each assembly component meets the standards. In order to ensure that each component is linked and installed in the right place, the assembly process is also carefully watched.
- (2)
- Throughout construction, high-quality prefabricated building materials should be selected to ensure their durability and service life. Likewise, pay attention to the construction process to provide a strong and reliable connection between the pieces and avoid aging and material shedding. Routine inspection and maintenance should be carried out to keep machinery and parts from malfunctioning and to guarantee that the facility can be operated regularly.
- (3)
- When it comes to residential comfort, consider the design of the house type, rationally arrange the space layout, and provide a comfortable living environment. Consideration should be given to the home’s soundproofing, ventilation, and heat retention concurrently.
- (4)
- Strict control should be exerted, during manufacture, over the materials chosen and the processing procedures employed in order to ensure the strength and stability of the components. Reasonable structural connection procedures should be employed during construction to guarantee coordination and complementarity between components. Regular structural safety checks should be carried out to identify and address any potential structural problems and ensure the building’s safety.
Author Contributions
Funding
Institutional Review Board Statement
Informed Consent Statement
Data Availability Statement
Acknowledgments
Conflicts of Interest
References
- Li, R.Y.M.; Li, B.; Zhu, X.E.; Zhao, J.J.; Pu, R.H.; Song, L.X. Modularity clustering of economic development and ESG attributes in prefabricated building research. Front. Environ. Sci. 2022, 10, 977887. [Google Scholar] [CrossRef]
- Boafo, F.E.; Kim, J.H.; Kim, J.T. Performance of Modular Prefabricated Architecture: Case Study-Based Review and Future Pathways. Sustainability 2016, 8, 558. [Google Scholar] [CrossRef]
- Li, X.J.; Wang, C.; Kassem, M.A.; Alhajlah, H.H.; Bimenyimana, S. Evaluation Method for Quality Risks of Safety in Prefabricated Building Construction Using SEM-SDM Approach. Int. J. Environ. Res. Public Health 2022, 19, 5180. [Google Scholar] [CrossRef]
- Zhang, J.; Wang, M.T.; Zhao, L.L.; Chen, M. Analysis of Factors Affecting Prefabricated Building Quality Based on ISM-BN. Sustainability 2023, 15, 9682. [Google Scholar] [CrossRef]
- Zhang, K.; Tsai, J.S. Identification of Critical Factors Influencing Prefabricated Construction Quality and Their Mutual Relationship. Sustainability 2021, 13, 11081. [Google Scholar] [CrossRef]
- Xu, X.; Ding, X.; Wang, Q.; Chen, T.; Deng, R. Comparative Analysis and Empirical Study of Prefabrication Rate Calculation Methods for Prefabricated Buildings in Various Provinces and Cities in China. Buildings 2023, 13, 2042. [Google Scholar] [CrossRef]
- Wang, Q.; Guo, W.; Xu, X.; Deng, R.; Ding, X.; Chen, T. Analysis of Carbon Emission Reduction Paths for the Production of Prefabricated Building Components Based on Evolutionary Game Theory. Buildings 2023, 13, 1557. [Google Scholar] [CrossRef]
- Xia, M.M.; Zhao, L.; Qiao, Y.N.; Yuan, Z.M.; Cui, Y.L.; Zhao, L.M.; Li, J.L. Analysis of Factors Affecting the Quality of Precast Components Based on Structural Equation Modeling. Arab. J. Sci. Eng. 2022, 47, 4171–4185. [Google Scholar] [CrossRef]
- Garay, R.; Pfenniger, F.; Castillo, M.; Fritz, C. Quality and Sustainability Indicators of the Prefabricated Wood Housing Industry-A Chilean Case Study. Sustainability 2021, 13, 8523. [Google Scholar] [CrossRef]
- Cui, Y.F.; Geng, Z.Q.; Zhu, Q.X.; Han, Y.M. Review: Multi-objective optimization methods and application in energy saving. Energy 2017, 125, 681–704. [Google Scholar] [CrossRef]
- Ojha, M.; Singh, K.P.; Chakraborty, P.; Verma, S. A review of multi-objective optimisation and decision making using evolutionary algorithms. Int. J. Bio-Inspired Comput. 2019, 14, 69–84. [Google Scholar] [CrossRef]
- Afshar, A.; Kaveh, A.; Shoghli, O.R. Multi-objective optimization of time-cost-quality using multicolony ant algorithm. Asian J. Civ. Eng. Build. Hous. 2007, 8, 113–124. [Google Scholar]
- Reyes, J.; Bartolo-Perez, P.; Cauich, W.; Huerta, D.; Hermosin, B.; Perez, T. Morphological and chemical analysis from deterioration crusts of historic buildings by sem/edx. Acta Microsc. 2009, 18, 185–194. [Google Scholar]
- Ranjbar, H.R.; Nekooie, M.A. An improved hierarchical fuzzy TOPSIS approach to identify endangered earthquake-induced buildings. Eng. Appl. Artif. Intell. 2018, 76, 21–39. [Google Scholar] [CrossRef]
- Fan, C.; Deng, B.C.; Yin, Y.L. Hierarchical structure and transfer mechanism to assess the scheduling-related risk in construction of prefabricated buildings: An integrated ISM-MICMAC approach. Eng. Constr. Archit. Manag. 2022, 30, 2991–3013. [Google Scholar] [CrossRef]
- Bai, L.B.; Wang, H.L.; Shi, C.M.; Du, Q.; Li, Y. Assessment of SIP Buildings for Sustainable Development in Rural China Using AHP-Grey Correlation Analysis. Int. J. Environ. Res. Public Health 2017, 14, 1292. [Google Scholar] [CrossRef]
- Zhang, B.; Niu, Z.W.; Feng, L.J.; Wang, X.Q. Evaluation system for lean knowledge management ability based on improved gray correlation analysis. Int. J. Ind. Eng.-Theory Appl. Pract. 2020, 27, 712–730. [Google Scholar]
- Li, X.H.; Zhao, C.Y.; Wang, B.; Feng, G. Regional partitioning of agricultural non-point source pollution in China using a projection pursuit cluster model. J. Arid Land 2011, 3, 278–284. [Google Scholar] [CrossRef]
- Xu, D.; Liu, D.P.; Liu, D.; Fu, Q.; Huang, Y.; Li, M.; Li, T.X. New method for diagnosing resilience of agricultural soil-water resource composite system: Projection pursuit model modified by sparrow search algorithm. J. Hydrol. 2022, 610, 127814. [Google Scholar] [CrossRef]
- Tao, H.F.; Wu, Z.J.; Yang, Y.K.; Li, Q.; Mahemujiang, A.; Jiang, Y.W.; Wei, J.Q. Establishment of a projection-pursuit-regression-based prediction model for the filtration performance of a micro-pressure filtration and cleaning tank for micro-irrigation. J. Clean. Prod. 2023, 388, 135992. [Google Scholar] [CrossRef]
- Zhou, T.; Sun, K.Z.; Chen, Z.H.; Yang, Z.X.; Liu, H.B. Automated Optimum Design of Light Steel Frame Structures in Chinese Rural Areas Using Building Information Modeling and Simulated Annealing Algorithm. Sustainability 2023, 15, 9000. [Google Scholar] [CrossRef]
- Liu, C.; Zhang, F.Q.; Zhang, H.; Shi, Z.X.; Zhu, H.Q. Optimization of assembly sequence of building components based on simulated annealing genetic algorithm. Alex. Eng. J. 2023, 62, 257–268. [Google Scholar] [CrossRef]
- Wang, Z.P.; Tian, J.C.; Feng, K.P. Optimal allocation of regional water resources based on simulated annealing particle swarm optimization algorithm. Energy Rep. 2022, 8, 9119–9126. [Google Scholar] [CrossRef]
- Alawag, A.M.; Alaloul, W.S.; Liew, M.S.; Musarat, M.A.; Baarimah, A.O.; Saad, S.; Ammad, S. Critical Success Factors Influencing Total Quality Management In Industrialised Building System: A Case Of Malaysian Construction Industry. Ain Shams Eng. J. 2023, 14, 101877. [Google Scholar] [CrossRef]
- Ignatius, J.; Rahman, A.; Yazdani, M.; Saparauskas, J.; Haron, S.H. AN INTEGRATED FUZZY ANP-QFD APPROACH FOR GREEN BUILDING ASSESSMENT. J. Civ. Eng. Manag. 2016, 22, 551–563. [Google Scholar] [CrossRef]
- Yin, S.; Zhu, X.; Karimi, H.R. Quality Evaluation Based on Multivariate Statistical Methods. Math. Probl. Eng. 2013, 2013, 1–10. [Google Scholar] [CrossRef]
- Sun, T.; Lv, X.; Cai, Y.; Pan, Y.; Huang, J. Software test quality evaluation based on fuzzy mathematics. J. Intell. Fuzzy Syst. 2021, 40, 6125–6135. [Google Scholar] [CrossRef]
- Han, X.; Cao, T. Study on ecological environment quality evaluation of the energy consumption pollution treatment in industrial parks. Environ. Sci. Pollut. Res. 2021, 28, 28038–28057. [Google Scholar] [CrossRef] [PubMed]


| Construction Process | Residence Comfort | Use Durability | Installation Stability | Structural Reliability | ||||||||
|---|---|---|---|---|---|---|---|---|---|---|---|---|
| RC1 | RC2 | RC3 | UD1 | UD2 | UD3 | IS1 | IS2 | IS3 | SR1 | SR2 | SR3 | |
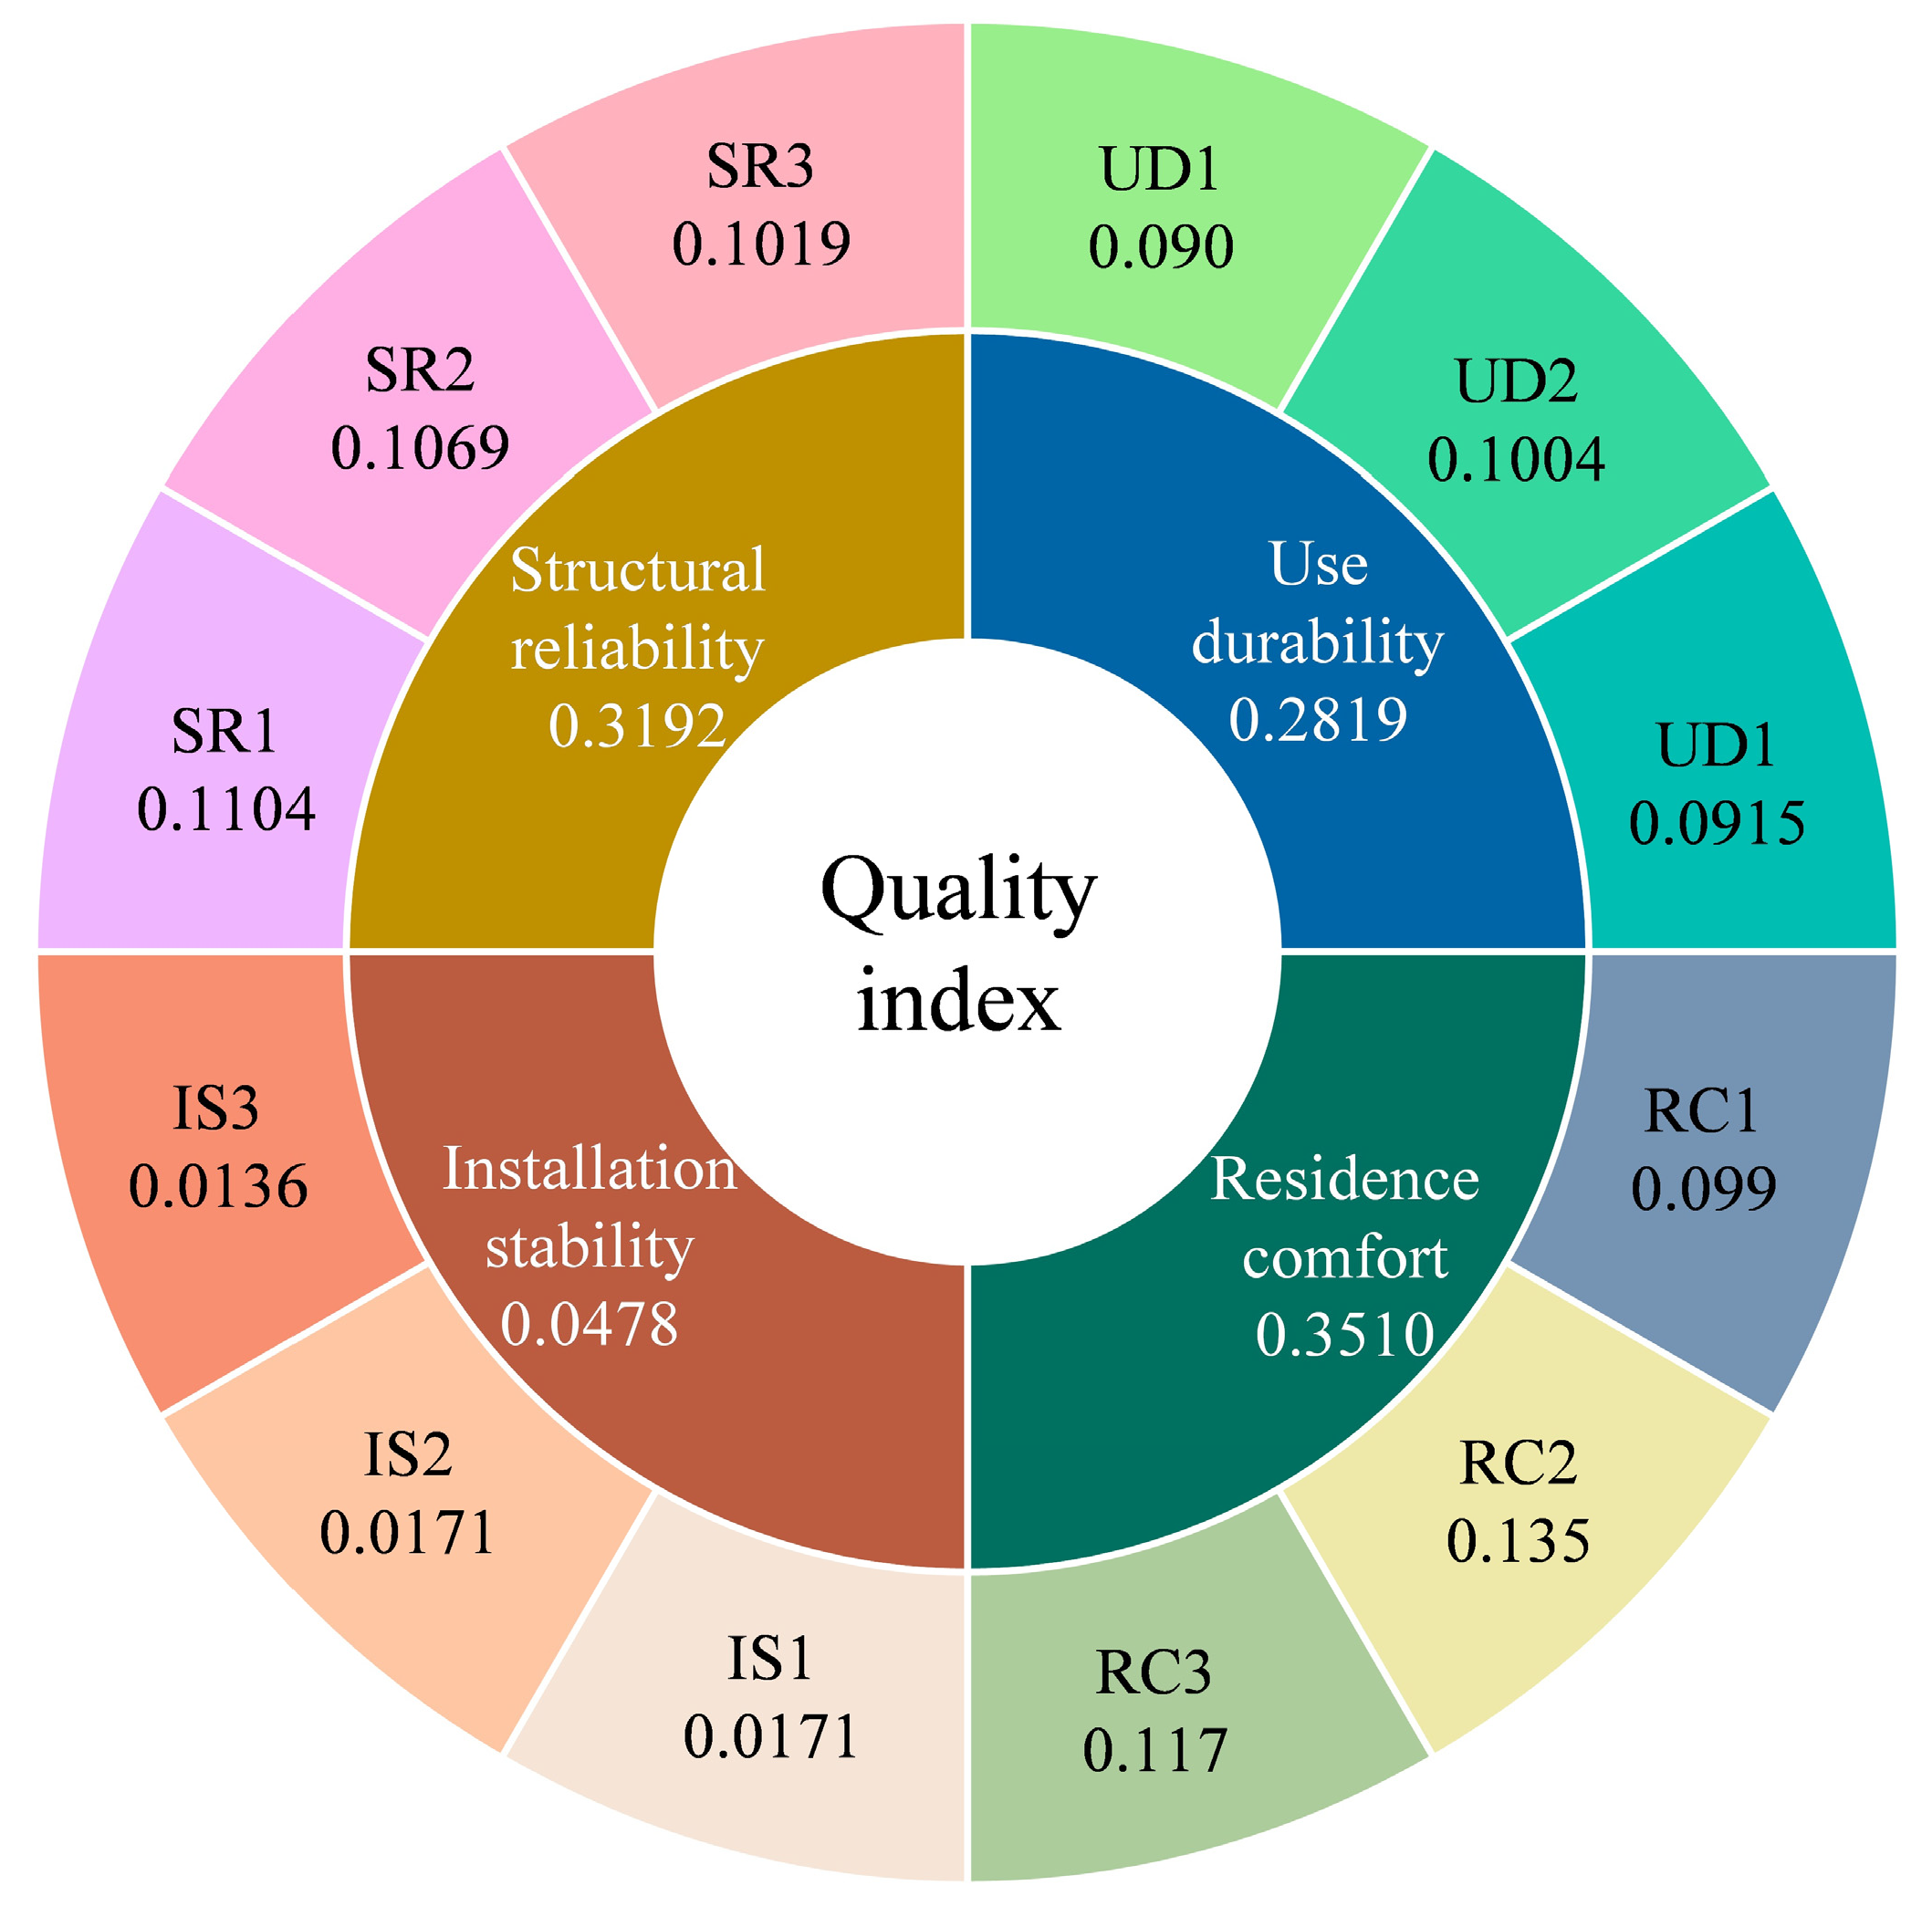
| 9.9% | 13.5% | 11.7% | 9.0% | 10.0% | 9.2% | 1.7% | 1.7% | 1.4% | 11.0% | 10.7% | 10.2% | |
| 1 | 5 | 4 | 3 | 5 | 2 | 5 | 3 | 3 | ||||
| 2 | 4 | 5 | ||||||||||
| 3 | 3 | |||||||||||
| 4 | 4 | 3 | ||||||||||
| 5 | 5 | 5 | 5 | |||||||||
| Degree of importance | 1.389 | 0.65 | 0.359 | 2.482 | ||||||||
| Type of Component | …… | 1 | 2 | 3 | 4 | 5 | …… | Degree of Importance | |||
|---|---|---|---|---|---|---|---|---|---|---|---|
| RC | UD | IS | SR | ||||||||
| Columns | |||||||||||
| Beam | |||||||||||
| Slab | 0 | 1 | 1 | 1 | 1 | 1 | 0 | 1.389 | 0.65 | 0.359 | 2.482 |
| Wall | |||||||||||
| Stairs | |||||||||||
Disclaimer/Publisher’s Note: The statements, opinions and data contained in all publications are solely those of the individual author(s) and contributor(s) and not of MDPI and/or the editor(s). MDPI and/or the editor(s) disclaim responsibility for any injury to people or property resulting from any ideas, methods, instructions or products referred to in the content. |
© 2023 by the authors. Licensee MDPI, Basel, Switzerland. This article is an open access article distributed under the terms and conditions of the Creative Commons Attribution (CC BY) license (https://creativecommons.org/licenses/by/4.0/).
Share and Cite
Wang, Q.; Xu, X.; Ding, X.; Chen, T.; Deng, R. Quality Evaluation Approach for Prefabricated Buildings Using Ant Colony Algorithm and Simulated Annealing Algorithm to Optimize the Projection Pursuit Model. Buildings 2023, 13, 2307. https://doi.org/10.3390/buildings13092307
Wang Q, Xu X, Ding X, Chen T, Deng R. Quality Evaluation Approach for Prefabricated Buildings Using Ant Colony Algorithm and Simulated Annealing Algorithm to Optimize the Projection Pursuit Model. Buildings. 2023; 13(9):2307. https://doi.org/10.3390/buildings13092307
Chicago/Turabian StyleWang, Qun, Xizhen Xu, Xiaoxin Ding, Tiebing Chen, and Ronghui Deng. 2023. "Quality Evaluation Approach for Prefabricated Buildings Using Ant Colony Algorithm and Simulated Annealing Algorithm to Optimize the Projection Pursuit Model" Buildings 13, no. 9: 2307. https://doi.org/10.3390/buildings13092307