
An Experimental Study on the Bond–Slip Relationship between Rebar and Ultra-High-Performance Concrete Grouted in Bellows
1
The Shantou Comprehensive Free Trade Zone Management Committee, Shantou 515071, China
2
School of Civil Engineering and Transportation, South China University of Technology, Guangzhou 510640, China
*
Author to whom correspondence should be addressed.
Buildings 2023, 13(9), 2375; https://doi.org/10.3390/buildings13092375
Submission received: 1 August 2023
/
Revised: 1 September 2023
/
Accepted: 11 September 2023
/
Published: 18 September 2023
(This article belongs to the Special Issue Advanced Concrete Structures: Structural Behaviors and Design Methods)
Abstract
:Ultra-high-performance concrete (UHPC)-filled duct connection is an innovative solution for joining assembled structures, in which the anchorage performance of the rebar and UHPC filled in bellows plays a critical role in determining the overall connection effectiveness. To establish a reliable anchorage length and a bond–slip relationship between rebar and UHPC within a bellow, a total of 16 specimens were conducted, and pullout tests were carried out. Two parameters were considered, including the diameter ratio (D/d), representing the proportion of the diameter of the bellow D to the diameter of the steel bar d, and anchorage length (L). By analyzing the failure modes, load versus deflection curves, and steel strain data, the influences of the diameter ratio and anchorage length on the anchorage performance were discussed. The test results showed that the failure mode changed from rebar pullout to rebar breakage as the anchorage length increased from 3 d to over 10 d. The reliable anchorage length of the rebar was recommended to be at least 10 d with a diameter ratio (D/d) of 2.4. Moreover, a fitting bond–slip model was proposed based on the experimental bond–slip curves between the rebar and UHPC interface within the bellows with high precision. These findings constitute a crucial basis for the comprehensive stress analysis of assembled structures connected using UHPC grouted in bellows.
1. Introduction
With the rapid development of the construction industry worldwide, the Earth’s environment urgently needs to be protected. Green construction has become a focus in recent years [1,2]. Technological innovation [3,4] and novel materials [5,6] for green construction were developed to reduce the carbon footprint and lower costs from the building industry. Accelerated bridge construction (ABC) is assuming an increasingly pivotal role in urban bridge construction worldwide due to its high quality, rapid construction, minimum interference in traffic, and ability to reduce environmental pollution [7,8,9]. A prefabricated column is a typical precast element, and the connections between columns and cap beams and its foundations are critical to the integrality and seismic performance of a bridge [10,11]. To date, various connections for precast columns have been developed, such as socket connections [12], pocket connections [13], bar couplers [14], and grouted ducts [15]. Many studies [12,13,14,15] have been conducted to verify the feasibility and effectiveness of these connections. To enhance the effectiveness of these connections, high-performance materials such as ultra-high-performance concrete (UHPC) [16] were proposed for use in the joint region due to their excellent mechanical properties, durability, and bond behavior.
Grout-filled duct connections have gained increasing attention recently as a convenient method in precast column construction. In this type of connection, the straight longitudinal bars of the column are anchored within corrugated ducts that are subsequently grouted, as depicted in Figure 1a. Experimental results have proved that grout-filled duct connections are emulative of cast-in-place construction specimens [17].
Ultra-high-performance concrete (UHPC) has emerged as a promising grout to enhance bond behavior and reduce the required embedment length of bars [18,19]. UHPC is a cementitious material formulated by mixing Portland cement, fine silica sand, silica fume, quartz flour, water reducer, and steel fibers. Compared to normal concrete (NC), UHPC exhibits significantly higher strength and ductility, and especially stronger bonding performance with steel bars [20,21]. The use of UHPC is becoming more widespread in new construction and retrofitting activities in civil engineering [22,23,24].
Some experimental studies [17,18,25,26,27,28,29,30] have been conducted in recent years to investigate the seismic performance of precast columns by using UHPC-filled duct connections. Experimental results have shown that no UHPC-filled duct connection damage such as bar pullout, duct pullout, or conical failure of the footing was observed, and the longitudinal bars of columns were well-anchored. It is worth noting that the seismic resilience of precast columns interconnected via UHPC-filled ducts closely approximates that of conventional cast-in-place construction specimens. Evidently, the UHPC-filled duct connection method shows immense potential for enhancing the efficiency and seismic performance of precast columns in civil engineering applications.
The anchoring performance of both the rebar and the UHPC filled within the bellows plays a pivotal role in facilitating force transmission between the structural members and determining the overall mechanical behavior of the structure. To conduct a comprehensive structure stress analysis by using UHPC-filled duct connections, it is essential to understand the bond–slip relationship between the rebar and the UHPC interface. Although numerous researchers [31,32,33,34,35,36,37] have directed their efforts toward investigating the interfacial bonding performance of rebar and UHPC through pullout tests, limited attention has been given to the distinctive scenario in which UHPC is infused within the bellows. In this scenario, the forces are different from the forces experienced when rebar is directly embedded in UHPC, as illustrated in Figure 2. It is necessary to consider this difference as it can potentially impact the overall connection performance.
Su et al. [31] conducted direct shear tests to investigate the shear mechanism and strength of a novel gravity-type grouted sleeve connection using UHPC. Their findings indicated that the UHPC-based connection exhibited shear strength at least 50% higher than that of traditional connections. Moreover, the failure mode of the UHPC-based connection resembled that of cast-in-place (CIP) specimens. Fehling et al. [32] explored the impact of different protective layer thicknesses and anchorage lengths on the anchorage performance of rebar-UHPC connections through pullout tests. They discovered that for rebar with a diameter of 12 mm, the reliable anchorage lengths were 4 d, 6 d, and 8 d, corresponding to protective layer thicknesses of 2.5 d, 2 d, and 1.5 d, respectively. Yuan and Graybeal [33] investigated the effects of rebar diameter, spacing, and coating on the anchorage performance of rebar-UHPC connections using pullout tests. Their results revealed that rebar with diameters of 13 mm and 25 mm exhibited average bond strengths from 20 MPa to 35 MPa. For a protective layer thicknesses of 3 d and spacing between rebar of 2 d, the minimum reliable anchorage length for the rebar was 8 d. Vidya Sagar Ronanki et al. [34] conducted rebar pullout tests to study the effect of rebar diameter (ranging from 13 mm to 22 mm), anchorage length (6 d to 10 d), protective layer thickness, and maintenance age on the anchorage performance of rebar-UHPC connections. Their experimental results demonstrated that the average bond strength of rebar-UHPC was approximately 5 times (9.7 MPa to 16.6 MPa) that of rebar–ordinary concrete bond strength, with the average bond strength increasing with the rise in rebar anchorage length. The bond stress was non-uniform, with the majority being distributed along the anchorage length within 2.5 d. Aoxiang Hu et al. [35] conducted a series of pullout tests to investigate the bond characteristics of deformed high-strength steel bars embedded in ultra-high-performance concrete (UHPC). Their results indicated that UHPC significantly increased the bond strength of deformed reinforcing steel bars, with the bond strength increasing with bar diameter. Additionally, the average bond stress of deformed reinforcing steel bars embedded in UHPC increased with increasing steel fiber volume content (up to 3%), concrete cover, and bar grades; it decreased with an increase in bar embedment length. Qi et al. [36] explored the bond behavior of reinforcing bars in ultra-high-performance concrete (UHPC) through both experimental and theoretical pullout tests. They found that inadequate concrete cover depth led to splitting failure, while a short embedment length resulted in concrete cone failure, leading to lower bond strengths. The bond strength increased by up to 229.8%, and the pullout energy increased by 401.4% as the concrete cover depth increased from 0.5 d to 2 d. They recommended development lengths of 6 d and 8 d corresponding to concrete cover depths of 2 d and 1.5 d, respectively. Liu et al. [37] conducted central unidirectional pullout tests on 54 prismatic specimens with deformed steel bars embedded in UHPC without lateral constraints. Their results revealed that when the anchorage length exceeded two times the diameter of the steel bar, the maximum strain occurred at approximately 1.5 times the diameter away from the loading end. The maximum bond stress decreased with increasing anchorage length but increased with increasing concrete cover. But excessive concrete cover did not yield a noticeable gain effect.
It is essential to highlight that the previous investigations into the anchorage performance of the rebar-UHPC interface were focused solely on a single interface between rebar and UHPC, as illustrated in Figure 3a. They did not take into account the specific connection technology of UHPC grouted in bellows, where the rebar is embedded inside the UHPC within the bellows (Figure 3b). Furthermore, the protective layer thickness of the rebar is linked to the diameter D of the grouted bellows and the diameter d of the longitudinal rebar, defined as the diameter ratio D/d. However, there are very limited studies that address the anchorage performance of rebar confined by UHPC filled within bellows, and the relevant interfacial bond–slip model is rarely reported in the existing literature. This gap in research needs to be addressed to gain a comprehensive understanding of the performance of the connections of UHPC grouted in bellows.
In this research, the anchorage performance of the rebar-UHPC grouted in bellows was experimentally investigated, specifically considering the actual situation in which the rebars were anchored by UHPC in the bellows. The focus of this study was on the interface between the rebar and the grouted UHPC inside the bellows, as depicted in Figure 3b. To achieve this objective, a series of tests on 16 specimens comprising metal corrugated pipes filled with UHPC and rebar were conducted, considering various diameter ratios (D/d) and anchorage lengths (L), and they were subjected to tension. The failure modes, load versus deflection curves, and steel strain data were analyzed to determine the reliable anchorage length and establish the bond–slip relationship between the rebar and UHPC within the bellows. These findings serve as a fundamental basis for the widespread adoption and application of the UHPC grout-filled bellow connection technology.
2. Experimental Program
2.1. Specimens and Test Matrix
The study primarily focused on two key factors: the diameter ratio (D/d), representing the proportion of the bellow diameter (D) to the rebar diameter (d), and the anchorage length (L). To investigate the effect of these factors, pullout tests were designed and performed on the specimen illustrated in Figure 3b.
Based on previous literature [31,32,33,34,35,36,37], it became evident that when the anchorage length (L) of the rebar inserted into the UHPC grouted in bellows exceeded 10 times the rebar diameter (10 d), no observable bond damage occurred at the interface between the rebar and UHPC, which indicated a reliable anchorage. If the anchorage length (L) was less than 10 d, it was possible for bond damage to occur. Therefore, the specimens in this study were categorized into two series: Series A, with anchorage length (L) exceeding 10 d, was utilized to explore the impact of the diameter ratio (D/d) and anchorage length (L) on the anchorage performance. Series B, characterized by an anchorage length (L) that could lead to bond damage due to being less than 10 d, was employed to study the interfacial bond–slip relationship between the rebar and the UHPC grouted in bellows. These distinct series allowed for a comprehensive analysis of the anchorage behavior and bond–slip characteristics under varying conditions.
In this study, HRB400 steel bar with a diameter of 25 (Φ25) was used. Series A was composed of four groups, each with a different anchorage length (10 d, 15 d, 20 d, and 24 d), and contained one specimen per group. On the other hand, Series B included 4 groups based on the anchorage length (3 d, 5 d, 7 d, and 10 d), with two specimens in each group, resulting in a total of 8 groups and 16 specimens, as detailed in Table 1.
In the table, the specimen named Φ25-60-24d indicates that the diameter of the steel bar was 25 mm, the diameter of the bellow was 60 mm, and the anchorage length was 24 d.
2.2. Specimen Fabrication
In Series A, the specimens were positioned on three ordinary concrete anchor blocks measuring 1200 mm × 1200 mm. Among them, two blocks had a height (H) of 600 mm, while one had a height (H) of 800 mm, accommodating different anchorage depths. The concrete grade used for the anchor blocks was C50. To mitigate any potential influence between individual specimens, the spacing between adjacent bellows was set at 300 mm [38], as illustrated in Figure 4a.
As for Series B, the objective was to investigate the interfacial bond–slip relationship between the rebar and the UHPC grout-filled bellow. Each specimen was independently fabricated, and the corrugated pipe was pre-buried in C50 concrete test blocks. These test blocks had dimensions of 250 mm × 250 mm, and the heights (H) were set at 320 mm, 250 mm, and 200 mm, respectively, according to the anchorage length, as shown in Figure 4b.
To prevent stress concentration at the ends of the connection between the rebar and the concrete specimen block from affecting the interfacial bonding performance, a section of PVC pipe was pre-fixed at the connection ends. This section of PVC pipe acted as an unbounded section for the rebar, thus controlling the different anchorage lengths of the rebar. The metal bellows used in the specimens had a diameter of 80 mm.
Figure 5 shows the fabrication process of series A and series B specimens. The main steps included the pre-burial of the bellows → casting and curing the anchor block concrete → the positioning of the rebar → filling the bellows with UHPC → curing and forming the UHPC.
2.3. Material Properties
The specimens were composed of various materials, including normal concrete (NC) for the anchor blocks, Φ25 rebar, UHPC, and Φ80 metal bellows. The mechanical properties of the bellows were provided by the manufacturer, while the mechanical properties of the other main materials were tested and recorded, as depicted in Figure 6.
The composition of the UHPC grouting material included cement, mineral powder, silica fume, quartz sand, water reducer, and water. The water-to-cement ratio was 0.19, while incorporating a steel fiber volume fraction of 2%. The steel macro-fiber used here is produced by Ganzhou Daye fibers Company in China. The total length of a single steel fiber was 13 mm with the diameter of 0.2 mm. The tensile strength of the steel fiber was 2850 Mpa. The mix proportions of UHPC are summarized in Table 2.
The test results revealed that the compressive strength of the ordinary concrete used for the anchor blocks was 51.2 MPa, with a modulus of elasticity of 35.0 GPa. As for the Φ25 rebar, the average values for yield strength, tensile strength, and modulus of elasticity were 445.1 MPa, 615.1 MPa, and 205.5 GPa, respectively. Under normal temperature curing conditions, the average 28-day tensile strength of UHPC was determined to be 8.4 MPa. Additionally, the average compressive strength of UHPC at the 28-day mark was recorded as 116.1 MPa. The properties of the materials are summarized in Table 3.
2.4. Test Set-up and Instrumentation
2.4.1. Loading Solutions and Instrumentation
Test set-up and the loading instrumentation are shown in Figure 7. For continuous loading in a load-controlled manner, a through-core electro hydraulic jack with a capacity of 100 tons was employed. The loading speed was maintained within the range of 15–20 kN/min until the bar yielded, after which, it was adjusted to 8–10 kN/min. Once the steel bar was pulled out or experienced breakage or the concrete block cracked, the test stopped immediately.
During the tests, the tensile force (F) in the axial direction of the rebar was measured using a force sensor in the jack. Simultaneously, the displacement at the loading end of the rebar was recorded with a displacement meter.
2.4.2. Arrangement and Testing of Strain Gauges on Rebar
To measure the bond stress at the contact interface between the rebar and UHPC, strain gauges were affixed to the rebar uniformly. The strain measurements were taken using a strain test analyzer, specifically model DH3816, with an acquisition frequency of 1 Hz.
The arrangement of strain gauges is illustrated in Figure 8. In Series A, the first strain gauge (Gauge 1) was positioned 50 mm above the surface of the concrete block, and a total of 5 additional strain gauges were evenly spaced downward in the anchorage section of the rebar. This resulted in 6 strain gauges being placed at 50 mm intervals from one another. The spacing of strain gauges in Series B was 20 mm, as shown in Figure 8b. The number of strain gauges used was dependent on the anchorage length (L) of the specimen.
3. Results and Discussion
3.1. Failure Mode
The failure modes and characteristic load values of each specimen are summarized in Table 4. It is evident that when the anchorage length exceeded 10 d, all the steel bars in the specimens in Series A fractured due to tension, as depicted in Figure 9a. This observation confirms that the rebars were reliably anchored, ensuring a robust connection.
Regarding specimens in Series B, with an anchorage length (L) below 10 d, two typical failure modes were observed: (1) As for the specimens with anchorage lengths of 10 d (Φ25-80-10d), the rebar experienced tensile failure, indicating that the anchorage length was sufficient, and the anchorage was reliable. (2) With anchorage lengths of 3 d, 5 d, and 7 d, the rebar underwent pullout, indicating that bonding failure occurred at the rebar-UHPC interface, as shown in Figure 9b.
Table 4 presents the failure mode and characteristic load values of each specimen, where the load characteristic values are averaged for two specimens with the same anchorage length in Series B.
3.2. Load versus Deflection Curves
Figure 10 displays the load versus deflection curves of the specimens. In general, the curves of two series of specimens exhibited significantly different load-deflection behaviors due to different anchorage lengths (L). When the anchorage length was more than 10 d (Series A), the load–displacement curve showed better ductility due to the reliable anchorage. The curves displayed a three-stage development process, characterized by linear growth, yielding, and strengthening, which is similar to the load–displacement curve of the steel bar under tension. When the anchorage length was less than 10 d (Series B), distinct behaviors were observed based on the anchorage length. When L was equal to 7 d and 10 d, the load–displacement curves of these two groups of specimens showed good ductility characteristics, indicating that the steel bar has a yield phenomenon. However, when L was set at 3 d and 5 d, the curves dropped suddenly after the peak load, indicating that the interface between the rebar and UHPC slipped. That is to say, when the anchorage length was less than 7 d, the steel bar was not effectively anchored, and the interface was damaged.
Figure 10a is a comparison of the load–displacement curves of two specimens with the same anchorage length but different diameter ratios. It can be seen that when the anchoring length was the same, the larger the diameter ratio (D/d) and the stronger the anchoring load. With the increase in anchorage length, the influence of the diameter ratio on the bearing capacity reduced. When L was 24 d, the influence of D/d could be neglected. Figure 10b is the load–displacement curve of two specimens within the same group in series B with the same anchorage length and diameter ratio. It is obvious that the curves of the two specimens in each group were close to each other.
3.3. Analysis of Factors Influencing Anchorage Performance of Rebar-UHPC Grouted in Bellows
3.3.1. Diameter Ratio D/d
The load versus deflection curves for specimens with different diameter ratios (D/d) are presented in Figure 10a. The experimental results indicate that effective anchorage of the rebar was achieved when the diameter ratio (D/d) was greater than 2.4.
Additionally, among specimens with the same anchorage length (L), those possessing a diameter ratio (D/d) of 3.2 exhibited higher yield and ultimate loads compared to those with a ratio of 2.4. This trend is substantiated by the strength characteristic values detailed in Table 4. For series A specimens, the ultimate loads increased by 15.47%, 8.89%, and 9.75% for anchorage lengths of 10 d, 15 d, and 20 d, respectively. This trend highlights that using metal bellows with a larger diameter (D) provides enhanced anchorage force and stronger anchorage performance for rebars of the same diameter (d).
3.3.2. Anchorage Length L
Figure 11 presents a comparison of the load versus deflection curves for specimens with the same diameter ratio (D/d) but different anchorage lengths (L).
Figure 11a is a comparison of the load–displacement curves of specimens in series A with the same diameter ratio of 3.2. It can be seen that the curves were very close, because the steel bar was reliably anchored when the anchorage length was enough, i.e., when L = 10 d, 15 d, 20 d, and 24 d, and all the specimens had the same mechanical behavior. The bonding performance of the interface between the reinforcement and the UHPC inside the bellows was reliable, and there was no slip. Therefore, the effective anchorage length (La) is recommended to be more than 10 d when using UHPC-filled duct connections.
Figure 11b presents the comparison of load–displacement curves of specimens in Series B with different anchorage lengths (3 d, 5 d, 7 d, and 10 d) and the same diameter ratio of 3.2. It can be seen that when the anchorage length was less than 10 d, the anchorage length had a significant effect on the load–displacement curves. When L was 10 d, the load–deflection curve exhibited a three-stage development process, similar to the curve characteristics observed in Series A, which indicated the anchorage was reliable. When L was 7 d, the load–deflection curve also showed ductility characteristics, and the rebar yielded. However, bond failure occurred at the interface between the rebar and UHPC as the load increased. Finally, the steel bar was pulled out and the load suddenly dropped. For the two groups of specimens with L = 5 d and 3 d, the load–displacement curve showed obvious brittle failure characteristics. Bond failure at the interface happened before the rebar yielded due to the insufficient anchorage, resulting in the rebar being pulled out. The ultimate bearing capacity of the two groups of specimens was reduced by 35.0% and 36.3%, respectively, compared to that of specimens with L = 10 d.
Clearly, the diameter ratio (D/d) and anchorage length (L) are two crucial factors influencing the anchorage performance of the rebar in UHPC grouted in bellows. The experimental results show the conditions for the reliable anchorage of the rebar are D/d ≥ 2.4 and L ≥ 10 d.
4. Bond–Slip Relationship of the Interface of Rebar-UHPC Grouted in Bellows
4.1. Load–Strain Curves (F-ε)
To establish the bond–slip relationship curve at the interface between the rebar and the UHPC grouted in bellows, a comprehensive strain analysis was executed for the specimens in Series B, where interfacial bond damage had occurred. The strain variation curves along the rebar of Series B specimens, correlating with load (F-ε), are illustrated in Figure 12.
As the load increased, the force transmission from the upper part of the anchorage section to the remote end occurred through the interfacial bond, leading to varying strains in the test specimens.
When considering an anchorage length of 3 d, several strain values near the loading end (1–5) initially increased followed by a subsequent decline. This phenomenon can be attributed to the relatively limited anchorage length, causing the upper part of the anchorage zone to start slipping when the load reached 90 kN. Consequently, this led to a reduction in the strain value for the upper part of the anchorage section.
With an anchorage length of 7 d, several strain measurement points near the loading end (1, 2, and 4) suddenly increased when the load reached approximately 225 kN. This occurrence was due to the rebar entering the yield platform, while the displacement at the loading end continued to increase even when the load remained constant, resulting in a sudden rise in strain values.
4.2. Experimental Curve for Bond–Slip Relationship
4.2.1. Standardization of Strain Positions
To explore the force transfer mechanism of rebar within UHPC grouted in bellows, the arrangement of strain measurement points along the anchorage section was standardized by defining an x-coordinate axis aligned with the rebar’s direction. This axis denoted the downward direction as positive direction, and it corresponded to the anchorage length, with the origin (0) placed at the beginning of the anchorage section. Each strain gauge’s position (x) was normalized by dividing the total anchorage section length (L); then, the relative position of each measurement point was determined. The coordinate axis is illustrated in Figure 13.
The strain–position curves following position standardization are depicted in Figure 14. Remarkably, as the anchorage length increased, the strain peak gradually shifted closer to the loading end. Furthermore, as the anchorage length extended, the shift of the strain peak towards the loading end became more pronounced. For instance, at anchorage lengths of 3 d and 5 d, the strain peaks appeared at x = 0.5 L and x = 0.18 L, respectively. Within the range of 7 d ≤ L ≤ 10 d, the strain peaks emerged near x = 0.12 L. Notably, when L = 10 d, and the specimen neared its damage point, the strain–position curve transitioned into to a bimodal shape. In this configuration, two peaks emerged around x = 0.12 L and x = 0.35 L. This behavior indicates complex force transfer characteristics within the anchorage section as the specimen approached its ultimate limit.
4.2.2. Interfacial Bond–Slip Relationship Curves
Drawing from reference [39,40], when strain gauges are closely positioned, the average bond stress between two adjacent gauges can be approximated as the bond stress at that specific point. This approximation can be expressed through Equation (1):
In Equation (1), d represents the diameter of the rebar, ∆x denotes the distance between the two measurement points, and Es stands for the modulus of elasticity of the rebar.
The displacement at the loading end of the rebar consists of two main components. The first part corresponds to the elongation of the rebar, while the other part accounts for the slip occurring between the rebar and the UHPC grouted in bellows across all sections of the surface. The slip (s) can be calculated using the following formula:
In the context of Equations (1) and (2), s1 represents the displacement at the loaded end of the test, s2 represents the displacement at the free end, and ∆l signifies the elongation of the rebar from the loaded end to the upper surface of the bonded section of the anchored rebar.
Using Equations (1) and (2), the bond stress–slip (τ-s curve) test curves for three groups of specimens (L = 3 d, 5 d, and 7 d) in which interfacial bond–slip damage occurred were calculated from the strain data, as illustrated in Figure 15.
4.3. Model for Bond–Slip Relationship
The τ-s curves obtained from the tests were standardized by normalizing the horizontal axis (slip) by dividing it by the maximum value (su) and the vertical axis (bond stress) by dividing it by the maximum value (τu). The standardized curves are presented in Figure 16, illustrating a consistent form for the τ-s curves of each group of specimens after standardization.
By using the anchorage length (L) and the diameter ratio (D/d) as parameters, a fitting process for the standardized bond stress–slip curve and characteristic eigenvalues was conducted. As a result, the following model for the bond stress–slip relationship in rebar-UHPC grouted in metal bellows was established:
The model included the following parameters: τu, signifying the peak bond stress; su, denoting the corresponding peak slip; τr as the residual bond stress; and sr, representing the corresponding residual slip.
Based on the experimental data, the fitting results for each eigenvalue are as follows:
where d is the diameter of the rebar, L is the anchorage length, and D is the diameter of the bellows.
5. Conclusions
This study was focused on exploring the anchorage performance of the UHPC grout-filled bellow connection technology used in precast columns. To investigate this, a total of 16 steel-UHPC specimens grouted in metal bellows were designed and used, considering varying diameter ratios (D/d) and anchorage lengths (L), in pullout tests. The influence of D/d and L on the anchorage behavior of the rebar and UHPC grouted in the bellows was analyzed. A bond–slip model for the interface between the rebar and the UHPC within the bellows was established by fitting the experimental results. The main conclusions extracted from this study are as follows:
(1) The anchorage length (L) was the dominant factor affecting the anchorage performance of the rebar in the UHPC grouted in bellows. When the anchorage length (L) was more than 10 d, the rebar anchorage was dependable, with all specimens with rebar exhibiting tensile failure. As a result, to ensure dependable rebar anchorage in the context of UHPC grouted in bellows, it is imperative to employ anchorage lengths (L) of at least 10 d.
(2) When the diameter ratio (D/d) was more than 2.4, specimens with an anchorage length (L) of 10 d achieved reliable anchorage via UHPC-filled bellows. The ultimate bearing capacity of specimens with D/d of 3.2 was 15.5% higher than that of specimens with D/d of 2.4. With the increase in anchorage length, the influence of the diameter ratio on the bearing capacity was reduced. When L was 24 d, the influence of D/d could be neglected.
(3) The strain distribution along the interface between rebars and UHPC exhibited a single peak distribution. The position of peak strain moved closer to the loading end as the anchorage length increased. After standardization, the experimental bond stress–position curves were obtained. The maximum bonding stress appeared at a distance of approximately 0.14 L from the loading end.
(4) The proposed three-stage bond–slip model based on the experimental curves can effectively describe the bond behavior of the interface between the rebar and UHPC grouted in bellows.
The research presented in this paper can provide a basis for the design and application of precast columns connected by using UHPC-filled ducts. It should be noted that the model proposed in this study is preliminary and needs more experiments and finite element analyses to further verify and improve it.
Author Contributions
Investigation, Z.W., Q.W. (Qiqi Wang) and Q.W. (Qian Wang); Data curation, Z.W., Q.W. (Qiqi Wang) and Q.W. (Qian Wang); Writing—original draft, Z.W.; Writing—review & editing, X.Z.; Project administration, X.Z.; Funding acquisition, X.Z. All authors have read and agreed to the published version of the manuscript.
Funding
This research was funded by Guangdong Provincial Natural Science Foundation grant number 2019A1515012222, and Guangzhou Science and Technology Planning Project grant number 202102080446.
Conflicts of Interest
The authors declare no conflict of interest.
References
- Farida, N.; Handayani, N.U.; Wibowo, M.A. Developing indicators of green construction of Green Supply Chain Management in construction industry: A literature review. IOP Conf. Ser. Mater. Sci. Eng. 2019, 598, 012021. [Google Scholar] [CrossRef]
- Ny Avotra, A.A.R.; Chenyun, Y.; Yongmin, W.; Lijuan, Z.; Nawaz, A. Conceptualizing the State of the Art of Corporate Social Responsibility (CSR) in Green Construction and Its Nexus to Sustainable Development. Front. Environ. Sci. 2021, 9, 541. [Google Scholar] [CrossRef]
- Hsiao, P.C.; Chou, S.C.; Hung, C.C. A novel seismic strengthening method for RC frames: Precast ultra-high performance concrete braces. J. Build. Eng. 2023, 71, 106592. [Google Scholar] [CrossRef]
- Halding, P.S. Reduction of the Carbon Footprint of Precast Columns by Combining Normal and Light Aggregate Concrete. Buildings 2022, 12, 215. [Google Scholar] [CrossRef]
- Wang, C.; Xiao, J.; Liu, W.; Ma, Z. Unloading and reloading stress-strain relationship of recycled aggregate concrete reinforced with steel/polypropylene fibers under uniaxial low-cycle loadings. Cem. Concr. Compos. 2022, 131, 104597. [Google Scholar] [CrossRef]
- Wang, C.; Wu, H.; Li, C. Hysteresis and damping properties of steel and polypropylene fiber reinforced recycled aggregate concrete under uniaxial low-cycle loadings. Constr. Build. Mater. 2022, 319, 126191. [Google Scholar] [CrossRef]
- Culmo, M.P.; Lord, B.; Huie, M.; Beerman, B. Accelerated Bridge Construction: Experience in Design, Fabrication and Erection of Prefabricated Bridge Elements and Systems: Final Manual; Rep. No. FHWA-HIF-12-013; Federal Highway Administration, Office of Bridge Technology: Washington, DC, USA, 2011.
- Khaleghi, B. Use of Precast Concrete Members for Accelerated Bridge Construction in Washington State. Transp. Res. Rec. J. Transp. Res. Board 2005, 11, 187–196. [Google Scholar] [CrossRef]
- Khan, M.A. Accelerated Bridge Construction: Best Practices and Techniques; Elsevier: Amsterdam, The Netherlands, 2014. [Google Scholar]
- Shafieifar, M.; Farzad, M.; Azizinamini, A. Investigation of a Detail for Connecting Precast Columns to Precast Cap Beams Using Ultrahigh-Performance Concrete. J. Bridg. Eng. 2020, 25, 04020001. [Google Scholar] [CrossRef]
- Zhang, Q.; Alam, M.S. State-of-the-Art Review of Seismic-resistant Precast Bridge Columns. In Proceedings of the 12th Canadian Conference on Earthquake Engineering, Quebec City, QC, Canada, 17–20 June 2019. [Google Scholar]
- Si, X.; Wen, J.; Zhang, G.; Jia, Z.; Han, Q. Seismic performance of precast double-column pier with UHPC-filled socket connections. Eng. Struct. 2023, 285, 115618. [Google Scholar] [CrossRef]
- Tazarv, M.; Saiidi, M.S. Design and Construction of Precast Bent Caps with Pocket Connections for High Seismic Regions; Rep. No. CCEER-15-06; Center for Civil Engineering Earthquake Research, Department of Civil and Environmental Engineering, University of Nevada: Reno, NE, USA, 2015. [Google Scholar]
- Qu, H.; Fu, J.; Li, T.; Wu, C.; Sun, X.; Wei, H.; Wang, Z. Experimental and numerical assessment of precast bridge columns with different grouted splice sleeve coupler designs based on shake table test. J. Bridge Eng. 2021, 26, 04021055. [Google Scholar] [CrossRef]
- Haber, Z.B.; Mackie, K.R.; Al-Jelawy, H.M. Testing and analysis of precast columns with grouted sleeve connections and shifted plastic hinging. J. Bridge Eng. ASCE 2017, 22, 04017078. [Google Scholar] [CrossRef]
- Wang, J.Q.; Wang, Z.; Gao, Y.F.; Zhu, J.Z. Review on aseismic behavior of precast piers: New material, new concept, and new application. Eng. Mech. 2019, 36, 1–23. [Google Scholar]
- Restrepo, J.I.; Tobolski, M.J.; Matsumoto, E.E. Development of a Precast Bent Cap System for Seismic Regions; National Cooperative Highway Research Program (NCHRP) Report 681; The National Academies Press: Washington, DC, USA, 2011; 166p. [Google Scholar]
- Tazarv, M.; Saiidi, M.S. UHPC-filled duct connections for accelerated bridge construction of RC columns in high seismic zones. Eng. Struct. 2015, 99, 413–422. [Google Scholar] [CrossRef]
- Fu, T.; Zhu, Z.; Ren, X.; Wang, K.; Meng, L.; Sun, Z. Research on the seismic behavior of hollow prefabricated square column with high-strength reinforcement using UHPC grouting materials. Case Stud. Constr. Mater. 2023, 18, e01816. [Google Scholar]
- Yuan, J.; Graybeal, B.A. Bond Behavior of Reinforcing Steel in Ultra-High Performance Concrete; Report No. FHWA-HRT-14-089; Federal Highway Administration: McLean, VA, USA, 2014.
- ACI Committee 239. Ultra-high performance concrete. In Proceedings of the ACI Fall Convention, Toronto, ON, Canada, 29 January–4 February 2012. [Google Scholar]
- Jiang, H.; Li, Y.; Liu, A.; Chen, L.; Chen, Y.; Xiao, J. Experimental Study on Shear Behavior of Precast Concrete Segmental Beams with Hybrid Tendons and Dry Joints. KSCE J. Civ. Eng. 2019, 23, 4354–4367. [Google Scholar] [CrossRef]
- Ye, M.; Li, L.; Pei, B.; Yoo, D.-Y.; Li, H. Shear behavior of externally prestressed ultra-high-performance concrete (UHPC) T-beams without stirrups. Eng. Struct. 2023, 288, 116217. [Google Scholar] [CrossRef]
- Li, H.; Li, L.; Du, C.; Ye, M.; Shao, X.; Zhou, C. Experimental Study on the Flexural Behavior of a Novel Nonprismatic Prestressed UHPC Composite Box Girder with Corrugated Steel Webs. J. Bridg. Eng. 2023, 28, 04023045. [Google Scholar] [CrossRef]
- Xu, W.; Ma, B.; Duan, X.; Li, J. Experimental investigation of seismic behavior of UHPC connection between precast columns and footings in bridges. Eng. Struct. 2021, 239, 112344. [Google Scholar] [CrossRef]
- Gao, J.; Xiang, N.; Li, J.; Xu, W. Cyclic Behavior of Precast Double-Column Bridge Bents with Lap Splice Connections by UHPC. J. Bridg. Eng. 2023, 28, 04023035. [Google Scholar] [CrossRef]
- Xu, Y.; Zeng, Z.; Wang, Z.; Ge, J. Experimental studies of embedment length of precast bridge pier with socket connection to pile cap. Eng. Struct. 2021, 233, 111906. [Google Scholar] [CrossRef]
- Lei, S.; Liu, L.; Wu, F.; Lin, W.; Peng, K.; Cao, J. Seismic performance of short precast columns with UHPC grouted sleeve connections: An experimental and numerical study. Structures 2023, 55, 427–440. [Google Scholar] [CrossRef]
- Zhang, G.; Han, Q.; Xu, K.; Song, Y.; Li, Z.; Du, X. Parameter analysis and design on socket CFST column-cap beam joint with UHPC grouted connection. Eng. Struct. 2023, 292, 116528. [Google Scholar] [CrossRef]
- Zhang, G.; Han, Q.; Xu, K.; Du, X.; He, W. Quasi-static tests of CFST embedded RC column-to-precast cap beam with socket connection. Eng. Struct. 2021, 241, 112443. [Google Scholar] [CrossRef]
- Su, H.; Fan, W.; Wang, H.; Liu, B.; Sun, W.; Shao, X. Direct shear strength of UHPC-based gravity-type grouted sleeve connection members. J. Build. Eng. 2023, 69, 106266. [Google Scholar] [CrossRef]
- Fehling, E.; Lorenz, P.; Leutbecher, T. Experimental investigations on anchorage of rebars in UHPC. In Proceedings of the Hipermat 2012 3rd International Symposium on UHPC and Nanotechnology for High Performance Construction Materials, Kassel, Germany, 7–9 March 2012; pp. 533–540. [Google Scholar]
- Yuan, J.; Graybeal, B.A. Bond Behavior of Reinforcing Steel in Ultra-High Performance Concrete; No. FHWA-HRT-14-090; Federal Highway Administration, Office of Infrastructure Research and Development: Washington, DC, USA, 2014.
- Ronanki, V.S.; Aaleti, S.; Valentim, D.B. Experimental investigation of bond behavior of mild steel reinforcement in UHPC. Eng. Struct. 2018, 176, 707–718. [Google Scholar] [CrossRef]
- Hu, A.; Liang, X.; Shi, Q. Bond Characteristics between High-Strength Bars and Ultrahigh-Performance Concrete. J. Mater. Civ. Eng. 2020, 32, 04019323. [Google Scholar] [CrossRef]
- Qi, J.; Cheng, Z.; Ma, Z.J.; Wang, J.; Liu, J. Bond strength of reinforcing bars in ultra-high performance concrete: Experimental study and fiber–matrix discrete model. Eng. Struct. 2021, 248, 113290. [Google Scholar] [CrossRef]
- Liu, H.; Liu, Y.; Li, A.; Lei, H. Experimental study on the bond performance of deformed steel bar in ultrahigh performance concrete. Case Stud. Constr. Mater. 2023, 18, e01874. [Google Scholar] [CrossRef]
- Wang, H.; Liu, J.; Shi, P.; Tao, T.; Zhu, Q. Experimental study on anchorage performance of rebar-corrugated metal duct for grout splicing. J. Southeast Univ. (Nat. Sci. Ed.) 2020, 50, 215–221. [Google Scholar]
- Yoo, D.-Y.; Kwon, K.-Y.; Park, J.-J.; Yoon, Y.-S. Local bond-slip response of GFRP rebar in ultra-high-performance fiber-reinforced concrete. Compos. Struct. 2015, 120, 53–64. [Google Scholar] [CrossRef]
- Khaksefidi, S.; Ghalehnovi, M.; de Brito, J. Bond behaviour of high-strength steel rebars in normal (NSC) and ultra-high performance concrete (UHPC). J. Build. Eng. 2020, 33, 101592. [Google Scholar] [CrossRef]
Figure 1.
UHPC-filled duct connection technology. (a) Precast column, (b) pre-buried bellows, (c) splicing, (d) grouting UHPC.
Figure 1.
UHPC-filled duct connection technology. (a) Precast column, (b) pre-buried bellows, (c) splicing, (d) grouting UHPC.
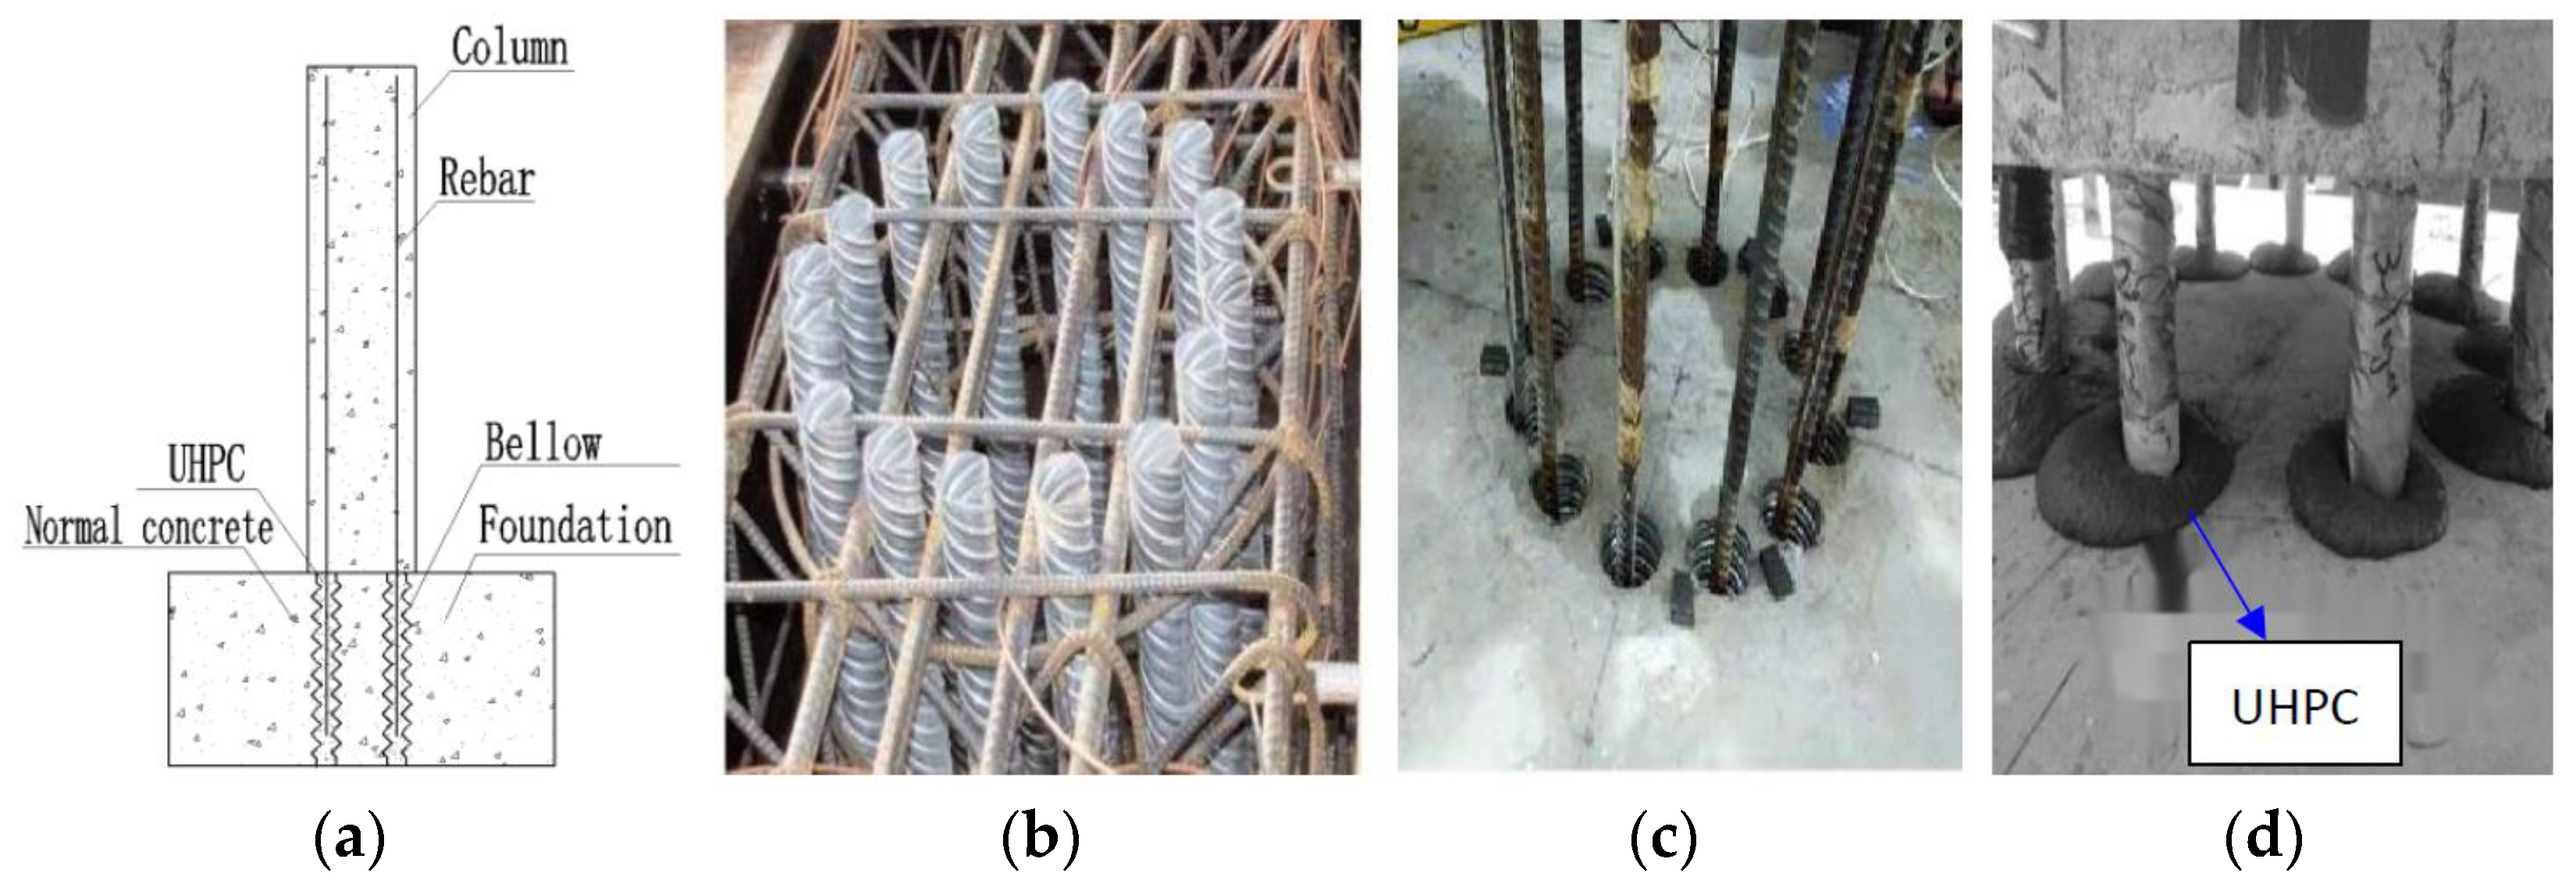
Figure 2.
Schematic diagram of rebar-UHPC tensile test [27].
Figure 2.
Schematic diagram of rebar-UHPC tensile test [27].
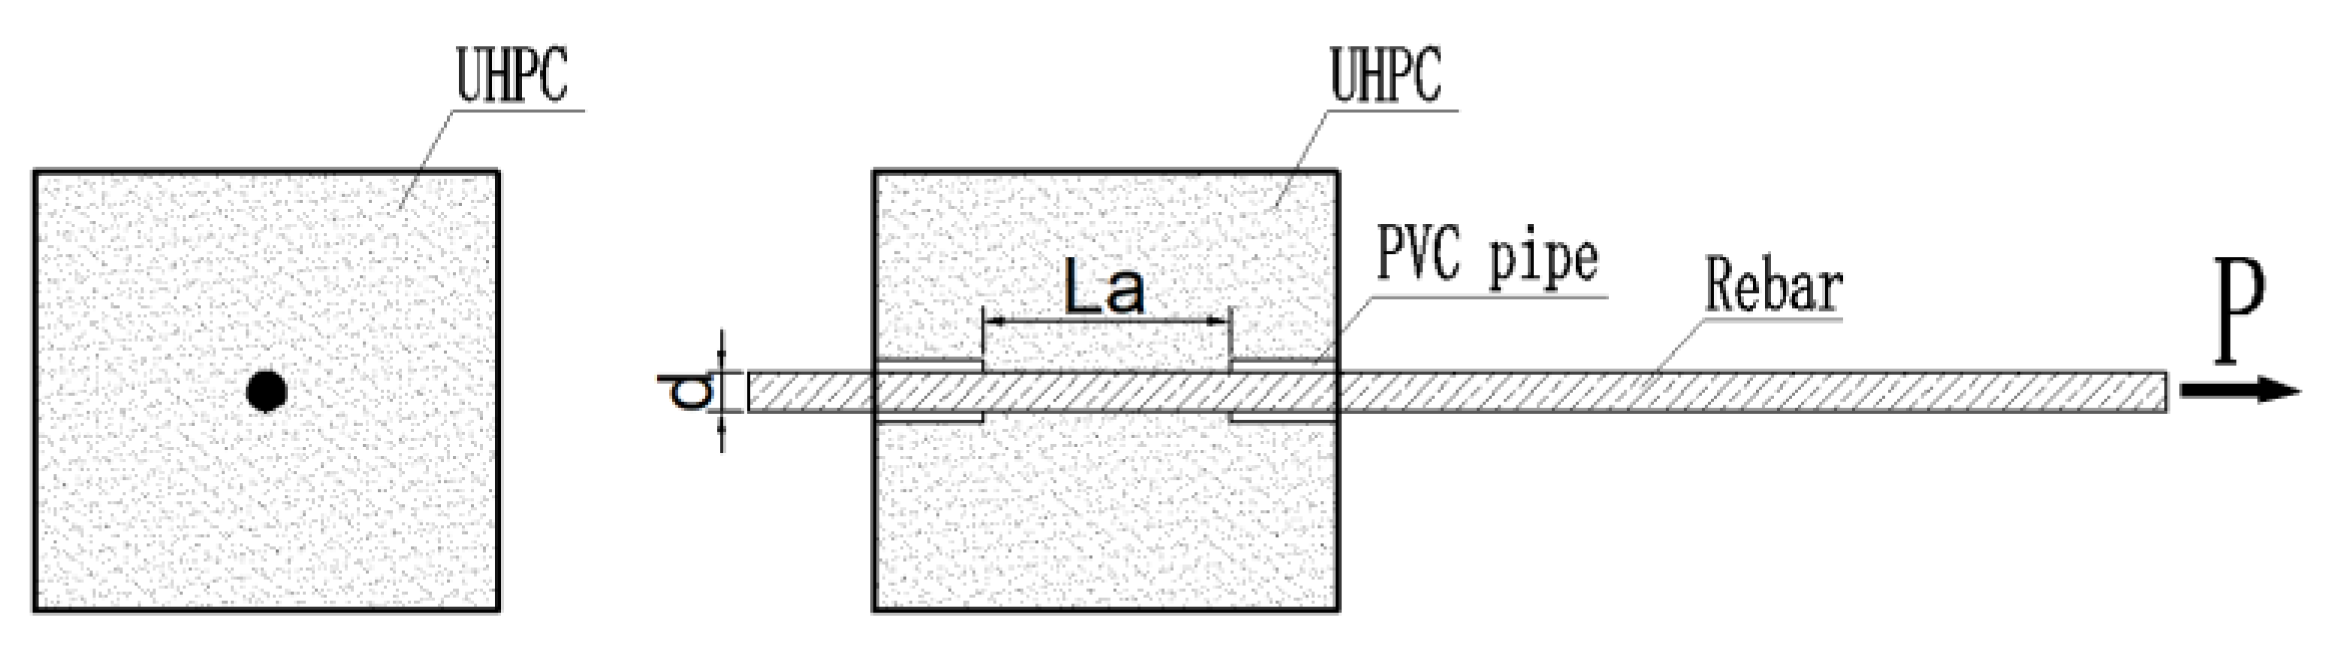
Figure 3.
Interface of connections of UHPC grouted in bellows. (a) Interface of rebar-UHPC, (b) interface of rebar-UHPC grouted in bellows.
Figure 3.
Interface of connections of UHPC grouted in bellows. (a) Interface of rebar-UHPC, (b) interface of rebar-UHPC grouted in bellows.

Figure 4.
Schematic diagram of the specimens. (a) Series A (L ≥ 10 d), (b) Series B (L ≤ 10 d).
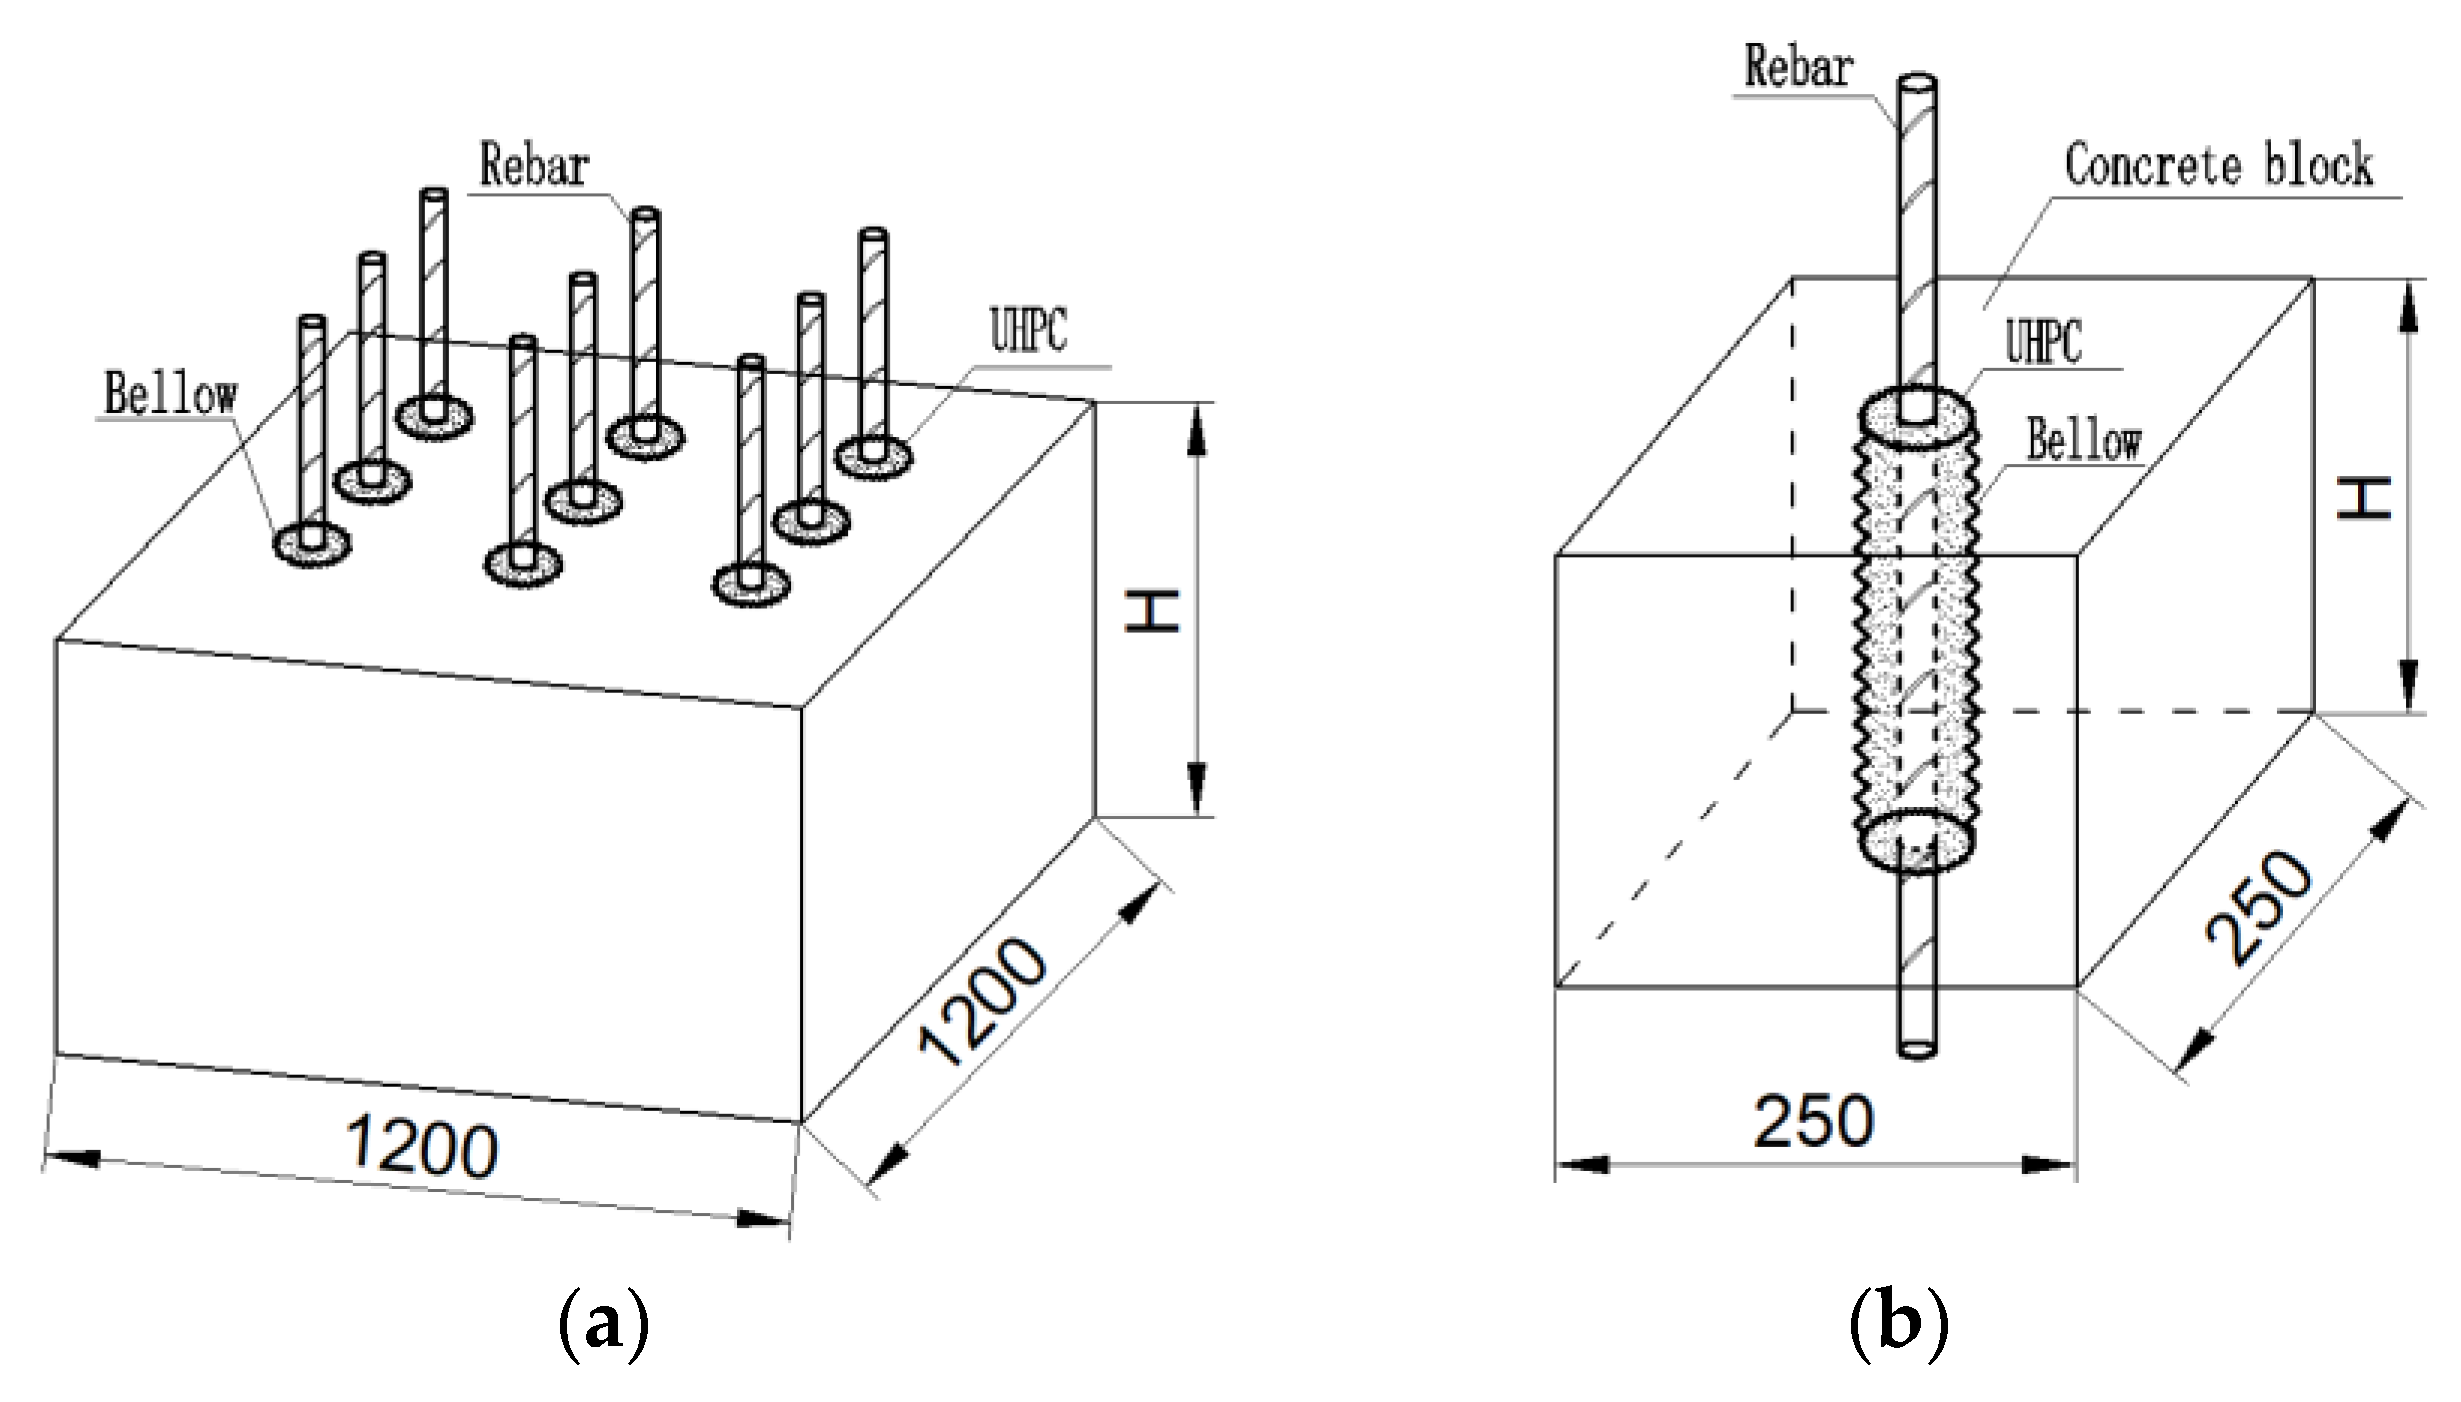
Figure 5.
Specimen fabrication. (a) Series A specimen fabrication. (b) Series B specimens.

Figure 6.
Test of mechanical property for materials. (a) Compressive test of NC, (b) tensile strength of rebar, (c) compressive test of UHPC, (d) tensile strength test of UHPC.
Figure 6.
Test of mechanical property for materials. (a) Compressive test of NC, (b) tensile strength of rebar, (c) compressive test of UHPC, (d) tensile strength test of UHPC.
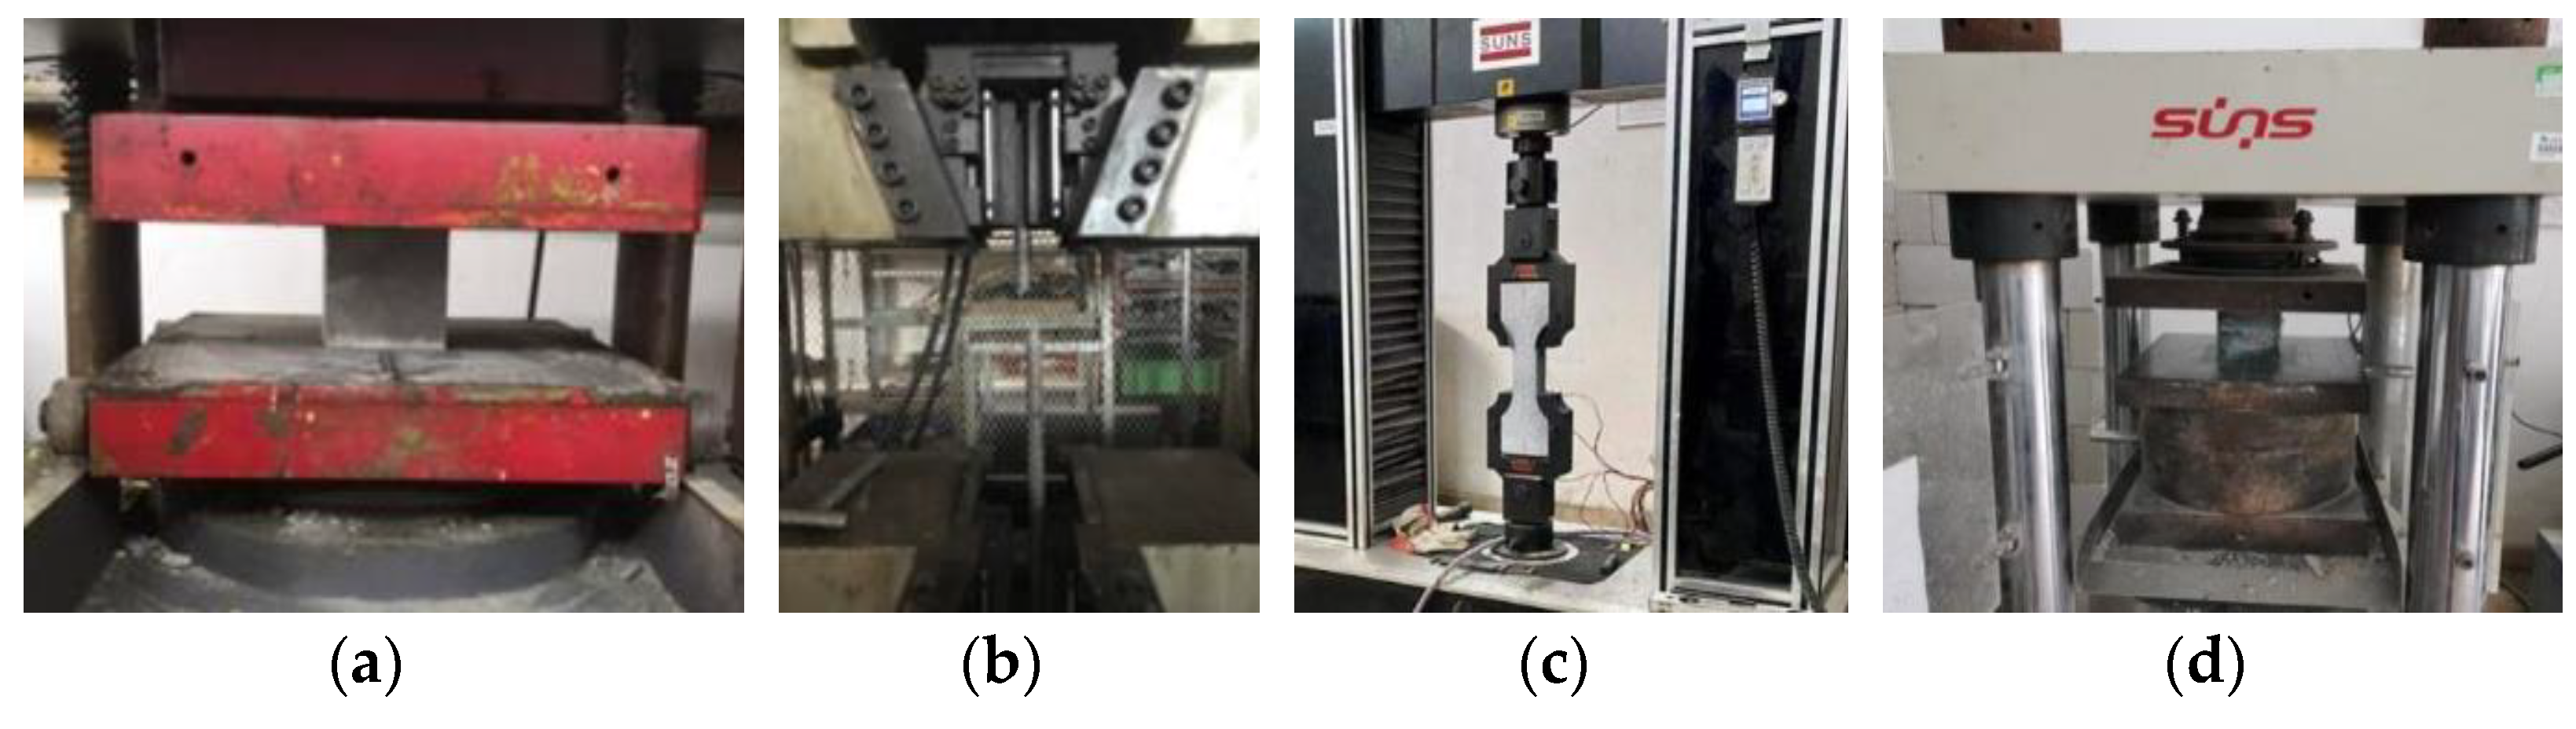
Figure 7.
Loading instrumentation diagram. (a) Schematic diagram, (b) loading equipment.

Figure 8.
Location of strain gauge. (a) Series A, (b) Series B.

Figure 9.
Typical failure mode. (a) Tensile failure of rebar (Φ25-80-10d). (b) Rebar pullout (Φ25-80-3d).
Figure 9.
Typical failure mode. (a) Tensile failure of rebar (Φ25-80-10d). (b) Rebar pullout (Φ25-80-3d).
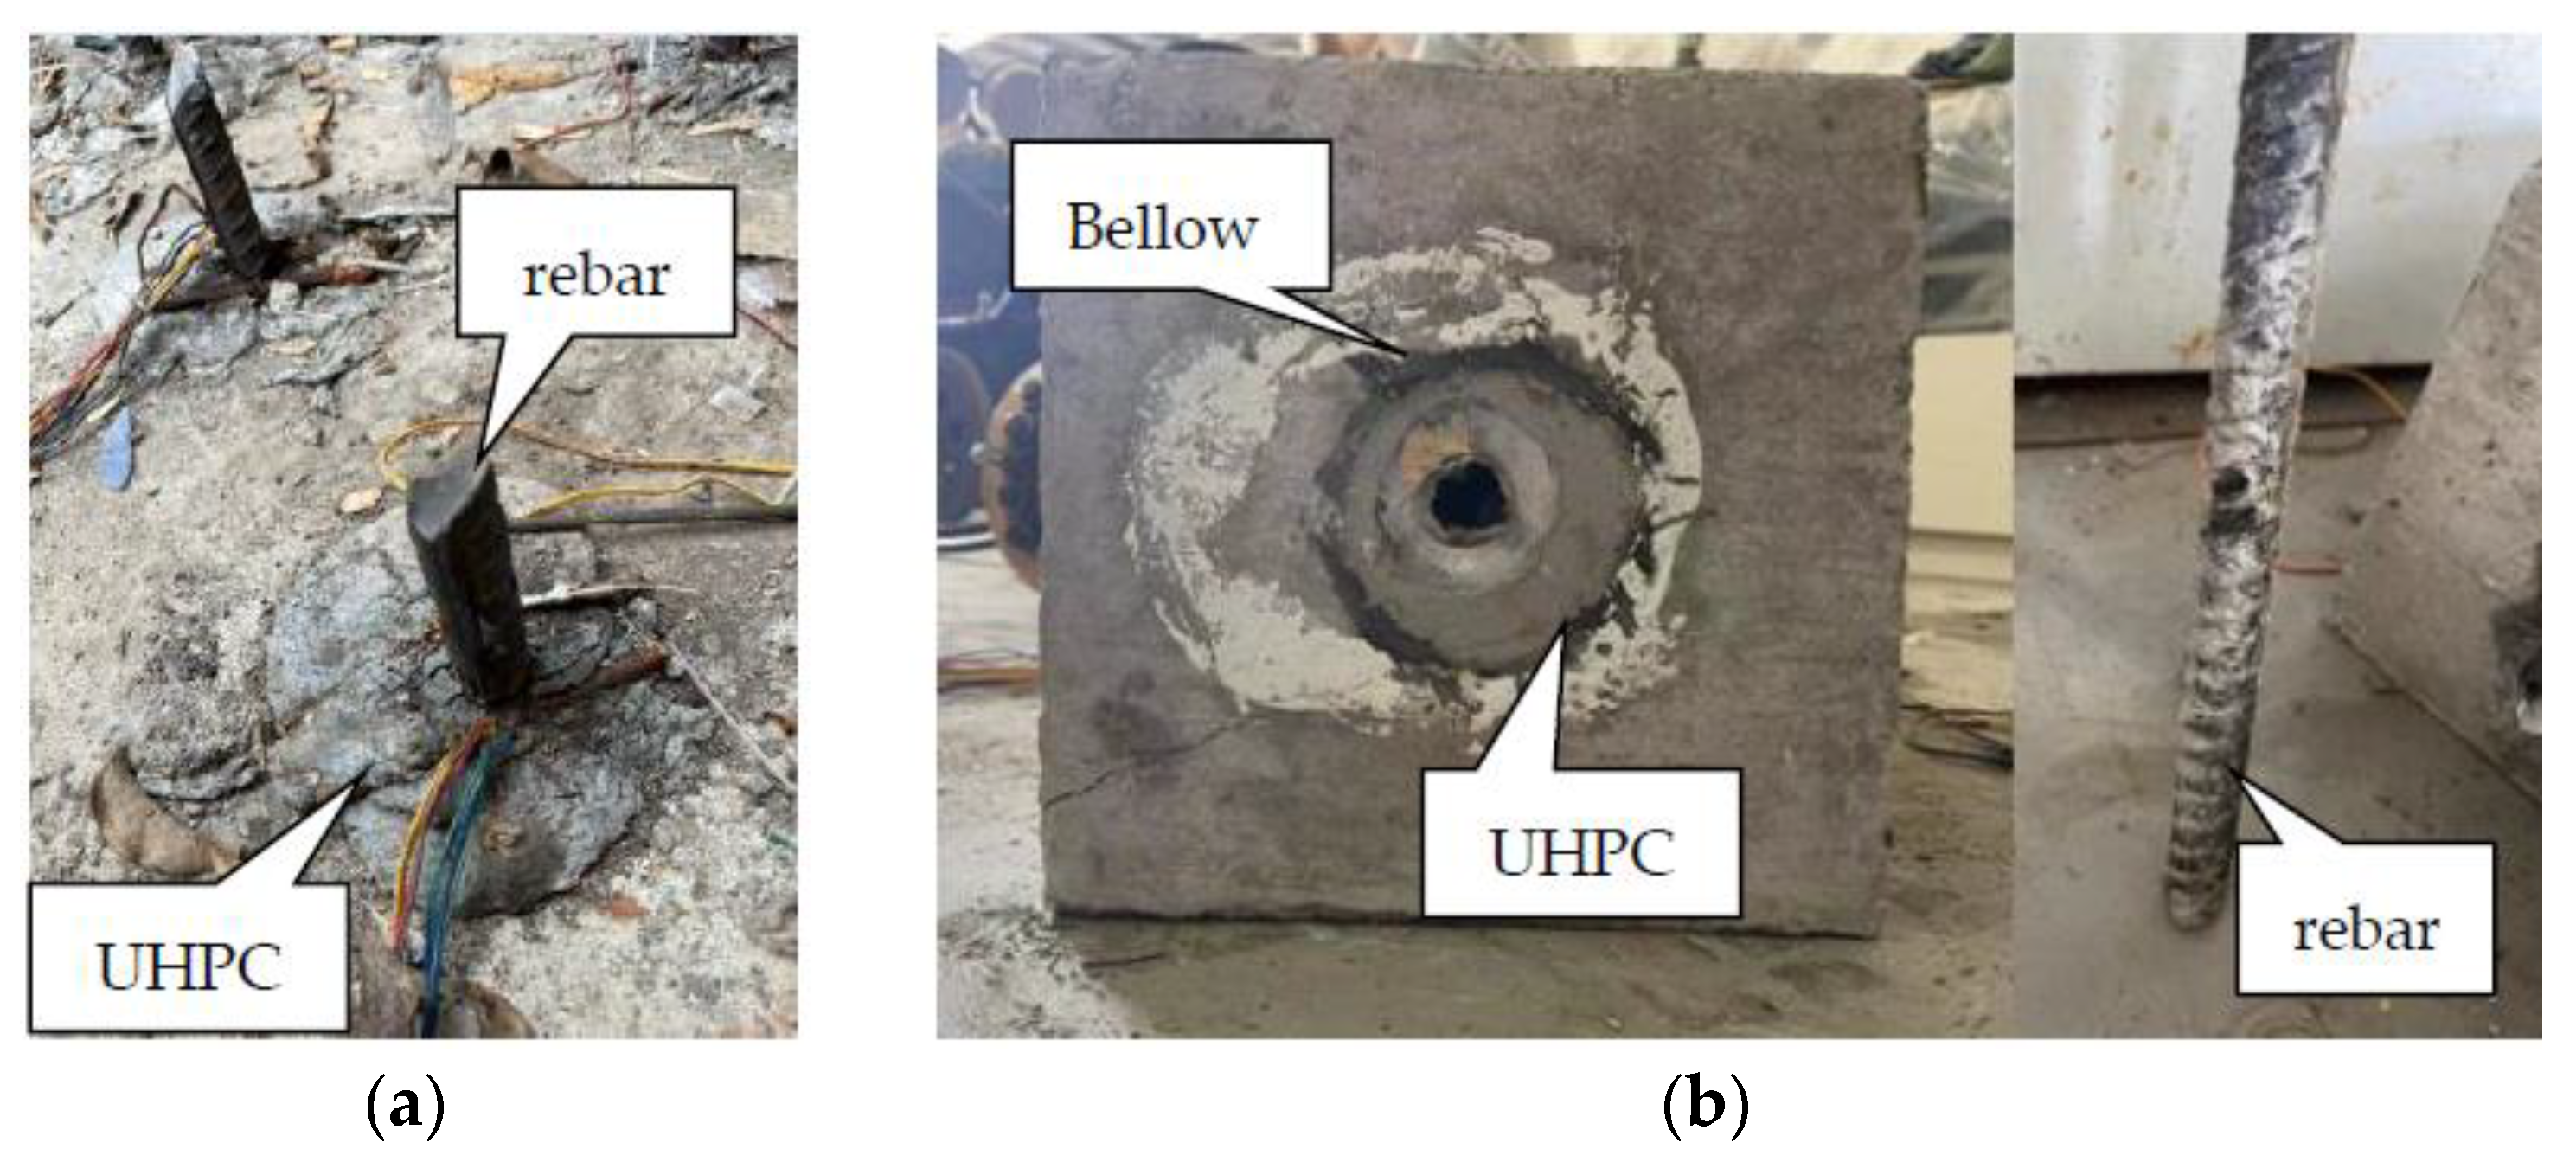
Figure 10.
Load versus deflection curves. (a) Series A. (b) Series B.
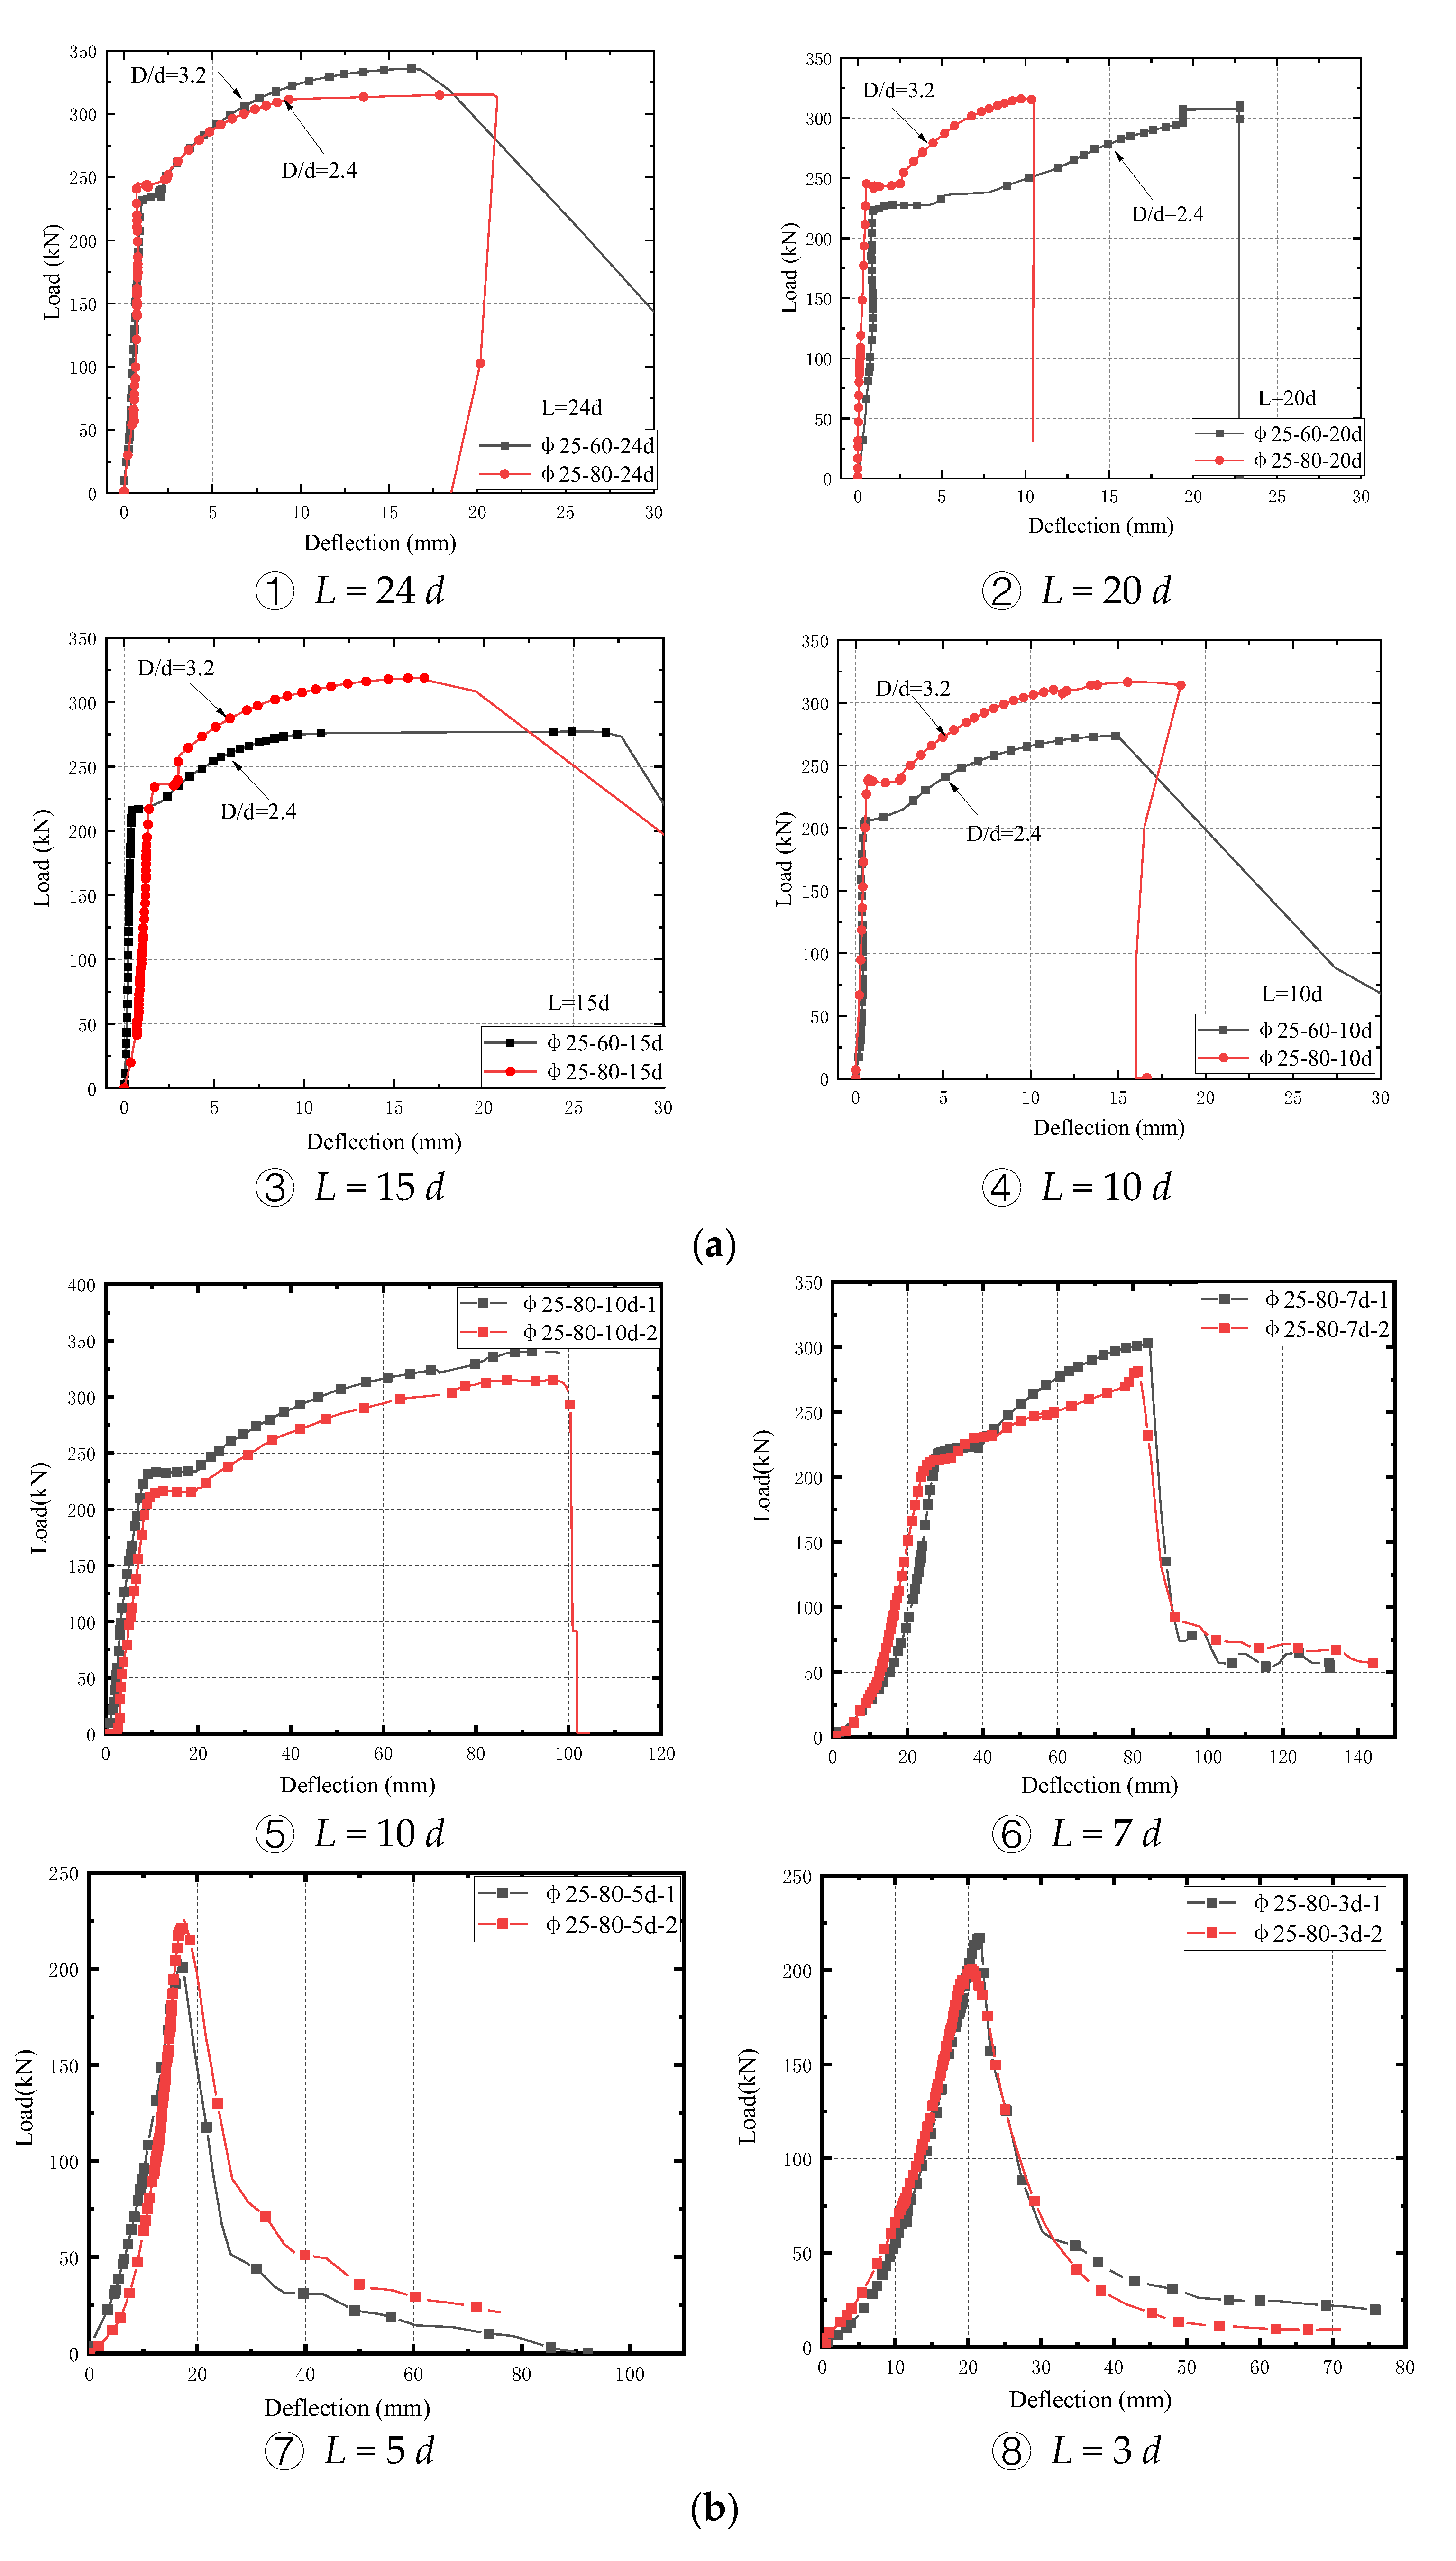
Figure 11.
Load–deflection curves for specimens with different anchorage lengths L. (a) Series A (b) Series B.
Figure 11.
Load–deflection curves for specimens with different anchorage lengths L. (a) Series A (b) Series B.
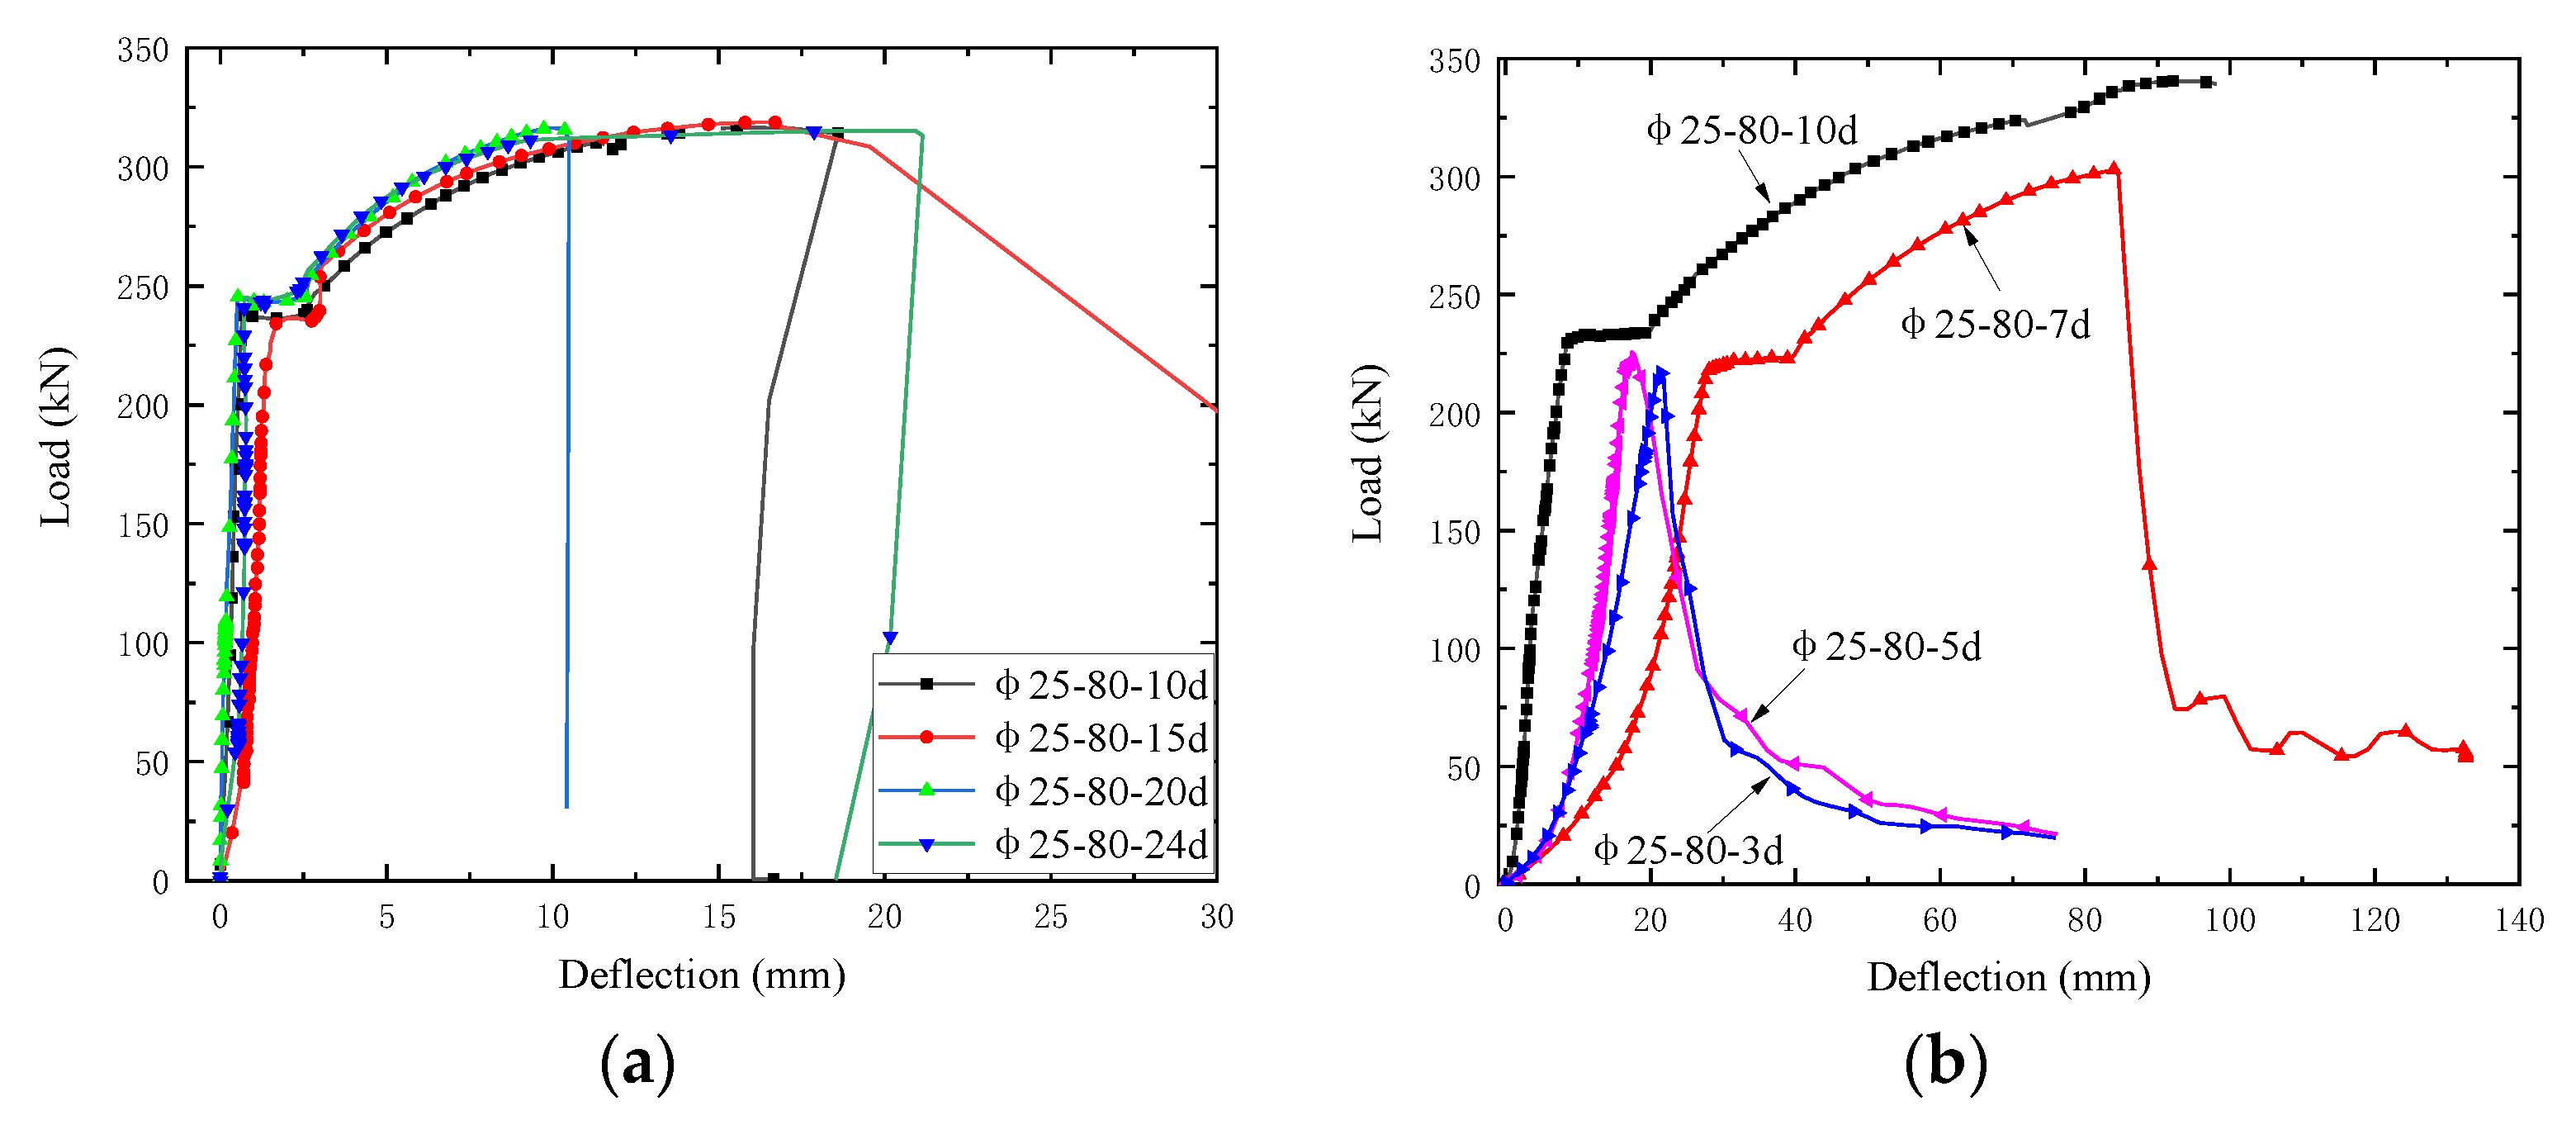
Figure 12.
Load–strain curve of specimens of series B. (a) L = 10 d (b) L = 7 d (c) L = 5 d (d) L = 3 d.
Figure 12.
Load–strain curve of specimens of series B. (a) L = 10 d (b) L = 7 d (c) L = 5 d (d) L = 3 d.

Figure 13.
Coordinate system diagram of anchorage positions.
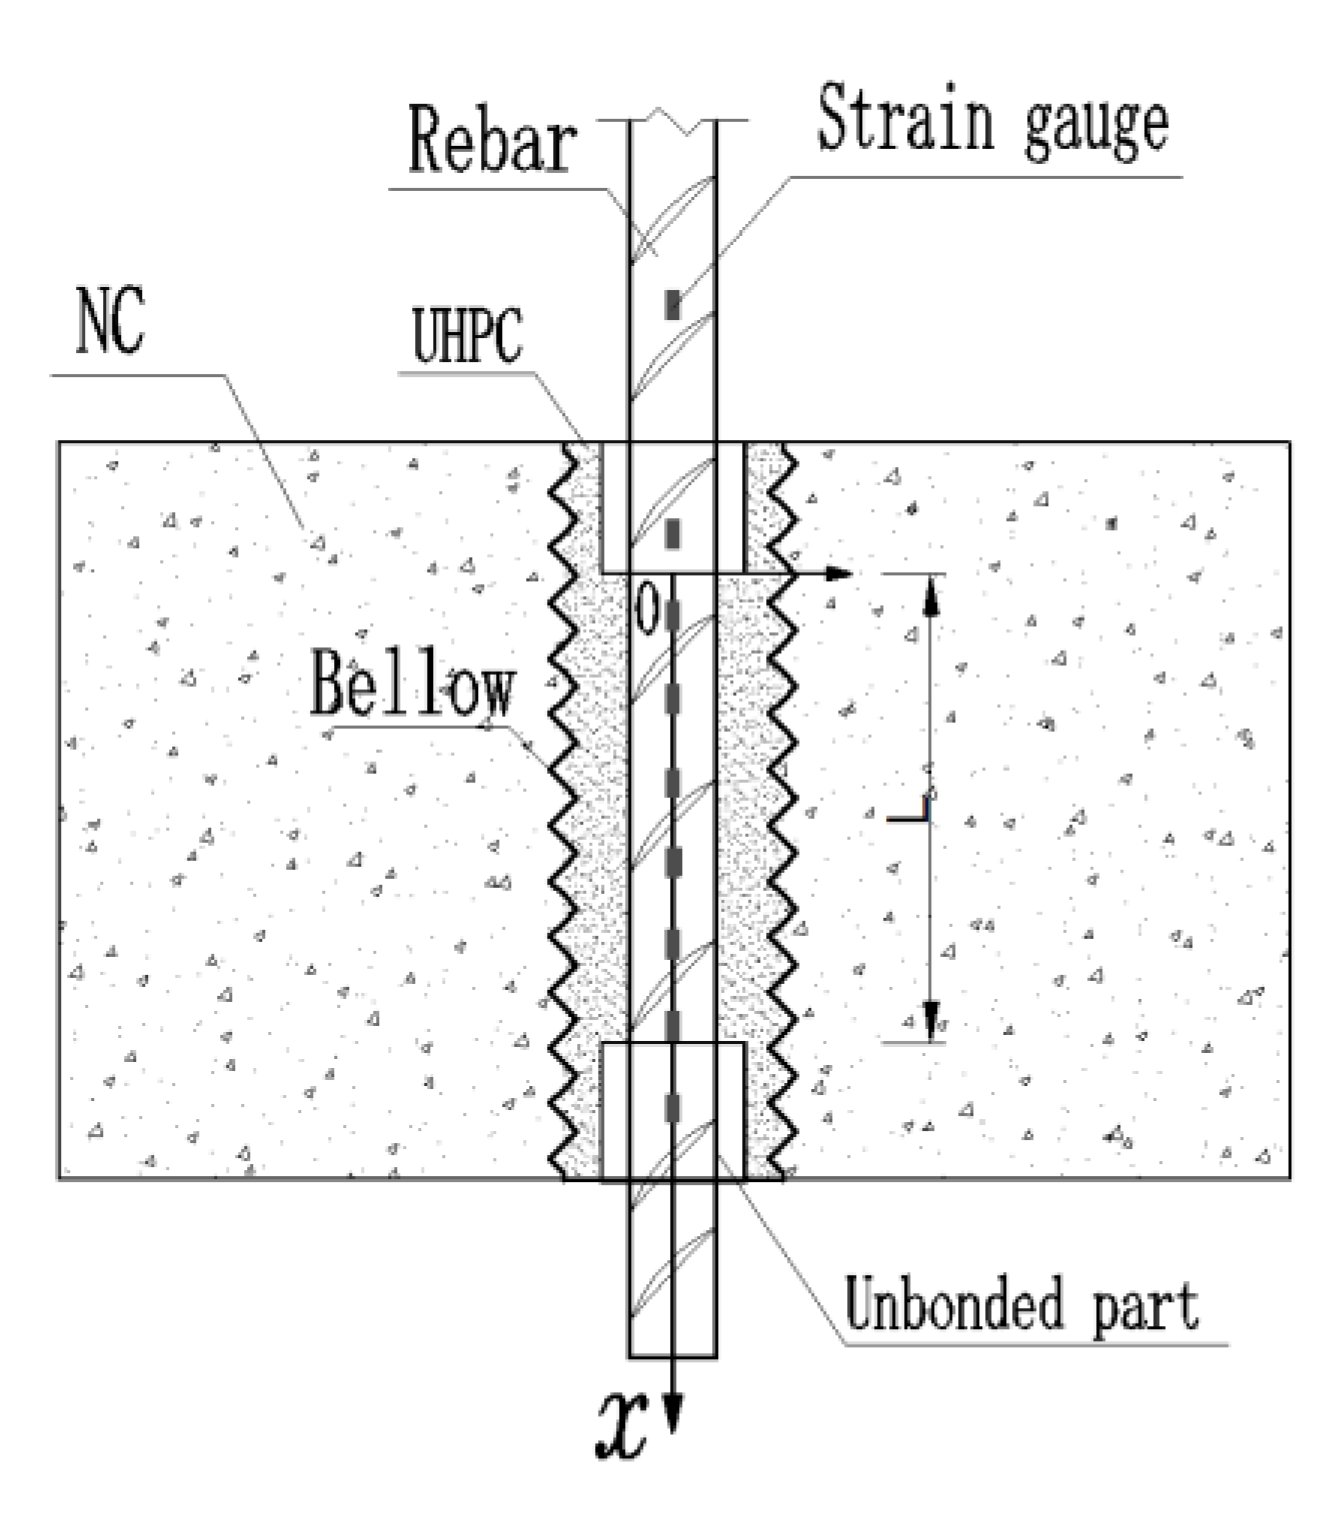
Figure 14.
Strain distribution curves under different loads. (a) L = 10 d, (b) L = 7 d, (c) L = 5 d, (d) L = 3 d.
Figure 14.
Strain distribution curves under different loads. (a) L = 10 d, (b) L = 7 d, (c) L = 5 d, (d) L = 3 d.
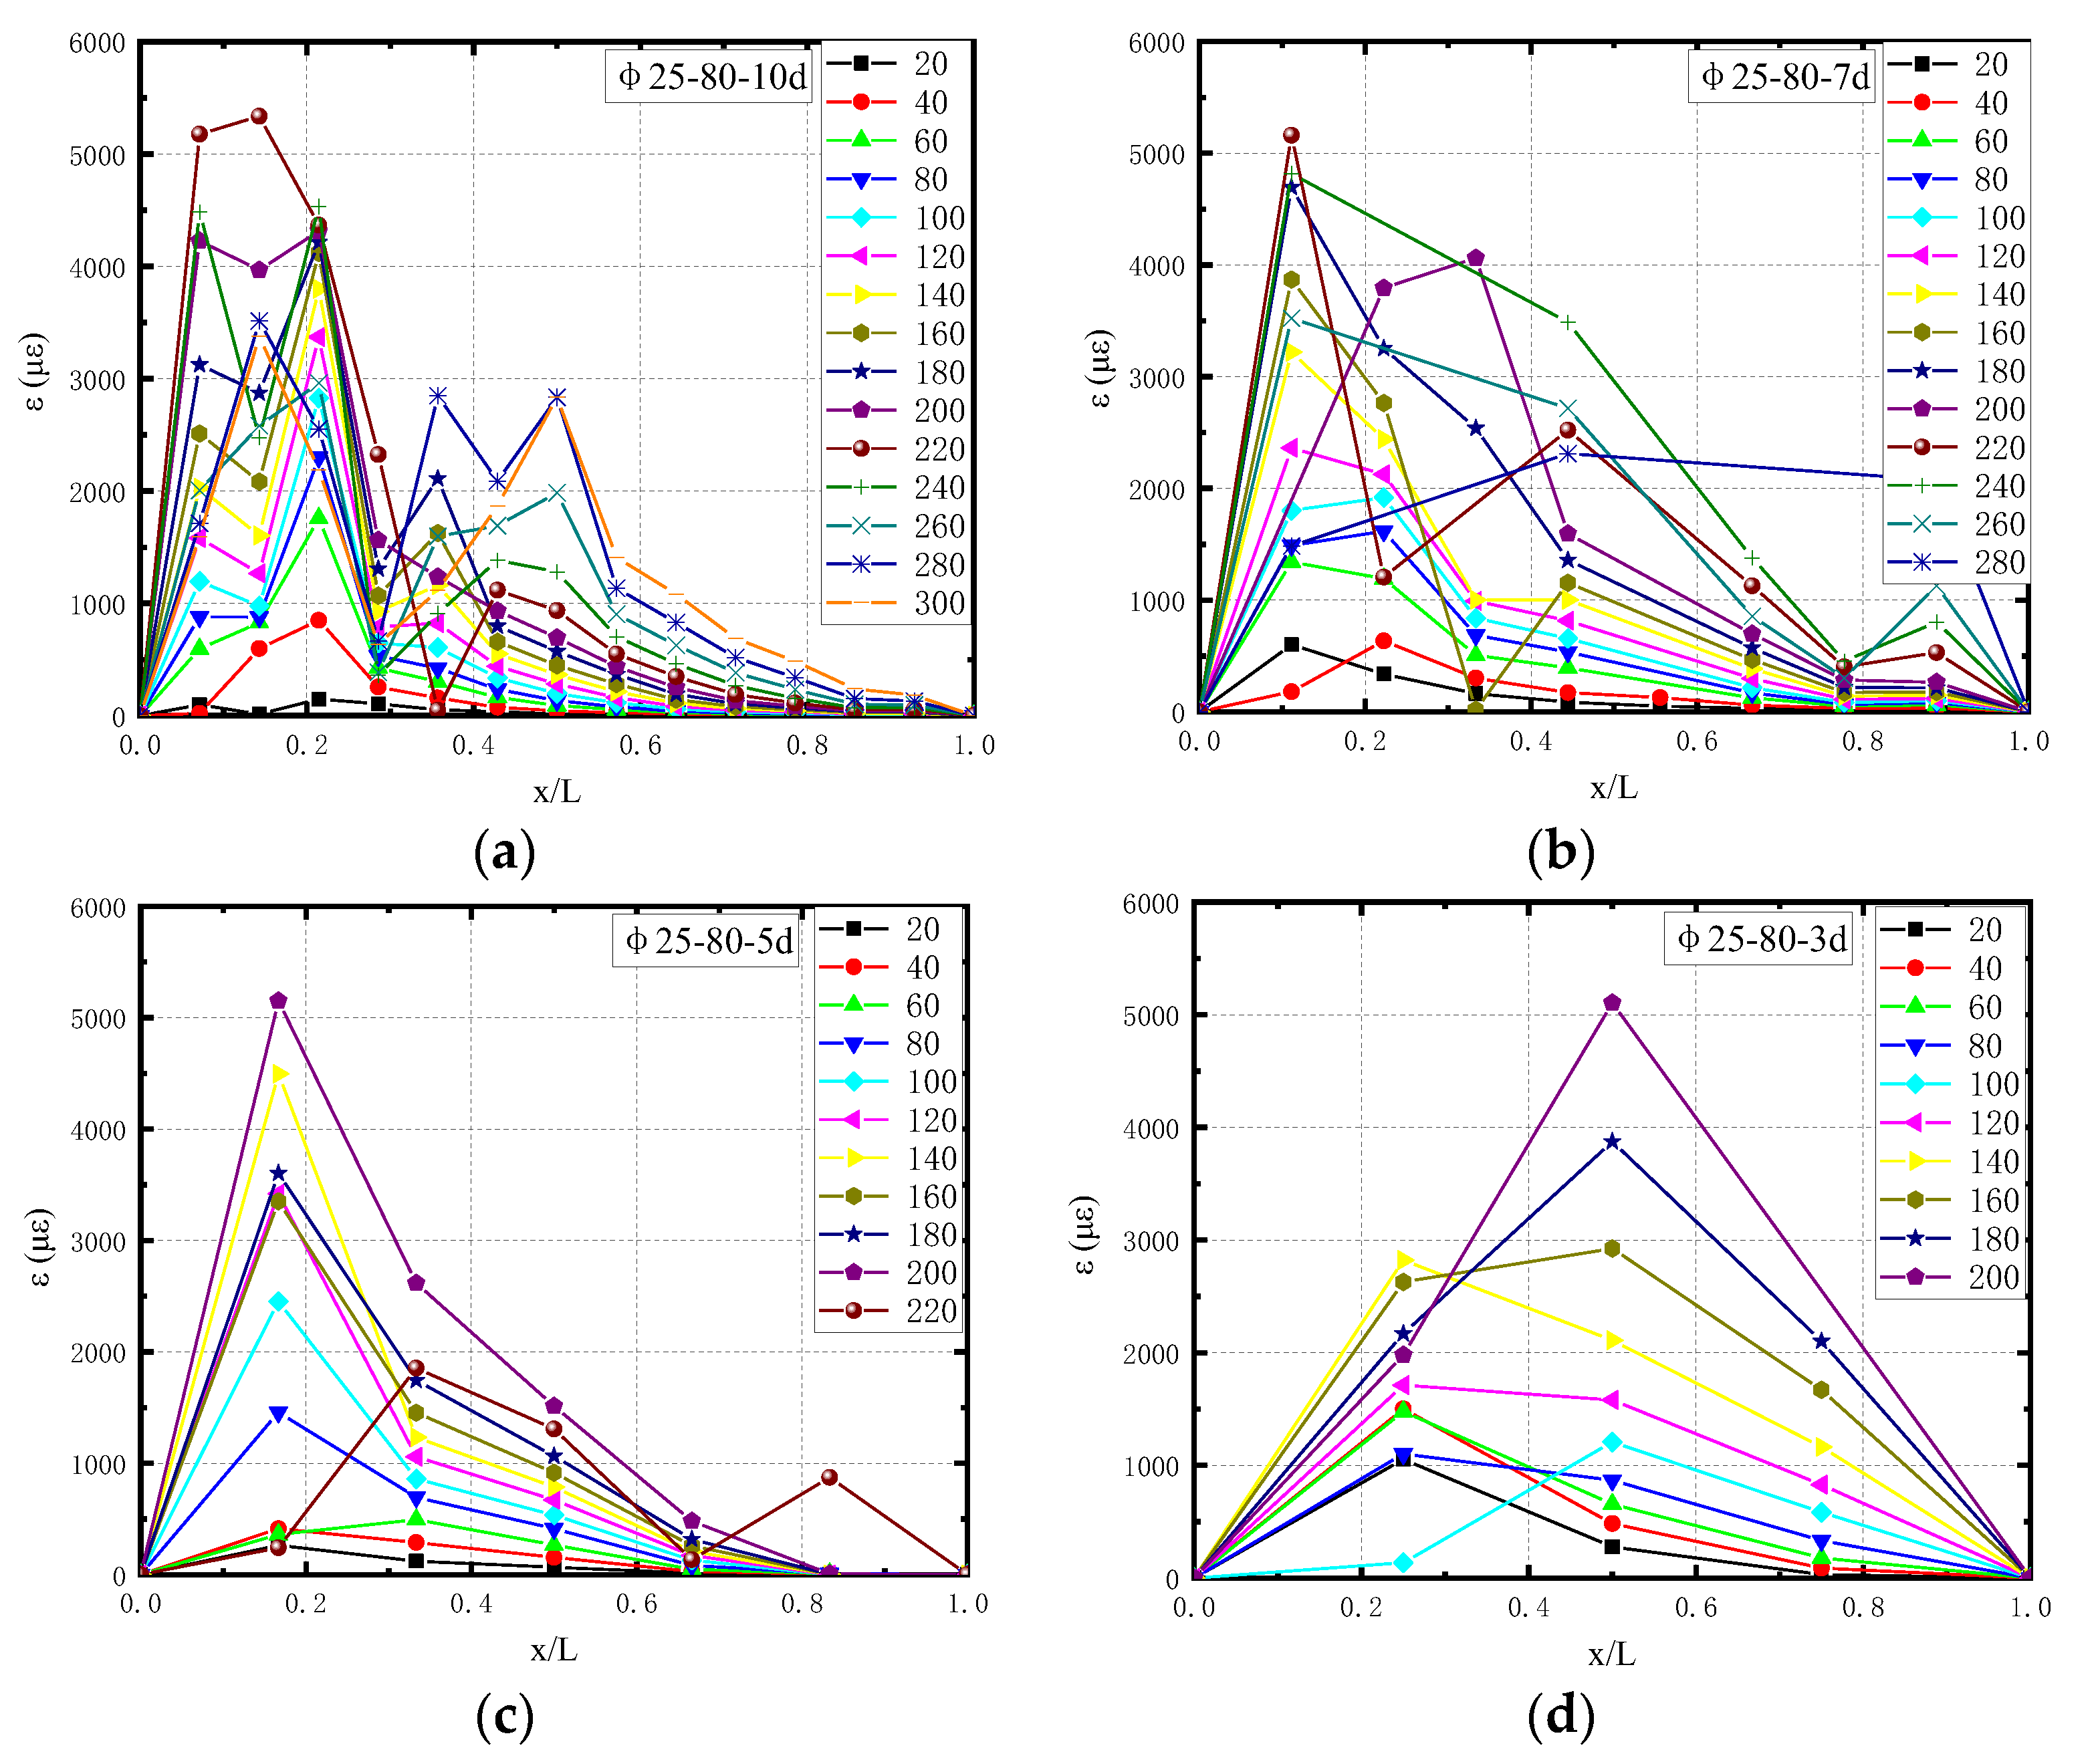
Figure 15.
Experimental curves of bond–slip. (a) L = 7 d, (b) L = 5 d, (c) L = 3 d.
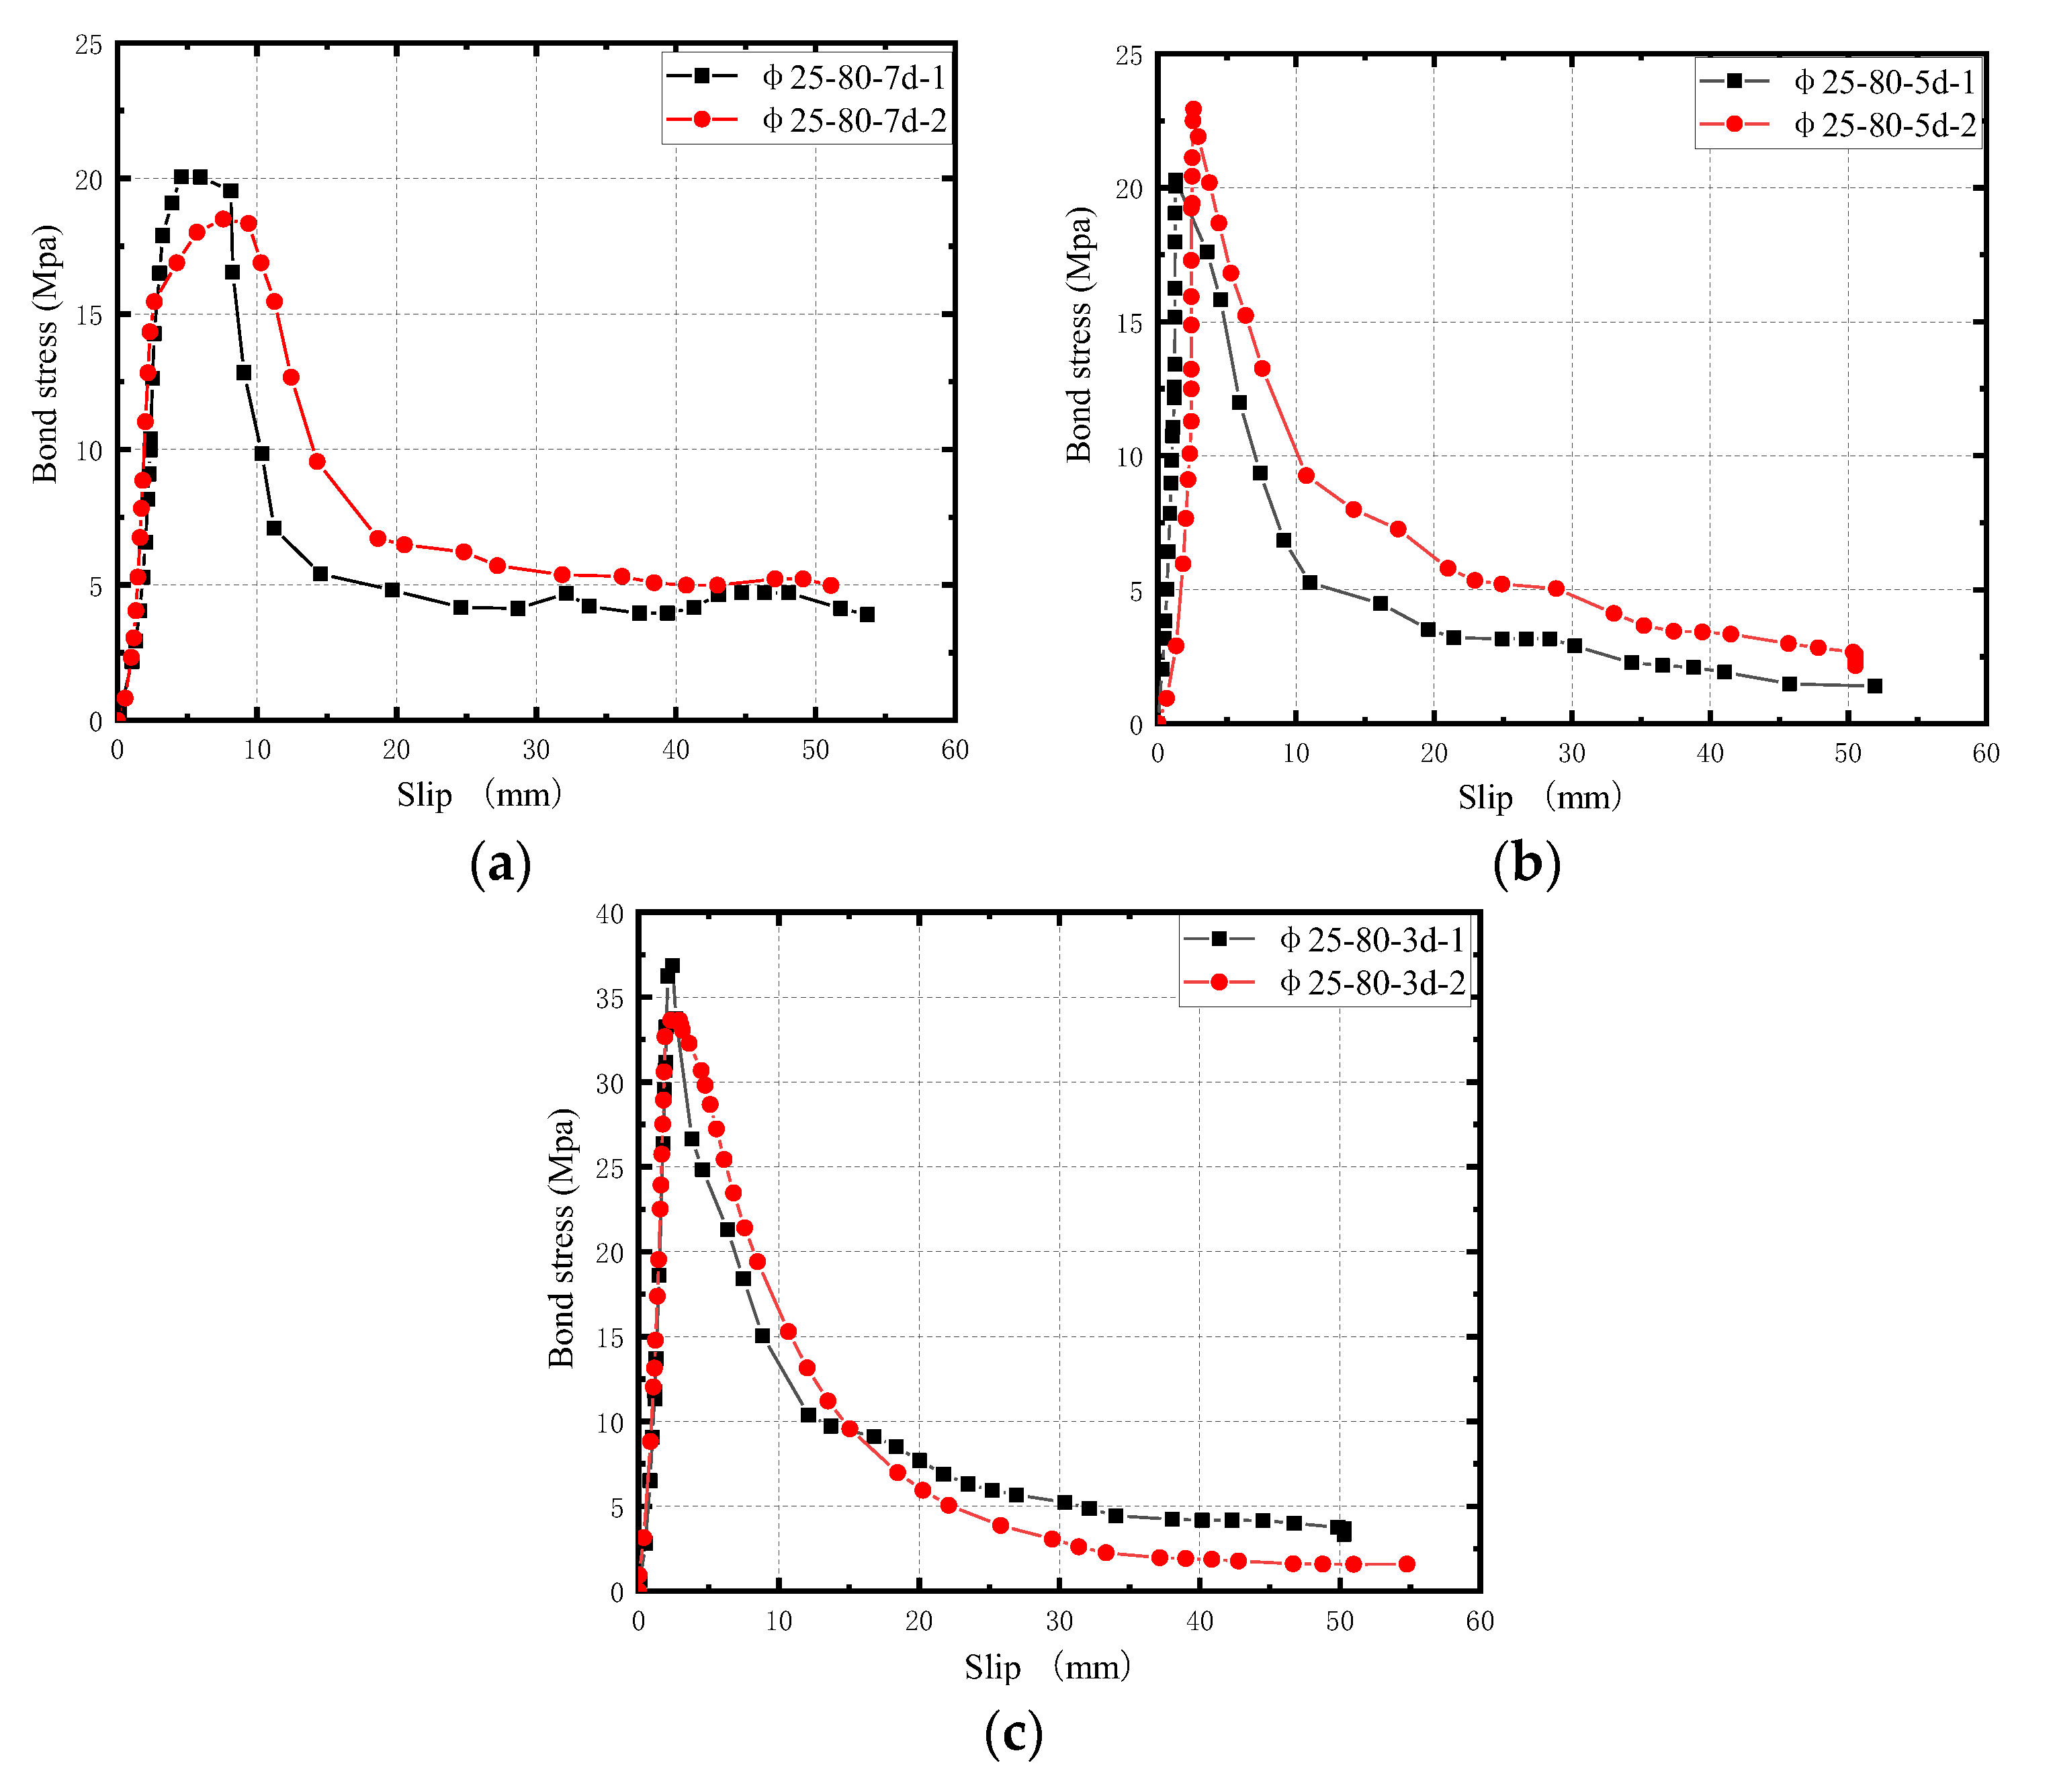
Figure 16.
τ-s curves after standardization.


Table 1.
Grouping of pullout tests for rebar-UHPC grouted in bellows.
| Test Matrix | Anchorage Length L | Rebar Diameter d | Bellows Diameter D | D/d | Specimen ID | The Number of Specimens |
|---|---|---|---|---|---|---|
| Series A | 24 d | 25 | 60 | 2.4 | Φ25-60-24d | 1 |
| 25 | 80 | 3.2 | Φ25-80-24d | 1 | ||
| 20 d | 25 | 60 | 2.4 | Φ25-60-20d | 1 | |
| 25 | 80 | 3.2 | Φ25-80-20d | 1 | ||
| 15 d | 25 | 60 | 2.4 | Φ25-60-15d | 1 | |
| 25 | 80 | 3.2 | Φ25-80-15d | 1 | ||
| 10 d | 25 | 60 | 2.4 | Φ25-60-10d | 1 | |
| 25 | 80 | 3.2 | Φ25-80-10d | 1 | ||
| Series B | 10 d | 25 | 80 | 3.2 | Φ25-80-10d | 2 |
| 7 d | 25 | 80 | 3.2 | Φ25-80-7d | 2 | |
| 5 d | 25 | 80 | 3.2 | Φ25-80-5d | 2 | |
| 3 d | 25 | 80 | 3.2 | Φ25-80-3d | 2 |
Table 2.
UHPC mix proportions.
| Materials | kg/m3 |
|---|---|
| Cement | 700 |
| Mineral powder | 250 |
| Silica fume | 150 |
| Quartz sand | 1260 |
| Water reducer | 11.8 |
| Water | 209 |
Table 3.
The properties of the materials.
| Materials | Items | Value |
|---|---|---|
| Normal concrete | Compressive strength | 51.2 MPa |
| Elastic modulus (Ec) | 35.0 Gpa | |
| Steel bars | Elastic modulus (Es) | 205.5 Gpa |
| Yield strength | 445.1 MPa | |
| Tensile strength | 615.1 MPa | |
| UHPC | Tensile strength | 8.4 MPa |
| Compressive strength | 116.1 MPa |
Table 4.
Specimen failure mode and characteristic load values.
| Series | Specimen No. | Failure Mode | Yield Load (kN) | Yield Strength (MPa) | Ultimate Load (kN) | Ultimate Strength (MPa) |
|---|---|---|---|---|---|---|
| A | Φ25-60-24d | Tensile failure of rebar | 234.79 | 478.55 | 335.58 | 683.98 |
| Φ25-80-24d | 245.19 | 499.75 | 315.24 | 642.53 | ||
| Φ25-60-20d | 223.55 | 455.66 | 309.57 | 630.97 | ||
| Φ25-80-20d | 245.36 | 500.10 | 315.69 | 643.44 | ||
| Φ25-60-15d | 215.02 | 438.26 | 275.69 | 561.92 | ||
| Φ25-80-15d | 234.15 | 477.25 | 318.72 | 649.62 | ||
| Φ25-60-10d | 205.05 | 417.94 | 273.65 | 557.76 | ||
| Φ25-80-10d | 236.85 | 482.75 | 316.41 | 644.91 | ||
| B | Φ25-80-10d | Tensile failure of rebar | 223.6 | 455.8 | 327.8 | 668.1 |
| Φ25-80-7d | Rebar pullout | 217.1 | 442.5 | 292.5 | 596.2 | |
| Φ25-80-5d | Rebar pullout | Not yielded | -- | 213.1 | -- | |
| Φ25-80-3d | Rebar pullout | Not yielded | -- | 208.7 | -- |
Disclaimer/Publisher’s Note: The statements, opinions and data contained in all publications are solely those of the individual author(s) and contributor(s) and not of MDPI and/or the editor(s). MDPI and/or the editor(s) disclaim responsibility for any injury to people or property resulting from any ideas, methods, instructions or products referred to in the content. |
© 2023 by the authors. Licensee MDPI, Basel, Switzerland. This article is an open access article distributed under the terms and conditions of the Creative Commons Attribution (CC BY) license (https://creativecommons.org/licenses/by/4.0/).
Share and Cite
MDPI and ACS Style
Wang, Z.; Zheng, X.; Wang, Q.; Wang, Q. An Experimental Study on the Bond–Slip Relationship between Rebar and Ultra-High-Performance Concrete Grouted in Bellows. Buildings 2023, 13, 2375. https://doi.org/10.3390/buildings13092375
AMA Style
Wang Z, Zheng X, Wang Q, Wang Q. An Experimental Study on the Bond–Slip Relationship between Rebar and Ultra-High-Performance Concrete Grouted in Bellows. Buildings. 2023; 13(9):2375. https://doi.org/10.3390/buildings13092375
Chicago/Turabian StyleWang, Zhongling, Xiaohong Zheng, Qiqi Wang, and Qian Wang. 2023. "An Experimental Study on the Bond–Slip Relationship between Rebar and Ultra-High-Performance Concrete Grouted in Bellows" Buildings 13, no. 9: 2375. https://doi.org/10.3390/buildings13092375
Note that from the first issue of 2016, this journal uses article numbers instead of page numbers. See further details here.