Article

A Seismic Risk Assessment of Concrete-Filled Double-Skin Steel Tube (CFDST) Frames with a Beam-Only-Connection for Reinforced Concrete Shear Walls (BRWs)

1
School of Civil Engineering, Central South University of Forestry and Technology, Changsha 410004, China
2
School of Civil Engineering, Chang’an University, Xi’an 710061, China
*
Author to whom correspondence should be addressed.
Buildings 2023, 13(9), 2378; https://doi.org/10.3390/buildings13092378
Submission received: 28 August 2023 / Revised: 11 September 2023 / Accepted: 12 September 2023 / Published: 19 September 2023

Abstract

:
The beam-only connected reinforced concrete shear wall (BRW) is used as a reinforcing component to enhance the seismic performance of concrete-filled, double-skin steel tube (CFDST) frames. The effects of the BRW on seismic risks of CFDST frames are investigated. Three performance levels of limit states are defined and described according to the typical failure of test specimens and the existing definition of current guidance. A simplified numerical model is calibrated for CFDST frame-BRW structures, and test results validate it. Nonlinear dynamic analyses on a nine-story CFDST-BRW building are performed to investigate the effects of BRW on reducing the seismic risk of CFDST buildings. The results show that the BRW reduces the probability of collapse of the CFDST frame to 2.76% in 50 years, which can effectively reduce the probability of different degrees of damage in the service cycle of the structure. The results provide information for risk-informed decision-making on the design of CFDST frame-BRW structures.

1. Introduction

The traditional concrete-filled steel tubular (CFST) frame structures rely on the connection of CFST frame joints (finger beam-column joint) to achieve lateral resistance. Once the CFST structure joints are damaged, they will collapse. Therefore, the frame-shear wall structure system and seismic design method have gradually attracted attention. Many researchers have conducted experimental, theoretical and numerical studies on the design methods of different structures.
So far, many experimental and theoretical studies have been carried out on the performance enhancement of CFST columns and frames. Wang [1] designed thin steel circular CFSTs. The specimens were tested, and their seismic performances were evaluated. Skalomenos [2] proposed using the HFD method to guide the seismic assessment of CFST frames. Gan [3] studied the mechanical properties of shear connectors in CFST frame structures. Lai [4] and Wang [5] used high-strength materials to improve the seismic capacities of CFST frames. Bai [6] established a model of a CFST frame and verified the correctness of the connection parts of the numerical model through experiments. Ren [7] and Jia [8] studied the typical working relationships between energy dissipation devices, buckling restrained braces, and CFST frames.
However, because the frame structure realizes the lateral resistance through the connections of beam and column members, only one seismic defense is included, and the scope of the application is limited. People gradually advocate using shear walls to improve the performance of frame structures.
For this reason, many shear wall types, frame connection methods, and seismic theories have been proposed. Nie [9] suggested using a composite shear wall to strengthen a CFST frame. The cooperative working relationship between the composite shear wall and the CFST frame was deduced. Wang [10] conducted seismic performance tests on concrete-filled steel tubular infilled walls. Guo [11] proposed a connection method between the CFST frames and partially infilled walls and conducted experimental research on their seismic performance. Hu [12] studied the cyclic performance of a CFDST frame strengthened by a BSW. Bian [13] proposed an assembled structure composed of a new frame-shear wall structure. Hu [14] proposed a fully precast CFSDT frame, which is only connected to the BSW system. An SPSW with a beam-only connection for this system was presented. Xu [15] proposed a precast CFST frame support system by using reinforced concrete beams and a shaking table test. Skalomenos [16] studied different modeling methods concerning the seismic vulnerability of CFST integral structures with or without rigid PZs. The influence of varying modeling methods on the structural vulnerability was quantified. Leon [17] proposed the concept of resilience of CFST composite structures and suggested that the resilience design of systems under different levels of earthquakes can be realized by determining the performance level indicators. Kamaris [18] provided a simplified seismic design method for CFST structures. Ahmadi [19] established a vulnerability model of CFST structures and calculated the failure probability of the structure under earthquake actions, which was used as the risk data of structural performance-based design. Hu [20] assessed the seismic risk of the CFDST frames. Six typical extreme performance levels of the CFDST structure were determined. The models for the specimens were established. The seismic responses of these models to seismic excitation were studied by nonlinear time history analysis, and the limit capacity were determined by incremental dynamic analysis.
Although many different types of shear walls have been proposed, most of these shear walls are connected to the frames with complete filling. The additional stresses by the shear walls will directly act on the column, which are unfavorable to the seismic resistance of the column. In addition, although there is already research foundations for CFST frame-shear walls, there are almost no research reports on composite CFDST frame-shear walls. Based on the above existing research, we propose a CFDST frame-BRW structure.
This study aims to define and describe three types of performance limit states applicable to this type of structure through the typical failure characteristics of frame-BRW structures. Based on the test-validating method, the numerical analysis models of specific composite frame-BRW structures are established. The regional representative seismic waves are selected, and the nonlinear dynamic analysis of the nine-story structure is carried out. Then, based on the theory of seismic risk assessment, a structural probability calculation model is constructed to evaluate the seismic risk of the structure quantitatively. The results will provide ideas and risk data for the performance-based seismic design of assembled CFDST frame-BRW structures.

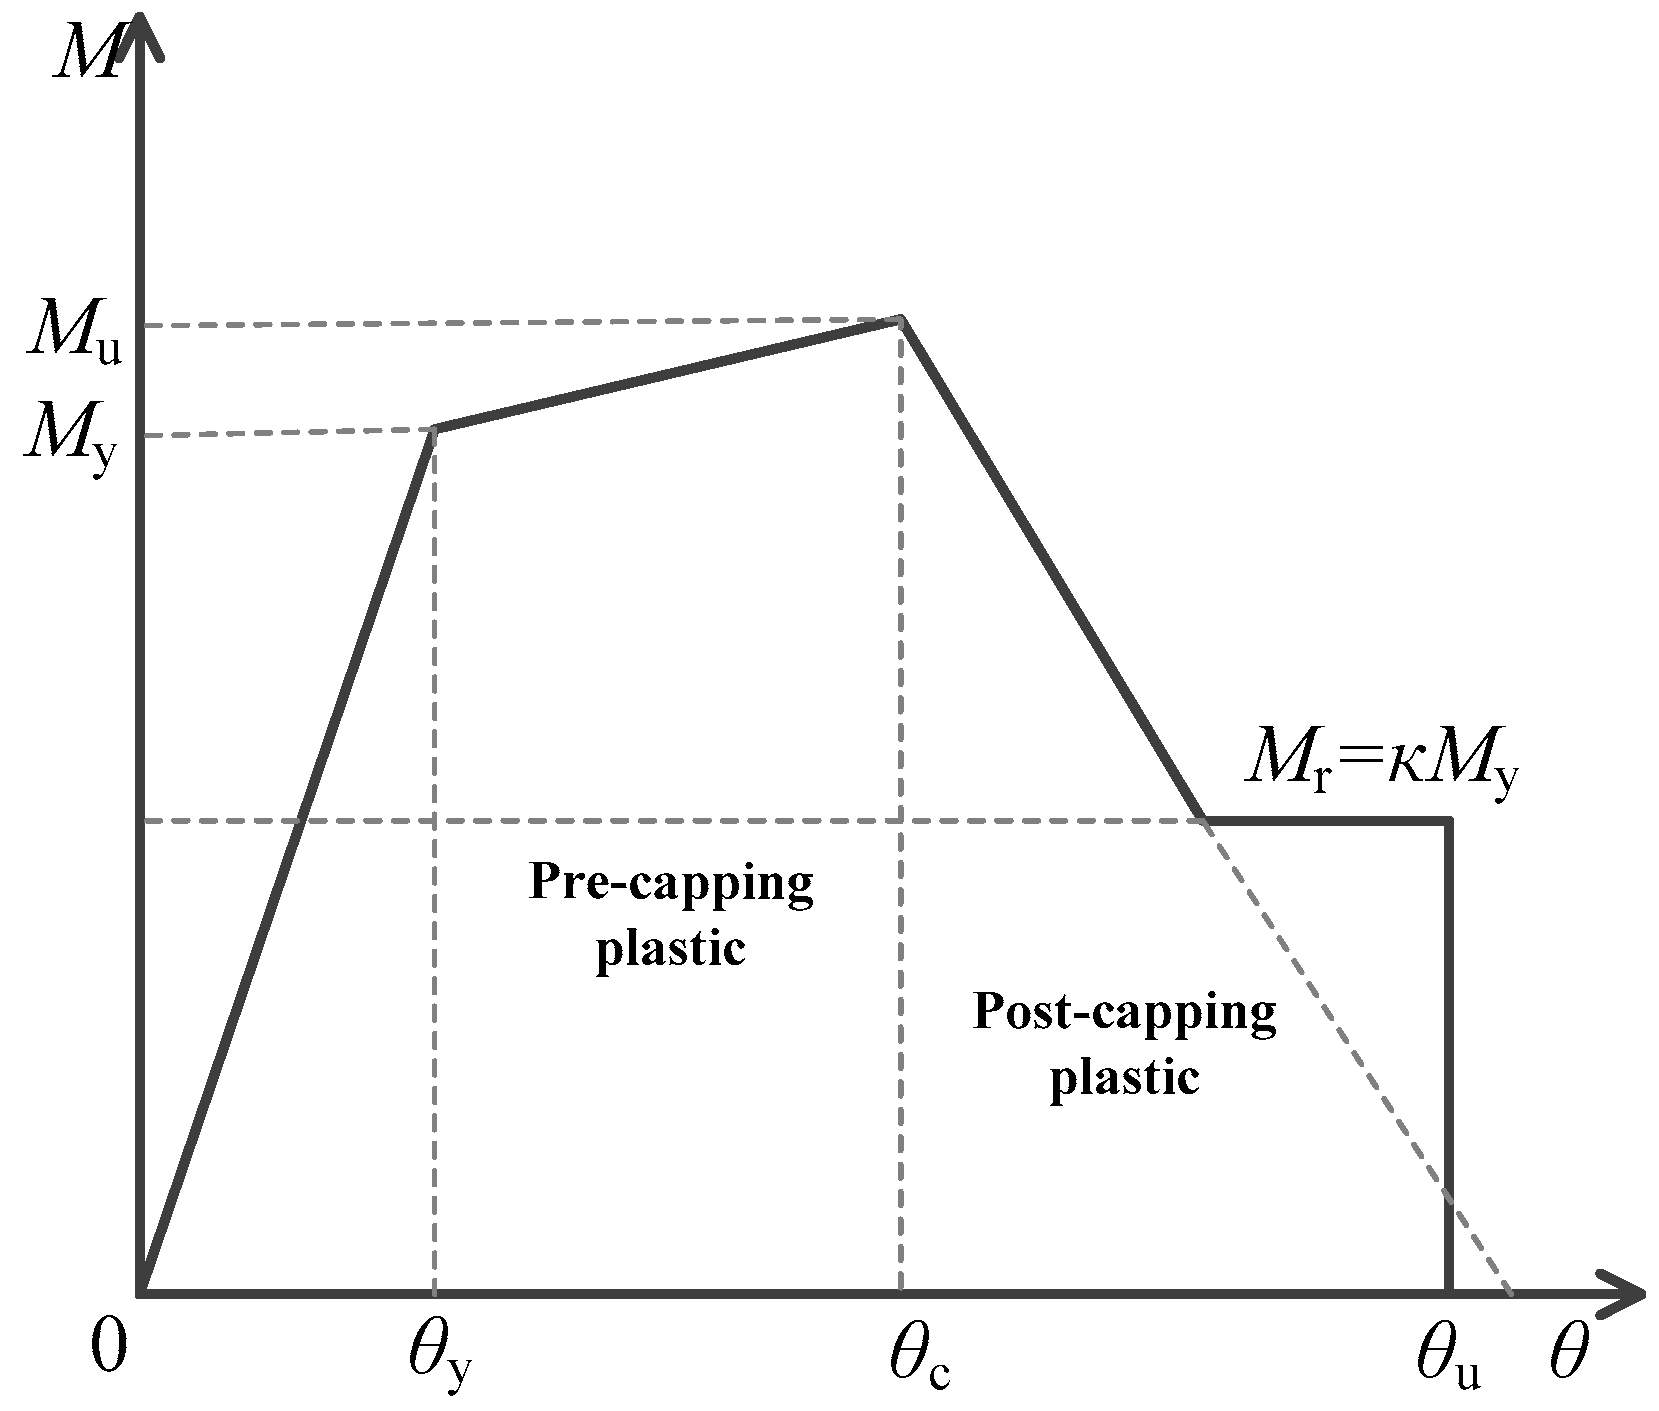
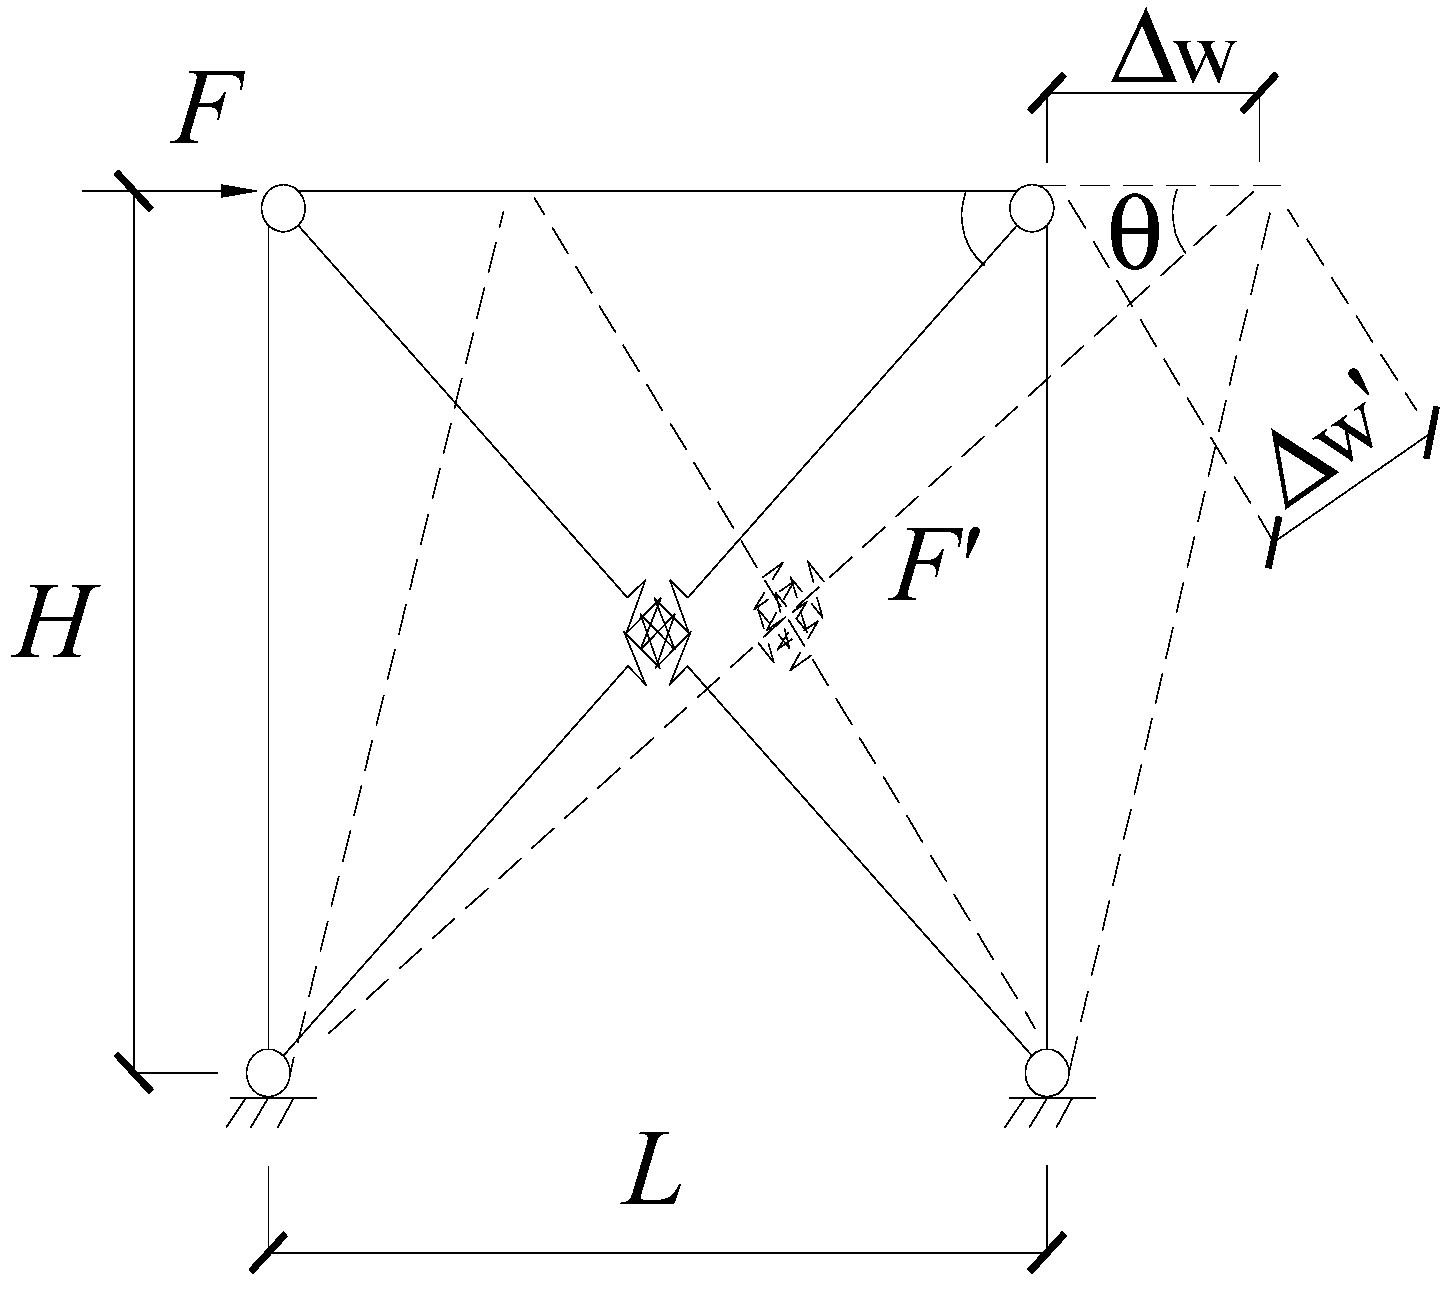
2. Cyclic Tests and Performance Limits

A total of two CFDST-BRW specimens were designed and tested. The BRW is the reinforced concrete shear wall. There were two test specimens investigated in this test.
These specimens were scaled down to half and were fabricated using the prefabrication method proposed in Ref. [20]. Details of these specimens are shown in Figure 1.
In the elastic stage, the CFDST frame and the BRW did not show obvious deformation. The state changed when the story drift ratio (SDR) was close to 1.0%, and the experimental curves showed an inflection point. Then, test specimens entered the elastic–plastic state. The cracks occurred on the BRW at this stage, resulting in the nonlinear behaviors of the test specimens. The specimens were significantly deformed as the SDR reached 3.0% and entered the failure stage. The loading capacity of all CFDST frame-BRW specimens began to degrade significantly, and the BRW gradually failed. The weld at the CFDST joint was torn, the obvious buckling deformation occurred on the stiffener of the CFDST joint and the plate at the beam flange, and the plate at the bottom of the column sustained local buckling. When the SDR reached 6.0%, the ultimate loading capacity of all specimens was obviously degraded, and all of the BRW failed. The CFTSD joints and column bottoms in the CFDST frame form obvious plastic hinges, and the structure was about to lose its bending resistance and cause overall deformation. The envelop curves of the specimens are shown in Figure 2.
There are three typical mechanical phases.
(1)
Stage I: from 0 to 1% drift. The CFDST frame-BRW structure can be approximately considered to be in the elastic stage. Although the BRW has small cracks, the deformation has little effect on their structural performance.
(2)
Stage II: from 1 to 3% drift. Many obvious cracks appeared on the BRW, and the bolt connection between the BRW and CFDST frame was damaged to a certain extent. Local buckling of column and beam flanges of the CFDST frames was obvious, and the weld connections and flange plates near the high-strength bolts were torn.
(3)
Stage III: from 3 to 6% drift. The BRW was obviously deformed, and it had basically separated from the CFDST frame and lost its loading capacity. The steel beam plate and high-strength bolts near the CFDST column were torn, and the CFDST frame joints and the bottom of the column formed a plastic hinge, which has basically lost its loading capacity.
The American design codes FEMA 356 [21], HAZUS [22], and SEAOC [23] have not defined the values of the limit state of the CFDST frame-BRW structure, and other design codes have not provided relevant reference information. We used the maximum inter-story drift ratio (ISDAmax) as the performance index to describe the limit state of the building structure. Combined with the definition of the CFDST frame defined by Ref. [20], and the meaning of the performance limits of the CFDST structure in FEMA 356 performance limit of the CFDST frame-BRW structure is defined as follows.
(1)
Immediate Occupancy (IO): the structure needs to be used immediately after the earthquake. This stage is described for the CFDST frame-BRW structure, i.e., the BRW has small cracks, the steel beam flange or web exhibits a slight yield or buckling phenomenon, and no obvious fracture phenomenon is observed. The performance limit is defined as 1.0%.
(2)
Structural Damage (SD): the structural or nonstructural components may be seriously damaged or partially collapsed, but the building still has a certain ability to resist collapse, which can ensure that the structure will not collapse. For the CFDST frame-BRW structure, this stage is described as follows. The BRW has many cracks, and the concrete at the bolt connection between the BRW and CFDST frame exhibits spalling phenomena. There are many steel plates yielding, buckling, or fracturing on the steel beam near the column, but they do not completely fail, and some members have obvious local buckling or plastic hinges. The performance limit is defined as 3.0%.
(3)
Structural Damage (SD): the structure collapses due to its inability to withstand its own gravity or insufficient lateral stiffness. For the CFDST frame-BRW structure, this stage is described as follows. The BRW has basically separated from the CFDST frame and has lost its loading capacity. The steel beam plate in the CFDST frame is torn, the joint concrete is crushed, and the outer steel tube is severely buckled. The performance limit is defined as 6.0%.

3. Numerical Model and Validation

3.1. CFDST Framework Numerical Model and Verification

Hu established the test-validated numerical model of the CFDST framework [20]. Based on this model, a nine-story CFDST frame-BRW was constructed, and the influence of a BRW on the seismic risk of a nine-story CFDST frame was studied. A seismic risk assessment was carried out. To ensure the integrity of the paper, the modeling and verification of the CFDST frame structure are still explained.

3.1.1. CFDT Column, Steel Beam, and CFDST Joints
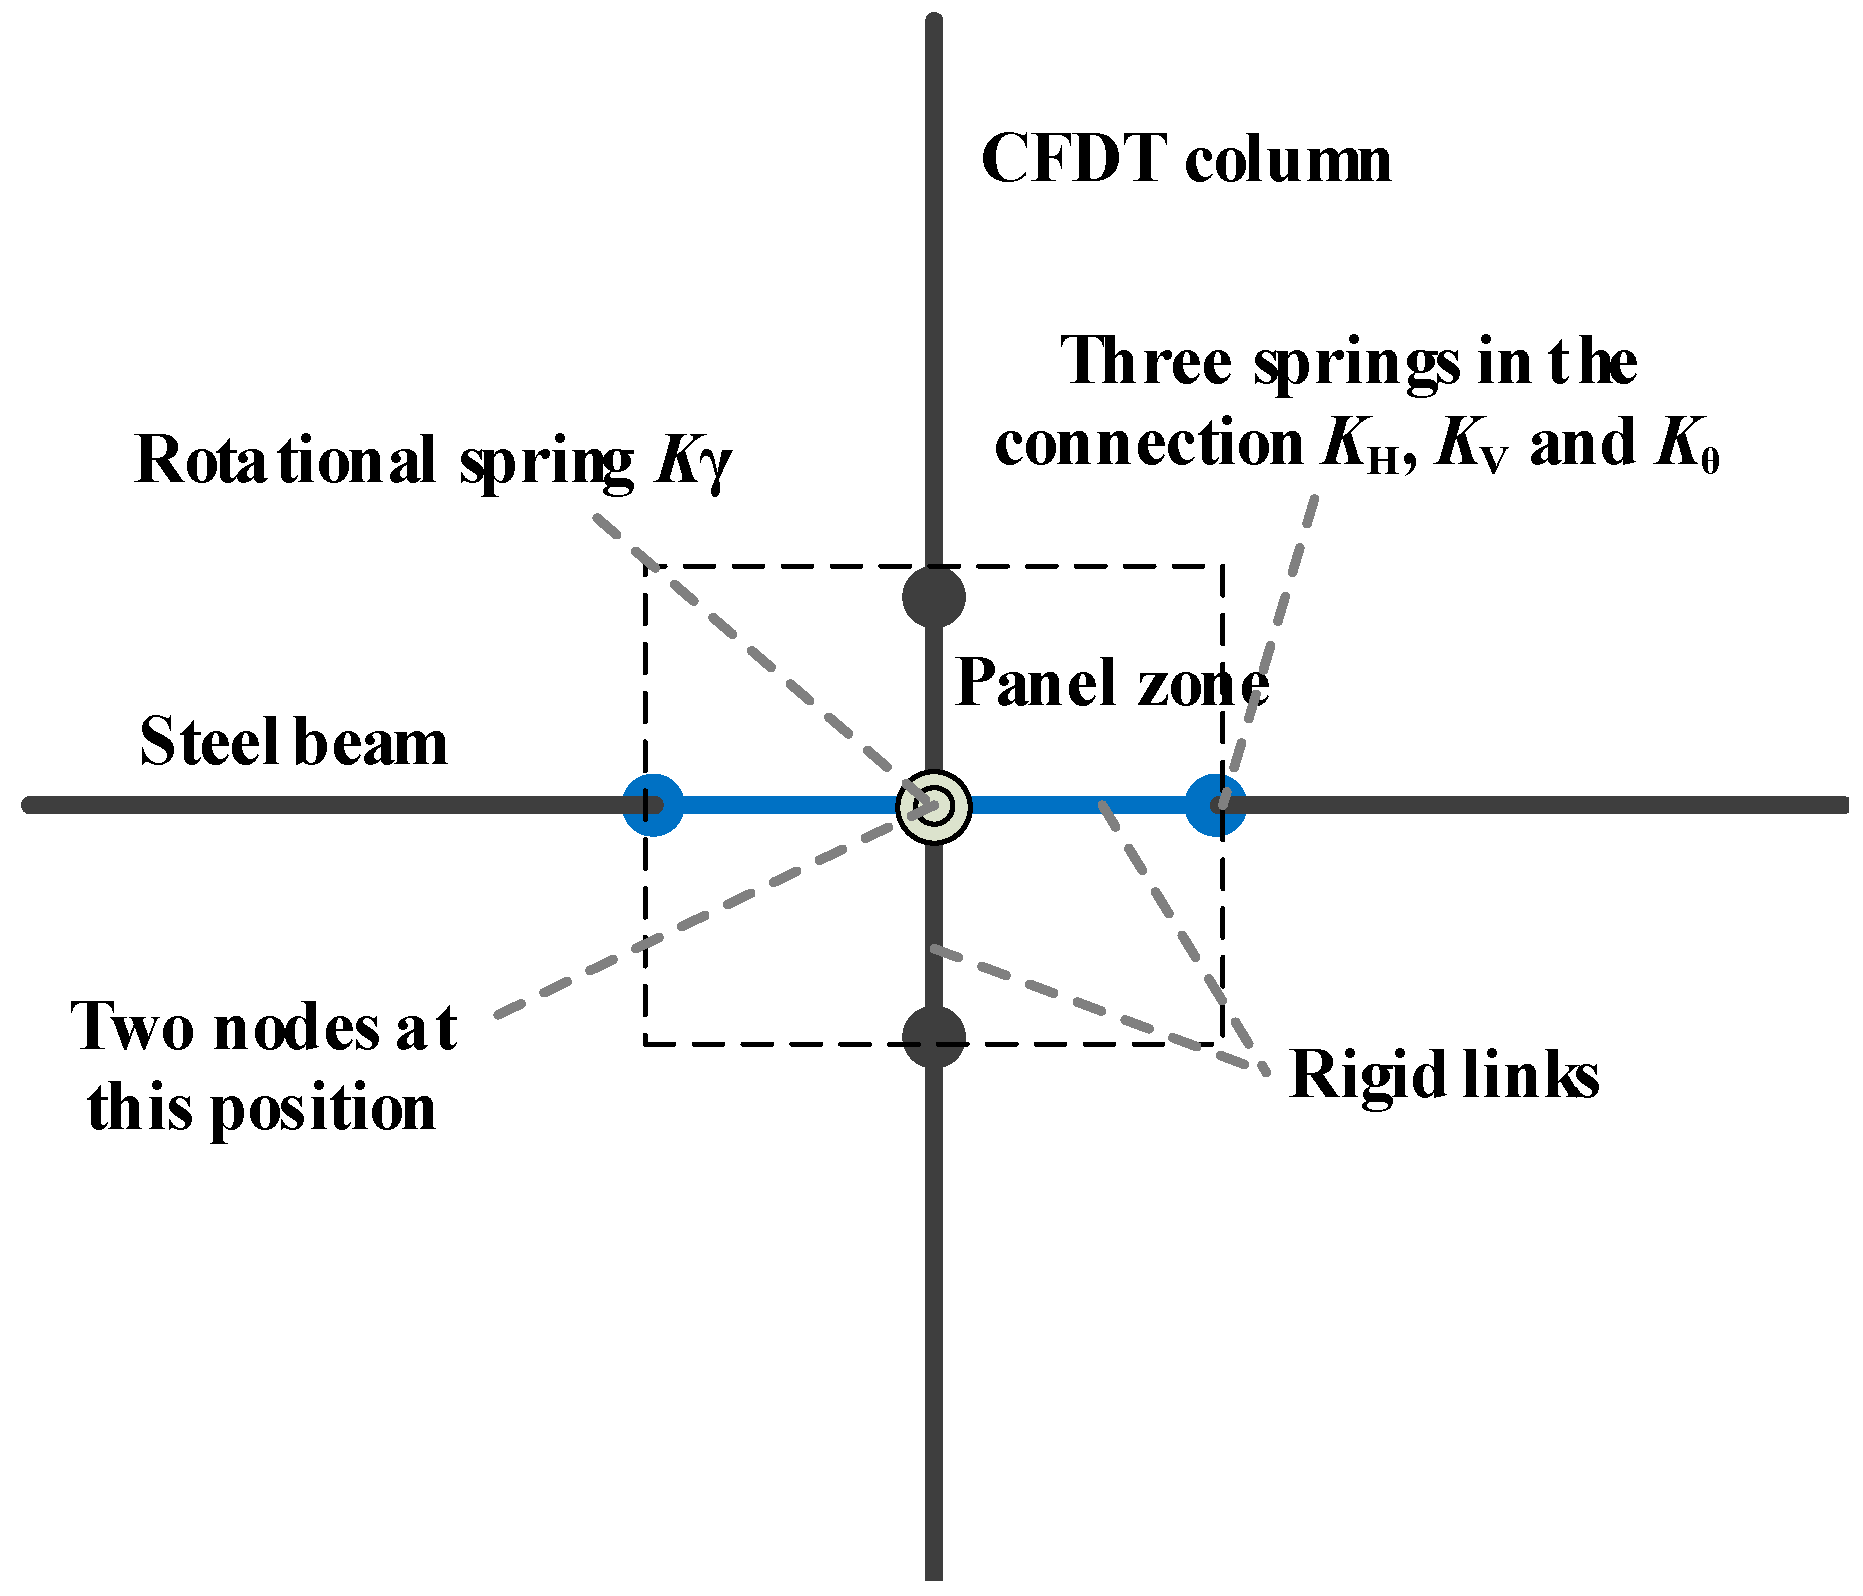
The CFDST frame structure model is established by using the OpenSees. Nonlinear elements are used to simulate the performances of CFDST columns and beams, and the CFDST column filled with concrete uses the Concrete 02 material, while the steel tube and beam use the Steel 02 material. The Kent–Scott–Park damage model is used for concrete materials to simulate the hysteretic characteristics and material degradation properties accurately.
Three nonlinear spring elements, i.e., a horizontal KH, a vertical KV, and a rotating Kθ, are used to simulate the CFDST joint model in Figure 3, and the mechanical behaviors of the nonlinear springs used to simulate the CFDST joints and nonlinear springs are simulated by the Zerolength element in OpenSees. In the numerical model, the model of the horizontal spring corresponds to two nodes at the connection position of the beam and column, and the modeling is achieved by maintaining the same horizontal displacement of the two nodes.
According to the failure modes observed during the test, the local buckling and fracture behavior of the steel beams occurred, resulting in strength and stiffness degradations of CFDST joints. Therefore, a simple nonlinear model cannot accurately simulate the mechanical behaviors of steel beams. An energy-based improved IK steel damage model developed by Lignos [24] was selected to simulate the intricate mechanical behaviors of steel beams accurately. The model is based on the Ibarra–Krawinkler (IK) [24] and more than 300 wide-flange steel beam tests.
The monotonic curve model of the improved IK model was adopted, as shown in Figure 4. The curve contains the yield moment (My), capping moment (Mc), residual moment (Mr), yield rotation (θy), pre-capping plastic rotation (θp), post-capping plastic rotation (θpc) and ultimate rotation capacity (θu). The strength and nonlinear deformation values should be appropriately reduced since the specimen is subjected to a reciprocating load. The values that need to be modified are shown as follows: (1) Mc is defined as 0.9 times the initial value but not less than My; (2) θp is determined to be 0.7 times the initial value; (3) θpc is determined to be 0.5 times the initial value.
According to the CFST frame-BRW structure test, The main failure behavior of the beam is located near the column. An improved IK model simulates the degradation behavior of steel beams by using a rotating spring. The vertical spring is modeled as being fully elastic. Therefore, the steel beam is transformed into a bilinear strengthening model.

3.1.2. Panel Zone

This paper establishes the panel zone (PZ) model to simulate the nonlinear behaviors of the CFDST joint panel. The PZ model should consider the influence of multiple factors, such as concrete cracking, concrete crushing, and steel yield, and the model should be based on the existing members of OpenSees.
The three-linear shear deformation model established by Skalomenos [16] modeled the PZ in the CFT column connection. In this idealized model, the total shear strength is the sum of the strengths of the steel tube and the concrete in the panel under the same deformation. To be sure of the shear yield strength and post-yield stiffness of the ideal model, this study considers the performances of the joint zone of the CFT column-wide flange beam bolted bending moment connection and the inner end plate and the CFT joint of the through-beam [25]. The PZ model of CFDST column joints is established, as shown in Figure 3. A rotating spring between the beam–column represents the relative rotation. The rotating spring is modeled by the Zerolength element. Two stiffness bar elements are used to simulate the relative rotation between the two motions of beams and columns and are modeled by stiffness-link elements. The rotational spring represents the mechanical behaviors of the joint, including rotational stiffness and shear capacity. Therefore, it is essential to model the stiffness and shear capacity of the spring and then simulate the nonlinear behaviors of the PZ. By determining the stiffness and shear loading capacity of the spring, the complex force relationship of the joint can be simplified into a functional relationship of multiple line segments. Then, it can be simplified into a relatively simple mathematical calculation problem.
The horizontal shear capacity of the PZ includes the shear contributions provided by steel tube and concrete. The shear capacity Vu is the sum of the shear capacities of steel tube and concrete:
V u = V s + V c = A s v ( f y 3 ) + 1.99 f c A c v
where Asv and Acv are the effective shear extents of the steel tube and concrete, respectively, and fy and f c are the steel tube yield strength and the core concrete compressive strength, respectively.
The core concrete is in a three-dimensional compressive stress state under the action of gravity load. Figure 5 is the mechanical model of core concrete without considering the internal and external steel pipes under gravity load.
The functional relationship between the compressive strength of core concrete and the standard strength of concrete is as follows:
f c = f c + k c ( P + 2 ζ P 0 B D π )
ζ = 66.474 ( t B ) 2 + 0.992 t B + 0.416
where fc is the standard compressive strength of concrete, kc is the strength improvement coefficient of concrete under lateral restraint, and ζ is the constraint reduction coefficient, which can be calculated by Equation (3). P and P0 are the pressures caused by the outer and inner steel tubes, respectively. B and t are the width and thickness of the outer steel tube, respectively, and D is the diameter of the inner steel tube.
Figure 6 shows the idealized trilinear model of the PZ of CFDST frame joints. The yield point of the PZ is the yield point of the steel tube.
The calculation of the shear deformation is shown as follows:
γ y = κ s 1 × ( V s 1 A s v 1 × G s ) = κ s 2 × ( V s 2 A s v 2 × G s ) y V s 1 + V s 2 = V s
where κs1 and κs2 are the shear coefficients of the square and circular steel tubes, which are equal to 1.2 and 10/9, respectively. Asv1 and Asv2 are the shear extents of the outer and inner tubes, respectively. Gs is the shear modulus of the steel tube. When the shear force of the PZ reaches 60% of the ultimate loading capacity Vu, the PZ yields. The inelastic stiffness of the second stage K2 is 20% of the initial stiffness of the first stage K1. The bending moment–rotation (M-θ) relationship of the rotating spring can be converted from the shear-deformation relationship mentioned above.
The bending moment M and the rotation angle θ can be calculated by the following formulas as:
M = V × B ,   K θ = K γ × B ,   θ = γ

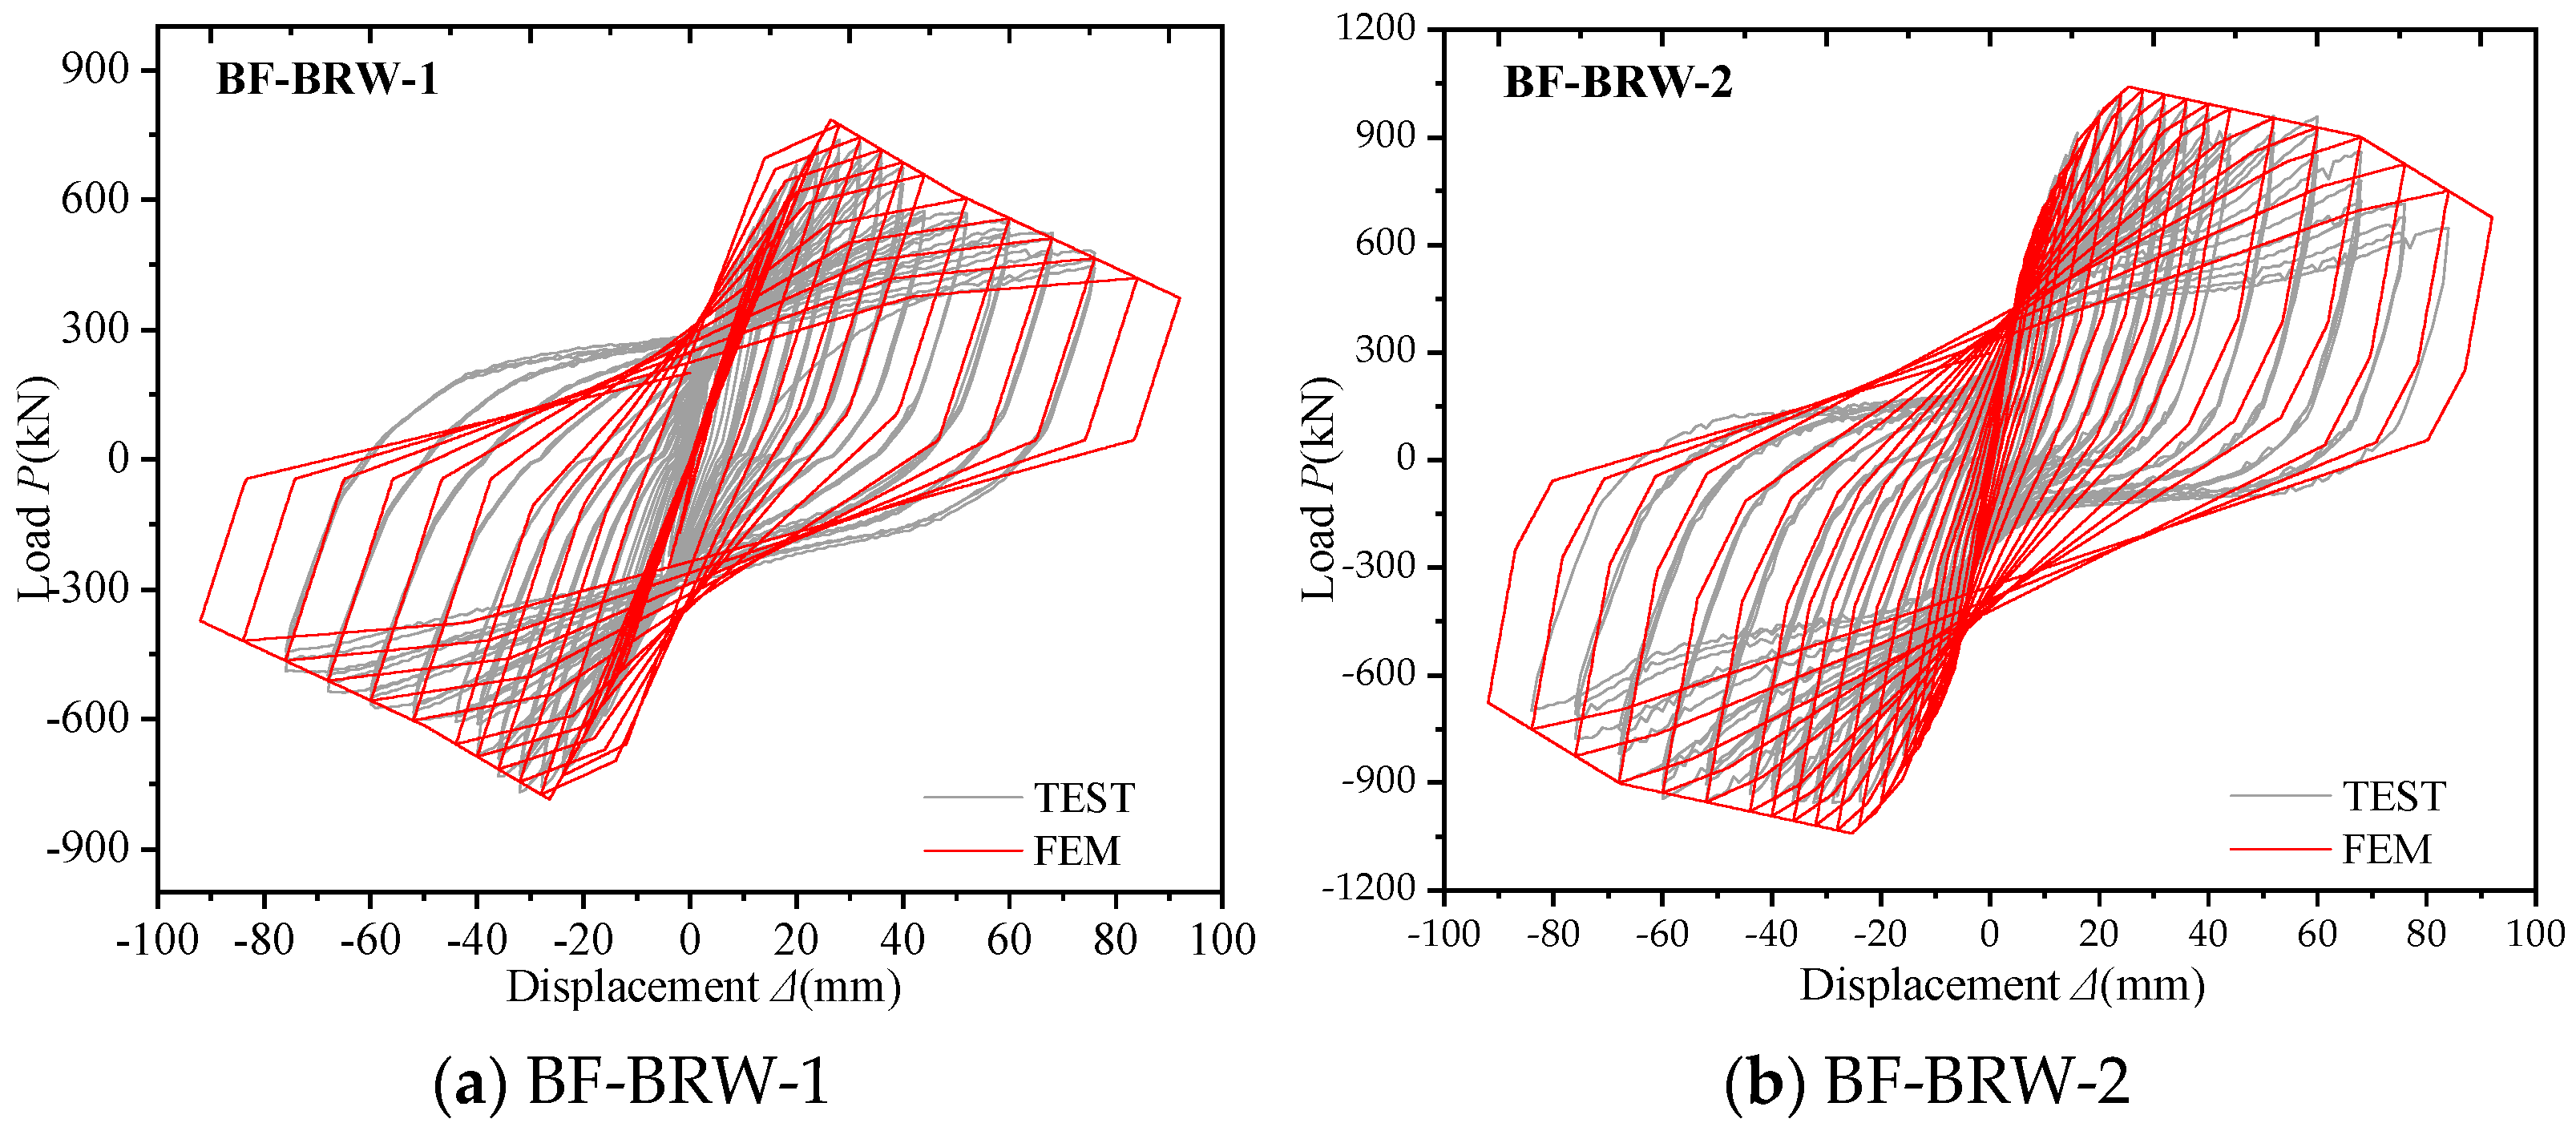
3.2. CFDST Frame-BRW Structure Numerical Model and Verification
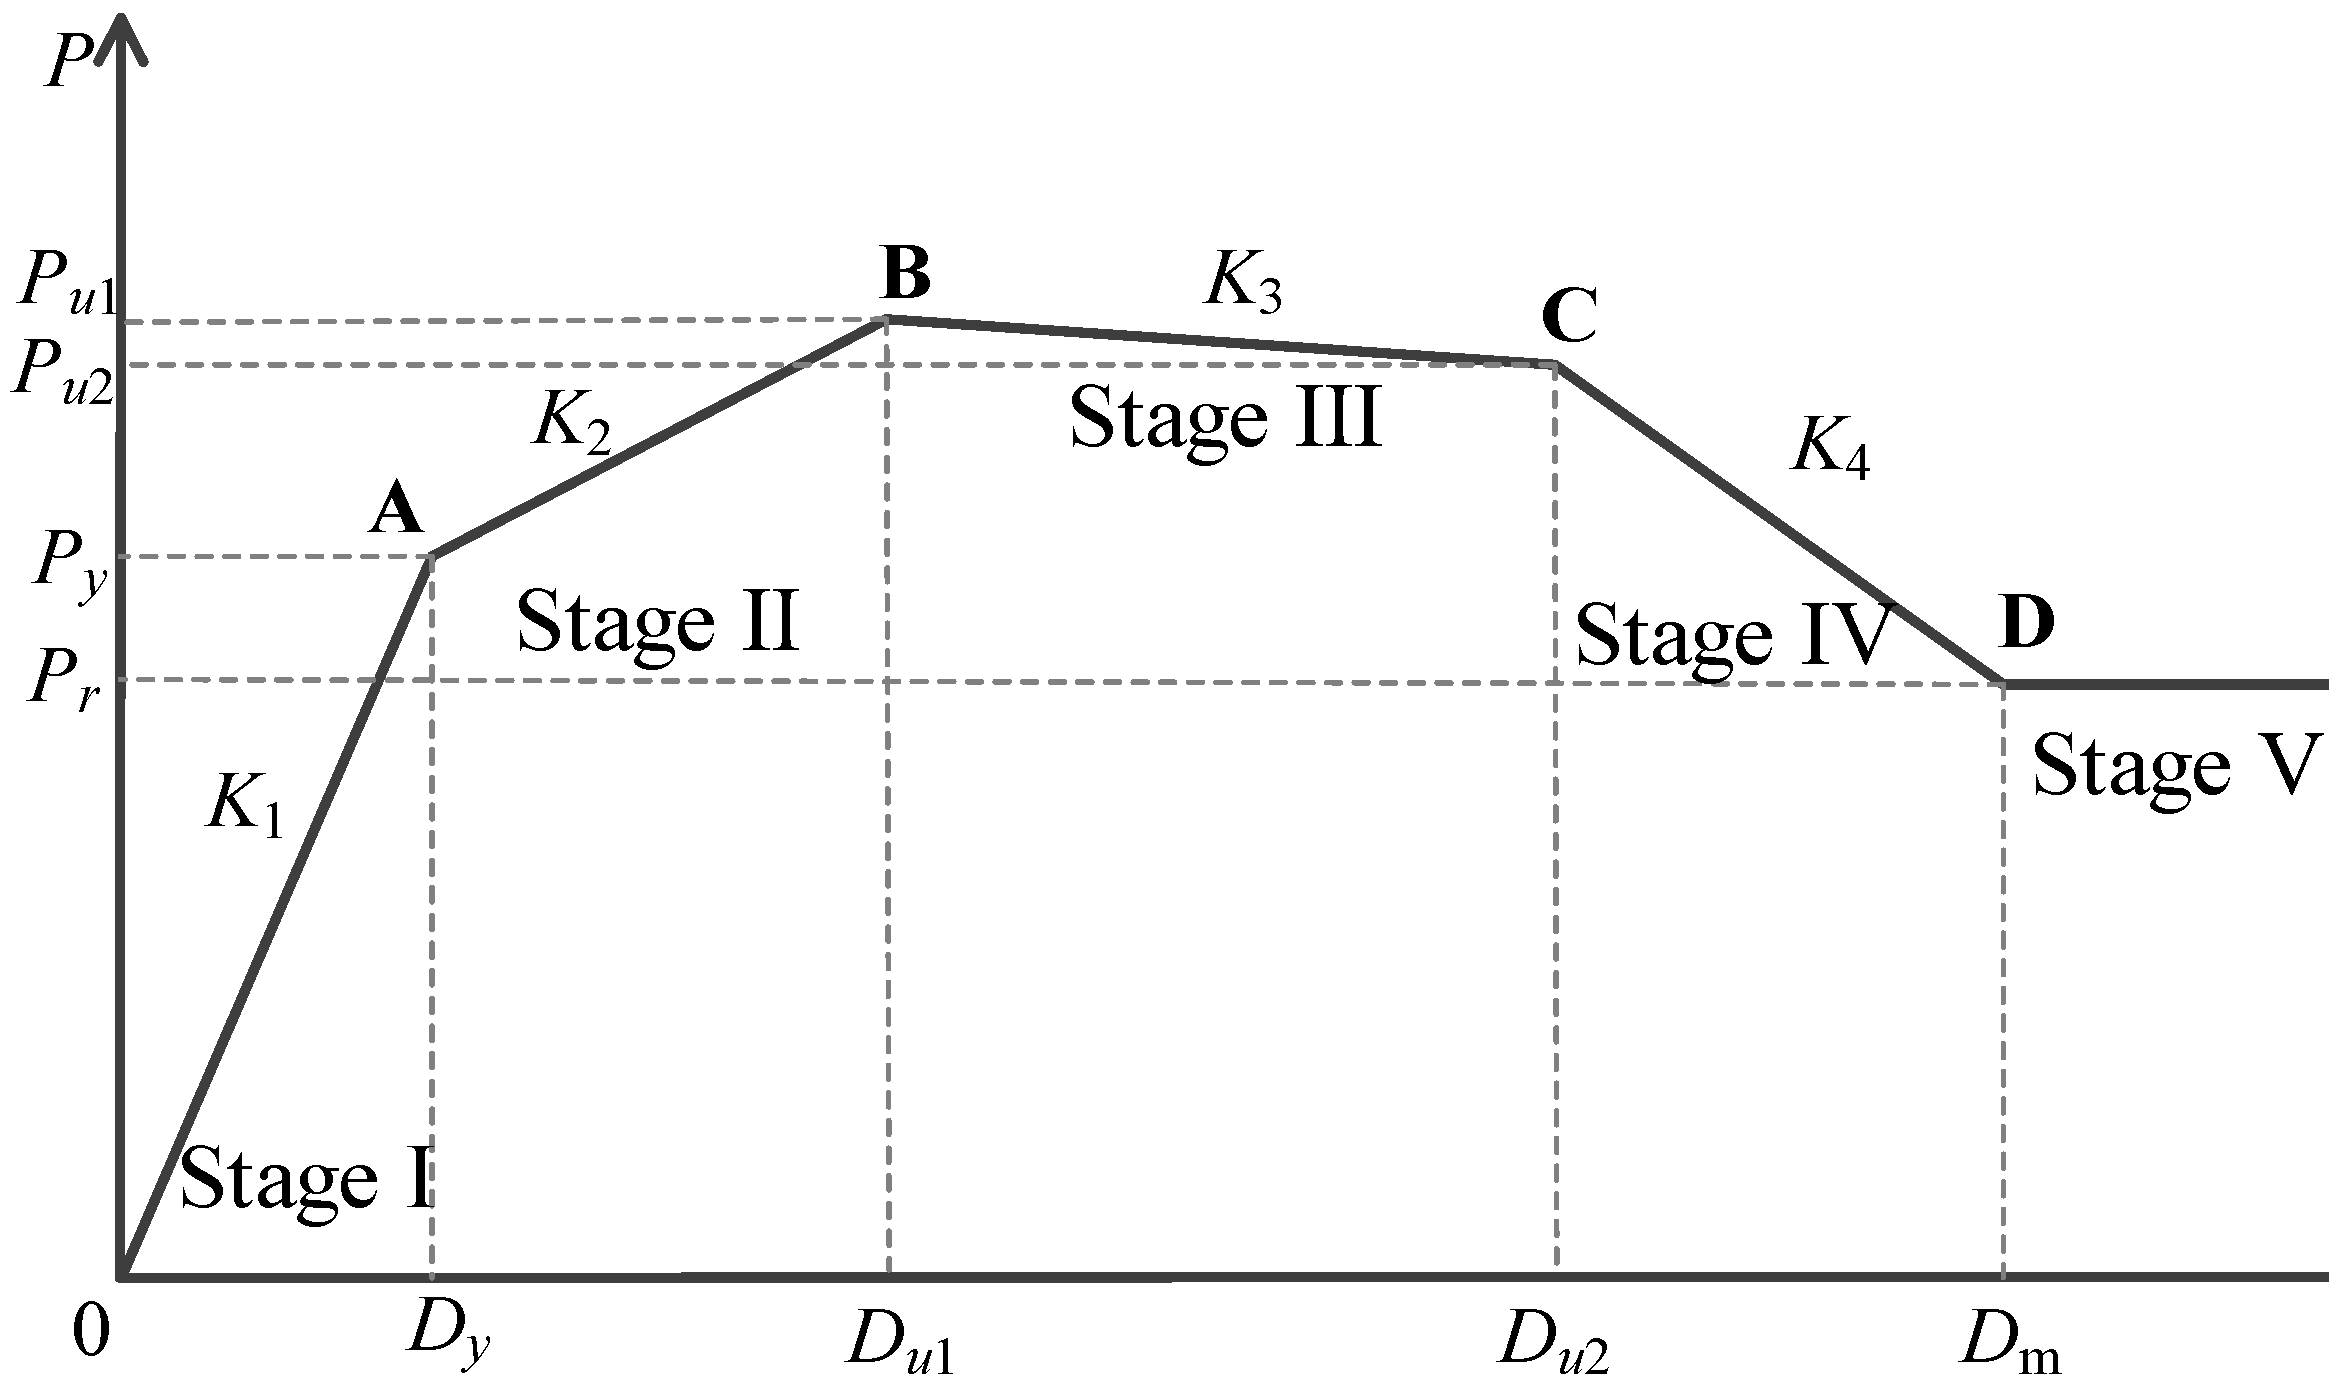
In the CFDST frame-BRW structure, the BRW and CFDST frame are connected by high-strength bolts. Therefore, many nonlinear behaviors are involved in seismic analysis. Considering the use of classical finite element software ANSYS or ABAQUS to finely model the CFDST frame-BRW structure, it will not only cause the numerical model to be complicated and the calculation cost to be too high, but also may cause the numerical model to be difficult to converge due to various nonlinearities. The simplified analysis method is used to establish the numerical analysis model. The simplified method utilized in Ref. [20] is used to model the CFDST framework. We recommend using two cross-arranged nonlinear springs to consider the nonlinear behaviors of the BRW. The seismic performance simulation analysis of the CFDST frame-BRW structure is still based on the OpenSees.
The two-node link element is used to simulate the nonlinear springs, and the hysteresis parameters of the BRW are input through the Pinching04 material model. The length of the two-node link element can be zero or nonzero. The element can simulate the deformation of the structure with 1 to 6 degrees of freedom. The two-node link element used in this paper only considers the axial deformation, that is, the contribution of the BRW to the lateral stiffness of the CFDST frame-BRW structure is simulated by the axial deformation. Pinching04 is a uniaxial material model defined by 39 parameters in Figure 7.
The element can characterize the deformation response of the structural member under uniaxial tension-compression loads. They can also represent the loading capacity and stiffness degradation behavior of the member under cyclic loading. The Pinching04 material model uses 16 parameters to define the skeleton curve of the members (ePf1, ePd1, ePf2, ePd2, ePf3, ePd3, ePf4, ePd4, eNf1, eNd1, eNf2, eNd2, eNf3, eNd3, eNf4 and eNd4) and uses 6 parameters to define the hysteretic characteristics of the members under a reciprocating load (uForceP, uForceN, rDispP, rDispN, rForceP and rForceN). The loading capacity degradation behaviors of the member under cyclic loading is defined by five parameters (gF1, gF2, gF3, gF4, and gF5). The unloading stiffness degradation of the member is controlled by five parameters (gK1, gK2, gK3, gK4, and gKLim). The loading stiffness degradation of the member is controlled by five parameters (gD1, gD2, gD3, gD4, and gDLim). The maximum degradation degree of each cycle is limited by two parameters (gE and dmgType). In addition, the Pinching04 material model can consider positive and negative loadings, so the Bauschinger effect of the model can be considered. For each loading direction, the skeleton curve can be defined by four parameters. Similarly, each direction can also define the hysteretic parameters, loading capacity, and stiffness degradation parameters. Because the Pinching04 material model contains many parameters, it can simulate the hysteretic behavior of complex structures under an earthquake.
Figure 8 is a geometric transformation relationship between the load–displacement curve of the element and the load–displacement curve of the BRW, including the force and displacement borne by the element:
F = F / 2 cos θ
Δ w = Δ w cos θ
where F and F′ are the horizontal forces borne by the wall and the axial force borne by a two-node link element, respectively; Δw and Δw′ are the horizontal displacements of the BRW and the axial deformation of a two-node link element, respectively; θ is the angle between the two-node link element and the steel beam and represents the angle between the force and deformation direction of the two-node link and the horizontal direction.
After selecting the element and material model of the simulated BRW, it is necessary to ensure the parameters in the material model, in which the skeleton curve is related to the loading capacity and deformation capacity of the BRW. To match the Pinching04 material model, this paper recommends a fivefold line model for the skeleton curve of the BRW connected to the beam end. There are four key points and five stages in Figure 9. The stage is known as the elastic stage, in which the BRW concrete does not crack, and the high-strength bolted connection between the BRW and the CFDST frame is not torn.
The loading capacity Py and the displacement Dy at point A are defined as the loading capacity corresponding to the cracking of concrete in the BRW, and the displacement is the ratio of the loading capacity to the elastic lateral stiffness of the BRW. Because the test model involves the initial defects of the BRW, the uncertainty of the material properties, and the bolt connection between the BRW and the CFDST frame, the ideal state theory cannot sufficiently reflect the stress state of the CFDST frame-BRW structure. To this end, this paper draws on the simplified processing method adopted by the energy-based improved IK damage model proposed by Lignos [26]. It uses the test data to determine the skeleton curve’s loading capacity and deformation parameters, represented by a simple constant coefficient. According to the analysis of the results of the two test models, the following key points are defined.
(1)
Point A is defined as follows, i.e., the loading capacity Py of the BRW is 0.59 times the peak loading capacity Pu1 of the BRW. The SDR is 0.6%, that is, the displacement is 9.0 mm.
(2)
Point B is defined as follows, i.e., the peak loading capacity Pu1 of the BRW is calculated according to the simplified calculation method. The SDR of the BRW is 1.3%, and the displacement is 19.5 mm.
(3)
Point C is defined as follows, i.e., the loading capacity Pu2 of the BRW is 0.75 times (BF-BRW-1) and 0.85 times (BF-BRW-2) of the peak loading capacity Pu1 of the BRW, and the SDRs are 2.6% (BF-BRW-1) and 3.3% (BF-BRW-2), that is, the displacements are 39.0 mm (BF-BRW-1) and 49.5 mm (BF-BRW-2), respectively.
(4)
Point D is defined as follows, i.e., the loading capacity Pm of the BRW is 0.27 times that of the peak loading capacity Pu1 of the BRW. The SDR is 5.7%, that is, the displacement is 85.5 mm.
When the skeleton curve parameters of the BRW are determined, the skeleton curve parameters of the BRW are converted into the skeleton curve parameters of the two-node link element according to Equations (8) and (9) and are input into the simplified model of the structure to realize the simulation analysis of the test model. Among them, ePf1, ePf2, ePf3, and ePf4 correspond to the forces at points A, B, C, and D after the geometric relationship is transformed; ePd1, ePd2, ePd3, and ePd4 correspond to the displacements at points A, B, C and D after geometric transformation, respectively.
λ j = P max i P max 1
K i = j = 1 2 P j i j = 1 2 Δ j i
where P max i represents the peak load of the specimen under the ith reciprocating load; P max 1 denotes the peak load of the specimen in the 1st loading stage; K i is the secant stiffness of the test specimen in the ith loading stage; P j i indicates the peak load capacity of the test specimen in the jth direction (forward loading and reverse loading) when the ith level is loaded; and Δ j i indicates the displacement corresponding to the peak loading capacity of the specimen in the j direction when the ith stage is loaded.
In addition to the forces and displacements at points A, B, C, and D, the hysteretic parameters, loading capacity, and stiffness degradation parameters of the two-node link element need to be determined. Analysis of the hysteretic curves measured in the test, the hysteretic parameters, loading capacity, and stiffness degradation parameters of the two-node link element can be obtained as follows.
For the BRW, the hysteretic parameters are uForceP = 0.2, uForceN = 0.2, rDispP = 0.8, rDispN = 0.8, rForceP = 0.95 and rForceN = 0.95, the loading capacity degradation parameters are gF1 = 0.0, gF2 = 0.0, gF3 = 0.0, gF4 = 0.0 and gF5 = 0.0, and the unloading stiffness degradation parameters are gK1 = 0.0, gK2 = 0.0, gK3 = 0.0, gK4 = 0.0 and gKLim = 0.0. The loading stiffness degradation parameters gD1 = 0.0, gD2 = 0.0, gD3 = 0.0, gD4 = 0.0 and gDLim = 0.0, the maximum degradation gE = 10.0 and dmgType = Energy.
The above parameters are input into the numerical analysis model, and the CFDST frame-BRW structure is numerically simulated and analyzed. The two CFDST frame-BRW structure tests completed are used to verify the numerical model as shown in Figure 10.
Since the CFDST frame connection and the BRW are represented by multiline segment functions, the predicted hysteresis curves show the prominent line segment shape characteristics. The simplified numerical model not only simulates the ultimate loading capacity of the test model but also has high accuracy for the degradation behaviors of the stiffness and loading capacity of the test model under cyclic loading. This shows that the model can accurately predict the seismic performances of the CFDST frame-BRW structure. In addition, compared with traditional finite element analysis software, such as ANSYS and ABAQUS, the calculation time of a single model using the simplified analysis method is less than 5 min, the calculation efficiency is high, and the convergence is good. Therefore, this method can be considered as an effective numerical method for seismic analysis and dynamic calculation of CFDST frame-BRW structures.

4. CFDST Frame-BRW for Seismic Risk Assessment

The earthquake risk assessment theory includes the following step: (1) collect ground motion data; (2) dynamically analyze the target building and obtain its response; (3) measure the structural performance and determine the degree of damage; (4) establish a vulnerability curve; and (5) calculate the seismic risk and make design decisions.
According to Ref. [20], the probability of the limit state in the seismic risk assessment generated the following formula:
P [ L S i ] ( k 0 m R k ) exp [ ( k β R ) 2 / 2 ]
where P[LSi] is the occurring probability of each limit state in seismic evaluation; LSi is the ith performance limit state of the structure; k and k0 are the shape parameter and proportional parameter of the seismic hazard curve, respectively; and m R   β R are the median and logarithmic standard deviation of seismic demand, respectively.

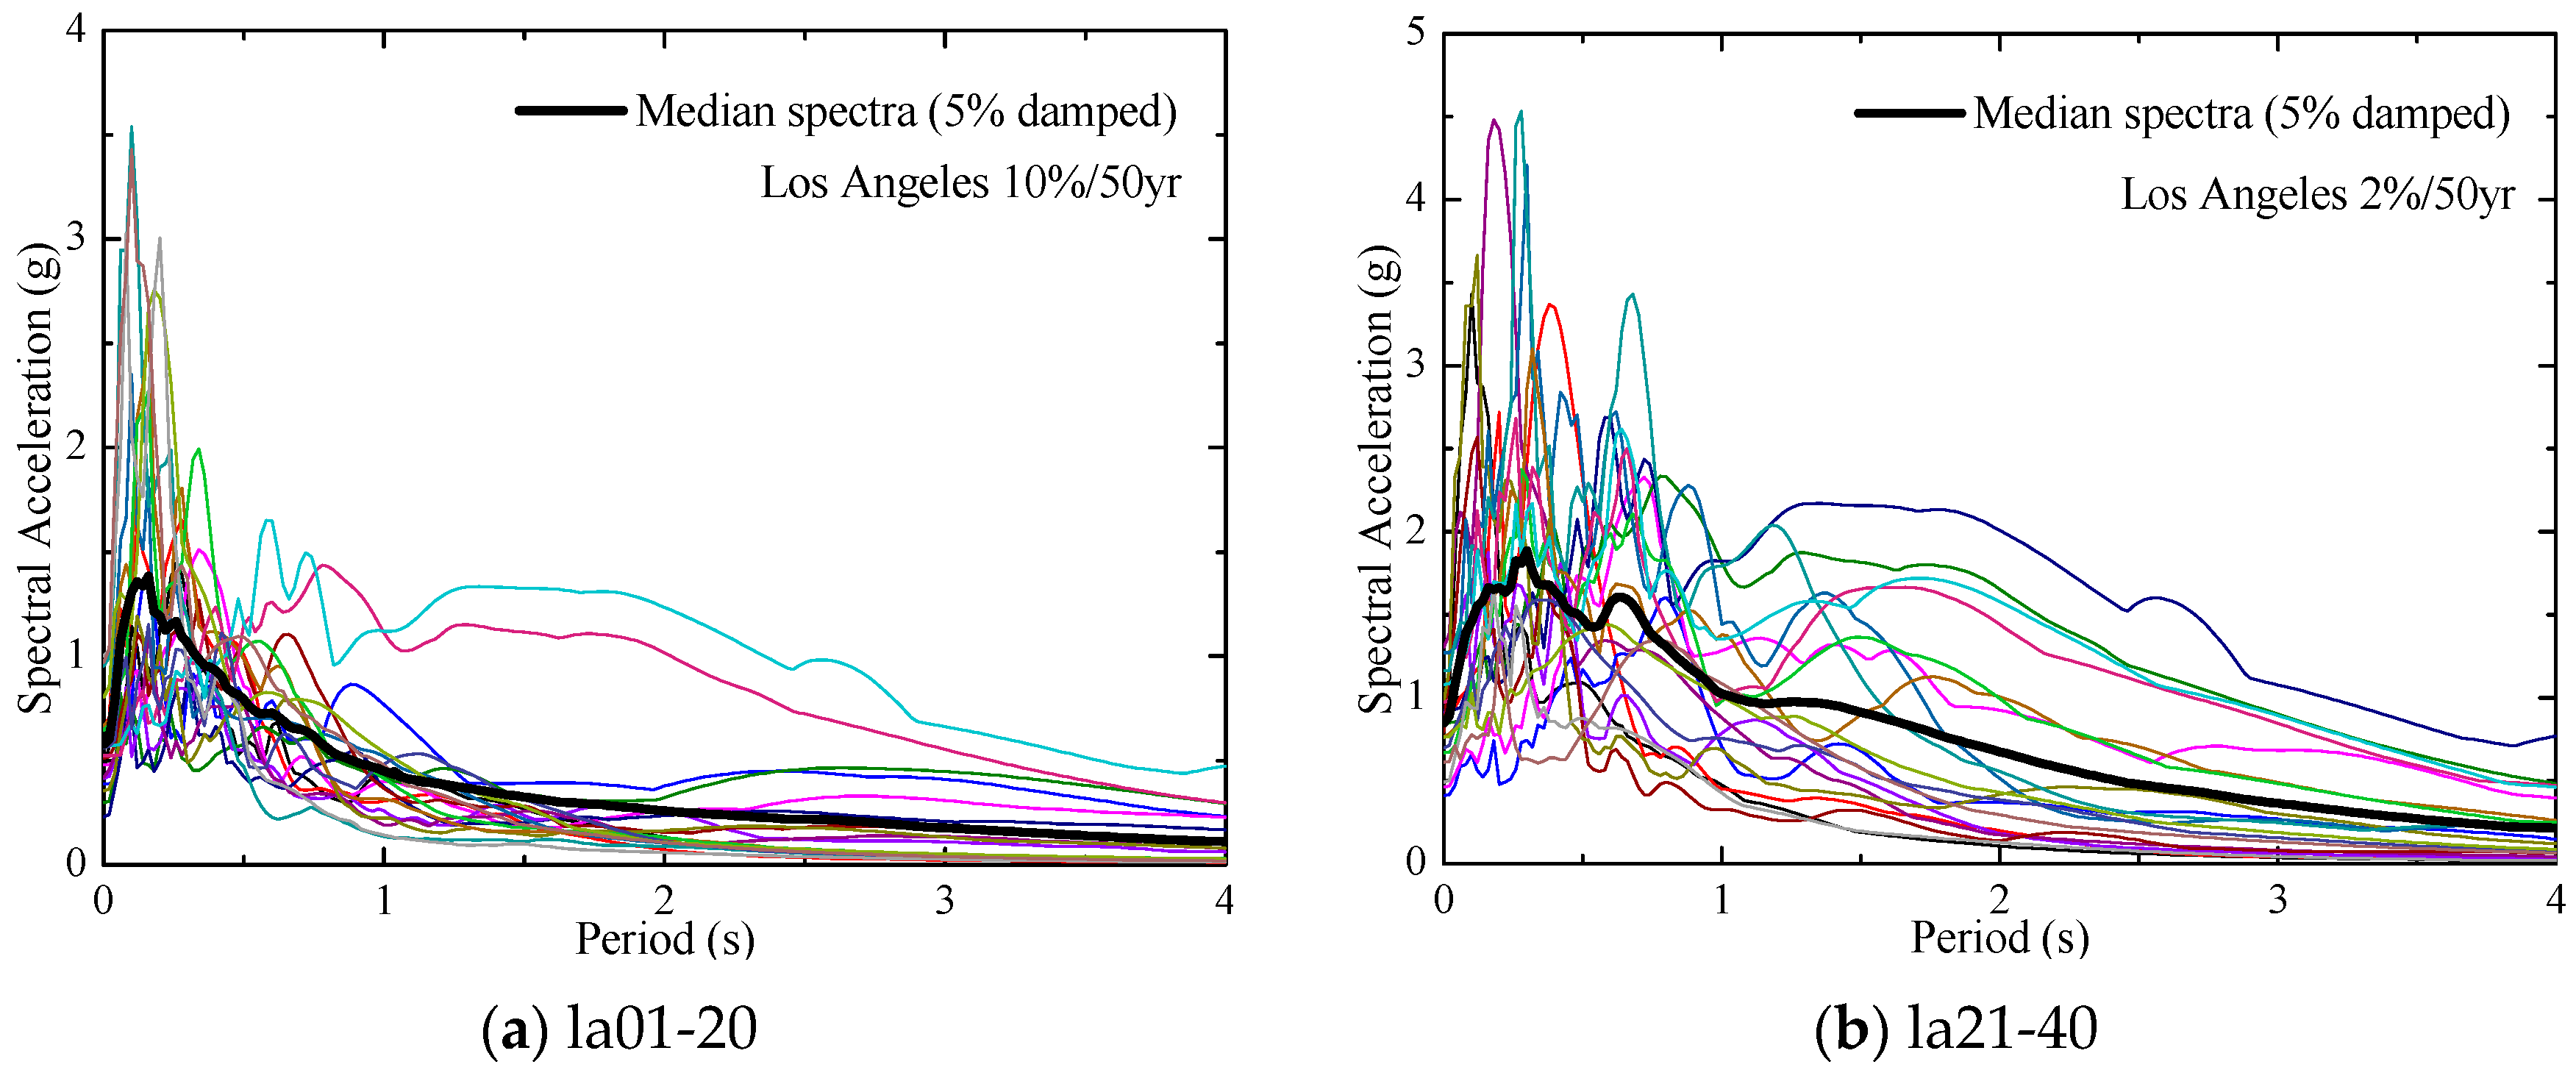
5. Earthquake Ground Motions

The seismic load and structural resistance of existing buildings are uncertain. The uncertainty of the seismic demand is dominant in the overall response. Therefore, The parameters of the numerical model are constants such as the yield stress and modulus. As China’s earthquake disaster map and regional representative seismic wave selection are still in the research and development stage, this paper takes the Los Angeles area of the US as an example and selects 40 ground motions. These ground motions are representative ground motions set by the SAC project [22] for the Los Angeles (LA) area for seismic risk analysis of steel building structures on site. These records represent two risk levels: the excess probability within 50 years is 10% (la01-20) and 2% (la21-40), each group containing 20 ground motions. The response spectrum of ground motions la01 to la40 in Figure 11 represents two seismic risk levels in the Los Angeles area.

6. Seismic Risk Assessment of CFDST-BRW Structure

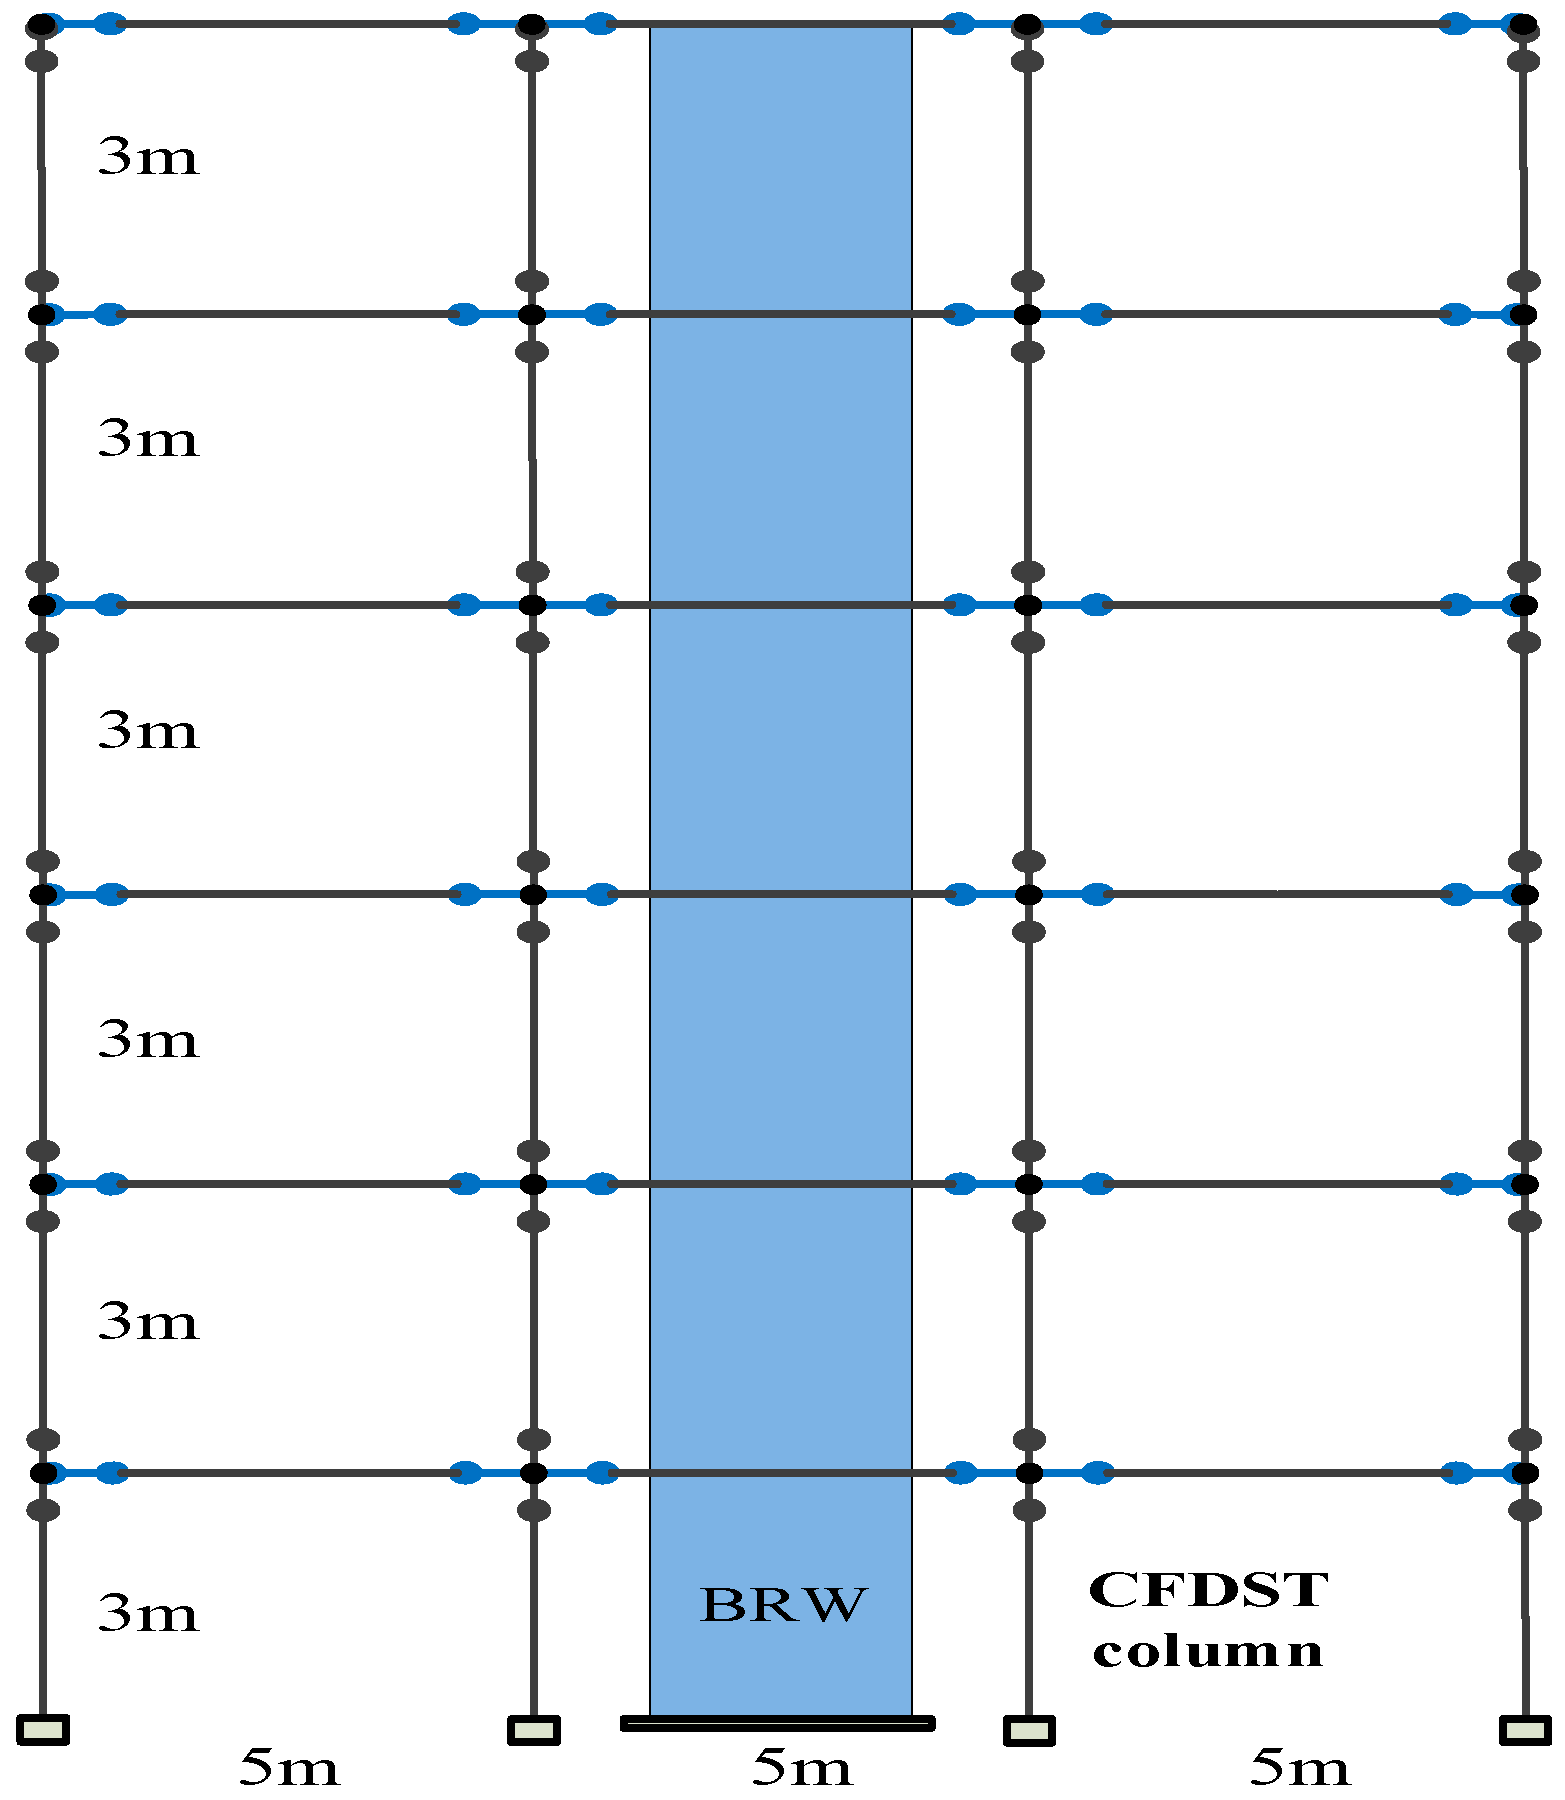
6.1. Prototype Structures

In this paper, the nine-story CFDST frame designed in Ref. [20] is used as the base model of the CFDST frame-BRW structure, as shown in Figure 12. For the CFDST frame-BRW structure, only a BRW is filled in the middle span, and the width of CFDST-BRW model is 3 m. The specific parameters are in Table 1.
The gravity load adopts the analysis example of Skalomenos [16], which is assumed to be G + 0.3Q = 27.5 kN/m. The yield strength of the CFDST column and the steel strength in the BRW is 275 MPa. The compressive strength of concrete and filled concrete in the BRW is 20 Mpa.

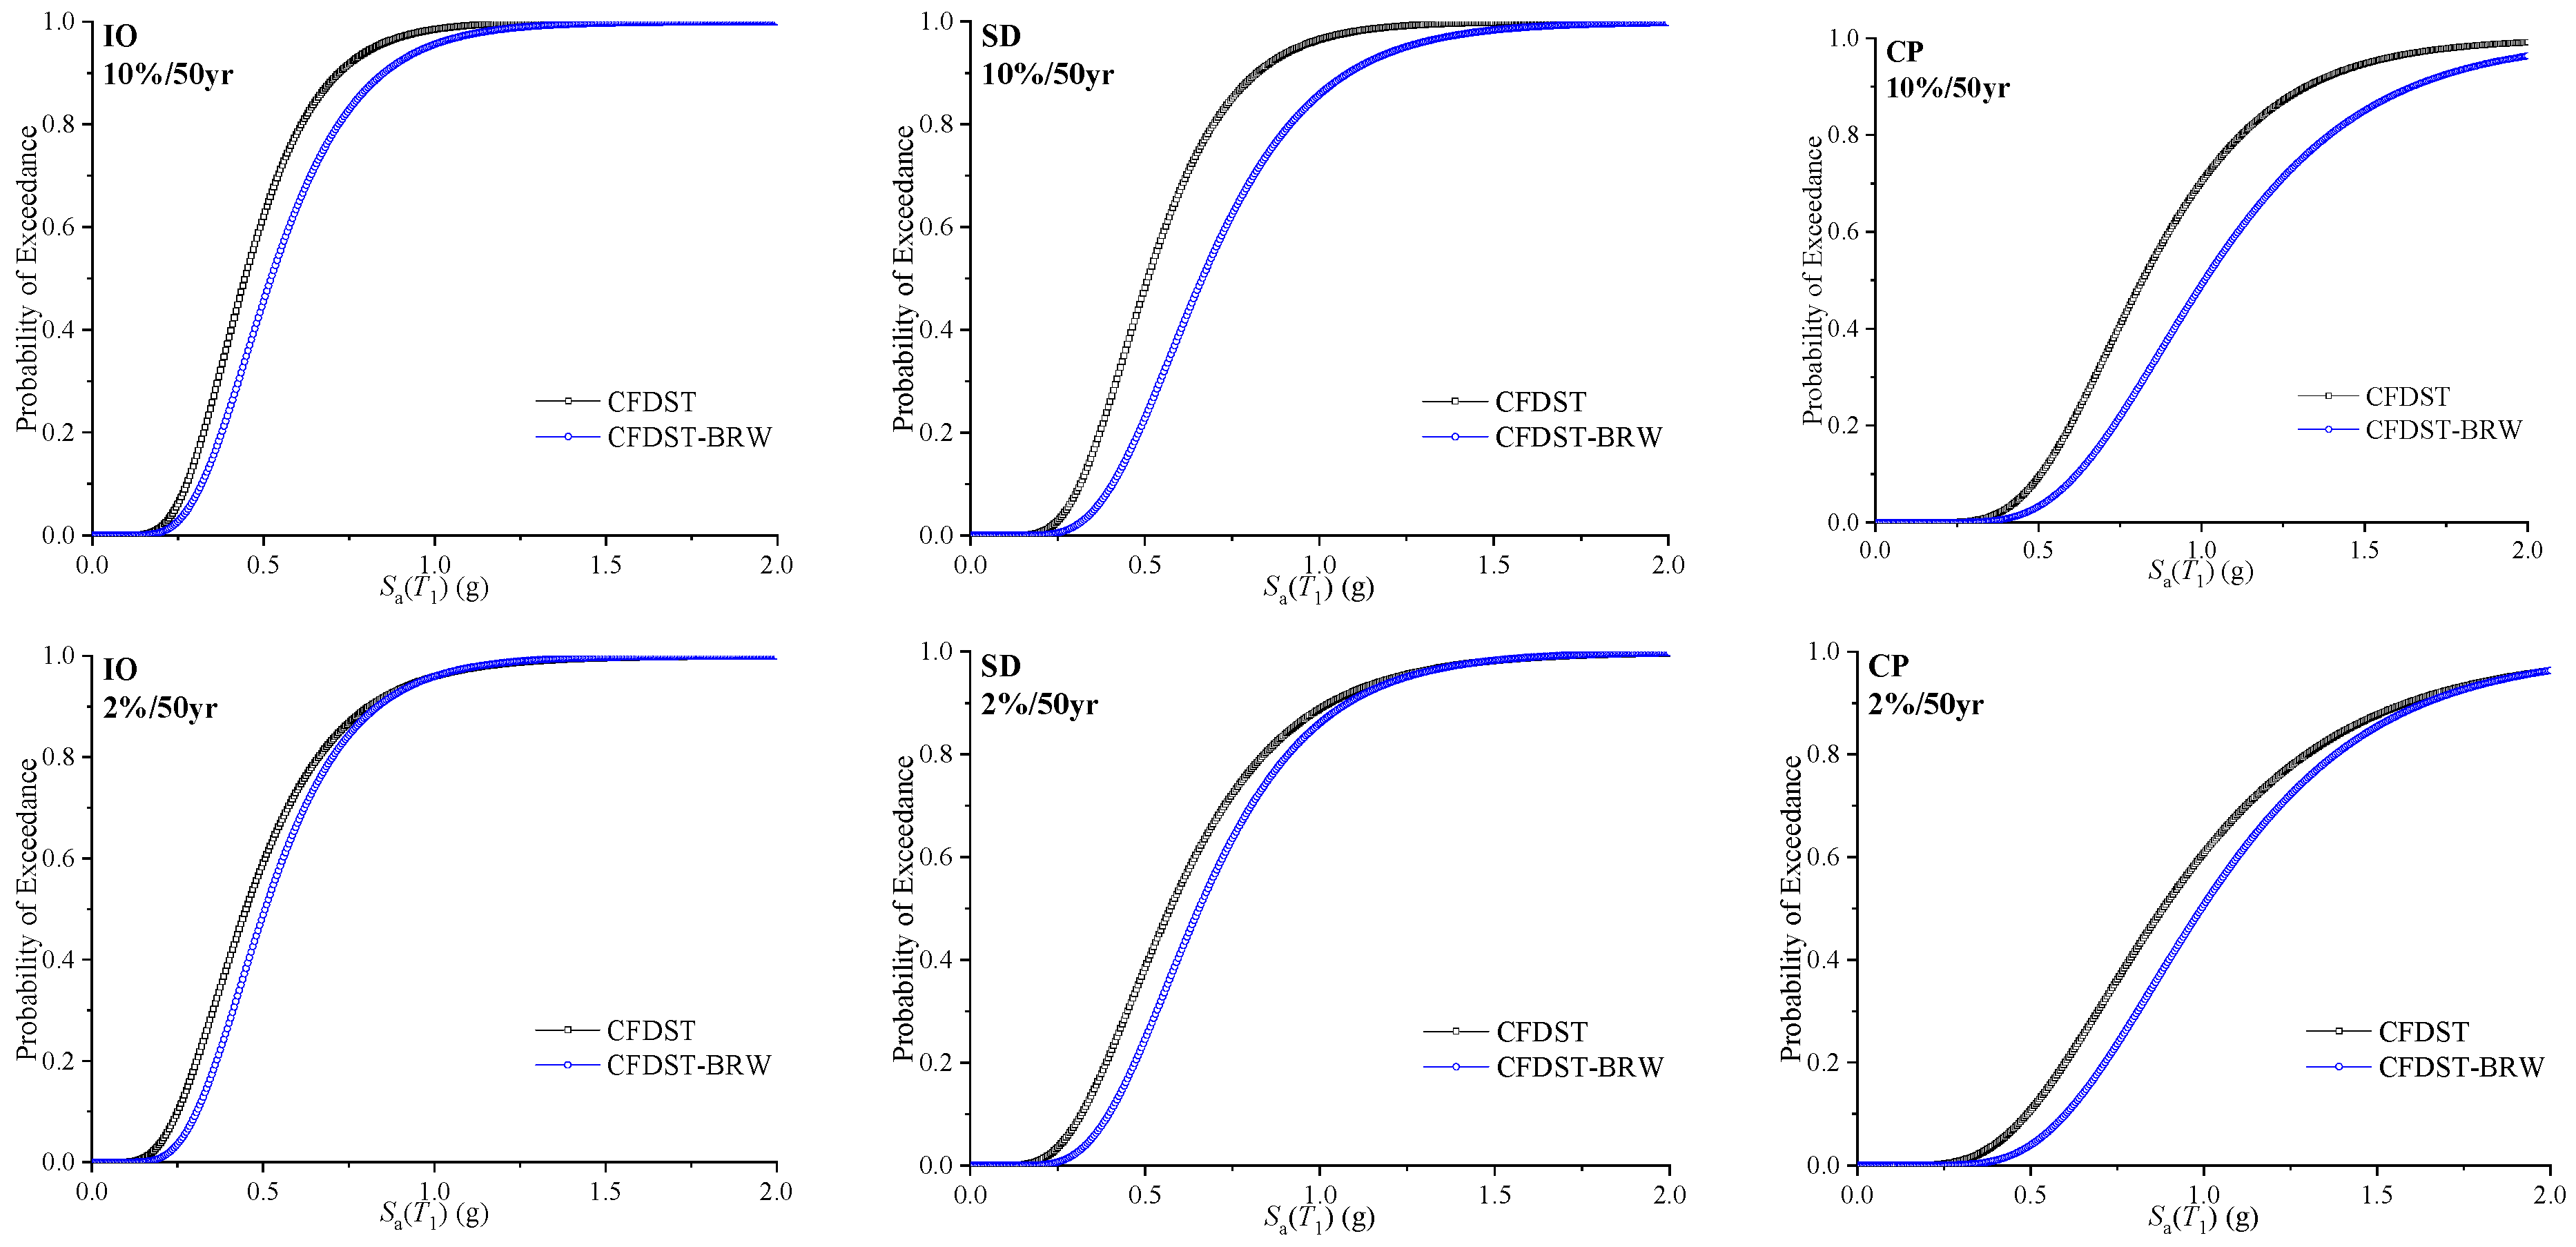
6.2. Probabilistic Seismic Demands

The nonlinear dynamic analysis is carried out to establish the numerical analysis model. The selected representative seismic waves (la01-la40) are input into the model one by one according to 10%/50 year and 2%/50 year groups, and the seismic demand results of the model can be obtained. The ISDAmax is used as a parameter to evaluate the structural performance.
The functional relationship between the ISDAmax of each floor and the spectral acceleration Sa (T1) [27] of the CFDST frame-BRW model obtained by nonlinear dynamic analysis is recorded as follows:
θ max = a s a b ε
where ε is a random variable; θmax is the ISDAmax obtained by NTHA; a and b are constants; Sa is the spectral acceleration corresponding to the first natural vibration period of the structure when the damping ratio is 5%.

6.3. Probabilistic Seismic Demands

The seismic vulnerability curve is the main part of structural seismic risk assessment, representing the functional relationship between the maximum dynamic response of the structure under an earthquake and the intensity of ground motion. The incremental dynamic analysis (IDA) of the CFDST frame-BRW is carried out using the selected seismic waves. Then, the curve relationship between the ground motion intensity and the dynamic response of each model is obtained. To reduce the calculation amount of dynamic analysis, each ground motion gradually increases the input ground motion intensity at a multiple of 100 gal and is gradually applied to the structure to record the relationship between the ISDAmax and the input seismic intensity. The median value mC of the seismic demand of the three structural models under different performance states is obtained by counting these IDA curves. In addition, the seismic vulnerability curve also considers many uncertain factors, including the uncertainty of earthquakes, the uncertainty of structures, and the uncertainty of modeling, which correspond to the logarithmic standard deviations, including βC for the uncertainty of earthquakes, βSC for the uncertainty of structures and βu for the uncertainty of modeling; βSC can be combined with βu to form βC = β S C 2 + β u 2 . It is called the logarithmic standard deviation, corresponding to the uncertainty of seismic demand.
According to these median values and uncertainty parameters, the seismic vulnerability of each model to various performance states can be calculated by:
P [ L S i | S a = x ] = Φ [ ( ln a x b / m C ) β C 2 + β D 2 ]
where the demand uncertainty βD is determined by the dynamic response of a series of ground motions, which is equal to σlnε; mC is the median of earthquake demand obtained by IDA; and βC is the logarithmic standard deviation of the earthquake demand group.
The seismic vulnerability of the CFDST frame-BRW model calculated in this paper only considers the influence of seismic uncertainty. It does not consider the impact of other uncertain factors, such as structural uncertainty and modeling uncertainty. These uncertainties need to be completed by carrying out many random numerical analyses. The authors will study the influence of the BRW on the seismic risk of CFDST frames. Therefore, only the uncertainty factors of earthquakes that have the greatest impact on them are selected. In the future, the authors will further study the seismic vulnerability and seismic risk of CFDST structures under multiple uncertainties and other damping structures [28]. Because multiple uncertainties are essential for accurately assessing structures’ seismic risk, many studies have discussed this issue [29,30,31,32,33,34,35,36,37,38].
The CFDST-BRW model’s seismic vulnerability is calculated using Equation (12). The fragility curves corresponding to each limit state in Figure 13 and the corresponding fragility parameters are shown in Table 2.

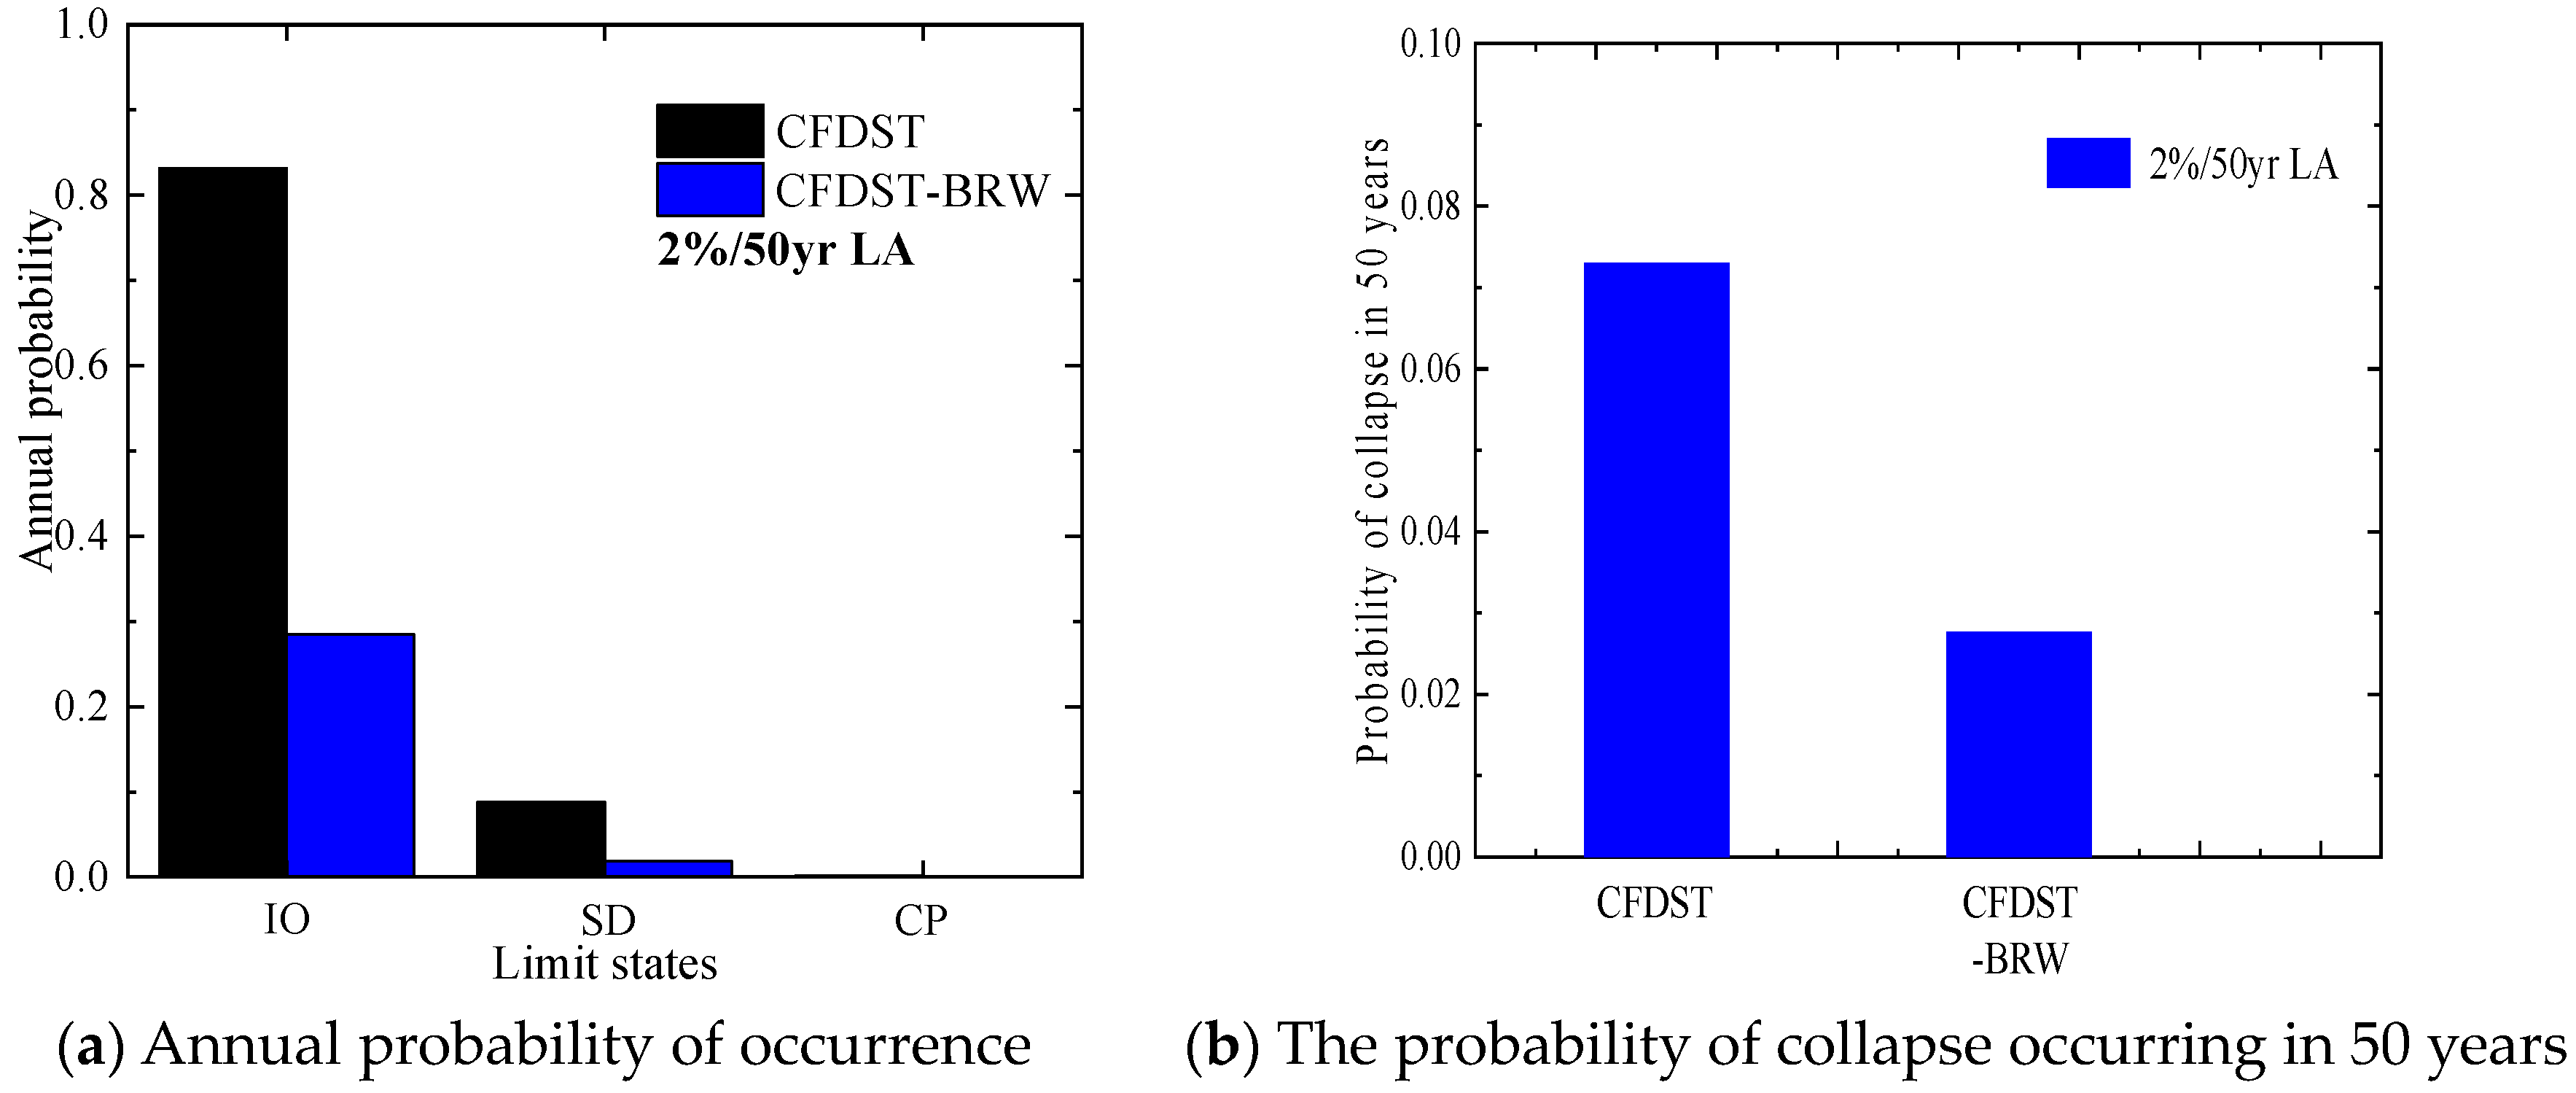
6.4. Probability Estimation of Annual Performance Limits

The HAZUS software released by the USGS of the US Geological Survey was used to calculate the seismic disaster parameters of the model in the Los Angeles area of 10%/50 year and 2%/50 year earthquakes, as shown in Table 3. According to these earthquake disaster parameters, the shape parameter k and the proportional parameter k0 of CFDST frame-BRW structures in Los Angeles can be obtained. The shape parameter k of the CFDST frame-BRW structure in this area is not largely different from the shape parameter k of the CFDST frame. The shape parameter k and the proportional parameter k0 of the model are brought into the seismic risk function, and the seismic disaster curve of the model can be obtained, as shown in Figure 14. The annual average occurrence probability of the CFDST frame-BRW model can be calculated by convolution calculation of the seismic risk function and seismic vulnerability function. The results are shown in Table 4.
As shown in Figure 15, combined with Ref. [20], the BRW reduces the annual probability and collapse probability of the CFDST frame structure to achieve various performance states within the service life of 50 years. The BRW reduces the annual failure probability and 50-year collapse probability of the CFDST frame to a reasonable extent. The BRW reduces the 50-year collapse probability of the CFDST frame to 2.76%, significantly reducing the CFDST frame’s collapse probability. The BRWs can effectively reduce the probability of different degrees of damage to the structure during the service life.

7. Conclusions

The seismic risk assessment of a nine-story CFDST frame-BRW structure was carried out to study the BRW on the seismic risk of the CFDST frame. The purpose was to calculate the exceedance probability of this kind of structure to reach various performance limit states during the design life period (usually 50 years). The ground motion obtained by the SAC project represented the uncertainty of seismic demand. The following conclusions can be drawn.
  • Based on the unified theory, the model considered the mechanical properties of concrete materials under a three-dimensional stress state under compression. A simplified analysis model of a shear wall with beam-end connections of different types of materials was established. The hysteretic characteristics of a BRW under earthquake action were simulated by two nonlinear springs with Pinching04 material properties. The correctness of the adopted simplified analysis model was verified by the seismic performance test results of two CFDST frame-BRW structures.
  • A numerical analysis model of a nine-story CFDST frame-BRW structure was established, and ground motion records were selected from the SAC project to describe the seismic risks in the Los Angeles area of the US States, which were divided into two risk levels of 2%/50 years and 10%/50 years. This model uses nonlinear time history analysis and incremental dynamic analysis on the selected records.
  • The analysis model’s fragility curves were established using three determined performance limits and structural responses. The annual probability of these three limits and the probability of collapse within 50 years were determined by convoluting the fragility with the seismic risk specified by the USGS.
  • The BRW reduced the probability of collapse of the CFDST frame to 2.76% in 50 years, which indicates the proposed BRW could effectively reduce the probability of different degrees of damage in the service cycle of the structure.

Author Contributions

Conceptualization, H.S., Y.H., J.Z. and Y.L.; Methodology, H.S.; Validation, H.S.; Investigation, H.S.; Resources, J.Z., D.W. and Y.L.; Data curation, H.S. and Y.H.; Writing—original draft, H.S. and Y.H.; Writing—review & editing, H.S. and Y.H.; Visualization, H.S. and Y.H.; Supervision, J.Z. and D.W.; Project administration, H.S. All authors have read and agreed to the published version of the manuscript.

Funding

This work was sponsored by the Hunan Natural Science Foundation of China (Grant No. 2021JJ41083) and the Hunan Provincial Department of Education Excellent Youth Fund (Grant No. 20B598).

Data Availability Statement

Not applicable.

Acknowledgments

The authors wish to thank the anonymous reviewers for their thorough evaluations and valuable comments, which have helped improve the paper.

Conflicts of Interest

The authors declare no conflict of interest.

References

  1. Wang, X.D.; Gao, P.; Liu, J.P.; Zhao, Q.R.; Xu, H.M.; Wei, W.; Wang, X.T. Assessment on seismic performance of circular concrete-filled thin-walled steel tube columns. Adv. Struct. Eng. 2023, 26, 399–412. [Google Scholar] [CrossRef]
  2. Skalomenos, K.A.; Hatzigeorgiou, G.D.; Beskos, D.E. Application of the hybrid force/displacement (HFD) seismic design method to composite steel/concrete plane frames. J. Constr. Steel. Res. 2015, 115, 179–190. [Google Scholar] [CrossRef]
  3. Gan, D.; Zhou, Z.; Yan, F.; Zhou, X.H. Shear transfer capacity of composite sections in steel tubed-reinforced-concrete frames. Structures 2017, 12, 54–63. [Google Scholar] [CrossRef]
  4. Lai, Z.C.; Huang, Z.H.; Varma, A.H. Seismic analysis and performance of high strength composite special moment frames (C-SMFs). Structures 2017, 9, 165–178. [Google Scholar] [CrossRef]
  5. Wang, K.; Yuan, S.F.; Chen, Z.X.; Zhi, H.X.; Shi, G.L.; Cao, D.F. Experimental study on hysteretic behavior of composite frames with concrete-encased CFST columns. J. Constr. Steel. Res. 2016, 123, 110–120. [Google Scholar] [CrossRef]
  6. Bai, Y.T.; Hu, H.S.; Wang, J.T.; Sun, Q. Modeling on collapse behaviour of high-rise concrete-filled steel composite frames under over-design seismic excitations. Struct. Infrastruct. Eng. 2017, 13, 1563–1575. [Google Scholar] [CrossRef]
  7. Ren, F.M.; Zhou, Y.; Zhang, J.B.; Lin, S.M. Experimental study on seismic performance of CFST frame structures with energy dissipation devices. J. Constr. Steel. Res. 2013, 90, 120–132. [Google Scholar] [CrossRef]
  8. Jia, M.M.; Lu, D.G.; Guo, L.H.; Sun, L. Experimental research and cyclic behavior of buckling-restrained braced composite frame. J. Constr. Steel. Res. 2014, 95, 90–105. [Google Scholar] [CrossRef]
  9. Nie, J.G.; Hu, H.S.; Fan, J.S.; Tao, M.X.; Li, S.Y.; Liu, F.J. Experimental study on seismic behavior of high-strength concrete filled double-steel-plate composite walls. J. Constr. Steel. Res. 2013, 88, 206–219. [Google Scholar] [CrossRef]
  10. Wang, J.F.; Li, B.B. Cyclic testing of square CFST frames with ALC panel or block walls. J. Constr. Steel. Res. 2017, 130, 264–279. [Google Scholar] [CrossRef]
  11. Guo, L.H.; Rong, Q.; Qu, B.; Liu, J.P. Testing of steel plate shear walls with composite columns and infill plates connected to beams only. Eng. Struct. 2017, 136, 165–179. [Google Scholar] [CrossRef]
  12. Hu, Y.; Zhao, J.H.; Zhang, D.F.; Li, Y.P. Cyclic performance of concrete-filled double-skin steel tube frames strengthened with beam-only-connected composite steel plate shear walls. J. Build. Eng. 2020, 31, 15. [Google Scholar] [CrossRef]
  13. Bian, J.L.; Cao, W.L.; Dong, H.Y.; Chen, J.W. Seismic research of prefabricated CFST frame with various H-steel frame shear walls. J. Build. Eng. 2022, 57, 20. [Google Scholar] [CrossRef]
  14. Hu, Y.; Zhao, J.H.; Zhang, D.F.; Zhang, H.Q. Cyclic tests of fully prefabricated concrete-filled double-skin steel tube/moment-resisting frames with beam-only-connected steel plate shear walls. Thin-Walled Struct. 2020, 146, 14. [Google Scholar] [CrossRef]
  15. Xu, S.Y.; Li, Z.L.; Liu, H.J. Global seismic performance of a new precast CFST column to RC beam braced frame: Shake table test and numerical study. Steel Compos. Struct. 2016, 21, 805–827. [Google Scholar] [CrossRef]
  16. Skalomenos, K.A.; Hatzigeorgiou, G.D.; Beskos, D.E. Modeling level selection for seismic analysis of concrete-filled steel tube/moment-resisting frames by using fragility curves. Earthq. Eng. Struct. Dyn. 2015, 44, 199–220. [Google Scholar] [CrossRef]
  17. Leon, R.T.; Gao, Y. Resiliency of steel and composite structures. Front. Struct. Civ. Eng. 2016, 10, 239–253. [Google Scholar] [CrossRef]
  18. Kamaris, G.S.; Skalomenos, K.A.; Hatzigeorgiou, G.D.; Beskos, D.E. Seismic damage estimation of in-plane regular steel/concrete composite moment resisting frames. Eng. Struct. 2016, 115, 67–77. [Google Scholar] [CrossRef]
  19. Ahmadi, M.; Naderpour, H.; Kheyroddin, A.; Gandomi, A.H. Seismic failure probability and vulnerability assessment of steel-concrete composite structures. Period. Polytech.-Civ. Eng. 2017, 61, 939–950. [Google Scholar] [CrossRef]
  20. Hu, Y.; Zhao, J.H.; Zhang, D.F.; Zhang, Y.F. Seismic risk assessment of concrete-filled double-skin steel tube/moment-resisting frames. Earthq. Struct. 2018, 14, 249–259. [Google Scholar] [CrossRef]
  21. FEMA. FEMA 356 Prestandard and Commentary for the Seismic Rehabilitation of Buildings; FEMA: Washington, DC, USA, 2000.
  22. HAZUS. HAZUS Earthquake Loss Estimation Methodology. National Institute of Building for the FEMA; HAZUS: Washington, DC, USA, 1997. [Google Scholar]
  23. SEAOC. SEAOC Appendix I: Tentative Guidelines for Performance-Based Seismic Engineering; SEAOC: Sacramento, CA, USA, 1999. [Google Scholar]
  24. Ibarra, L.F.; Medina, R.A.; Krawinkler, H. Hysteretic models that incorporate strength and stiffness deterioration. Earthq. Eng. Struct. Dyn. 2005, 34, 1489–1511. [Google Scholar] [CrossRef]
  25. Muhummud, T. Seismic Behavior and Design of Composite SMRFs with Concrete Filled Steel Tubular Columns and Steel Wide Flange Beams. Ph.D. Dissertation, Lehigh University, Bethlehem, PA, USA, 2023. [Google Scholar]
  26. Lignos, D.G.; Krawinkler, H. Deterioration modeling of steel components in support of collapse prediction of steel moment frames under earthquake loading. J. Struct. Eng. 2011, 137, 1291–1302. [Google Scholar] [CrossRef]
  27. Ellingwood, B.R.; Kinali, K. Quantifying and communicating uncertainty in seismic risk assessment. Struct. Saf. 2009, 31, 179–187. [Google Scholar] [CrossRef]
  28. Soni, D.P.; Mistry, B.B.; Jangid, R.S.; Panchal, V.R. Seismic response of the double variable frequency pendulum isolator. Struct. Control Health Monit. 2011, 18, 450–470. [Google Scholar] [CrossRef]
  29. Dolsek, M. Simplified method for seismic risk assessment of buildings with consideration of aleatory and epistemic uncertainty. Struct. Infrastruct. Eng. 2012, 8, 939–953. [Google Scholar] [CrossRef]
  30. Tubaldi, E.; Barbato, M.; Ghazizadeh, S. A probabilistic performance-based risk assessment approach for seismic pounding with efficient application to linear systems. Struct. Saf. 2012, 36–37, 14–22. [Google Scholar] [CrossRef]
  31. Tubaldi, E.; Barbato, M.; Dall'Asta, A. Performance-based seismic risk assessment for buildings equipped with linear and nonlinear viscous dampers. Eng. Struct. 2014, 78, 90–99. [Google Scholar] [CrossRef]
  32. Kosic, M.; Fajfar, P.; Dolsek, M. Approximate seismic risk assessment of building structures with explicit consideration of uncertainties. Earthq. Eng. Struct. Dyn. 2014, 43, 1483–1502. [Google Scholar] [CrossRef]
  33. Asgarian, B.; Ordoubadi, B. Effects of structural uncertainties on seismic performance of steel moment resisting frames. J. Constr. Steel. Res. 2016, 120, 132–142. [Google Scholar] [CrossRef]
  34. Melani, A.; Khare, R.K.; Dhakal, R.P.; Mander, J.B. Seismic risk assessment of low rise RC frame structure. Structures 2016, 5, 13–22. [Google Scholar] [CrossRef]
  35. Kechidi, S.; Macedo, L.; Castro, J.M.; Bourahla, N. Seismic risk assessment of cold-formed steel shear wall systems. J. Constr. Steel. Res. 2017, 138, 565–579. [Google Scholar] [CrossRef]
  36. Jalayer, F.; Ebrahimian, H. Seismic risk assessment considering cumulative damage due to aftershocks. Earthq. Eng. Struct. Dyn. 2017, 46, 369–389. [Google Scholar] [CrossRef]
  37. Aghababaei, M.; Mahsuli, M. Component damage models for detailed seismic risk analysis using structural reliability methods. Struct. Saf. 2019, 76, 108–122. [Google Scholar] [CrossRef]
  38. Lu, D.G.; Yu, X.H.; Jia, M.M.; Wang, G.Y. Seismic risk assessment for a reinforced concrete frame designed according to Chinese codes. Struct. Infrastruct. Eng. 2014, 10, 1295–1310. [Google Scholar] [CrossRef]
Figure 1. Test specimens.
Buildings 13 02378 g001
Figure 2. Envelop curves of the test specimens.
Buildings 13 02378 g002
Figure 3. The PZ model of CFDST frame beam-to-column intermediate joints.
Buildings 13 02378 g003
Figure 4. The monotone curve of the improved IK model.
Buildings 13 02378 g004
Figure 5. The stress state of concrete filled in the CFDST column.
Buildings 13 02378 g005
Figure 6. Trilinear model of the CFDST frame beam-column PZ.
Buildings 13 02378 g006
Figure 7. Hysteresis model of Pinching04 material.
Buildings 13 02378 g007
Figure 8. Relationship between the force and deformation.
Buildings 13 02378 g008
Figure 9. Definition of the skeleton curve for the BRW.
Buildings 13 02378 g009
Figure 10. Comparison of FEM and test results.
Buildings 13 02378 g010
Figure 11. Response spectra in the Los Angeles region.
Buildings 13 02378 g011
Figure 12. Schematic diagram of the CFDST frame-BRW structure.
Buildings 13 02378 g012
Figure 13. Fragility curves of the models associated with the LA ensemble.
Buildings 13 02378 g013
Figure 14. Seismic hazard curves for Los Angeles.
Buildings 13 02378 g014
Figure 15. Seismic risk probability of the CFDST frame shear wall model.
Buildings 13 02378 g015
Table 1. First-order natural vibration period of the BRW model.
TypeSizeT1 (s)
CFDST
-BRW
The thickness of reinforced concrete is 120 mm, and the spacing between steel bars is 206.130 mm. It is distributed in two layers along the thickness direction of the plate. The diameter of the steel bars is 10 mm. The thickness of the protective layer is 20 mm1.415
Table 2. Fragility parameters for the models in the Los Angeles region.
ModelEarthquake GroupingmIOmSDmCPβR
CFDST-BRW10%/50 year0.2240.3901.0210.382
2%/50 year0.2080.3770.9830.391
Table 3. Seismic hazard parameters for the Los Angeles region.
ModelT1Sa (T1) (g)kk0 (×10−4)
10%/50 year2%/50 year
CFDST-BRW1.4150.5220.7854.0511.489
Table 4. Annual probability of limit state occurrence for the models in Los Angeles.
Structural ModelSeismic CategoryP [LSi] (×10−3)
IOSDCP
CFDST-BRW10%/50 year211.3722.360.45
2%/50 year302.1427.160.56
Disclaimer/Publisher’s Note: The statements, opinions and data contained in all publications are solely those of the individual author(s) and contributor(s) and not of MDPI and/or the editor(s). MDPI and/or the editor(s) disclaim responsibility for any injury to people or property resulting from any ideas, methods, instructions or products referred to in the content.

