

The Development of Health-Based Overheating Limit Criteria for School Buildings


1
Construction Research Centre, National Research Council Canada, 1200 Montreal Road, Building M-24, Ottawa, ON K1A0R6, Canada
2
Department of Building, Civil & Environmental Engineering, Concordia University, 1455 de Maisonneuve Blvd. West, Montreal, QC H3G1M82, Canada
*
Author to whom correspondence should be addressed.
Buildings 2024, 14(1), 165; https://doi.org/10.3390/buildings14010165
Submission received: 10 November 2023
/
Revised: 30 December 2023
/
Accepted: 2 January 2024
/
Published: 9 January 2024
(This article belongs to the Special Issue Nature-Based Solutions to Mitigate the Effects of Climatic Changes)
Abstract
:Overheating in school buildings can negatively affect the cognitive learning performance of particularly young students whose thermoregulation systems are still developing. However, currently, in schools, issues related to overheating have been addressed by limiting the exposure time to thermal discomfort. In this paper, the development of a general procedure that combines building and bioheat simulations to evaluate overheating risk in schools and generate health-based overheating limit criteria that may be applied in Canadian schools is described. General school building models, having either old or new constructions, were created based on a primary school building and successfully calibrated using field measurements of indoor temperature and humidity and published building energy use intensity data. Three sets of two limit criteria (exposure duration and severity of overheating) that account for the personal exposure conditions of students in primary, middle, and secondary schools were developed by limiting the body dehydration of students during extreme overheating events. Comparing the proposed limit criteria with the hour of exceedance criterion revealed interesting relationships between them, suggesting the proposed limit criteria as a benchmark for the comfort-based criteria, particularly for the more vulnerable primary and middle schools. The proposed procedure with the obtained overheating limit criteria is intended to be applied in any field or simulation study to assess the risk of overheating in similar school buildings under any local prevailing climate.
1. Introduction
Overheating in buildings’ interior spaces has recently received increased attention, given that overheating has been shown to be the direct cause of heat-related mortality [1,2,3]. Overheating risk arises from the combined effects of climatic heat waves, building characteristics and their operation, and the vulnerability of occupants to exposure to extreme heat. Future global warming is expected to increase the frequency and intensity of heat waves and, thus as well, increase heat-related mortality [4]. In school buildings, the primary factors affecting overheating risk include high internal heat gains (solar heat gains from large windows, lighting, high occupancy density, and equipment heat emissions) and poor space ventilation [5,6,7]. Students, particularly those in primary schools (under the age of 12 years), are the most vulnerable to heat, given that their thermoregulatory systems are still developing [8]. Although there have been very limited epidemiological studies reporting the heat mortality of students or children [8,9], overheating does affect the cognitive functions and learning performance of students [10,11]. It is, therefore, very urgent to address overheating issues in school buildings to combat the ever-increasing threat of future climate change and thereby protect the comfort, health, and wellbeing of students and teachers.
In Canada, there were approximately 14,600 public elementary and secondary schools as of 2020, of which primary schools made up 82% [12], which served approximately 5.2 million students [13]. The vast majority (>76%) of all schools are of older constructions, i.e., built before 1990 [14], and are poorly maintained [15]. On a national scale, about 36% of such school buildings do not have any form of space cooling [14]. Many schools suffer from poor indoor air quality due to poor space ventilation, as many classrooms have either non-operable windows or no windows whatsoever [16]. Recognizing these issues, the Canadian federal and provincial governments have invested millions of dollars to retrofit and improve the ventilation system of classrooms, particularly during the global COVID-19 pandemic [17,18]. Further studies are needed to evaluate post-pandemic retrofitted schools in regard to thermal comfort, the health of students, and overheating risk reduction.
Managing the risk of overheating in school classrooms not only requires identifying the vulnerabilities and resilience strategies of school buildings to heat exposure [19], as previously mentioned, but also understanding the physiological response of students and their adaptation to heat exposure. Indeed, school children under 12 years of age are undergoing constant body growth, and their thermoregulatory system is not fully developed, and, therefore, they respond to heat exposure differently than young adults [8]. Compared to young adults, children have a higher ratio of body surface area to mass but with lower sweating rates (per unit surface area and body temperature increase) [20,21]. Thus, children store less heat in their bodies and rely on dry heat dissipation with effective sweat evaporation [22,23]. Furthermore, children’s musculoskeletal system is less effective than adults’, thus producing more metabolic energy per unit of body mass for the same activity level [24]. As well, for children in rest conditions, their metabolic rate per unit of body mass is higher than that of young adults. In addition, children have lower cardiac output due to their smaller hearts, and under heat exposure, their thermoregulatory system diverts more blood flow to the skin surface for cooling, thus leaving less blood flow to the vital organs and working muscles [21]. Consequently, children rely more on dry heat dissipation than evaporative sweating, resulting in higher core and skin temperatures, which may put them at a high risk of heat injury under sustained heat exposure [25]. Strategies that increase dry heat dissipation (such as radiant cooling, using ventilation fans, or lowering the environmental temperature) are thus more suitable for school children than adults who rely more on evaporative sweating under heat exposure. Indeed, results from field studies have shown that students prefer ventilation fans after air-conditioning and lower setpoint temperatures for cooling as compared to adults [26,27]. As for the behavioural adaptation of children to heat, the latter is also limited and varies with their age, with younger children tending to rely on adults to avoid thermal discomfort [28].
2. Review of Existing Overheating Criteria for School Buildings
The existing criteria to evaluate overheating risks specific to school buildings are very limited, and most of these are based on thermal comfort (i.e., not health-related) with ad hoc and varying threshold limits. In England (UK), the Department of Education uses the regulations of the Building Bulletin 101 (BB101) [29] for free-running school buildings. In the previous edition of BB101 [30], three criteria were identified for overheating risk analysis during classroom-occupied hours (9:00 to 15:30) on weekdays from May to September. The first mandatory criterion limits the number of discomfort hours to 120 h when the operative temperature of classrooms remains above 28 °C. The second and third optional criteria limit the average difference between the indoor and outdoor air temperatures to 5 °C and cap the indoor operative temperature to a maximum value of 32 °C, respectively. Overheating is declared if at least two criteria are not met. These criteria were subsequently updated in BB101 [29] based on the guideline of the CIBSE TM52 [31]. The first revised mandatory criterion limits the discomfort hours to 40 h when the indoor operative temperature remains above the maximum temperature of the adaptive thermal comfort of the European Standard EN 15251 [32] during the period of 9:00 to 16:00 on weekdays for the entire summer for the months of May to September, including the holiday period as if the school were occupied. The other two criteria limit the daily weighted exceedance to 6 on any day and cap the indoor operative temperature to 4 °C above the maximum adaptive comfort temperature. These updated criteria can only be evaluated using building simulation and, therefore, are not practical for field measurement as schools are not occupied during the summer holidays. In New Zealand, the Ministry of Education [33] addresses overheating in schools by limiting the overheating hours during the occupied hours over the summer periods of October 10 to December 20 and February 1 to April 15. The overheating hours are not to exceed 80 and 40 h when the indoor operative temperature is above the threshold values of 25° and 28 °C, respectively. In North America, no standard or guideline exists that addresses overheating issues in school buildings. However, due to the increased high indoor air temperatures, reaching up to or exceeding 38 °C (100 °F), and their many associated health issues, as reported by teachers and students [34], some states in the US have started legislation to limit the maximum indoor temperature in school buildings to protect the safety and health of students, teachers, and support staff [35,36]. A temperature value of 27.8 °C (82 °F) was proposed for discussion to limit indoor temperatures in learning and support service spaces of school buildings.
The aforementioned specific criteria for school buildings, together with the criteria developed for other building types and academic research, have been widely used to evaluate overheating risk (by simulation and field measurement) in school buildings under the current climate and future projections. A summary of findings from prior studies related to the evaluation of overheating risk in school buildings is listed in Table 1. The study findings recommend reconsidering the threshold limits for overheating risk and account for the specific physiological and psychological needs of school children. Furthermore, subjective studies on overall (long-term) occupant discomfort and heat-related health effects are needed to benchmark the objective (deterministic) studies of overheating risk in school buildings. From the subjective side, overheating risk can be evaluated using occupant dissatisfaction surveys reporting overall thermal discomfort and any heat-related health symptoms [37].
The main aim of this paper is two-fold: (1) to develop new overheating limit criteria based on the heat-related health of students in educational buildings (primary, middle, and secondary schools) and (2) to explore any common background (relationships) for benchmarking the comfort-based limit criteria. This paper is organized as follows. After the subject introduction, details of the general simulation approach to generate the new overheating limit criteria are provided. This is followed by the Results section, which outlines the limit criteria for Canadian schools, as obtained from the results of simulations, and their comparison with selected comfort-based criteria for school buildings. Applications of the study findings are then discussed and elaborated, and their limitations are identified. Finally, the general simulation approach and study findings are summarized in the Conclusions section.
3. Method
The proposed method uses combined building and bioheat simulation to develop the overheating limit criteria specific to school buildings. The approach consists of the development of calibrated school building models and a general procedure to evaluate overheating risk and its relation to the selected heat-related health indicators as related to school students. The details of the approach follow.
3.1. Simulation Models of Representative Buildings
The simulation models of representative school buildings to evaluate the risk of overheating are built based on the orientation and geometry of a real primary school building, with construction characteristics representing typical or average values of construction practices for old and new school buildings for the chosen location. Two sets of school building models were developed for the partially retrofitted old and new school buildings in five representative Canadian urban locations (Ottawa, Toronto, Montreal, Calgary, and Vancouver). Partial building retrofit assumes that the roof, HVAC and lighting systems, and equipment are renovated to the requirement of the applicable building energy code.
3.1.1. Building Geometry
The real (monitored) primary school (PS) is a 3 + 1 storey building located on the Island of Montreal (Quebec). The building was built in 1930 and thereafter underwent six retrofits, including an extension in 1955, adding a boiler room in 2008, masonry in 2009, plumbing in 2014, new roof in 2015, and sanitary blocks and foundations in 2019. The school’s capacity includes 24 teaching staff and 396 students. Figure 1 shows the shape, orientation, and exterior views of the southeast and northwest facades of the building. The total width and length of the building are 46 m and 53 m, respectively. The dimensions of a typical classroom in the building are 9.4 m × 8.1 m.
The monitored building was built with exterior walls made of concrete blocks and solid brick masonry veneer claddings. The insulation level of the exterior walls is, however, not known. On the first floor, there are classrooms and offices, gym, and washrooms. Stairways and elevator shafts connect the basement to the upper floors. The second and third floors have similar layouts, with each floor being composed of several classrooms.
3.1.2. Building Construction
There was minimal information available for the envelopes and internal heat gains of the monitored (old) building. The available data were taken from the architectural drawings (e.g., dimensions, window sizes, glazing type, etc.) as obtained from the school board, building surveys, and site visits. The unknown data (e.g., envelope insulation levels, etc.) were, however, assumed to be typical for the construction practice at that time or retrofitted to the pre-current construction practice. In this regard, the details of the wall constructions for the building models of the old school were assumed typical of the 1980s, whereas the roof construction, lighting/HVAC systems, and equipment were assumed to be retrofitted to the previous edition of the National Energy Code of Canada for Buildings (NECB-2011) [45]. The whole building air infiltration rate was assumed to be equal to the average value reported in [46], which was 9 ACH@75Pa (7.75 L/s/m2) for old schools built from 1930 to 1975. For schools with new constructions, the leakage rate was assumed to be half of the average value for old schools, which was very close to the minimum value reported in [45]. The construction characteristics of the old and new (current) school building models are included in Table 2 and Table 3 below.
3.1.3. Internal Casual Heat Gains
The internal casual heat gains include those from diverse equipment (computers, printers, screen projectors, etc.), electrical lighting, and space occupants. The equipment and electrical lighting system of the old school building models were assumed to be renovated according to the current applicable building code NECB-2017 [48]. The operating schedules of these systems were also taken from NECB-2017. Table 4 summarizes the operation schedules and power densities for the internal casual heat gains of the old and new (current) school building models.
3.1.4. Building HVAC System
The heating system of the monitored building used electric baseboard heating for all heated spaces. This applied to the gym, classrooms, library, offices, halls, and stairways. There was, however, no central cooling or ventilation system in the building, and the classrooms were naturally ventilated by opening windows and using portable fans (in some classrooms). For both the old and new school building models, the electrical baseboard heating system is retained, but central cooling and ventilation systems consisting of three packaged rooftop units are installed to provide the ventilation and cooling needs of all thermal zones (except the gym) of each building floor. Each packaged rooftop unit consists of outdoor air mixing box, heat recovery unit, direct expansion cooling coil, and variable air volume (VAV) supply fan. The VAV fan of the old building models runs intermittently with the cooling system and is off when there is no cooling demand. However, for the new building models, the VAV fan runs continuously to supply the required minimum flow rate of the outdoor air to the served spaces.
3.1.5. Building Thermal Zoning
Each classroom space is treated as a single thermal zone. Likewise, offices, libraries, gyms, corridors, and washroom spaces are treated as single thermal zones. The stairwell shaft is split into vertically stacked thermal zones, linked to each other by horizontal holes (fictitious windows). Figure 2 shows a three-dimensional view of the modelled building facades, and Figure 3 and Figure 4 show the thermal zones of each building floor.
3.2. Airflow Network Model
The air flow network model (AFN) of the EnergyPlus program v9.2 [48] is applied to the building thermal models to link the outdoor environment, air infiltration or exfiltration (through building exterior surfaces), mechanical ventilation (through exhaust fans), and natural ventilation (through window openings) with the indoor thermal simulation. The AFN is composed of the following main components:
- Air leakages through the external building surfaces (roofs, walls, exterior doors, non-operable windows), which are handled as leakages through cracks with mass flow coefficients calculated based on the air leakage rate of the whole building (Table 2) by assuming a uniform leakage distribution per surface area;
- Air leakage through the external openable windows (handled automatically in EnergyPlus) based on their openness factor and operation schedule. Windows can be opened only during the space occupancy hours on weekdays if natural ventilation is activated; otherwise, they are closed;
- Air leakage through the horizontal fictitious windows (holes) connecting hollow spaces such as stairwell shafts (handled automatically in EnergyPlus);
- Air leakage through the partially open internal classroom doors leading to the corridor spaces (handled automatically based on their openness factor);
- Air leakage through the closed internal doors of offices, library, gym, stairwells, and corridors. The air leakage data of these components are taken from the air leakage databases of building components of Ricketts [49];
- Exhaust fans (in washroom spaces) are connected to the AFN.
3.3. Building Model Calibration
The school building models with new and old constructions are calibrated using the field measurement of the indoor conditions (air temperature and relative humidity) of the monitored PS building and published (measured) energy use intensity (EUI) data of similar Canadian school buildings.
For thermal calibration using the field measurement data, the general PS building simulation model with old construction was set up to replicate the real school building based on the available construction input details collected during the surveys and site visits, as mentioned before. The unknown construction input data of the real school building, such as the whole-building air leakage rate, internal casual heat gains, and other parameter values, are, however, kept equal to the default average or typical values of the general PS building simulation model. This manual calibration approach (without fine-tuning of the model input values) is adopted in this study rather than using the automated calibration approach in which the values of the many unknown model input data are adjusted or fine-tuned to minimize the deviations between the model predictions and the limited measured indoor conditions for the following main reasons among many. First, the interior space usage and operation (e.g., lighting power density, occupancy density, equipment power density, and operation of internal doors, openable windows, solar shadings, etc.) of the entire building, including the monitored classrooms, were unknown, and therefore, they had to be assumed. Second, the limited samples of the monitored classrooms were not large enough to permit adjusting the unknown values of the many construction parameters of each building space (or thermal zone), thereby avoiding any unrealistic values of parameter combinations that would result from an optimization calibration procedure. For example, the optimization procedure would not capture the standard value of the whole building air leakage rate (driven by vertical stack and wind pressure effects) due to the weak stack effect in warm summer conditions and the dominance of natural ventilation driven by wind pressure. Third, the intent of the adopted calibration approach was to obtain an order of magnitude on realistic absolute values of the indoor conditions (air temperature and relative humidity), as predicted by a general school building model having typical or average construction data, compared with real buildings with various construction characteristics. The magnitudes (absolute values) of the indoor conditions are very important to analyze the risk of overheating, and any misestimation will influence the interpretation of the overheating results. This manual calibration approach has previously been successfully applied to long-term care homes [37] and senior social housing.
3.3.1. Field-Monitored Data
Indoor sensors of air relative humidity and temperature were installed in classrooms 301, 302, 305, and 306 (Figure 4). However, during the monitoring period, the exterior walls and windows of classrooms 305 and 306 were being retrofitted and, therefore, were excluded from the building model calibration. The model calibration used the measured data of classrooms 301 and 302. The operable windows of classrooms, offices, and the library were assumed to have been opened manually during the occupancy period if the indoor air temperature exceeded both a fixed setpoint value and the outdoor air temperature. The control setpoint temperature was fixed at 26 °C (equivalent to a slightly warm thermal sensation (TSV = 0.5) of a reference adult person wearing typical summer clothing with 0.57 clo). The window average opening factor was set to 16% (calculated based on architectural drawings and site observations). The internal doors of the classrooms were assumed to be open by an average openness factor of 25% during the classroom hours from 8:00 AM to 4:00 PM on weekdays (to account for short breaks between classes); otherwise, they were closed. Internal doors of stairwells connected to the corridor spaces were set closed at all times to comply with the applicable fire code of buildings. The simulation model was run for the monitoring period from 4 August to 30 September 2020 (school was not occupied in August, and therefore, the corresponding internal heat gains were zeroed) using the local measured outdoor conditions (temperature, relative humidity, wind speed, global solar radiation).
Figure 5 compares the measured and predicted values of the indoor air temperature and relative humidity of classrooms CR301 and CR302, as well as their classroom averages. The simulated model of the PS building predicted the trend of the classroom indoor temperature very well. The simulated peak temperature, which occurred in the afternoon, was higher than the measured value by up to 2 °C. This deviation could be, among other factors, attributed to the onsite retrofit work that was conducted during the monitoring period when the school was closed for study in August. Overall, the simulation results are in very good agreement with the measurement data for the classroom average temperature, particularly when the school was open for study in September. Similarly, the simulation results for relative humidity (RH) were also in very good agreement with the measurement data. As expected, the indoor RH followed the trend of the outdoor RH very well when either the school was closed for study in August or opened in September (indicating student/teacher interaction with window opening).
Table 5 summarizes the values of the mean bias error (MBE) and root mean square error (RMSE) of relative humidity and temperature calculated for each classroom space and their mean values. These error indices are adopted in ASHRAE Guideline 14 [50] for building water and energy consumption. The calculated range of MBE-T (1 to 2%) is within the accuracy limit of ±10% of ASHRAE [50]. The corresponding range of RMSE-T (1.3 °C to 1.4 °C) is also within the accuracy limit of 1.5 °C, as recommended by [51] for the temperature prediction in naturally ventilated buildings. As for the relative humidity, the prediction accuracy is slightly lower than that for temperature, with average MBE-RH of −2% and average RMSE-RH of 5.6%.
3.3.2. Building Energy Use Intensity Data
Furthermore, for the calibration exercise of the simulation model for the monitored building, the general PS building models with old and new constructions were calibrated using public (measured) data on energy use intensity (EUI) of similar school buildings as reported in various Canadian energy use databases. To this end, the following assumptions were used to calibrate the predicted EUI:
- The service hot water (SHW) energy use was not included in the model prediction but is calculated based on the boiler seasonal efficiency and typical SHW loads and usage schedules for school buildings as taken from NECB-2017 (65 W/person for classrooms and 90 W/person for offices). The boiler seasonal efficiency was fixed at 60% for old construction and 75% for new construction [52];
- The corresponding annual energy use of SHW was estimated to be 36,176 kWh;
- For spacing heating, a natural gas furnace system was used with an assumed furnace efficiency of 80% for old construction and 90% for new construction. The energy use for the electrical baseboard heating system of the simulation model was therefore converted to gas furnace heating using the aforementioned furnace eficiencies;
- For the annual building cooling energy use, the coefficient of performance (COP) was fixed at 3 for new and retrofit construction and 2.5 for old construction;
- The exterior lighting system was not included in the building simulation model and, therefore, was not accounted for in the EUI.
The aforementioned general PS building models for new and old constructions were run for six representative Canadian urban locations. The model for old construction assumes insulated walls with a U-factor of 0.5 W/m2 K, and that for roofs was 0.459 W/m2 K. Table 6 compares the simulated total EUI data (for cooling, heating, lighting, and SHW) and electricity energy usage with published benchmark data on PS buildings across Canada. The total building heated area without the basement space was 4221 m2. The published EUI data show great variability with construction types and building locations. The predicted EUI and electricity use for both old and new buildings were within the reported ranges of real buildings. The predicted EUI for new buildings was close to the energy target of new school buildings as set in [53]. For old school buildings, the predicted EUI data was close to the national average of school buildings, as reported by NRCan [54].
3.4. Procedure to Evaluate Overheating Risk
The general procedure to evaluate overheating risk in buildings was presented in previous studies [37,60]. Specific details related to school buildings are provided below.
3.4.1. Identification of Overheating Events
The Standard Effective Temperature (SET) metric is used as a heat stress index to calculate overheating risk. Overheating events are characterized by three attributes: duration (DUR, days), intensity (INT, °C), and severity (SETH, °C·h). The duration of overheating events is the number of consecutive days (N) for which the cumulative positive deviation of the hourly values of SETτ from its threshold value (SETd) on each day exceeds a minimum value fixed to 4 °C·h. The severity attribute indicates the cumulative heat stress over the overheating event period, as provided by Equation (1). The intensity is the ratio of severity to duration (SETH/(DUR*24)). Overheating events are distinguished from each other if they are separated by at least one recovery day with the daily cumulative deviation (SETτ − SETd) lower than or equal to its fixed minimum value (4 °C·h). For educational buildings where interior spaces are not occupied during nighttime, the severity of overheating events in occupied spaces is expressed as follows:
where
: day index of the overheating event period;
: duration of an overheating event (days);
: start time of space occupancy (h);
: end time of space occupancy (h);
: hourly value of SET of the space being occupied at hour () (°C);
: time step resolution (h).
Evaluation of Equation (1) requires known threshold values of SETd and a reference person being under direct exposure to indoor heat events to evaluate SETτ. The threshold value SETd is chosen depending on the type of building space and occupant’s vulnerability to heat under the local climate. In this paper, educational buildings are distinguished as primary schools (age 6–12 years), middle schools (age 13–15 years), and secondary (high) schools (age 15–18 years). Up to three values of SETd should, therefore, be considered for classroom spaces of each school type. Students of primary schools are the most vulnerable to heat due to their limited behavioural adaptation to heat, followed by students of middle schools and then students of secondary schools. Those students of secondary schools can be assumed to be young adults with full behavioural adaptation to heat. Therefore, for primary/middle school buildings, SETd is calculated to maintain neutral thermal comfort conditions (thermal sensation vote, TSV < 0.5), whereas, for secondary school buildings, SETd is calculated to maintain thermal comfort conditions up to slight sweating or slightly warm thermal sensation (TSV < 1.5). The comfort range up to TSV = 1.5 is where people can usually adapt to heat to restore thermal comfort by using simple means such as reducing activity level, wearing light clothing, using ventilation fans, etc. For students naturally acclimatized to the local warm/hot climate, a value of 1.2 °C is added to SETd [61]. Table 7 lists the suggested threshold values of SETd for school buildings, which are calculated for a reference adult person in a sedentary position using the general model of the metabolic-based predicted mean vote index (MPMV) by Laouadi [62]. Note that in the table, the corresponding threshold operative temperature (To) is also shown for the standard indoor conditions of relative humidity of 50% and air speed of 0.15 m/s. Due to their age-related physiological and psychological differences compared with adults, as pointed out in the introduction, school children usually have a wider range of thermal comfort conditions (i.e., a lower slope of TSV vs. To), as determined from the results obtained in various field studies [27,63]. The threshold values of SETd and To in Table 7 are within the reported thermal comfort range of operative temperature between 16 and 30.7 °C in temperate and tropical climates for students in various educational buildings [64]. Similarly, De Dear et al. [63] found a common neutral range (TSV within ±0.5) with operative temperatures between 18.4 and 26.4 °C, and the operative temperature corresponding to TSV = 1 was 30.5 °C in Australian primary and secondary schools with and without air-conditioning in the late summer season period.
3.4.2. Health Indicators to Limit Overheating Risk
Indoor overheating events, as identified by Equation (1), are the results of the outdoor environment conditions and internal heat buildup. Various types of overheating events having different attributes (duration, severity, and intensity) are therefore expected in hot weather seasons. Furthermore, due to the internal heat buildup, indoor overheating events may begin before and terminate after the outdoor heat wave events. To avoid any heat-related health symptom or injury that would impair student cognitive functions and learning performance and to declare a school building is safe for occupancy, these various types of overheating events have to be subject to some limit criteria. The proposed approach to developing such limit criteria is based on protecting the health of students, as described in detail in [37], by limiting the cumulative body dehydration of students due to sweating, insufficient water and electrolyte replacement, and maximum body core temperature during the overheating events. Table 8 lists the suggested threshold limits for body maximum core temperature and dehydration and rehydration levels of children in primary, middle, and secondary school buildings for overheating risk analysis.
The suggested threshold limits in Table 8 are selected from the practical ranges as reported in various field survey studies on dehydration levels of school children and nutritional studies of children. In hot climates, most (60% to 84%) school children are found dehydrated by drinking less than their recommended daily fluid intake, with a hydration rate varying from 50% to 62% [67,68,69,70,71]. Similar studies in temperate climates found a daily hydration rate of 58.5% of a large sample (1054) of school children (ages 9–13 years) [72]. Body dehydration is well known to affect the cognitive functions and learning performance of children in schools [69]. For healthy adults, the International Standard Organisation [73] recommends the maximum allowable dehydration rate of 3% of body weight in industrial workplaces and indicates that higher dehydration rates are associated with increased heart rates and reduced sensitivity to sweating due to reduced blood plasma volume. Similarly, a body dehydration level as low as 2% in adults may result in a significant deterioration in mental functions (short-term memory, arithmetic ability, and visuomotor tracking) [74]. As for body core temperature, children are known to have a higher core temperature than adults at the same activity level due to their higher metabolic rate [8]. The international standards for heat exposure in workplaces set a maximum value for the core temperature to 38 °C for healthy adults under continuous heat exposure of up to eight hours [75,76,77]. This temperature limit may not, however, be suitable for school children to avoid any effect on their cognitive functions and learning performance under sustained heat exposure for many days.
3.4.3. Overheating Limit Criteria
The limit criteria to declare a building space is overheated is to compare the attributes (DUR, INT, SETH) of various types of overheating events during the evaluation period of hot weather conditions with their limit values (DURL, INTL, SETHL). Overheating is declared if at least the duration, intensity, or severity attribute reaches or exceeds the limit value shown below:
DUR ≥ DURL; or INT ≥ INTL; or SETH ≥ SETHL
To evaluate Equation (2), relationships between the overheating attributes (DUR, INT, SETH) and the aforementioned health indicators should be determined. Our previous work on overheating in residential buildings found that the severity and duration attributes correlate well with the cumulative body dehydration level, and the intensity attribute correlates well with the maximum body core temperature [60]. Body dehydration and core temperature are calculated using the two-node physiological model for young adults of Ji et al. [78].
3.4.4. Simulation Procedure
Combined building and bioheat simulations are used to establish the relationships between the attributes of overheating events and the health indicators. To cover the many types of overheating events, representative school building models with new and old constructions with various overheating passive mitigation measures should be simulated in multiple urban locations that have extreme weather data files that cover the historical period and future climate projections to bracket the overheating risk in such buildings. However, applying such a procedure to school buildings requires a special handling in that schools are only occupied during the daytime on weekdays of the school summer calendar (not covering the entire summer period from May to September). Weekends may, therefore, be considered relief days for which students are in their homes and are thus assumed to be fully hydrated with minimal heat stress. Consequently, the duration of overheating events is capped at five days and only accounts for the extreme outdoor heat waves that cover weekdays during the school summer calendar. Another challenge when evaluating the overheating risk in schools is the proper selection of local extreme weather files for building simulation. The latter are usually developed to cover extreme heat waves over the entire summer period. Extreme heat waves are more likely to occur in the months of July and August, and during those months, schools are closed (except for summer schools). Therefore, to evaluate overheating risk in schools, extreme weather files should include heat wave periods in the school summer calendar (covering the months of May, June, and September, as in Canada). These heat waves are usually milder than those in the months of July or August. In this work, the local extreme weather files for overheating risk analysis in schools were selected from the three proposed types of extreme summer weather years [61] to comply with this requirement. Table 9 lists the local extreme weather files used for the simulation for each selected urban city. These extreme summer weather files were extracted from sets of 31-year hourly weather data for the historical period (1986–2016) and future mid-century climate projections with a global warming of GW = 2 °C (2034–2064) using the simulated climate data of [79] and methodology of [71].
It should be noted that the proposed approach to evaluate overheating risk in school buildings (Equation (1)) is based on personal exposure conditions that involve tracking all building spaces occupied by the same students during a period of a complete day (24 h). In this regard, the cumulative effects of heat on students can be quantified and carried over from day to day. This approach is different from the one that evaluates overheating risk in fixed building spaces (e.g., classrooms only) independently of other spaces that may be occupied by the same students during different daytime periods. More details on the proposed approach may be found in [37]. Following this approach, the space occupancy schedule in Canadian educational buildings is assumed to start from 8:00 AM and end at 4:00 PM. For this time period, occupants (students) are assumed to dwell in their classrooms with some hours spent in the gymnasium in the morning (library and corridor/hall areas are excluded due to their short occupancy periods, <hour). Table 10 shows the time slots of school spaces where students spend their time during a 24 h period.
4. Results
4.1. Overheating Limit Criteria
The calibrated model of the PS building with new and old constructions is simulated in five Canadian urban locations (Ottawa, Montreal, Toronto, Calgary and Vancouver). Simulations covered free-running schools with natural ventilation and other passive measures to mitigate overheating risk, such as interior and exterior shading devices.
Figure 6, Figure 7 and Figure 8 show the plots of the overheating attributes (DUR, INT and SETH) versus the cumulative body dehydration and maximum core temperature. Based on these results, there are two limit criteria for primary schools, duration (DURL) and severity (SETHL), which are provided as follows:
There is, however, no limit to the intensity (INT) attribute for the selected Canadian locations. This means that body dehydration and inadequate water and electrolyte replacement of students in primary schools are the primary causes of heat-related health issues. Fortunately, body dehydration and rehydration may be controlled, and the health risk can, thus, be prevented.
Due to similar space occupancy patterns (Table 10), overheating evaluation in middle and secondary schools follows the same analysis as in primary schools, except that the threshold values of SETd and the assumed body dehydration rate in middle and secondary schools are different (Table 8). The calibrated model of the PS building is also used for middle and secondary schools.
Based on the inputs in Table 8 and Figure 6, Figure 7 and Figure 8, there are only two limit criteria for middle schools, which are as follows:
For secondary schools, the simulation results of primary schools are post-processed using the inputs in Table 7 to calculate the attributes of overheating events. Figure 9 and Figure 10 show the plots of the overheating attributes (duration and severity) versus the cumulative body dehydration in secondary schools. Similar to primary/middle schools, there are two limit criteria for secondary schools, which are as follows:
4.2. Inter-Comparison of Overheating Criteria
The overheating limit criteria developed for school buildings are compared with the BB101 criteria, which have been widely adopted in England (UK) for educational buildings [80]. The BB101 criteria apply to all school types. In this study, the first mandatory criterion—hour of exceedance (HE)—is selected as being suitable for comparison with the obtained limit criteria of duration and severity of overheating events (DURL, SETHL). In the old version of BB101 [30], a classroom is declared as overheated if the calculated HE exceeds 120 h during the occupied hours from May to September (total occupied hours of 562 h, excluding lunch breaks and the vacation month of August in UK schools). In terms of percentage, in the UK, 120 h corresponds to 21% of the summer school occupied hours. For the new criterion of BB101 [29], the HE is fixed to 40 h (5% of the total hours of 763 h) during the five summer months (May–September) on weekdays (9 AM to 4 PM).
In this comparison study, the old and new BB101 criteria are applied to all school types at the Montreal (Quebec) location, but with some adjustments to account for the occupied hours of the Canadian school summer calendar. In Montreal, classrooms are occupied from 9 AM to 4 PM on weekdays from May 1 to June 23 and August 30 to September 30. The total occupied hours are 430 h. In this regard, the 21% HE limit of old BB101 [30] corresponds to 90 occupied hours, and the 5% HE limit of new BB101 [29] corresponds to 21 occupied hours. The adaptive comfort model of ASHRAE 55 [81] is used in the new BB101 criterion instead of the European standard EN 15251 [32].
The simulations were conducted for buildings with old (O) and new (N) constructions under the historical climate (H) and future mid-century projected climate (F). Four overheating measures were simulated, including a free-running reference building with internal blinds covering classroom windows during the day (Ref), Ref + closed exterior shading devices on classroom windows (ES), Ref + classroom windows opened when the indoor air temperature is higher than both the outdoor air temperature and a fixed setpoint temperature of 26 °C (VO), and Ref + air conditioning in the common spaces of library/offices and corridor/hall areas, excluding the gym (CONC).
Figure 11 and Figure 12 show the outdoor temperature (Tout) and indoor air temperature to which students of classroom #206 (having southeast-facing windows) are exposed according to the schedule provided in Table 10 in primary school buildings with old and new constructions and different overheating measures during an extreme overheating event (22–26 May 2010). School buildings with new construction are warmer than school buildings with old construction, particularly for buildings without natural ventilation, for which the peak temperature difference may reach up to 1.5 °C. All simulated strategies are effective in reducing indoor air temperature but are not sufficient to eliminate the risk of overheating in the selected classroom.
Figure 13 shows plots of the duration and severity indices (DUR, SETH) versus HE of the old BB101 criterion for primary and middle school buildings. These relationships appear to be smooth, with fewer data scattered at the first tenths of HE, but they become highly scattered thereafter. The scatter of the data indicates that the HE method captures more overheating events during the summer evaluation period, which are independent of the single extreme overheating event of the proposed method. For primary schools (PS), the proposed method in terms of DUR and SETH indices predicts that most classrooms are overheated (except a few of them with the CONC measure). Likewise, the old BB101 method predicts that most classrooms are overheated, but a significant number of them are not. This method is, therefore, somewhat lenient, not capturing some overheating events, and in order to be consistent with the proposed method, its HE should be reduced to 32 h to avoid any effect on the health or cognitive learning performance of students due to their body dehydration during long overheating events. It should be noted that the suggested HE of 32 h is close to the new BB101 criterion (5% of the occupied hours or 21 h). For middle schools (MS), both the proposed and old BB101 methods predict that most classrooms are overheated, but a significant number of them are not. In order for methods to be consistent, the HE of the old BB101 method should be reduced to 75 h (or 17% of the occupied hours).
Figure 14 shows plots of DUR and SETH versus HE of the new BB101 criterion for primary and middle school buildings. The plots show high data scattering at high values of HE (>50 h), indicating weak relationships between the proposed and new BB101 methods. For primary schools, both the proposed and new BB101 criteria are consistent and predict that the vast majority of classrooms are overheated (except for the few ones with the CONC measure). However, for middle schools, the proposed method predicts that most classrooms are overheated, but a significant number of them are not, which makes it different from the new BB101 method. In order for both methods to be consistent for middle schools, the HE of the new BB101 method should be increased to 75 h to cover at least eight overheating events in the summer school occupancy period.
Figure 15 shows plots of DUR versus HE of the old and new BB101 criteria for secondary school buildings. The plots show a high data scattering, indicating weak relationships between DUR and HE. The proposed method is not consistent with both BB101 criteria in that it predicts that most classrooms are not overheated, but a significant number of them are. This is not the case for the BB101 criteria, which predict that almost all classrooms are overheated. In this regard, the HE methods of BB101 are not suitable for secondary schools where students are assumed well adapted to warm temperatures in summer, particularly in warm/hot climates.
5. Discussion
This study presents a general simulation procedure to evaluate overheating risk in school buildings and from which health-based limit criteria can be generated under any prevailing local climate. The procedure includes developing calibrated building models, identifying interior overheating events, selecting health indicators, and conducting simultaneous building and bioheat simulations to draw relationships between attributes of overheating events and health indicators.
The results from the calibrated building models reveal similar findings to those of our previous work on long-term care homes [37]. Indeed, calibrated building models, built on the real (representative) geometry of buildings with average or typical local construction data, internal casual heat gains, and whole building air infiltration rates, produce indoor conditions very similar (with the same order of magnitude) to real settings if a proper software tool, capable of modelling heat and moist air flows in buildings, such as EnergyPlus [48], is used. It follows that general archetype or prototype (not calibrated using field data) building models properly zoned to address overheating risk can be used to develop similar overheating limit criteria using proper input values of SETd and student dehydration/rehydration levels (Table 7 and Table 8) specific to the local climate and population.
Identification of extreme overheating events over the summer months is very important to analyze the risk of overheating in any building type. These extreme overheating events may coincide with the extreme outdoor heat waves but may begin before and terminate days after the heat wave. This is in line with epidemiological studies, which indicated that heat mortality continued to be reported a few days (lag time) after heat waves [1,2,82]. Furthermore, extreme overheating events may result from mild outdoor heat waves, depending on the internal heat gains and space ventilation of buildings. Therefore, extreme summer weather files used for building simulation to analyze overheating risk should include extreme heat waves in the school summer calendar to account for the proper solar heat gains (which would be more significant for early or late summer sunny days than around the mid-summer due to lower solar altitude angles) and internal casual heat gains of occupied building spaces.
The proposed approach to analyze overheating risk in school buildings is based on the personal exposure conditions that students experience during the overheating event period. This approach involves tracking all building spaces occupied by the same students while they are in school. Therefore, the heat stress felt by students and its day-to-day cumulative effect on their health and cognitive learning performance during the overheating event period is not restricted to the classroom environment conditions but also to other spaces such as the gym, corridor/hall areas, library, and other building spaces. In this regard, strategies to mitigate overheating risk not directly related to classrooms (such as corridor ventilation, cooling of common spaces, etc.) can be evaluated. This approach is, however, different from the one that involves evaluating overheating risk when students are only in classrooms (fixed space approach).
The proposed overheating limit criteria are developed on the basis of maintaining a certain level of thermal comfort (Table 7) and limiting body dehydration and core temperature (Table 8) to avoid any cumulative effect on the health and cognitive learning performance of students. As the comfort requirement and heat vulnerability of students vary with the student’s age (younger students are more vulnerable than older students), the three stages of educational buildings are distinguished: primary (6–12 years), middle (13–15 years), and secondary schools (16–18 years). In this study, neutral comfort levels (TSV < 0.5) are considered for primary/middle schools, and comfort levels up to a slightly warm sensation (TSV < 1.5) are considered for secondary schools. In this regard, the limit criteria for primary schools are more stringent and should be applied to schools where students have limited natural and behavioural adaptation to heat, such as in cold climates with temperate summers. The limit criteria for secondary schools are, however, more relaxed, assuming that students have opportunities to adapt to heat in locations with temperate summers or locations where students are naturally acclimatized to heat in warm/hot climates. The limit criteria for middle schools are in between primary and secondary schools with moderate stringency and, therefore, should be applied in any local climate or replace those for secondary schools if more stringency is required. If only one set of limit criteria is required to be applied to all school education stages (such as K-12 schools with all levels of education), we recommend using the limit criteria for primary schools in cold climates and the limit criteria for middle schools in warm, hot, or humid climates. Furthermore, we recommend using the limit criteria for middle schools if the school building includes both the middle and secondary education levels.
A comparison of the obtained (health-based) limit criteria (DURL, SETHL) with the (comfort-based) HE limit criterion of the old and new BB101 methods reveals interesting relationships between them, indicating that the old BB101 criterion is suitable for middle schools, whereas the new BB101 criterion is suitable for primary schools. Furthermore, caution should be exercised in applying the comfort-based HE criterion to overheating mitigation measures that are not directly related to classrooms (such as the CONC measure). These findings suggest the use of the proposed method as a benchmark for comfort-based methods when they are applied to school buildings. Further research covering schools in other local climates is needed to consolidate these findings.
The limitations of this study are noted below:
- The general building models were calibrated using the manual calibration approach [83] in which the many unknown input data of the model (envelope construction data, lighting and equipment power densities, space occupancy density, building air leakage rate, operation of windows and interior doors, etc.) are filled by typical or average values of similar real buildings and using some assumptions for the space operation (e.g., controls of window and interior door openings) without any fine-tuning of parameter values. This approach is adopted due to the limited monitoring data of the building spaces (only measurement of indoor and outdoor conditions). However, the model calibration could be further improved using the automated calibration approach and sensitivity analysis in which the unknown values of the main influential parameters are fine-tuned using a statistical or optimization procedure to minimize the error between the simulation and measurement.
- The overheating limit criteria for the three school education stages (Equations (3)–(5)) are developed for healthy students based on some assumptions for their daily rehydration levels (Table 8). However, Figure 6, Figure 7, Figure 9 and Figure 10 can be used to deduce the limit criteria for other real-life values of student rehydration levels specific to given geographical locations. Furthermore, these limit criteria should not be applied to students with special learning needs (due to their disability or learning problems).
- The limit criteria are obtained for Canadian schools under typical cold climates with temperate summers. Under such or similar climates, the body dehydration of students seems to be the only health indicator to account for in overheating risk analysis (the core temperature hardly reaches its limit value, as in Figure 8). Fortunately, body dehydration can be prevented by making cool drinking water available to students in schools and urging them to rehydrate themselves to compensate for the sweating water loss during heat events. However, the situation may be different under other local climates, such as warm, hot, or humid climates where the core temperature may reach its limit value under short exposure times (a few hours), and a third limit criterion (INTL) would be needed to be considered. In this case, the procedure of Section 3.4 should be followed to develop specific criteria with input data, such as those in Table 7 and Table 8, that are suitable for the local climate and population.
6. Conclusions
In this paper, a general simulation procedure was developed and applied to evaluate overheating risk in school buildings under any prevailing local climate, and health-based limit criteria for Canadian schools were generated. The procedure is composed of four steps: (1) the development of calibrated school building models; (2) the identification of overheating events; (3) the selection of suitable heat-related health indicators and their threshold values; and (4) conducting simultaneous building and bioheat simulations to determine relationships between attributes of overheating events (duration, severity, and intensity) and health indicators. The proposed overheating limit criteria for Canadian schools were also compared with the comfort-based BB101 methods for the purpose of finding a common relationship for both types of overheating limit criteria.
Two sets of calibrated building models of primary schools with old and new constructions in five Canadian urban locations (Ottawa, Montreal, Toronto, Calgary, and Vancouver) were developed based on the real shape and form of a primary school building. The old school building models represented typical old construction practices of the 1980s at the selected locality, but with a partial retrofitting for the roof, interior lighting and HVAC systems, and other equipment according to the applicable building energy code (NECB-2011). The air leakage rate of the whole building was taken from published average data of similar old school buildings. The new school building models represented the current construction practice at the selected location with model construction inputs taken from the current building energy code requirements (NECB-2017) and published data on air infiltration rates of recent school buildings. The school building models were calibrated using the measured indoor conditions of relative humidity and temperature of the monitored primary school building and published energy use intensity (EUI) data of similar real school buildings in different Canadian locations. For the thermal calibration, the input data of the old school building model were adjusted by accounting for the given input data of the monitored building but the unkown inputs of the monitored building were kept equal to the default values of the general building model. The time-series simulation data obtained for the monitored school building model showed a very good agreement with the field measurement of indoor temperature and relative humidity of classrooms, with an RMSE-T lower than 1.4 °C and an RMSE-RH lower than 6%. Similarly, for the energy calibration, the school building model predictions were within the reported EUI range of real school buildings. The model calibration work highlighted an important finding for the building simulation community that the use of general archetype building models (which cannot be calibrated using field environmental data) with average or typical input data at a given location can be used to carry out overheating risk analysis by reproducing indoor conditions of temperature and relative humidity very close (within the same order of magnitude) to real situations.
The proposed general simulation approach to evaluate overheating risk in school buildings uses personal exposure conditions that students experience in different spaces of the school building, including classrooms, gyms, and other building spaces. These personal exposure conditions can directly affect the health and cognitive learning performance of students during heat events. As the leading causes of mortality during heat waves [84], body dehydration from sweating, insufficient water and electrolyte replacement, and maximum body core temperature were selected as health indicators to develop overheating limit criteria for safe occupancy in educational buildings during extreme heat events. Combined building and bioheat simulations were used to establish relationships between attributes of overheating events (DUR, INT, SETH) and the health indicators, and then the limit criteria were developed by capping the attribute indices. Due to age-dependent thermal comfort requirements and the heat vulnerability of students (younger students require cooler conditions and are more vulnerable to heat than older students), the three stages of educational buildings were distinguished as primary (6–12 years), middle (13–15 years), and secondary (16–18 years) by maintaining neutral comfort levels (TSV < 0.5) for primary/middle schools and comfort levels up to a slightly warm sensation (TSV < 1.5) for secondary schools. The proposed simulation procedure was applied to the calibrated building models of primary schools under the Canadian cold climate conditions, and the results were extended to the middle and secondary school buildings due to similar space occupancy patterns.
The obtained limit criteria for the three educational stages indicated that body dehydration is the only health indicator to consider in Canadian school buildings (the body core temperature did not reach its limit value). In practical applications, the body dehydration of students is largely preventable by making cool drinking water available in schools and allowing students to regularly rehydrate themselves during heat events. On the one hand, the limit criteria for primary school buildings can be considered stringent and should be applied in school buildings where students are expected to have limited natural and behavioural adaptation to heat, such as in cold climates with temperate summers. On the other hand, the limit criteria for secondary school buildings are considered less stringent by assuming that (older) students can freely adapt to heat in locations with temperate summers or are naturally acclimatized to heat in warm/hot climates. The limit criteria for middle school buildings have an intermediate degree of stringency and should, therefore, be applied to schools providing the middle level or both the middle and secondary levels in any local climate or replace those of secondary school buildings if a greater degree of stringency is required at given climate conditions. In school buildings with all levels of education (such as K-12 schools), it is recommended that the limit criteria for primary school buildings in cold/temperate climates be used, and with respect to buildings located in warm, hot, or humid climates that the limit criteria for middle schools be used. However, for the latter climates, a third criterion (INTL) might emerge to limit the body core temperature. In this case, the procedure of Section 3.4 should be followed to develop the appropriate limit criteria for the given local climate and population.
A comparison of the (health-based) limit criteria obtained with the (comfort-based) hour of exceedance (HE) limit criterion of the old and new BB101 methods, as applied to Canadian schools, revealed interesting relationships between them, indicating that the old BB101 criterion is more suitable for middle school buildings and the new BB101 criterion is more suitable for primary school buildings. For primary school buildings, the old BB101 HE criterion was found somewhat lenient, not capturing a significant number of overheating events, and in order to be consistent with the proposed limit criteria (DURL, SETHL), the HE should be reduced to 32 h (or 7% of the total occupied hours). For middle school buildings, it is suggested the HE be reduced to 75 h (or 17% of the total occupied hours) to be consistent with the proposed criteria. As for the new BB101 HE criterion, the latter was found consistent with the proposed criteria for primary school buildings, except for school buildings having cooled common spaces (CONC measure). However, for middle schools, the HE of the new BB101 method should be increased to 75 h (or 17% of the occupied hours) to be consistent with the proposed criteria. For secondary school buildings where students are assumed to be well adapted to warm temperatures in summer, neither of the HE criteria of the BB101 methods was found suitable. In view of these results, it is suggested that the proposed limit criteria be used as a benchmark for the comfort-based limit criteria when they are applied to school buildings. However, caution should be exercised in applying the comfort-based criteria to overheating mitigation measures that are not directly related to classrooms (such as the CONC measure). Further research covering other schools in different local climates is needed to consolidate these findings.
Author Contributions
Conceptualization, A.L.; methodology, A.L.; formal analysis, A.L. and L.J.; funding acquisition, A.L. and L.W.; project administration, A.L., Z.J. and M.A.L.; supervision, A.L.; writing—original draft, A.L. and L.J.; writing—review and editing, Z.J., M.A.L. and L.W. All authors have read and agreed to the published version of the manuscript.
Funding
This research was funded by Infrastructure Canada through the Climate Resilient Built Environment (CRBE) Initiative (NRC Project Number: A1-020366). The field measurement was carried out through a collaborative research project led by Concordia University and funded by the Natural Sciences and Engineering Research Council (NSERC) of Canada through the Advancing Climate Change Science in Canada Program (#ACCPJ 535986-18).
Data Availability Statement
The data presented in this study are available on request from the corresponding author. The data require permissions from the project clients for public use.
Acknowledgments
The authors would like to thank the Ministère de l’Éducation et de l’Enseignement supérieur (MEES, Quebec) for its support for the field measurement.
Conflicts of Interest
The authors declare no conflicts of interest.
List of Abbreviations
| Abbreviation Name | Meaning |
| ACH | Air Change per Hour |
| AFN | Air flow network |
| BB101 | Building Bulletin 101 |
| COG | Centre of glass |
| DUR | Duration of overheating event |
| DURL | Limit value of duration of overheating event |
| EUI | Energy use intensity |
| EPS | Expanded polystyrene |
| HE | Hours of exceedance |
| HS | High (secondary) school |
| INT | Intensity of overheating event |
| INTL | Limit value of intensity of overheating event |
| MBE | Mean bias error |
| NECB | National Energy Code of Canada for Buildings |
| MPMV | Metabolic-based predicted mean vote index |
| MS | Middle school |
| PS | Primary school |
| RMSE | Root mean square error |
| SET | Standard Effective Temperature Index |
| SETH | Severity of overheating event |
| SETHL | Limit value of severity of overheating event |
| SWH | Service hot water |
| TSV | Thermal sensation vote |
| XPS | Extruded polystyrene |
References
- BCCS. Extreme Heat and Human Mortality: A Review of Heat-Related Deaths in B.C. in Summer 2021; British Columbia Coroners Service: Burnaby, BC, Canada, 2022.
- Lamothe, F.; Maxime, R.; Sarah-Émilie, R.H. Enquête Épidémiologique-Vague de Chaleur à l’été 2018 à Montréal; Direction régionale de santé publique du CIUSSS du Centre-Sud-de-l’Île-de-Montréal, Gouvernement du Québec: Montreal, QC, Canada, 2019; ISBN 978-2-550-84020-6. Available online: https://www.preventionweb.net/publication/vague-de-chaleur-ete-2018-montreal-enquete-epidemiologique (accessed on 1 September 2023).
- Bustinza, R.; Lebel, G.; Gosselin, P.; Bélanger, D.; Chebana, F. Health impacts of the July 2010 heat wave in Québec, Canada. BMC Public Health 2013, 13, 56. [Google Scholar] [CrossRef] [PubMed]
- IPCC. Climate Change 2021: The Physical Science Basis. Contribution of Working Group I to the Sixth Assessment Report of the Intergovernmental Panel on Climate Change; Masson-Delmotte, V., Zhai, P., Pirani, A., Connors, S.L., Péan, C., Berger, S., Caud, N., Chen, Y., Goldfarb, L., Gomis, M.I., et al., Eds.; Cambridge University Press: Cambridge, UK; New York, NY, USA, 2021. [Google Scholar] [CrossRef]
- Mohamed, S.; Rodrigues, L.; Omer, S.; Calautit, J. Overheating and indoor air quality in primary schools in the UK. Energy Build. 2021, 250, 111291. [Google Scholar] [CrossRef]
- Montazami, A.; Wilson, M.; Nicol, F. Aircraft noise, overheating and poor air quality in classrooms in London primary schools. Build. Environ. 2012, 52, 129–141. [Google Scholar] [CrossRef]
- Jenkins, D.P.; Peacock, A.D.; Banfill, P.F.G. Will future low-carbon schools in the UK have an overheating problem? Build. Environ. 2009, 44, 490–501. [Google Scholar] [CrossRef]
- Smith, C.J. Pediatric Thermoregulation: Considerations in the Face of Global Climate Change. Nutrients 2019, 11, 2010. [Google Scholar] [CrossRef]
- Tsuzuki, K. Effects of heat exposure on the thermoregulatory responses of young children. J. Therm. Biol. 2023, 113, 103507. [Google Scholar] [CrossRef]
- Chen, Y.; Tao, M.; Liu, W. High temperature impairs cognitive performance during a moderate intensity activity. Build. Environ. 2020, 186, 107372. [Google Scholar] [CrossRef]
- Li, X.; Zhang, L.; Fang, X.; Stanton, B.; Xiong, Q.; Lin, D.; Mathur, A. Schooling of migrant children in China: Perspectives of school teachers. Vulnerable Child Youth Stud. 2010, 5, 79–87. [Google Scholar] [CrossRef]
- CME. Education in Canada—An Overview; Council of Ministers of Education: Toronto, ON, Canada, 2023. Available online: https://cmec.ca/299/Education-in-Canada-An-Overview/index.html (accessed on 2 October 2023).
- StatCan. Elementary–Secondary Education Survey, 2019/2020; Statistics Canada: Ottawa, ON, Canada, 2021. [CrossRef]
- NRCan. Survey of Commercial and Institutional Energy Use–Buildings 2009; Detailed statistical report; Natural Resources Canada: Ottawa, ON, Canada, 2012.
- Government of Quebec. 2017–2027 Québec Infrastructure Plan/2017–2018 Annual Management Plans for Public Infrastructure Investments; Québec Public Infrastructure: Québec, QC, Canada, 2017.
- Fixouschools. Ventilation Is Going to Be a Challenge at Many Ontario Schools. 2020. Available online: https://fixourschools.ca/2020/06/30/ventilation-is-going-to-be-a-challenge-at-many-ontario-schools/ (accessed on 2 October 2023).
- BC GOV. Students Get Improved Air Quality in B.C. Schools. 2023. Available online: https://news.gov.bc.ca/releases/2023ECC0016-000332 (accessed on 2 October 2023).
- Government of Canada. Government of Canada Investing an Additional $150 Million in Better Ventilation for Schools, Hospitals, and Other Public Buildings. 2021. Available online: https://www.canada.ca/en/office-infrastructure/news/2021/04/government-of-canada-investing-an-additional-150-million-in-better-ventilation-for-schools-hospitals-and-other-public-buildings.html (accessed on 2 October 2023).
- Pal, A.; Tsusaka, T.W.; Nguyen, T.P.L.; Ahmad, M.M. Assessment of vulnerability and resilience of school education to climate-induced hazards: A review. Dev. Stud. Res. 2023, 10, 2202826. [Google Scholar] [CrossRef]
- Bar-Or, O.; Shephard, R.J.; Allen, C.L. Cardiac output of 10- to 13-year-old boys and girls during submaximal exercise. J. Appl. Physiol. 1971, 30, 219–223. [Google Scholar] [CrossRef]
- Shibasaki, M.; Inoue, Y.; Kondo, N.; Iwata, A. Thermoregulatory responses of prepubertal boys and young men during moderate exercise. Graefe Arch. Clin. Exp. Ophthalmol. 1997, 75, 212–218. [Google Scholar] [CrossRef] [PubMed]
- Wagner, J.A.; Robinson, S.; Tzankoff, S.P.; Marino, R.P. Heat tolerance and acclimatization to work in the heat in relation to age. J. Appl. Physiol. 1971, 33, 616–622. [Google Scholar] [CrossRef] [PubMed]
- Drinkwater, B.L.; Kupprat, I.C.; Denton, J.E.; Crist, J.L.; Horvath, S.M. Response of prepubertal girls and college women to work in the heat. J. Appl. Physiol. 1977, 43, 1046–1053. [Google Scholar] [CrossRef] [PubMed]
- MacDougall, J.D.; Roche, P.D.; Bar-Or, O.; Moroz, J.R. Maximal Aerobic Capacity of Canadian Schoolchildren: Prediction Based on Age-Related Oxygen Cost of Running. Int. J. Sports Med. 1983, 4, 194–198. [Google Scholar] [CrossRef] [PubMed]
- Hosokawa, Y.; Stearns, R.L.; Casa, D.J. Is Heat Intolerance State or Trait? Sports Med. 2019, 49, 365–370. [Google Scholar] [CrossRef] [PubMed]
- Kim, J.; de Dear, R. Thermal comfort expectations and adaptive behavioural characteristics of primary and secondary school students. Build. Environ. 2018, 127, 13–22. [Google Scholar] [CrossRef]
- Torriani, G.; Lamberti, G.; Salvadori, G.; Fantozzi, F.; Babich, F. Thermal comfort and adaptive capacities: Differences among students at various school stages. Build. Environ. 2023, 237, 110340. [Google Scholar] [CrossRef]
- De Giuli, V.; Da Pos, O.; De Carli, M. Indoor environmental quality and pupil perception in Italian primary schools. Build. Environ. 2012, 56, 335–345. [Google Scholar] [CrossRef]
- ESFA. Building Bulletin 101 (BB101): Guidelines on Ventilation, Thermal Comfort and Indoor Air Quality in Schools; Version 1, 2018; Education and Skills Funding Agency: London, UK, 2018.
- DfES. BB101: A Design Guide: Ventilation of School Buildings; Department for Education and Skills: London, UK, 2006.
- CIBSE. CIBSE TM52-The Limits of Thermal Comfort: Avoiding Overheating in European Buildings; The Chartered Institution of Building Services Engineers: London, UK, 2013. [Google Scholar] [CrossRef]
- EN 15251:2007; Indoor Environmental Input Parameters for Design and Assessment of Energy Performance of Buildings Addressing Indoor Air Quality, Thermal Environment, Lighting and Acoustics. Comité Européen de Normalisation (CEN): Brussels, Belgium, 2007.
- Ministry of Education. Designing Schools in New Zealand: Designing Quality Learning Spaces–Indoor Air Quality & Thermal Comfort; Version 2.0; Ministry of Education: Wellington, New Zealand, 2022.
- NYSUT. Overheated: NYSUT Assembles Classroom Heat Report for Legislators. New York State United Teachers. 2023. Available online: https://www.nysut.org/news/2023/september/classroom-heat (accessed on 2 October 2023).
- NYSS. Senate Bill S3397: Establishes a Maximum Temperature in School Buildings and Indoor Facilities. New York State Senate. 2023. Available online: https://www.nysenate.gov/legislation/bills/2023/S3397 (accessed on 16 October 2023).
- Conybeare, W. Los Angeles County Board of Supervisors Passes Motion To Protect Students during Extreme Heat. KTLA 5 News. 12 September 2023. Available online: https://ktla.com/news/local-news/los-angeles-county-board-of-supervisors-passes-motion-to-protect-students-during-extreme-heat/ (accessed on 16 October 2023).
- Laouadi, A.; Ji, L.; Shu, C.; Wang, L.; Lacasse, M.A. Overheating Risk Analysis in Long-Term Care Homes—Development of Overheating Limit Criteria. Buildings 2023, 13, 390. [Google Scholar] [CrossRef]
- Pisani, M.; Burman, E.; Mumovic, D. A comparative analysis of current and newly proposed overheating criteria for UK schools: A climate change aspect. In Proceedings of the 10th International Conference on Healthy Buildings, Brisbane, Australia, 8–12 July 2012; Volume 1, pp. 836–842. [Google Scholar]
- Montazami, A.; Nicol, F. Overheating in schools: Comparing existing and new guidelines. Build. Res. Inform. 2013, 41, 317–329. [Google Scholar] [CrossRef]
- Teli, D.; Bourikas, L.; James, P.A.B.; Bahaj, A.S. Thermal Performance Evaluation of School Buildings using a Children-based Adaptive Comfort Model. Procedia Environ. Sci. 2017, 38, 844–851. [Google Scholar] [CrossRef]
- Lykartsis, A.; B-Jahromi, A.; Mylona, A. Investigating risk of overheating for school buildings under extreme hot weather conditions. Adv. Energy Res. 2017, 5, 277–287. [Google Scholar] [CrossRef]
- Heracleous, C.; Michael, A. Assessment of overheating risk and the impact of natural ventilation in educational buildings of Southern Europe under current and future climatic conditions. Energy 2018, 165, 1228–1239. [Google Scholar] [CrossRef]
- Xie, Z.; Shu, C.; Reich, B.Z.; Wang, L.; Baril, D.; Ji, L.; Yang, S.; Bai, X.; Zmeureanu, R.; Lacasse, M.; et al. A field study on summertime overheating of six schools in Montreal Canada. J. Phys. Conf. Ser. 2021, 2069, 012168. [Google Scholar] [CrossRef]
- Baba, F.M.; Ge, H.; Wang, L.; Zmeureanu, R. Assessing and mitigating overheating risk in existing Canadian school buildings under extreme current and future climates. Energy Build. 2023, 279, 112710. [Google Scholar] [CrossRef]
- NRC. National Energy Code of Canada for Buildings (NECB-2011); National Research Council of Canada: Ottawa, ON, Canada, 2011.
- Shaw, C.Y.; Jones, L. Air Tightness and Air Infiltration of School Buildings. ASHRAE Trans. 1979, 85 Pt 1, 85–95. [Google Scholar]
- NRC. National Energy Code of Canada for Buildings (NECB-2017); National Research Council of Canada: Ottawa, ON, Canada, 2017.
- DOE. EnergyPlus v9.6. USA Department of Energy. 2021. Available online: https://energyplus.net/ (accessed on 1 April 2021).
- Ricketts, L. A Field Study of Airflow in a High-Rise Multi-Unit Residential Building. 2014. Available online: http://hdl.handle.net/10012/8190 (accessed on 1 June 2021).
- ASHRAE. ASHRAE Guideline 14-2014: Measurement of Energy, Demand, and Water Savings; American Society of Heating Refrigerating and Air Conditioning Engineers: Atlanta, GA, USA, 2014. [Google Scholar]
- Donovan, A.O.; Sullivan, P.D.O.; Murphy, M.D. Predicting air temperatures in a naturally ventilated nearly zero energy building: Calibration, validation, analysis and approaches. Appl. Energy 2019, 250, 991–1010. [Google Scholar] [CrossRef]
- Oliker, I. Assessment of Seasonal Boiler Efficiency in Individual Buildings. 2023. Available online: https://www.esmagazine.com/articles/101464-assessment-of-seasonal-boiler-efficiency-in-individual-buildings. (accessed on 2 October 2023).
- Enerlife Consulting Inc. Ontario EcoSchools Energy Performance Study 2017; EcoSchools Canada: Toronto, ON, Canada, 2017. [Google Scholar]
- NRCan. Energy Star Portfolio Manager. 2016. Available online: https://portfoliomanager.energystar.gov/pdf/reference/Canadian%20National%20Median%20Table.pdf (accessed on 1 June 2022).
- Issa, M.H.; Attalla, M.; Rankin, J.H.; Christian, A.J. Detailed analysis of electricity, water, and gas consumption quantities and costs in Toronto’s public schools. Can. J. Civ. Eng. 2010, 37, 25–36. [Google Scholar] [CrossRef]
- Vancouver School Board. Strategic Energy Management Plan Update 2021–2022, Pathways to 2030—And Beyond. Vancouver, BC. Available online: https://media.vsb.bc.ca/sb365media/attachments/62240ba0-cff0-4b47-b4b9-08fde1029749_VSB_SEMP_2021-22.pdf (accessed on 2 October 2023).
- Manitoba Public School Finance Board. The Public Schools Finance Board Amendment and the Public Schools Amendment Act. 2012. Available online: https://web2.gov.mb.ca/bills/38-4/b035e.php (accessed on 1 June 2022).
- Ouf, M.M.; Issa, M.H. Energy consumption analysis of school buildings in Manitoba, Canada. Int. J. Sustain. Built Environ. 2017, 6, 359–371. [Google Scholar] [CrossRef]
- NRCan. Building Energy Benchmarking; Natural Resources Canada: Ottawa, ON, Canada, 2009.
- Laouadi, A.; Bartko, M.; Lacasse, M.A. A New Methodology of Evaluation of Overheating in Buildings. Energy Build. 2020, 226, 110360. [Google Scholar] [CrossRef]
- Laouadi, A.; Bartko, M.; Lacasse, M.; Armstrong, M.; Gaur, A. Development of reference summer weather years for analysis of overheating risk in buildings. J. Build. Perform. Simul. 2020, 13, 301–319. [Google Scholar] [CrossRef]
- Laouadi, A. A New General Formulation for the PMV Thermal Comfort Index. Buildings 2022, 12, 1572. [Google Scholar] [CrossRef]
- de Dear, R.; Kim, J.; Candido, C.; Deuble, M. Summertime Thermal Comfort in Australian School Classrooms. In Counting the Cost of Comfort in a Changing World; NCEUB: London, UK, 2014; pp. 10–13. [Google Scholar]
- Zomorodian, Z.S.; Tahsildoost, M.; Hafezi, M. Thermal comfort in educational buildings: A review article. Renew. Sustain. Energy Rev. 2016, 59, 895–906. [Google Scholar] [CrossRef]
- Basu, R. High ambient temperature and mortality: A review of epidemiologic studies from 2001 to 2008. Environ. Health 2009, 8, 40. [Google Scholar] [CrossRef] [PubMed]
- HC. Heat Alert and Response Systems to Protect Health: Best Practices Guidebook. Prepared by: Water, Air and Climate Change Bureau Healthy Environments and Consumer Safety Branch; Health Canada: Ottawa, ON, Canada, 2012.
- Bottin, J.H.; Morin, C.; Guelinckx, I.; Perrier, E.T. Hydration in Children: What Do We Know and Why Does It Matter? Ann. Nutr. Metab. 2019, 74 (Suppl. S3), 11–18. [Google Scholar] [CrossRef] [PubMed]
- Gibson-Moore, H. Improving Hydration in Children: A Sensible Guide. Nutr. Bull. 2013, 38, 236–242. [Google Scholar] [CrossRef]
- Bar-David, Y.; Urkin, J.; Kozminsky, E. The Effect of Voluntary Dehydration on Cognitive Functions of Elementary School Children. Acta Paediatr. Int. J. Paediatr. 2005, 94, 1667–1673. [Google Scholar] [CrossRef]
- Smithers, G.; Gregory, J.; Bates, C.; Prentice, A.; Jackson, L.; Wenlock, R. The National Diet and Nutrition Survey: Young People Aged 4–18 Years. Nutr. Bull. 2000, 25, 105–111. [Google Scholar] [CrossRef]
- Fadda, R.; Rapinett, G.; Grathwohl, D.; Parisi, M.; Fanari, R.; Calò, C.M.; Schmitt, J. Effects of Drinking Supplementary Water at School on Cognitive Performance in Children. Appetite 2012, 59, 730–737. [Google Scholar] [CrossRef]
- Senterre, C.; Dramaix, M.; Thiébaut, I. Fluid Intake Survey among Schoolchildren in Belgium. BMC Public Health 2014, 14, 1–10. [Google Scholar] [CrossRef]
- ISO-7933:2023; Ergonomics of the Thermal Environment—Analytical Determination and Interpretation of Heat Stress Using the Predicted Heat Strain Model. International Organization for Standardization: Geneva, Switzerland, 2023.
- Gopinathan, P.M.; Pichan, G.; Sharma, V.M. Role of Dehydration in Heat Stress-Induced Variations in Mental Performance. Arch. Environ. Health 1988, 43, 15–17. [Google Scholar] [CrossRef] [PubMed]
- NIOSH. Criteria for a Recommended Standard: Occupational Exposure To Hot Environments (Revised Criteria 1986). National Institute for Occupational Safety and Health, DHHS (NIOSH) Publication No. 86-113, 1-140. 1986. Available online: https://www.cdc.gov/niosh/docs/86-113/ (accessed on 2 October 2023).
- CCOHS. Working in Hot Environments: Health and Safety Guide; Canadian Centre for Occupational Health and Safety: Hamilton, ON, Canada, 2005.
- ISO-7243:2017; Ergonomics of the Thermal Environment—Assessment of Heat Stress Using the WBGT (Wet Bulb Globe Temperature) Index. International Organization for Standardization: Geneva, Switzerland, 2017.
- Ji, L.; Laouadi, A.; Shu, C.; Wang, L.; Lacasse, M.A. Evaluation and Improvement of the Thermoregulatory System for the Two-Node Bioheat Model. Energy Build. 2021, 249, 111235. [Google Scholar] [CrossRef]
- Gaur, A.; Lacasse, M.A.; Armstrong, M. Climate Data to Undertake Hygrothermal and Whole Building Simulations Under Projected Climate Change Influences for 11 Canadian Cities. Data 2019, 4, 72. [Google Scholar] [CrossRef]
- McLeod, R.S.; Mathew, M.; Salman, D.; Thomas, C.L.P. An Investigation of Indoor Air Quality in a Recently Refurbished Educational Building. Front. Built Environ. 2021, 7, 769761. [Google Scholar] [CrossRef]
- ANSI/ASHRAE Standard 55-2020; Thermal Environmental Conditions for Human Occupancy. American Society of Heating Refrigerating and Air Conditioning Engineers: Atlanta, GA, USA, 2020.
- Gasparrini, A.; Armstrong, B. Time series analysis on the health effects of temperature: Advancements and Limitations. Environ. Res. 2010, 110, 633–638. [Google Scholar] [CrossRef]
- Fabrizio, N.; Monetti, V. Methodologies and Advancements in the Calibration of Building Energy Models. Energies 2015, 8, 2548–2574. [Google Scholar] [CrossRef]
- Fouillet, A.; Rey, G.; Laurent, F.; Pavillon, G.; Bellec, S.; Guihenneuc-Jouyaux, C.; Clavel, J.; Jougla, E.; Hémon, D. Excess Mortality Related to the August 2003 Heat Wave in France. Int. Arch. Occup. Environ. Health 2006, 80, 16–24. [Google Scholar] [CrossRef]
Figure 1.
Close-ups of the real PS building (taken from GoogleTM): aerial view (left) and frontal views (right) of the southeast and northwest façades.
Figure 1.
Close-ups of the real PS building (taken from GoogleTM): aerial view (left) and frontal views (right) of the southeast and northwest façades.

Figure 2.
Perspective views of the PS building model showing the south-facing (left) and north-facing (right) facades.
Figure 2.
Perspective views of the PS building model showing the south-facing (left) and north-facing (right) facades.

Figure 3.
Thermal zones of the first floor.

Figure 4.
Thermal zones of the second and third floors.
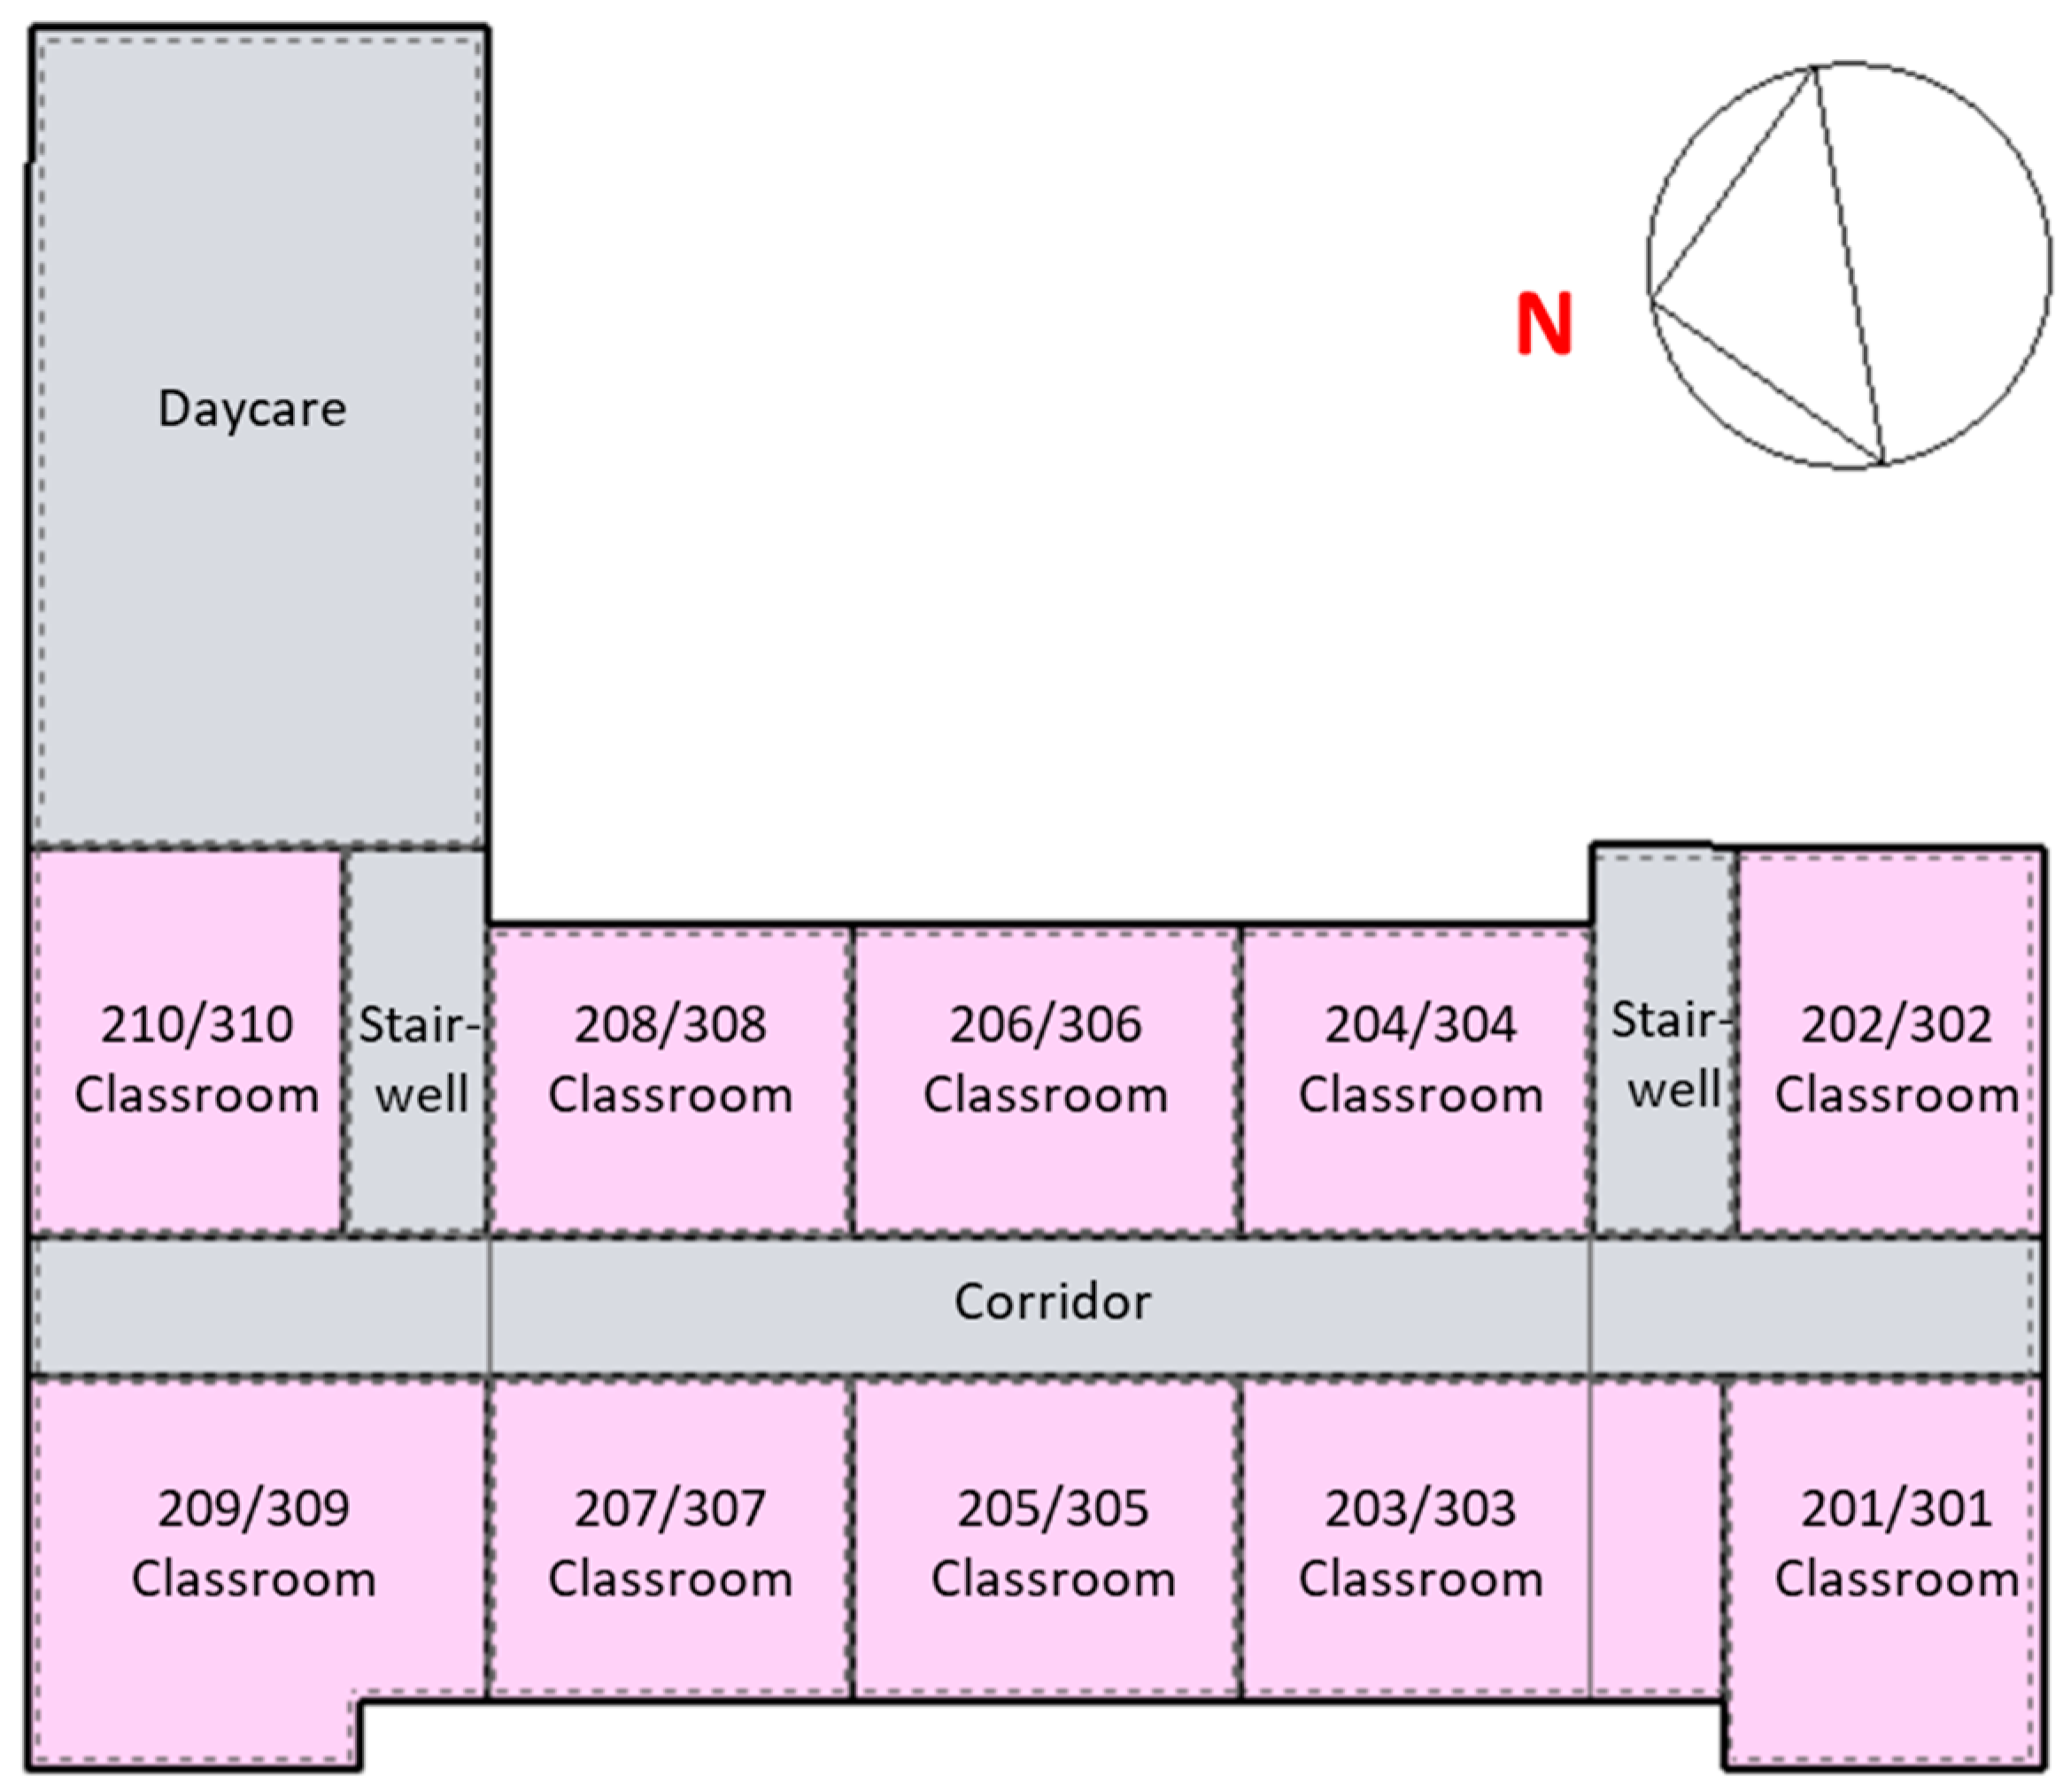
Figure 5.
Comparison of indoor relative humidity and temperature of classrooms (CR301 and CR302) and their mean values.
Figure 5.
Comparison of indoor relative humidity and temperature of classrooms (CR301 and CR302) and their mean values.
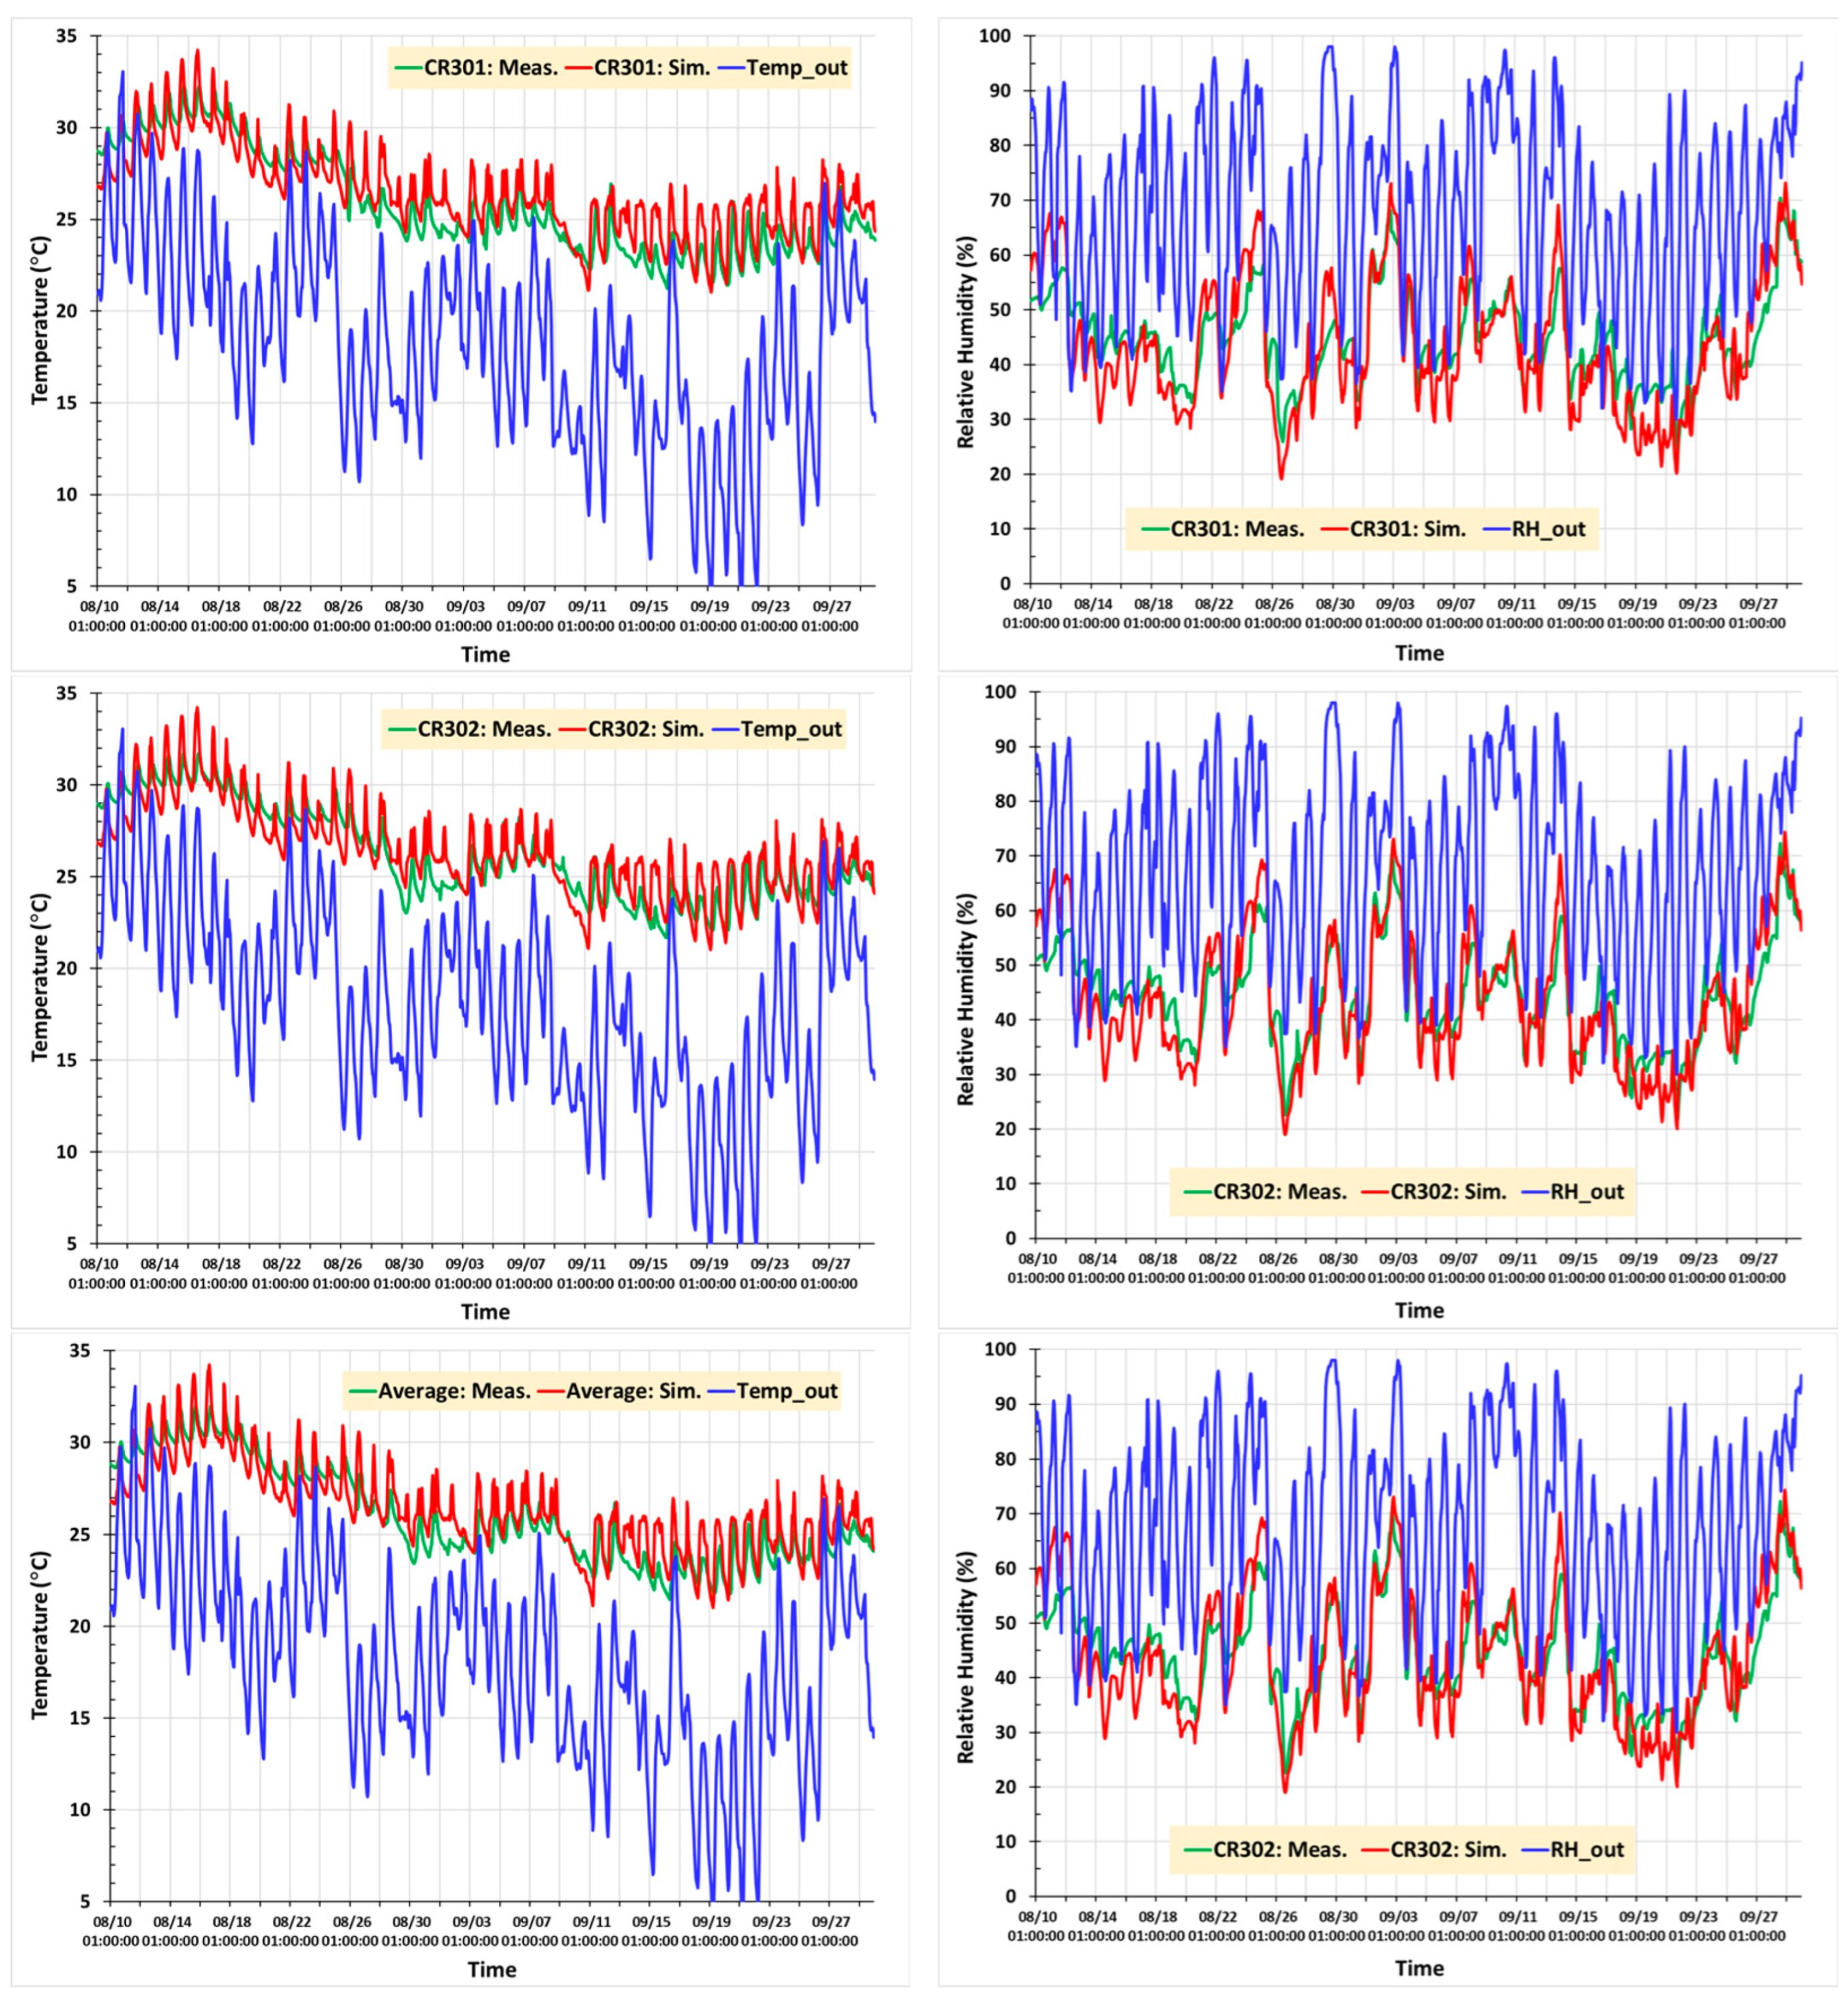
Figure 6.
Duration of overheating events versus cumulative body water loss in primary school buildings. Note that the yellow rectangle represents the domain that delimits overheating risk.
Figure 6.
Duration of overheating events versus cumulative body water loss in primary school buildings. Note that the yellow rectangle represents the domain that delimits overheating risk.

Figure 7.
Severity of overheating events versus cumulative body water loss in primary school buildings.
Figure 7.
Severity of overheating events versus cumulative body water loss in primary school buildings.

Figure 8.
Intensity of overheating events versus maximum body core temperature in primary school buildings.
Figure 8.
Intensity of overheating events versus maximum body core temperature in primary school buildings.
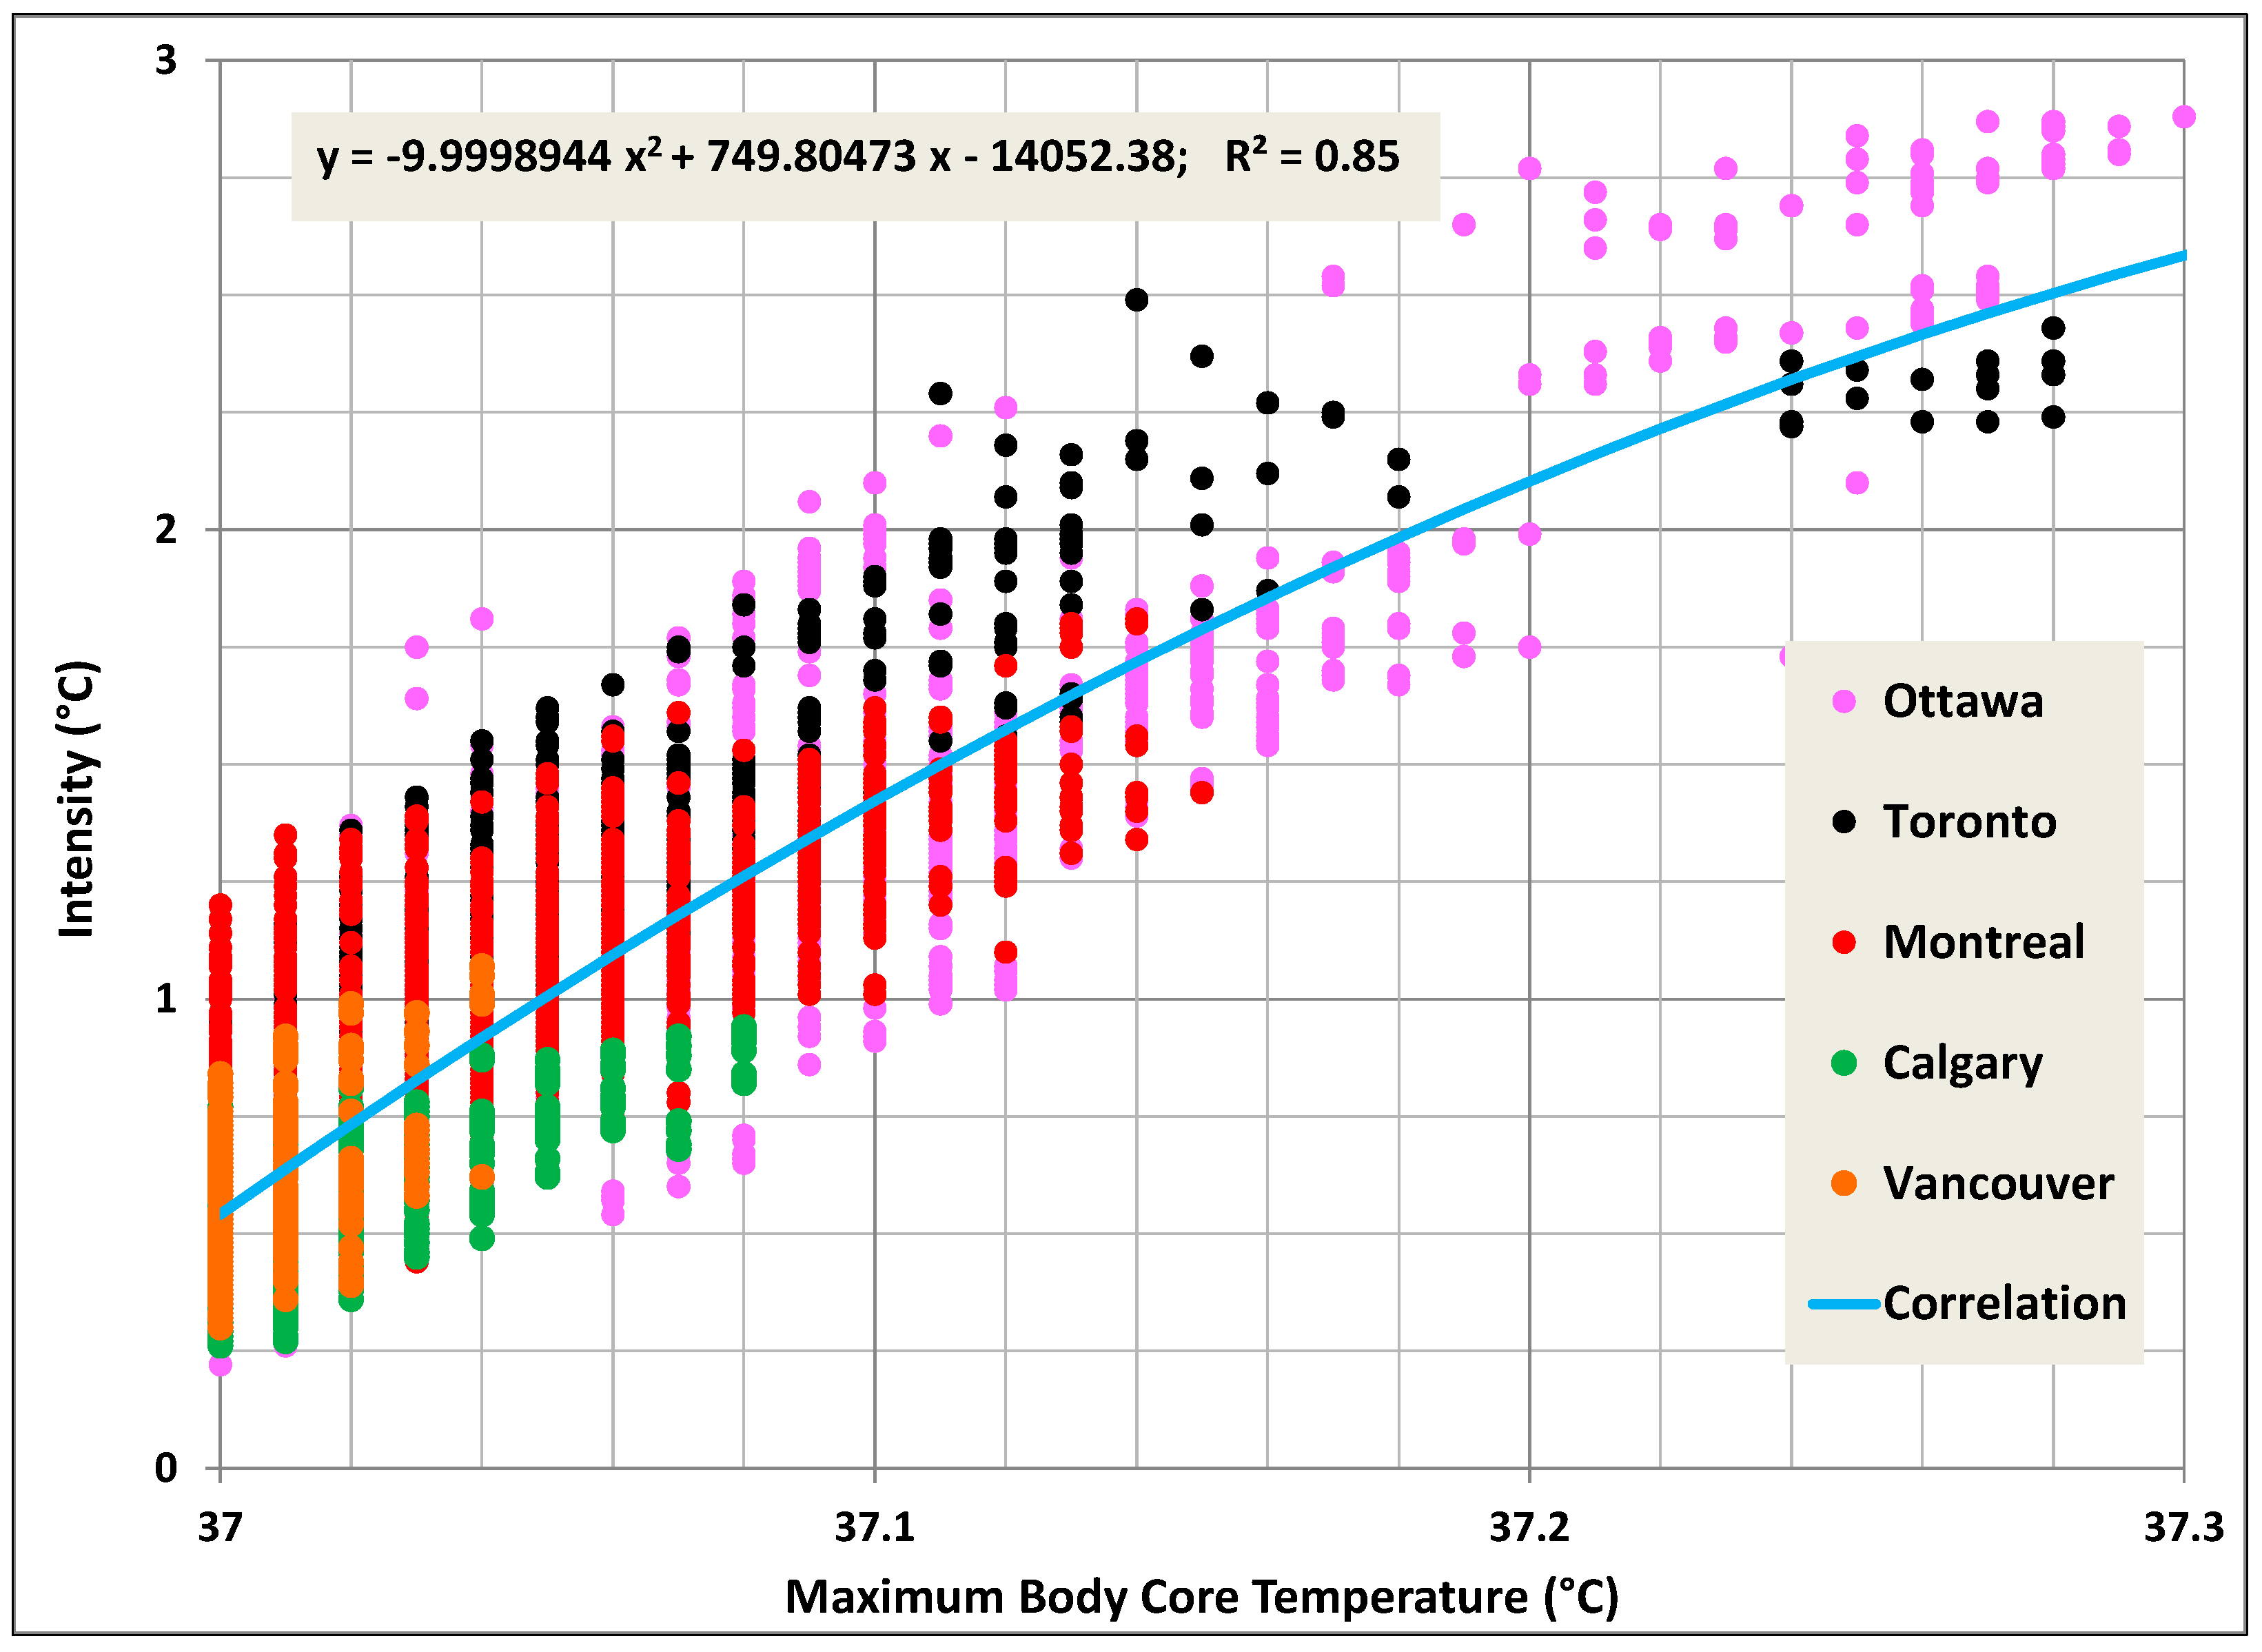
Figure 9.
Duration of overheating events versus body water loss in secondary school buildings.
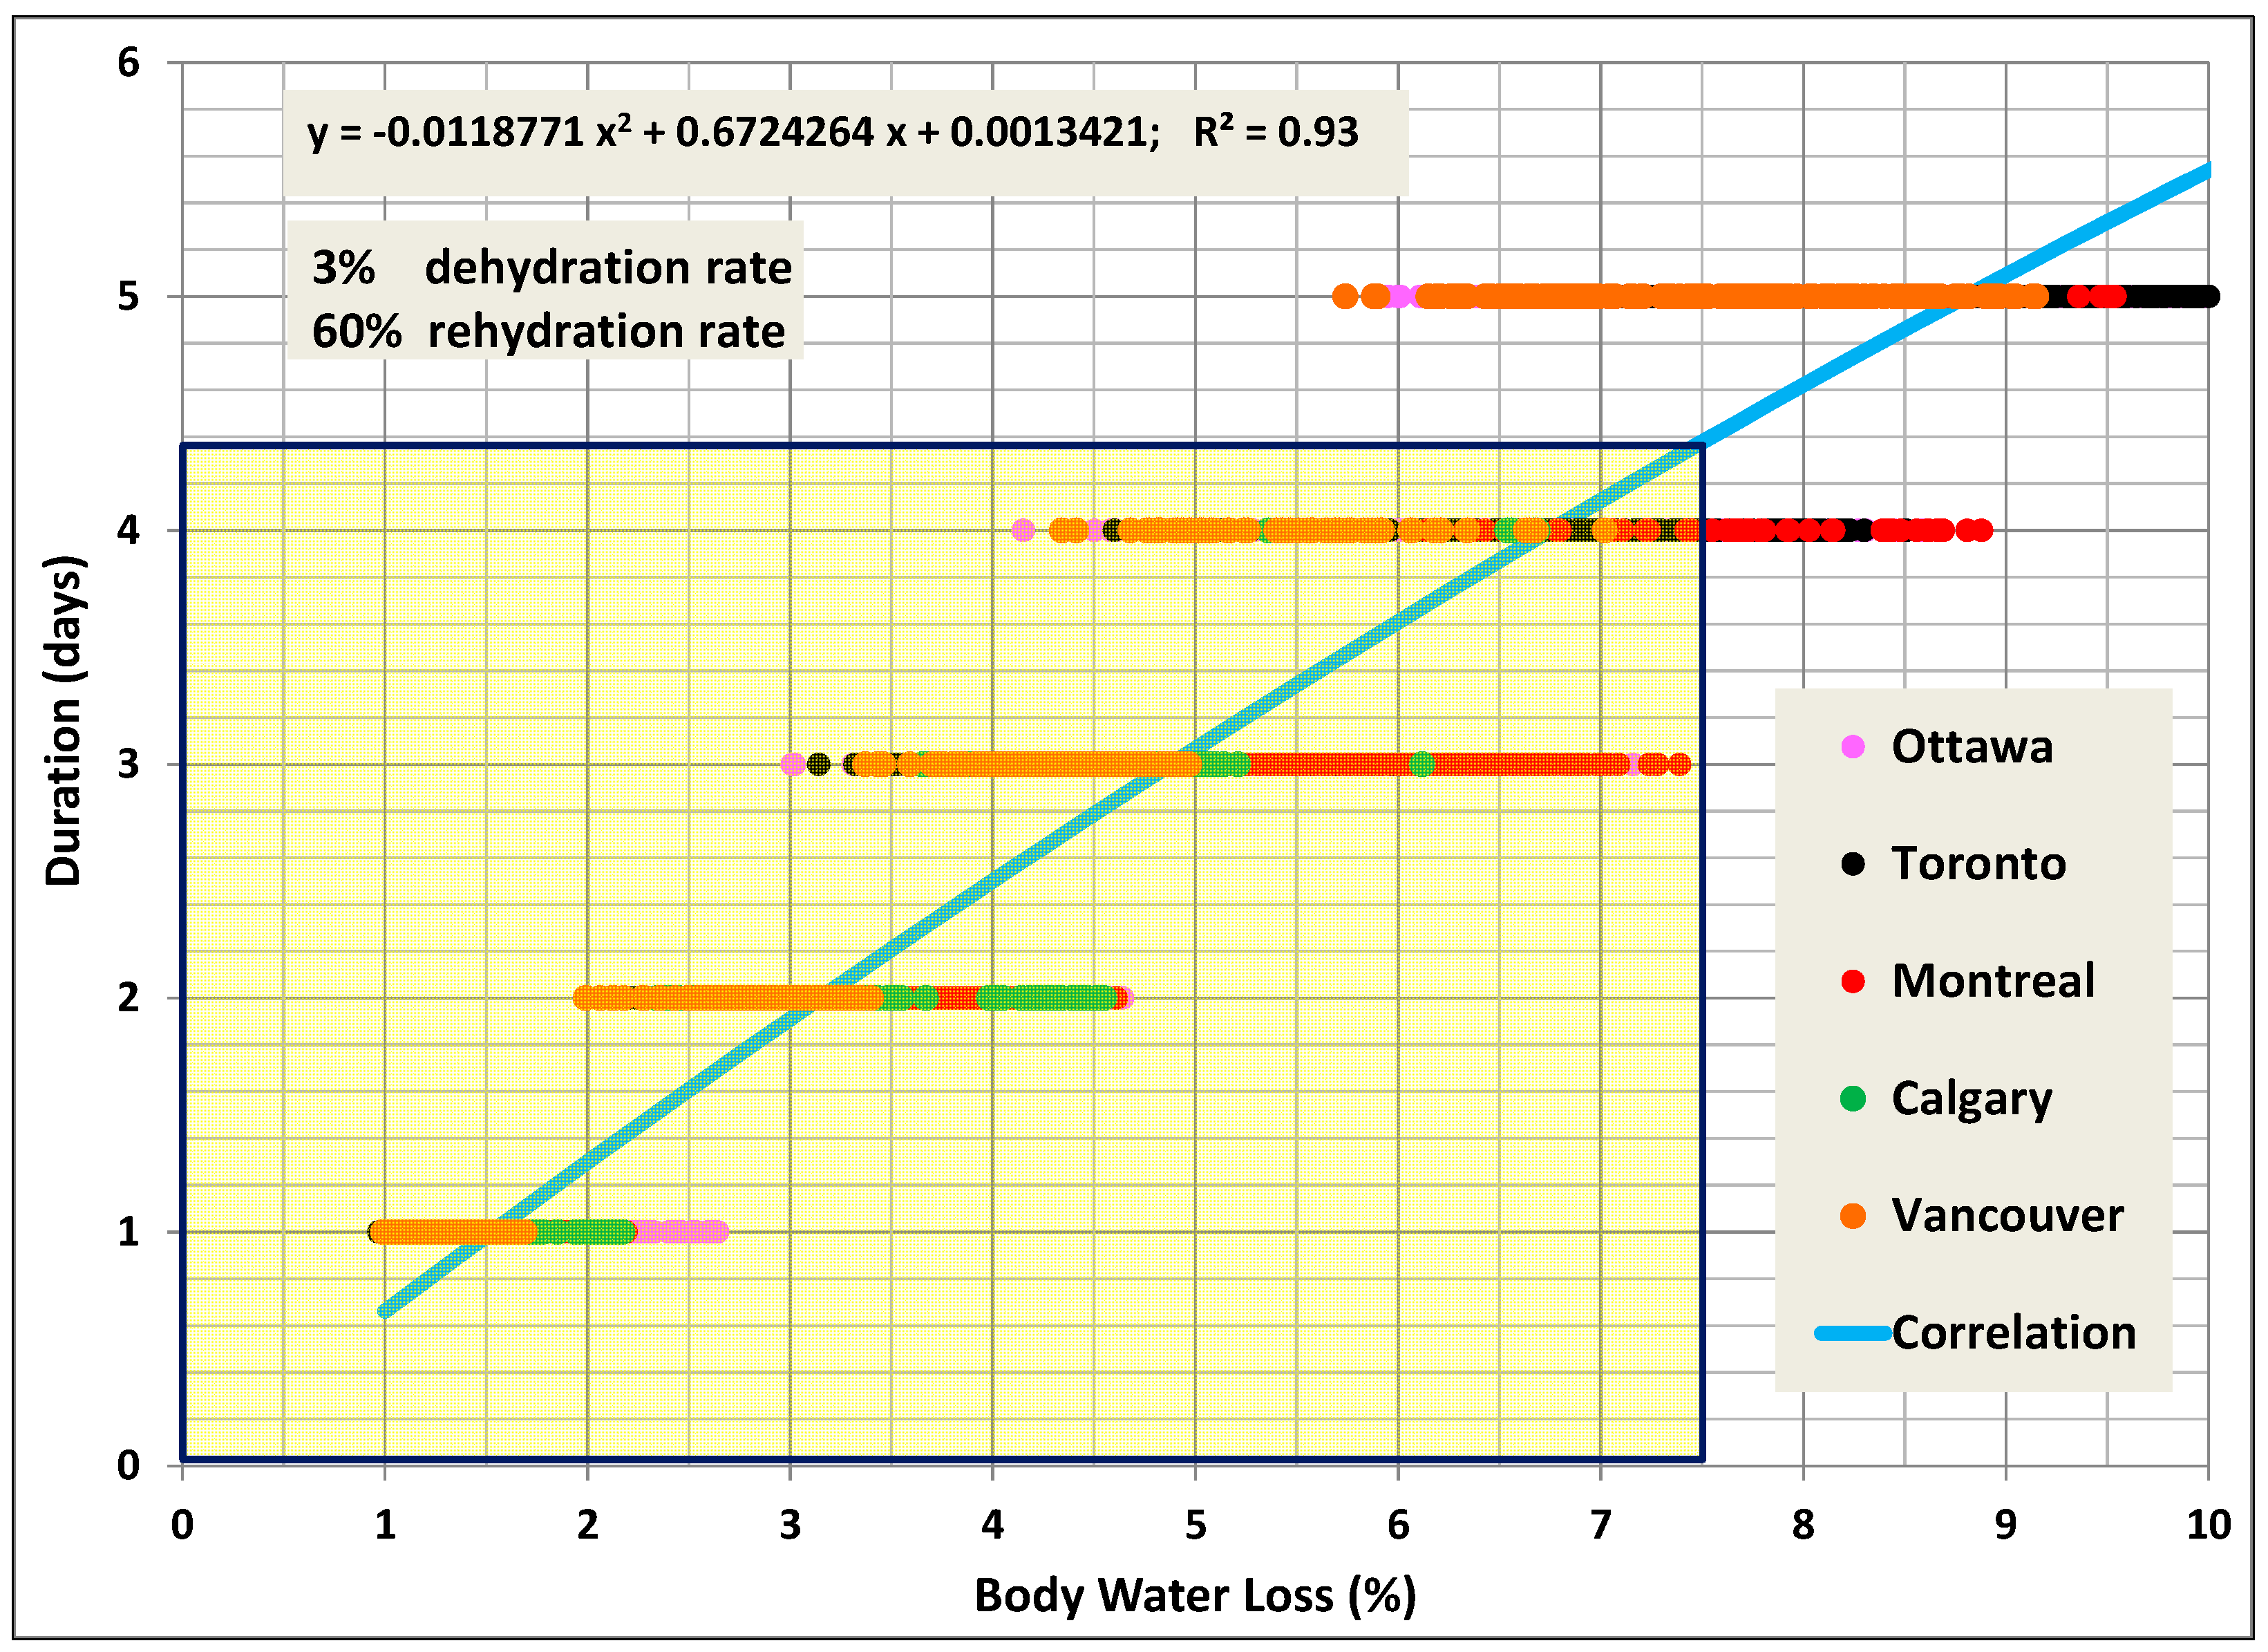
Figure 10.
Severity of overheating events versus body water loss in secondary school buildings.
Figure 11.
Indoor air temperature that students of classroom #206 are exposed to in primary school buildings with old construction during an extreme overheating event (22–26 May 2010).
Figure 11.
Indoor air temperature that students of classroom #206 are exposed to in primary school buildings with old construction during an extreme overheating event (22–26 May 2010).
Figure 12.
Indoor air temperature that students of classroom #206 are exposed to in primary school buildings with new construction during an extreme overheating event (22–26 May 2010).
Figure 12.
Indoor air temperature that students of classroom #206 are exposed to in primary school buildings with new construction during an extreme overheating event (22–26 May 2010).

Figure 13.
Relationships between the proposed (DUR/SETH) and old BB101 criteria for classrooms of primary and middle school buildings. The red-dotted lines represent the overheating limit values.
Figure 13.
Relationships between the proposed (DUR/SETH) and old BB101 criteria for classrooms of primary and middle school buildings. The red-dotted lines represent the overheating limit values.
Figure 14.
Relationships between the proposed (DUR/SETH) and new BB101 criteria for classrooms of primary and middle school buildings. The red-dotted lines represent the overheating limit values.
Figure 14.
Relationships between the proposed (DUR/SETH) and new BB101 criteria for classrooms of primary and middle school buildings. The red-dotted lines represent the overheating limit values.

Figure 15.
Relationships between the proposed (DUR) and BB101 criteria for classrooms of secondary school buildings. The red-dotted lines represent the overheating limit values.
Figure 15.
Relationships between the proposed (DUR) and BB101 criteria for classrooms of secondary school buildings. The red-dotted lines represent the overheating limit values.

Table 1.
Summary of prior overheating studies in school buildings.
| Reference | Location | Method | Overheating Criteria | Findings |
|---|---|---|---|---|
| [7] | UK | Simulation | Percent of occupied hours above 28 °C | Lower internal heat gains, external shadings, and space ventilation could reduce overheating risk but are not sufficient under future projections of climate change. |
| [38] | London (UK) | Simulation | Old/new BB101 | The new BB101 criteria are more difficult to meet, suggesting reconsidering the threshold limits to ensure that they adequately represent the physiological and psychological needs of students. |
| [39] | London (UK) | Field measurement; thermal comfort surveys | Old/new BB101 | The old BB101 criteria are too lenient, resulting in the occurrence of some overheating events. The new BB101 criteria are more stringent but need further development to accurately reflect the perception of building occupants. |
| [40] | UK | Field measurement and comfort surveys | CIBSE TM52 with adjusted adaptative thermal comfort for children | Adult-based overheating criteria (CIBSE TM52) did not permit detecting overheating risk in the schools as were investigated, but the use of children-based criteria did in 3 of 4 schools. |
| [41] | 14 UK locations | Simulation | Old BB101 | Only two UK locations fulfilled the old BB101 criteria under the current climate. Additional overheating measures are needed in other locations under the current and future projected climates. |
| [42] | Cyprus | Simulation | CIBSE TM52 | The school buildings were unable to meet the CIBSE TM52 criteria for more than 70% of the occupied hours. |
| [5] | UK Midlands | Field measurement | Percent of occupied hours above 25 and 28 °C | Most classrooms overheated over 60% of the occupied hours. |
| [43] | Montreal (Canada) | Field measurement | Percent of occupied hours above ASHRAE-55 max. Adaptive thermal comfort temperature | Overheated hours (covering July/August) exceeded 80% in most of the monitored classrooms. |
| [44] | Montreal (Canada) | Calibrated simulation | New BB101 | Classrooms overheated with more than 110 h under the current climate. A combination of measures would be needed to reduce the risk of overheating in future climate projections. |
Table 2.
Construction input data of the old and new (current) school building models.
| Construction | Old (Partial Retrofit) | New (Current) |
|---|---|---|
| Whole building air leakage rate ACH @75Pa (L/s/m2) (above grade volume) | 9 (7.57) | 4.5 (3.88) |
| Ground floor | Insulated slab (U-factor = 0.331 W/m2 K): 100 mm foam insulation; 100 mm concrete slab; 70 mm screed; 30 mm timber flooring | |
| Walls | Concrete block (U-factor = 0.5 W/m2 K): 100 mm brick veneer; 25 mm air gap; 38 mm EPS insulation; 200 mm concrete block; 13 mm gypsum board | Steel stud (insulation (EPS) thickness varies with location as in Table 3): 100 mm brick veneer; 25 mm air gap; Insulation (EPS); 13 mm OSB; 150 mm batt steel stud; 13 mm gypsum board |
| Roofs | Concrete deck (insulation (XPS) thickness varies with location as in Table 3): 1 mm roof membrane; insulation (XPS); 150 mm concrete slab; 13 mm gypsum board | |
| Windows | Double clear glass with aluminum frame (COG U-factor = 2.7 W/m2 K) | Double clear low-emission glass with argon gas and aluminum frame (COG U-factor = 1.33 W/m2 K) |
Table 3.
Requirement of NECB-2017 [47] for building envelopes with new constructions.
Table 3.
Requirement of NECB-2017 [47] for building envelopes with new constructions.
| City | U-Factor of Walls (W/m2 K) | U-Factor of Roofs (W/m2 K) | U-Factor of Retrofitted Roofs (W/m2 K) [45] |
|---|---|---|---|
| Montreal | 0.236 | 0.153 | 0.198 |
| Ottawa | 0.236 | 0.153 | 0.198 |
| Toronto | 0.266 | 0.153 | 0.198 |
| Calgary | 0.201 | 0.135 | 0.169 |
| Vancouver | 0.299 | 0.188 | 0.239 |
Table 4.
Operation schedules and internal heat gains of school building models.
| Space | Schedule * | Occupancy Density (m2/Person) | Lighting Power Density (W/m2) | Equipment Power Density (W/m2) |
|---|---|---|---|---|
| Classrooms | D | 7.5 | 10.3 | 5 |
| Offices | A | 20 | 10 | 7.5 |
| Library | C | 20 | 8.8 | 1 |
| Gym | D | 10 | 5.4 | 1 |
| Corridor/hall | D | 100 | 7.1 | 0 |
| Stairwell | D | 200 | 6.3 | 0 |
| Washrooms | D | 30 | 9.1 | 1 |
* Details of the operation schedules are found in NECB-2017 [47].
Table 5.
MBE and RMSE of indoor relative humidity and temperature for classrooms (CR301, CR301) and their mean values.
Table 5.
MBE and RMSE of indoor relative humidity and temperature for classrooms (CR301, CR301) and their mean values.
| Error | CR301 | CR302 | Classroom Average |
|---|---|---|---|
| RMSE-T (°C) | 1.4 | 1.3 | 1.3 |
| RMSE-RH (%) | 6.0 | 5.4 | 5.6 |
| MBE-T (%) | 1 | 1 | 2 |
| MBE-RH (%) | 2 | 1 | −2 |
Table 6.
Calibration of the model predicted EUI data with public benchmark data of Canadian school buildings (note: the average data are for the selected five cities).
Table 6.
Calibration of the model predicted EUI data with public benchmark data of Canadian school buildings (note: the average data are for the selected five cities).
| City | Const. | Electricity (KWh/m2) | Total (kWh/m2) | Benchmark—Electricity (kWh/m2) | Benchmark—EUI (kWh/m2) |
|---|---|---|---|---|---|
| Ottawa | New | 56.47 | 114.89 | 40 [53] | 105 [53] |
| Montreal | New | 56.45 | 114.90 | / | / |
| Toronto | New | 56.79 | 105.25 | 40 [53] or 95 [55] | 275 [55] |
| Vancouver | New | 55.19 | 82.32 | 35.76 [56] | / |
| Winnipeg | New | 55.40 | 143.49 | 126.3 [57] | 225 [58] |
| Average | New | 55.82 | 111.21 | 80.1 [59] | 200 [54] or 261 [14] |
| Ottawa | Old | 56.47 | 176.21 | 59.2 [53] | 231 [54] |
| Montreal | Old | 56.45 | 177.51 | / | 183 [54] |
| Toronto | Old | 56.79 | 157.06 | 70 [55] | 231 [54] |
| Vancouver | Old | 55.19 | 110.53 | / | 181 [54] |
| Winnipeg | Old | 55.40 | 235.59 | 115 [57] | 250 [14] |
| Average | Old | 55.82 | 170.11 | 80.1 [59] | 181 [54] |
Table 7.
Suggested threshold values of SETd for school buildings.
| School Type | Occupant Type | Reference Adult Person + | SETd (To) (°C) ++ |
|---|---|---|---|
| Primary | Children (6–12 years) | 1.2 met & 0.57 clo | 27 (26.5) in May; 28.2 (27.7) in June–September |
| Middle | Children (13–15 years) | 27 (26.5) in May; 28.2 (27.7) in June–September | |
| Secondary | Young adults (16–18 years) | 30 (29.5) in May; 31.2 (30.7) in June–September |
+ Students may have higher metabolic rates than adults depending on age [27], and therefore, the corresponding comfort operative temperature may be lower. ++ Students are assumed to be acclimatized to summer heat conditions, except in the beginning month of May in cold climates with warm summers [65,66].
Table 8.
Suggested thresholds of body dehydration and rehydration rates and maximum core temperature for school buildings. Note that the dehydration rate with rehydration is calculated as (dehydration rate without rehydration)/(100-rehydration rate).
Table 8.
Suggested thresholds of body dehydration and rehydration rates and maximum core temperature for school buildings. Note that the dehydration rate with rehydration is calculated as (dehydration rate without rehydration)/(100-rehydration rate).
| School Type | Occupant Type | Rehydration Rate (%) | Dehydration Rate without Rehydration (%) | Dehydration Rate with Rehydration (%) | Max. Core Temperature (°C) |
|---|---|---|---|---|---|
| Primary | Children | 60 | 2 | 5 | 37.6 |
| Middle | Children | 60 | 3 | 7.5 | 37.6 |
| Secondary | Young adults | 60 | 3 | 7.5 | 37.6 |
Table 9.
Extreme summer weather years for building simulation for each selected urban location.
| Period | Montreal | Ottawa | Toronto | Calgary | Vancouver |
|---|---|---|---|---|---|
| Historical | 2010 | 2010 | 2006 | 2007 | 1989 |
| Future–2050 | 2047 | 2054 | 2060 | 2052 | 2052 |
Table 10.
Time periods of interior spaces occupied by the same students during a 24 h period in primary schools.
Table 10.
Time periods of interior spaces occupied by the same students during a 24 h period in primary schools.
| Time | 8–9 | 9–10 | 10–11 | 11–16 | 16–24 |
|---|---|---|---|---|---|
| Space | Gym | Classroom | Gym | Classroom | None |
| Activity | Before classes | Classes | Activity | Classes | None |
Disclaimer/Publisher’s Note: The statements, opinions and data contained in all publications are solely those of the individual author(s) and contributor(s) and not of MDPI and/or the editor(s). MDPI and/or the editor(s) disclaim responsibility for any injury to people or property resulting from any ideas, methods, instructions or products referred to in the content. |
© 2024 by the authors. Licensee MDPI, Basel, Switzerland. This article is an open access article distributed under the terms and conditions of the Creative Commons Attribution (CC BY) license (https://creativecommons.org/licenses/by/4.0/).
Share and Cite
MDPI and ACS Style
Laouadi, A.; Ji, L.; Jandaghian, Z.; Lacasse, M.A.; Wang, L. The Development of Health-Based Overheating Limit Criteria for School Buildings. Buildings 2024, 14, 165. https://doi.org/10.3390/buildings14010165
AMA Style
Laouadi A, Ji L, Jandaghian Z, Lacasse MA, Wang L. The Development of Health-Based Overheating Limit Criteria for School Buildings. Buildings. 2024; 14(1):165. https://doi.org/10.3390/buildings14010165
Chicago/Turabian StyleLaouadi, Abdelaziz, Lili Ji, Zahra Jandaghian, Michael A. Lacasse, and Liangzhu Wang. 2024. "The Development of Health-Based Overheating Limit Criteria for School Buildings" Buildings 14, no. 1: 165. https://doi.org/10.3390/buildings14010165
Note that from the first issue of 2016, this journal uses article numbers instead of page numbers. See further details here.