


Spatial Parameters Determining Urban Wellbeing: A Behavioral Experiment
Faculty of Architecture & Town Planning, Technion-Israel Institute of Technology, Haifa 3200003, Israel
*
Authors to whom correspondence should be addressed.
Buildings 2024, 14(1), 211; https://doi.org/10.3390/buildings14010211
Submission received: 27 November 2023
/
Revised: 6 January 2024
/
Accepted: 8 January 2024
/
Published: 13 January 2024
(This article belongs to the Special Issue Urban Wellbeing: The Impact of Spatial Parameters)
Abstract
:In today’s rapid urbanization process around the world, understanding the impact of environmental parameters on urban dwellers’ wellbeing is more important than ever. In this paper, we explored the influence of 3D spatial and physical factors on the wellbeing of urban dwellers. Twenty-one virtual environments comprised three street sections, five building morphologies, and two densification rates, and were rated by 147 study participants. Our findings indicate that all three parameters (street sections, building morphology, and density rates) can be used to independently predict urban wellbeing. This research presents a milestone in understanding the complex relationships between street sections, building morphology, and perceived density on urban wellbeing. The outcomes of this study can be implemented by urban designers, architects, and researchers, with the aim of creating more wellbeing-centered urban designs.
1. Introduction
Currently, majority of the human population lives in urban settings, which will increase significantly over the next few decades. By the year 2050, 68% of all humans are expected to be living in urban areas, equaling to about 2.5 billion more people than today [1]. As such, the wellbeing of urban dwellers is of utmost importance. In this paper, we explore the influence of 3D spatial/physical factors on the wellbeing of urban dwellers, including the street sections, morphology of buildings (i.e., street façade), and density levels. More specifically, this research paper explores the relationships between dense urban settings and residents’ wellbeing.
The term wellbeing is frequently addressed in the literature through a wide range of fields and definitions, and in relation to a variety of human domains, such as people’s health, education, and levels of comfort [2]. Within the urban setting, certain design parameters may also affect people’s wellbeing, such as feelings of safety and happiness, belonging, perceived density, and vibrancy [3], as well as the morphology of buildings [4,5,6,7,8]. Wellbeing has been found to increase in urban settings that are composed of more uniquely built environments rather than repetitive ones, and when some spaces are used for commercial purposes [1,3,6]. In addition, urban wellbeing is positively influenced by the existence of vegetation [9,10,11,12,13].
This paper employs diverse methodologies to assess and compute wellbeing while endeavoring to delineate the concept of urban wellbeing and its constituent elements. Wellbeing is a multifaceted construct with myriad definitions across various research domains, encompassing diverse facets of individuals’ lives, including health, comfort, dwelling, and education [2]. Previous studies have examined how urban design parameters can impact various dimensions of wellbeing, such as perceived density, vibrancy, belonging, happiness, and safety [3]. However, a comprehensive investigation into the influence of urban design parameters on all domains of wellbeing is yet to be undertaken. This study concentrates on individuals’ subjective feelings and sensations [14], utilizing validated wellbeing questionnaires as a foundational framework [15].
As urban settings are desirable for many people [16,17,18], studies strive to identify design principles that positively impact the needs of urban dwellers [7,19,20,21,22,23]. In areas that are densely populated, architectural designs must be carefully addressed as a means for ensuring quality living and enhanced wellbeing [24]. However, the relationship between dense residential developments (due to increased urban dwelling) and urban morphology is intertwined and intricate, and plays a key role in shaping urban settings [25]. As a result, research on the complex relationships between urban density, urban design, and urban wellbeing has been conducted extensively [7,26,27]. However, in today’s fast-paced, ever-growing and evolving world, urban researchers, planners, and designers must continuously examine urban wellbeing in light of the extensive urbanism, which includes traditional public spaces, modern urban forms, and new smart technologies [28].
Despite their importance for urban dwellers’ wellbeing, however, pedestrian spaces tend to be omitted from urban research studies, with such spaces being regarded simply as “leftovers” in urban street design. Streets are designed according to the size of motorized vehicle sizes, including lane widths, rather that according to the optimal sidewalk width, for example [29]. This is especially troubling as increased active mobility among pedestrians is beneficial for their wellbeing and the environment, enabling less space-consuming transportation options and with lower speeds [30].
The perception of enclosure experienced by individuals is influenced by the height of buildings on both sides of the street [31]. Stamps (2005) asserts that the degree of enclosure rises in tandem with the height of the vertical defining surfaces [32]. However, this relationship is not strictly linear, with greater disparities in the sense of enclosure observed between two-to-four-story buildings compared to four-to-six-story buildings. This observation aligns with Gehl’s (2010) concept of vertical thresholds, dividing buildings into three categories based on their potential interaction with the surroundings and streetscape [30].
Additionally, some studies posit that the importance of the sense of enclosure lies in its impact on the visual attention of pedestrians at the street level [21,33]. Urban designers and practitioners gauge the sense of enclosure using the enclosure rate, defined as the ratio between the building’s height and the street’s width. The recommended comfort range for enclosure rates is between 1:2 and 3:2 [34,35]; however, when the ratio reaches 1:6, pedestrians appear to lose their perception of an enclosing space [36].
Previous studies involved the evaluation of analytical models, replicating pedestrian movements within urban settings through behavioral virtual reality experiments. Our findings suggest that this approach contributes to the refinement and augmentation of analytical models, aligning them more closely with human perceptions of space and spatial preferences. These enhanced analytical models hold potential for assessing design proposals and aiding decision-makers by providing reliable simulation results indicative of residents’ potential wellbeing [37]. All street sections in the alternatives we presented to the subjects fall within the recommended range of enclosure rates by Alexander and Jane Jacobs [34,35] (0.5–1.5).
Gerike (2021) [29] presents two positive options for pedestrians: the supply-oriented approach, whereby the design and width of sidewalks are in line with the needs of the pedestrian and their activities at each specific location; and the demand-oriented approach, whereby attractive and wider sidewalks are provided at suitable locations, offering pedestrians space in which to move and conduct activities, thereby encouraging people to spend time on the streets, creating lively streets and cities. Either way, greenery, shade, shelter, and outdoor furniture positively impact pedestrian activity and should therefore be included in guidelines relating to urban street design [10,13,29,38,39,40,41]. Liveliness can be impacted through urban design via means such as commercial and public seating, independent businesses, varied buildings and blocks, and communal gathering places. Indeed, urban planners and designers must address the social aspects of streets [28], especially as a means for enhancing the wellbeing of urban dwellers [1].
According to Ref. [3], despite the importance of urban wellbeing and a large corpus of related literature, this term continues to be complex from both theoretical and practical point of views (Bardhan) [24,42]. Striving to achieve improved urban designs by placing peoples’ needs at the canter [30,43,44], this study examines the relationships between urban design forms and the wellbeing of urban residents. In the current study, urban wellbeing is defined by happiness, sense of safety, perceived density, sense of belonging and place attachment, and the liveliness of the street [1,3]. The Integrated Wellbeing Index (IWI) was defined as the average calculation of all senses above [45].
A framework, which integrates street morphology and human conduct with virtual reality (VR) has been previously described as an effective tool for studying the interaction of human behavior in urban environments [8,46,47,48,49,50,51]. The present study is extending our previous experiment, though conducted on the Qualtrics platform and not in a VR laboratory due to COVID-19. Urban environments, with differing building morphologies, street sections and densities, were presented to the participants via their personal computers.
2. Materials and Methods
2.1. Research Design
A previous research paper describes a case study of an urban street (i.e., Bloch Street) in Tel Aviv, of which the density and form were virtually transformed and intensified up to six times its actual density in real life. Two experiments were then conducted. The first focused on the impact of the density rate, existence of commerce and vegetation on participants’ wellbeing, while the second focused on the relationship between urban and building morphologies at one fixed level of density and the wellbeing of potential urban dwellers. The latter was based on the findings of the former experiment, whereby participants’ sense of wellbeing was only significantly affected by density when it was intensified more than four times the real-life density level of the case study. This study is based on the findings of these two previous experiments, focusing on the impact of morphology and street section at two density levels. This study focuses on virtual environments that scored the best and worst wellbeing rates in the two preliminary studies and adds the street section variable. The case study that was employed in both previous experiments and the current one is an existing street in Tel Aviv, as it is currently undergoing rapid urban renewal, densification, and population expansion. Moreover, TA was deemed particularly suitable as it meets all the criteria of prosperous urbanism with regard to congestion, urban supply, diverse population, various services, employment, and cultural activity [3,52,53].
Figure 1 depicts the relationship between the variations in two preceding studies, laying the groundwork for the current study detailed in this paper. The left vertical segment showcases illustrations of environments with varied density levels, as presented to participants in the first experiment. The horizontal set of illustrations, presented in the second experiment reported in this paper, features environments with uniform density levels, specifically the edge density level identified in the first experiment to maintain high wellbeing levels. The colored circles within the figure symbolize the different components of the Individual Wellbeing Index (IWI), with their sizes corresponding to the high/low values observed in both experiments.
In this study, the term density is defined as “the calculated built volume”, i.e., the existing built volume of the case study. The densified alternatives in this study were four and six times greater than the real density of the case study.
2.2. Participants
One hundred and forty-seven architecture students participated in this study, as part of a behavioral research course that was taught by one of the authors. Due to COVID-19 restrictions, the experiment was conducted using the Qualtrics Experience Management (XM) software platform [54]. All students signed an informed written consent form prior to participating in the experiment. Complete anonymity was ensured to all participants. Next, students received a link via email to access the experiment. Each participant was asked to watch a total of 11 videos that simulated their traversing through variant environments and complete a wellbeing questionnaire after watching each video.
2.3. Virtual Simulation
Tools for studying the impact of urban environments and architecture on wellbeing combine virtual reality (VR) laboratories, urban morphology, and spatial human behavior [8,47,48,49,50,51,55,56]. However, due to COVID-19 restrictions and limitations, the behavioral experiments in the current study were conducted remotely via Qualtrics XM [54], not in a VR laboratory. Using this platform, the participants were exposed to a set of videos simulating a range of urban environments that differed in density, vegetation, and building morphology, on their own personal computers. Simulations were created in SketchUp 2020 (Trimble, Sunnyvale, CA, USA) and then rendered in TwinMotion 2021.1 (Epic Games, Cary, NC, USA) to create a realistic scenery of people and traffic.
Twenty-one environments were created using three street sections, five building morphologies, and two densification rates (Table 1). Built morphologies with the highest and lowest wellbeing scores from the two previous experiments mentioned above [3] were applied in this experiment through three types of street sections (Figure 2).
Street sections: a boulevard street section, an integrated street section, and a two-lane street section. (1) The boulevard street section was 34 m wide, avenue-type, based on the renowned Rothschild Avenue in Tel Aviv. This street section was composed of four traffic lanes, two in each direction, with trees and vegetation along both sidewalks. This section also had a 7 m wide walkable avenue in the center of the four lanes, as well as a dedicated bike lane in both directions [57]. (2) The integrated street section was also 34 m wide, based on a typical large street type in Tel Aviv, comprising four traffic lanes, two in each direction. Greenery was added to the traffic islands. This section also had two central electric tram lanes, one in each direction, similar to Arlozorove Street in Tel Aviv which is currently under construction. (3) The two-lane (two way) street section was 21 m wide, a medium sized street type in Tel Aviv, similar to the original case study (Bloch Street) examined in the original experiment. Alongside each lane was a dedicated bike lane, with posts separating the car lanes from the bike lanes. Each sidewalk was 5 m wide, with street vegetation composed of trees and private front gardens. A parking lane was also located along one side of the street.
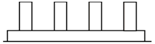
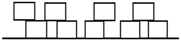
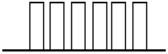
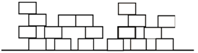
Building morphology. The following are the five building morphologies that were applied to the three street sections (Figure 3): (1) all plots at the street level housed high-rise buildings (i.e., plot consolidation with a high rise). Resulting in two types of street sections, this morphology was previously evaluated as having medium-to-good wellbeing ratings [6]. (2) The medium volume composition morphology allows for many outdoor private spaces. Creating a varied street section, this morphology was previously evaluated as having high wellbeing ratings [6]. (3) High-rise (tower-based) buildings, as the most commonly seen morphology in urban areas undergoing densification, were previously evaluated as having medium-to-low wellbeing ratings [3]. (4) The small volume composition is composed of small volumetric units, and this morphology was evaluated as having the highest wellbeing ratings in previous research [3]. (5) Merging all plots on the street (i.e., plot consolidation), a monotonous, continuous block morphology, is a single street section along the street, evaluated as having the lowest wellbeing ratings in previous experiments [3].
Volumetric density. In a previous study [3], the small-volume composition (morphology #4) was rated with the highest wellbeing results in previous research, and towers (morphology #3) were tested in two density levels: four times and six times the density level of the original case study (Bloch Street).
Two density levels were defined, 4X and 6X, based on previous study [3]. X = 170,000 m3 the existing built volume on both sides of Bloch Street. It contains a four-story building with a 20–25 m width façade and 8 m gap between the buildings and the state of Bloch Street before urban renewal. Moreover, 4X represents four times the built volume on Bloch Street, while 6X represents six times the built volume. Twenty-one alternative virtual environments were created (see Table 1A). In all environments, the quantity of virtual vegetation, traffic, and people was similar.
2.4. Wellbeing Questionnaire
The participants were asked to fill out a validated wellbeing questionnaire [14,15]. To increase reliability of the answers, each participant receive all questionnaires in a random sequence of questions. Moreover, certain adjustments were made to the questionnaire to better suit urban wellbeing [45,58,59]. Each participant viewed 11 virtual environments (out of the 21 existing environments, based on an incomplete statistical block design) and completed 11 questionnaires. After viewing each environment, the participants were asked to rate 18 items on a Likert-like scale of 1 (not at all) to 5 (very much so), for example, “I feel happy when I walk along this street” or “There are unsafe places along this street” (Supplementary Materials).
2.5. Statistical Analysis
Rather than asking the participants to view and rate 21 virtual environments, which is time-consuming and would probably entail decreased attention and focus during the study, the experiment was performed as an incomplete block [60], whereby participants were asked to evaluate a total of 11 virtual environments. The following is the allocation matrix (Table 1B):
For dimensionality reduction, we performed principal component (PC) analysis (Figure 4) using oblique rotation, to identify different wellbeing domains. PCs were included if their eigenvalue was >1 (Figure 4a). Each item on the questionnaire was assigned to one PC based on the highest correlation between the item and the PC (Figure 4b). We transformed the values of the wellbeing questions to the PC space, and all following analyses were performed on the PC values. Next, we defined the IWI as the mean of the values of all included PCs [45]. For hypothesis testing, we only used nonparametric tests to avoid assumptions of normality.
Continuous variables are described as medians (interquartile range [IQR]) and were contrasted with the multi-group Kruskal–Wallis test. If a significant difference was identified, pairwise comparisons were performed with the Mann–Whitney U rank test. Categorical variables are described as counts (percentages) and were contrasted with Fisher’s exact test.
Univariable linear regression analysis was performed to examine street section, morphology, and density, and as possible predictors of wellbeing PC scores. All factors identified as significant or marginally significant (p < 0.2) predictors were entered into a multivariable regression model to examine their independent predictive ability [61,62]. Regression analyses are reported as β [95%CI]. Correction for multiple comparisons was performed with the false discovery rate (FDR) [63]. All statistical analyses were performed with R Core Team V.4.1.1 (R foundation for statistical computing, Vienna, Austria, 2021). Statistical significance was set at p < 0.05 and all tests were two-sided.
3. Findings
The authors’ affiliated Ethics Committee approved this study. Of the 147 participants who took part in the study, 134 (92%) participants were younger than 35 years, 125 (86%) were single, 63 (84%) were born in Israel, 88 (60%) lived in urban areas, and 41 (28%) declared living in a dense urban environment (Table 2). The PC analysis is described in Figure 4.
3.1. Descriptive Statistics
Density. Of the five wellbeing domains, happiness, belonging, and perceived density positive values were found to be significantly higher in the 4x density compared to the 6x density levels (Figure 5). The remaining two domains (safety and vibrancy) were similar across the different densities. IWI values were significantly higher for the 4x compared to 6X densities.
Street section. Happiness values were significantly higher for the boulevard than for the other two street sections (integrated and two lanes). However, belonging values were the highest for the two-lane section and lowest for the boulevard. Perceived density, safety, and vibrancy values were the lowest for the two-lane street section, yet had similar values for the other two sections. Finally, IWI values were the highest for the Boulevard, followed by the integrated street section. The two-lane street section exhibited the lowest IWI values (Figure 6).
Morphology. Happiness values were the highest for the small-volume composition and the lowest for plot consolidation. No significant differences were seen between other morphologies. Safety values were the highest for plot consolidation with high-rise buildings, with no significant difference between other morphologies. Moreover, no significant differences were seen in perceived density values between morphologies. Belonging values were the lowest for plot consolidation with high-rise buildings, and the highest for plot consolidation, high-rise buildings, and medium-volume compositions. Finally, vibrancy values were the highest for a medium-volume composition, followed by the small-volume composition. The lowest vibrancy values were seen in plot consolidations with high-rise buildings. IWI values were the highest for small-volume compositions and the lowest for plot consolidation (Figure 7).
3.1.1. High-Rise Morphology
When focusing on tower morphologies (plot consolidations with high-rise morphologies #1 and #3), all wellbeing domains had higher values in the 4x density, except for vibrancy (Figure 8a).
For the boulevard street sections with high-rise morphologies, happiness, belonging, vibrancy, and IWI values were significantly higher for the 4x density levels (Figure 8b).
Safety and IWI values were significantly higher for the lower density level (4x) in the integrated street section with high-rise morphologies (Figure 8c).
Happiness values were significantly lower in the 4x density for the two-lane street section with the high-rise morphologies. All other morphologies were similar across both densities (Figure 8d).
3.1.2. Small-Volume Composition Morphology
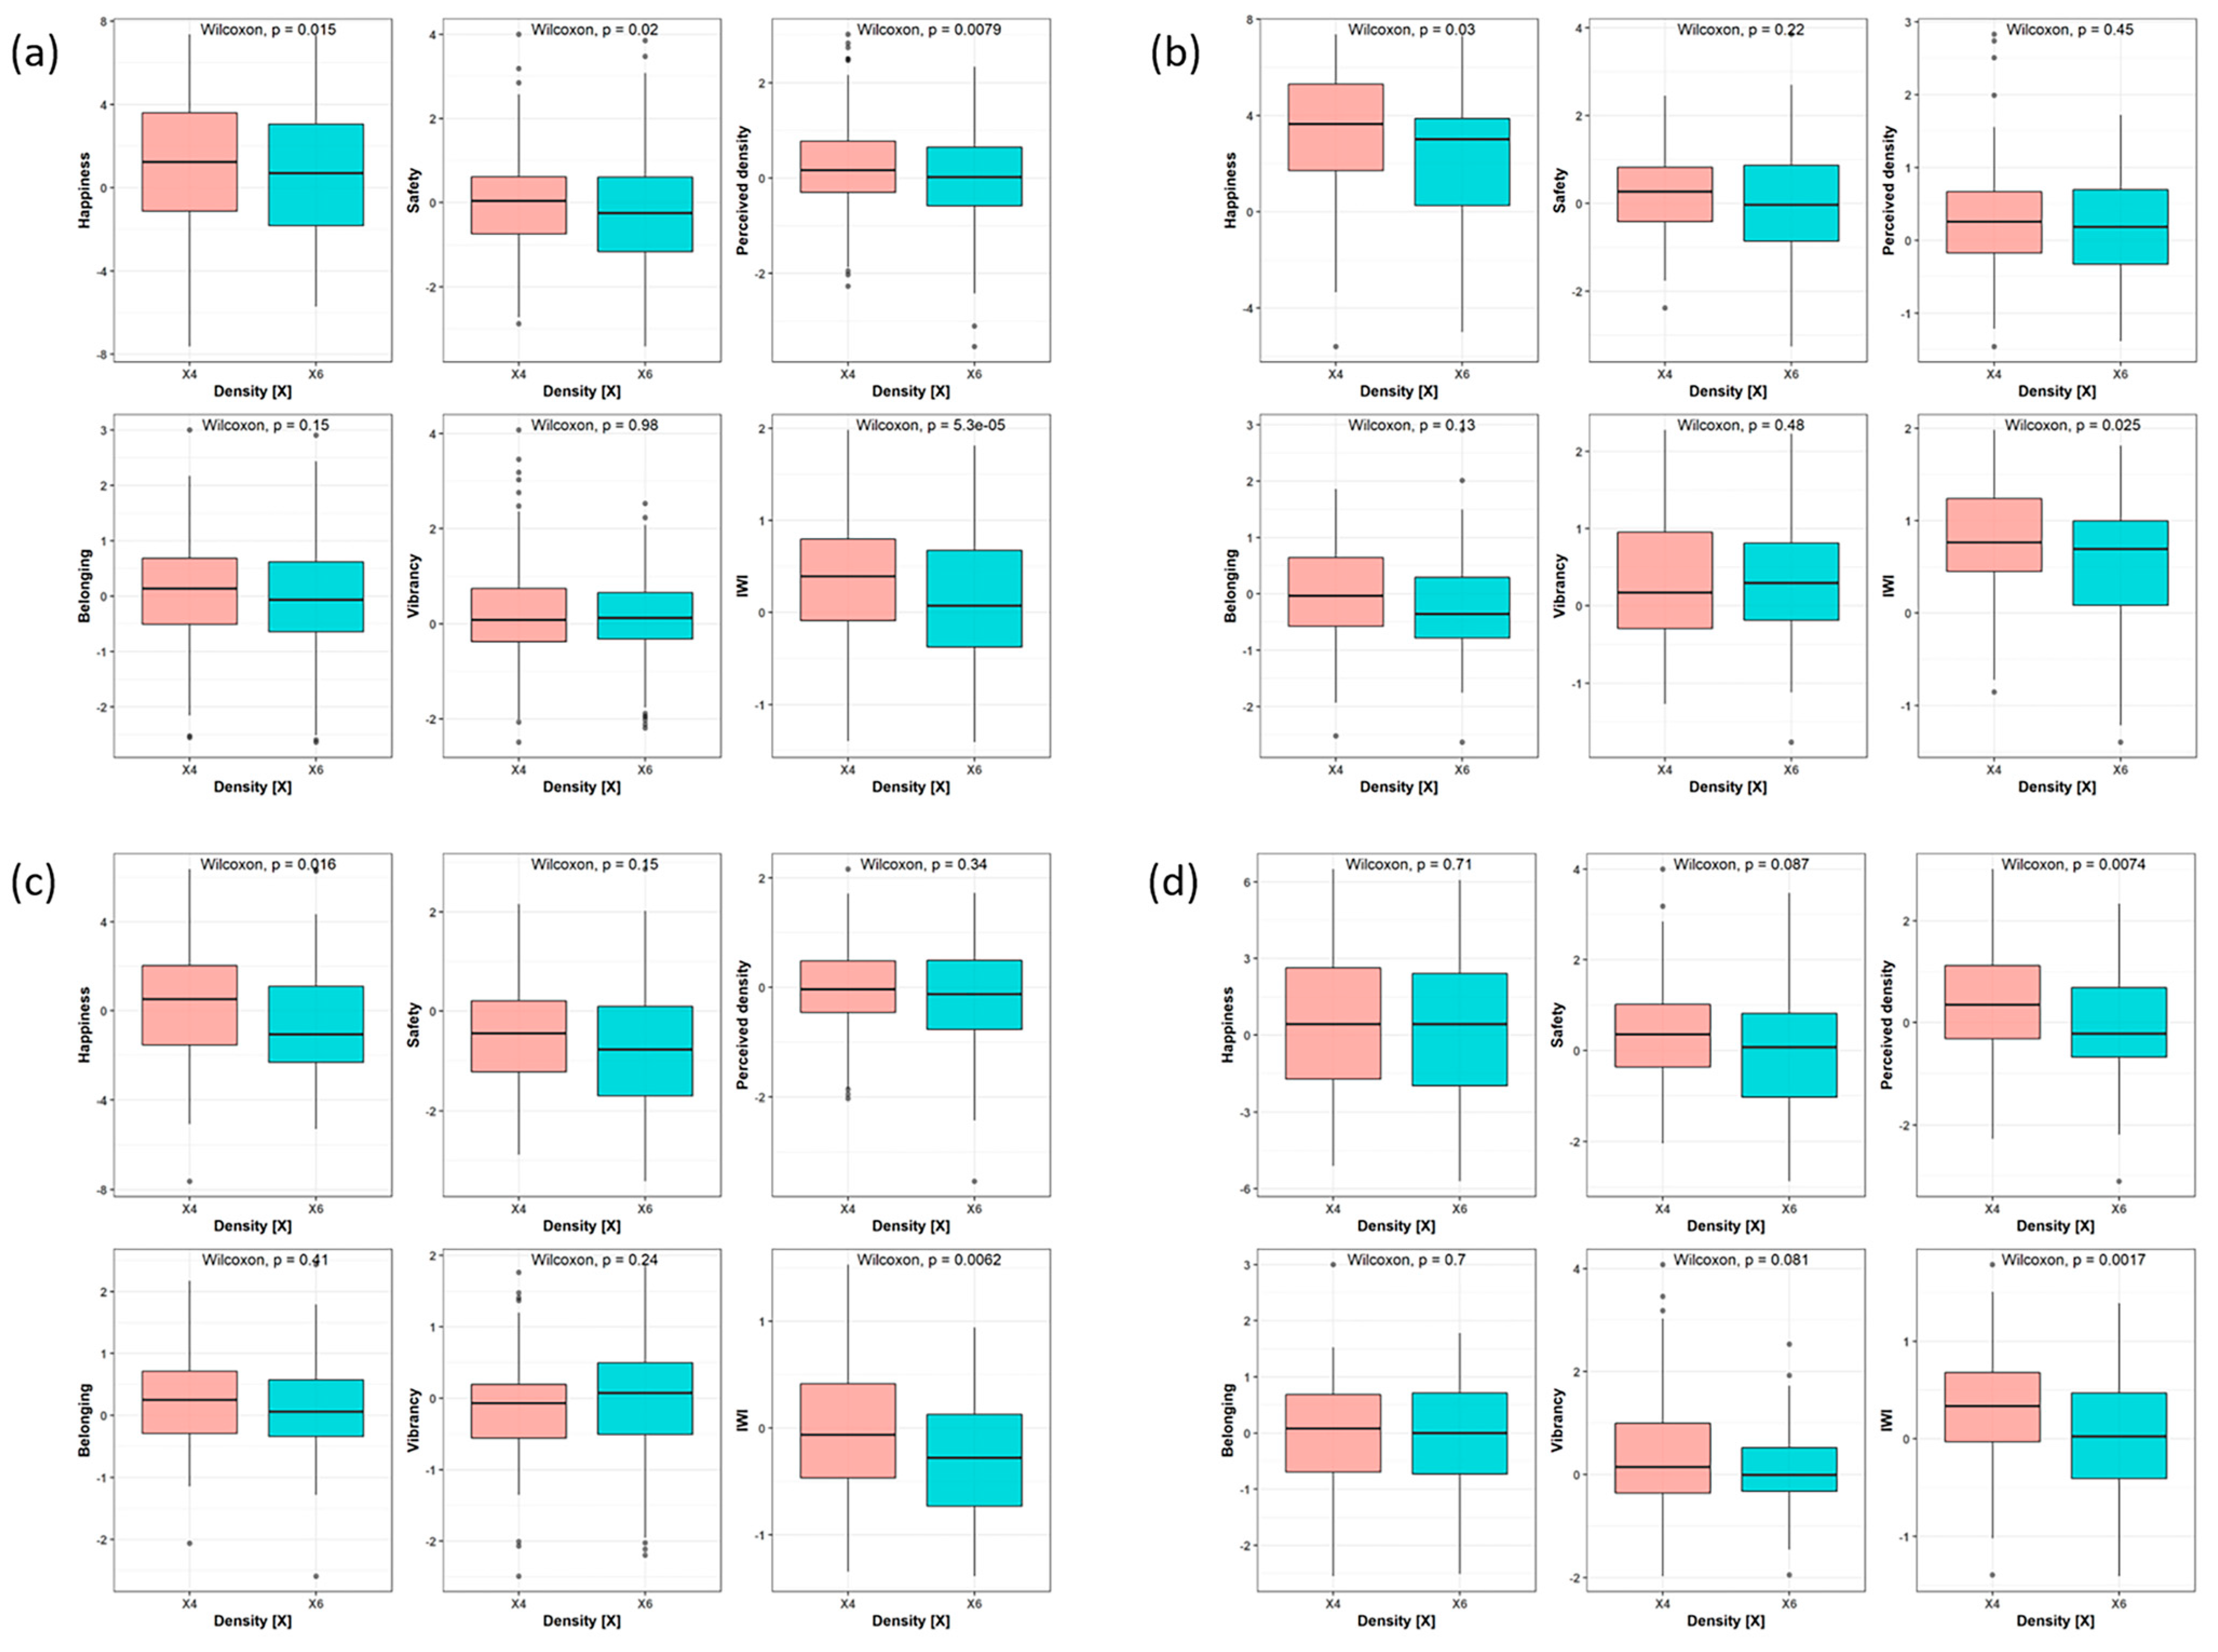
In the small-volume composition morphology, belonging and vibrancy values were similar across both densities, while all other wellbeing domain values were higher for the lower (4x) density (Figure 9a).
Happiness and IWI values were significantly higher in the 4x density for the boulevard street section and the small-volume composition. All other wellbeing domains were similar across the different densities (Figure 9b).
Happiness and IWI values were significantly higher in the lower (4x) density for the two-land street section with a small-volume composition. No other differences were demonstrated across density levels (Figure 9c).
Perceived density and IWI values were significantly higher for the lower (4x) density in the integrated street section with a small-volume composition (Figure 9d).
3.2. Regression Analyses
Density. Univariable analysis indicates that the higher density (6x) was a predictor of lower happiness and belonging, and higher perceived density. Density was not found to be a predictor of safety or vibrancy. Moreover, the higher density predicted lower IWI values (Table 3).
Street section. Compared to the boulevard section, the two-lane street section was a predictor of lower values for all five PC domains and IWI, except belonging where it predicted higher values. Furthermore, the integrated street section was a predictor of lower happiness and IWI. An integrated street section was not an independent predictor of safety, perceived density, or vibrancy (Table 4).
Morphology. Wellbeing domain associations with morphology are described in Table 5. A small-volume composition was most strongly associated with happiness (β 2.3 95% CI [1.7, 3]) among all morphologies. Plot consolidation with high-rise morphology was the only significant predictor of safety (with an average increase of 0.53 [0.22, 0.84] in safety value compared with plot consolidation) among the different morphologies. None of the morphologies predicted perceived density. Belonging values were predicted by plot consolidation with high-rise buildings, followed by a medium-volume composition (with an average increase of 0.65 [0.41, 0.89] and 0.54 [0.30, 0.78] in belonging compared with plot consolidation, respectively). Vibrancy values were positively predicted by all morphologies except for high-rise buildings. Finally, IWI was positively predicted by all morphologies, with the strongest association between plot consolidation and high-rise buildings (0.65 [0.41, 0.89]).
3.3. Multivariable Regression Analysis
Since density did not predict safety and vibrancy, and morphology did not predict perceived density, these features were excluded from the multivariable analysis. All variables were independent predictors of all wellbeing domains, except for density that did not significantly predict safety and vibrancy values, and morphology that did not predict perceived density values. Street section had the strongest association with happiness, safety, and vibrancy, with boulevard predicting the highest values. Density and street section had similar associations with perceived density, and density had the lowest association with belonging. Finally, street section, density, and morphology predicted IWI independently of one another, with street section having the greatest impact on IWI values (Table 6).
4. Discussion
In line with previous studies, this experiment indicates the great impact of density, morphology, and street sections on the wellbeing of city dwellers. All wellbeing domains (happiness, safety, perceived density, belonging, vibrancy) received higher values for the lower density than for the higher one—a finding that was reinforced by the univariable regression model, whereby the volumetric density rate along the street was found to be a significant predictor of IWI values (β = −0.31 [−0.38, −0.23]). Similar to previous studies on wellbeing at various density levels [3,6], the current study shows that IWI values are significantly higher for lower densities along the street than for higher ones. The current study also reinforces findings, whereby lower density levels predict higher IWI values. For example, higher levels of actual density were found to create higher levels of perceived density, which in turn retracted from people’s sense of wellbeing [50,64,65].
The boulevard street section provided the highest values for all wellbeing domains except for belonging, while the two-lane street section presented the lowest values. This aligns with previous research that advocates for a comfort range of enclosure rates between 1:2 and 3:2 [34,35]. Notably, all the sections and morphologies we examined fall within this recommended range. However, for the boulevard and integrated sections of the two-lane street, half of the enclosure rates were outside this range, which may contribute to explaining the lower values observed for that particular street section.
Our regression analysis also demonstrated the positive influence of the boulevard street section and the negative effect of the two-lane street section on wellbeing. These results imply that the wider the street section is, the lower the actual measured density is, mitigating the detrimental effect of densification processes on wellbeing. Moreover, our results show that all three parameters, i.e., density, morphology, and street section, independently predict wellbeing values. For example, high density constraints combined with a wide street section and a small-volume composition (i.e., more dynamic morphology) will compensate the low wellbeing values caused by the high density level. As such, these three parameters may offer urban designers flexibility in maintaining reasonable urban wellbeing values.
In a univariable model focusing on the street section, we also found that belonging values were higher for the two-lane street section, whereby the narrower the street, the higher the sense of belonging. This is in line with previous claims, whereby human-scale street sections contribute to feelings of belonging and safety [30,35,44]. Similar to previous work on wellbeing in various density levels, in this study the IWI values were found to be significantly higher for the lower volumetric density level than for the higher one. The current study reinforces earlier findings whereby lower density levels predict higher IWI values.
Similar results were also seen for the high rise morphology, whereby for all street sections, the 4x volumetric density was associated with higher IWI values in a high rise morphology. The impact of volumetric density along the street side persisted, regardless of the street section. In addition, for the small-volume composition, higher IWI values were found with a 4x density compared to the 6x density. However, when using a small-volume composition, the effect of volumetric density was significantly diminished across all three street sections or most wellbeing domains. These results suggest that density independently influences wellbeing, regardless of the street section and morphology, except in cases of a small-volume composition, which almost completely negates the effect of density. The results of this study further reinforce the results of previous studies [3,6], whereby the more complex the morphology and the less repetitive the patterns, the higher the sense of wellbeing. As such, urban wellbeing increases when the morphology is more complex and less repetitive, thereby creating a sense of human scale. We also found a trend whereby people prefer the small/medium-volume composition over other morphologies, which is line with previous findings, whereby a good city is one that creates a balance between order and form [66].
The multivariable regression model reinforces the results of the univariate regression analysis, demonstrating that all three variables independently predict wellbeing. Similarly, the 4x density predicted higher IWI values. Findings whereby the higher the density the lower the IWI were also seen in a previous study [3], where urban environments can be densified up to 4x (4x = 680,000 m3; street width 21 m) and still maintain wellbeing in urban residents. From this limit onward, however, a significant impairment in people’s sense of wellbeing is seen, even if vegetation and commerce are added. In this study, we showed that there is a significant decline in IWI values when transitioning from a 4x to a 6x density, and that certain morphologies we improve IWI values even at higher densities such as 6x, as claimed in previous studies [23].
In addition, the boulevard street section predicted the highest IWI and happiness values, while the two-lane section predicted the lowest perceived density, safety, and vibrancy values. Interestingly, the two-lane section predicted the highest belonging values. This result is a milestone in understanding the relationship between street section and urban wellbeing, indicating that any street section can contribute to different aspects of wellbeing. This important finding could be added to our knowledge of how to design a pedestrian-friendly street [10,13,39,67,68] to enhance how the pedestrian feels.
Finally, regarding the morphology parameter, we showed that the small-volume composition predicted the highest IWI values, similar to plot consolidation with high-rise buildings. However, the plot consolidation morphology (i.e., a continuous block) predicted the lowest IWI values. Plot consolidation alone was found to predict low IWI values in all our studies [3], yet this study is unique as it shows that this morphology combined with high-rise morphology creates a changing, diverse and complexed street section that receives high IWI values. As such, applying the findings of this study for all three parameters offers urban designers the flexibility and knowledge needed when planning in urban dense environments to address urban residents’ wellbeing.
Our findings indicate that all three design parameters (street sections, building morphology, and density rates) can be used to independently predict urban wellbeing. More specifically, we found that a higher-perceived density predicts lower urban wellbeing. Moreover, the wider the street section, the higher the urban wellbeing. Finally, the boulevard street section provided the highest wellbeing values, while the two-lane street section presented the lowest values. Further studies are needed to elucidate the interplay between additional parameters and their effect on urban wellbeing.
5. Limitations
Our study has several limitations. First, the research population is mostly homogenous, mainly consisting of architecture students. Differences were seen in previous studies as to how people perceive urban environments, depending on their background in architecture or design [69]. Moreover, the age distribution of the participants in this study is narrow, with most participants being younger than 35. Finally, most participants were single and had no children. As such, generalizations of these findings to the general public should be made with caution. Future research could therefore benefit from performing similar experiments with a larger range of participants.
Secondly, due to the COVID-19 pandemic, the experiments were not conducted in a VR laboratory. Instead, the study was conducted via the Qualtrics platform, with the participants taking part in the study from the comfort of their home. However, although this differs from immersive devices, our findings are similar in all three experiments, each of which was conducted using a different 3D methodology (visualization lab wide screen, Vive HTC, and Qualtrics). Moreover, the current findings validate all three VR methods. The absence of a VR laboratory setting could have impacted the immersive experience and participants’ responses. Therefore, the findings might differ in a more controlled and immersive environment.
Lastly, the study did not test the interaction between different environmental features as this is a hypothesis-generating study. Since we have three features, adding all the interaction terms will render the model unexplainable. We believe that restricting our model is the right strategy and our results should be the basis of designing future studies that can examine the interaction between features and their effect on wellbeing.
6. Future Research
Further investigation into higher density levels and additional building morphologies could offer additional insights into the intricate interactions between design parameters and wellbeing. Our use of a generic building facade across all experiments means that we did not assess the impact of varying facade styles (such as balconies and visual complexity), textures, and colors on dwellers’ wellbeing. Exploring additional street sections might enable a more comprehensive examination of the interplay between street sections, density, and building morphology. It is worth noting that research analyzing the relationships between spatial parameters and urban wellbeing contributes significantly to accurate predictions of wellbeing for city dwellers.
Finally, this research is part of a series of experiments aimed at creating a theoretical framework for establishing urban architecture and design principles. We hope to emphasize the importance of specific parameters on urban dwellers’ wellbeing, which could pave the way to additional research for establishing additional principals that should be implemented in dense urban spaces to enhance urban wellbeing in city residents.
Supplementary Materials
The following supporting information can be downloaded at: https://www.mdpi.com/article/10.3390/buildings14010211/s1.
Author Contributions
Y.T.H. conducted the study presented in this paper as part of her PhD research. The research was supervised by D.F.-G. All authors have read and agreed to the published version of the manuscript.
Funding
Israel Science Foundation (Grant no. 1485/15) and scholarship from Mr. and Mrs. Langsam of the Jack Langsam Fellowship Fund.
Data Availability Statement
Data are available on request from the corresponding author.
Conflicts of Interest
The authors report there are no competing interests to declare.
References
- Haifler-Trossman, Y.; Fisher-Gewirtzman, D. Urban Well-Being in Dense Cities—The influence of densification strategies, experiment in virtual reality. In Proceedings of the eCAADe 2020, Berlin, Germany, 16–17 September 2020; pp. 323–332. [Google Scholar]
- Diener, E.; Suh, E.; Oishi, S. Recent findings on subjective well-being. Indian J. Clin. Psychol. 1997, 24, 25–41. [Google Scholar]
- Trossman-Haifler, Y.; Fisher-Gewirtzman, D. How urban wellbeing is influenced by spatial urban parameters (density, morphology, vegetation & commerce), as examined in a VR framework. Archit. Sci. Rev. 2022, 65, 370–384. [Google Scholar]
- Alexander, E.R. Density measures: A review and analysis. J. Archit. Plan. Res. 1993, 10, 181–202. [Google Scholar]
- Fisher-Gewirtzman, D.; Burt, M.; Tzamir, Y. A 3-D visual method for comparative evaluation of dense built-up environments. Environ. Plan. B Plan. Des. 2003, 30, 575–587. [Google Scholar] [CrossRef]
- Haifler-Trossman, Y.; Fisher-Gewirtzman, D. Urban Wellbeing, As Influenced by Densification Rates and Building Typologies—A Virtual Reality Experiment. In Proceedings of the CAADRIA 2020, Bangkok, Thailand, 5–6 August 2020. [Google Scholar]
- Martin, L.; March, L. Urban Space and Structures; Cambridge University Press: Cambridge, UK, 1972. [Google Scholar]
- Steadman, P. Building Types and Built Forms; Troubador Publishing Ltd.: Leicester, UK, 2014. [Google Scholar]
- Bai, X.; Nath, I.; Capon, A.; Hasan, N.; Jaron, D. Health and wellbeing in the changing urban environment: Complex challenges, scientific responses, and the way forward. Curr. Opin. Environ. Sustain. 2012, 4, 465–472. [Google Scholar] [CrossRef]
- Gilchrist, K.; Brown, C.; Montarzino, A. Workplace settings and wellbeing: Greenspace use and views contribute to employee wellbeing at peri-urban business sites. Landsc. Urban Plan. 2015, 138, 32–40. [Google Scholar] [CrossRef]
- Ke, X.; Gatzweiler, F.W. Health and Well-Being in the Changing Urban Environment. In Urban Health and Wellbeing Programme; Springer: Berlin/Heidelberg, Germany, 2020; pp. 65–70. [Google Scholar]
- Wolch, J.R.; Byrne, J.; Newell, J.P. Urban green space, public health, and environmental justice: The challenge of making cities ‘just green enough’. Landsc. Urban Plan. 2014, 125, 234–244. [Google Scholar] [CrossRef]
- Lee, A.C.K.; Jordan, H.C.; Horsley, J. Value of urban green spaces in promoting healthy living and wellbeing: Prospects for planning. Risk Manag. Healthc. Policy 2015, 8, 131–137. [Google Scholar] [CrossRef]
- Nishio, S.; Ito, F. Statistical validation of utility of head-mounted display projection-based experimental impression evaluation for sequential streetscapes. Environ. Plan. B Urban Anal. City Sci. 2019, 47, 1167–1183. [Google Scholar] [CrossRef]
- Fuller, R.A.; Irvine, K.N.; Devine-Wright, P.; Warren, P.H.; Gaston, K.J. Psychological benefits of greenspace increase with biodiversity. Biol. Lett. 2007, 3, 390–394. [Google Scholar] [CrossRef]
- Fisher-Gewirtzman, D. The association between perceived density in minimum apartments and spatial openness index three-dimensional visual analysis. Environ. Plan. B Urban Anal. City Sci. 2017, 44, 764–795. [Google Scholar] [CrossRef]
- Moos, M. “G enerationed” space: Societal restructuring and young adults’ changing residential location patterns. Can. Geogr./Le Géographe Canadien 2014, 58, 11–33. [Google Scholar] [CrossRef]
- Myers, D. Peak millennials: Three reinforcing cycles that amplify the rise and fall of urban concentration by millennials. Hous. Policy Debate 2016, 26, 928–947. [Google Scholar] [CrossRef]
- Hawley, A.H. Community power and urban renewal success. Am. J. Sociol. 1963, 68, 422–431. [Google Scholar] [CrossRef]
- Lynch, K. Good City Form; MIT Press: Cambridge, MA, USA, 1984. [Google Scholar]
- Rapoport, A. Human Aspects of Urban Form; Pergamon Oxford: Oxford, UK, 1977; Volume 3. [Google Scholar]
- Fisher-Gewirtzman, D. Can 3D Visibility Calculations along a Path Predict the Perceived Density of Participants Immersed in a Virtual Reality Environment? In Proceedings of the Eleventh International Space Syntax Symposium, Lisbon, Portugal, 3–7 July 2017; pp. 160.1–160.18. [Google Scholar]
- Fisher-Gewirtzman, D.; Wagner, I.A. Spatial openness as a practical metric for evaluating built-up environments. Environ. Plan. B Plan. Des. 2003, 30, 37–49. [Google Scholar] [CrossRef]
- Bardhan, R.; Kurisu, K.; Hanaki, K. Does compact urban forms relate to good quality of life in high density cities of India? Case of Kolkata. Cities 2015, 48, 55–65. [Google Scholar] [CrossRef]
- Cheng, V. Understanding density and high density. In Designing High-Density Cities; Routledge: London, UK, 2009; pp. 37–51. [Google Scholar]
- Churchman, A. Disentangling the concept of density. J. Plan. Lit. 1999, 13, 389–411. [Google Scholar] [CrossRef]
- Berghauser Pont, M.Y.; Haupt, P.A. Space, Density and Urban Form. Ph.D. Thesis, Delft University of Technology, Delft, The Netherlands, 2009. [Google Scholar]
- Mehta, V.; Bosson, J.K. Revisiting lively streets: Social interactions in public space. J. Plan. Educ. Res. 2021, 41, 160–172. [Google Scholar] [CrossRef]
- Gerike, R.; Koszowski, C.; Schröter, B.; Buehler, R.; Schepers, P.; Weber, J.; Wittwer, R.; Jones, P. Built Environment Determinants of Pedestrian Activities and Their Consideration in Urban Street Design. Sustainability 2021, 13, 9362. [Google Scholar] [CrossRef]
- Gehl, J. Cities for People; Island Press: Washington, DC, USA, 2013. [Google Scholar]
- Lindal, P.J.; Hartig, T. Architectural variation, building height, and the restorative quality of urban residential streetscapes. J. Environ. Psychol. 2013, 33, 26–36. [Google Scholar] [CrossRef]
- Stamps, A.E. III. Enclosure and safety in urbanscapes. Environ. Behav. 2005, 37, 102–133. [Google Scholar] [CrossRef]
- Mehta, V. Look closely and you will see, listen carefully and you will hear: Urban design and social interaction on streets. J. Urban Des. 2009, 14, 29–64. [Google Scholar] [CrossRef]
- Alexander, C. A Pattern Language: Towns, Buildings, Construction; Oxford University Press: Oxford, UK, 1977. [Google Scholar]
- Jacobs, A.B. Great Streets; University of California Transportation Center: Berkeley, CA, USA, 1993. [Google Scholar]
- Robert Davis, A.D.; Plater-Zyberk, E. The Lexicon of the New Urbanism; Duany Plater-Zyberk & Company: Miami, FL, USA, 2002. [Google Scholar]
- Yosifof, R.; Trossman-Haifler, Y.; Fisher-Gewirtzman, D. VR Experiment that Supports the Development of Analytical Tools for Simulating and Predicting Urban Well-Being. Co-Creat. Future Incl. Through Des. 2022, 2, 485–494. [Google Scholar]
- Glaeser, E. Triumph of the City; Pan: London, UK, 2011. [Google Scholar]
- Nagendra, H.; Gopal, D. Street trees in Bangalore: Density, diversity, composition and distribution. Urban For. Urban Green. 2010, 9, 129–137. [Google Scholar] [CrossRef]
- Ulrich, R.S. Biophilia, biophobia, and natural landscapes. Biophilia Hypothesis 1993, 7, 73–137. [Google Scholar]
- Kellert, S.R.; Wilson, E.O. The Biophilia Hypothesis; Island Press: Washington, DC, USA, 1993. [Google Scholar]
- Tonne, C.; Adair, L.; Adlakha, D.; Anguelovski, I.; Belesova, K.; Berger, M.; Brelsford, C.; Dadvand, P.; Dimitrova, A.; Giles-Corti, B. Defining pathways to healthy sustainable urban development. Environ. Int. 2020, 146, 106236. [Google Scholar] [CrossRef]
- Carmona, M. Public Places, Urban Spaces: The Dimensions of Urban Design; Routledge: London, UK, 2010. [Google Scholar]
- Sim, D. Soft City: Building Density for Everyday Life; Island Press: Washington, DC, USA, 2019. [Google Scholar]
- Tabachnick, B.G.; Fidell, L.S.; Ullman, J.B. Using Multivariate Statistics; Pearson: Boston, MA, USA, 2007; Volume 5. [Google Scholar]
- Fisher-Gewirtzman, D.; Bruchim, E. Considering Variant Movement Velocities on the 3D Dynamic Visibility Analysis (DVA)—Simulating the perception of urban users: Pedestrians, cyclists and car drivers. In Proceedings of the 36th eCAADe Conference, Lodz, Poland, 19–21 September 2018; pp. 569–576. [Google Scholar]
- Fisher-Gewirtzman, D. Integrating ‘weighted views’ to quantitative 3D visibility analysis as a predictive tool for perception of space. Environ. Plan. B Urban Anal. City Sci. 2018, 45, 345–366. [Google Scholar] [CrossRef]
- Kaya, H.S.; Mutlu, H. Modelling 3D spatial enclosure of urban open spaces. J. Urban Des. 2017, 22, 96–115. [Google Scholar] [CrossRef]
- Kuliga, S.F.; Thrash, T.; Dalton, R.C.; Hoelscher, C. Virtual reality as an empirical research tool—Exploring user experience in a real building and a corresponding virtual model. Comput. Environ. Urban Syst. 2015, 54, 363–375. [Google Scholar] [CrossRef]
- Natapov, A.; Fisher-Gewirtzman, D. Visibility of urban activities and pedestrian routes: An experiment in a virtual environment. Comput. Environ. Urban Syst. 2016, 58, 60–70. [Google Scholar] [CrossRef]
- Shushan, Y.; Portugali, J.; Blumenfeld-Lieberthal, E. Using virtual reality environments to unveil the imageability of the city in homogenous and heterogeneous environments. Comput. Environ. Urban Syst. 2016, 58, 29–38. [Google Scholar] [CrossRef]
- Ford, L.R. Lynch revisited: New urbanism and theories of good city form. Cities 1999, 16, 247–257. [Google Scholar] [CrossRef]
- Lynch, K. The Image of the City; MIT Press: Cambridge, MA, USA, 1960; Volume 11. [Google Scholar]
- Qualtrics.com. QualtricsXM. Available online: https://www.qualtrics.com/uk/lp/uk-ppc-experience-management/?utm_source=google&utm_medium=ppc&utm_campaign=ME|SRC|BRD|Qualtrics&campaignid=12266883524&utm_content=&adgroupid=118216226780&utm_keyword=qualtrics&utm_term=qualtrics&matchtype=e&device=c&placement=&network=g&creative=496759449091&gclid=Cj0KCQjwmuiTBhDoARIsAPiv6L8GN4Jhppnne0AfDMTU7RjXMrZj5HGDikPuv_kdomN2X-ghLI_LxrAaAl8VEALw_wcB (accessed on 5 January 2024).
- Fisher-Gewirtzman, D. Perception of density by pedestrians on urban paths: An experiment in virtual reality. J. Urban Des. 2018, 23, 674–692. [Google Scholar] [CrossRef]
- Portman, M.E.; Natapov, A.; Fisher-Gewirtzman, D. To go where no man has gone before: Virtual reality in architecture, landscape architecture and environmental planning. Comput. Environ. Urban Syst. 2015, 54, 376–384. [Google Scholar] [CrossRef]
- Macdonald, E. Building a boulevard. ACCESS Mag. 2006, 1, 2–9. [Google Scholar]
- Fish, C.J. Place, emotion, and environmental justice in Harlem: June Jordan and Buckminster Fuller’s 1965 “architextual” collaboration. Discourse 2007, 29, 330–345. [Google Scholar] [CrossRef]
- Jiang, B.; Larsen, L.; Deal, B.; Sullivan, W.C. A dose–response curve describing the relationship between tree cover density and landscape preference. Landsc. Urban Plan. 2015, 139, 16–25. [Google Scholar] [CrossRef]
- Fleiss, J.L. Balanced incomplete block designs for inter-rater reliability studies. Appl. Psychol. Meas. 1981, 5, 105–112. [Google Scholar] [CrossRef]
- Bursac, Z.; Gauss, C.H.; Williams, D.K.; Hosmer, D.W. Purposeful selection of variables in logistic regression. Source Code Biol. Med. 2008, 3, 17. [Google Scholar] [CrossRef]
- Zhang, Z. Model building strategy for logistic regression: Purposeful selection. Ann. Transl. Med. 2016, 4, 111. [Google Scholar] [CrossRef]
- Benjamini, Y.; Yekutieli, D. The control of the false discovery rate in multiple testing under dependency. Ann. Stat. 2001, 29, 1165–1188. [Google Scholar] [CrossRef]
- Cooper Marcus, C.; Sarkissian, W. Housing as If People Mattered; University of California Press Ltd.: Berkeley, CA, USA, 1986. [Google Scholar]
- Fisher-Gewirtzman, D.; Polak, N. A learning automated 3D architecture synthesis model: Demonstrating a computer governed design of minimal apartment units based on human perceptual and physical needs. Archit. Sci. Rev. 2019, 62, 301–312. [Google Scholar] [CrossRef]
- Montgomery, J. Making a city: Urbanity, vitality and urban design. J. Urban Des. 1998, 3, 93–116. [Google Scholar] [CrossRef]
- Gerike, R.; Hubrich, S.; Koszowski, C.; Schröter, B.; Wittwer, R. Active Transport: Heterogeneous Street Users Serving Movement and Place Functions; Elsevier: Amsterdam, The Netherlands, 2021. [Google Scholar]
- Glaeser, E.L. Triumph of the City: How Our Greatest Invention Makes Us Richer, Smarter, Greener, Healthier, and Happier; Penguin: London, UK, 2012. [Google Scholar]
- Blumenfeld-Lieberthal, E.; Serok, N.; Milner, E.L. What Makes Us Think It’s a City? Built Environ. 2018, 44, 177–191. [Google Scholar] [CrossRef]
Figure 1.
Designing the experiment: graphic conclusions of the past two experiments showing the relations of variables.
Figure 1.
Designing the experiment: graphic conclusions of the past two experiments showing the relations of variables.

Figure 2.
The three types of street sections.
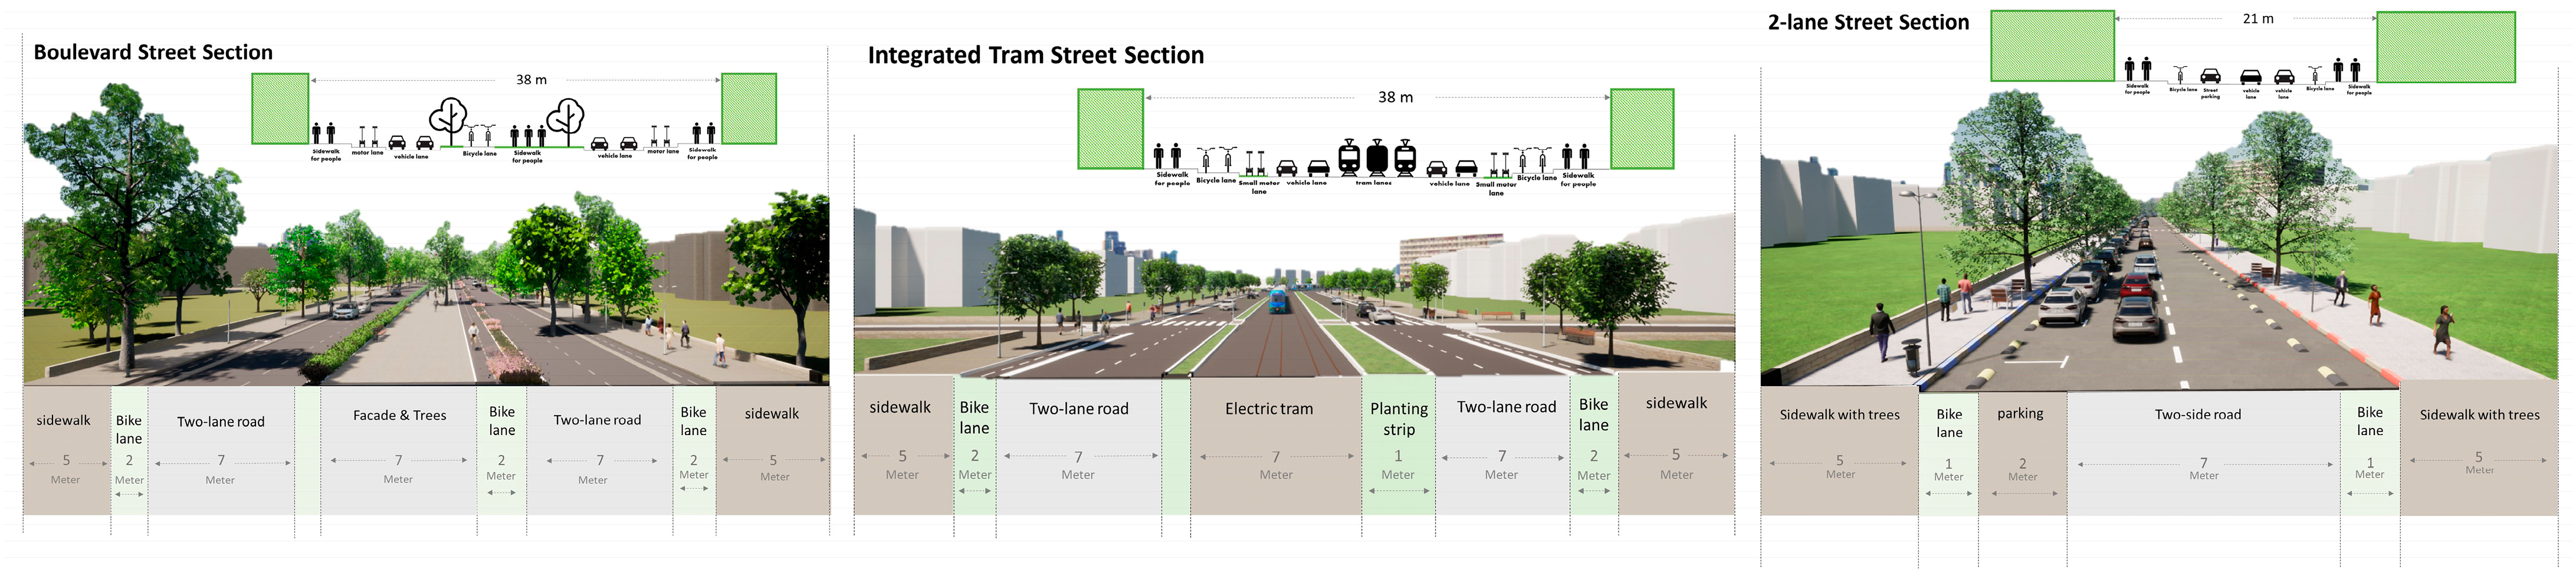
Figure 3.
Five building morphologies.

Figure 4.
(a) Scree plot of the PCs. Each PC explains part of the variance in the data. We chose to retain five PCs, which together explain > 85% of the data variance. (b) Correlation of the wellbeing questions with each specific PC. Questions with highly positive or negative correlations defined the wellbeing domain assigned to the PC.
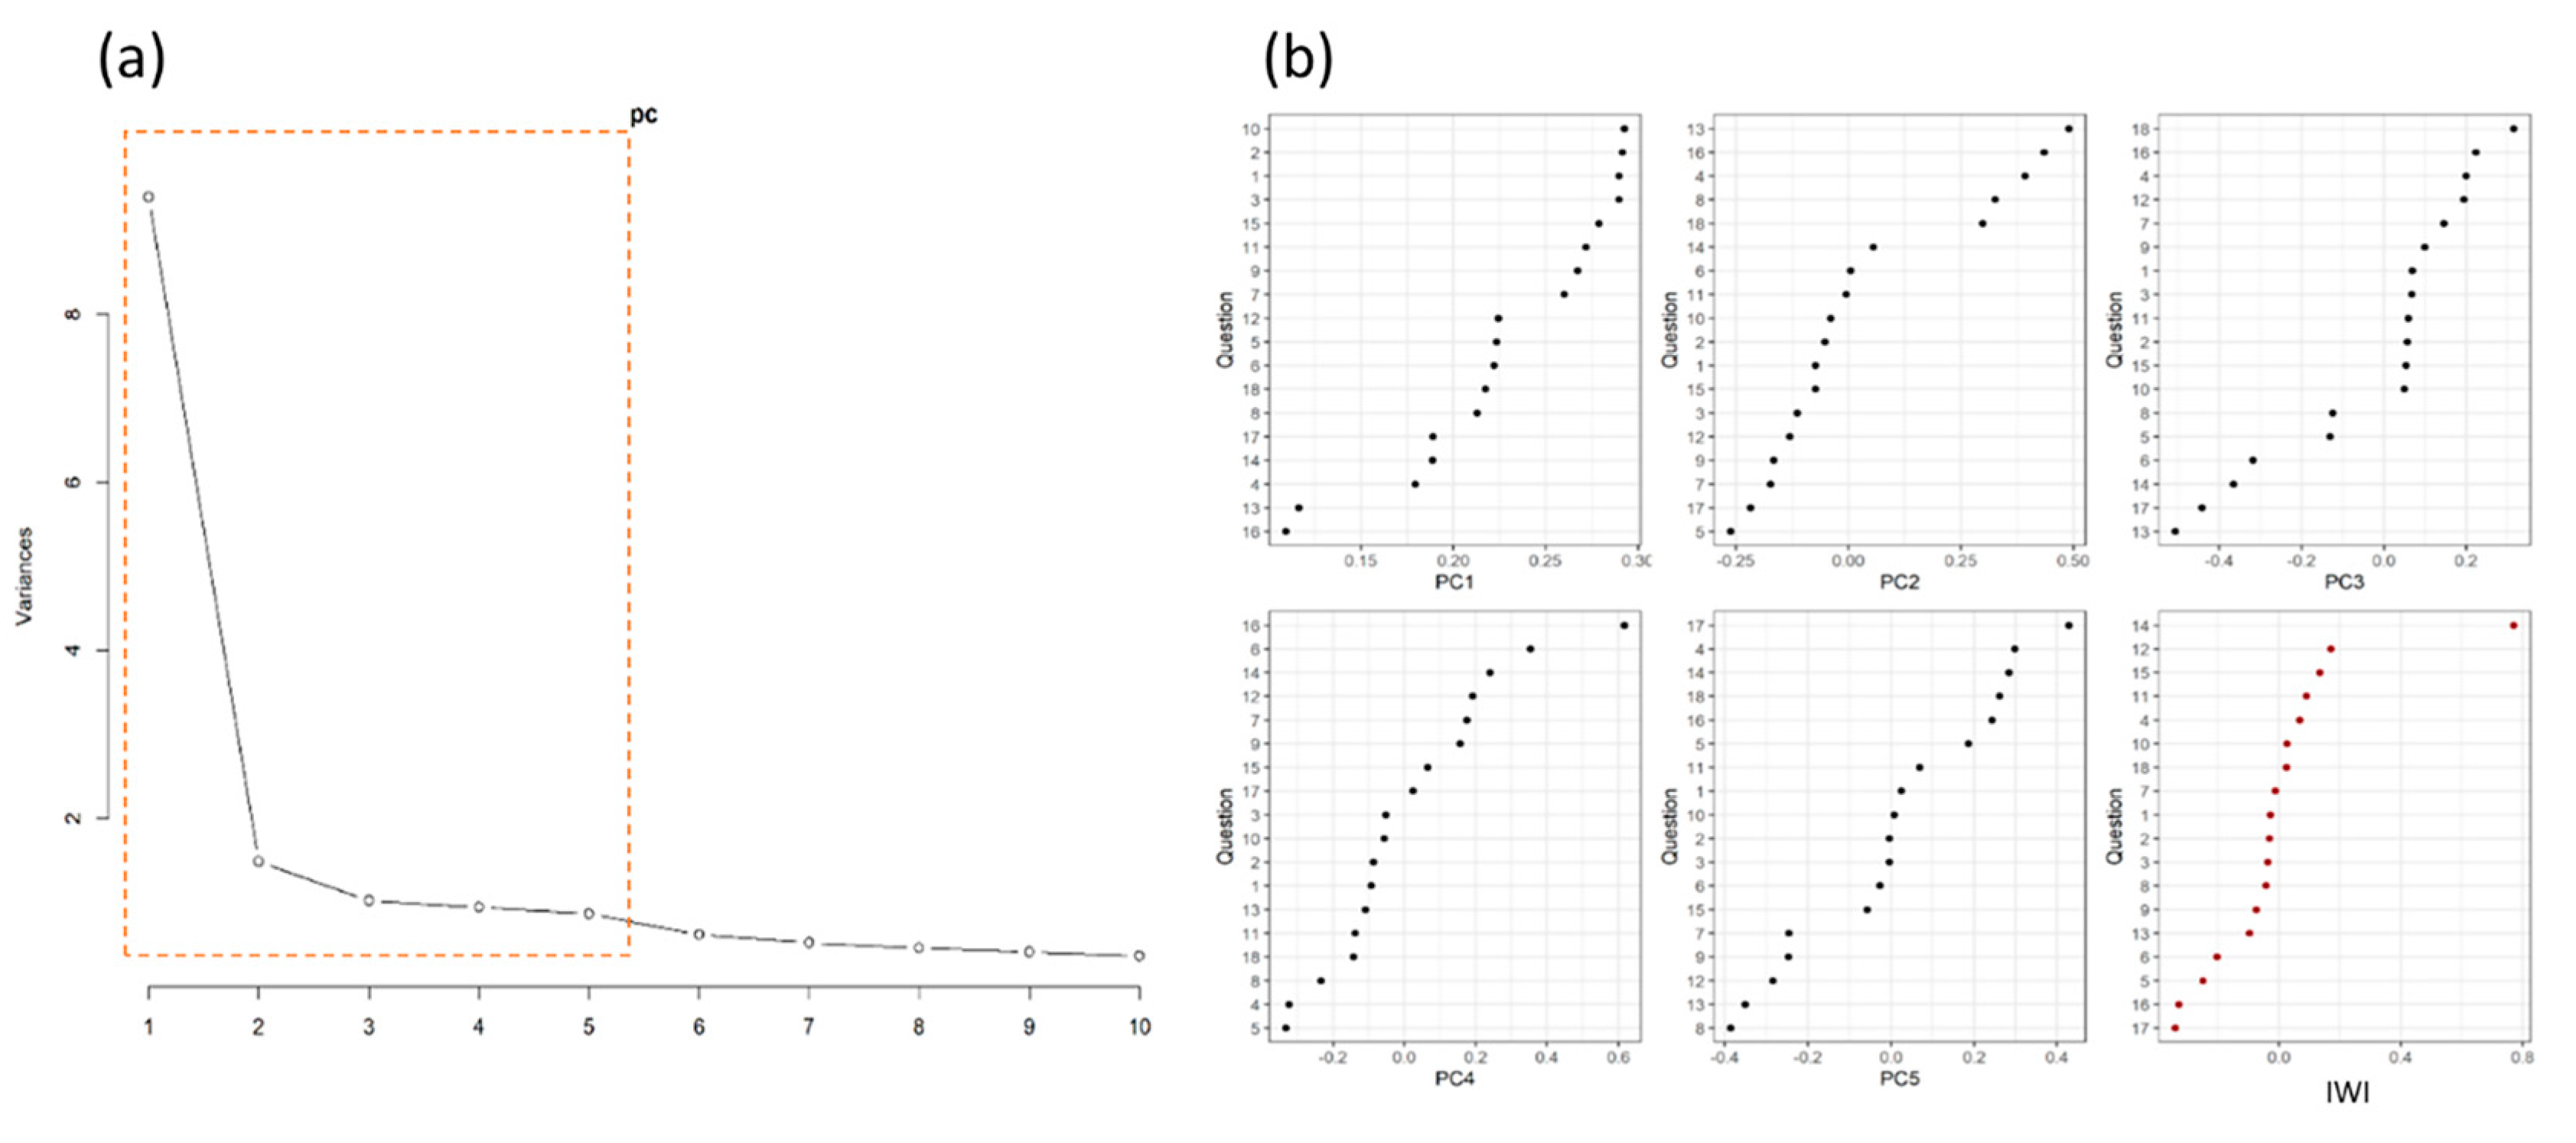
Figure 5.
PC values by density.

Figure 6.
PC values by street section.
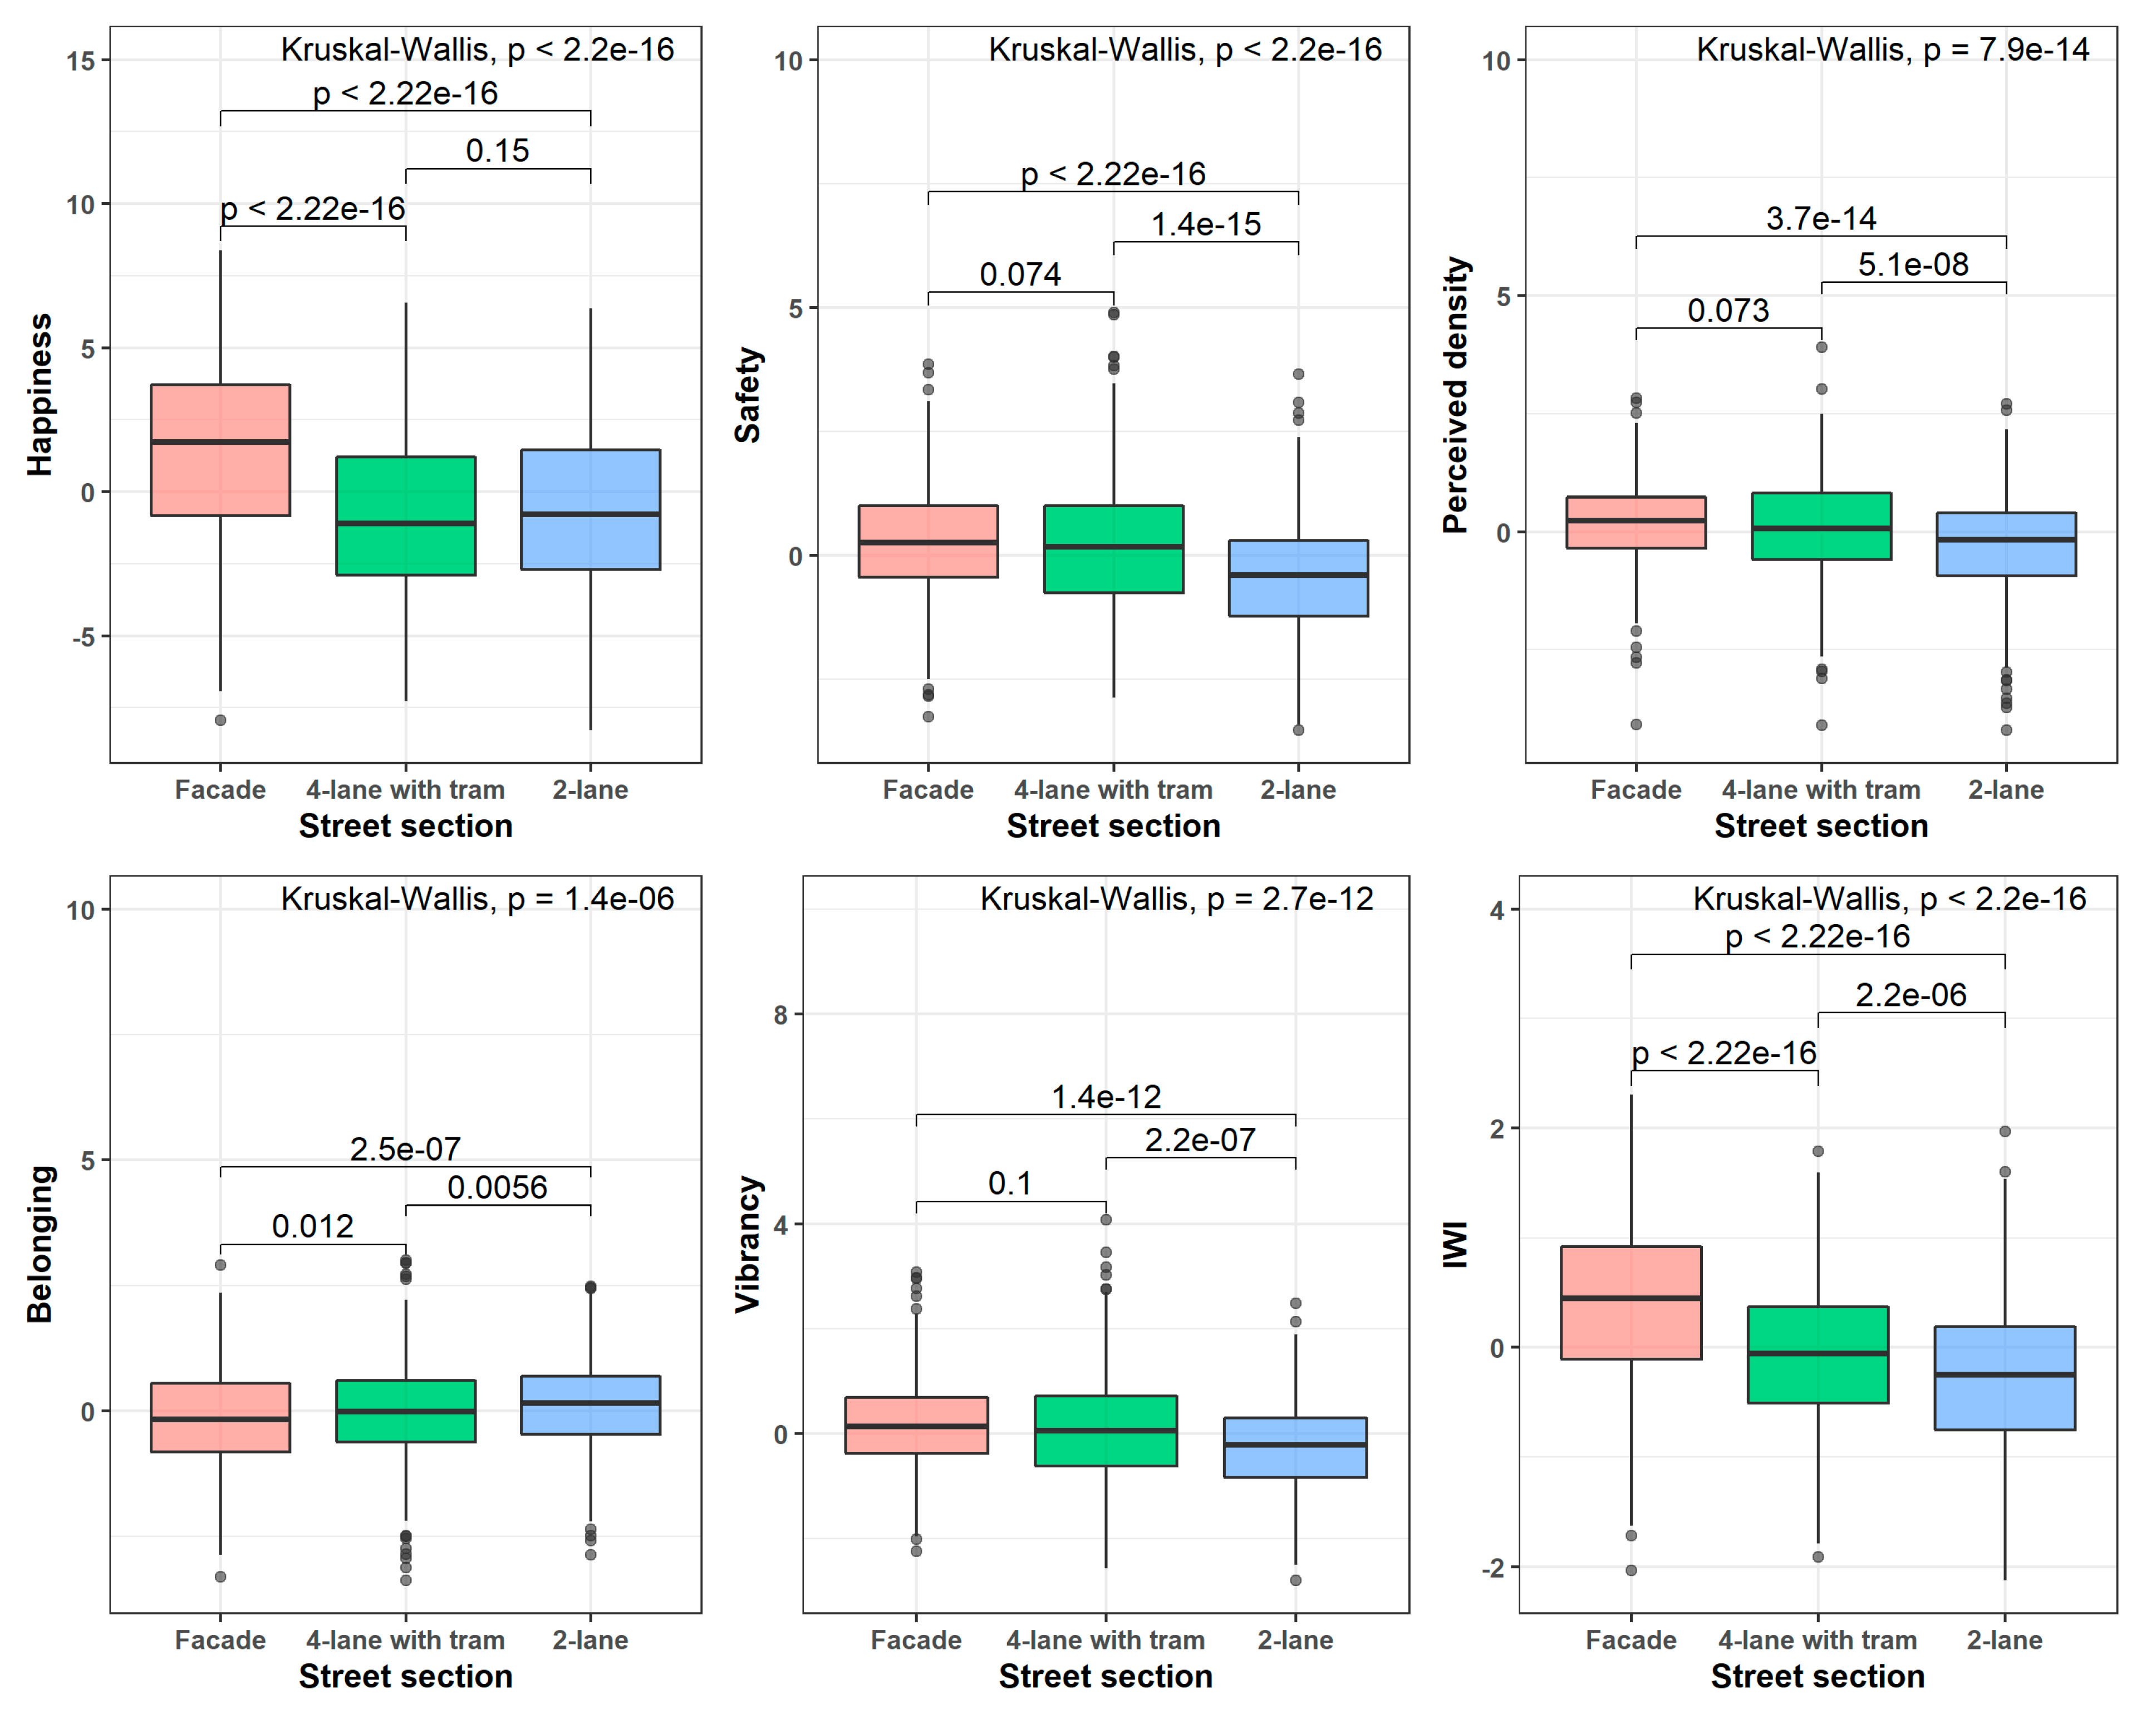
Figure 7.
PC values by morphologies. Pair-wise comparisons between different morphologies described by p-values.
Figure 7.
PC values by morphologies. Pair-wise comparisons between different morphologies described by p-values.
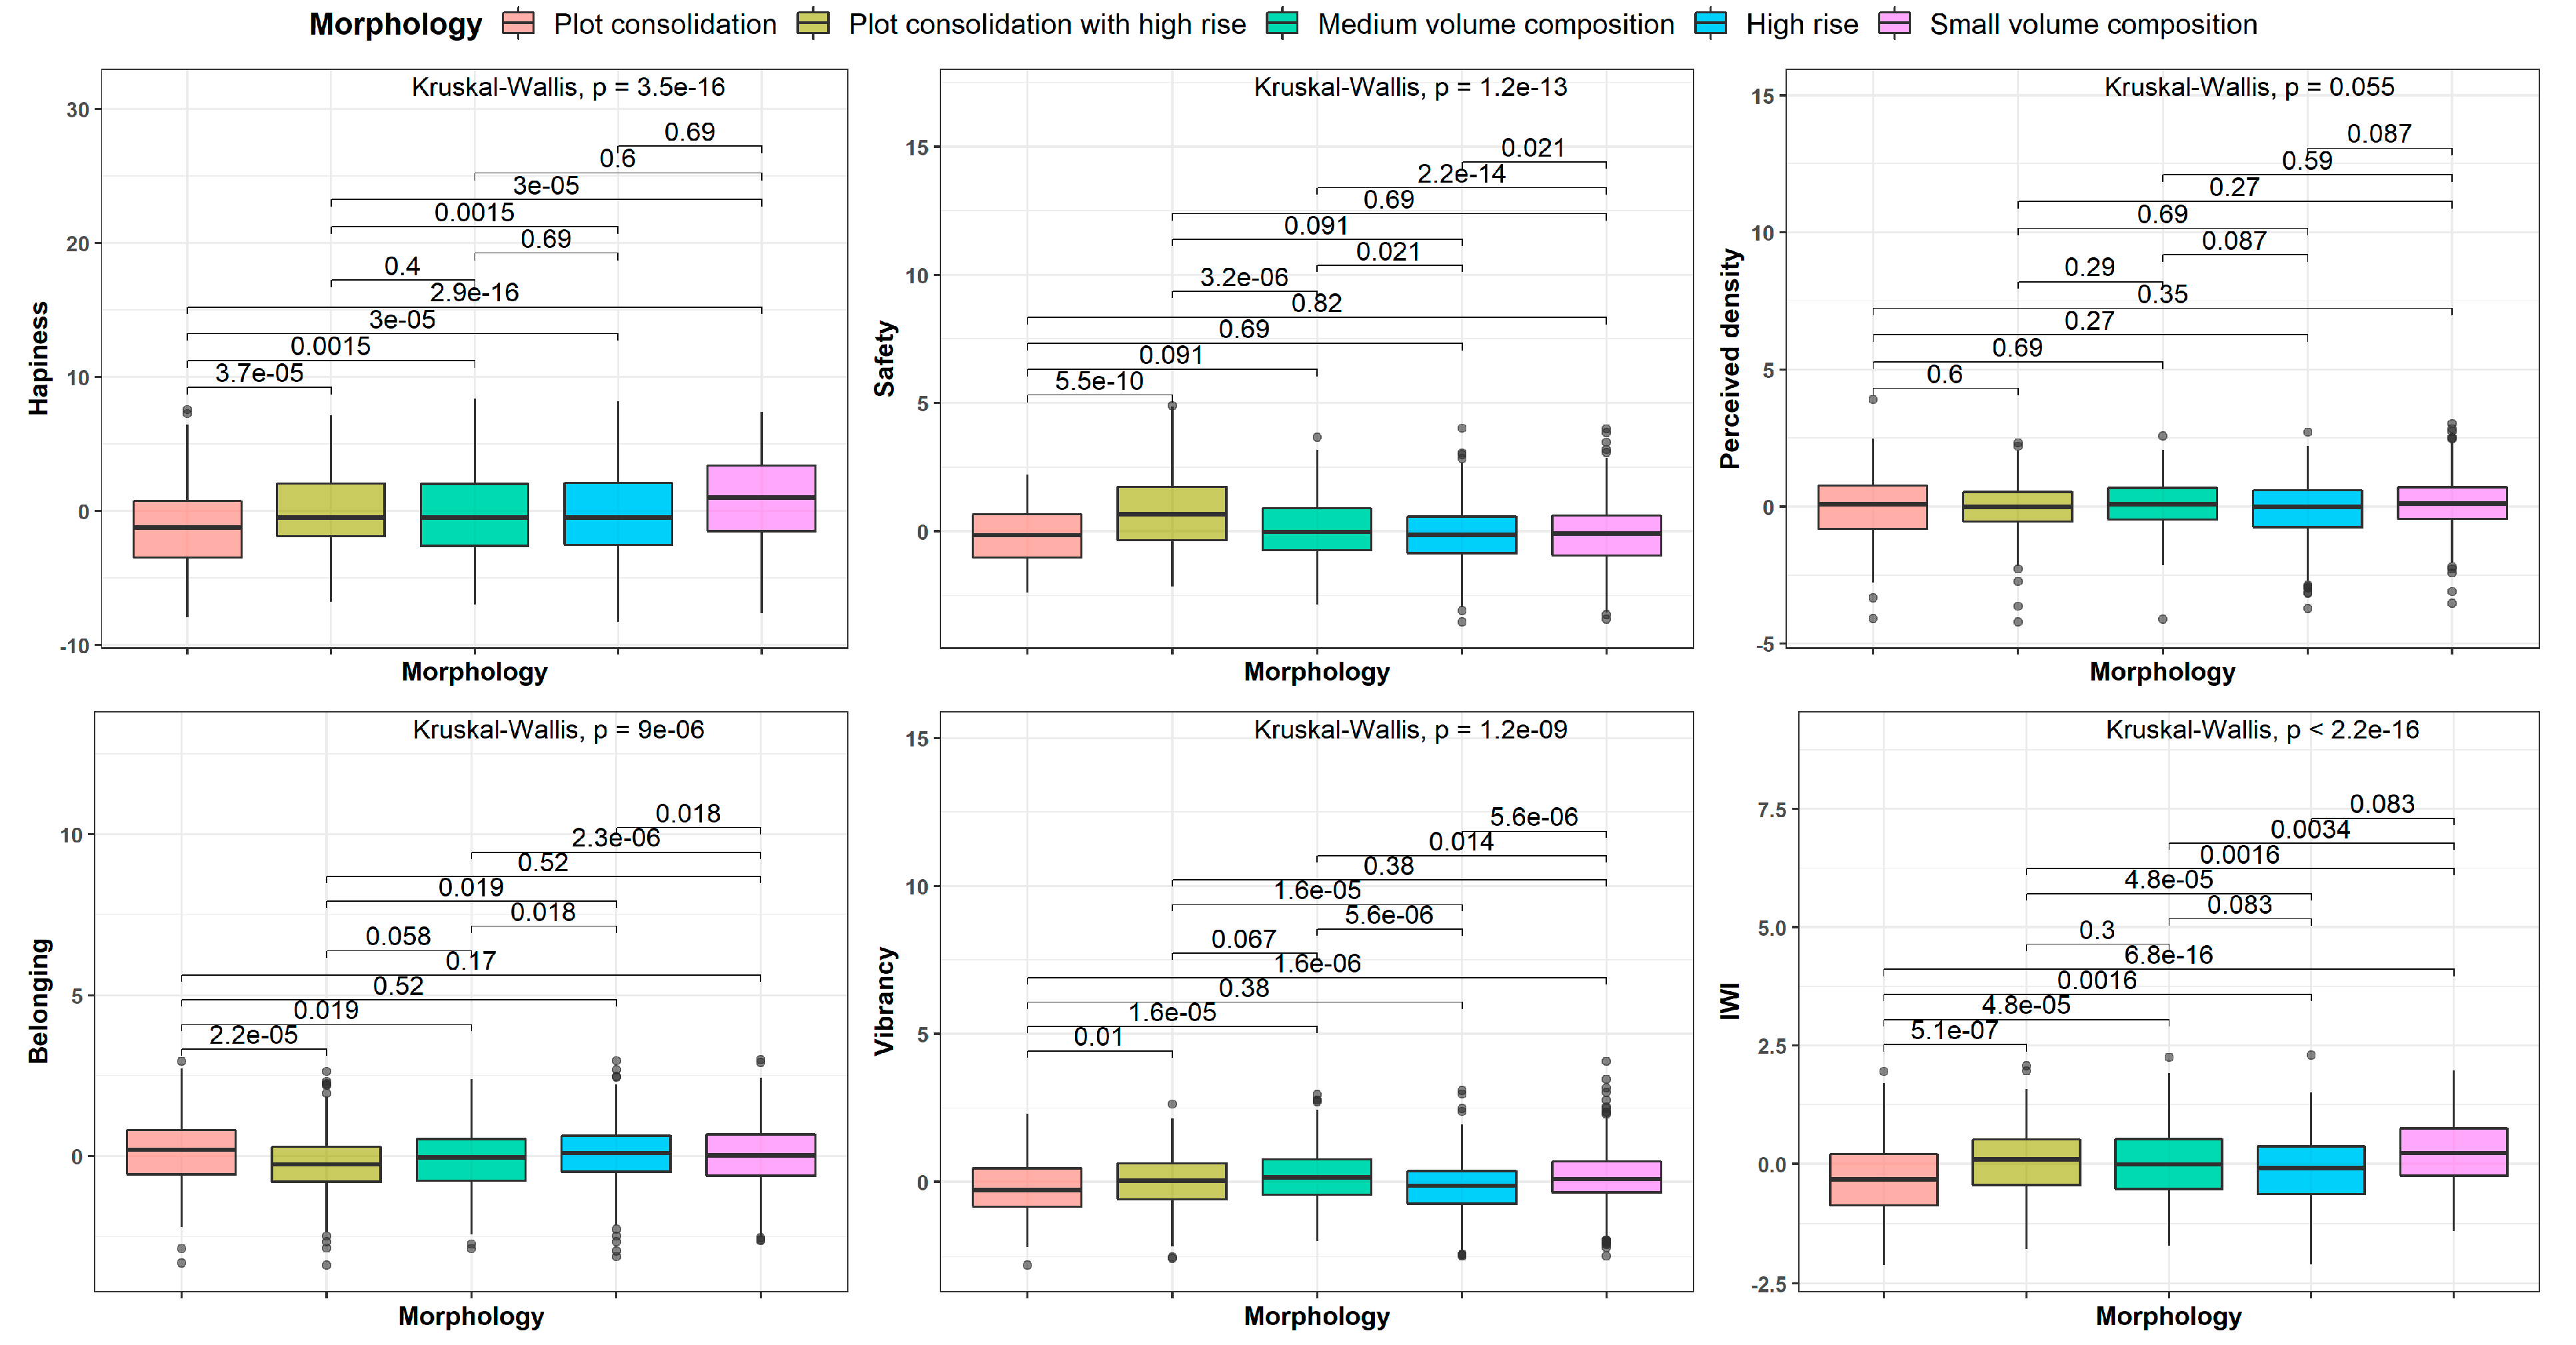
Figure 8.
(a) PC values by density level in high-rise morphologies. (b) PC values for the boulevard street section with high-rise morphologies across density levels. (c) PC values in high-rise morphologies in integrated street sections: 4x versus 6x density levels. (d) PC values in high-rise morphologies in two-lane street sections: 4x versus 6x density levels.
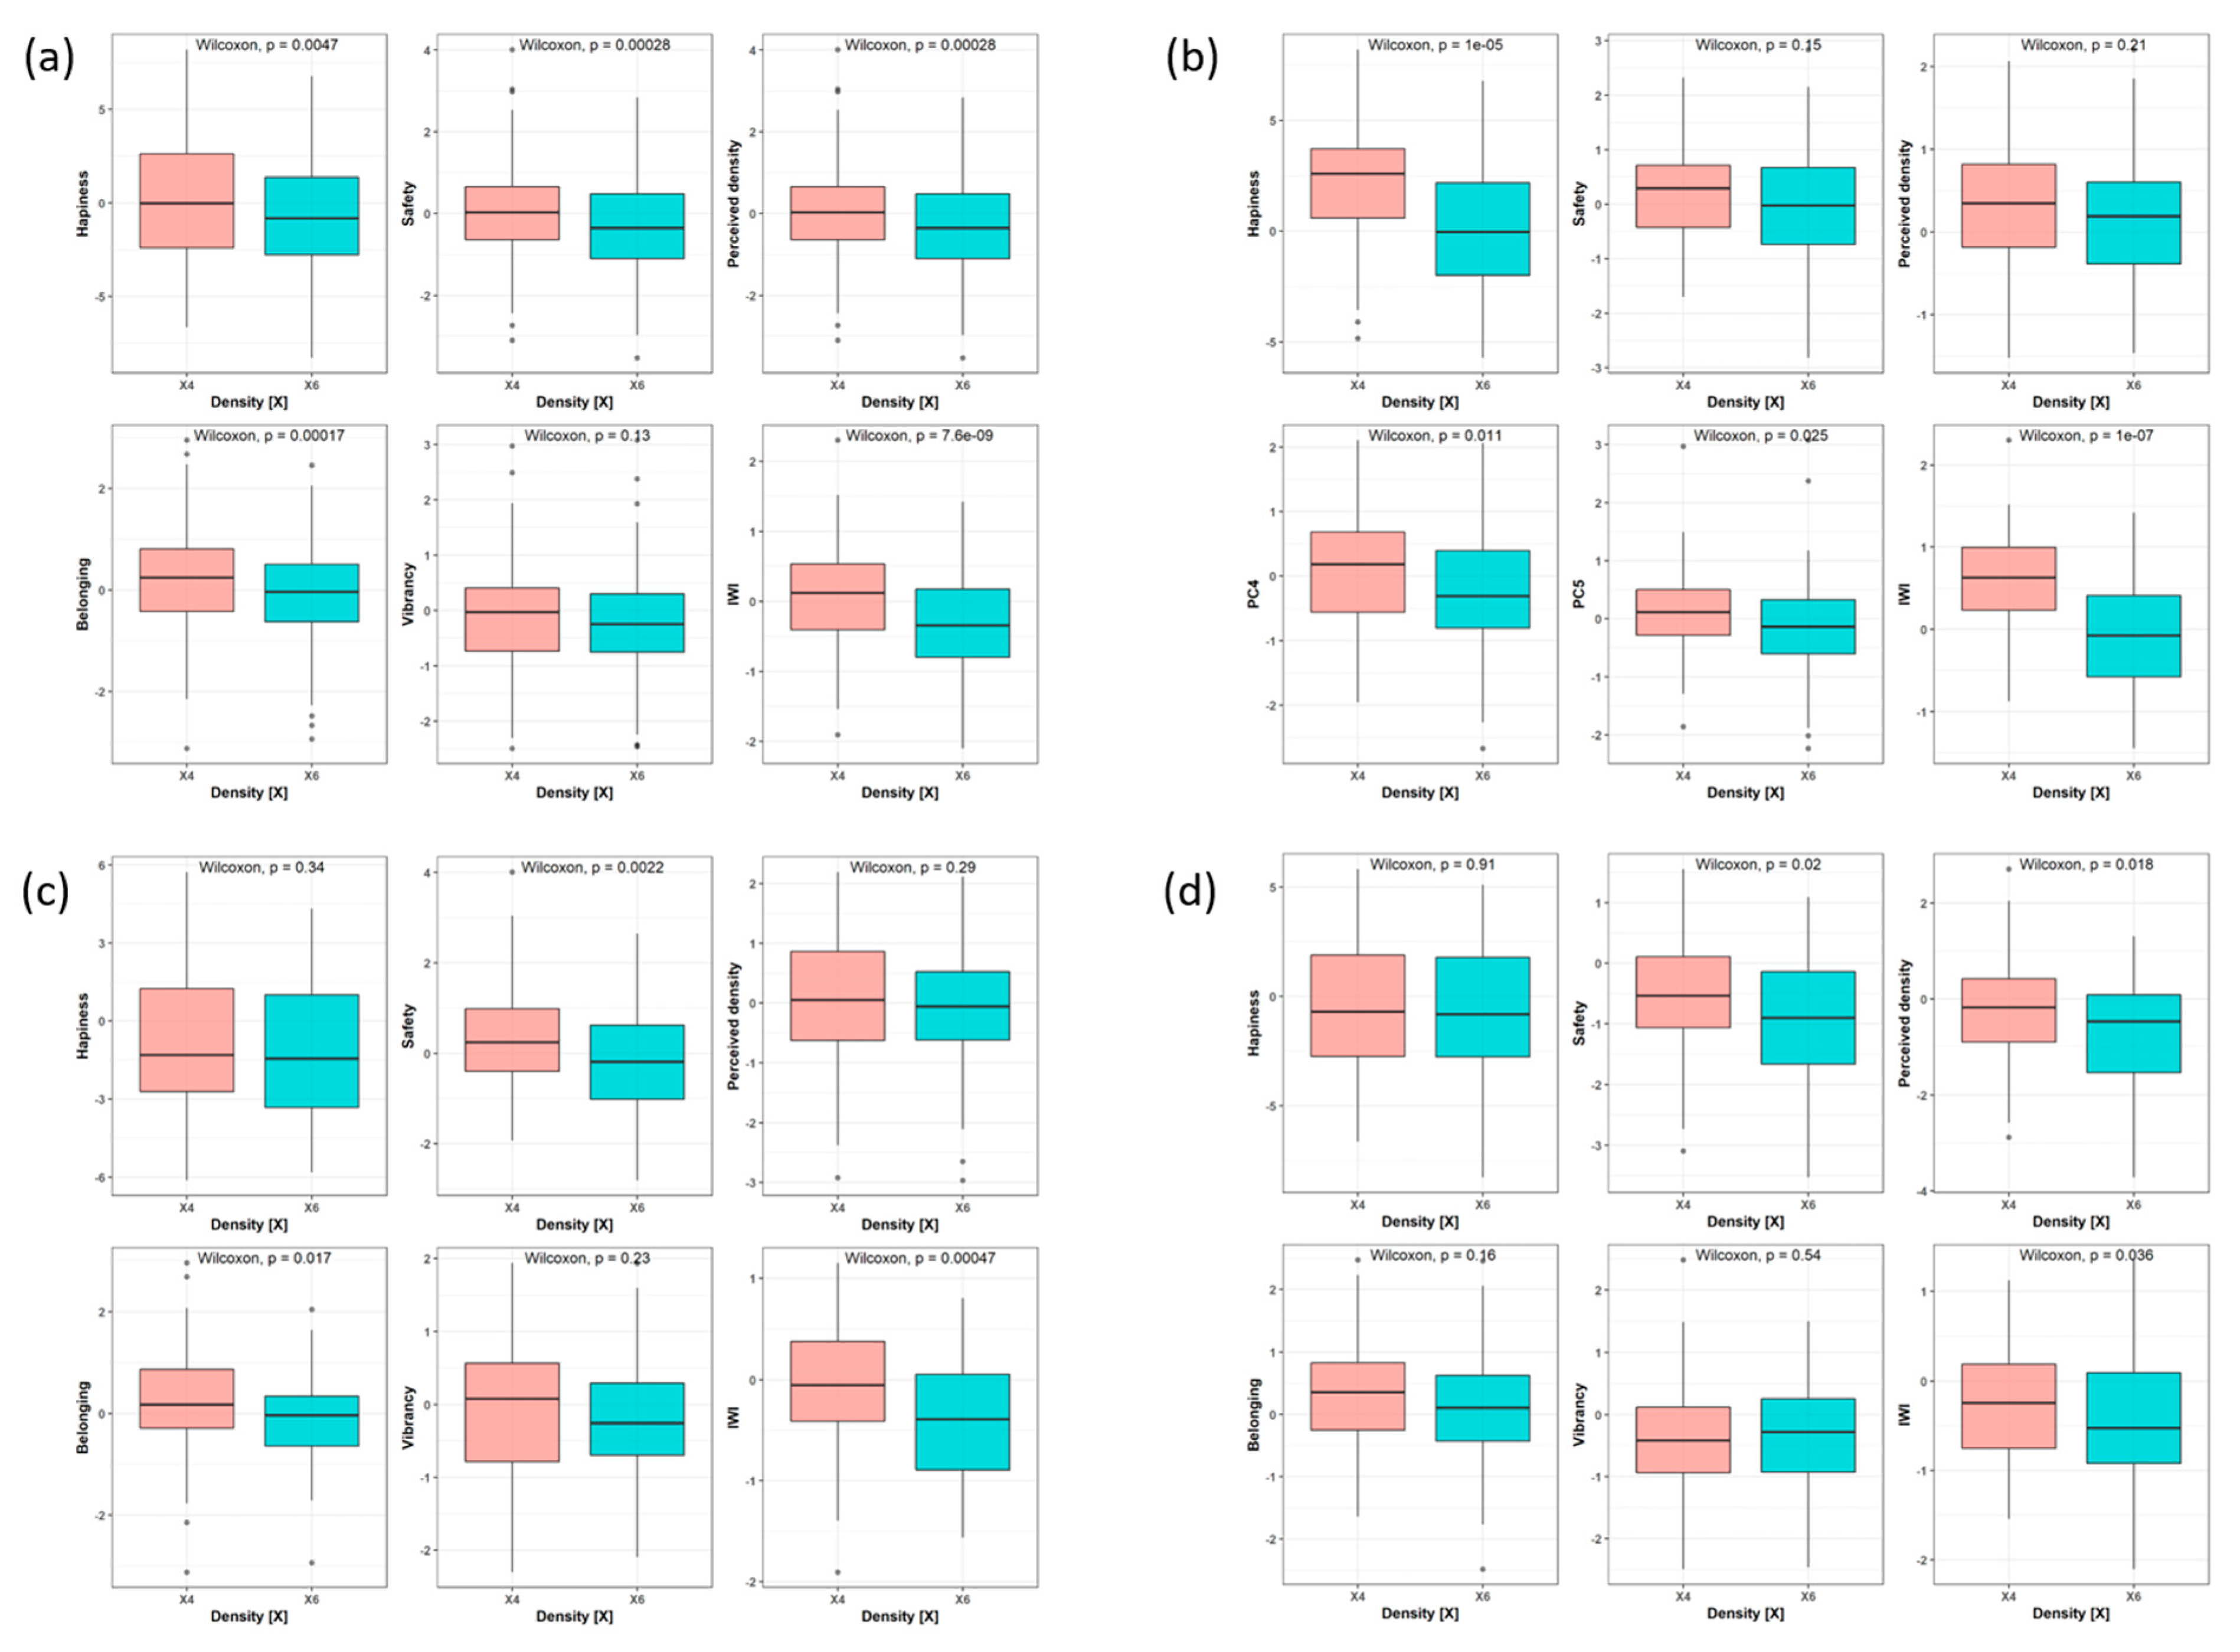
Figure 9.
(a) Wellbeing values for the small-volume composition. (b) Wellbeing values for the boulevard street section and small-volume composition. (c) Wellbeing domain values for the integrated street section with a small-volume composition by density. (d) Wellbeing domain values for the two-lane street section with a small-volume composition by density.

Table 1.
The statistical design (A) summarizing the 21 environment variations and (B) the allocation matrix for the incomplete block design. Each block of participants explored a different set of environments.
Table 1.
The statistical design (A) summarizing the 21 environment variations and (B) the allocation matrix for the incomplete block design. Each block of participants explored a different set of environments.
| (A) | |||||||||||
|---|---|---|---|---|---|---|---|---|---|---|---|
| Morphology | Density Level | Street Section | |||||||||
| Boulevard | Integrated | Two Lane | |||||||||
 | 6x | 1 | 2 | 3 | |||||||
 | 6x | 4 | 5 | 6 | |||||||
 | 6x | 7 | 8 | 9 | |||||||
 | 6x | 10 | 11 | 12 | |||||||
 | 6x | 13 | 14 | 15 | |||||||
 | 4x | 16 | 17 | 18 | |||||||
 | 4x | 19 | 20 | 21 | |||||||
| (B) | |||||||||||
| Block-1 | 1 | 3 | 4 | 5 | 6 | 7 | 14 | 16 | 18 | 20 | 21 |
| Block-2 | 4 | 7 | 8 | 9 | 11 | 12 | 14 | 16 | 18 | 20 | 21 |
| Block-3 | 1 | 6 | 8 | 9 | 10 | 12 | 14 | 16 | 18 | 19 | 21 |
| Block-4 | 6 | 7 | 8 | 9 | 10 | 12 | 14 | 16 | 18 | 19 | 21 |
| Block-5 | 1 | 3 | 4 | 5 | 10 | 12 | 14 | 16 | 17 | 19 | 21 |
| Block-6 | 1 | 2 | 3 | 7 | 10 | 11 | 13 | 15 | 17 | 19 | 21 |
| Block-7 | 1 | 2 | 4 | 5 | 7 | 11 | 13 | 15 | 17 | 19 | 20 |
| Block-8 | 2 | 5 | 6 | 8 | 10 | 11 | 13 | 15 | 17 | 19 | 20 |
| Block-9 | 2 | 3 | 5 | 8 | 9 | 11 | 13 | 15 | 17 | 18 | 20 |
| Block-10 | 2 | 3 | 4 | 6 | 9 | 11 | 13 | 15 | 17 | 18 | 20 |
Table 2.
Study cohort demographics.
| Characteristic | n = 147 1 |
|---|---|
| Age | |
| 18–25 | 70 (48%) |
| 25–35 | 64 (44%) |
| 35–50 | 8 (5.5%) |
| 50–65 | 1 (0.7%) |
| Other | 4 (2.8%) |
| Family Status | |
| Single | 125 (86%) |
| Married | 13 (8.9%) |
| I have children | 8 (5.5%) |
| Unknown | 1 |
| Participants’ Hometown Environment | |
| Urban | 88 (60%) |
| Dense Urban | 41 (28%) |
| Rural | 17 (12%) |
| Unknown | 1 |
1 n (%).
Table 3.
Wellbeing component prediction by density levels.
| Outcome | Beta | 95% CI 1 | p-Value | q-Value 2 |
|---|---|---|---|---|
| Happiness | −1.1 | −1.4, −0.74 | <0.001 | <0.001 |
| Safety | −0.01 | −0.14, 0.12 | 0.8 | 0.8 |
| Perceived density | −0.18 | −0.29, −0.08 | <0.001 | 0.001 |
| Belonging | −0.22 | −0.32, −0.12 | <0.001 | <0.001 |
| Vibrancy | −0.06 | −0.15, 0.04 | 0.3 | 0.3 |
| IWI | −0.31 | −0.38, −0.23 | <0.001 | <0.001 |
1 CI = Confidence Interval. 2 False discovery rate correction for multiple testing.
Table 4.
Wellbeing component prediction by street section.
| Outcome | Beta | 95% CI 1 | p-Value 2 |
|---|---|---|---|
| Happiness | <0.001 | ||
| Boulevard | — | — | |
| Integrated section | −2.2 | −2.6, −1.9 | |
| Two lanes | −2.0 | −2.3, −1.6 | |
| Safety | <0.001 | ||
| Boulevard | — | — | |
| Integrated section | −0.09 | −0.24, 0.05 | |
| Two lanes | −0.73 | −0.87, −0.59 | |
| Perceived density | <0.001 | ||
| Boulevard | — | — | |
| Integrated section | −0.11 | −0.23, 0.01 | |
| Two lanes | −0.48 | −0.60, −0.37 | |
| Belonging | <0.001 | ||
| Boulevard | — | — | |
| Integrated section | 0.16 | 0.05, 0.28 | |
| Two lanes | 0.32 | 0.20, 0.43 | |
| Vibrancy | <0.001 | ||
| Boulevard | — | — | |
| Integrated section | −0.07 | −0.18, 0.04 | |
| Two lanes | −0.41 | −0.52, −0.30 | |
| IWI | <0.001 | ||
| Boulevard | — | — | |
| Integrated section | −0.47 | −0.55, −0.39 | |
| Two lanes | −0.66 | −0.74, −0.58 |
1 CI = Confidence Interval. 2 False discovery rate correction for multiple testing.
Table 5.
Wellbeing component prediction by street morphology.
| Characteristic | Beta | 95% CI 1 | p-Value |
|---|---|---|---|
| Happiness | <0.001 | ||
| Plot consolidation | — | — | |
| Plot consolidation with a high rise | 1.3 | 0.54, 2.1 | |
| Medium-volume composition | 1.1 | 0.34, 1.9 | |
| High rise | 0.85 | 0.18, 1.5 | |
| Small composition | 2.3 | 1.7, 3.0 | |
| Safety | <0.001 | ||
| Plot consolidation | — | — | |
| Plot consolidation with a high rise | 0.53 | 0.22, 0.84 | |
| Medium-volume composition | 0.08 | −0.24, 0.39 | |
| High rise | −0.09 | −0.35, 0.18 | |
| Small composition | −0.13 | −0.40, 0.13 | |
| Vibrancy | 0.4 | ||
| Plot consolidation | — | — | |
| Plot consolidation with a high rise | 0.11 | −0.16, 0.37 | |
| Medium-volume composition | 0.06 | −0.21, 0.33 | |
| High rise | −0.10 | −0.33, 0.13 | |
| Small composition | 0.03 | −0.20, 0.26 | |
| Perceived density | 0.053 | ||
| Plot consolidation | — | — | |
| Plot consolidation with a high rise | −0.15 | −0.40, 0.10 | |
| Medium-volume composition | 0.13 | −0.12, 0.38 | |
| High rise | −0.03 | −0.24, 0.19 | |
| Small composition | 0.17 | −0.04, 0.38 | |
| Belonging | <0.001 | ||
| Plot consolidation | — | — | |
| Plot consolidation with a high rise | 0.65 | 0.41, 0.89 | |
| Medium-volume composition | 0.54 | 0.30, 0.78 | |
| High rise | 0.17 | −0.03, 0.38 | |
| Small composition | 0.42 | 0.22, 0.62 | |
| IWI | <0.001 | ||
| Plot consolidation | — | — | |
| Plot consolidation with a high rise | 0.65 | 0.41, 0.89 | |
| Medium-volume composition | 0.54 | 0.30, 0.78 | |
| High rise | 0.17 | −0.03, 0.38 | |
| Small composition | 0.42 | 0.22, 0.62 |
1 CI = Confidence Interval.
Table 6.
Multivariable regression analysis.
| Happiness | Perceived density | Belonging | IWI | Safety | Vibrancy | |||||||
|---|---|---|---|---|---|---|---|---|---|---|---|---|
| Characteristic | Beta | 95% CI 1 | Beta | 95% CI 1 | Beta | 95% CI 1 | Beta | 95% CI 1 | Beta | 95% CI 1 | Beta | 95% CI 1 |
| Density | ||||||||||||
| 4x | — | — | — | — | — | — | — | — | — | — | — | — |
| 6x | −0.78 | −1.1, −0.42 | −0.19 | −0.29, −0.08 | −0.21 | −0.33, −0.09 | −0.34 | −0.42, −0.25 | ||||
| Street Section | ||||||||||||
| Boulevard | — | — | — | — | — | — | — | — | — | — | — | — |
| Integrated section | −2.2 | −2.6, −1.9 | −0.11 | −0.23, 0.01 | 0.16 | 0.05, 0.28 | −0.47 | −0.55, −0.39 | −0.09 | −0.23, 0.05 | −0.07 | −0.18, 0.04 |
| Two-Lanes | −2.0 | −2.3, −1.7 | −0.49 | −0.61, −0.37 | 0.31 | 0.20, 0.43 | −0.66 | −0.74, −0.58 | −0.73 | −0.87, −0.59 | −0.40 | −0.51, −0.30 |
| Morphology | ||||||||||||
| Plot consolidation | — | — | — | — | — | — | — | — | — | — | — | — |
| Plot consolidation with high-rise | 1.2 | 0.63, 1.7 | −0.41 | −0.58, −0.23 | 0.36 | 0.24, 0.48 | 0.84 | 0.62, 1.1 | 0.22 | 0.05, 0.39 | ||
| Medium volume composition | 1.0 | 0.43, 1.5 | −0.23 | −0.41, −0.05 | 0.29 | 0.17, 0.41 | 0.21 | 0.00, 0.43 | 0.43 | 0.26, 0.60 | ||
| High-rise | 0.67 | 0.18, 1.2 | −0.16 | −0.33, 0.00 | 0.02 | −0.09, 0.13 | −0.01 | −0.20, 0.17 | 0.04 | −0.10, 0.18 | ||
| Small composition | 1.8 | 1.3, 2.2 | −0.23 | −0.39, −0.06 | 0.34 | 0.22, 0.45 | 0.03 | −0.15, 0.22 | 0.37 | 0.22, 0.51 | ||
1 CI = Confidence Interval.
Disclaimer/Publisher’s Note: The statements, opinions and data contained in all publications are solely those of the individual author(s) and contributor(s) and not of MDPI and/or the editor(s). MDPI and/or the editor(s) disclaim responsibility for any injury to people or property resulting from any ideas, methods, instructions or products referred to in the content. |
© 2024 by the authors. Licensee MDPI, Basel, Switzerland. This article is an open access article distributed under the terms and conditions of the Creative Commons Attribution (CC BY) license (https://creativecommons.org/licenses/by/4.0/).
Share and Cite
MDPI and ACS Style
Trossman Haifler, Y.; Fisher-Gewirtzman, D. Spatial Parameters Determining Urban Wellbeing: A Behavioral Experiment. Buildings 2024, 14, 211. https://doi.org/10.3390/buildings14010211
AMA Style
Trossman Haifler Y, Fisher-Gewirtzman D. Spatial Parameters Determining Urban Wellbeing: A Behavioral Experiment. Buildings. 2024; 14(1):211. https://doi.org/10.3390/buildings14010211
Chicago/Turabian StyleTrossman Haifler, Yaala, and Dafna Fisher-Gewirtzman. 2024. "Spatial Parameters Determining Urban Wellbeing: A Behavioral Experiment" Buildings 14, no. 1: 211. https://doi.org/10.3390/buildings14010211
Note that from the first issue of 2016, this journal uses article numbers instead of page numbers. See further details here.