
Architectonic Design Supported by Visual Environmental Simulation—A Comparison of Displays and Formats
 , and
, and
Abstract
:1. Introduction
2. Materials and Methods
2.1. Experimental Design
2.1.1. Experiment 1: Displays
- PC: Laptop with a 17.3 inch screen, 1920 × 1080 pixel resolution and navigation via a wireless joystick.
- HTC Vive Pro 2: Portable VR head-mounted display with 2448 × 2448 pixel stereoscopic screen per eye, 96° field of view, head position tracking using gyroscopes and accelerometers and navigation via a wireless joystick.
- PowerWall: Display system using a rear-projected 635 × 223 cm stereoscopic screen (using spectacles with shutters) with a resolution of 3137 × 1080 pixels, head position tracking using infrared cameras, virtual environment generation by a high-performance graphic computer and navigation via a wireless joystick.
- CAVE: Virtual reality system composed of four rear-projected 350 × 204 cm stereoscopic screens (front, two sides and floor), with a resolution of 1872 × 1080 pixels, head position tracking using infrared cameras, virtual environment generation by a set of networked computers (connected and synchronised with each other) and navigation via a wireless joystick.
2.1.2. Experiment 2: Formats
- Standard photograph/image: Photograph with a resolution of 3840 × 2160 pixels, taken with a GoPro Hero 7 Silver camera (GoPro, City: San Mateo, California (USA).), at a height of 165 cm to simulate eye level. Given the inherent limitation of this format in capturing an entire environment, the most representative point of view was selected [53].
- Spherical panoramic l resolution of 4096 × 2048 pixels, from photographs taken by seven GoPro Hero 7 Silver cameras attached to panoramic recording mounts (in the same positions and heights as used in standard images).
- Video: Video (with sound) with a resolution of 3840 × 2160 pixels at 25 frames per second, taken with a GoPro Hero 7 Silver camera. The same point of view and height were used as in standard images.
- Spherical panoramic video: 360° × 180° equirectangular video (with sound) with a total resolution of 4096 × 2048 pixels at 25 frames per second, from images taken by seven GoPro Hero 7 Silver cameras attached to panoramic recording mounts (in the same positions and heights as used in standard images).
2.2. Measurements
2.3. Participants
2.4. Procedure
- a.
- Descriptive analysis of the ratingsFirst, a descriptive analysis was carried out to detect trends in the results. The values for each variable were normalised to their z scores to simplify comparisons.
- b.
- Analysis of significant differences based on the subjects’ profiles.Although it was not the study’s main object, we tested for the existence of statistically significant differences in the responses based on the gender and age of the participants. The statistical analyses applied were based on the normality of the data for each variable, which were assessed using the Kolmogorov–Smirnov (K–S) test. Due to the non-normality of the data (K–S, p < 0.05), the comparison between both groups (gender: male vs female/age: 20–35 vs. 35–50) was made through a non-parametric Mann–Whitney U test (also referred to as the Wilcoxon rank sum test). The Mann–Whitney U test is a non-parametric method to detect whether two samples come from the same distribution, or to test whether the medians between comparison groups are different. It is based on the ordering of the data and the use of ranks to perform the contrast, with two statistics (the U Mann–Whitney and the W Wilcoxon) and a significance level. We will look at the significance level (p < 0.05) to identify the existence of significant differences.
- c.
- Analysis of significant differences between the evaluated stimuliAn analysis was undertaken to identify any statistically significant differences in the respondents’ responses based on the display (experiment 1) or format (experiment 2) visualised. The statistical analyses applied were based on the normality of the data, using the Kolmogorov–Smirnov (K–S) test. Due to the non-normality of the data (K–S, p < 0.05), the comparison between groups (displays: PC-HTC Vive Pro 2-PowerWall Screen–CAVE; formats: image–360° image–video–360° video) were made through a non-parametric Kruskal–Wallis test. The Kruskal–Wallis test compares whether different samples are equally distributed and therefore belong to the same distribution. It is an extension of the Mann–Whitney test for more than two groups. Where differences were found between groups, the samples were compared in pairs. Again, we will look at the significance level (p < 0.05) to identify the existence of significant differences.
- d.
- Relationship between variables and stimuliAn analysis was undertaken to identify any statistically significant correlations, using Spearman’s Rho correlation coefficient for non-parametric samples, firstly between the variables evaluated, and subsequently between the variables and the stimuli displayed.
3. Results
3.1. Experiment 1: Displays
3.1.1. Descriptive Analysis of the Ratings
3.1.2. Analysis of Significant Differences
- a.
- Based on the profile of the subject (gender and age)
- b.
- Based on the stimuli analysed (displays)
3.1.3. Analysis of Relationships between Variables
- a.
- Between the variables that measure the users’ responses
- b.
- Between the variables that measure the users’ responses and displays
3.2. Experiment 2: Formats
3.2.1. Descriptive Analysis of the Ratings
3.2.2. Analysis of Significant Differences
- a.
- Based on the profile of the subject (gender and age)
- b.
- Based on the stimuli analysed (formats)
3.2.3. Analysis of Relationships between Variables
- a.
- Between the variables that measure the users’ responses
- b.
- Between the variables that measure the users’ responses and formats
4. Discussion and Conclusions
Author Contributions
Funding
Data Availability Statement
Conflicts of Interest
References
- Morgan, M.S. Model experimetns, virtual experiments, and virtual reality. In The Philosophy of Scientific Experimentation; Radder, H., Ed.; University of Pittsburgh Press: Pittsburgh, PA, USA, 2003; p. 216. [Google Scholar]
- Martingano, A.J.; Persky, S. Virtual reality expands the toolkit for conducting health psychology research. Soc. Personal. Psychol. Compass 2021, 15, e12606. [Google Scholar] [CrossRef] [PubMed]
- Kisker, J.; Gruber, T.; Schöne, B. Behavioral realism and lifelike psychophysiological responses in virtual reality by the example of a height exposure. Psychol. Res. 2021, 85, 68–81. [Google Scholar] [CrossRef] [PubMed]
- Hepperle, D.; Wölfel, M. Similarities and Differences between Immersive Virtual Reality, Real World, and Computer Screens: A Systematic Scoping Review in Human Behavior Studies. Multimodal Technol. Interact. 2023, 7, 56. [Google Scholar] [CrossRef]
- Higuera-Trujillo, J.L.; López-Tarruella Maldonado, J.; Llinares, C. Psychological and physiological human responses to simulated and real environments: A comparison between Photographs, 360° Panoramas, and Virtual Reality. Appl. Ergon. 2017, 65, 398–409. [Google Scholar] [CrossRef] [PubMed]
- Kazemi, R.; Lee, S.C. Human Factors/Ergonomics (HFE) Evaluation in the Virtual Reality Environment: A Systematic Review. Int. J. Hum. Comput. Interact. 2023. [Google Scholar] [CrossRef]
- Knight, M.; Dokonal, W.; Brown, A.; Hannibal, C. Contemporary Digital Techniques in the Early Stages of Design. In Computer Aided Architectural Design Futures 2005; Springer: Dordrecht, The Netherlands, 2005; pp. 165–174. [Google Scholar]
- Manzoor, B.; Othman, I.; Pomares, J.C. Digital technologies in the architecture, engineering and construction (AEC) industry—A bibliometric—Qualitative literature review of research activities. Int. J. Environ. Res. Public Health 2021, 18, 6135. [Google Scholar] [CrossRef]
- Safikhani, S.; Keller, S.; Schweiger, G.; Pirker, J. Immersive virtual reality for extending the potential of building information modeling in architecture, engineering, and construction sector: Systematic review. Int. J. Digit. Earth 2022, 15, 503–526. [Google Scholar] [CrossRef]
- Wang, C.; Wei, S.; Du, S.; Zhuang, D.; Li, Y.; Shi, X.; Jin, X.; Zhou, X. A systematic method to develop three dimensional geometry models of buildings for urban building energy modeling. Sustain. Cities Soc. 2021, 71, 102998. [Google Scholar] [CrossRef]
- Beckmann, J. The Virtual Dimension: Architecture, Representation, and Crash Culture; Princeton Architectural Press: New York, NY, USA, 1998. [Google Scholar]
- Davila Delgado, J.M.; Oyedele, L.; Demian, P.; Beach, T. A research agenda for augmented and virtual reality in architecture, engineering and construction. Adv. Eng. Informatics 2020, 45, 101122. [Google Scholar] [CrossRef]
- Sontang, S. On Photography; RosettaBooks LLC: New York, NY, USA, 1977. [Google Scholar]
- Bouchlaghem, D.; Shang, H.; Whyte, J.; Ganah, A. Visualisation in architecture, engineering and construction (AEC). Autom. Constr. 2005, 14, 287–295. [Google Scholar] [CrossRef]
- Rosa, J. Architectural photography and the construction of modern architecture. Hist. Photogr. 1998, 22, 99–104. [Google Scholar] [CrossRef]
- Fangi, G. Spherical photogrammetry for cultural heritage metric documentation: A critical review. In Research for Development; Springer: Berlin/Heidelberg, Germany, 2015; pp. 301–311. [Google Scholar]
- Steuer, J. Defining Virtual Reality: Dimensions Determining Telepresence. J. Commun. 1992, 42, 73–93. [Google Scholar] [CrossRef]
- Bowman, D.A.; Kruijff, E.; LaViola, J.J.; Poupyrev, I. An Introduction to 3-D User Interface Design. Presence Teleoperators Virtual Environ. 2001, 10, 96–108. [Google Scholar] [CrossRef]
- De Kort, Y.A.W.; Ijsselsteijn, W.A.; Kooijman, J.; Schuurmans, Y. Virtual Laboratories: Comparability of Real and Virtual Environments for Environmental Psychology. Presence Teleoperators Virtual Environ. 2003, 12, 360–373. [Google Scholar] [CrossRef]
- Newman, M.; Gatersleben, B.; Wyles, K.J.; Ratcliffe, E. The use of virtual reality in environment experiences and the importance of realism. J. Environ. Psychol. 2022, 79, 101733. [Google Scholar] [CrossRef]
- Weber, S.; Weibel, D.; Mast, F.W. How to Get There When You Are There Already? Defining Presence in Virtual Reality and the Importance of Perceived Realism. Front. Psychol. 2021, 12, 628298. [Google Scholar] [CrossRef]
- Fribourg, R.; Argelaguet, F.; Lécuyer, A.; Hoyet, L. Avatar and Sense of Embodiment: Studying the Relative Preference between Appearance, Control and Point of View. IEEE Trans. Vis. Comput. Graph. 2020, 26, 2062–2072. [Google Scholar] [CrossRef]
- Zhan, T.; Yin, K.; Xiong, J.; He, Z.; Wu, S.T. Augmented Reality and Virtual Reality Displays: Perspectives and Challenges. iScience 2020, 23, 101397. [Google Scholar] [CrossRef]
- Ng, A.K.T.; Chan, L.K.Y.; Lau, H.Y.K. A study of cybersickness and sensory conflict theory using a motion-coupled virtual reality system. Displays 2020, 61, 101922. [Google Scholar] [CrossRef]
- Ramaseri Chandra, A.N.; El Jamiy, F.; Reza, H. A Systematic Survey on Cybersickness in Virtual Environments. Computers 2022, 11, 51. [Google Scholar] [CrossRef]
- Watzek, K.A.; Ellsworth, J.C. Perceived Scale Accuracy of Computer Visual Simulations. Landsc. J. 1994, 13, 21–36. [Google Scholar] [CrossRef]
- Churchill, E.F.; Snowdon, D. Collaborative Virtual Environments: An Introductory Review of Issues and Systems. Virtual Real. 1998, 3, 3–15. [Google Scholar] [CrossRef]
- Sharples, S.; Cobb, S.; Moody, A.; Wilson, J.R. Virtual reality induced symptoms and effects (VRISE): Comparison of head mounted display (HMD), desktop and projection display systems. Displays 2008, 29, 58–69. [Google Scholar] [CrossRef]
- Lovett, A.; Appleton, K.; Warren-Kretzschmar, B.; Von Haaren, C. Using 3D visualization methods in landscape planning: An evaluation of options and practical issues. Landsc. Urban Plan. 2015, 142, 85–94. [Google Scholar] [CrossRef]
- Schnabel, M.A.; Kvan, T. Spatial Understanding in Immersive Virtual Environments. Int. J. Archit. Comput. 2003, 1, 435–448. [Google Scholar] [CrossRef]
- Foley, J.D. Computer Graphics: Principles and Practice; Addison-Wesley Professional: Boston, MA, USA, 1996; Volume 12110. [Google Scholar]
- Day, A. Urban visualization and public inquiries: The case of the Heron Tower, London. Archit. Res. Q. 2002, 6, 363–372. [Google Scholar] [CrossRef]
- Pietsch, S.M. Computer visualisation in the design control of urban environments: A literature review. Environ. Plan. B Plan. Des. 2000, 27, 521–536. [Google Scholar] [CrossRef]
- Rohrmann, B.; Bishop, I. Subjective responses to computer simulations of urban environments. J. Environ. Psychol. 2002, 22, 319–331. [Google Scholar] [CrossRef]
- Zhang, Y.; Liu, H.; Kang, S.C.; Al-Hussein, M. Virtual reality applications for the built environment: Research trends and opportunities. Autom. Constr. 2020, 118, 103311. [Google Scholar] [CrossRef]
- Noghabaei, M.; Heydarian, A.; Balali, V.; Han, K. Trend analysis on adoption of virtual and augmented reality in the architecture, engineering, and construction industry. Data 2020, 5, 26. [Google Scholar] [CrossRef]
- Lange, E. The limits of realism: Perceptions of virtual landscapes. Landsc. Urban Plan. 2001, 54, 163–182. [Google Scholar] [CrossRef]
- Magalhães, M.; Coelho, A.; Melo, M.; Bessa, M. Measuring users’ emotional responses in multisensory virtual reality: A systematic literature review. Multimed. Tools Appl. 2023, 1–41. [Google Scholar] [CrossRef]
- Liu, Y.; Castronovo, F.; Messner, J.; Leicht, R. Evaluating the Impact of Virtual Reality on Design Review Meetings. J. Comput. Civ. Eng. 2020, 34, 04019045. [Google Scholar] [CrossRef]
- Guo, Z.; Zhou, D.; Zhou, Q.; Zhang, X.; Geng, J.; Zeng, S.; Lv, C.; Hao, A. Applications of virtual reality in maintenance during the industrial product lifecycle: A systematic review. J. Manuf. Syst. 2020, 56, 525–538. [Google Scholar] [CrossRef]
- Ammirato, S.; Felicetti, A.M.; Linzalone, R.; Corvello, V.; Kumar, S. Still our most important asset: A systematic review on human resource management in the midst of the fourth industrial revolution. J. Innov. Knowl. 2023, 8, 100403. [Google Scholar] [CrossRef]
- de Klerk, R.; Duarte, A.M.; Medeiros, D.P.; Duarte, J.P.; Jorge, J.; Lopes, D.S. Usability studies on building early stage architectural models in virtual reality. Autom. Constr. 2019, 103, 104–116. [Google Scholar] [CrossRef]
- Jishtu, P.; A Yadav, M. Futuristic Technology in Architecture & Planning—Augmented and Virtual Reality: An Overview. Int. J. Soft Comput. Artif. Intell. Appl. 2021, 10, 1–13. [Google Scholar] [CrossRef]
- Getuli, V.; Capone, P.; Bruttini, A.; Isaac, S. BIM-based immersive Virtual Reality for construction workspace planning: A safety-oriented approach. Autom. Constr. 2020, 114, 103160. [Google Scholar] [CrossRef]
- Berni, A.; Borgianni, Y. Applications of virtual reality in engineering and product design: Why, what, how, when and where. Electronics 2020, 9, 1064. [Google Scholar] [CrossRef]
- Wang, Y.; Lin, Y.S. Public participation in urban design with augmented reality technology based on indicator evaluation. Front. Virtual Real. 2023, 4, 1071355. [Google Scholar] [CrossRef]
- Van Leeuwen, J.P.; Hermans, K.; Jylhä, A.; Quanjer, A.J.; Nijman, H. Effectiveness of virtual reality in participatory urban planning. In Proceedings of the ACM International Conference Proceeding Series; Association for Computing Machinery, Espoo, Finland, 13–15 August 2018; pp. 128–136. [Google Scholar]
- Williams, K.J.H.; Ford, R.M.; Bishop, I.D.; Loiterton, D.; Hickey, J. Realism and selectivity in data-driven visualisations: A process for developing viewer-oriented landscape surrogates. Landsc. Urban Plan. 2007, 81, 213–224. [Google Scholar] [CrossRef]
- Orland, B. Synthetic Landscapes. In Environmental Simulation; Springer: Boston, MA, USA, 1993; pp. 213–250. [Google Scholar]
- Mahdjoubi, L.; Wiltshire, J. Towards a Framework for Evaluation of Computer Visual Simulations in Environmental Design. Des. Stud. 2001, 22, 193–209. [Google Scholar] [CrossRef]
- Osgood, C.E.; Suci, G.J.; Tannenbaum, P.H. The Measurement of Meaning; University of Illinois Press: Chicago, IL, USA, 1957; ISBN 9780252745393. [Google Scholar]
- Sierra, J.R. Manual de Dibujo de La Arquitectura, Etc.: Contra La Representación; Instituto Universitario de Ciencias de la Construcción. Universidad de Sevilla: Sevilla, Spain, 1997; ISBN 978-84-88988-19-5. [Google Scholar]
- Hetherington, J.; Daniel, T.C.; Brown, T.C. Is Motion More Important than It Sounds?: The Medium of Presentation in Environment Perception Research. J. Environ. Psychol. 1993, 13, 283–291. [Google Scholar] [CrossRef]
- Radford, A.; Woodbury, R.; Braithwaite, G.; Kirkby, S.; Sweeting, R.; Huang, E. Issues of Abstraction, Accuracy and Realism in Large Scale Computer Urban Models. In CAAD futures 1997; Springer: Dordrecht, The Netherlands, 1997; pp. 679–690. [Google Scholar]
- Bates-Brkljac, N. Assessing Perceived Credibility of Traditional and Computer Generated Architectural Representations. Des. Stud. 2009, 30, 415–437. [Google Scholar] [CrossRef]
- Buller, D.B.; Burgoon, J.K. Interpersonal Deception Theory. Commun. Theory 1996, 6, 203–242. [Google Scholar] [CrossRef]
- Appleyard, D. Understanding Professional Media. In Human Behavior and Environment; Springer: Boston, MA, USA, 1977; pp. 43–88. [Google Scholar]
- Sheppard, S.R.J. Visual Simulation: A User’s Guide for Architects, Engineers, and Planners; Van Nostrand Reinhold: New York, NY, USA, 1989; ISBN 9780442278274. [Google Scholar]
- Hall, R. Algorithms for Realistic Image Synthesis. In Computer Graphics Techniques: Theory and Practice; Rogers, D.F., Earnshaw, R.A., Eds.; Springer: New York, NY, USA, 1990; ISBN 9780387972374. [Google Scholar]
- White, D.D.; Wutich, A.; Larson, K.L.; Gober, P.; Lant, T.; Senneville, C. Credibility, Salience, and Legitimacy of Boundary Objects: Water Managers’ Assessment of a Simulation Model in an Immersive Decision Theater. Sci. Public Policy 2010, 37, 219–232. [Google Scholar] [CrossRef]
- Weisman, J. Evaluating Architectural Legibility: Way-Finding in the Built Environment. Environ. Behav. 1981, 13, 189–204. [Google Scholar] [CrossRef]
- Kim, J.Y.; Kim, M.J. Exploring Visual Perceptions of Spatial Information for Wayfinding in Virtual Reality Environments. Appl. Sci. 2020, 10, 3461. [Google Scholar] [CrossRef]
- Nikolic, D. Evaluating Relative Impact of Virtual Reality Components Detail and Realism on Spatial Comprehension and Presence; Pennsylvania State University: State College, PA, USA, 2007. [Google Scholar]
- Faul, F.; Erdfelder, E.; Lang, A.G.; Buchner, A. G*Power 3: A Flexible Statistical Power Analysis Program for the Social, Behavioral, and Biomedical Sciences. In Proceedings of the Behavior Research Methods. Behav. Res. Methods 2007, 39, 175–191. [Google Scholar] [CrossRef]
- Chang, E.; Kim, H.T.; Yoo, B. Virtual Reality Sickness: A Review of Causes and Measurements. Int. J. Hum. Comput. Interact. 2020, 36, 1658–1682. [Google Scholar] [CrossRef]
- Pelizzari, M.A.; Scrivano, P. Intersection of Photography and Architecture - Introduction. Vis. Resour. 2011, 27, 107–112. [Google Scholar] [CrossRef]
- Bafna, S. How Architectural Drawings Work - and What That Implies for the Role of Representation in Architecture. J. Archit. 2008, 13, 535–564. [Google Scholar] [CrossRef]
- Borden, I. Imaging Architecture: The Uses of Photography in the Practice of Architectural History. J. Archit. 2007, 12, 57–77. [Google Scholar] [CrossRef]
- Portman, M.E.; Natapov, A.; Fisher-Gewirtzman, D. To Go Where No Man Has Gone before: Virtual Reality in Architecture, Landscape Architecture and Environmental Planning. Comput. Environ. Urban Syst. 2015, 54, 376–384. [Google Scholar] [CrossRef]
- Pallavicini, F.; Pepe, A.; Minissi, M.E. Gaming in Virtual Reality: What Changes in Terms of Usability, Emotional Response and Sense of Presence Compared to Non-Immersive Video Games? Simul. Gaming 2019, 50, 136–159. [Google Scholar] [CrossRef]
- Eiris, R.; Gheisari, M.; Esmaeili, B. Desktop-Based Safety Training Using 360-Degree Panorama and Static Virtual Reality Techniques: A Comparative Experimental Study. Autom. Constr. 2020, 109, 102969. [Google Scholar] [CrossRef]
- de Vasconcelos, G.N.; Malard, M.L.; van Stralen, M.; Campomori, M.; de Abreu, S.C.; Lobosco, T.; Gomes, I.F.; Lima, L.D.C. Do We Still Need CAVEs? In Proceedings of the International Conference on Education and Research in Computer Aided Architectural Design in Europe; Education and research in Computer Aided Architectural Design in Europe; University of Porto: Porto, Portugal, 2019; Volume 3, pp. 133–142. [Google Scholar]
- Shinde, Y.; Lee, K.; Kiper, B.; Simpson, M.; Hasanzadeh, S. A Systematic Literature Review on 360° Panoramic Applications in Architecture, Engineering, and Construction (AEC) Industry. J. Inf. Technol. Constr. 2023, 28, 405–437. [Google Scholar] [CrossRef]
- Coelho, H.; Melo, M.; Barbosa, L.; Martins, J.; Teixeira, M.S.; Bessa, M. Authoring Tools for Creating 360 Multisensory Videos—Evaluation of Different Interfaces. Expert Syst. 2021, 38. [Google Scholar] [CrossRef]
- Xu, M.; Li, C.; Zhang, S.; Callet, P. Le State-of-the-Art in 360 Video/Image Processing: Perception, Assessment and Compression. IEEE J. Sel. Top. Signal Process. 2020, 14, 5–26. [Google Scholar] [CrossRef]


| Experiment 1: | Experiment 2: | |
|---|---|---|
| Display Comparison | Format Comparison | |
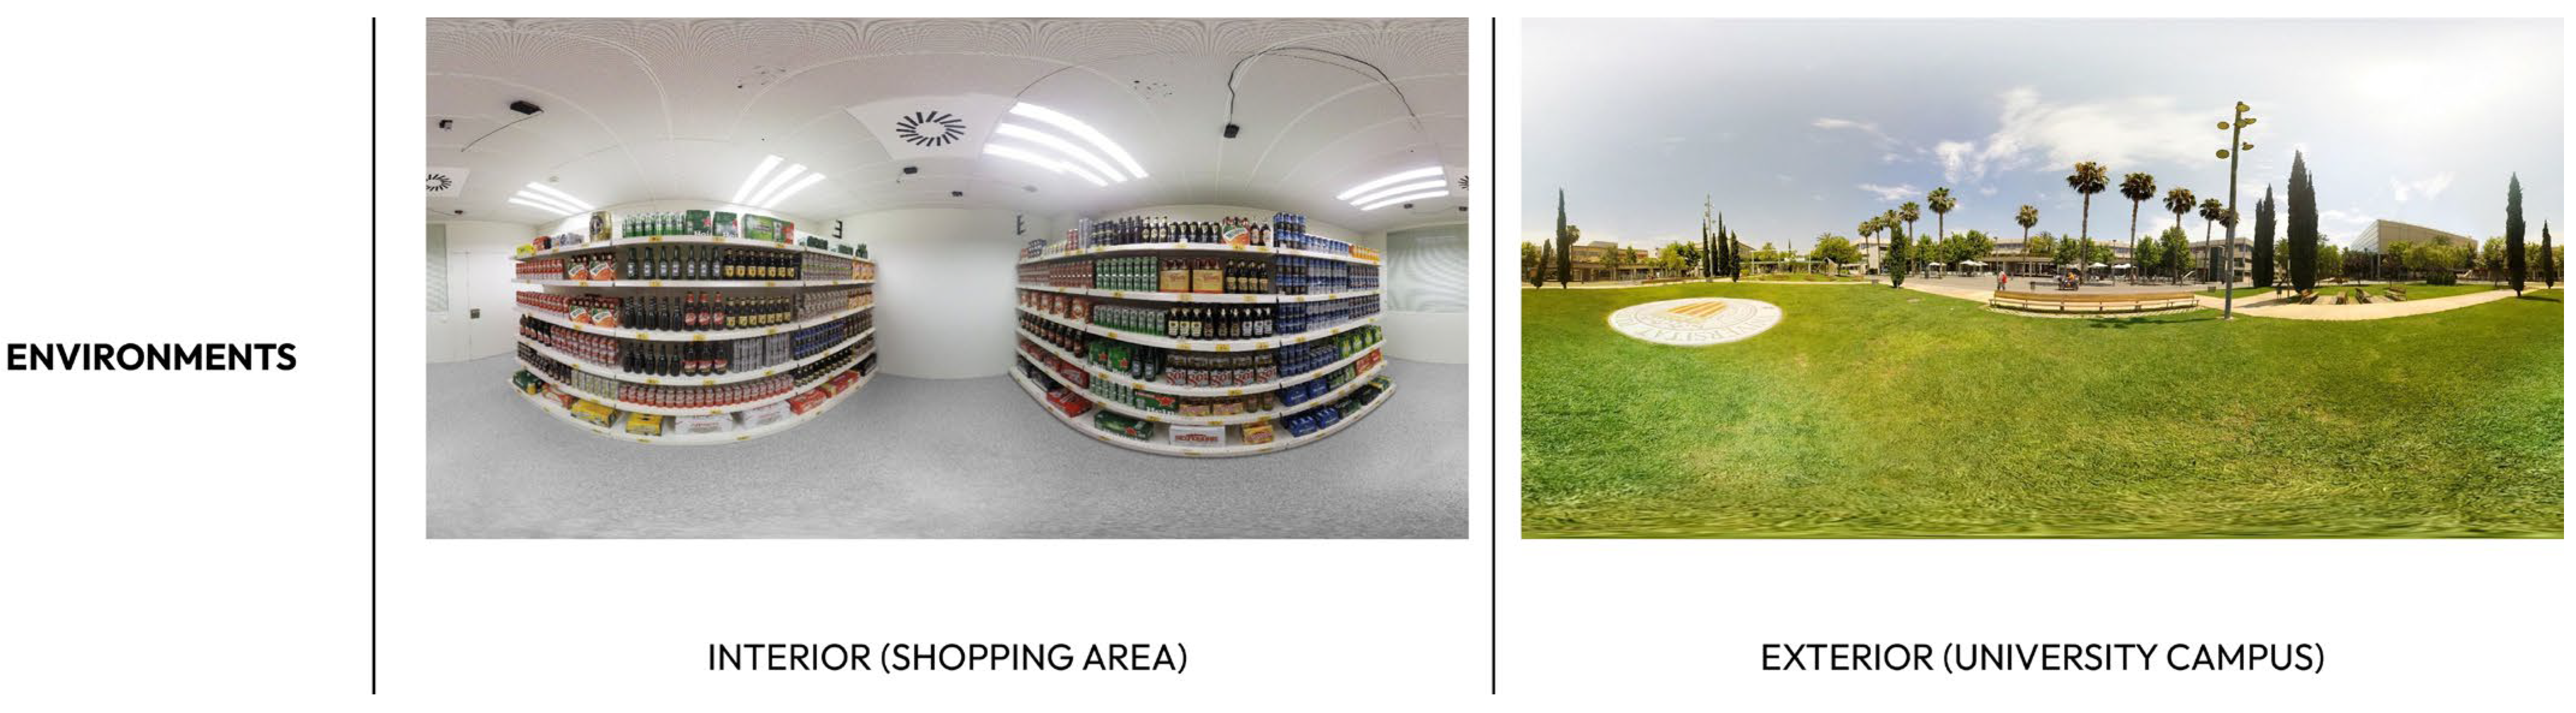
| Stimuli | Indoor space (shop) | Outdoor space (square) |
| Display | 1. PC (n = 20) | HTC Vive Pro 2 Head-Mounted Display |
| 3. HTC Vive Pro 2 (n = 20) | ||
| 4. PowerWall Screen (n = 20) | ||
| 5. CAVE (n = 20) | ||
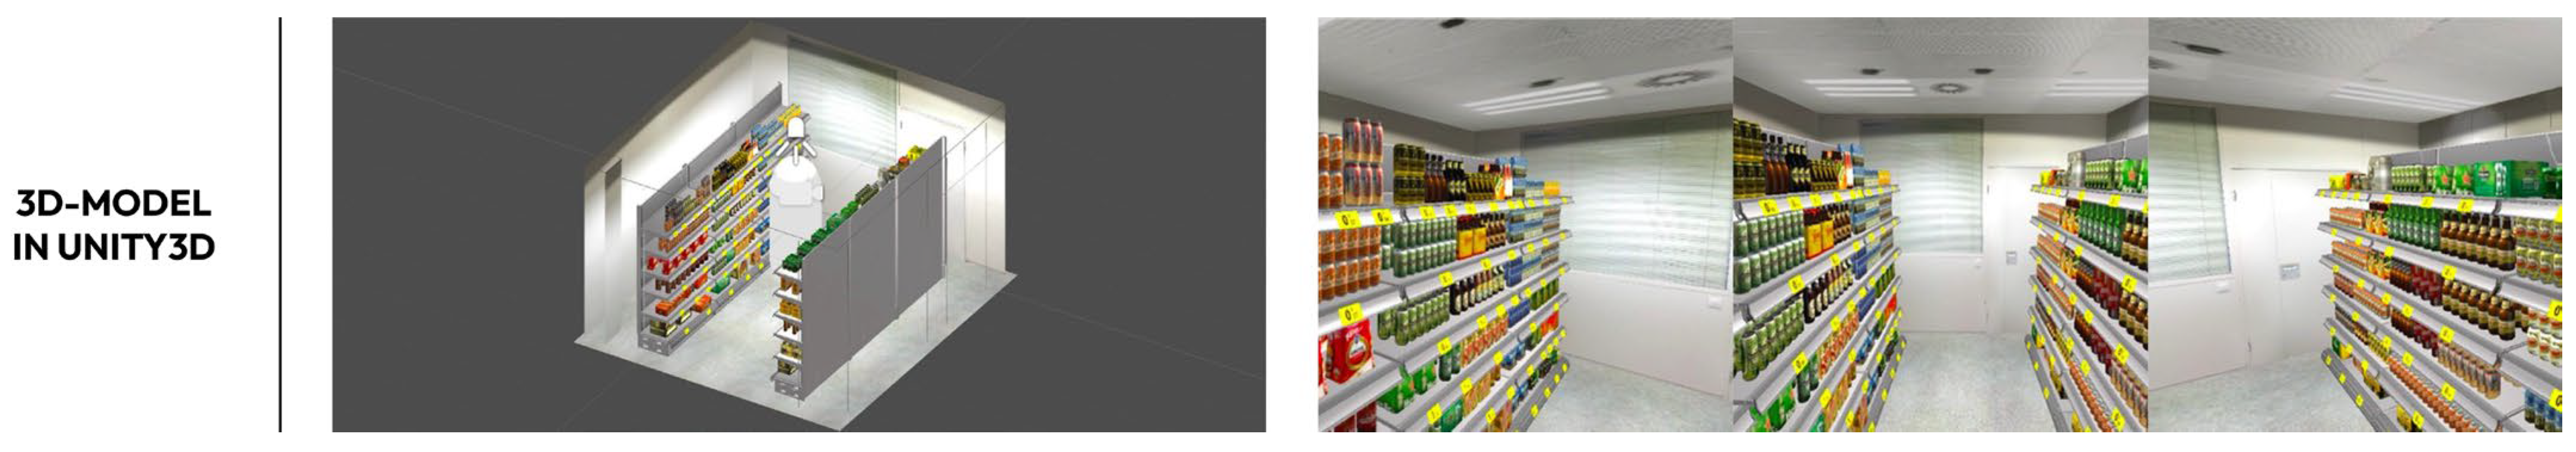
| Format | Virtual Environment | 1. Image (n = 20) |
| 2. 360° image (n = 20) | ||
| 3. Video (n = 20) | ||
| 4. 360° video (n = 20) | ||
| Sample | 80 (20 per stimulus) | 80 (20 per stimulus) |
| Dependent variables | 1. Credibility: abstraction, accuracy and realism | |
| 2. Spatial comprehension | ||
| 3. Sense of direction | ||
| 4. Help with design decisions | ||
| Data analysis | 1. Analysis of means | |
| 2. Statistically significant differences between groups | ||
| 3. Statistically significant correlations between concepts and groups | ||
| Gender | Age | ||||||||
|---|---|---|---|---|---|---|---|---|---|
| Male | Female | 20 to 35 | 36 to 50 | Total | |||||
| Experiment 1 | 55 | 55% | 45 | 45% | 53 | 53% | 47 | 47% | 100 |
| Experiment 2 | 47 | 59% | 33 | 41% | 42 | 53% | 38 | 48% | 80 |
| Based on users’ responses | Analysis of means Standard deviation |
| (a) Based on the profile of the subject (gender and age) | Mann–Whitney U |
| (b) Based on the stimuli analysed (displays and formats) | Kruskal–Wallis | |
| (a) Analysis of relationships between the variables that measure the users’ responses | Spearman correlation |
| (b) Analysis of relationships between the variables that measure the users’ responses and the stimuli (displays and formats) |
| Differences by Age (20 to 35/35 to 50) | ||||||
|---|---|---|---|---|---|---|
| Abstraction | Accuracy | Realism | Comprehension | Orientation | Helps with Design Decisions | |
| Mann–Whitney U | 1103.00 | 913.50 | 1030.50 | 1164.50 | 963.50 | 1147.00 |
| Wilcoxon W | 2231.00 | 2344.50 | 2461.50 | 2595.50 | 2394.50 | 2578.00 |
| Z | −1.00 | −2.34 | −1.52 | −0.62 | −2.09 | −0.69 |
| Asymp. Sig. (2-tailed) | 0.316 | 0.059 | 0.128 | 0.537 | 0.067 | 0.488 |
| Differences by gender (male/female) | ||||||
| Abstraction | Accuracy | Realism | Comprehension | Orientation | Helps with Design Decisions | |
| Mann–Whitney U | 1091.00 | 1185.00 | 1107.00 | 1203.50 | 1073.00 | 1198.00 |
| Wilcoxon W | 2126.00 | 2725.00 | 2647.00 | 2743.50 | 2613.00 | 2233.00 |
| Z | −1.03 | −0.37 | −0.93 | −0.26 | −1.22 | −0.28 |
| Asymp. Sig. (2-tailed) | 0.301 | 0.710 | 0.354 | 0.795 | 0.222 | 0.780 |
| Abstraction | Accuracy | Realism | Easy to Comprehend the Space | Easy to Orient Myself | Helps with Design Decisions | ||
|---|---|---|---|---|---|---|---|
| Abstraction | coef. | −0.395 ** | −0.087 | −0.019 | −0.089 | 0.193 | |
| Sig. | 0.000 | 0.387 | 0.850 | 0.378 | 0.054 | ||
| Accuracy | coef. | −0.395 ** | 0.191 | 0.203 * | 0.209 * | −0.053 | |
| Sig. | 0.000 | 0.056 | 0.043 | 0.037 | 0.600 | ||
| Realism | coef. | −0.087 | 0.191 | 0.351 ** | 0.287 ** | 0.586 ** | |
| Sig. | 0.387 | 0.056 | 0.000 | 0.004 | 0.000 | ||
| Easy to Understand the Space | coef. | −0.019 | 0.203 * | 0.351 ** | 0.452 ** | 0.382 ** | |
| Sig. | 0.850 | 0.043 | 0.000 | 0.000 | 0.000 | ||
| Easy to Orient Myself | coef. | −0.089 | 0.209 * | 0.287 ** | 0.452 ** | 0.352 ** | |
| Sig. | 0.378 | 0.037 | 0.004 | 0.000 | 0.000 | ||
| Helps with Design Decisions | coef. | 0.193 | −0.053 | 0.586 ** | 0.382 ** | 0.352 ** | |
| Sig. | 0.054 | 0.600 | 0.000 | 0.000 | 0.000 | ||
| Differences by Age (20 to 35/35 to 50) | ||||||
|---|---|---|---|---|---|---|
| Abstraction | Accuracy | Realism | Comprehension | Orientation | Helps with Design Decisions | |
| Mann–Whitney U | 690.50 | 787.50 | 754.50 | 733.00 | 794.00 | 719.00 |
| Wilcoxon W | 1431.50 | 1528.50 | 1657.50 | 1636.00 | 1535.00 | 1622.00 |
| Z | −1.06 | −0.11 | −0.44 | −0.71 | −0.04 | −0.78 |
| Asymp. Sig. (2-tailed) | 0.287 | 0.916 | 0.660 | 0.478 | 0.968 | 0.434 |
| Differences by gender (male/female) | ||||||
| Abstraction | Accuracy | Realism | Comprehension | Orientation | Helps with Design Decisions | |
| Mann–Whitney U | 642.00 | 646.00 | 719.00 | 742.50 | 609.50 | 737.00 |
| Wilcoxon W | 1203.00 | 1774.00 | 1280.00 | 1870.50 | 1737.50 | 1865.00 |
| Z | −1.34 | −1.32 | −0.58 | −0.37 | −1.71 | −0.39 |
| Asymp. Sig. (2-tailed) | 0.180 | 0.188 | 0.562 | 0.715 | 0.087 | 0.699 |
| Abstraction | Accuracy | Realism | Easy to Comprehend the Space | Easy to Orient Myself | Helps with Design Decisions | ||
|---|---|---|---|---|---|---|---|
| Abstraction | coef. | −0.480 ** | −0.064 | 0.084 | −0.046 | −0.004 | |
| Sig. | 0.000 | 0.573 | 0.461 | 0.683 | 0.975 | ||
| Accuracy | coef. | −0.480 ** | 0.276 * | 0.231 * | 0.162 | 0.143 | |
| Sig. | 0.000 | 0.013 | 0.039 | 0.150 | 0.206 | ||
| Realism | coef. | −0.064 | 0.276 * | 0.518 ** | 0.411 ** | 0.349 ** | |
| Sig. | 0.573 | 0.013 | 0.000 | 0.000 | 0.002 | ||
| Easy to Understand the Space | coef. | 0.084 | 0.231 * | 0.518 ** | 0.359 ** | 0.248 * | |
| Sig. | 0.461 | 0.039 | 0.000 | 0.001 | 0.026 | ||
| Easy to Orient Myself | coef. | −0.046 | 0.162 | 0.411 ** | 0.359 ** | 0.548 ** | |
| Sig. | 0.683 | 0.150 | 0.000 | 0.001 | 0.000 | ||
| Helps with Design Decisions | coef. | −0.004 | 0.143 | 0.349 ** | 0.248 * | 0.548 ** | |
| Sig. | 0.975 | 0.206 | 0.002 | 0.026 | 0.000 | ||
| Video (vs. Image) | coef. | 0.277 * | −0.193 | 0.076 | 0.033 | −0.128 | 0.119 |
| Sig. | 0.013 | 0.086 | 0.502 | 0.771 | 0.258 | 0.293 | |
| 360° (vs. Non-360°) | coef. | 0.125 | −0.069 | 0.176 | 0.234 * | 0.545 ** | 0.530 ** |
| Sig. | 0.271 | 0.542 | 0.119 | 0.037 | 0.000 | 0.000 | |
Disclaimer/Publisher’s Note: The statements, opinions and data contained in all publications are solely those of the individual author(s) and contributor(s) and not of MDPI and/or the editor(s). MDPI and/or the editor(s) disclaim responsibility for any injury to people or property resulting from any ideas, methods, instructions or products referred to in the content. |
© 2024 by the authors. Licensee MDPI, Basel, Switzerland. This article is an open access article distributed under the terms and conditions of the Creative Commons Attribution (CC BY) license (https://creativecommons.org/licenses/by/4.0/).
Share and Cite
Higuera-Trujillo, J.L.; López-Tarruella Maldonado, J.; Castilla, N.; Llinares, C. Architectonic Design Supported by Visual Environmental Simulation—A Comparison of Displays and Formats. Buildings 2024, 14, 216. https://doi.org/10.3390/buildings14010216
Higuera-Trujillo JL, López-Tarruella Maldonado J, Castilla N, Llinares C. Architectonic Design Supported by Visual Environmental Simulation—A Comparison of Displays and Formats. Buildings. 2024; 14(1):216. https://doi.org/10.3390/buildings14010216
Chicago/Turabian StyleHiguera-Trujillo, Juan Luis, Juan López-Tarruella Maldonado, Nuria Castilla, and Carmen Llinares. 2024. "Architectonic Design Supported by Visual Environmental Simulation—A Comparison of Displays and Formats" Buildings 14, no. 1: 216. https://doi.org/10.3390/buildings14010216