

Local Thermal Comfort and Physiological Responses in Uniform Environments


School of Mechanical Engineering, Tongji University, Shanghai 201804, China
*
Author to whom correspondence should be addressed.
Buildings 2024, 14(1), 59; https://doi.org/10.3390/buildings14010059
Submission received: 18 November 2023
/
Revised: 14 December 2023
/
Accepted: 17 December 2023
/
Published: 24 December 2023
(This article belongs to the Special Issue Advances in Built Environment Engineering: Ventilation, Air Conditioning, and Heating Technology)
Abstract
:The thermal perception of different body parts can vary greatly throughout the human body and have different influences on overall thermal sensation and comfort. Various personal comfort systems (PCS) have been developed to stimulate local body parts for the purpose of enhancing human thermal comfort, yet the most effective body parts for intervention remain undetermined. Therefore, a series of climate chamber experiments under five uniform environments with three sets of suits were conducted in this study. The results showed that the head, chest, belly, and hands tended to feel no cooler than overall in cooler environments, but arms and legs felt generally no warmer than overall in warmer environments. The head, trunk and upper arms were more likely to be the comfort-dominant body parts. Additionally, the upper arms and upper back expected temperature regulation measures the most under non-neutral environments, thus they seem to be the two most needed and effective targeted body parts that a PCS could be applied to. The skin temperature and thermal sensation of limbs were more sensitive to indoor air temperatures than those of the torso. However, variations in the skin temperature of the head, chest, upper back, and calves had the strongest correlation with overall sensation vote changes. The above results and conclusions can not only serve as the basis for the future studies of local thermal comfort, but also provide theoretical guidance for the design of future PCS products.
1. Introduction
In recent decades, due to people spending most of their time indoors, indoor thermal comfort has attracted increasing attention [1,2,3]. Thermal comfort has already been found to be strongly related to human health, well-being and productivity [4,5,6]. Initially, one-size-fits-all thermal comfort models based on the prediction of large group averages, such as the predicted mean vote, were widely accepted [7,8]. Later, individual differences in thermal comfort caused by factors such as gender, age, etc., attracted the attention of researchers [9,10,11]. Academics have also found that feelings in local body parts vary greatly as a result of physical factors and the uneven distribution of clothing d [12]. Draught and vertical temperature differences in non-uniform environments may also cause local thermal sensation differences [13]. Furthermore, local thermal sensations and thermal comfort have great effects on overall thermal comfort and may cause metabolic transients, as observed in previous studies [14,15,16,17]. Some researchers have suggested that the reasonable selection of local body part combinations could achieve more accurate overall comfort predictions [18,19]. For the purpose of improving overall thermal comfort for indoor occupants, it is of great significance to understand the mechanism of local thermal comfort and its impact on overall thermal comfort, which is essential for the evaluation of overall thermal comfort [20].
Diverse conclusions have been drawn from previous research in both uniform environments and non-uniform environments [21,22,23]. Arens et al. [22] found that the feet were consistently cooler than other body parts in uniform conditions and were a main reason for discomfort in cool conditions. Fang et al. [24] observed that the head, torso, and hands felt significant warmer than the overall sensation of thermal comfort, while arms and lower limbs felt significantly cooler. Choi et al. [18] discovered that the forehead and arms provided stronger support for overall perception than other body parts. Some researchers found that warming the feet was an effective comfort-enhancing method [23,25], while another experiment observed that heating the waist could increase overall thermal perception more than heating the feet [26]. Some studies have observed that the head has a strong influence on overall thermal comfort and that cooling the face could best improve thermal comfort [18,27]. Fang [24] discovered that the upper back and chest that played a dominant role in overall comfort. However, some of the following issues exist in previous research: the limited number of body parts selected for local stimulation resulted in the omission of potentially temperature-sensitive body parts; the lack of diversity in environment temperatures and stimulus intensity jointly led to conditional conclusions; biased conclusions were drawn from small sample experiments and one-direction stimulation experiments, referring to heating only or cooling only. Therefore, comprehensive and systematic experiments are needed to further explore the mechanism of local thermal comfort.
Inspired by the fact that local thermal sensations could greatly affect overall thermal sensation and comfort, more and more scholars have considered using personal comfort systems (PCS) for human thermal regulation while helping to save building energy consumption [28]. A large number of experiments on the application of various kinds of PCSs have been conducted [29]. A heated/cooled chair was used to condition the microclimate around the back and hips [30,31]; a heated vest was used to heat the torso [32,33]; a heating mat and foot-warmers were used to warm up feet [34,35]; and the face and chest were cooled by deck fans [36]. However, the design of existing PCS products was not effectively guided by obtained local thermal comfort results, and related experiments were more often based on existing products rather than on conclusions drawn from previous research. Furthermore, the most effective targeted body parts and heat transfer mechanisms for PCSs remain undetermined [29]. Therefore, conducting local thermal sensation experiments can not only contribute to a greater understanding of local thermal sensation mechanisms and their effect on overall thermal comfort, but also provide guidance for PCS product design and related research.
For the research objectives mentioned above, a number of climate chamber experiments have been conducted to collect physiological parameters, overall subjective responses, and local subjective responses under uniform environments. This paper investigates nine spatially uniform conditions under five indoor air temperature from 20 °C to 32 °C, at 3 °C intervals, with three different suits. Section 2 demonstrates how the experiments were conducted in detail. Section 3 presents the effects of indoor air temperature and clothing insulation on overall and local thermal sensation votes and comfort votes, among which a previously unnoticed phenomenon called the “comfort peak” was observed, and its features and importance are discussed. Section 4 summarizes five effect patterns of local subjective votes on overall subjective votes based on gathered questionnaires. Dominance patterns and average patterns were the assumptions used to develop the complaint-driven model and weight coefficient overall comfort model, respectively [37,38,39]. Results indicate that they each accounted for one-third of the obtained questionnaires, suggesting that the current overall thermal comfort models using local votes as input are only suitable under certain situations. The upper back and upper arms were considered as the most effective targeted body parts that PCSs could potentially be applied to for thermal regulation under non-neutral environments and the highest likelihood that these are the comfort-dominant body part. The results and conclusion of this study can not only help in the development of PCS products but also contribute to further studies of local thermal comfort in non-uniform environments or research for the thermal comfort of senior citizens.
2. Methods
2.1. Experimental Conditions
The experiment was carried out in the climate chamber of Tongji University from May 2023 to October 2023. The climate chamber has the capacity to control ambient temperature within ±0.3 °C of the set point in a range of 18 °C to 28 °C and within 0.5 °C when the set point range expands from 0 °C to 40 °C. The relative humidity was maintained between 55–65% and the air speed was less than 0.1 m/s in the chamber. Therefore, a uniform environment without obvious draughts could be created, making it possible to explore the effects of indoor air temperature and clothing insulation on subjective votes and physical responses in uniform environments.
Five levels of indoor air temperature, 20 °C, 23 °C, 26 °C, 29 °C and 32 °C, and three different sets of clothing, were chosen to be studied. The combination of indoor air temperature and suits determined 9 experimental conditions, as seen in Table 1. Suit A comprised a T-shirt, underwear, shorts, and cloth slippers with bare feet. For Suit B, a long-sleeved shirt and trousers replaced the T-shirt and shorts of suit A, respectively, and a pair of socks was added as well. Suit C included a coat in addition to the components of suit B and cloth slippers were replaced by cotton slippers. The overall clothing insulation was 0.37 clo, 0.59 clo and 0.77 clo for Suits A, B, and C, respectively [40]. The suits used in the experiment are shown in Figure 1.
2.2. Experimental Procedure
A complete 2 h experiment consisted of four stages: a 20 min preparation stage, a 20 min adaptive stage, a 50 min experiment stage and a 30 min recovery stage. The experimental procedure is shown in Figure 2.
During the preparation stage, subjects were briefed on experimental procedures and related notes. Subsequently, instruments were attached to their body surfaces, and participants were outfitted in standardized clothing.
During the adaptive stage, participants sat still outside the climate chamber (26 °C) to eliminate the effect of outdoor temperature and reach a thermoneutral state. At the 15th minute of this stage, subjects were asked to complete a questionnaire.
At the beginning of the experimental stage, subjects were directed to enter the climate chamber where the room temperature had already been controlled and stabilized. Immediately upon taking a seat, participants were asked to complete a questionnaire, after which questionnaires were offered at 5 min intervals over the course of 50 min. Physiological parameters were recorded as well.
After the 50 min exposure, participants exited the climate chamber, and the recovery stage began. Similar to the experimental stage, they were instructed to complete a questionnaire as soon as they exited climate chamber and fill it at 5 min intervals, later in the recovery stage.
2.3. Questionnaire and Measurement
Subjective votes, both overall votes and local votes for 11 body parts (including the head, chest, belly, upper back, waist, left upper arm, left forearm, left hand, left thigh, left calf, left foot), were collected through questionnaires.
Subjective perception of overall and local thermal sensation and comfort were collected using continuous 7-point scales with a minimum unit of 0.25. Similarly, participants provided overall and local thermal expectations using 7-point scales, and thermal satisfaction and thermal acceptability using 4-point scales (Figure 3). Subjects were asked to respond to subjective questions at 5 min intervals.
Skin temperature (Tskin) was measured using Pyrobuttons (Opulus, Philadelphia, PA, USA, accuracy: ±0.2 °C) at the same 11 body parts, as local subjective votes, at 20 s intervals. Environmental parameters in the climate chamber were also recorded every 1 min through instrument HD32.3TC Thermal microclimate (Delta OHM, Padua, Italy), through which WBGT, PMV, PDD and mean radiant temperature (Trm) were calculated.
2.4. Subjects
In this study, subjects were required to have good eyesight, good hearing, and no congenital and heat-related disease. A total of 32 college students (12 males and 20 females) aged 18 to 28 were selected as participants. They were asked to avoid intense exercise and have enough sleep before the beginning of the experiment. This study was reviewed by the Ethics Committee of Tongji University (2020tjdx051). Participants provided informed consent for the study and basic personal information before the start of the experiment, as shown in Table 2.
2.5. Data Analysis
To statistically compare and analyze the subjective thermal votes and physical responses according to temperature and clothing insulation, the following steps were conducted: (i) feature selection; and (ii) statistical analysis.
2.5.1. Feature Selection
The results of subjective votes and physiological responses are mainly presented as mean values and standard deviations. The selection of features was conducted as follows: The subjective votes of the 1st minute of the experimental stage and recovery stage were chosen to reflect the instantaneous subjective feelings when entering and exiting the climate chamber, respectively. The subjective votes were relatively stable after 30 min of exposure in the climate chamber. Therefore, the average value of the subjective votes at the 35th, 40th and 45th min was chosen to represent subjective feelings after stabilization. The mean skin temperature at the last 5 min of the adaptive stage was chosen as the reference value, which was subtracted to calculate temperature variations. The mean skin temperature of the last 5 min of the experimental stage was chosen as the “stable” skin temperature since some skin temperatures did not achieve stability during the whole experimental stage.
2.5.2. Statistical Analysis
Statistical analysis was carried out from three perspectives: (i) temperature difference; (ii) clothing insulation; and (iii) body parts. The independent sample t-test, a statistical test used to compare the means of two independent groups, was employed. When the p-value is less than 0.05, it indicates a significant difference between the means of the two groups. This test was applied in working conditions with the same room temperature to statistically analyze the differences concerning subjective votes and physical responses under different clothing insulation conditions. One-way ANOVA was utilized in working conditions with the same suit to statistically analyze the differences under various room temperatures. It was also used to compare local subjective votes and skin temperatures in the same working conditions to analyze differences among body parts.
3. Results
3.1. Environmental Parameters
Figure 4 depicts the environmental parameters during typical experimental processes. During the adaptive stage (minute 0–minute 20) and the recovery stage (minute 70–minute 100), the experimental temperature outside the climate chamber was controlled near 26 °C. The room temperature was controlled around the target temperature of each working condition, with a maximum difference of 0.5 °C, while relative humidity and air speed were controlled between 55% and 65% and under 0.1 m/s, respectively. These results indicate that the environmental parameters in the climate chamber were effectively controlled in accordance with the predetermined working conditions.
3.2. Overall and Local Subjective Votes under Different Conditions
3.2.1. Overall Sensation and Overall Comfort
The average of the overall sensation votes and overall comfort votes during different working conditions are illustrated in Figure 5.
During the adaptive stage (minute 15–minute 20), participants’ overall sensation votes under different conditions did not differ that much, with suit A scoring slightly lower (−0.13) and suit C scoring slightly higher (0.43). The distribution of the thermal comfort votes was more dispersed than that of the thermal sensation votes.
During the experimental stage (minute 20–minute 70), condition 2 (C23C) and condition 5 (C26B), where the overall sensation votes were closest to 0, had the highest and the second highest overall comfort votes. Despite both having a 3 °C temperature difference to 26 °C, condition 6 (C29B) achieved a higher absolute change in the voting value than condition 4 (C23B). However, under working condition 4, participants felt slightly comfortable (0 ≤ TCV ≤ 1), while they felt neutral or slightly uncomfortable under working condition 6 (−1 ≤ TCV ≤ 0). Similarly, condition 7 (C32B) had a higher absolute value of thermal sensation votes and more uncomfortable thermal comfort votes than condition 3 (C20B). Temperature changes in different directions with the same value resulted in varying degrees of voting changes, indicating that thermal comfort votes were asymmetrically distributed around 26 °C, or that the neutral temperature was not 26 °C with suit B.
In terms of clothing insulation, suit A and suit C corrected subjects’ thermal sensations towards thermal neutrality under hot or cold conditions. Conditions with suit A and suit C all had higher thermal comfort votes compared to suit B, for most of the experimental stage.
During the recovery stage (minute 70–minute 100), condition 2 (C23C) and condition 1 (C20C) remained the warmest and second-warmest condition, while condition 8 and condition 9 were the coolest and the second-coolest conditions. There was not much difference in the overall sensation votes of participants among different conditions with suit B. In terms of overall comfort votes, condition 5 (C26B) maintained the most comfortable conditions. The farther the temperature of the suit B working condition was away from 26 °C, the lower the overall comfort votes.
For conditions with relatively mild temperatures (23 °C and 29 °C), comfort votes of conditions for suit A and suit C became lower than those for suit B during the recovery stage. However, for conditions with extreme temperatures (20 °C and 32 °C), comfort votes of conditions for suit A and suit C remained higher than those for suit B during the recovery stage.
3.2.2. Local Sensation Vote and Comfort Vote
Despite being in a uniform environment, subjective thermal votes and their changing trends differed greatly among the body parts and conditions during the experimental stage. Only noteworthy or frequently observed phenomena are summarized and listed here. Taking condition 2 (C23C) and condition 4 (C23B) as examples, Figure 6 shows their mean local sensation votes and mean local comfort votes. Only the mean votes of some special moments are displayed, including minute 15, minute 20, minute 70 and the average of minute 55, minute 60 and minute 65, representing adaptation in neutral environment, entrance into the climate chamber, stabilization under uniform environment and exit from the climate chamber, respectively.
“Overshoot” refers to the phenomenon where the maximum difference in the sensation vote exists at the moment right after the transition from one environment to another, and the difference subsequently narrows. For example, the overall sensation votes of condition 4 (C23B) had an obvious “overshoot” after entering the climate chamber. The patterns of “overshoot” appearing in the experiment can be summarized by the following three points: (1) more “overshoot” could be observed in the comfort votes than the sensation votes; (2) obvious “overshoot” was only noticeable in cooler conditions; and (3) “Overshoot” was more frequently observed in conditions with suit B.
After the exit, in cooler conditions, most body parts felt cooler than during the adaptive stage with suit C, but felt roughly the same as the adaptive stage with suit B. However, in hotter conditions, body parts felt warmer than the adaptive stage with suit B, and felt roughly the same with suit A. Occasionally, some body parts not only recovered to the same level as that of the adaptive stage, but even went beyond. Furthermore, body parts with similar sensation votes, taking the waist in condition 2 (C23C), for example, had various comfort votes, indicating that thermal comfort is not only affected by thermal sensation, physical status, and the thermal preferences of subjects, but is influenced by previous heat exposure and thermal expectations as well. This supports the opinion that thermal comfort does not strictly accord with thermal sensation [41].
“Comfort peak” were observed under several conditions. Figure 7 demonstrates some examples.
Most of the body parts’ comfort votes decreased dramatically after entering condition 1. However, it is noteworthy that all of them bounced back somewhat, 5 or 10 min after entering the climate chamber (at minute 25 or 30) and then continued to decrease from there. This phenomenon is called the “comfort peak”, as it could only be observed in comfort votes and not sensation votes, and it differed from the phenomenon of “overshoot” in the following two aspects. First, in a descending process, “overshoot” often refers to the lowest value, but “comfort peak” was the highest value due to a bounce-back during the descending process. Second, “overshoot” often occurred soon after a transition, while “comfort peak” occurred 20 or 25 min later after the transition. The bounce-back of the “comfort peak” in a descending order (Figure 7a) may have been caused by the body’s regulatory mechanism, while the other “comfort peak” that occurred after entering a more comfortable environment (Figure 7b–d) strongly supports the theory that the sense of comfort occurs when the discomfort is alleviated [22,23], since the feeling of alleviating discomfort disappeared gradually as the sense of comfort reached a peak and then decreased as well. It is not the value of “comfort peak” but the moment when the peak appears that matters. The bounce-back “comfort peak” suggests that it takes our body 5 min or so to suppress discomfort caused by sudden changes in the environment. On the other hand, the other “comfort peak” indicates that after entering a more comfortable environment, the feelings of comfort begin to diminish after about 20 min.
3.2.3. Effect of Room Temperature and Clothing on Subjective Votes
Figure 8 shows participants’ subjective votes after stabilization under different conditions. The color of each body part represents the mean value of the votes at minute 35, minute 40 and minute 45. The letters a, b, c etc., reflect the significant differences between different body parts under the same conditions. If two body parts have the same letters, it indicates that there is no significant difference between these two parts’ subjective votes after stabilization; otherwise, the difference is significant (p < 0.05). Furthermore, a part labeled with letter a is always the hottest (or least cold) or the most comfortable part of the whole body under its condition, and the part labeled with letter b has the second highest value, and so forth. In terms of sensation vote, three out of the nine conditions showed no significant differences among the body parts. In cooler conditions (20 °C and 23 °C), thighs and calves were always among the coldest body parts, while in hotter conditions (29 °C and 32 °C), the upper back was the hottest body part.
In terms of the comfort vote, no significant difference was observed among the body parts in eight out of nine conditions, indicating that thermal sensation was more prone to uneven distribution than thermal comfort in a uniform environment.
Conditions with suit B were compared to condition 5 (C26B), and if there was significant difference, a black “*” was noted according to the level of significance. The upper back, upper arms, and forearms seemed to be the three most sensitive parts to room temperature, since under all conditions with suit B these parts’ sensation votes as well as the comfort votes were significantly different than those of condition 5. The sensitivity of body parts to temperature changes was also influenced by the direction of temperature changes, consistent with former study results [42]. For example, sensation votes for the head were more sensitive when room temperature increased than when it decreased, while sensation votes for the hands were more sensitive when the temperature was lower.
Conditions with suit A and suit C were compared to suit B conditions with the same room temperature, and a colored “*” (green for sensation votes, red for comfort votes) was used to mark the significance of the differences between them. Compared to suit B, suit C’s sensation votes for the upper arms, hands and feet were significantly improved, while the sensation votes for the trunk hardly changed. In terms of suit A, although only the sensation votes of upper back under condition 9 (C32A) had significance difference compared to condition 7 (C32B), the comfort votes under both 29 °C and 32 °C conditions were commonly enhanced, among which the improvement of upper back’s comfort votes was the most significant.
3.2.4. Thermal Acceptability and Thermal Satisfaction
The thermal acceptability and thermal satisfaction votes during experimental stage are shown in Figure 9.
Participants were more likely to find the uniform environment acceptable rather than satisfying, since the percentages of clearly acceptable and just acceptable were higher than those of clearly satisfied and just satisfied. With higher percentages of clearly acceptable and clearly satisfied, condition 2 (C23C) and condition 5 (C26B) were the most acceptable and satisfying conditions. In terms of indoor air temperature, although with the same temperature difference at 26 °C, condition 3 (C20B) and condition 4 (C23B) were more acceptable and satisfying than condition 6 (C29B) and condition 7 (C32B). A similar asymmetric distribution was also found in the overall thermal sensation votes, which ispartially consistent with Xiong’s observation [43]. As for clothing insulation, suit C achieved a higher percentage of acceptable and satisfied in cooler conditions, while suit A achieved a higher percentage of acceptable and satisfied in hotter conditions.
3.2.5. Overall and Local Thermal Expectation
Overall and local thermal expectation votes for all conditions are listed in Table 3. The absolute value of the overall expectation vote was higher than most of the local expectation votes’ absolute values. Generally, votes for the head remained among the highest local expectation votes, while the votes for the calves and waist were among the lowest, indicating that a cooler environment was preferred for the head, whereas a warmer environment was preferred for the waist and calves compared to other body parts. In cooler environments, the upper back and upper arms required the most heating, while the belly and hands had the lowest warming expectation. However, in hotter environments, the expectation for cooling of the upper back and upper arms was the highest, while the belly and hands were the least expected body part to cool down. The above phenomenon suggests that when the indoor air temperature deviates from the thermal neutral temperature, no matter if it is increased or decreased, the upper back and upper arms are the body parts that expect to receive the most temperature regulation, while the belly and hands have the lowest expectations for regulation.
3.3. Skin Temperature under Different Working Conditions
3.3.1. Effects of Environment Temperature on Skin Temperature
There are 5 conditions using suit B in total whose skin temperatures are illustrated in Figure 10, taking belly and calf for instance.
Significant differences in skin temperature in different conditions were determined using a one-way ANOVA test. The skin temperature of the head in a 20 °C environment and a 23 °C environment showed no significant difference. The skin temperature of the thighs in the 26 °C environment and 29 °C environment also showed no significant difference. The skin temperature of the upper arms in a 23 °C environment and 26 °C environment had a significant difference of 0.05 levels. Except for these three pairs mentioned above, all other pairs (skin temperature of the same body part in different uniform environments) had a significant difference of 0.01 level.
As shown in Figure 10, the higher the room temperature, the higher the mean skin temperature of each body part. The range of the skin temperatures in 26 °C condition was the smallest. Furthermore, the farther the room temperature was away from 26 °C, the wider the range of the skin temperature. In terms of body parts, limbs had a larger skin temperature range than the trunk in all kinds of conditions; the feet and hands had the largest range while the chest and belly had the smallest. The head also had a small skin temperature range under two cooler conditions. Among the differences in stable skin temperatures between conditions, differences were highest in the feet and hands were, that of the thighs was the third largest, while the belly, chest, and head were still the three smallest, indicating that skin temperature in the limbs was more sensitive to room temperature than that of the trunk.
3.3.2. Effects of Clothing on Skin Temperature
In order to investigate the effects of clothing on skin temperature, skin temperature variation curves of the same room temperature working conditions with the different suits were compared, and an independent sample t-test was also utilized. Temperature differences in skin temperature at minute 15 were used to replace the actual skin temperature value to eliminate the impact of initial skin temperatures.
Compared to suit B, suit A and suit C had significant differences in skin temperature variations under hotter and colder conditions, respectively. Suits had more significant impacts on skin temperature variations in conditions where the indoor air temperature was closer to 26 °C, with significant differences observed in all 11 body parts for 23 °C conditions, in 6 parts for 20 °C conditions, in 8 parts for 29° C conditions and in 5 parts for 32 °C conditions. Interestingly, in 29° C conditions, temperature variations in body parts were significantly higher for suit A, which had less clothing insulation. One possible reason is that the body part reference temperatures for suit A were lower than those for suit B; therefore, a bigger difference between indoor air temperature and skin temperature resulted in a larger skin temperature increase.
Clothing can affect the differences of skin temperature variations between the torso and limbs. Under conditions with suit B, torso’s temperature variations were significant smaller than limbs’. However, under 20 °C condition wearing suit C the difference narrowed and under 23 °C condition wearing suit C there was no significant difference. Although only a coat was added to the torso compared to suit B, suit C not only reduced the skin temperature variations of both the torso and limbs, but narrowed the differences between them.
Clothing can affect whether body parts reach temperature stabilization. The skin temperatures of most body parts with suit B under cooler conditions kept decreasing after 50 min exposure, except for the head and belly, while suit C helped these parts to achieve temperature stabilization within the experimental stage. For example, the skin temperature variation curves of the upper limbs in the 23 °C environment wearing suit B and suit C are shown in Figure 11a. However, fewer body parts with suit A achieved temperature stabilization than with suit B under hotter conditions.
Clothing can affect temperature changes in the recovery stage. During the recovery stage, skin temperatures of body parts wearing suit C or wearing suit A recovered to their reference values sooner than body parts wearing suit B. The skin temperature of most body parts continued to increase or decrease towards their reference values of minute 15 after 30 min recovery at 26 °C environment, except for body parts in condition 7 (C32B) where skin temperature stabilized at a value slightly higher than the reference value, as shown in Figure 11b.
4. Discussion
4.1. Effect Patterns of Local Subjective Votes on Overall Subjective Votes
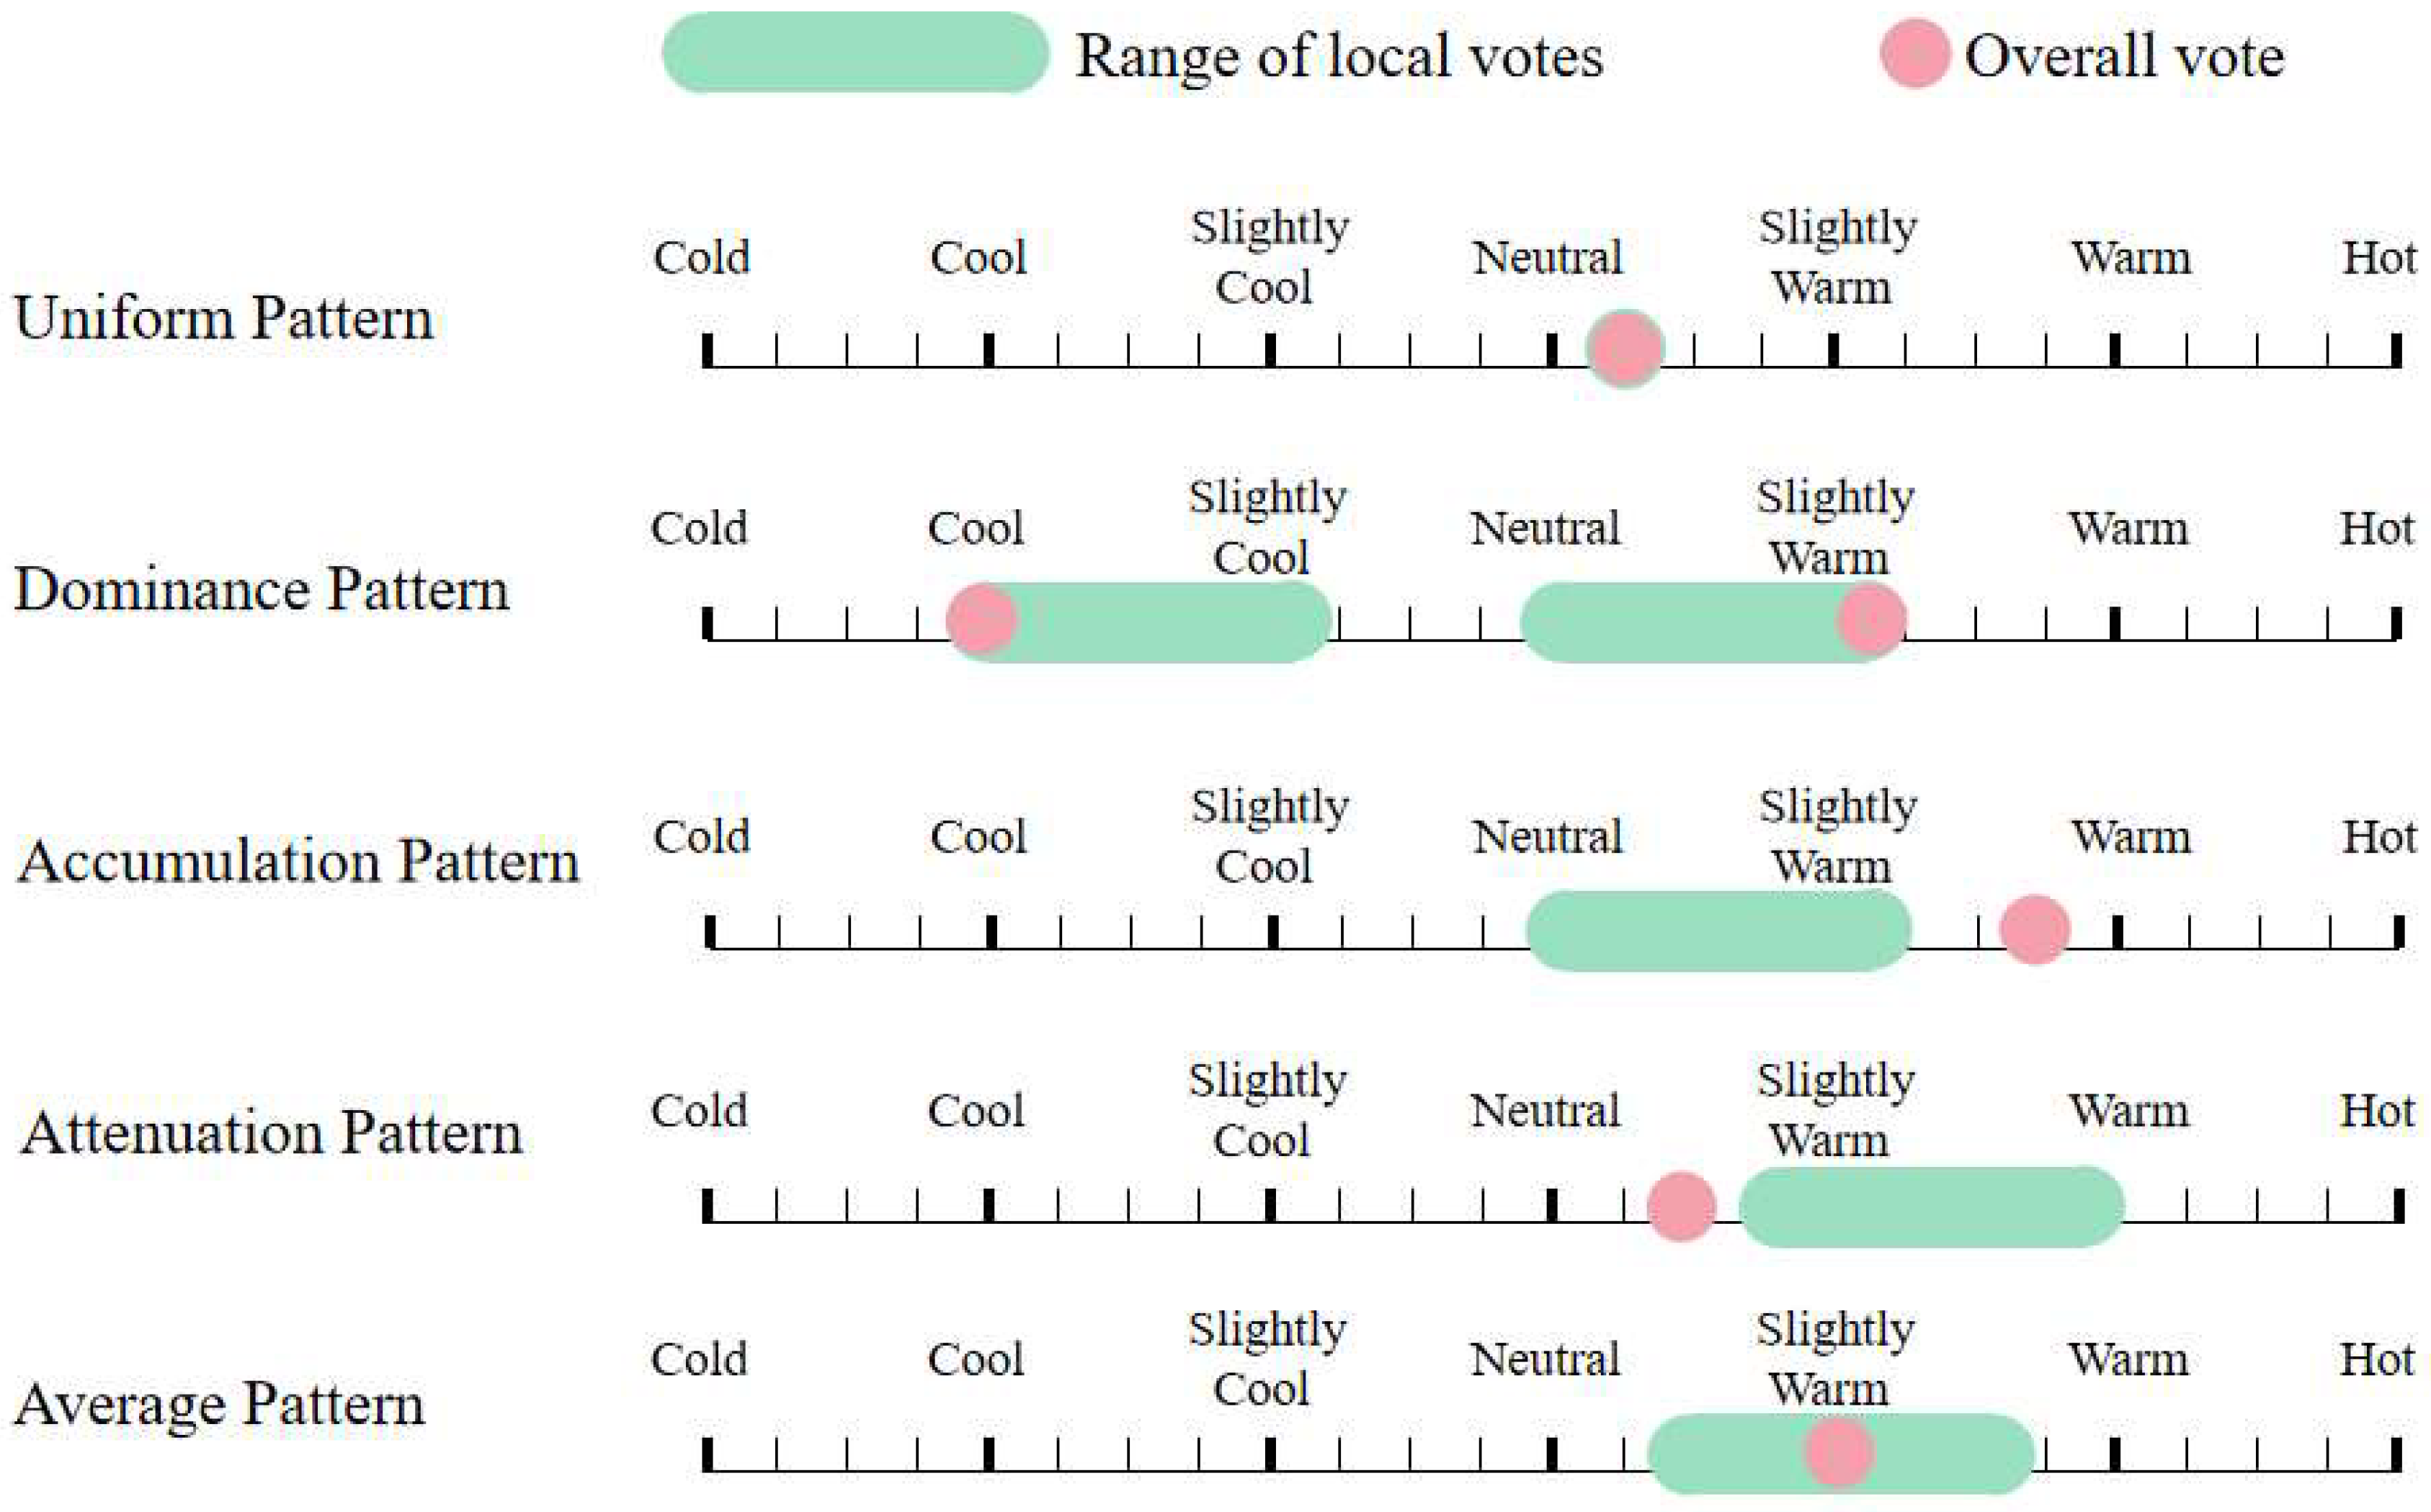
Five types of effect patterns of local subjective votes on overall subjective votes were extracted from the gathered questionnaires. The characteristics of each pattern are illustrated in Figure 12. Only the sensation vote scale is shown in Figure 12, but the pattern characteristics for the comfort vote are the same.
Strictly speaking, the uniform pattern refers to situations where all local votes were equal to the overall vote; in other words, all body parts felt the same. In many cases, having one or two body parts that felt different from others did not affect the overall sensation. Therefore, the definition of the uniform pattern was artificially relaxed to having 9 or more body parts that matched the overall sensation or comfort vote.
Non-uniform patterns were divided into the following four categories. The dominance pattern refers to situations where the overall vote was equal to the highest or the lowest value of all local votes. The accumulation pattern and attenuation pattern refer to situations where the overall vote was higher or lower than all of the local votes, respectively. Situations where the overall vote was between the highest local vote and the lowest local vote were classified as the average pattern. The number of occurrences in 1396 collected questionnaires of both the sensation vote pattern and comfort vote pattern are listed in Table 4.
The average pattern, dominance pattern and uniform pattern, orderly, were the three most frequently occurring patterns in the sensation pattern. The average pattern, dominance pattern and uniform pattern occurred most frequently with the comfort vote. The accumulation pattern occurred occasionally (7.88% of the comfort questionnaire and 5.16% of the sensation questionnaire), while the attenuation pattern hardly ever occurred. Although about half of the questionnaires (693 questionnaires, 49.64%) were classified into a homonymous pattern in both the sensation pattern and comfort pattern, it is notable that the remaining questionnaires indicated that the division in the patterns was not strictly consistent between these two subjective votes. For example, the fact that there were more average patterns in the sensation vote and more uniform patterns in the comfort vote indicated that people’s thermal sensations were more sensitive, and they were more likely to experience uniform comfort than uniform sensations. In other words, people can feel uniform comfort even if the thermal sensation is non-uniform.
Under a non-strictly uniform pattern where local subjective votes were not all consistent with the overall vote, the higher the frequency of a non-uniform local vote in a certain body part, the smaller the impact on the overall vote. Among non-strictly uniform sensation questionnaires, the hands, feet and belly were most likely to feel warmer than the overall vote, while the calves, feet and legs were most likely to feel cooler than the overall vote, proving that these parts had the least impact on overall sensation. With the uniform comfort pattern, the hands and feet were most likely to feel more comfortable while feet and calves were most likely to feel uncomfortable than the overall comfort vote.
Under the dominance pattern, conversely, the higher the frequency of a dominant local vote appearing in a certain body part, the higher the impact on the overall vote. The upper back, head and chest were most likely to have the hottest local vote and determine the overall sensation vote, while the upper back, upper arm and belly were most likely to have the coldest local vote and determine the overall sensation vote. In terms of the comfort pattern, the head, belly, and upper back were most likely to have the most comfortable local vote and dominate the overall comfort vote, while the upper back, upper arms and head were most likely to have the most uncomfortable local vote and dominate the overall comfort vote. A focus on questionnaires with less than two dominant parts revealed that hands and feet scarcely played a dominant role.
Considering the above analysis, the following conclusions can be drawn: the head, trunk and upper arms are more likely to be the dominant body part; however, although hands, calves and feet often feel inconsistent with the whole body, they hardly affect the overall feeling.
Although there were different patterns related to how local subjective votes affected overall votes, data applicable to all patterns were also found. When participants felt cold, referring to situations where the overall sensation vote was less than or equal to −1, the head, chest, belly, and hands felt warmer than overall with a frequency of over 83.95% and felt no cooler than overall with a frequency of over 98.77%. When participants felt hot, referring to situations where the overall sensation vote was higher or equal to 1, legs felt colder than overall with a frequency of over 67.65%, and the arms and legs felt no warmer than overall with a frequency of over 91.91%. Under the dominance sensation pattern, if it was a hot-driven situation, whose overall sensation vote was dominated by the hottest local part, the overall sensation vote must be greater than or equal to 0. Likewise, comfort-driven situation could only occur only if the overall comfort vote was greater than or equal to 0 while discomfort-driven situation’s occurrence had no limitation. The phenomenon that overall comfort vote could be dominated by the most comfort part was inconsistent with Zhang’s complaint-driven model [37].
Some academics utilized weight coefficients that added up to 1 to establish overall sensation models or overall comfort models [38,39]. For example, the weight coefficients of Zhang’s overall sensation model are 0.21, 0.24, 0.25 and 0.30 for the face, chest, back and lower body, respectively. Selecting 1 as the sum of the weight coefficients was based on an assumption that overall sensation was determined by averaging local sensation, which was only correct under an average pattern. This average assumption will inevitably miscalculate the overall sensation under the dominant pattern, and usually the predicted value will be closer to neutral than to the actual value.
4.2. Correlation between Sensation Vote and Skin Temperature
The correlation between the overall sensation vote, the local sensation vote and skin temperature was analyzed through SPSS 26. The data used for the correlation analysis were the change values between back-to-back thermal sensation votes and the differences in skin temperature at the corresponding time. The results are shown in Table 5.
As shown in the table, the changes in skin temperature were significantly positively correlated with the overall thermal sensation vote and the corresponding local thermal sensation vote changes, but the correlation coefficients were different. The skin temperature changes of the head, chest, upper back, and calves, had higher correlation coefficients with overall and local thermal sensation vote changes. The correlation coefficients for the waist and feet between the variations of skin temperature and sensation votes were the lowest.
4.3. Limitations and Future Work
The effect patterns of local subjective votes on overall subjective votes discussed in Section 4.1 were summarized and proposed based on the experimental data of uniform environments. Whether these are suitable for non-uniform environment or for situations where some body parts are under local stimulation needs to be tested in future studies. Only the results of subjective and physiological responses of young people in a uniform environment are presented, and no models were established in this article. In addition, the results are only applicable to young people; therefore, similar studies need to be conducted on elderly people in the future to investigate differences between young and elderly people.
5. Conclusions
This study investigated the thermal comfort and physiological responses of young people in uniform environments with different clothing through a series of climate chamber experiments with 32 subjects. The main conclusions of this study are summarized as follows.
- (1)
- Local perceptions varied widely from one another and were greatly different than overall perceptions in uniform environments. In cooler environments, the head, chest, belly, and hands felt warmer than overall, with a frequency of over 83.95%, and they felt no cooler than overall with a frequency of over 98.77%. In warmer environments, legs felt colder than overall with a frequency of over 67.65%. Arms and legs also felt no warmer than overall with a frequency of over 91.91%. Perceptions of the same body part also differed a lot in different environments or when wearing different suits. Thermal sensations of the limbs and upper back were sensitive to indoor air temperature and suits. Conversely, thermal sensations of the head, chest, belly, and waist were relatively less sensitive.
- (2)
- Overall thermal comfort votes, thermal acceptability votes, and thermal satisfaction votes were all asymmetrically distributed around 26 °C with T-shirt and pants. Participants were more likely to find the uniform environment acceptable rather than satisfying. People could feel uniform comfort even if the thermal sensation was non-uniform. The overall comfort vote could be dominated by the most comfortable body parts.
- (3)
- After a jump in temperature, “Overshoot” was more likely to be found in the thermal comfort vote than in the sensation vote. A previously unnoticed phenomenon “comfort peak”, referring to situations where comfort votes have the highest value during exposure, were observed under several conditions. The bounce-back “comfort peak” suggests that it takes our body 5 min or so to suppress discomfort caused by sudden changes in the environment. The other “comfort peak” indicates that after entering a more comfortable environment for about 20 min, the feelings of comfort begin to diminish.
- (4)
- The head, trunk, and upper arm were more likely to be the dominant body parts, while hands, calves and feet hardly affected overall feelings. Additionally, the upper arms and upper back expected temperature regulation measures the most under non-neutral environments. Therefore, the upper back and upper arms seem to be the two most needed and effective targeted body parts that PCSs could be applied to.
- (5)
- The skin temperature of limbs was more sensitive to indoor air temperatures than that of the torsos, while hands and feet were the most sensitive. However, the temperature variations of hands and feet had the worst correlation with changes in local sensation votes as well as overall sensation votes. Skin temperature variations for the head, chest, upper back, and calves had the strongest correlation with the overall sensation vote changes.
- (6)
- By changing to a more suitable suit in slightly non-neutral uniform environments, the thermal sensation votes and comfort votes could be effectively improved. Suitable clothes also helped skin temperatures to stabilize more quickly after jumps in temperature. Wearing an extra coat on the upper body could effectively reduce the difference in skin temperature changes between the torso and limbs.
- (7)
- Five effect patterns of local subjective votes on overall subjective votes were summarized based on the gathered questionnaires. The dominance pattern and average pattern, which are assumptions for developing complaint-driven model and weight coefficient overall comfort model, respectively, each accounted for one-third of the obtained questionnaires, indicating that the current overall thermal comfort models using local votes as inputs are only suitable under certain situations.
Author Contributions
Conceptualization, H.Y., Y.T. and X.Z.; methodology, Y.T., X.Z. and H.Y.; software, Y.T. and X.Z.; validation, Y.T., H.M. and K.Z.; formal analysis, Y.T.; investigation, X.Z., Y.T., K.Z. and H.M.; resources, H.Y.; data curation, X.Z. and Y.T.; writing—original draft preparation, X.Z.; writing—review and editing, H.Y., Y.T., K.Z. and H.M.; visualization, X.Z.; supervision, H.Y.; project administration, H.Y.; funding acquisition, H.Y. All authors have read and agreed to the published version of the manuscript.
Funding
This research was funded by National Natural Science Foundation of China, grant number 52078355 and 51578386 and the Science and Technology Commission of Shanghai Municipality, grant number 20dz1207201. The APC was funded by National Natural Science Foundation of China, grant number 52078355 and 51578386.
Data Availability Statement
The data presented in this study are available upon request from the corresponding author. The data are not publicly available due to further exploration of these data.
Conflicts of Interest
The authors declare no conflicts of interest.
References
- Brasche, S.; Bischof, W. Daily time spent indoors in german homes—Baseline data for the assessment of indoor exposure of german occupants. Int. J. Hyg. Environ. Health 2005, 208, 247–253. [Google Scholar] [CrossRef] [PubMed]
- Klepeis, N.E.; Nelson, W.C.; Ott, W.R.; Robinson, J.P.; Tsang, A.M.; Switzer, P.; Behar, J.V.; Hern, S.C.; Engelmann, W.H. The national human activity pattern survey (nhaps): A resource for assessing exposure to environmental pollutants. J. Expo. Sci. Environ. Epidemiol. 2001, 11, 231–252. [Google Scholar] [CrossRef] [PubMed]
- Leech, J.A.; Nelson, W.C.; Burnett, R.T.; Aaron, S.; Raizenne, M.E. It’s about time: A comparison of canadian and american time–activity patterns. J. Expo. Sci. Environ. Epidemiol. 2002, 12, 427–432. [Google Scholar] [CrossRef] [PubMed]
- Xia, Y.; Lin, W.; Gao, W.; Liu, T.; Li, Q.; Li, A. Experimental and numerical studies on indoor thermal comfort in fluid flow: A case study on primary school classrooms. Case Stud. Therm. Eng. 2020, 19, 100619. [Google Scholar] [CrossRef]
- Shi, X.; Zhu, N.; Zheng, G. The combined effect of temperature, relative humidity and work intensity on human strain in hot and humid environments. Build. Environ. 2013, 69, 72–80. [Google Scholar] [CrossRef]
- Omonijo, A.G. Assessing seasonal variations in urban thermal comfort and potential health risks using physiologically equivalent temperature: A case of ibadan, nigeria. Urban Clim. 2017, 21, 87–105. [Google Scholar] [CrossRef]
- Ye, G.; Yang, C.; Chen, Y.; Li, Y. A new approach for measuring predicted mean vote (pmv) and standard effective temperature (set∗). Build. Environ. 2003, 38, 33–44. [Google Scholar] [CrossRef]
- Fanger, P.O. Assessment of man’s thermal comfort in practice. Br. J. Ind. Med. 1973, 30, 313–324. [Google Scholar] [CrossRef]
- Wang, Z.; de Dear, R.; Luo, M.; Lin, B.; He, Y.; Ghahramani, A.; Zhu, Y. Individual difference in thermal comfort: A literature review. Build. Environ. 2018, 138, 181–193. [Google Scholar] [CrossRef]
- Beshir, M.Y.; Ramsey, J.D. Comparison between male and female subjective estimates of thermal effects and sensations. Appl. Ergon. 1981, 12, 29–33. [Google Scholar] [CrossRef]
- Jiao, Y.; Yu, H.; Yu, Y.F.; Wang, Z.; Wei, Q. Adaptive thermal comfort models for homes for older people in Shanghai, China. Energy Build. 2020, 215, 109918. [Google Scholar] [CrossRef]
- Khiavi, N.M.; Maerefat, M.; Zolfaghari, S.A. Assessment of overall body thermal sensation based on the thermal response of local cutaneous thermoreceptors. J. Therm. Biol. 2019, 83, 187–194. [Google Scholar] [CrossRef] [PubMed]
- Kaczmarczyk, J.; Melikov, A.; Fanger, P.O. Human response to personalized ventilation and mixing ventilation. Indoor Air 2004, 14, 17–29. [Google Scholar] [CrossRef] [PubMed]
- Wang, Y.M.; Lian, Z.W.; Chang, H.Y. The correlation between the overall thermal comfort, the overall thermal sensation and the local thermal comfort in non-uniform environments with local cooling. Indoor Built Environ. 2022, 31, 1822–1833. [Google Scholar] [CrossRef]
- Zhang, H.; Arens, E.; Huizenga, C.; Han, T. Thermal sensation and comfort models for non-uniform and transient environments: Part I: Local sensation of individual body parts. Build. Environ. 2010, 45, 380–388. [Google Scholar] [CrossRef]
- Zhang, H.; Arens, E.; Huizenga, C.; Han, T. Thermal sensation and comfort models for non-uniform and transient environments, part II: Local comfort of individual body parts. Build. Environ. 2010, 45, 389–398. [Google Scholar] [CrossRef]
- Goto, T.; Toftum, J.; de Dear, R.; Fanger, P.O. Thermal sensation and thermophysiological responses to metabolic step-changes. Int. J. Biometeorol. 2006, 50, 323–332. [Google Scholar] [CrossRef] [PubMed]
- Choi, J.-H.; Yeom, D. Investigation of the relationships between thermal sensations of local body areas and the whole body in an indoor built environment. Energy Build. 2017, 149, 204–215. [Google Scholar] [CrossRef]
- Zhang, K.G.; Yu, H.; Tang, Y.; Luo, M.H.; Su, Z.X.; Li, C.E. Quantitative investigation of body part selection for data-driven personal overall thermal preference prediction. Buildings 2022, 12, 170. [Google Scholar] [CrossRef]
- Pellerin, N.; Deschuyteneer, A.; Candas, V. Local thermal unpleasantness and discomfort prediction in the vicinity of thermoneutrality. Eur. J. Appl. Physiol. 2004, 92, 717–720. [Google Scholar] [CrossRef]
- Su, X.; Yuan, Y.; Wang, Z.; Liu, W.; Lan, L.; Lian, Z. Human thermal comfort in non-uniform thermal environments: A review. Energy Built Environ. 2023. [Google Scholar] [CrossRef]
- Arens, E.; Zhang, H.; Huizenga, C. Partial- and whole-body thermal sensation and comfort—Part I: Uniform environmental conditions. J. Therm. Biol. 2006, 31, 53–59. [Google Scholar] [CrossRef]
- Arens, E.; Zhang, H.; Huizenga, C. Partial- and whole-body thermal sensation and comfort—Part II: Non-uniform environmental conditions. J. Therm. Biol. 2006, 31, 60–66. [Google Scholar] [CrossRef]
- Fang, Z.; Liu, H.; Li, B.; Tan, M.; Olaide, O.M. Experimental investigation on thermal comfort model between local thermal sensation and overall thermal sensation. Energy Build. 2018, 158, 1286–1295. [Google Scholar] [CrossRef]
- Ghaddar, N.; Ghali, K.; Chehaitly, S. Assessing thermal comfort of active people in transitional spaces in presence of air movement. Energy Build. 2011, 43, 2832–2842. [Google Scholar] [CrossRef]
- Liu, C.; Tang, Y.; Sun, L.; Zhang, N.; Gao, W.; Yuan, L.; Shi, J. Effects of local heating of body on human thermal sensation and thermal comfort. J. Build. Eng. 2022, 53, 104543. [Google Scholar] [CrossRef]
- Nakamura, M.; Yoda, T.; Crawshaw, L.I.; Yasuhara, S.; Saito, Y.; Kasuga, M.; Nagashima, K.; Kanosue, K. Regional differences in temperature sensation and thermal comfort in humans. J. Appl. Physiol. 2008, 105, 1897–1906. [Google Scholar] [CrossRef]
- Zhang, H.; Arens, E.; Zhai, Y. A review of the corrective power of personal comfort systems in non-neutral ambient environments. Build. Environ. 2015, 91, 15–41. [Google Scholar] [CrossRef]
- Tang, Y.; Yu, H.; Zhang, K.; Niu, K.; Mao, H.; Luo, M. Thermal comfort performance and energy-efficiency evaluation of six personal heating/cooling devices. Build. Environ. 2022, 217, 109069. [Google Scholar] [CrossRef]
- Pasut, W.; Zhang, H.; Arens, E.; Zhai, Y.C. Energy-efficient comfort with a heated/cooled chair: Results from human subject tests. Build. Environ. 2015, 84, 10–21. [Google Scholar] [CrossRef]
- Yang, H.; Deng, Y.; Cao, B.; Zhu, Y. Study on the local and overall thermal perceptions under nonuniform thermal exposure using a cooling chair. Build. Environ. 2020, 176, 106864. [Google Scholar] [CrossRef]
- Song, W.F.; Lai, D.D.; Wang, F.M. Evaluating the cold protective performance (cpp) of an electrically heated garment (ehg) and a chemically heated garment (chg) in cold environments. Fibers Polym. 2015, 16, 2689–2697. [Google Scholar] [CrossRef]
- Li, S.; Jia, X.; Cao, B.; Zhu, Y. Improvement of thermal perceptions and physiological responses using torso heating under short-term cold exposure. Sci. Total Environ. 2023, 892, 164491. [Google Scholar] [CrossRef] [PubMed]
- Zhang, H.; Arens, E.; Taub, M.; Dickerhoff, D.; Bauman, F.; Fountain, M.; Pasut, W.; Fannon, D.; Zhai, Y.; Pigman, M. Using footwarmers in offices for thermal comfort and energy savings. Energy Build. 2015, 104, 233–243. [Google Scholar] [CrossRef]
- Wang, H.; Li, W.; Wang, J.; Xu, M.; Ge, B. Experimental study on local floor heating mats to improve thermal comfort of workers in cold environments. Build. Environ. 2021, 205, 108227. [Google Scholar] [CrossRef]
- He, Y.; Li, N.; Li, N.; Li, J.; Yan, J.; Tan, C. Control behaviors and thermal comfort in a shared room with desk fans and adjustable thermostat. Build. Environ. 2018, 136, 213–226. [Google Scholar] [CrossRef]
- Zhang, H.; Arens, E.; Huizenga, C.; Han, T. Thermal sensation and comfort models for non-uniform and transient environments, Part III: Whole-body sensation and comfort. Build. Environ. 2010, 45, 399–410. [Google Scholar] [CrossRef]
- Zhang, Y. Effect of Local Exposure on Human Responses. Ph.D. Thesis, Tsinghua University, Beijing, China, 2005. [Google Scholar]
- Jin, Q. Study on Thermal Sensation During Step-Change in Non-Uniform Thermal Environment. Ph.D. Thesis, Dalian University of Technology, Dalian, China, 2012. [Google Scholar]
- Tang, Y.; Su, Z.X.; Yu, H.; Zhang, K.G.; Li, C.E.; Ye, H. A database of clothing overall and local insulation and prediction models for estimating ensembles’ insulation. Build. Environ. 2022, 207, 108418. [Google Scholar] [CrossRef]
- Wang, Z.; Wang, J.; He, Y.; Liu, Y.; Lin, B.; Hong, T. Dimension analysis of subjective thermal comfort metrics based on ashrae global thermal comfort database using machine learning. J. Build. Eng. 2020, 29, 101120. [Google Scholar] [CrossRef]
- Velt, K.B.; Daanen, H.A.M. Thermal sensation and thermal comfort in changing environments. J. Build. Eng. 2017, 10, 42–46. [Google Scholar] [CrossRef]
- Xiong, J.; Lian, Z.; Zhang, H. Effects of exposure to winter temperature step-changes on human subjective perceptions. Build. Environ. 2016, 107, 226–234. [Google Scholar] [CrossRef]
Figure 1.
Experiment suits: (a) suit A; (b) suit B; and (c) suit C.

Figure 2.
Experiment procedure.
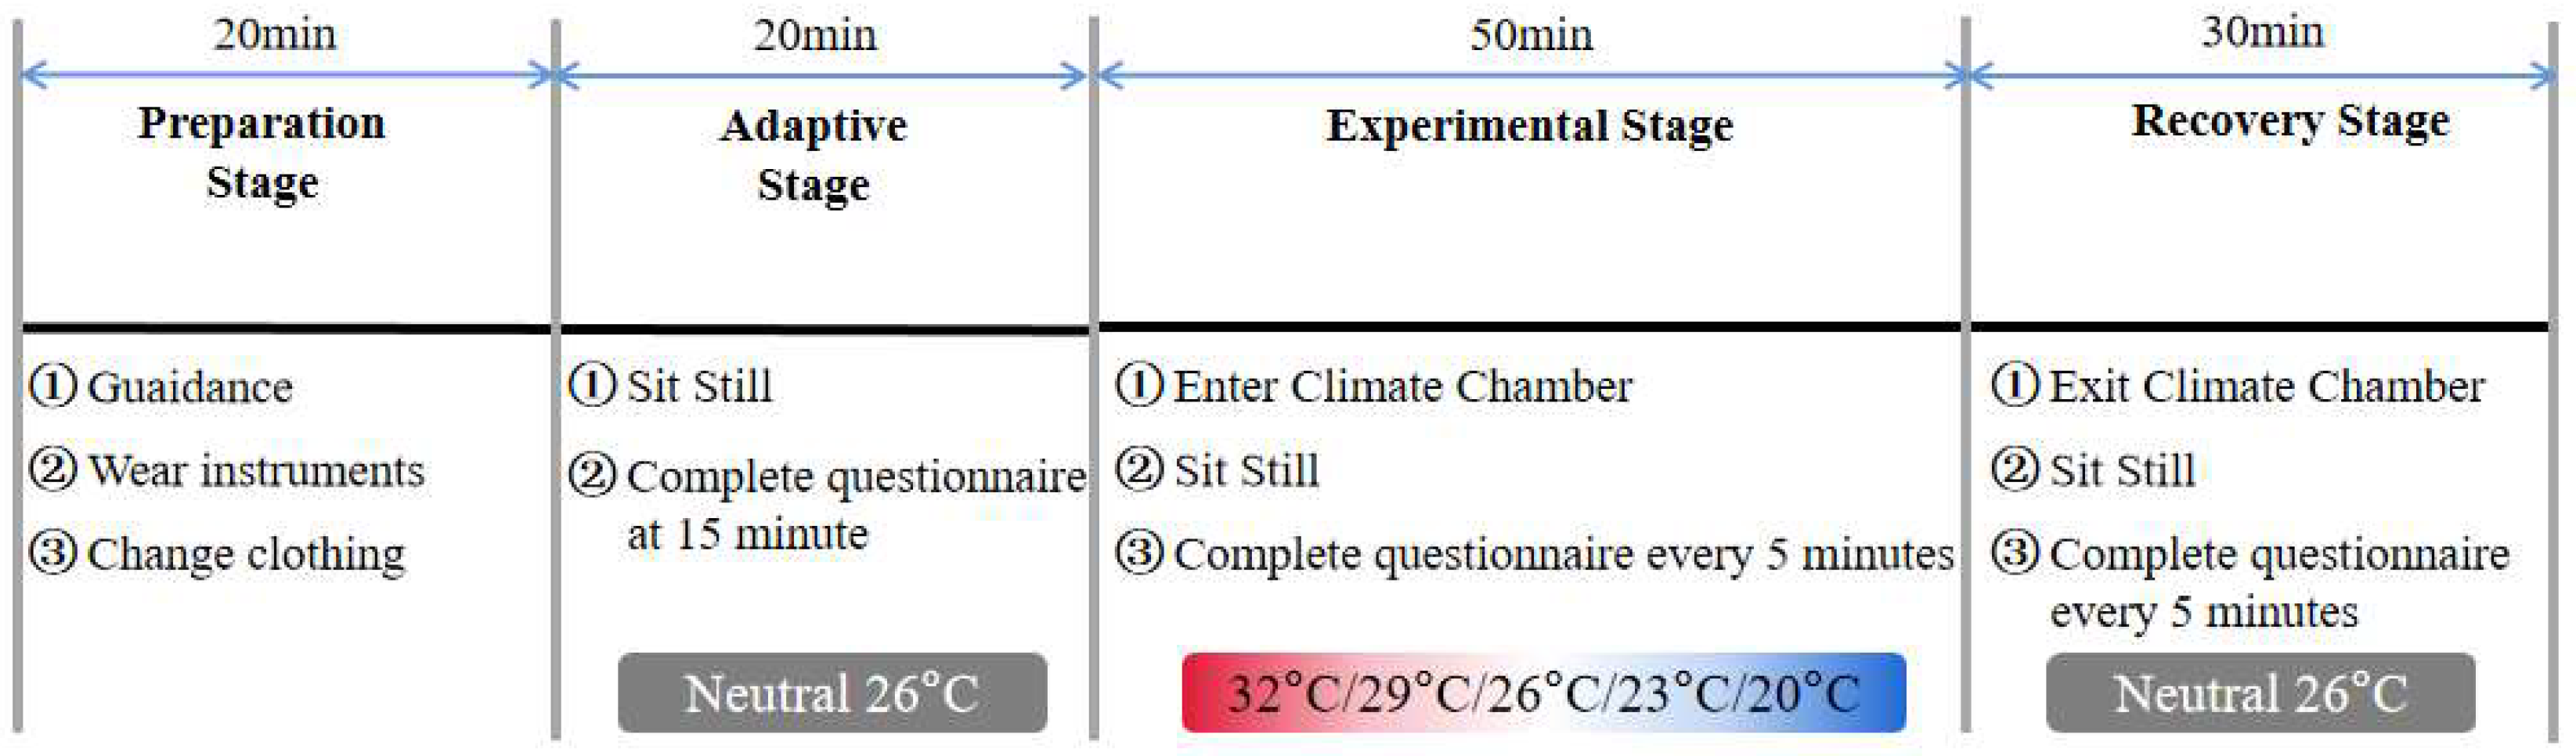
Figure 3.
Subjective questionnaire scales.
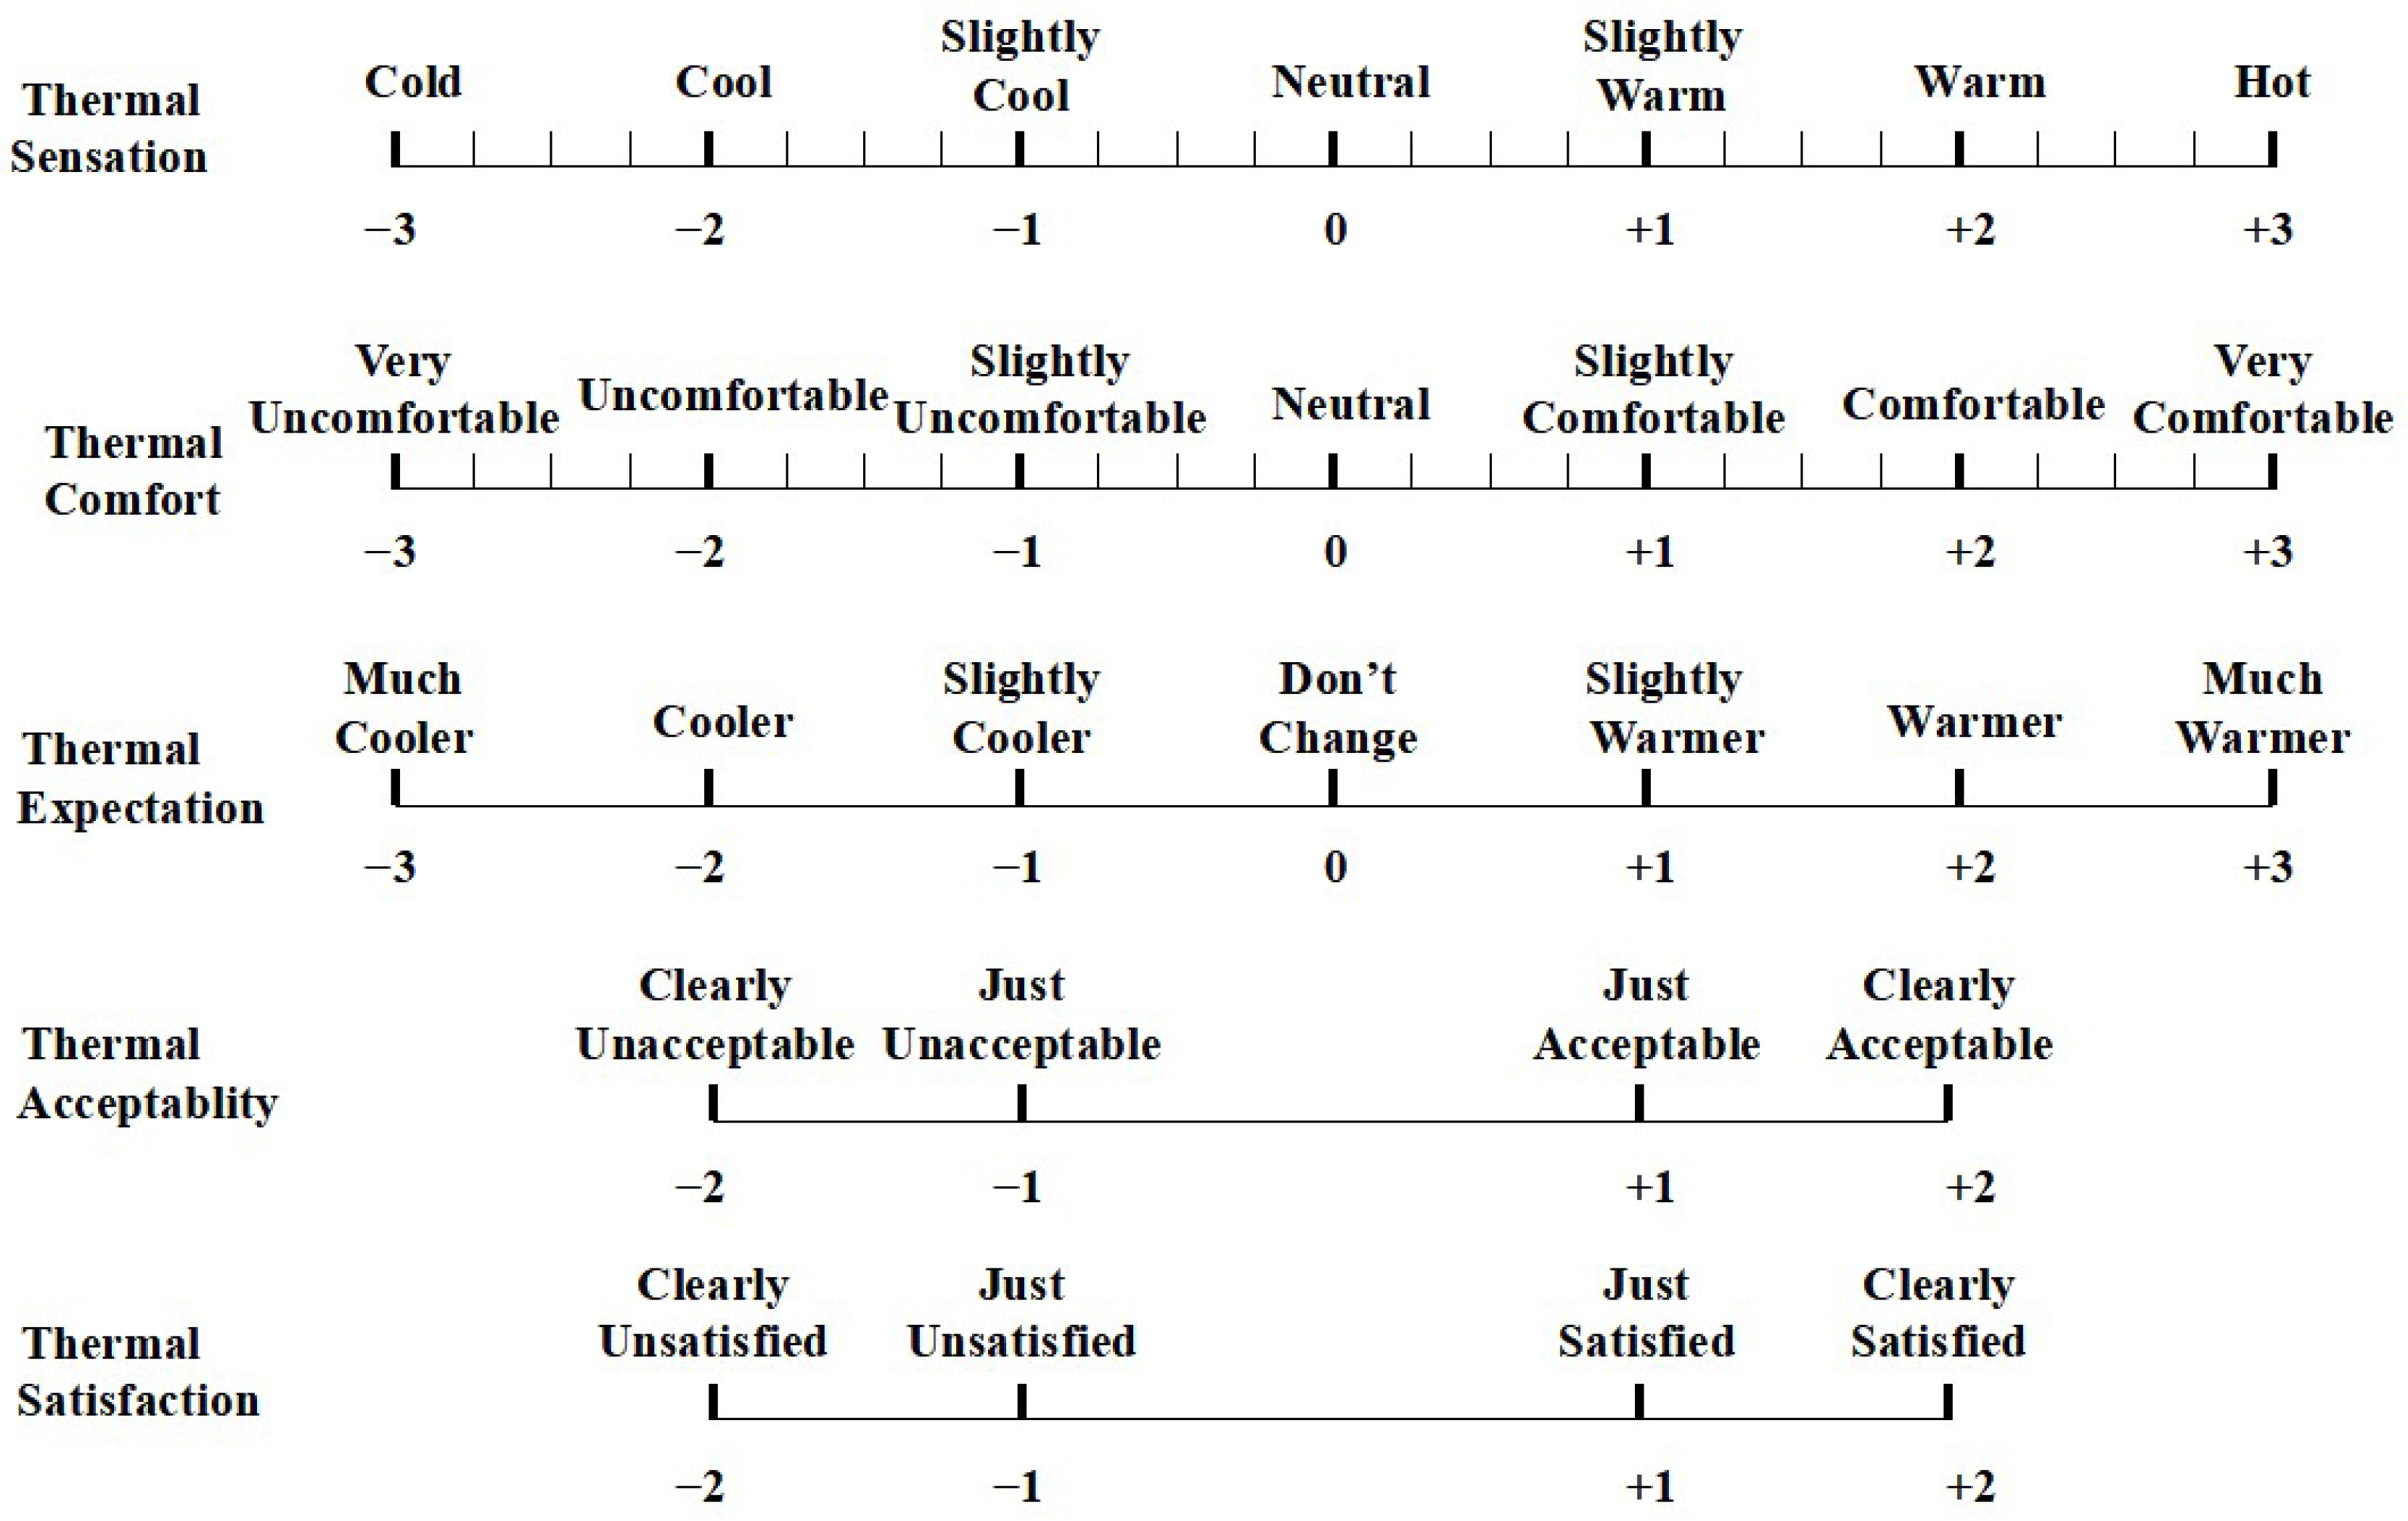
Figure 4.
Environmental parameters: (a) room temperature; and (b) relative humidity and air speed.
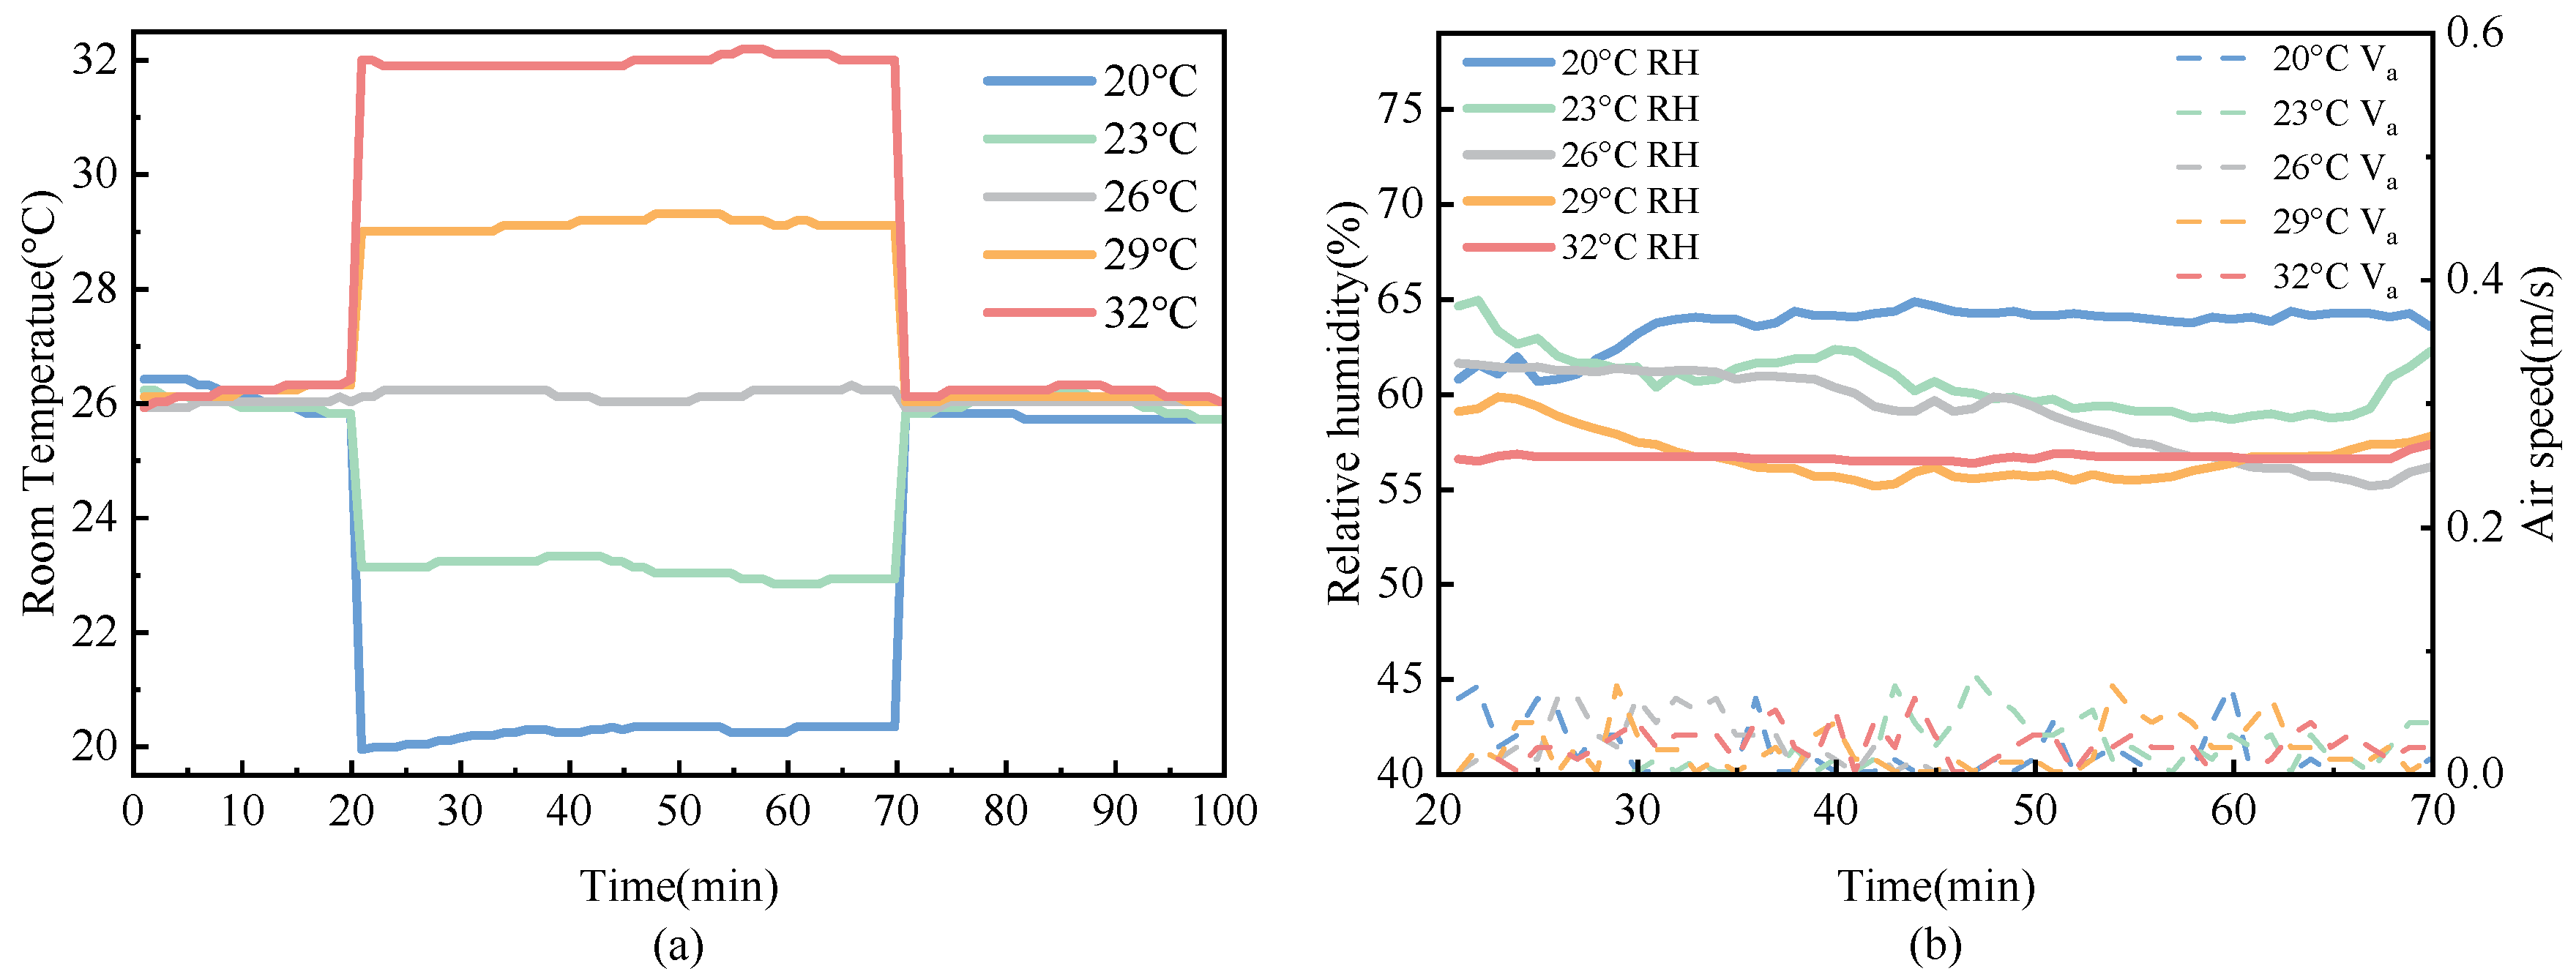
Figure 5.
Overall subjective votes under different conditions: (a) overall sensation vote; and (b) overall comfort vote.
Figure 5.
Overall subjective votes under different conditions: (a) overall sensation vote; and (b) overall comfort vote.

Figure 6.
Mean local sensation and comfort vote: (a) local sensation vote of condition 2; (b) local comfort vote of condition 2; (c) local sensation vote of condition 4; and (d) local comfort vote of condition 4.
Figure 6.
Mean local sensation and comfort vote: (a) local sensation vote of condition 2; (b) local comfort vote of condition 2; (c) local sensation vote of condition 4; and (d) local comfort vote of condition 4.

Figure 7.
Comfort peak: (a) condition 1 min 25; (b) condition 2 min 40; (c) condition 8 min 35; and (d) condition 8 min 45.
Figure 7.
Comfort peak: (a) condition 1 min 25; (b) condition 2 min 40; (c) condition 8 min 35; and (d) condition 8 min 45.

Figure 8.
Subjective votes after stabilization: (a) local sensation votes; and (b) local comfort votes.
Figure 8.
Subjective votes after stabilization: (a) local sensation votes; and (b) local comfort votes.
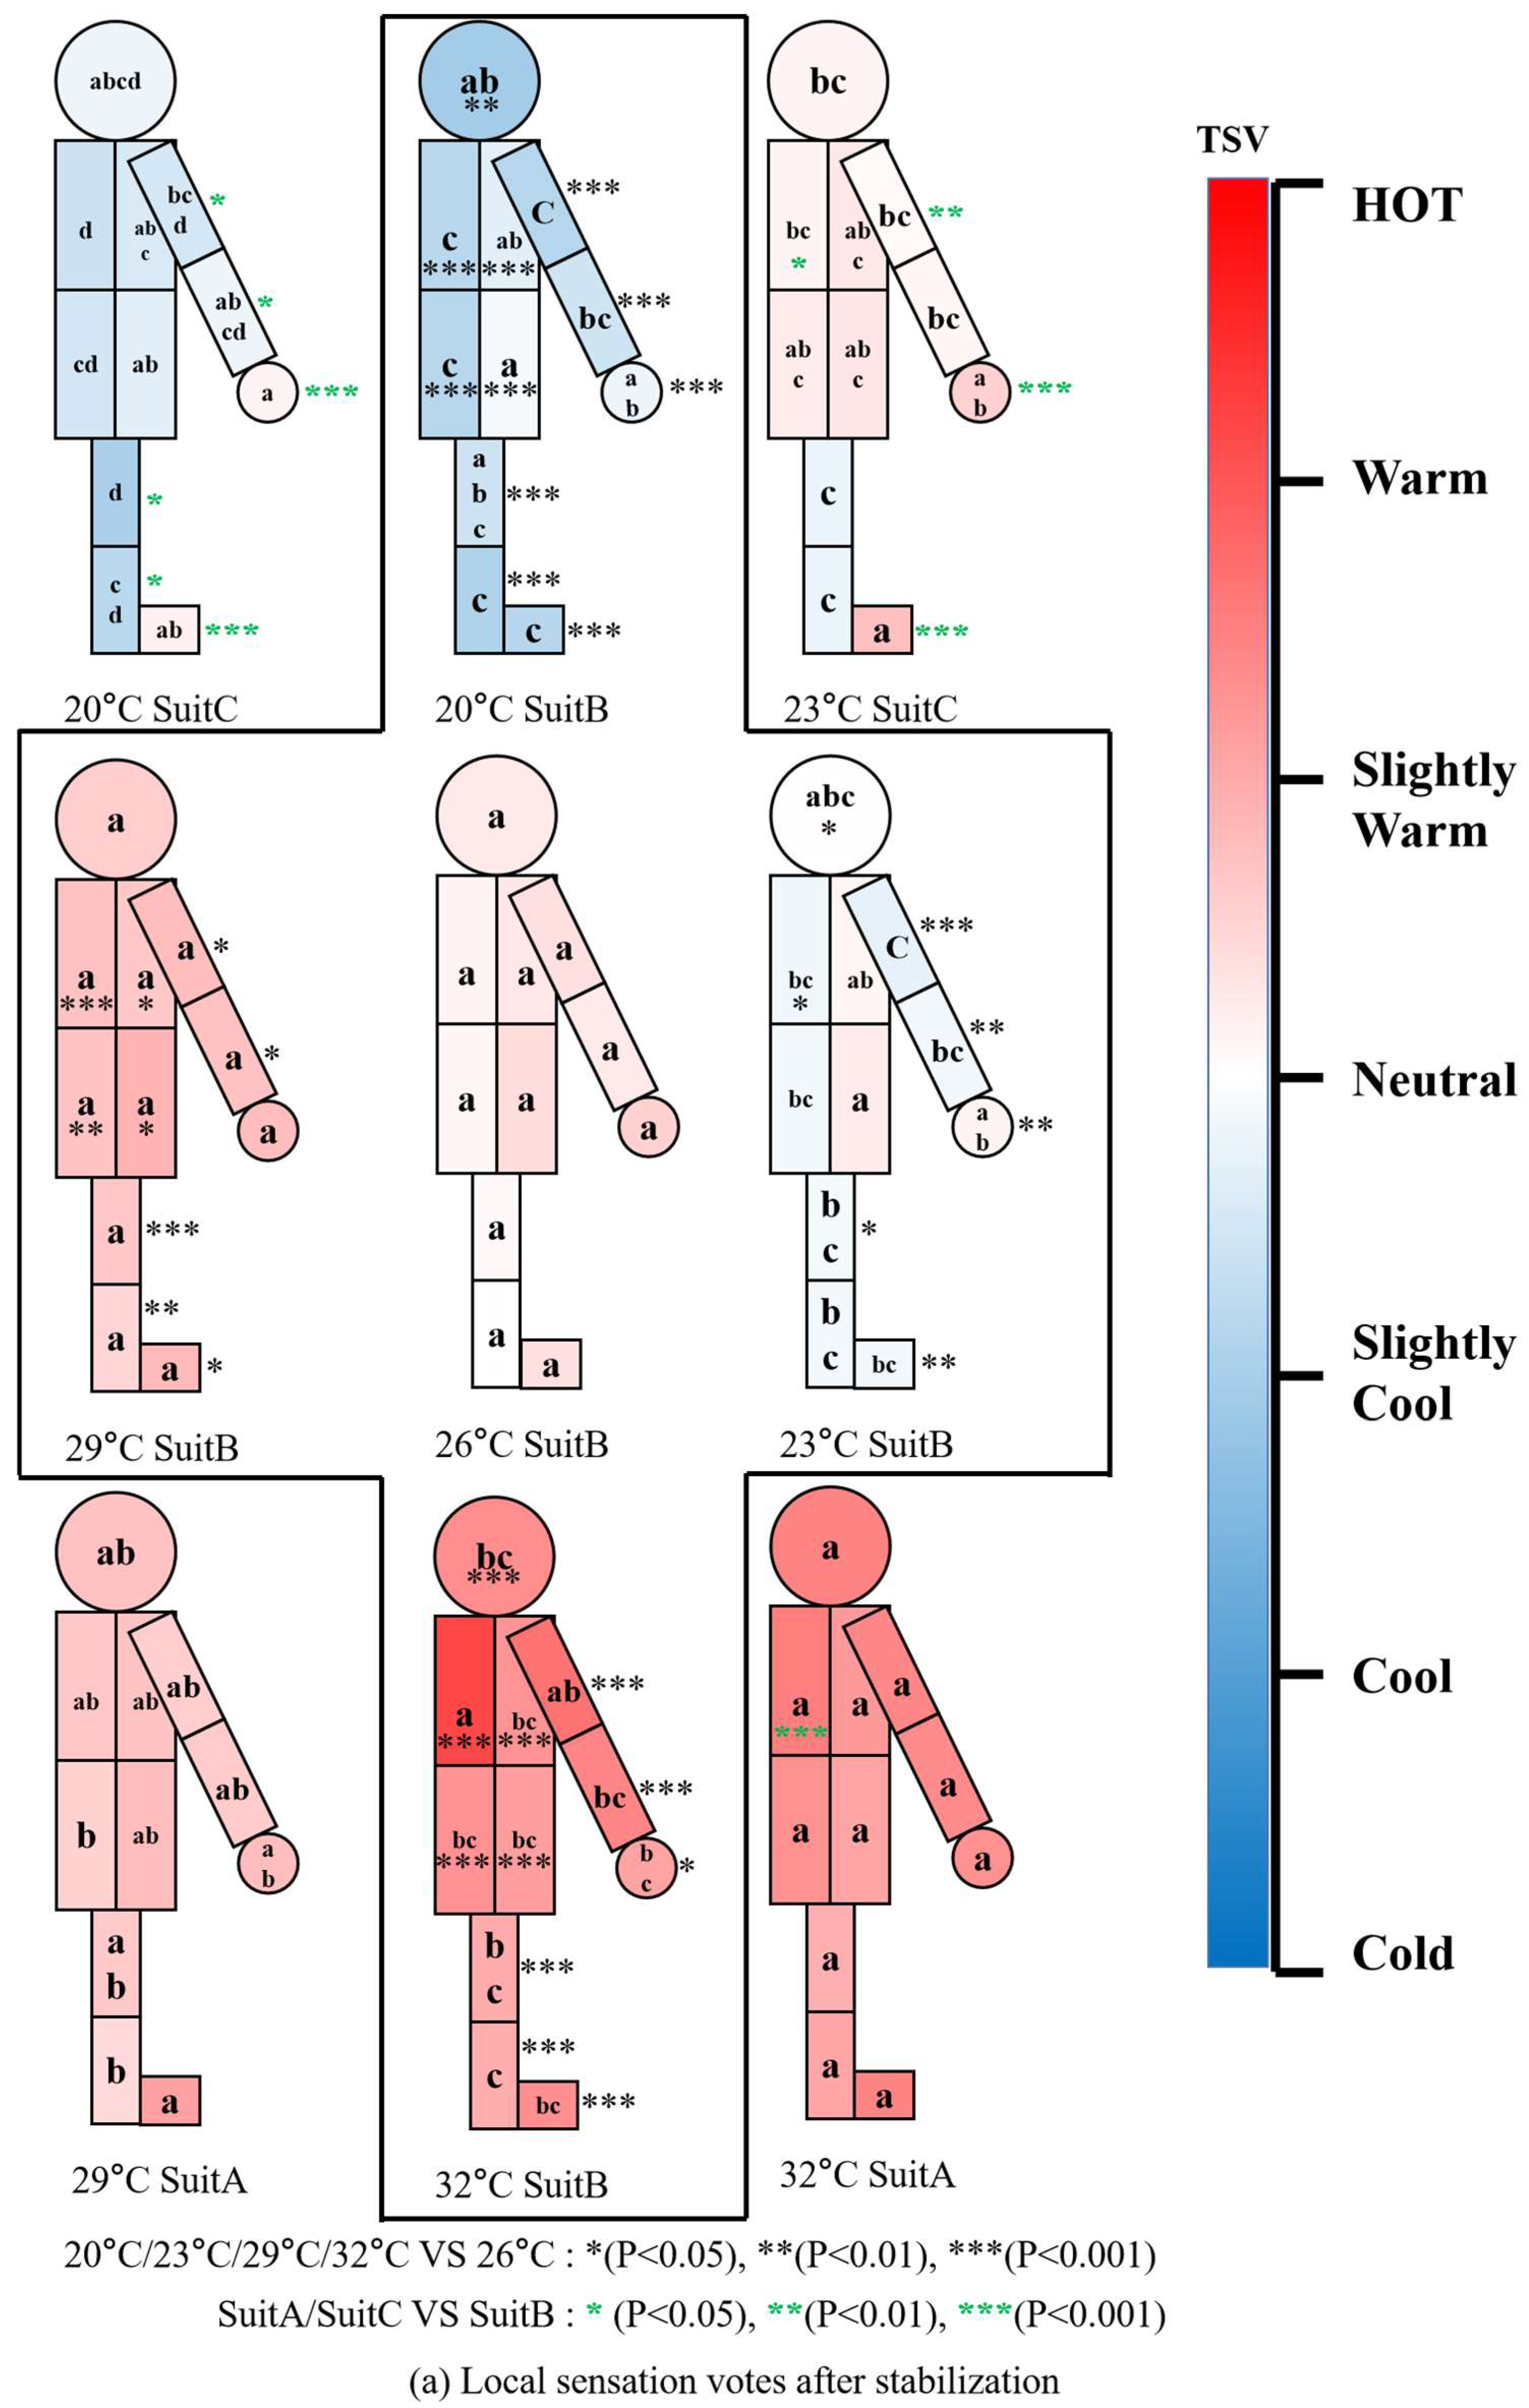
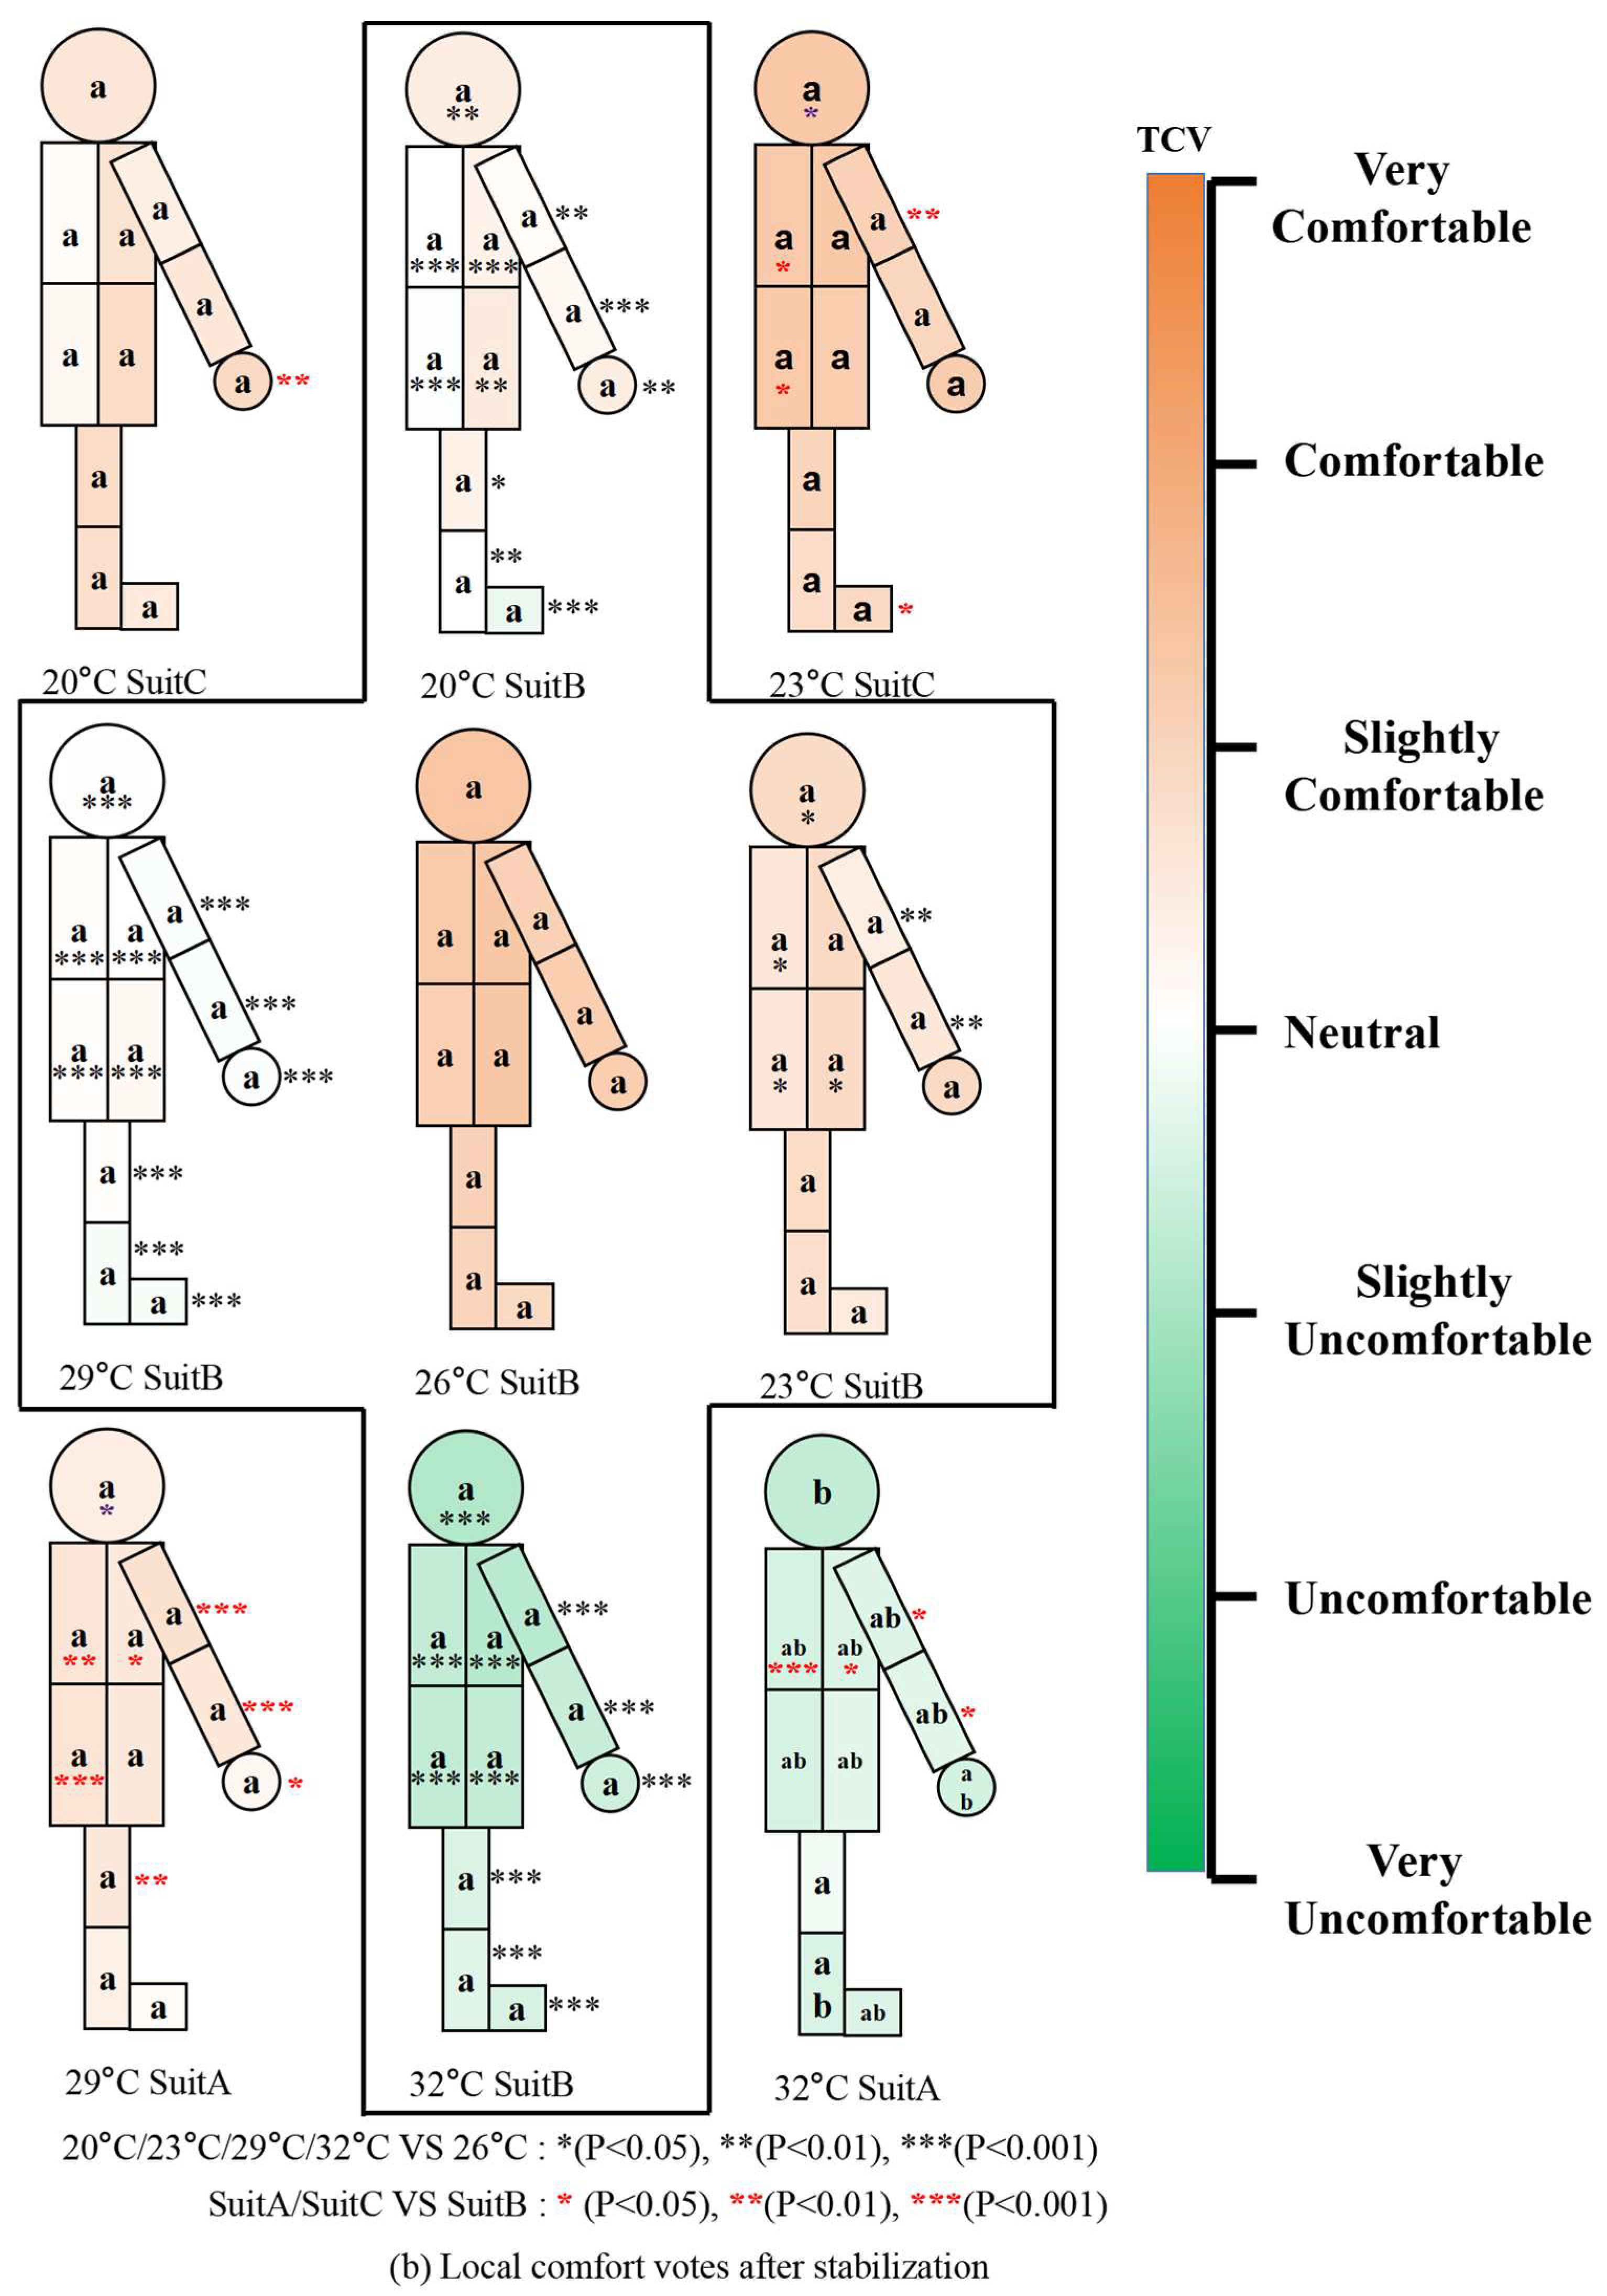
Figure 9.
Percentage of subjective votes under different conditions: (a) thermal acceptability; and (b) thermal satisfaction.
Figure 9.
Percentage of subjective votes under different conditions: (a) thermal acceptability; and (b) thermal satisfaction.
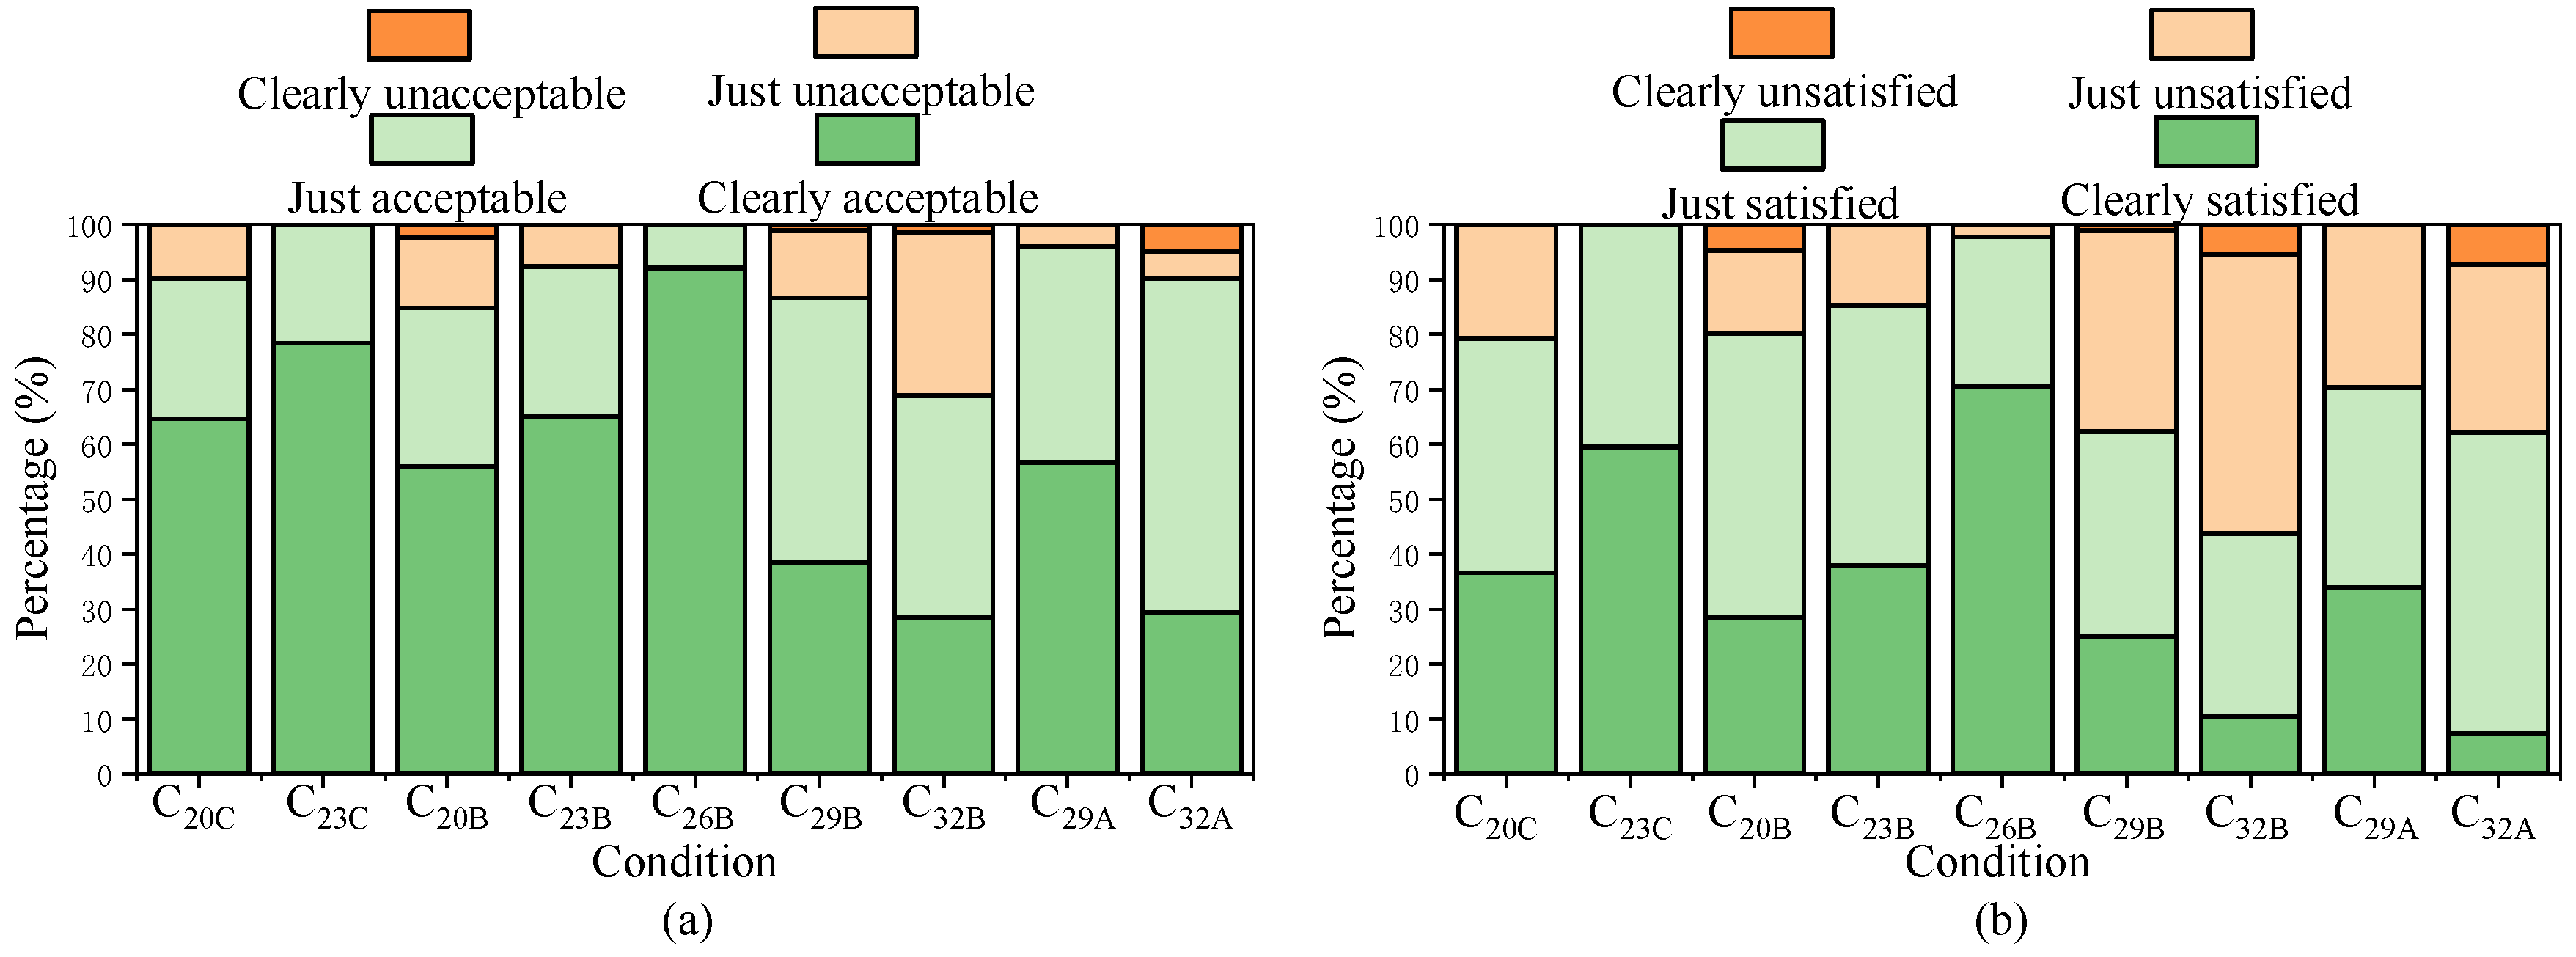
Figure 10.
Skin temperature under conditions with suit B: (a) belly; (b) calves.
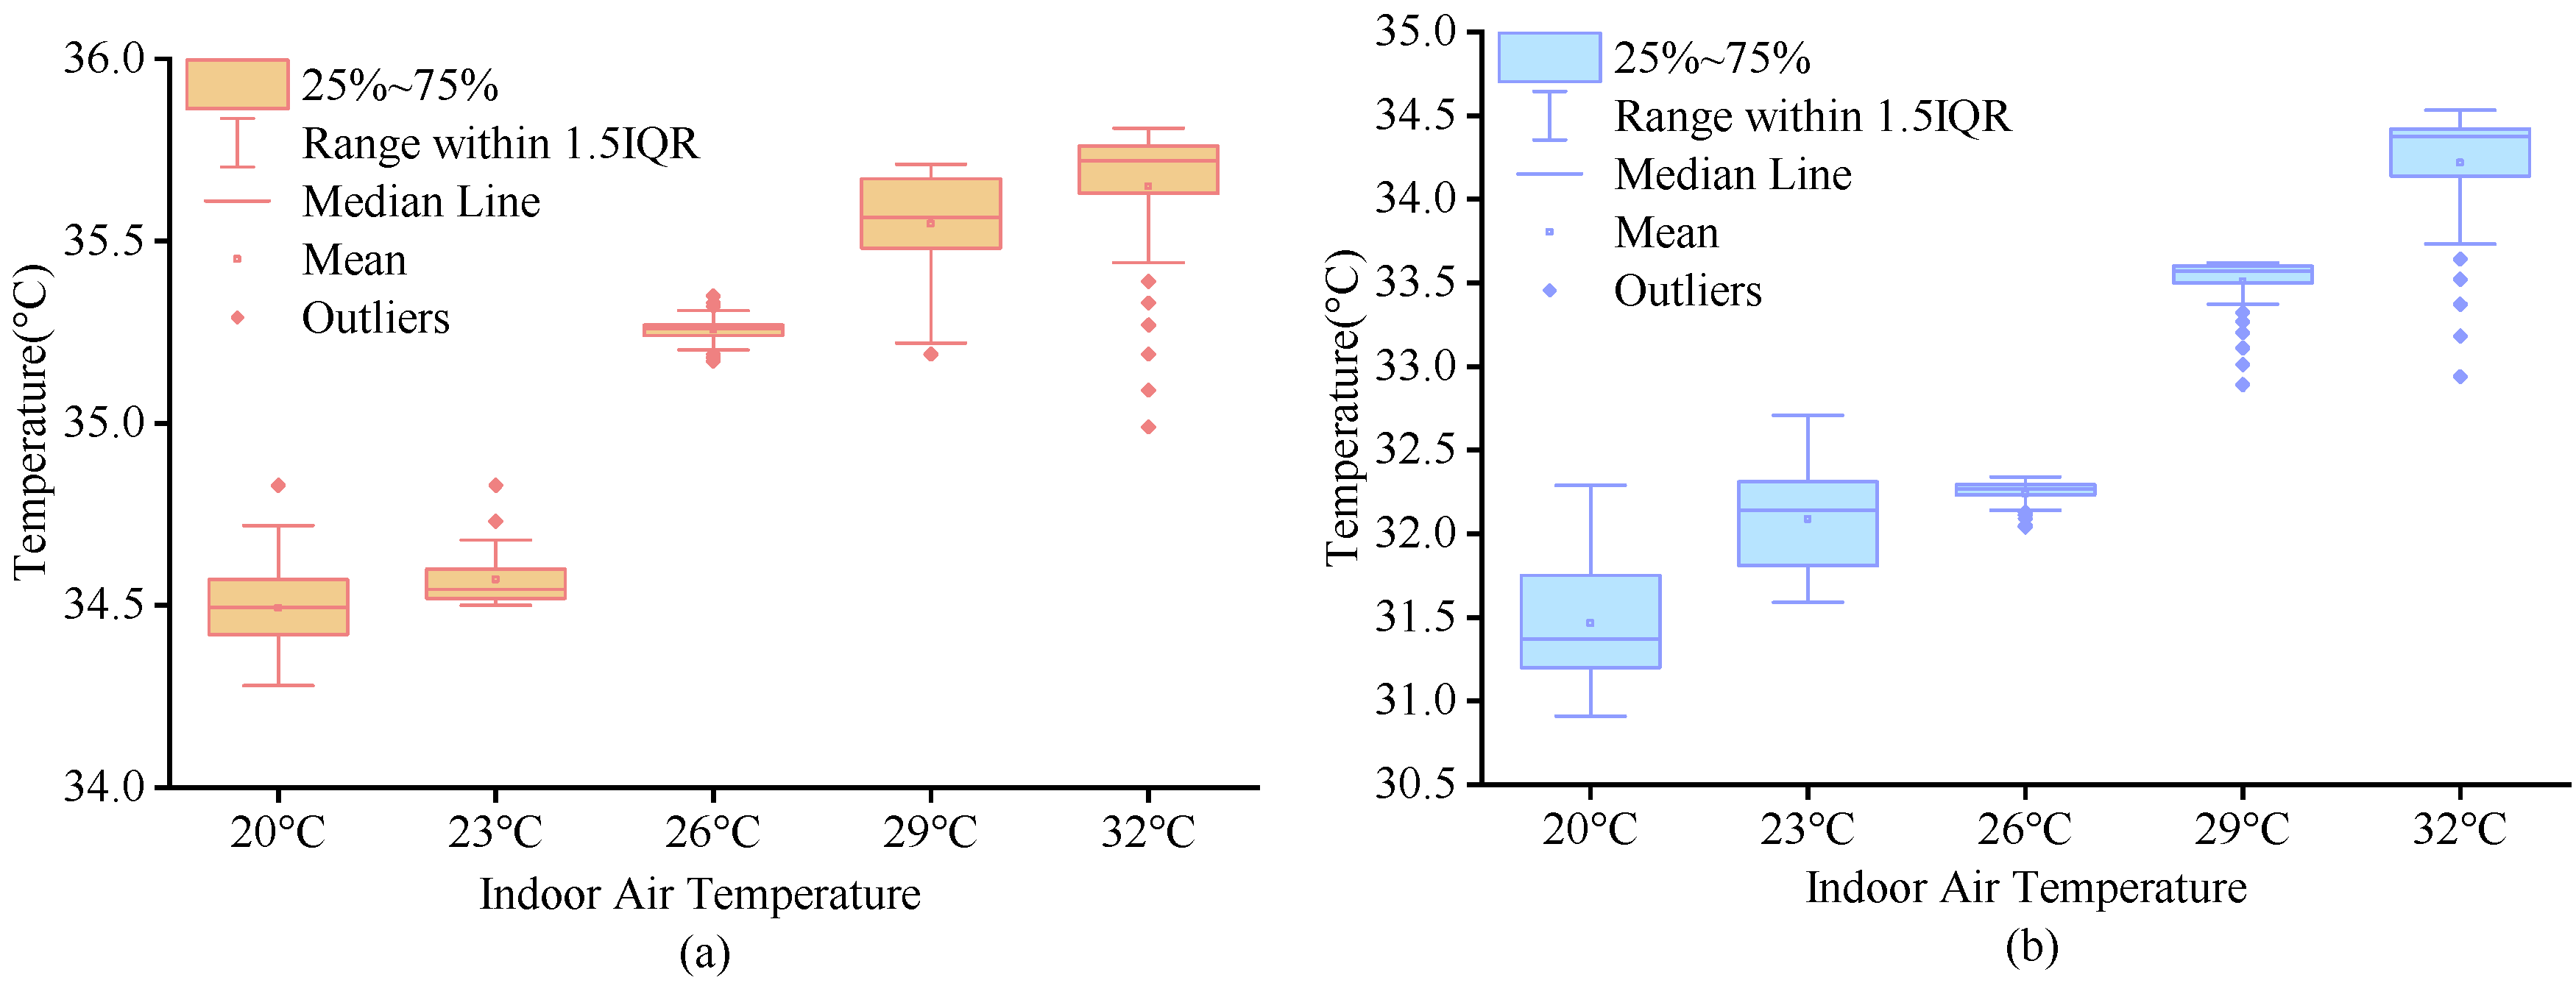
Figure 11.
Skin temperature variation curves of upper limbs: (a) 23 °C conditions; (b) 32 °C conditions.
Figure 11.
Skin temperature variation curves of upper limbs: (a) 23 °C conditions; (b) 32 °C conditions.

Figure 12.
Pattern features.

Table 1.
Experimental Conditions.
| Working Conditions | Abbreviation | Room Temperature | Suits | ||
|---|---|---|---|---|---|
| Suit A 0.37 clo | Suit B 0.59 clo | Suit C 0.77 clo | |||
| Condition 1 | C20C | 20 °C | √ | ||
| Condition 2 | C23C | 23 °C | √ | ||
| Condition 3 | C20B | 20 °C | √ | ||
| Condition 4 | C23B | 23 °C | √ | ||
| Condition 5 | C26B | 26 °C | √ | ||
| Condition 6 | C29B | 29 °C | √ | ||
| Condition 7 | C32B | 32 °C | √ | ||
| Condition 8 | C29A | 29 °C | √ | ||
| Condition 9 | C32A | 32 °C | √ | ||
Table 2.
Subject profiles.
| Gender | Sample Size | Age (Years) | Height (m) | Weight (kg) | BMI (kg/m2) |
|---|---|---|---|---|---|
| Male | 12 | 22.83 ± 3.01 | 173.08 ± 6.11 | 63.94 ± 6.13 | 21.34 ± 1.63 |
| Female | 20 | 22.4 ± 3.36 | 161.50 ± 5.20 | 56.95 ± 8.73 | 21.65 ± 3.06 |
Table 3.
Overall and thermal expectation votes.
| Overall | Head | Chest | Belly | Upper Back | Waist | Upper Arm | Forearm | Hand | Thigh | Calf | Foot | |
|---|---|---|---|---|---|---|---|---|---|---|---|---|
| C20C | 0.88 | 0.17 | 0.33 | 0.33 | 0.83 | 0.67 | 0.67 | 0.50 | 0.33 | 0.50 | 0.67 | 0.50 |
| C23C | 0.14 | 0.17 | 0.17 | 0.17 | 0.17 | 0.17 | 0.00 | 0.17 | −0.17 | 0.50 | 0.33 | −0.17 |
| C20B | 1.38 | 0.29 | 0.57 | 0.36 | 0.93 | 0.79 | 0.86 | 0.43 | 0.36 | 0.71 | 1.14 | 1.43 |
| C23B | 0.64 | −0.07 | 0.00 | 0.14 | 0.43 | 0.43 | 0.43 | 0.29 | −0.07 | 0.29 | 0.36 | 0.21 |
| C26B | 0.00 | −0.14 | 0.00 | 0.00 | 0.14 | 0.29 | −0.14 | 0.00 | −0.14 | 0.14 | 0.29 | 0.57 |
| C29B | −1.00 | −0.94 | −0.88 | −0.88 | −1.00 | −0.75 | −1.13 | −0.88 | −0.63 | −1.13 | −0.88 | −1.00 |
| C32B | −1.71 | −1.11 | −1.33 | −1.11 | −1.78 | −1.11 | −1.56 | −1.33 | −0.78 | −0.78 | −0.89 | −0.78 |
| C29A | −0.57 | −1.00 | −0.50 | −0.50 | −0.50 | −0.33 | −0.33 | −0.33 | −0.67 | −0.50 | −0.33 | −0.67 |
| C32A | −1.25 | −1.00 | −0.78 | −0.44 | −0.89 | −0.78 | −0.89 | −0.78 | −0.78 | −0.67 | −0.56 | −1.00 |
Table 4.
Number of pattern occurrences.
| Comfort Vote | Uniform | Accumulation | Attenuation | Dominance | Average | Total | ||
|---|---|---|---|---|---|---|---|---|
| Sensation Vote | Comfort-Accumulation | Discomfort-Accumulation | ||||||
| Uniform | 196 | 11 | 3 | 1 | 39 | 12 | 262 | |
| Accumulation | Warmth-accumulation | 2 | 1 | 5 | 0 | 13 | 3 | 24 |
| Coldness-accumulation | 7 | 2 | 17 | 0 | 17 | 5 | 48 | |
| Attenuation | 0 | 2 | 0 | 0 | 4 | 1 | 7 | |
| Dominance | 122 | 24 | 14 | 3 | 249 | 84 | 496 | |
| Average | 121 | 25 | 6 | 2 | 182 | 223 | 559 | |
| Total | 448 | 65 | 45 | 6 | 504 | 328 | 1396 | |
Table 5.
Correlation between sensation vote and skin temperature.
| Sensation Vote | Overall Sensation Vote | Local Sensation Vote | |
|---|---|---|---|
| Skin Temperature | |||
| Head | 0.704 ** | 0.616 ** | |
| Chest | 0.643 ** | 0.658 ** | |
| Belly | 0.563 ** | 0.530 ** | |
| Upper Back | 0.622 ** | 0.672 ** | |
| Waist | 0.543 ** | 0.494 ** | |
| Upper Arm | 0.568 ** | 0.607 ** | |
| Forearm | 0.591 ** | 0.515 ** | |
| Hand | 0.666 ** | 0.549 ** | |
| Thigh | 0.592 ** | 0.687 ** | |
| Calves | 0.647 ** | 0.618 ** | |
| Foot | 0.490 ** | 0.473 ** | |
** p < 0.01.
Disclaimer/Publisher’s Note: The statements, opinions and data contained in all publications are solely those of the individual author(s) and contributor(s) and not of MDPI and/or the editor(s). MDPI and/or the editor(s) disclaim responsibility for any injury to people or property resulting from any ideas, methods, instructions or products referred to in the content. |
© 2023 by the authors. Licensee MDPI, Basel, Switzerland. This article is an open access article distributed under the terms and conditions of the Creative Commons Attribution (CC BY) license (https://creativecommons.org/licenses/by/4.0/).
Share and Cite
MDPI and ACS Style
Zhong, X.; Yu, H.; Tang, Y.; Mao, H.; Zhang, K. Local Thermal Comfort and Physiological Responses in Uniform Environments. Buildings 2024, 14, 59. https://doi.org/10.3390/buildings14010059
AMA Style
Zhong X, Yu H, Tang Y, Mao H, Zhang K. Local Thermal Comfort and Physiological Responses in Uniform Environments. Buildings. 2024; 14(1):59. https://doi.org/10.3390/buildings14010059
Chicago/Turabian StyleZhong, Xianzhun, Hang Yu, Yin Tang, Huice Mao, and Kege Zhang. 2024. "Local Thermal Comfort and Physiological Responses in Uniform Environments" Buildings 14, no. 1: 59. https://doi.org/10.3390/buildings14010059
Note that from the first issue of 2016, this journal uses article numbers instead of page numbers. See further details here.