
Cause Identification and Coupling Relationship Analysis of Urban Problems: A Case Study of Poor Parking Convenience
1
School of Civil Engineering and Architecture, Wuhan University of Technology, Wuhan 430070, China
2
Central & Southern China Municipal Engineering Design and Research Institute Co., Ltd., Wuhan 430014, China
3
Construction Seventh Engineering Division Corp., Ltd., Guangzhou 510080, China
*
Authors to whom correspondence should be addressed.
Buildings 2024, 14(2), 516; https://doi.org/10.3390/buildings14020516
Submission received: 8 November 2023
/
Revised: 18 January 2024
/
Accepted: 7 February 2024
/
Published: 14 February 2024
(This article belongs to the Collection Strategies for Sustainable Urban Development)
Abstract
:As the size and complexity of cities around the world increase, various types of urban problems are emerging. These problems are caused by multiple factors that have complex relationships with each other. Addressing a single cause blindly may result in additional problems, so it is crucial to understand how urban problems arise and how their causes interact. The study utilizes the Grey Decision-Making Trial and Evaluation Laboratory (Grey-DEMATEL), in conjunction with the Grey Interpretative Structural Model (Grey-ISM), to construct a hierarchical structure that examines the relationships between the causes of urban problems, thereby revealing the root causes and developmental mechanisms of urban problems. The Grey Matrix Cross-Reference Multiplication Applied to Classification (Grey-MICMAC) method was employed to clarify the influence and position of each cause. The Poor Parking Convenience (PPC) in Wuhan, China, is taken as a case study. The findings reveal the following: (1) the proposed method effectively identifies the key causes and processes of urban problems; (2) the insufficient management of roadside parking areas and impractical allocation of temporary parking spaces are the two main causes of PPC in Wuhan City. This method would be helpful to urban managers in discovering the causes of urban problems and formulating corresponding policies, to ultimately contribute towards healthy urban and sustainable development.
1. Introduction
With the rapid development of modern cities, both their scale and complexity are increasing drastically. According to the United Nations [1], between 1950 and 2020, there was an increase in the global urban population from 30% to 56.2%, with a projected rise to nearly 68% by 2050 [2,3]. Although cities play a central role in economic and social development, rapid urbanization has resulted in various negative influences and urban problems, such as air pollution, traffic congestion, and housing shortages, which hinder the regular operation of cities. Urban problems are widespread in developed countries worldwide [4], and the faster and more extensive the development of an urban area is, the greater the likelihood for a variety of severe problems. These problems have become significant obstacles to achieving sustainable development, hindering socio-economic progress, and impeding the harmonious coexistence between humans and nature [5,6]. Therefore, addressing urban problems has become increasingly crucial.
To facilitate coordinated development between urban areas and their economies, as well as their social and environmental systems, effective governance of urban problems requires the identification of specific causal factors, similar to the process that doctors use when diagnosing the underlying cause of an illness prior to prescribing treatments. Given that urban problems tend to be complex and interrelated, it is generally unrealistic to fully resolve all causal factors, as they often produce cascading effects on one another. Moreover, haphazardly addressing individual causal factors may inadvertently exacerbate the broader repercussions of other factors [7]. Consequently, when confronting urban problems, it is crucial to consider the relationships between these causes and their mechanisms of influence on urban problems [8], so as to provide targeted solutions. Additionally, depending on individual characteristics, as in the case of human diseases, there may be significant differences between the causes of a disease among patients with identical symptoms. The mechanisms and causes behind the same urban problem can vary among different cities.
In recent years, numerous scholars have focused on identifying the causes of urban problems by employing a wide range of research methodologies for this purpose, as illustrated in Table 1 [2,9,10,11,12,13,14,15,16,17,18,19,20,21,22,23,24,25,26,27,28,29,30,31,32]. However, a comprehensive analysis of the interrelations and impacts of the causes of these urban problems, as well as their specific roles and functionalities, is still relatively uncommon. Chen et al. [2] conducted an examination of urban health problems based on subjective qualitative analysis and an objective quantitative evaluation. Peng et al. [32] used the city’s complaint hotline records to identify the daily causes of urban problems. Ma et al. [9] employed the case analysis method to discern the underlying factors which contribute to the causes of urban flooding problems. Loorbach et al. [10] conducted a sustainable assessment of urban problems from the dimensions of social technology, social institutions, and social ecology. From a simulation perspective, Torkayesh et al. [17] utilized the Geographic Information System (GIS) to address the problem of urban landfill. Wu et al. [23] simulated an urban spatial structure and low-carbon planning system by employing remote sensing nighttime light data. Furthermore, scholars have employed various approaches, such as econometric models [26] and neural network algorithms [30], to conduct quantitative data mining analysis on the causes of urban problems.
Existing research reveals numerous approaches to ascertain the cause of urban problems. However, given the diverse types and complex causes of urban problems, as well as their varied manifestations, some are easy to identify whereas others are difficult to recognize [32]. To date, there has been a lack of comprehensive and systematic research on identifying and analyzing the causes of urban problems. Most previous studies have primarily focused on identifying specific types of urban problems, while neglecting to identify the relationships between causes. Furthermore, influenced by urban characteristics, the mechanisms and causes behind the same urban problems differ between various cities [33]. To address this problem, it is necessary to establish a universal scientific method and diagnostic system for identifying the root causes of urban problems and exploring the relationships between them [34].
Common methods for studying the relationships between factors include regression analysis, Analytic Hierarchy Process (AHP), Importance-Performance Analysis (IPA), and correlation analysis. Regression analysis [35] is employed to investigate the relationships between factors, and it requires a high degree of linearity for persuasiveness. AHP [36] and IPA [37] mainly rank factors, overlooking the relationships between them. Correlation analysis can determine whether there is a close correlation between factors, but it requires high-quality data. These methods have limitations in terms of investigating the causes of urban problems, and they are not suitable for constructing interactive coupling models or quantifying the extent of causes’ impacts. The Decision-Making Trial and Evaluation Laboratory method (DEMATEL) [38] effectively analyzes the relationships between factors in complex systems using graph theory, and it translates them into a visual structure. Interpretative Structural Modeling (ISM) [39] categorizes the disordered elements of complex systems into multi-level hierarchical structures, thus elucidating the interactive and hierarchical relationships between factors. The Cross-Impact Matrix Multiplication Applied to Classification (MICMAC) method, based on dependence and driving power calculations, facilitates the analysis of the position and role of various factors within the system. However, when assessing factor correlations, subjective and qualitative evaluations of factors are often required. Real systems usually involve inaccurate and uncertain information, leading to the incorporation of grey theory and fuzzy logic for optimization [40]. When applying fuzzy logic, the selection of an appropriate membership function for the research issue is crucial, whereas grey methods demonstrate distinct advantages when dealing with uncertainties arising from small samples, inaccuracies, and incomplete information [41].
Therefore, the purpose of this study is to propose a methodology for identifying the causes of the urban problems and exploring the relationships between these causes; this methodology integrates the Grey-DEMATEL, Grey-ISM, and Grey-MICMAC. The Grey-DEMATEL-ISM is advantageous in terms of defining the relationships between causes and revealing connections between complex urban systems. It does so by proposing an explanatory hierarchical structure directed graph and presenting it in a multi-level cascading structure. Grey-MICMAC was employed to analyze the most driving and most dependent causes of urban problems in a system, as well as classify the causes of urban problems as independent causes, autonomous causes, dependent causes, and linkage causes [42]. These methods have been successfully applied in various fields, such as environmental sustainability assessment [43], urban risk assessment [44], and public policy design [45].
Wuhan, one of China’s pilot cities for the “Urban Physical Examination”, has been selected as the subject of this case study, with a specific focus on the recognized urban problem of Poor Parking Convenience (PPC) [2,3]. This research delves into the intricate interplay between the causes behind urban problems in Wuhan, and it aims to provide guidance for city administrators to tackle these problems while pursuing sustainable development. The results identify urban problems in Wuhan and the relationships between the causes are presented to guide urban managers to overcome urban problems while maintaining a sustainable development path for the city. This will enable the effective recognition and prevention of urban problems.
The paper is structured as follows: Section 2 reviews the definition of urban problems, methods for identifying them, and it analyzes the causes and formation mechanisms of urban problems by drawing analogies with causes of human diseases. Section 3 introduces the basic concepts and formulas of the Grey-number, DEMATEL method, ISM method, and MICMAC method used in the study. In Section 4, these methods are applied to analyze the PPC urban problem in Wuhan, China. Section 5 employs the Grey-DEMATEL, Grey-ISM, and Grey-MICMAC methods to analyze the causal influence mechanism and prominent factors behind the PPC urban problem. Finally, Section 6 presents the research results, it summarizes the findings, and discusses future research directions for identifying the causes of urban problems.
2. Theoretical Basis
2.1. Urban Problems
Over the past 50 years, rapid urban expansion, particularly in developing countries, has brought forth a series of new challenges, including housing problems, deficiencies in public facility construction, environmental problems, and transportation problems [46]. The range of difficulties and challenges that are uniquely inherent to urban environments are defined as urban problems [2,3]. These problems fundamentally stem from the complex interplay between high population density, socio-economic diversity, environmental constraints, and infrastructure demands. These urban problems severely hinder the sustainable development of cities. The main forms of urban problems include traffic congestion, housing shortages, water and energy scarcity, disorderly conduct, imbalanced materials and energy flows, and intensifying demand conflicts. Some studies also consider urban apathy, youth problems, urban beggars, etc., to fall within the research scope of urban problems [47]. Urban problems first emerge during the processes of urbanization and urban development, exhibiting variations in scale and characteristics based on factors such as a city’s size, location, economy, governance, and culture. Furthermore, these problems differ depending on the stage of development [48].
Given that urban problems impact the quality of life of urban residents, they are the primary causes of social conflicts, and they contribute to the decline of residents’ life satisfaction, conducting an in-depth investigation into the causes of urban problems can help prevent and alleviate these problems and predict trends in urban social development. It can also promote social progress and urban sustainable development. From the perspective of urban sustainability, understanding the underlying factors contributing to urban social problems is crucial [49]. This can be achieved by implementing effective strategies and policies that address these problems, foster social well-being, and ensure long-term urban sustainability [50].
2.2. Causes and Mechanisms of Urban Problems
Cities, like humans, go through the processes of “birth, aging, illness, and death.” A city can be defined as an organic living system [51,52]. Similarly to human diseases, cities also encounter “health problems” during their development, which affect their healthy growth. There are many similarities between human diseases and urban problems. The cause system of human diseases is compared with that of urban problems in this study, as shown in Figure 1.
- Human disease cause system [53,54]. The causes of human diseases are often the result of multiple factors coupled together. Existing research suggests that the vast majority of human diseases stem from six main factors, as follows: negative emotions, environmental pollution, genetic inheritance, body metabolism, living habits, and drug-related side effects [55]. The complex interplay between these factors can trigger various types of human diseases, with their underlying causes often interacting with each other. If only one or some of the causes are considered without taking into account their relationships, it may exacerbate the severity of other causes, or even trigger additional diseases [56]. For example, when an individual is excessively obese, if only medication for weight loss is considered while neglecting factors such as metabolism and lifestyle habits, it may not only fail to achieve the desired weight loss effect, but it may also lead to other drug-related diseases.
- Urban problem cause system. Urban problems result from a combination of multiple factors, similarly to the causes of human diseases [2]. Government action, city planning, the economic situation, information technology, energy consumption, and demographics are among the key factors influencing urban problems [57,58]. Blind urban governance (i.e., not understanding the causes and mechanisms behind specific urban problems) can worsen existing problems or even give rise to new ones [2]. For instance, in 1999, Kuala Lumpur (the capital of Malaysia) announced its plan to relocate its administrative capital to Putrajaya, a suburb located 20 km away from Bukit, in order to alleviate traffic congestion and environmental pollution. However, as of 2020, Kuala Lumpur remains densely populated, with severe air pollution issues [59]. In India, the government has implemented various social welfare programs and economic reform initiatives in an attempt to address problems such as poverty, housing, and healthcare. However, despite these efforts, the poverty rate in India continues to increase, and new problems, including economic structural imbalances, have emerged [60].
Based on a comparison of the above frameworks, it can be stated that blindly addressing a single cause may lead to additional problems. Therefore, it is important to thoroughly understand the underlying causes of urban problems, how these causes influence urban problems, and the relationships between them.
3. Research Methods
In this chapter, four formal methods (Grey-DEMATEL-ISM-MICMAC) will be introduced to identify the causes of urban problems in this study. The framework of this methodology is shown in Figure 2.
3.1. Grey Number
In the field of urban studies, the relationships between the causes of urban problems are characterized by information uncertainty and ambiguity. The Grey system theory can help reduce resultant research errors to a certain extent [61]. Therefore, the main role of the Grey number, or interval number, as a concept of grey theory is to deal with the problem of insufficient and incomplete information. As it requires only a small amount of valid data to simulate and predict systems, it is widely used in various studies that focus on topics such as agriculture, economy, and population. A Grey number, , is defined to represent the number in an interval. and are the upper and lower boundaries of the interval. In the formula, they are represented by Expression (1).
3.2. DEMATEL-ISM Method
3.2.1. DEMATEL Method
DEMATEL is a systems analysis method that utilizes graphical and matrix tools to analyze the degree of causality and correlation between dimensions in complex management problems [62]. By analyzing the logical relationship between each element in the system, we can derive the degree of influence of each element on other elements and the degree to which the element is being influenced, thereby determining the degree of cause and centrality for each element. This structured approach helps to identify feasible solutions by determining the importance of each element in the system based on the degree of cause and centrality. The DEMATEL steps are as follows.
Step 1: Create a direct impact matrix of indicators , assuming the system has indicators as expressed in (2).
The direct influence matrix between each indicator is determined via a comparison of all indicators in the system, respectively, where indicates the degree of direct influence of indicator on indicator .
Step 2: After obtaining the direct relationship for matrix , this paper further obtains the normalized grey direct relationship matrix using Expression (3).
Among them is , , . Equation (3) expresses the actual meaning of the elements in the direct impact matrix , by row, in accordance with the fuzzy number summation criterion for the summation [63]. For each row of the summation result, there is an upper and lower limit value. In this paper, the largest upper bound in the summation result of each row is called . Then, all elements of the direct relationship matrix are multiplied by to obtain the normalized Grey direct relationship matrix .
Step 3: Build comprehensive influence matrix using Expression (4).
In the calculation equation, is the degree of the combined influence of indicator on indicator , and refers to the unit matrix.
Step 4: According to matrix , the rows represent the magnitude of the impact of factors on other factors, whereas the list shows that a factor is influenced by other indicators and determines the causal relationships between factors.
3.2.2. ISM Method
ISM is structural method based on graph theory, which can transform ambiguous ideas and views into intuitive models with good structural relationships [64]. The ISM model uses theoretical deduction to reveal the connections between the influencing factors in complex economic and social systems, presenting them in a multi-layered hierarchical structure. This approach allows for a clearer, more rigorous, and hierarchical representation of the internal structures of complex systems. The steps involved in ISM are as follows.
Step 1: Set system components G using Expression (5).
In the formula, denotes the element in the system.
Step 2: Construct the adjacency matrix A and the reachable matrix M. Determine the adjacency matrix of the influencing factors based on whether there is a direct influential relationship between factors and . When takes the value of 1, there is a direct binary relationship between and . When takes the value of 0, there is no direct binary relationship between and .
Add the adjacency matrix A to the unit matrix and perform a power operation on it to obtain the reachable matrix S of the matrix A if the matrix M satisfies the conditions expressed in Equation (6).
Step 3: Hierarchy division. Factor division can more clearly determine the hierarchical relationships between each other, and based on the obtained reachable matrix M, the reachable set , prior set , and intersection set are found. is the set of all factors influenced by factor . That is the set of elements in the reachable matrix M, which consists of the elements in the columns that correspond with each row’s elements that have a value of 1. is the intersection of and . The new reachable matrix is obtained by removing the rows and columns that correspond with the factors in the set which are formed by the highest-level factors in the reachable matrix, based on the principle that the reachable set equals the intersection set.
Step 4: Interpretation of the model. After the analysis of the above steps and the reduction hierarchy of the grading results, the recursive structure model of the system elements is derived.
3.2.3. Comparing DEMATEL and ISM
DEMATEL and ISM are based on graph theory and matrices. Both methods acquire information from experts or decision makers, and the relationships between factors are identified through visualization [65]. Despite their similarities, DEMATEL and ISM have some differences. DEMATEL can analyze the causal relationships between factors and determine their importance, but it lacks a strong focus on the relationships between the factors. On the other hand, ISM can establish a hierarchical structure using the factors, but it requires unanimous agreement from the decision-making group regarding a specific issue, making it susceptible to expert bias, and thus, it may influence final results. Considering these limitations of ISM and the different focuses of these two methods, an integrated Grey-DEMATEL-ISM approach effectively combines diverse expert opinions and assigns variable weights to factor relationships. The comprehensive influence matrix in DEMATEL can be transformed into a reachability matrix A in the ISM by setting a division threshold, and it constructs a hierarchical structure for complex systems [66].
3.3. MICMAC Method
MICMAC is a method for analyzing the relationships and interactions between factors in a system, classifying the elements of the system using cross-influence matrices multiplication, and it is often employed to identify factors with high dynamics and dependencies in a system [67].
When using MICMAC, it is first necessary to calculate the driving forces and dependencies of each factor, further defining the place and role of urban problems as causes. Based on the strength of each factor’s driving power and dependence power, quadrant 1 of the coordinate system can be divided into four parts, which represent four different causes, as follows: Independent cause, Autonomous cause, Dependent cause, and Linkage cause.
Step 1: Factor identification. Factors required for the study were identified through a literature review, surveys, and directed research in related areas.
Step 2: Interaction Matrix (IM) construction. Pairwise comparisons of Pair-Wise Comparisons (PWC) were calculated, and a matrix-based questionnaire was designed to assess the relationship between each pair of factors in each pair, in accordance with the PWC, using formula (7). The IM matrix is replaced by the reachable matrix S, which is generated based on the DEMATEL-ISM model [67].
Step 3: Calculate driving power and dependence power . Driving power represents the ability of the i-th cause to influence the other causes, and similarly, dependence power represents the ability of the j-th etiology to be influenced by the other etiologies. Driving power and dependence power are obtained, as shown in Expressions (8) and (9), respectively, where represents the elements in the reachability matrix.
4. Case Study
4.1. Background of Case City
Wuhan (29°58′–31°22′ N, 113°41′–115°05′ E) is located in the center of central China, and it serves as the capital city of Hubei province. It consists of 13 districts, and covers a total area of 8569.15 km2, as shown in Figure 3. With rapid economic and social development over the past two decades, Wuhan’s GDP reached 1.77 trillion yuan in 2021, ranking ninth among China’s prefecture-level cities (293 in total). In the same year, its permanent population reached 13.65 million, with an urbanization rate of 84.56% [68]. Wuhan has been identified as a pilot city in China for four consecutive years, according to the “Urban Physical Examination” programs. Results from this program, conducted between 2020 to 2023, indicate that Wuhan faces similar urban problems to other mega-cities across China, including residential satisfaction, housing problems, public services, parking problems, etc. [2,3].
Parking is a particularly prominent urban problem. According to the 2021 urban physical examination, the average score for parking was a mere 70.09 out of a possible 100 points, ranking at the bottom of the 34 urban physical examination indicators [2,3]. In 2021, the motor vehicle ownership in Wuhan reached 4.1 million, whereas the total number of parking spaces constructed in the city was less than 2.5 million, resulting in a deficit of 1.5 million parking spaces. The limited availability of parking space is likely to lead to conflicts between car owners and it may also lower people’s happiness index; it also raises questions about the abilities of government management agencies, and it weakens people’s ability to recognize city managers. Moreover, failing to adequately plan for parking spaces not only reduces road capacity, but it also increases the likelihood of traffic accidents [69]. Although Wuhan has made great efforts in recent years, the problem of Poor Parking Convenience (PPC) still exists [70]. Therefore, an empirical investigation was conducted to identify the root causes of PPC in Wuhan, China, as well as the underlying connections between these causes, in order to provide relevant advice.
4.2. Identification of Causes of PPC
Due to the lack of effective management measures, insufficient investment in the parking industry, and inadequate participation in civilized parking, increasing the convenience of tiny car parking is a challenging task. To address these problems, it is necessary to fully understand and identify the obstacles in improving car parking convenience, which is the cause of PPC.
This study identifies the causes of PPC in Wuhan by drawing on the existing literature. Research conducted by Zheng et al. [71] and Li et al. [72] indicates that the high density of buildings in the core urban areas of Wuhan makes the construction of public parking lots difficult, and the enforcement against illegal parking is below the national average. The Wuhan Traffic Management Bureau [73] also acknowledges that drivers exhibit tendencies to take risks, which contributes to illegal parking, which, in turn, reduces parking convenience. Zhang et al. [74] and Xu et al. [75] point out that the high fees for indoor parking, and the lack of intelligent parking management, are reasons behind the challenges concerning on-street parking in Wuhan.
Existing studies have thoroughly analyzed the causes of the PPC problem in Wuhan, but there is a lack of studies which comprehensively summarize and organize these causes. To generalize past research and systematically identify the causes of PPC, we invited a team of 11 experts as interviewees, including five university experts and six experts from the Wuhan Urban and Rural Construction Bureau. These experts have lived in Wuhan for more than 15 years and have over a decade of experience in fields such as parking management, parking information systems, parking facility development, and urban planning. They were also core members of the “Urban Physical Examination” project from 2020 to 2023 [2,3]. By reviewing the relevant research on parking convenience in Wuhan, and consulting with the aforementioned 11 experts, finally, the 16 causes of PPC in Wuhan were established (shown in Table 2).
The Grey-DEMATEL-ISM-MICMAC [76] analytical method was adopted in this study to analyze and assess the relationships between these causes and their importance. The aforementioned 11 urban physical examination experts were invited to participate in a survey study. A questionnaire (Appendix A) was designed and distributed to all the experts, who were informed of the research objectives and provided with the definitions and an overview of urban problems to ensure a shared understanding of the relationships between urban problems. Individual interviews were conducted sequentially to minimize potential direct influences, and all data were anonymized to guarantee the independence of the participating experts. In-depth talks with the expert panel resulted in determining a final Grey direct relationship matrix for the 16 PCC causes, as detailed in Section 4.3.

Table 2.
Causes of PPC.
| Urban Causes of PPC | Descriptive Comments | Reference |
|---|---|---|
| Excessive land acquisition costs and low return on investment in parking facilities (B1) | The high cost of land in parking lot construction results in unreasonable expenses related to the parking space structure, which fails to meet people’s consumption levels, and leads to low returns on investment. | [71,72] |
| High density of urban buildings and low density of parking spaces (B2) | In some parts of the city, high-density buildings make roads congested and narrow, which compresses the space needed for parking. | [74,77] |
| Parking lot location is not reasonable (B3) | In the process of site selection planning, it is observed that some of the chosen parking lots prove to be inadequate during construction due to their low utilization rates, contributing minimally to urban operations. | [71,78] |
| Vehicle growth is far outpacing the construction of parking lots (B4) | Motor vehicle purchases are increasing at a faster rate than the rate at which parking spaces are being built. | [72,74] |
| Intelligent parking systems are still being set up, and the benefits of technological tools are not obvious (B5) | Intelligent parking lots are still under construction, and they have not been installed in the majority of the city; thus, its scientific and technological benefits have not been highlighted. | [79,80] |
| Urban public transport is not perfect (B6) | Urban traffic order management, infrastructure construction, and supporting services are not perfect. | [78] |
| Insufficient awareness of the importance of Parking industry policy (B7) | Insufficient understanding of parking industry policies leads to the formulation of inadequate policies during the construction of parking lots. | [72,75] |
| Lack of management institutions or mechanisms to adapt to the development of the new situation of parking (B8) | As the number of motor vehicles rapidly increases, there is no appropriate management organization or mechanism. | [77] |
| Insufficient use of the price lever to adjust parking distribution (B9) | Price difference between road parking and off-road parking is not obvious. | [78,79] |
| Management of parking spaces on the road is confusing (B10) | The phenomenon of disorderly parking among vehicles on the road is serious due to the lack of an effective management system, resulting in chaotic management. | [77] |
| Early urban planning was inadequate (B11) | Early government planning for the parking lot was inadequate. | [71,75] |
| High coordination workload, difficulty to promote social enterprises, and low motivation (B12) | During the coordination work of parking lot construction, there is limited support and enthusiasm from people for the coordination efforts. | [71,72] |
| Dense buildings in the old city and difficulties in building public parking lots (B13) | Due to the inadequate construction planning and high density in the old urban areas, the available space for parking lot construction is limited and site selection becomes challenging. | [71,81] |
| Temporary parking space planning is not reasonable (B14) | Temporary parking spaces are not planned properly, making road parking substandard, and it also affects traffic. | [72,80] |
| Low overall quality of residents, resulting in wasted parking resources (B15) | The quality of resident parking is low, and there is a serious issue where vehicles are being parked indiscriminately, resulting in the inefficient use of parking spaces. This leads to a waste of parking resources. | [77,78] |
| Lack of preferential incentives in policy hinders the construction process of public parking lots (B16) | A lack of preferential policies to encourage developers to build parking lots, and the low motivation of developers, hinder the construction process. | [74,79] |
4.3. The Results of Application of Method
The Grey-DEMATEL, Grey-ISM, and Grey-MICMAC mixed analysis methods were adopted to identify the relationship between the causes of PPC and their degrees of importance. The specific steps created for the adopted methods are discussed below.
Step 1: A 16 × 16 matrix, depicting all obstacles, was created using each expert’s questionnaire. Assuming that the obtained matrix was , then represents the degree of influence of the -th barrier on the -th barrier. For instance, represents the degree of influence that excessive land acquisition costs, and low return on investments in parking facilities (B1), have on the high density of urban buildings and low density of parking spaces (B2). According to Grey theory [82], the degree of influence of grayscale can be divided into five levels, and the corresponding gray values are shown in Table 3.
Step 2: The matrix of each expert was obtained, and using the correspondence in Table 4, it was transformed into a grayscale relationship matrix. The overall grey direct-relationship matrix is given in Table 4, after the direct relationship matrix was determined using Equation (10), where is the total number of experts who participated in the research.
Step 3: According to Equation (3), the normalized Grey direct relationship matrix was created after obtaining the direct relationship matrix , as shown in Table 5.
Step 4: After calculating the grey total relationship matrix , and using the method proposed by Bai and Satir [76] to divide the standardized Grey direct relation matrix into the upper limit matrix and lower limit matrix , the total Grey relationship matrix was then created after merging, as shown in Table 6. This occurs by obtaining from the upper limit matrix and from the lower limit matrix. The solution process is illustrated in Equations (11) and (12).
After obtaining the Grey total relationship matrix , the dominance rate was introduced [76], and a dominance rate matrix was obtained to explore the possibility of influential links between causes. was selected as the threshold value, and 0.036 and 0.103 were selected as the upper and lower mean values of the grey total relationship matrix using the dominance rate [76]. Table 7 displays the corresponding dominance probability rate matrix.
Step 5: As demonstrated in Equation (13), the dominance rate matrix yields the 0–1 reachability matrix , which was then utilized for ISM analysis.
The meaning of Equation (13) is as follows: if the dominance rate is greater than 50%, the corresponding position element in the 0–1 reachability matrix is 1. Conversely, if the dominance rate is less than 50%, the corresponding position element in the 0–1 reachability matrix is 0. More specifically, the reachability matrix has a value of 1 for every element, regardless of size, on the major diagonal. The results of the 0–1 reachability matrix are shown in Table 8.
Step 6: Obtain the accessibility matrix , then multiply it by the position components of the grey total relationship matrix that correspond with accessibility matrix to produce the accessibility matrix , as indicated in Equation (14), and the accessibility matrix as shown in Table 9.
Through Grey-DEMATEL analysis, the 0–1 reachability matrix was obtained. The reachability matrix was employed in this study to conduct ISM analysis and determine the Driving power and Dependence power, which was then utilized in the subsequent MICMAC analysis.
Step 7: The ranks of PPC urban problem causes were classified using an iterative approach. The reachability set and antecedent set were introduced here, where the antecedent set of a cause is the set of itself and other urban causes that may affect it. The reachability set of a cause is the set of itself and other causes that it may affect. The intersection level is the intersection of the reachability set and Antecedent set, if the reachability set and Intersection Level of a cause are identical; this study classifies it as the first level. The iterative process is as follows if the first level is determined and the impact of the first level PPC causes is eliminated: if the reachability set and intersection level of a cause are the same, the cause is categorized as the second level, and the above process is repeated. The first level set is shown in Table 10, whereas Figure 4 illustrates the division diagram.
Step 8: The obtained driving power and dependence power ertr transformed into Crisp Scores, and , using defuzzification for subsequent MICMAC analysis. Since the results are expressed as Grey numbers, the Convert Fuzzy into Crisp Scores (CFCS) deblurring method was used to process these values [83]. CFCS is considered the most effective deblurring method, and the results are displayed in Table 11. Using the ISM-based hierarchical framework model, it became possible to identify the underlying and outcome factors among the etiological factors of PPC.
Step 9: Obtaining the prominence and net effect and fuzzing them using CFCS. The prominence and net effect are obtained using Equations (15) and (16), respectively. The results are shown in Table 12.
Based on the driving power and dependence power, the MICMAC analysis enabled the classification of causes into four categories, as follows: (i) autonomous causes, (ii) dependent causes, (iii) linkage causes, and (iv) independent causes, as analyzed by Grey-MICMAC. The driving power and dependence power of the causes are shown in Figure 5.
4.4. Result Analysis
4.4.1. Grey-DEMATEL-ISM Analysis
The crucial fundamental factors that play a significant role in the governance of PPC urban problems, primarily fall to the bottom of the ISM hierarchical model, though they deeply influence government decision-making. These fundamental factors are closely related to the government’s policies, urban development planning, and public encouragement. They not only have a crucial function on their own, but they also significantly impact other PPC causes. In this study, there are five fundamental causes, as follows: “insufficient awareness of the importance of Parking industry policy (B7)”, “lack of management institutions or mechanisms to adapt to the development of the new situation of parking (B8)”, “early urban planning was inadequate (B11)”, “dense buildings in the old city and difficulties in building public parking lots (B13)”, and “lack of preferential incentives in policy hinders the construction process of public parking lots (B16)”. If the Wuhan city administration wants to address PPC factors such as B6, B9, or B12, it must pay great attention to B7, B8, and B16, because B7, B8, and B16 are affected by B6, B9, and B12. To successfully handle PPC urban causes, both internal policies (B7, B8) and external incentive orientation (B16) are required. The former is associated with senior government management whereas the latter concerns how well the government comprehends public opinion. According to Zheng et al. [71], the absence of comprehensive parking industry policies by governments, and insufficient encouragement towards masses’ needs, are main causes for PPC urban problems.
Additionally, “early urban planning was inadequate (B11)” and “dense buildings in the old city and difficulties in building public parking lots (B13)” had a significant impact on other factors. This is one of the main causes of PPC urban problems, but its special characteristics are mainly reflected in temporal irreversibility. It may only be suitable for issuing warnings in emerging cities and focusing on early urban spatial planning.
Transitional factors play a mediating role in the causes of urban problems related to PPC, which are influenced by underlying factors, and they exert an impact on surface-level factors within the ISM framework. Figure 4 delineates five key factors, “excessive land acquisition costs and low return on investment in parking facilities (B1)”, “high density of urban buildings and low density of parking spaces (B2)”, “vehicle growth is far outpacing the construction of parking lots (B4)”, “intelligent parking systems are still being set up, and the benefits of technological tools are not obvious (B5)”, and “low overall quality of residents, resulting in the waste of parking resources (B15)”. By isolating Transitional factors from other variables, their transitional role can be minimized, thereby mitigating the evolution of PPC problems. The status of B1 and B2 factors is influenced by B8, B13, and B16. Due to dense urban buildings, narrow roadways, as well as a lack of innovative reform strategies and incentive policies in the initial stages, there exists a high investment cost for parking spaces, coupled with low parking space density. Similarly, the status of B4, B5, and B15 will affect B6 and B12. When rapid automobile growth is accompanied by an overall decline in residents’ quality of life, it exacerbates coordination challenges while further deteriorating the state of urban public transportation systems.
The resultant factors are the influencing factors that indicate the most significant resultant and influenced factors [84]. The resultant factors that have an effect on PPC, at the top of ISM-based hierarchical framework at level 1 and level 2, are related to the strategic planning of the parking program. Figure 4 illustrates six resultant causes, as follows: “parking lot location is not reasonable (B3)”, “urban public transport is not perfect (B6)”, “insufficient use of the price lever to adjust the parking distribution (B9)”, “management of parking spaces on the road is confusing (B10)”, “high coordination workload, difficult to promote social enterprises, and low motivation (B12)”, and “temporary parking space planning is not reasonable (B14)”. These resultant factors do not constitute significant causes for the other four categories of causal factors. Consequently, these factors exert the least impact on the successful management of PPC urban problems. However, it is important to note that this does not imply diminished importance; rather, they should be perceived as influenced factors rather than influencing factors. Wojnowska et al. [85] found that lack of transportation systems, and the unreasonable operation and maintenance of parking spaces and lots, are the main resultant factors. Iacobucci et al. [86] also found that the difficulty in promoting social enterprises has led to a reduction in effectiveness in terms of managing parking spaces, which is a resultant factor for PPC urban problems, and it appears at the top of the hierarchy, upon which, effectiveness depends.
4.4.2. Grey-MICMAC Analysis
Autonomous causes situated in quadrant I (lower-left) of Figure 5, include “excessive land acquisition costs and low return on investment in parking facilities (B1)”, “vehicle growth is far outpacing the construction of parking lots (B4)”, “intelligent parking systems are still being set up, and the benefits of technological tools are not obvious (B5)”, and “low overall quality of residents, resulting in the waste of parking resources (B15)”. The average driving power and dependence power of these PPC causes are merely 0.564 and 0.441, respectively, indicating that these autonomous causes exhibit an insignificant correlation with other causes. As shown in Figure 4, these PPC causes fall within levels 3 and 4 of the ISM hierarchy identification frameworks, which is the intermediate level. This finding aligns with research conducted by Zheng et al. [71], who suggested that the relatively low quality of some residents in Wuhan may contribute to parking difficulties.
Independent causes are situated in quadrant II (lower-right) of the Figure 5. These PPC causes exhibit a relatively weak average dependency of 0.316, yet they possess a robust average driving force, reaching 1.409. This indicates that these particular causes are likely to influence other causes while remaining unaffected by them. Their strong driving power qualifies these causes as key factors. There are six independent causes, as follows: “high density of urban buildings and low density of parking spaces (B2)”, “insufficient awareness of the importance of Parking industry policy (B7)”, “lack of management institutions or mechanisms to adapt to the development of new parking lots (B8)”, “early urban planning was inadequate (B11)”, “dense buildings in the old city and difficulties in building public parking lots (B13)”, and “lack of preferential incentives in policy hinders the construction process of public parking lots (B16)”. These PPC causes are located at levels 5 and 6 of the ISM hierarchical model, which are the lowest levels. When governing PPC, urban managers should pay close attention to the independent causes, which is key to improving car parking convenience.
Linkage causes are situated in quadrant III (upper-right) of Figure 5. The causes falling within this quadrant exhibit both strong dependence power and driving power, indicating significant connections with other causes, and a susceptibility to being influenced by them. Such causes would be positioned at the intermediate level of the ISM hierarchy model. However, as depicted in Figure 5, none of the PPC causes are classified as linkage causes.
Dependent causes are situated in quadrant IV (upper-left) of Figure 5, including “parking lot location is not reasonable (B3)”, “urban public transportation is not perfect (B6)”, “insufficient use of the price lever to adjust the parking distribution (B9)”, “management of parking spaces on the road is confusing (B10)”, “high coordination workload, difficult to promote social enterprises, and low motivation (B12)”, and “temporary parking space planning is not reasonable (B14)”. The dependent causes exhibit strong dependence on other causes, with an average as high as 1.723; however, their average driving power is relatively weak, at only 0.547. This suggests that these causes are easily influenced by other causes, but they are less likely to exert influence on them. The dependent causes, positioned at the top levels of the ISM hierarchy model shown in Figure 4, which are level 1 and 2, are the most vulnerable to other causes.
4.4.3. Analysis of Prominent Factors
The visualization of Table 12 results in the generation of Figure 6, revealing that the four most prominent causal factors (the highest scoring causal factors), are “parking lot location is not reasonable (B3)”, “insufficient awareness of the importance of Parking industry policy (B7)”, “management of parking spaces on the road is confusing (B10)” and “temporary parking space planning is not reasonable (B14)”. The two most prominent factors identified are B10 and B14, with prominence scores of 2.575 and 2.422, respectively. This finding aligns with previous research on parking convenience [80], which indicates that disorganized management and inadequate planning for temporary parking spaces have worsened the PPC problem in Wuhan. The government’s relevant parking industry policy, as well as the selection of locations for constructing parking lots, have become crucial factors influencing future growth in Wuhan’s parking industry and improving convenience.
5. Discussions
5.1. Discussion on Grey DEMATEL-ISM-MICMAC
- i.
- The driving power and dependence diagram in Figure 5 provides valuable insights which illustrate the mutual importance and interdependence of the Wuhan PPC causes behind urban problems. The first cluster (autonomic causes) in MICMAC analysis shows that there are four autonomous causes, namely, B1, B4, B5, and B15. We found that B15 does not have much influence on the other PPC causes. The analysis shows that “low overall quality of residents, resulting in the waste of parking resources (B15)” is not the main cause of PPC, and hence, it can be addressed at the same time as other causes. These causes have few direct linkages with other causes; however, this does not imply that these causes are irrelevant. For example, the increase in vehicle acquisition has substantially increased parking demand, and the absence of forecasting of vehicle parking demand has made it impossible to meet parking demands [70]. On the other hand, “vehicle growth is far outpacing the construction of parking lots (B4)” resulted in almost equal driving power (0.323, 0.895) and dependence power (0.436, 1.052), which is attributed to how these causes are intertwined with other causes. Therefore, conducting a parking survey was necessary to understand the distribution and changes concerning the deficiency of parking spaces.
- ii.
- The second cluster (independent causes) during MICMAC analysis concerns the fact that causes have low dependence power and high driving power, including B2, B7, B8, B11, B13, and B16; these can be summarized in terms of urban planning and policy awareness. This finding is consistent with that of Zheng et al. [71], indicating that government regulation support and top management commitment play an important role, and their absence works as a main causes of PPC generation. From the ISM model shown in Figure 4, it can be observed that dependent causes are mostly located at the bottom level of the ISM model. Due to their low dependence and high driving power, addressing these causes early in the implementation of PPC has the potential to establish a solid foundation for these practices and improve efficiency as it tackles the remaining causes. Therefore, Wuhan needs to implement preferential policies as soon as possible to encourage and support parking facility construction development, make full use of its land for building parking facilities, and explore composite urban land use to fully utilize land value. Furthermore, incentives and the simplification of parking space approval procedures are proposed to encourage more enterprises to participate in the creation of urban parking lots [87].
- iii.
- The third cluster (linkage causes) is not observed in the MICMAC analysis. Any change in linkage causes affects the criticality of other PPC causes. These causes both drive and depend on other variables. Therefore, they are rather unstable and difficult to resolve. The case studied in this article lacks linkage causes. We found that the causes, B1, B2, B4, B5, and B15, are positioned in the middle level of the ISM-based hierarchy model. However, these causes are independent of the lower causes. We also observed that “excessive land acquisition costs and low return on investment in parking facilities (B1)” and ”vehicle growth is far outpacing the construction of parking lots (B4)” have more driving power and dependence power compared with B2, B5, and B15. Hence, these two causes may have potential as linkage causes, however, their relationship would not be strong. As these causes are affected by lower-level causes which subsequently impact higher-level causes, it may be argued that both cause B1 and B4 indirectly influence all other causes. This finding also implies that the causes, B1 and B4, may be the most unstable causes, as their positions expose them to the highest intensity of relationships with other causes. This observation is consistent with evidence from Wuhan, where excessively high land prices and the increasing number of motor vehicles are currently prevalent [78].
- iv.
- The fourth cluster (dependent causes) consists of B3, B6, B9, B10, B12, and B14, which have the highest dependence and the least driving power, thus forming the top level of the ISM hierarchy. “Parking lot location is not reasonable (B3)”, “management of parking spaces on the road is confusing (B10)” and “temporary parking space planning is not reasonable (B14)” are highly dependent on all the other causes. To ensure parking convenience, it is necessary to combine intelligent management technology with parking space management when establishing the parking lot later on, which takes into account the impact of local traffic patterns and building density [88]. Furthermore, promoting public transportation construction and introducing travel incentives can help alleviate vehicle travel pressure [74].
In conclusion, city administrators should maximize land value, streamline the project clearance process, and enhance the parking management mechanism by deploying smart parking. If managed correctly, this approach will have a positive impact on Wuhan’s PPC problem. However, its effectiveness is also heavily dependent on other causal factors such as corporate management commitment and government regulatory policies [89].
5.2. Comparison Analysis
The DEMATEL-ISM-MICMAC method was used to analyze the causes of urban coupling of PPC, using the same expert opinion data, without employing Grey theory. The calculation results are shown in Table 13 and Figure 7.
Table 13 shows that the original six layers have been reduced to four. The hierarchical structure of some causes was consolidated into the same tier, such as B4 and B6, which were merged down from L2 and L3 to L1, respectively. This flattening indicates a shift in inter-causal coupling relationships, from external to internal, regarding the causes of urban problems in Wuhan’s PPC, resulting in a more ambiguous internal influence mechanism. It also implies that the experts’ cognition of causes is uncertain and incomplete. The hierarchy derived from the Grey DEMATEL-ISM approach, which provides a clearer stratification.
As observed in Figure 7, significant changes can be seen in terms of the driving power and dependence power of each cause. Notably, B1 and B4 shifted from quadrant I to quadrants IV and II, respectively. The calculated results demonstrate that B3, B9, and B14, as well as B6 and B12, are positioned similarly, suggesting they have similar influence and positioning. Although the traditional MICMAC model effectively categorizes the causes, it fails to further differentiate between the positioning of these causes; the Grey theory-based MICMAC method allows for a clearer positioning of the causes.
By comparing hierarchical structures and cause classifications, it can be concluded that incomplete cognition hinders experts from differentiating between vague and similar issues during evaluation. The application of grey theory leads to clearer divisions of the hierarchical structure, enabling experts to assess vagueness and uncertainties more flexibly in decision-making, leading to outcomes that are closer to reality.
6. Conclusions and Future Prospects
6.1. Conclusions
With the rapid urbanization of the world, numerous urban problems have emerged, which impedes multidimensional and sustainable city growth. Developing countries in particular are facing unpredictable and uncontrollable challenges. Many researchers and city managers are working on identifying the causes of these urban problems and promoting sustainable urban development. Existing studies have explored and uncovered the causes of urban problems, but there are few uniform methods which analyze the inherent links between these causes. A hybrid Grey-DEMATEL, Grey-ISM, and Grey-MICMAC system approach is proposed in this study to gain insight into the pathogenic mechanisms behind urban problems. The primary conclusions are as follows.
- (1)
- The PPC urban problem in Wuhan, China, was adopted to validate the feasibility of the proposed method. Conventional methods for identifying urban problems are inadequate for comprehensively identifying the causes, or analyzing the relationships and significance between these causes. The hybrid approach we have developed has proven effective in providing valuable insights into the causes of urban problems and their underlying logical relationships.
- (2)
- The methodology established in this paper is theoretically efficacious, as it uses Grey numbers to aptly encapsulate the ambiguity inherent in the system, thereby mitigating errors attributable to subjective assessments. The Grey-DEMATEL-ISM approach was employed to quantify the impact of causes, clarifying their hierarchical structure and interactions. Building on this, the Grey-MICMAC method categorizes causes into four distinct groups to analyze their roles and influence.
- (3)
- Through an extensive review of the literature and expert surveys, 16 causes that affect the PPC in Wuhan were identified. These causes are categorized into six levels and three dimensions. “Parking lot location is not reasonable” (B3), “insufficient awareness of the importance of Parking industry policy” (B7), “management of parking spaces on the road is confusing” (B10) and “temporary parking space planning is not reasonable” (B14) were identified as key causes. They exhibit a strong driving force and low dependence, and they influence other causes that contribute to PPC. To alleviate the exacerbation of the PPC problems, it is crucial to strengthen road management and improve parking space planning in Wuhan.
- (4)
- Without a clear understanding of the intrinsic relationship between these causal factors, policies proposed by city managers are unlikely to yield desired outcomes, and they may even yield counterproductive effects. By employing DEMATEL, ISM, and MICMAC methods for causal analysis to establish correlations and determine the significance of causes contributing to urban problems, this study enables urban managers to formulate targeted measures that effectively guide sustainable urban development.
6.2. Limitations and Future Work
This paper presents innovative research on the identification and exploration of urban problem causation, and it proposes a structured method for recognizing the causes of urban problems that contribute to their management. However, future research needs to address several limitations.
- (1)
- The analysis of urban problem causes related to PPC in this article is static, whereas the formation of PPC is a dynamic process with changing types and states of causes at different stages. Future studies could employ dynamic analytical methods such as Structural Equation Modeling (SEM) or the System Dynamics Method (SDM) [12,90] to conduct a dynamic impact analysis of urban problem causes.
- (2)
- Regarding methodology, a linkage model was constructed using a mixed-methods approach to precisely identify the origins of urban problems; however, this model has not yet been statistically validated. The effectiveness of these models could be further verified by employing techniques such as machine learning or data mining to explore more complex relationships between causes of urban problems.
- (3)
- This study is based on a framework that may have certain biases, as the original data for the method were derived from the opinions of a few experts. Furthermore, the method was validated solely using one case study of urban problems, which offers opportunities for further research. Future research could expand upon the selection of experts, and it could study various urban problems in other cities. Moreover, it could build on the identification of problems in these cities, based on the existing literature and expert insights, using the methodology presented in this paper to analyze causes, categorize them, and pinpoint their origin.
Author Contributions
W.C.: supervision; data curation; funding acquisition; writing—review and editing. Y.T.: writing—original draft; investigation; editing and resources. Y.W. (Yanhua Wang): funding acquisition; supervision; data curation; funding acquisition. H.Y.: conceptualization; writing—original draft; methodology; validation; writing—review and editing. Y.W. (Yong Wang): funding acquisition; data curation; visualization. All authors have read and agreed to the published version of the manuscript.
Funding
This work is supported by the project China Construction Seventh Engineering Division Corp., Ltd. named “The Research on the Development and Construction Operation System of Urban Renewal Projects on the Enterprise Side (grant number: CSCEC7b-2022-Z-23)”; supported by the project from the Ministry of Housing and Urban-Rural Development of the People’s Republic of China named “The Research on comprehensive evaluation criteria for Urban Health Examination (grant number: 2022-R-022)”, supported by the project from the ”Wuhan Urban Construction Bureau Science and Technology Plan Project (grant number: 202238)”, and supported by the project from the ”Wuhan University of Technology Campus level Research Project (grant number: 20221h0128)”. The authors also appreciate the insightful comments provided by the anonymous reviewers.
Data Availability Statement
On behalf of all the authors, the corresponding author states that our data are available upon reasonable request.
Conflicts of Interest
Author Yanhua Wang was employed by the company Central & Southern China Municipal Engineering Design and Research Institute Co., Ltd. And author Yong Wang was employed by the company Construction Seventh Engineering Division Corp., Ltd. The remaining authors declare that the research was conducted in the absence of any commercial or financial relationships that could be construed as a potential conflict of interest.
Appendix A
Survey Questionnaire
–Exploring Causes to Poor Parking Convenience (PPC) of urban problems
(Translated from Mandarin)
A1. Directions for Completing Questionnaire and Example
The survey consists of several sets of questions. Each question within a question set asks you to compare two factors at a time (i.e., pair-wise comparisons). Please do fill in only empty boxes and do not fill in boxes marked with a 0. For each question, please refer to Table A1 for the scale to describe your perceptions of the influence of one factor on another factor.
Example: If the question asks you to compare “High density of urban buildings and low density of parking spaces” versus “Parking lot location is not reasonable”, then a 2 means that “High density of urban buildings and low density of parking spaces” has a Low influence on “Parking lot location is not reasonable”. As an example, in Table A3, we wrote that the “High density of urban buildings and low density of parking spaces” has a Low influence on “Parking lot location is not reasonable”, with a value of 2.
Table A1.
Linguistic scales.
| Linguistic Terms | Ratings |
|---|---|
| No influence (N) | 0 |
| Very low influence (VL) | 1 |
| Low influence (L) | 2 |
| High influence (H) | 3 |
| Very high influence (VH) | 4 |
Table A2.
Directions for filling in question sets. With respect to Poor Parking Convenience, to what extent do Causes in row i influence other Causes in column j?
Table A2.
Directions for filling in question sets. With respect to Poor Parking Convenience, to what extent do Causes in row i influence other Causes in column j?
| PPC Causes in Column j | |||||||||||||||||
|---|---|---|---|---|---|---|---|---|---|---|---|---|---|---|---|---|---|
| B1 | B2 | B3 | B4 | B5 | B6 | B7 | B8 | B9 | B10 | B11 | B12 | B13 | B14 | B15 | B16 | ||
| PPC Causes in Row i | B1 | 0 | |||||||||||||||
| B2 | 0 | ||||||||||||||||
| B3 | 0 | ||||||||||||||||
| B4 | 0 | ||||||||||||||||
| B5 | 0 | ||||||||||||||||
| B6 | 0 | ||||||||||||||||
| B7 | 0 | ||||||||||||||||
| B8 | 0 | ||||||||||||||||
| B9 | 0 | ||||||||||||||||
| B10 | 0 | ||||||||||||||||
| B11 | 0 | ||||||||||||||||
| B12 | 0 | ||||||||||||||||
| B13 | 0 | ||||||||||||||||
| B14 | 0 | ||||||||||||||||
| B15 | 0 | ||||||||||||||||
| B16 | 0 | ||||||||||||||||
Table A3.
Illustration of filling in one question set for the survey. With respect to Poor Parking Convenience, to what extent does Cause in row i influence another Cause in column j?
Table A3.
Illustration of filling in one question set for the survey. With respect to Poor Parking Convenience, to what extent does Cause in row i influence another Cause in column j?
| PPC Causes in Column j | |||||||||||||||||
|---|---|---|---|---|---|---|---|---|---|---|---|---|---|---|---|---|---|
| B1 | B2 | B3 | B4 | B5 | B6 | B7 | B8 | B9 | B10 | B11 | B12 | B13 | B14 | B15 | B16 | ||
| PPC Causes in Row i | B1 | 0 | 3 | 2 | 2 | 2 | 2 | 1 | 2 | 2 | 2 | 0 | 1 | 1 | 2 | 0 | 1 |
| B2 | 3 | 0 | 3 | 3 | 1 | 3 | 1 | 0 | 2 | 3 | 2 | 2 | 3 | 4 | 1 | 1 | |
| B3 | 2 | 2 | 0 | 1 | 1 | 2 | 2 | 0 | 2 | 3 | 1 | 1 | 2 | 3 | 1 | 1 | |
| B4 | 0 | 1 | 2 | 0 | 1 | 2 | 1 | 1 | 2 | 3 | 0 | 2 | 2 | 3 | 1 | 1 | |
| B5 | 0 | 0 | 2 | 0 | 0 | 2 | 1 | 0 | 2 | 4 | 1 | 2 | 1 | 3 | 1 | 1 | |
| B6 | 2 | 2 | 3 | 3 | 1 | 0 | 2 | 2 | 2 | 2 | 1 | 3 | 1 | 3 | 1 | 1 | |
| B7 | 3 | 1 | 3 | 2 | 2 | 2 | 0 | 3 | 3 | 3 | 2 | 2 | 1 | 3 | 2 | 4 | |
| B8 | 2 | 1 | 3 | 2 | 2 | 3 | 2 | 0 | 3 | 3 | 1 | 3 | 1 | 3 | 1 | 2 | |
| B9 | 1 | 0 | 3 | 0 | 1 | 2 | 0 | 0 | 0 | 2 | 1 | 2 | 0 | 2 | 0 | 1 | |
| B10 | 1 | 1 | 2 | 0 | 1 | 2 | 0 | 0 | 2 | 0 | 1 | 2 | 1 | 2 | 1 | 2 | |
| B11 | 3 | 4 | 3 | 2 | 1 | 2 | 2 | 2 | 2 | 3 | 0 | 2 | 3 | 3 | 1 | 2 | |
| B12 | 1 | 1 | 2 | 2 | 2 | 2 | 1 | 2 | 2 | 2 | 1 | 0 | 0 | 2 | 0 | 1 | |
| B13 | 4 | 4 | 3 | 2 | 0 | 3 | 1 | 0 | 1 | 3 | 1 | 3 | 0 | 3 | 0 | 1 | |
| B14 | 0 | 2 | 4 | 0 | 0 | 2 | 1 | 1 | 3 | 4 | 1 | 2 | 1 | 0 | 0 | 0 | |
| B15 | 0 | 0 | 0 | 0 | 0 | 2 | 1 | 0 | 2 | 1 | 0 | 3 | 0 | 0 | 0 | 0 | |
| B16 | 0 | 3 | 2 | 2 | 2 | 2 | 1 | 2 | 2 | 2 | 0 | 1 | 1 | 2 | 0 | 1 | |
Table A4.
Cause definitions.
| Urban Causes of PPC | Descriptive Comments |
|---|---|
| Excessive land acquisition costs and low return on investment in parking facilities (B1) | The high cost of land in parking lot construction results in an unreasonable expense for the parking space structure, which fails to meet people’s consumption level and leads to a low return on investment. |
| High density of urban buildings and low density of parking spaces (B2) | In some parts of the city, high-density buildings make roads congested and narrow, which compresses the space needed for parking. |
| Parking lot location is not reasonable (B3) | In the process of site selection planning, it is observed that some of the chosen parking lots prove to be inadequate during construction due to their low utilization rates, contributing minimally to urban operations. |
| The rate of vehicle acquisition is increasing faster than the construction of parking lots (B4) | Motor vehicle purchases are being made at a faster rate than parking spaces are being built. |
| Intelligent parking systems are still being set up, and the benefits of technological tools are not obvious (B5) | The intelligent parking lot is still under construction and has not been put into use in the vast area of the city; thus, its scientific and technological benefits have not been highlighted. |
| Urban public transport is not perfect (B6) | Urban traffic order management, infrastructure construction, and supporting services are not perfect. |
| Insufficient awareness of the importance of Parking industry policy (B7) | Insufficient understanding of parking industry policies leads to the formulation of inadequate policies in the construction of parking lots. |
| Lack of management institutions or mechanisms to adapt to the development of the new parking situation (B8) | As the number of motor vehicles rapidly increases, there is no appropriate management organization or mechanism to cope with this new situation. |
| Insufficient use of the price lever to adjust the parking distribution (B9) | Price difference between road parking and off-road parking is not obvious. |
| Management of parking spaces on the road is confusing (B10) | The phenomenon of disorderly parking of vehicles on the road is serious due to the lack of an effective management system, resulting in chaotic management. |
| Early urban planning was inadequate (B11) | Early government planning for the parking lot was inadequate. |
| High coordination workload, difficulty to promote social enterprises, and low motivation (B12) | During the coordination work of parking lot construction, there is limited support and enthusiasm from people to assist with the coordination efforts. |
| Dense buildings in the old city and difficulties in building public parking lots (B13) | Due to unreasonable construction planning and high density in the old urban areas, the available space for parking lot construction is limited and site selection becomes challenging. |
| Temporary parking space planning is not reasonable (B14) | Temporary parking spaces are not planned properly, making road parking substandard and affecting traffic. |
| Low overall quality of residents, resulting in the waste of parking resources (B15) | The quality of resident parking is low, and there is a serious issue concerning vehicles being parked indiscriminately, resulting in the inefficient use of parking spaces. This leads to a waste of parking resources. |
| Lack of preferential incentives in policy hinders the construction process of public parking lots (B16) | Lack of preferential policies to encourage developers to build parking lots and the low motivation of developers hinder the construction process. |
References
- United Nations. UN-Habitat: Urbanization Is Still Unstoppable, with 68% of the Global Urban Population Expected to Reach 2050. Available online: https://news.un.org/zh/story/2022/06/1105282 (accessed on 26 April 2023).
- Chen, W.; Wang, Y.; Ren, Y.; Yan, H.; Shen, C. A novel methodology (WM-TCM) for urban health examination: A case study of Wuhan in China. Ecol. Indic. 2022, 136, 108602. [Google Scholar] [CrossRef]
- Yan, H.; Liu, Z. A New Perspective on the Evaluation of Urbanization Sustainability: Urban Health Examination. Sustainability 2023, 15, 9338. [Google Scholar] [CrossRef]
- Wu, Z.; Yang, X.; Liu, W. Intelligent Urbanization or Labor Urbanization: Strategic Thinking on Urbanization Path of China. Urban Plann. Forum 2015, 15–23. [Google Scholar] [CrossRef]
- Qi, W.; Gao, Y.; Zhang, Q. Spatiotemporal Dynamics of Beijing’s Urbanization Efficiency from 2005 to 2014. Sustainability 2017, 9, 2190. [Google Scholar] [CrossRef]
- Shuai, C.; Chen, X.; Shen, L.; Jiao, L.; Wu, Y.; Tan, Y. The turning points of carbon Kuznets curve: Evidences from panel and time-series data of 164 countries. J. Clean. Prod. 2017, 162, 1031–1047. [Google Scholar] [CrossRef]
- Dong, J.; Xu, Y.; Hwang, B.; Ren, R.; Chen, Z. The Impact of Underground Logistics System on Urban Sustainable Development: A System Dynamics Approach. Sustainability 2019, 11, 1223. [Google Scholar] [CrossRef]
- Li, W.; Feng, W.; Yuan, H. Multimode Traffic Travel Behavior Characteristics Analysis and Congestion Governance Research. J. Adv. Transport. 2020, 2020, 6678158. [Google Scholar] [CrossRef]
- Ma, Y.; Cui, Y.; Tan, H.; Wang, H. Case study: Diagnosing China’s prevailing urban flooding-Causes, challenges, and solutions. J. Flood Risk Manag. 2022, 15, e12822. [Google Scholar] [CrossRef]
- Loorbach, D.; Frantzeskaki, N.; Avelino, F. Sustainability Transitions Research: Transforming Science and Practice for Societal Change. Annu. Rev. Environ. Resour. 2017, 42, 599–626. [Google Scholar] [CrossRef]
- Yue, W.; Li, C.; Mao, G. Urban Traffic Bottleneck Identification Based on Congestion Propagation. In Proceedings of the 2018 IEEE International Conference on Communications (ICC), Kansas City, MO, USA, 20–24 May 2018. [Google Scholar] [CrossRef]
- Lousada, A.L.D.; Ferreira, F.A.F.; Meidute-Kavaliauskiene, I.; Spahr, R.W.; Sunderman, M.A.; Pereira, L.F. A sociotechnical approach to causes of urban blight using fuzzy cognitive mapping and system dynamics. Cities 2021, 108, 102963. [Google Scholar] [CrossRef]
- Abdullah, L.; Rahim, S.N. Bipolar neutrosophic DEMATEL for urban sustainable development. J. Intell. Fuzzy Syst. 2020, 39, 6109–6119. [Google Scholar] [CrossRef]
- Fang, M.; Feng, Z.; Wang, X.; Ma, J. A Pipeline Blockage Identification Model Learning from Unbalanced Datasets Based on Random Forest. In Proceedings of the 33RD Chinese Control and Decision Conference (CCDC 2021), Kunming, China, 22–24 May 2021; pp. 696–701. [Google Scholar] [CrossRef]
- Kansal, M.L.; Osheen; Tyagi, A. Hotspot Identification for Urban Flooding in a Satellite Town of National Capital Region of India. In Proceedings of the World Environmental and Water Resources Congress 2019: Emerging and Innovative Technologies and International Perspectives, Pittsburgh, PA, USA, 19–23 May 2019; pp. 12–24. [Google Scholar]
- Zhao, M.; Zhang, R.; Liu, H.; Zhang, X.; Wang, Y. A Study on the Spatial-Temporal Evolution and Problem Area Identification of High-Quality Urban Development in the Central Region. Sustainability 2023, 15, 11098. [Google Scholar] [CrossRef]
- Torkayesh, A.E.; Zolfani, S.H.; Kahvand, M.; Khazaelpour, P. Landfill location selection for healthcare waste of urban areas using hybrid BWM-grey MARCOS model based on GIS. Sustain. Cities Soc. 2021, 67, 102712. [Google Scholar] [CrossRef]
- Wang, X.; Wang, S.; Liu, G.; Yan, N.; Yang, Q.; Chen, B.; Bai, J.; Zhang, Y.; Lombardi, G.V. Identification of Priority Areas for Improving Urban Ecological Carrying Capacity: Based on Supply-Demand Matching of Ecosystem Services. Land 2022, 11, 698. [Google Scholar] [CrossRef]
- Yustiani, Y.M.; Hasbiah, A.W.; Matsumoto, T.; Rachman, I. Identification of important efforts in urban river water quality management (case study of Cikapundung River, Bandung, Indonesia). Int. Conf. Res. Collab. Environ. Sci. 2019, 245, 011001. [Google Scholar] [CrossRef]
- Zhang, W.; Li, Y.; Zheng, C. The distribution characteristics and driving mechanism of vacant land in Chengdu, China: A perspective of urban shrinkage and expansion. Land Use Policy 2023, 132, 106812. [Google Scholar] [CrossRef]
- Cai, G.; Zhang, J.; Du, M.; Li, C.; Peng, S. Identification of urban land use efficiency by indicator-SDG 11.3.1. PLoS ONE 2020, 15, e0244318. [Google Scholar] [CrossRef]
- Zhou, D.; Lin, Z.; Lim, S.H. Spatial characteristics and risk factor identification for land use spatial conflicts in a rapid urbanization region in China. Environ. Monit. Assess. 2019, 191, 677. [Google Scholar] [CrossRef]
- Wu, Y.; Li, C.; Shi, K.; Liu, S.; Chang, Z. Exploring the effect of urban sprawl on carbon dioxide emissions: An urban sprawl model analysis from remotely sensed nighttime light data. Environ. Impact Assess. 2022, 93, 106731. [Google Scholar] [CrossRef]
- Tashakor, M.; Modabberi, S.; Argyraki, A. Assessing the contamination level, sources and risk of potentially toxic elements in urban soil and dust of Iranian cities using secondary data of published literature. Environ. Geochem. Health 2022, 44, 645–675. [Google Scholar] [CrossRef]
- Aldea, A.; Aldea, M. The interrelationships between urban dynamics and water resource and supply based on multitemporal analysis. In Proceedings of the Fourth International Conference on Remote Sensing and Geoinformation of the Environment (RSCY2016), Paphos, Cyprus, 4–8 April 2016; p. 9688. [Google Scholar] [CrossRef]
- Manso, M.; Teotonio, I.; Silva, C.M.; Cruz, C.O. Green roof and green wall benefits and costs: A review of the quantitative evidence. Renew. Sustain. Energy Rev. 2021, 135, 110111. [Google Scholar] [CrossRef]
- Li, Y.; Lian, Z.; Zhai, T.; Xie, X.; Wang, Y.; Li, M. Assessment of Land Ecological Security Based on the Boston Model: A Case Study from China. Land 2023, 12, 1348. [Google Scholar] [CrossRef]
- Zhao, D.; Li, X.; Wang, X.; Shen, X.; Gao, W. Applying Digital Twins to Research the Relationship Between Urban Expansion and Vegetation Coverage: A Case Study of Natural Preserve. Front. Plant Sci. 2022, 13, 840471. [Google Scholar] [CrossRef] [PubMed]
- Oleniacz, R.; Gorzelnik, T.; Bogacki, M. Impact of urban, suburban and industrial background on air pollution levels of dust substances in North-Eastern part of Krakow (Poland). In Proceedings of the 3rd International Conference on the Sustainable Energy and Environmental Development, Online, 7 December 2021; p. 642. [Google Scholar] [CrossRef]
- Hu, X.; Han, Y.; Yu, B.; Geng, Z.; Fan, J. Novel leakage detection and water loss management of urban water supply network using multiscale neural networks. J. Clean. Prod. 2021, 278, 123611. [Google Scholar] [CrossRef]
- Liang, T.; Du, P.; Yang, F.; Su, Y.; Luo, Y.; Wu, Y.; Wen, C. Potential Land-Use Conflicts in the Urban Center of Chongqing Based on the “Production-Living-Ecological Space” Perspective. Land 2022, 11, 1415. [Google Scholar] [CrossRef]
- Peng, X.; Li, Y.; Si, Y.; Xu, L.; Liu, X.; Li, D.; Liu, Y. A social sensing approach for everyday urban problem-handling with the 12345-complaint hotline data. Comput. Environ. Urban 2022, 94, 101790. [Google Scholar] [CrossRef]
- Fang, C. On integrated urban and rural development. J. Geogr. Sci. 2022, 32, 1411–1426. [Google Scholar] [CrossRef]
- Lowe, M.; Adlakha, D.; Sallis, J.F.; Salvo, D.; Cerin, E.; Moudon, A.V.; Higgs, C.; Hinckson, E.; Arundel, J.; Boeing, G.; et al. City planning policies to support health and sustainability: An international comparison of policy indicators for 25 cities. Lancet Glob. Health 2022, 10, E882–E894. [Google Scholar] [CrossRef]
- Ma, Z.; Xue, Y.; Hu, G. Geographically Weighted Regression Analysis for Spatial Economics Data: A Bayesian Recourse. Int. Region. Sci. Rev. 2021, 44, 582–604. [Google Scholar] [CrossRef]
- Du, H.; Li, Z. Analysis of the impact of the ecological environment on the railway construction based on analytic hierarchy process (ahp) and probability statistics. Fresen. Environ. Bull. 2021, 30, 10718–10727. [Google Scholar]
- Boley, B.B.; McGehee, N.G.; Hammett, A.L. Importance-performance analysis (IPA) of sustainable tourism initiatives: The resident perspective. Tour. Manag. 2017, 58, 66–77. [Google Scholar] [CrossRef]
- Li, H.; Tao, M.; Zuo, Z. Analysis of the key influencing factors of the construction and development of new smart city in china based on dematel method. Fresen Environ. Bull. 2020, 29, 10915–10923. [Google Scholar]
- Mannan, B.; Khurana, S.; Haleem, A. Modeling of critical factors for integrating sustainability with innovation for Indian small- and medium-scale manufacturing enterprises: An ISM and MICMAC approach. Cogent Bus. Manag. 2016, 3, 1140318. [Google Scholar] [CrossRef]
- Nourani, V.; Karimzadeh, H.; Baghanam, A.H. Forecasting CO pollutant concentration of Tabriz city air using artificial neural network and adaptive neuro-fuzzy inference system and its impact on sustainable development of urban. Environ. Earth Sci. 2021, 80, 131–136. [Google Scholar] [CrossRef]
- Gong, Q.; Chen, M.; Zhao, X.; Ji, Z. Sustainable Urban Development System Measurement Based on Dissipative Structure Theory, the Grey Entropy Method and Coupling Theory: A Case Study in Chengdu, China. Sustainability 2019, 11, 293. [Google Scholar] [CrossRef]
- Janssen, M.; Luthra, S.; Mangla, S.; Rana, N.P.; Dwivedi, Y.K. Challenges for adopting and implementing IoT in smart cities: An integrated MICMAC-ISM approach. Internet Res. 2019. ahead-of-print. [Google Scholar]
- Guan, C.; Dong, D.; Shen, F.; Gao, X.; Chen, L. Hierarchical Structure Model of Safety Risk Factors in New Coastal Towns: A Systematic Analysis Using the DEMATEL-ISM-SNA Method. Int. J. Environ. Res. Public Health 2022, 19, 10496. [Google Scholar] [CrossRef]
- Chen, J.; Tseng, T. Modeling the Quality Enablers of Supplier Chain Quality Management. SAGE Open 2022, 12, 21582440221129484. [Google Scholar] [CrossRef]
- Teymourifar, A.; Trindade, M.A.M. Using DEMATEL and ISM for Designing Green Public Policies Based on the System of Systems Approach. Sustainability 2023, 15, 10765. [Google Scholar] [CrossRef]
- Zhang, W.; He, J.; Zhan, L. Method System of Urban Physical Examination for High Quality Development in China. Sci. Geogr. Sin. 2021, 41, 1–12. [Google Scholar] [CrossRef]
- Bos, F.; Jaffe, R. A rejuvenated approach to urban development and inequality: Young people’s perceptions and experiences in Rio de Janeiro. Habitat. Int. 2015, 48, 106–112. [Google Scholar] [CrossRef]
- Jiao, X. Urban Problems in Urbanization Process: The Connotation, Types and Governance Mechanism. Econ. Probl. 2015, 7–12. [Google Scholar] [CrossRef]
- Herrington, C.S.; Horndeski, K. Is urban stream restoration really a wicked problem? Urban Ecosyst. 2023, 26, 479–491. [Google Scholar] [CrossRef]
- Xing, Z.; Guo, W.; Liu, J.; Xu, S. Toward the Sustainable Development of the Old Community: Proposing a Conceptual Framework Based on Meaning Change for Space Redesign of Old Communities and Conducting Design Practices. Sustainability 2022, 14, 4755. [Google Scholar] [CrossRef]
- Malaviya, P.; Singh, A. Constructed Wetlands for Management of Urban Stormwater Runoff. Crit. Rev. Environ. Sci. Tec. 2012, 42, 2153–2214. [Google Scholar] [CrossRef]
- Wei, X.; Si, Z. Fully Exploring Traditional Chinese Culture and Promoting Organic Development of Green City. Procedia Eng. 2017, 180, 1531–1540. [Google Scholar] [CrossRef]
- Anamul Hasan, M.; Sher-E-Alam, K.M.; Raja Chowdhury, A. Human Disease Diagnosis Using a Fuzzy Expert System. arXiv 2010, arXiv:1006.4544. [Google Scholar]
- Reverby, S. A perspective on the root causes of illness. Am. J. Public Health 1972, 62, 1140–1142. [Google Scholar] [CrossRef] [PubMed]
- Macarthur, D.G.; Manolio, T.A.; Dimmock, D.P.; Rehm, H.L.; Gunter, C. Guidelines for investigating causality of sequence variants in human disease. Nature 2014, 508, 469–476. [Google Scholar] [CrossRef]
- Brooke, H.L.; Talback, M.; Hornblad, J.; Johansson, L.A.; Ludvigsson, J.F.; Druid, H.; Feychting, M.; Ljung, R. The Swedish cause of death register. Eur. J. Epidemiol. 2017, 32, 765–773. [Google Scholar] [CrossRef]
- Leach, J.M.; Mulhall, R.A.; Rogers, C.D.F.; Bryson, J.R. Reading cities: Developing an urban diagnostics approach for identifying integrated urban problems with application to the city of Birmingham, UK. Cities 2019, 86, 136–144. [Google Scholar] [CrossRef]
- Lu, J.; Li, B.; Li, H.; Al-Barakani, A. Expansion of city scale, traffic modes, traffic congestion, and air pollution. Cities 2021, 108, 102974. [Google Scholar] [CrossRef]
- Kanniah, K.D. Quantifying green cover change for sustainable urban planning: A case of Kuala Lumpur, Malaysia. Urban For. Urban Green 2017, 27, 287–304. [Google Scholar] [CrossRef]
- Moghadam, H.S.; Helbich, M. Spatiotemporal urbanization processes in the megacity of Mumbai, India: A Markov chains-cellular automata urban growth model. Appl. Geogr. 2013, 40, 140–149. [Google Scholar] [CrossRef]
- Li, Y.; Xu, F. Identification of influencing factors in long-term care system design based on rough set interval grey number DEMATEL model. Manag. Rev. 2022, 35, 320. [Google Scholar] [CrossRef]
- Sun, H.; Mao, W.; Dang, Y.; Xu, Y. Optimum path for overcoming barriers of green construction supply chain management: A grey possibility DEMATEL-NK approach. Comput. Ind. Eng. 2022, 164, 107833. [Google Scholar] [CrossRef]
- Chen, D.; Zhang, F. Supplement and Extension of Interval Number Algorithm. J. Liaocheng Univ. (Nat. Sci. Ed.) 2009, 22, 20–21. [Google Scholar]
- Luo, J.; Zhou, D.; Tian, D.; Xu, H.; Wang, Y.; Yao, C.; Wu, Y.; Du, M.; Zhou, Y. Analysis on the lnfluencing Factors of Telemedicine Implementation Based on ISM and MICMAC Model. Med. Soc. 2021, 34, 61–66. [Google Scholar] [CrossRef]
- Kumar, A.; Dixit, G. An analysis of barriers affecting the implementation of e-waste management practices in India: A novel ISM-DEMATEL approach. Sustain. Prod. Consum. 2018, 14, 36–52. [Google Scholar] [CrossRef]
- Kannan, G.; Pokharel, S.; Kumar, P.S. A hybrid approach using ISM and fuzzy TOPSIS for the selection of reverse logistics provider. Resour. Conserv. Recycl. 2010, 54, 28–36. [Google Scholar] [CrossRef]
- Kumar, H.; Singh, M.K.; Gupta, M.P. A policy framework for city eligibility analysis: TISM and fuzzy MICMAC-weighted approach to select a city for smart city transformation in India. Land Use Policy 2019, 82, 375–390. [Google Scholar] [CrossRef]
- Yang, F.; Hu, W. Exploring the Scale Effects of Trade-offs and Synergies of Multifunctional Cultivated Land--Evidence from Wuhan Metropolitan Area. J. Resour. Ecol. 2022, 13, 1116–1127. [Google Scholar]
- Wang, S.; Liu, Y. Parking in inner versus outer city spaces: Spatiotemporal patterns of parking problems and their associations with built environment features in Brisbane, Australia. J. Transp. Geogr. 2022, 98, 103261. [Google Scholar] [CrossRef]
- Guo, L.; Peng, Y.; Huang, J.; Feng, J.; Hu, G.; Sun, X. Identification and Optimization of Spatial Elements in Short Distance Commuting for Green Trave: Taking Wuhan as an Example. Urban Plann. Forum 2022, 37–43. [Google Scholar] [CrossRef]
- Zheng, H.; Wan, P.; Wu, S. Wuhan: Addressing Development Shortcomings and Alleviating Parking Difficulties. Urban Rural Dev. 2018, 12, 56–59. [Google Scholar]
- Li, Y.; Dai, Y.; Liu, Y. Research on Parking Development Policy in Wuhan City. J. Wuhan Tech. Coll. Commun. Control. Eng. 2011, 13, 38–40. [Google Scholar]
- Bureau, W.T.M. Returning the Road to the People, Wuhan Traffic Police Explore a New Model for Violating Traffic Stopping Management through “Five Measures”. Available online: http://jgj.wuhan.gov.cn/jgdt/48177.jhtml (accessed on 26 May 2023).
- Zhang, Z.; Chen, L. Wuhan: Dual guidance for driving and parking, facilitating public travel. Road Traffic Manag. 2017, 04, 21–22. [Google Scholar]
- Xu, L.; Zhu, A. The depth of investigation determines the depth of investigation—Analysis of the “White Paper on the Investigation of Wuhan Parking Status”. Press Outpost 2011, 11, 24–26. [Google Scholar]
- Bai, C.G.; Satir, A. Barriers for green supplier development programs in manufacturing industry. Resour. Conserv. Recycle 2020, 158, 104756. [Google Scholar] [CrossRef]
- Yuan, X. Research on Parking Problems in Wuhan City. Sci. Technol. Assoc. Forum 2012, 01, 188–189. [Google Scholar]
- Li, J.; Zhao, J. Reflections on Strengthening the Overall Management of Government Resources: Based on a Survey of the Management of Public Parking Facilities in Wuhan City. Assets Financ. Adm. Inst. Chem. Eng. Symp. Ser. 2021, 21, 7–8. [Google Scholar]
- Dai, Y.; Zhang, X.; Huang, G. Research and Development Thinking on the Current Situation of Urban Parking in Wuhan. Traffic Transp. 2006, 01, 64–65. [Google Scholar]
- Chen, B.; Shu, C. Design of Wuhan Intelligent Parking Guidance System with ETC Integration. World Build. Mater. 2012, 33, 96–100. [Google Scholar]
- Chen, Y. Research on Parking Space Allocation Standards for Residential Projects in Wuhan Area. Theor. Res. Urban Constr. 2019, 03, 12–13. [Google Scholar] [CrossRef]
- Xing, M.; Luo, X.; Zan, Y.; Yang, L.; Jin, H.; Luo, J. Identification of factors affecting hoisting quality of large offshore structures and analysis of their coupling relationship based on grey-DEMATEL-ISM-MICMAC. Ocean. Eng. 2023, 280, 114805. [Google Scholar] [CrossRef]
- Opricovic, S.; Tzeng, G.H. Compromise solution by MCDM methods: A comparative analysis of VIKOR and TOPSIS. Eur. J. Oper. Res. 2004, 156, 445–455. [Google Scholar] [CrossRef]
- Wu, X.; Cai, X.; Guo, H.; Wang, Y. Safe Operation of Urban Rail Transit Based on DEMATEL Research on Key Impact Indicators. Auto Time 2022, 11, 190–192. [Google Scholar]
- Wojnowska-Heciak, M.; Suchocka, M.; Blaszczyk, M.; Muszynska, M. Urban Parks as Perceived by City Residents with Mobility Difficulties: A Qualitative Study with In-Depth Interviews. Int. J. Environ. Res. Public Health 2022, 19, 2018. [Google Scholar] [CrossRef] [PubMed]
- Iacobucci, E.; McDonald, N.; Edwards, C.H.W.; Steiner, R. Using social media to understand challenges faced by US urban parcel delivery drivers: Reports from the curb. Transp. Policy 2022, 126, 96–106. [Google Scholar] [CrossRef]
- Xia, B.; Fang, Y.; Shen, H.; Shen, J.; Pan, S. Sustainable Renewal of Underground Parking Space in the Scenario of Shared Autonomous Vehicles. Buildings 2022, 12, 4. [Google Scholar] [CrossRef]
- Sallis, J.F.; Bull, F.; Burdett, R.; Frank, L.D.; Griffiths, P.; Giles-Corti, B.; Stevenson, M. Use of science to guide city planning policy and practice: How to achieve healthy and sustainable future cities. Lancet 2016, 388, 2936–2947. [Google Scholar] [CrossRef] [PubMed]
- Huang, Y.; Yu, P.; Xie, P. Analysis and Optimized Location Selection of Comprehensive Green Space Supply in the Central Urban Area of Hefei Based on GIS. Buildings 2023, 13, 2731. [Google Scholar] [CrossRef]
- Nicolas, C.; Kim, J.; Chi, S. Quantifying the dynamic effects of smart city development enablers using structural equation modeling. Sustain. Cities Soc. 2020, 53, 101916. [Google Scholar] [CrossRef]
Figure 1.
Comparison between urban problems and human diseases.
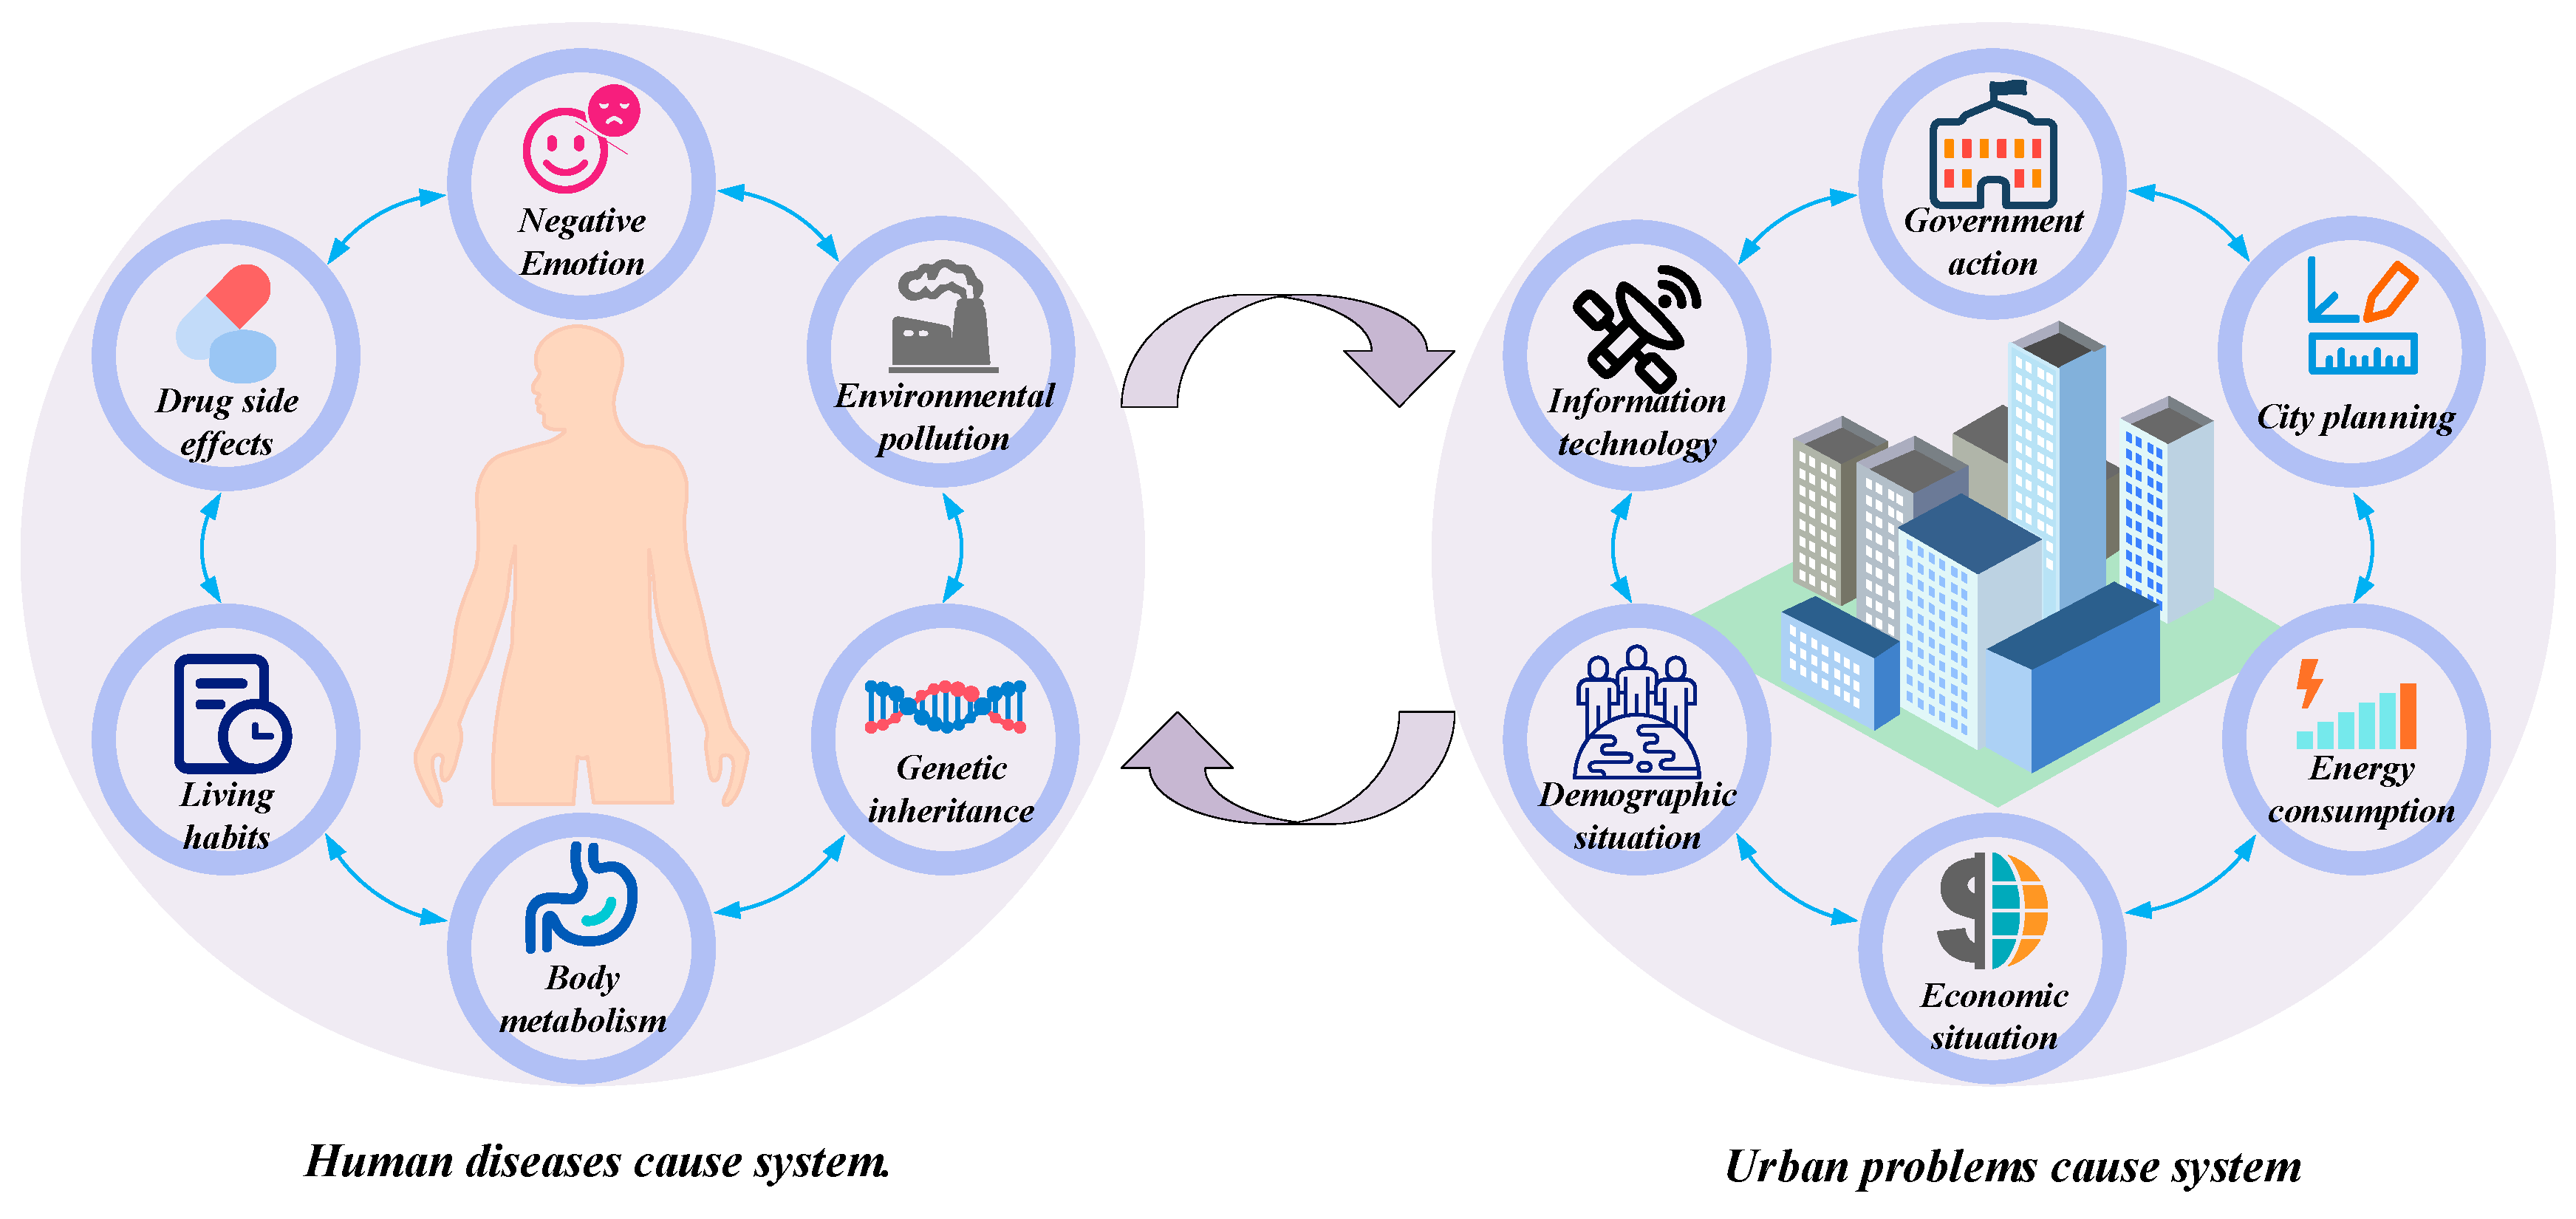
Figure 2.
Flow chart of methodology.
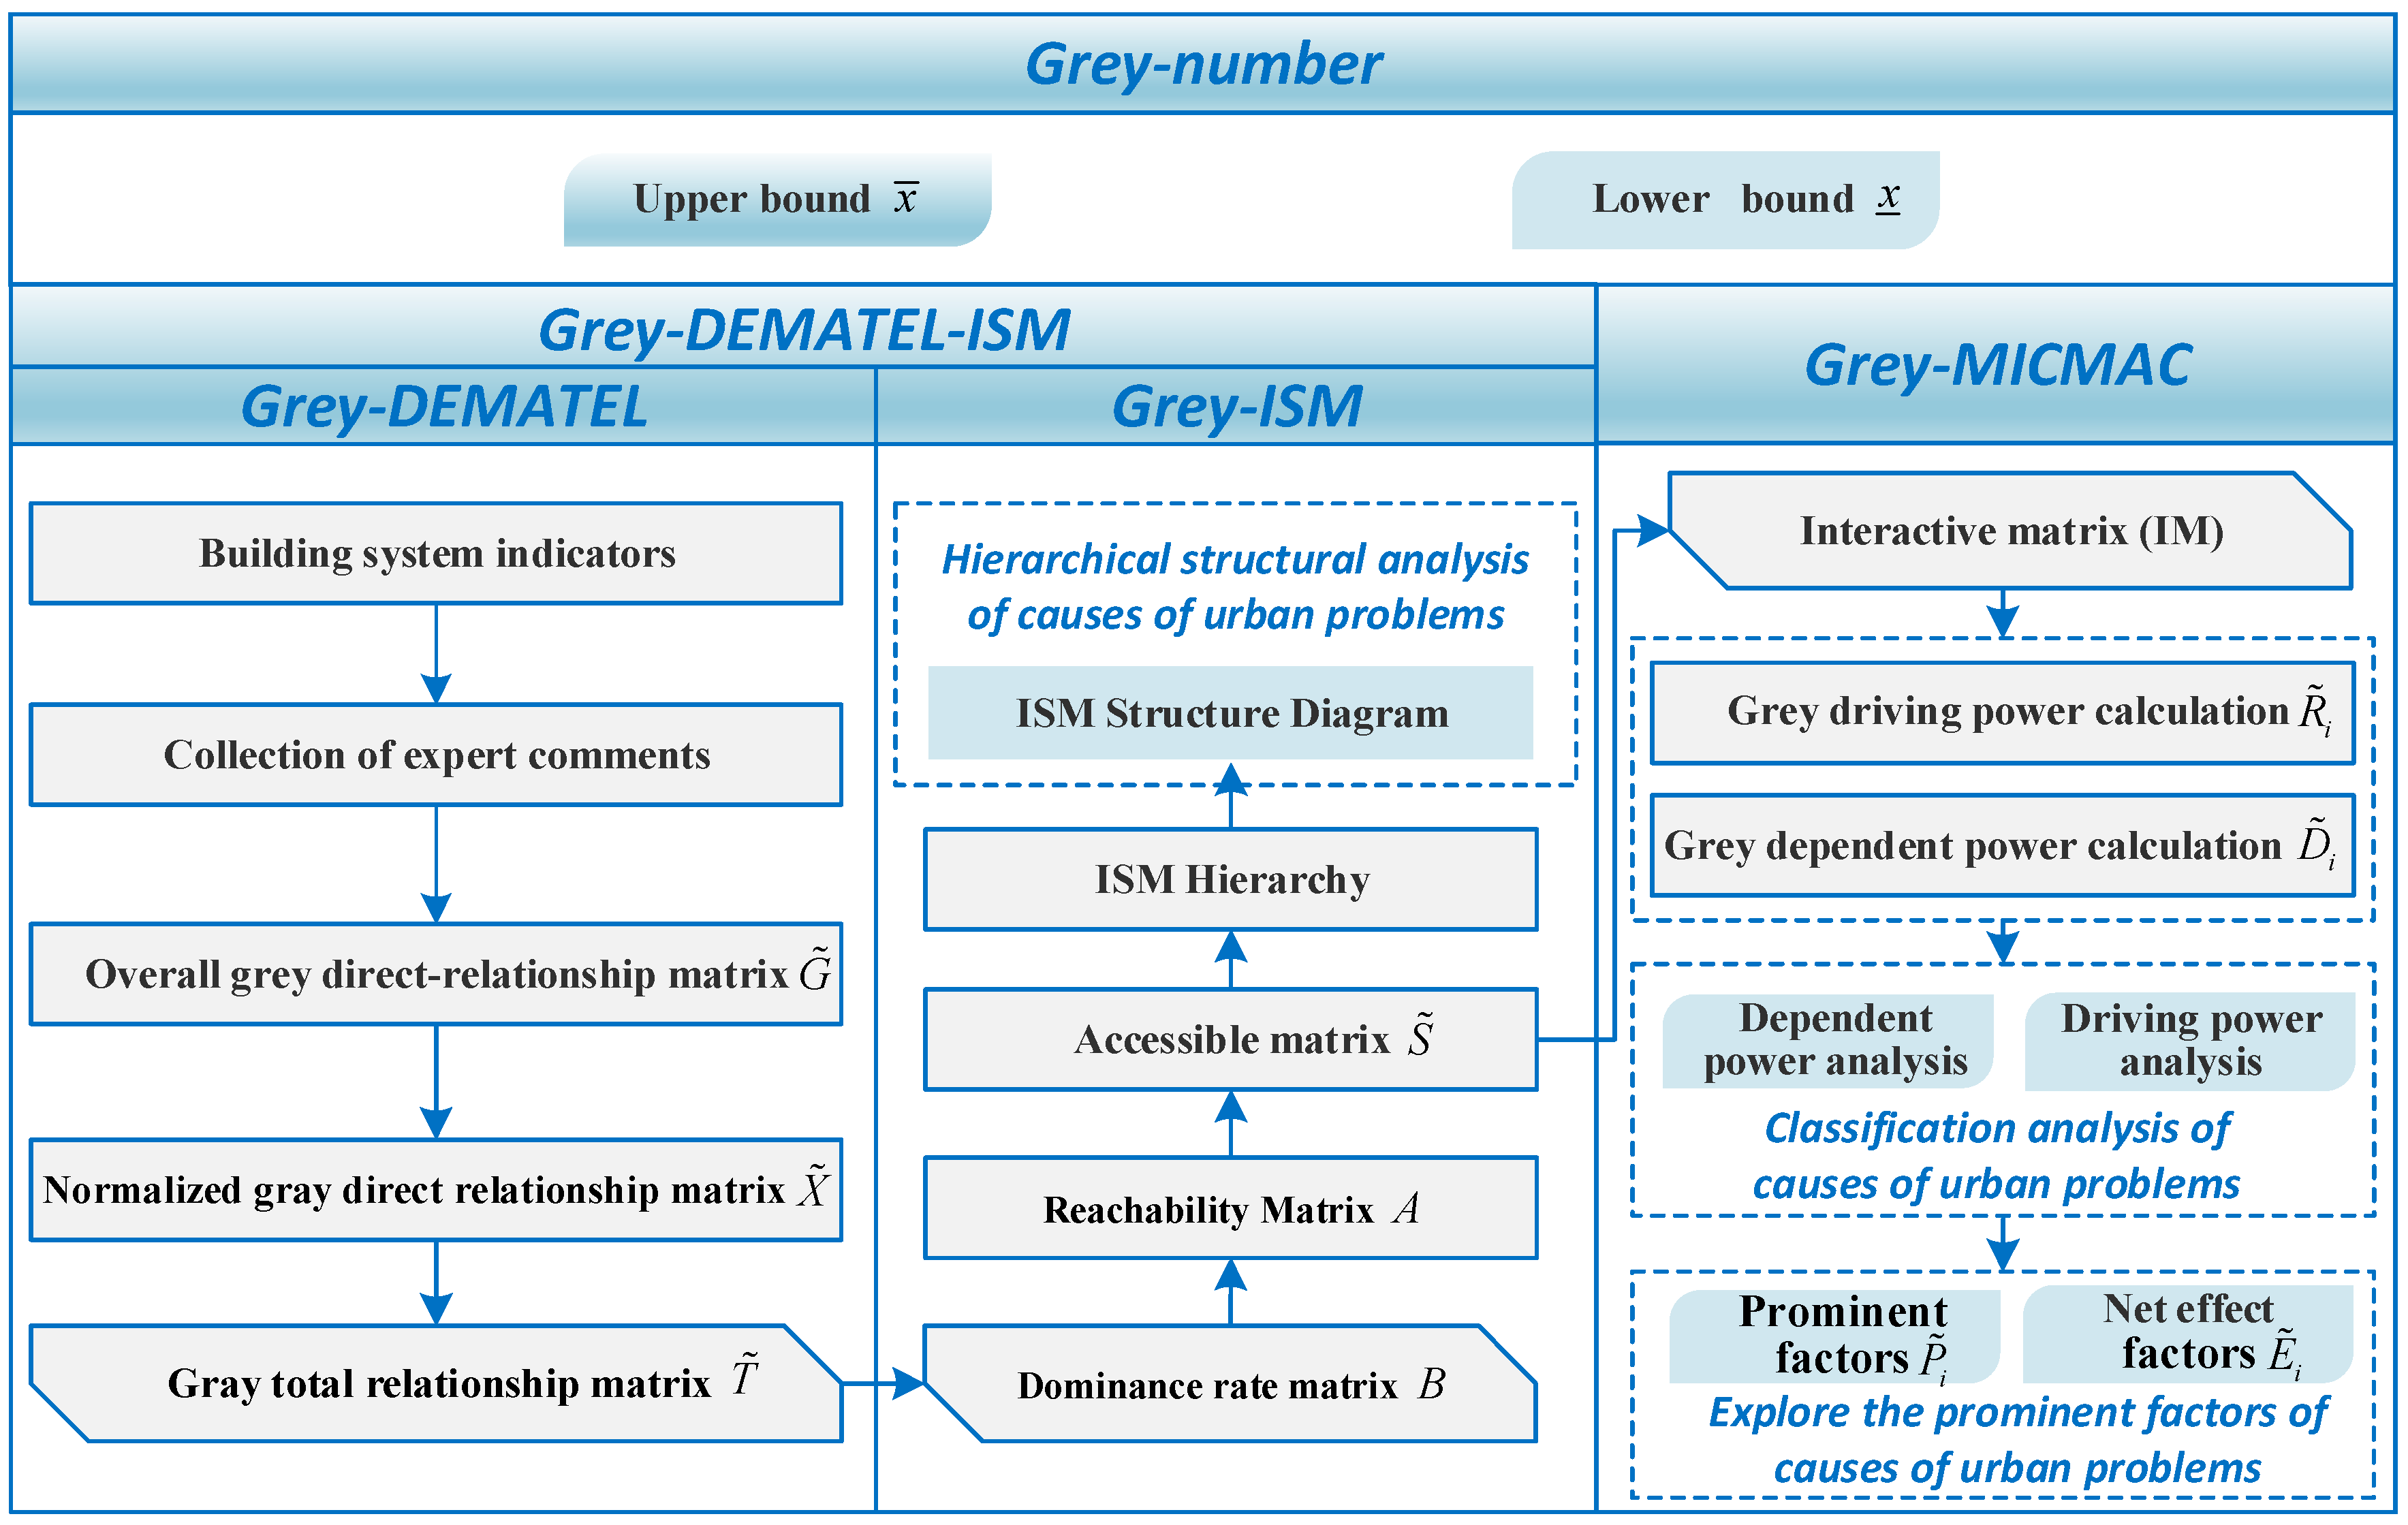
Figure 3.
Geographical location of Wuhan City.

Figure 4.
ISM grading framework for the causes of PPC in Wuhan.
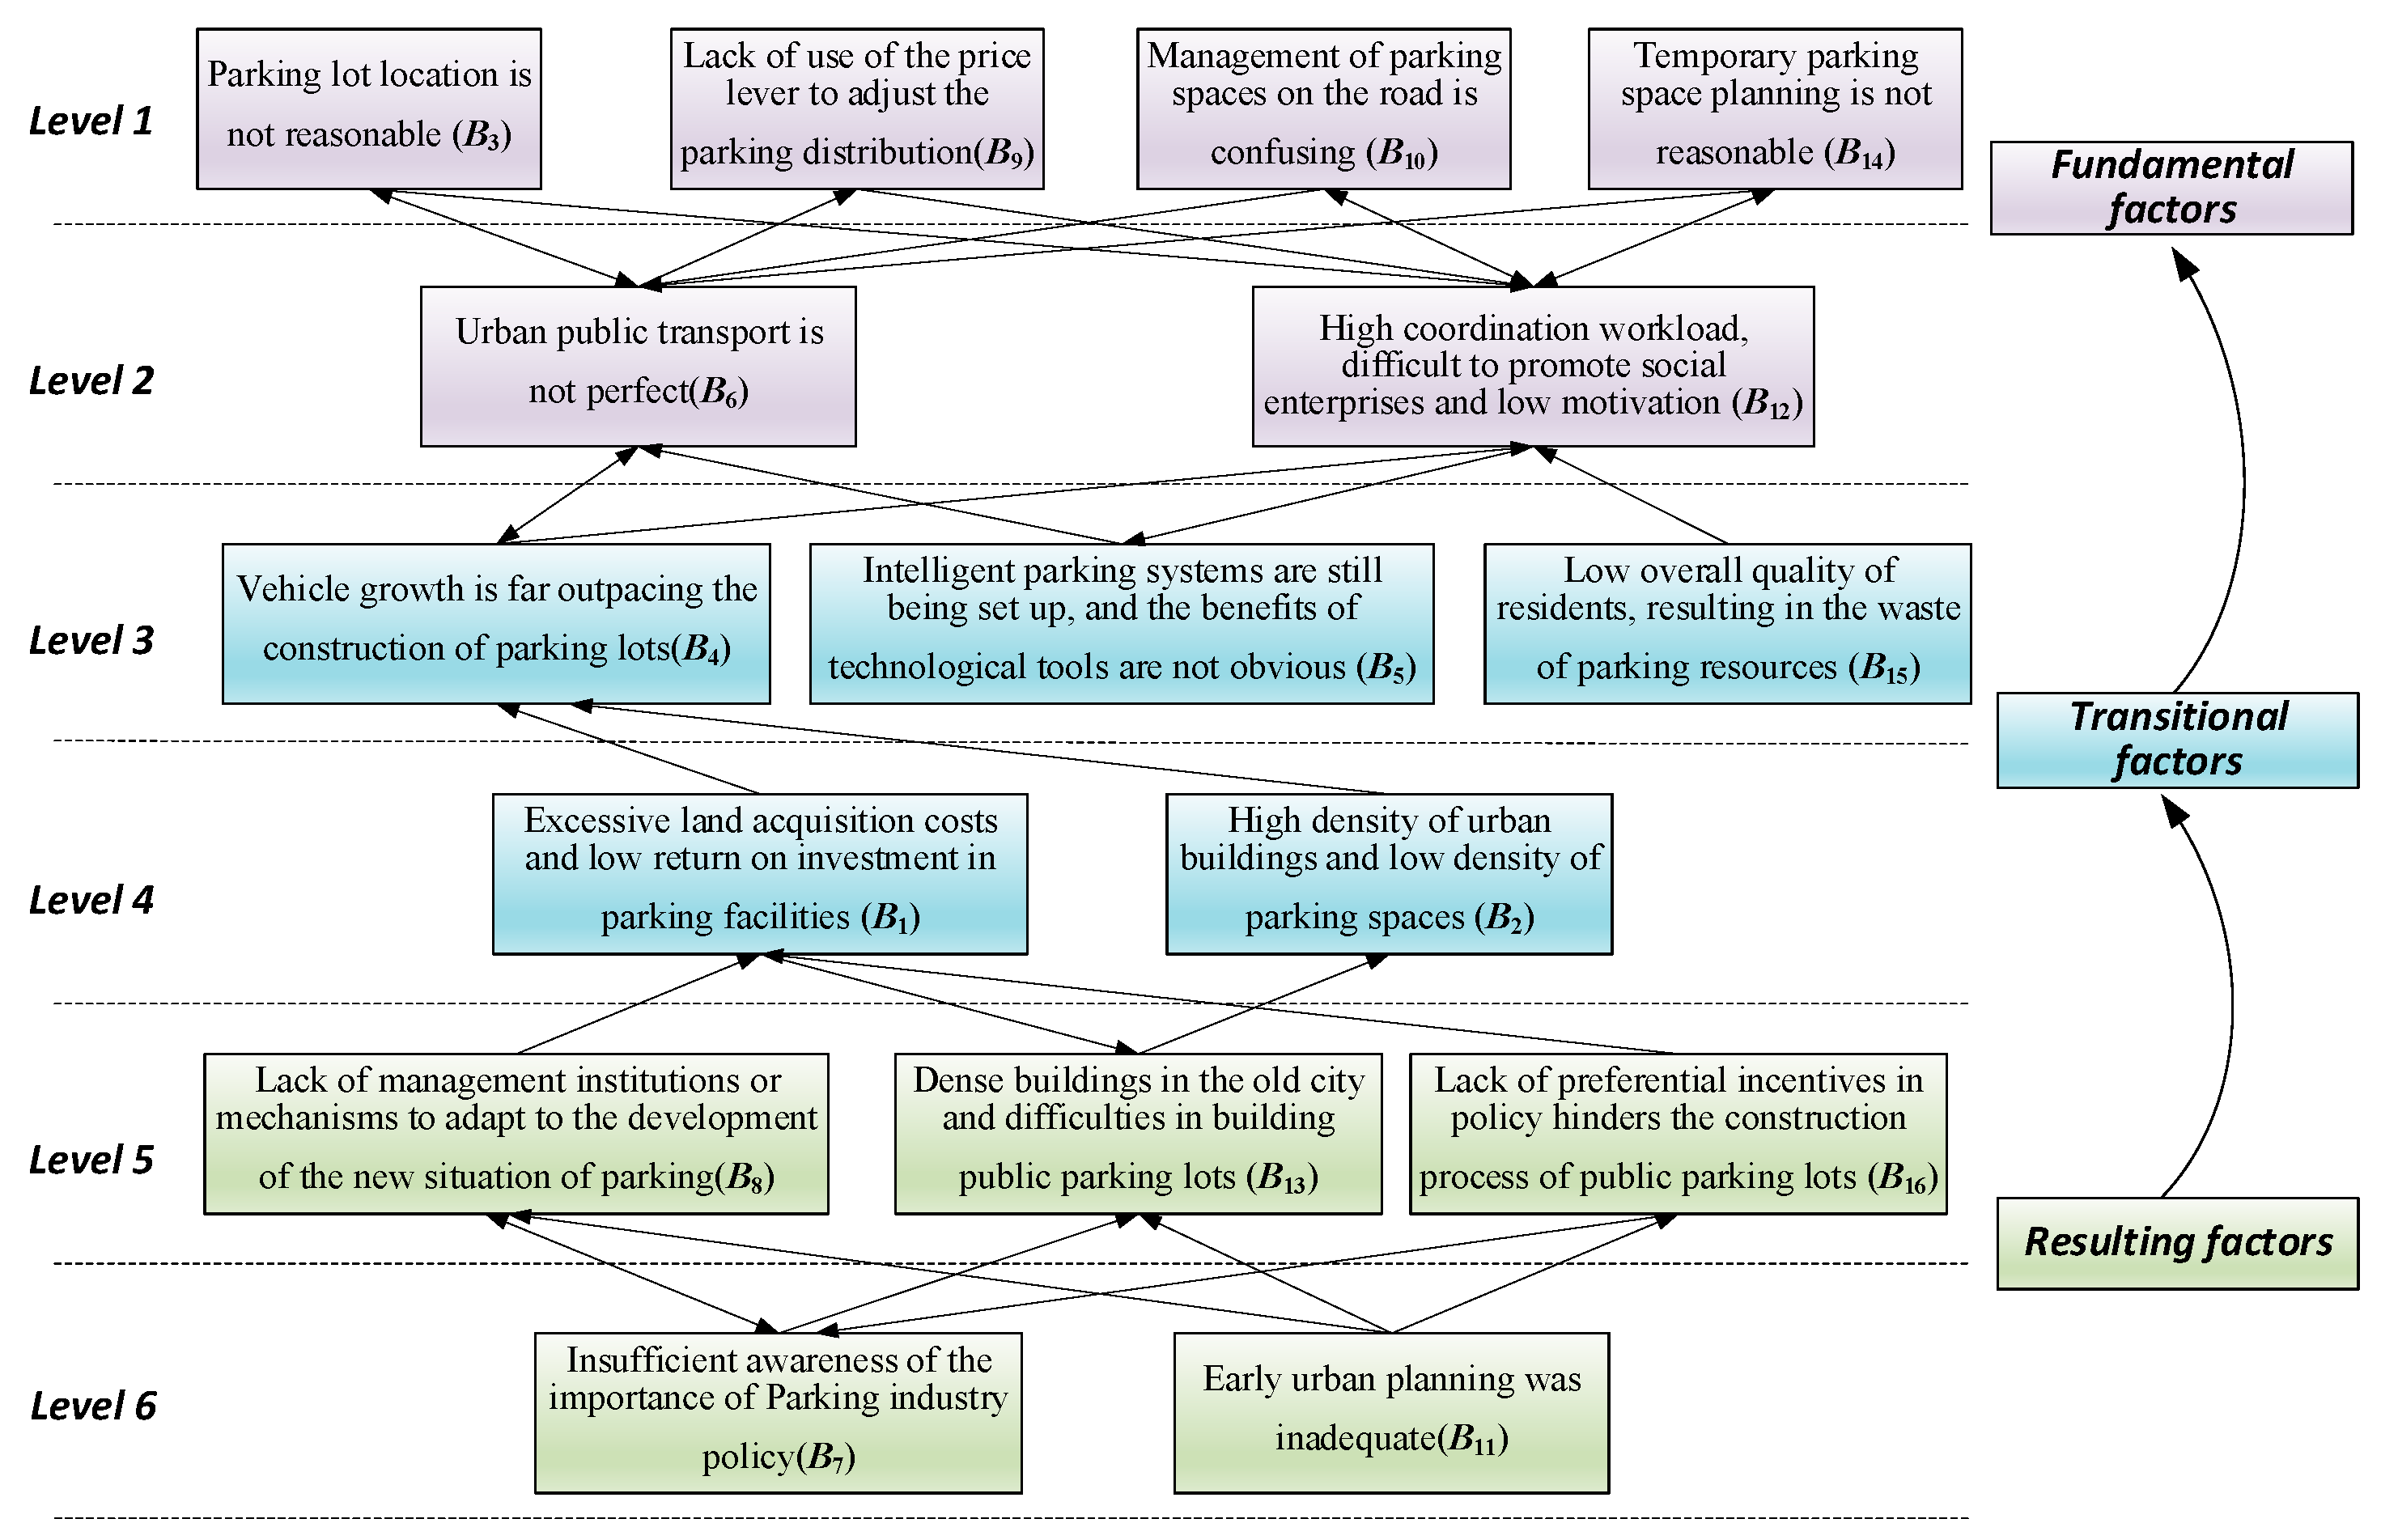
Figure 5.
MICMAC analysis of PPC problem causes.
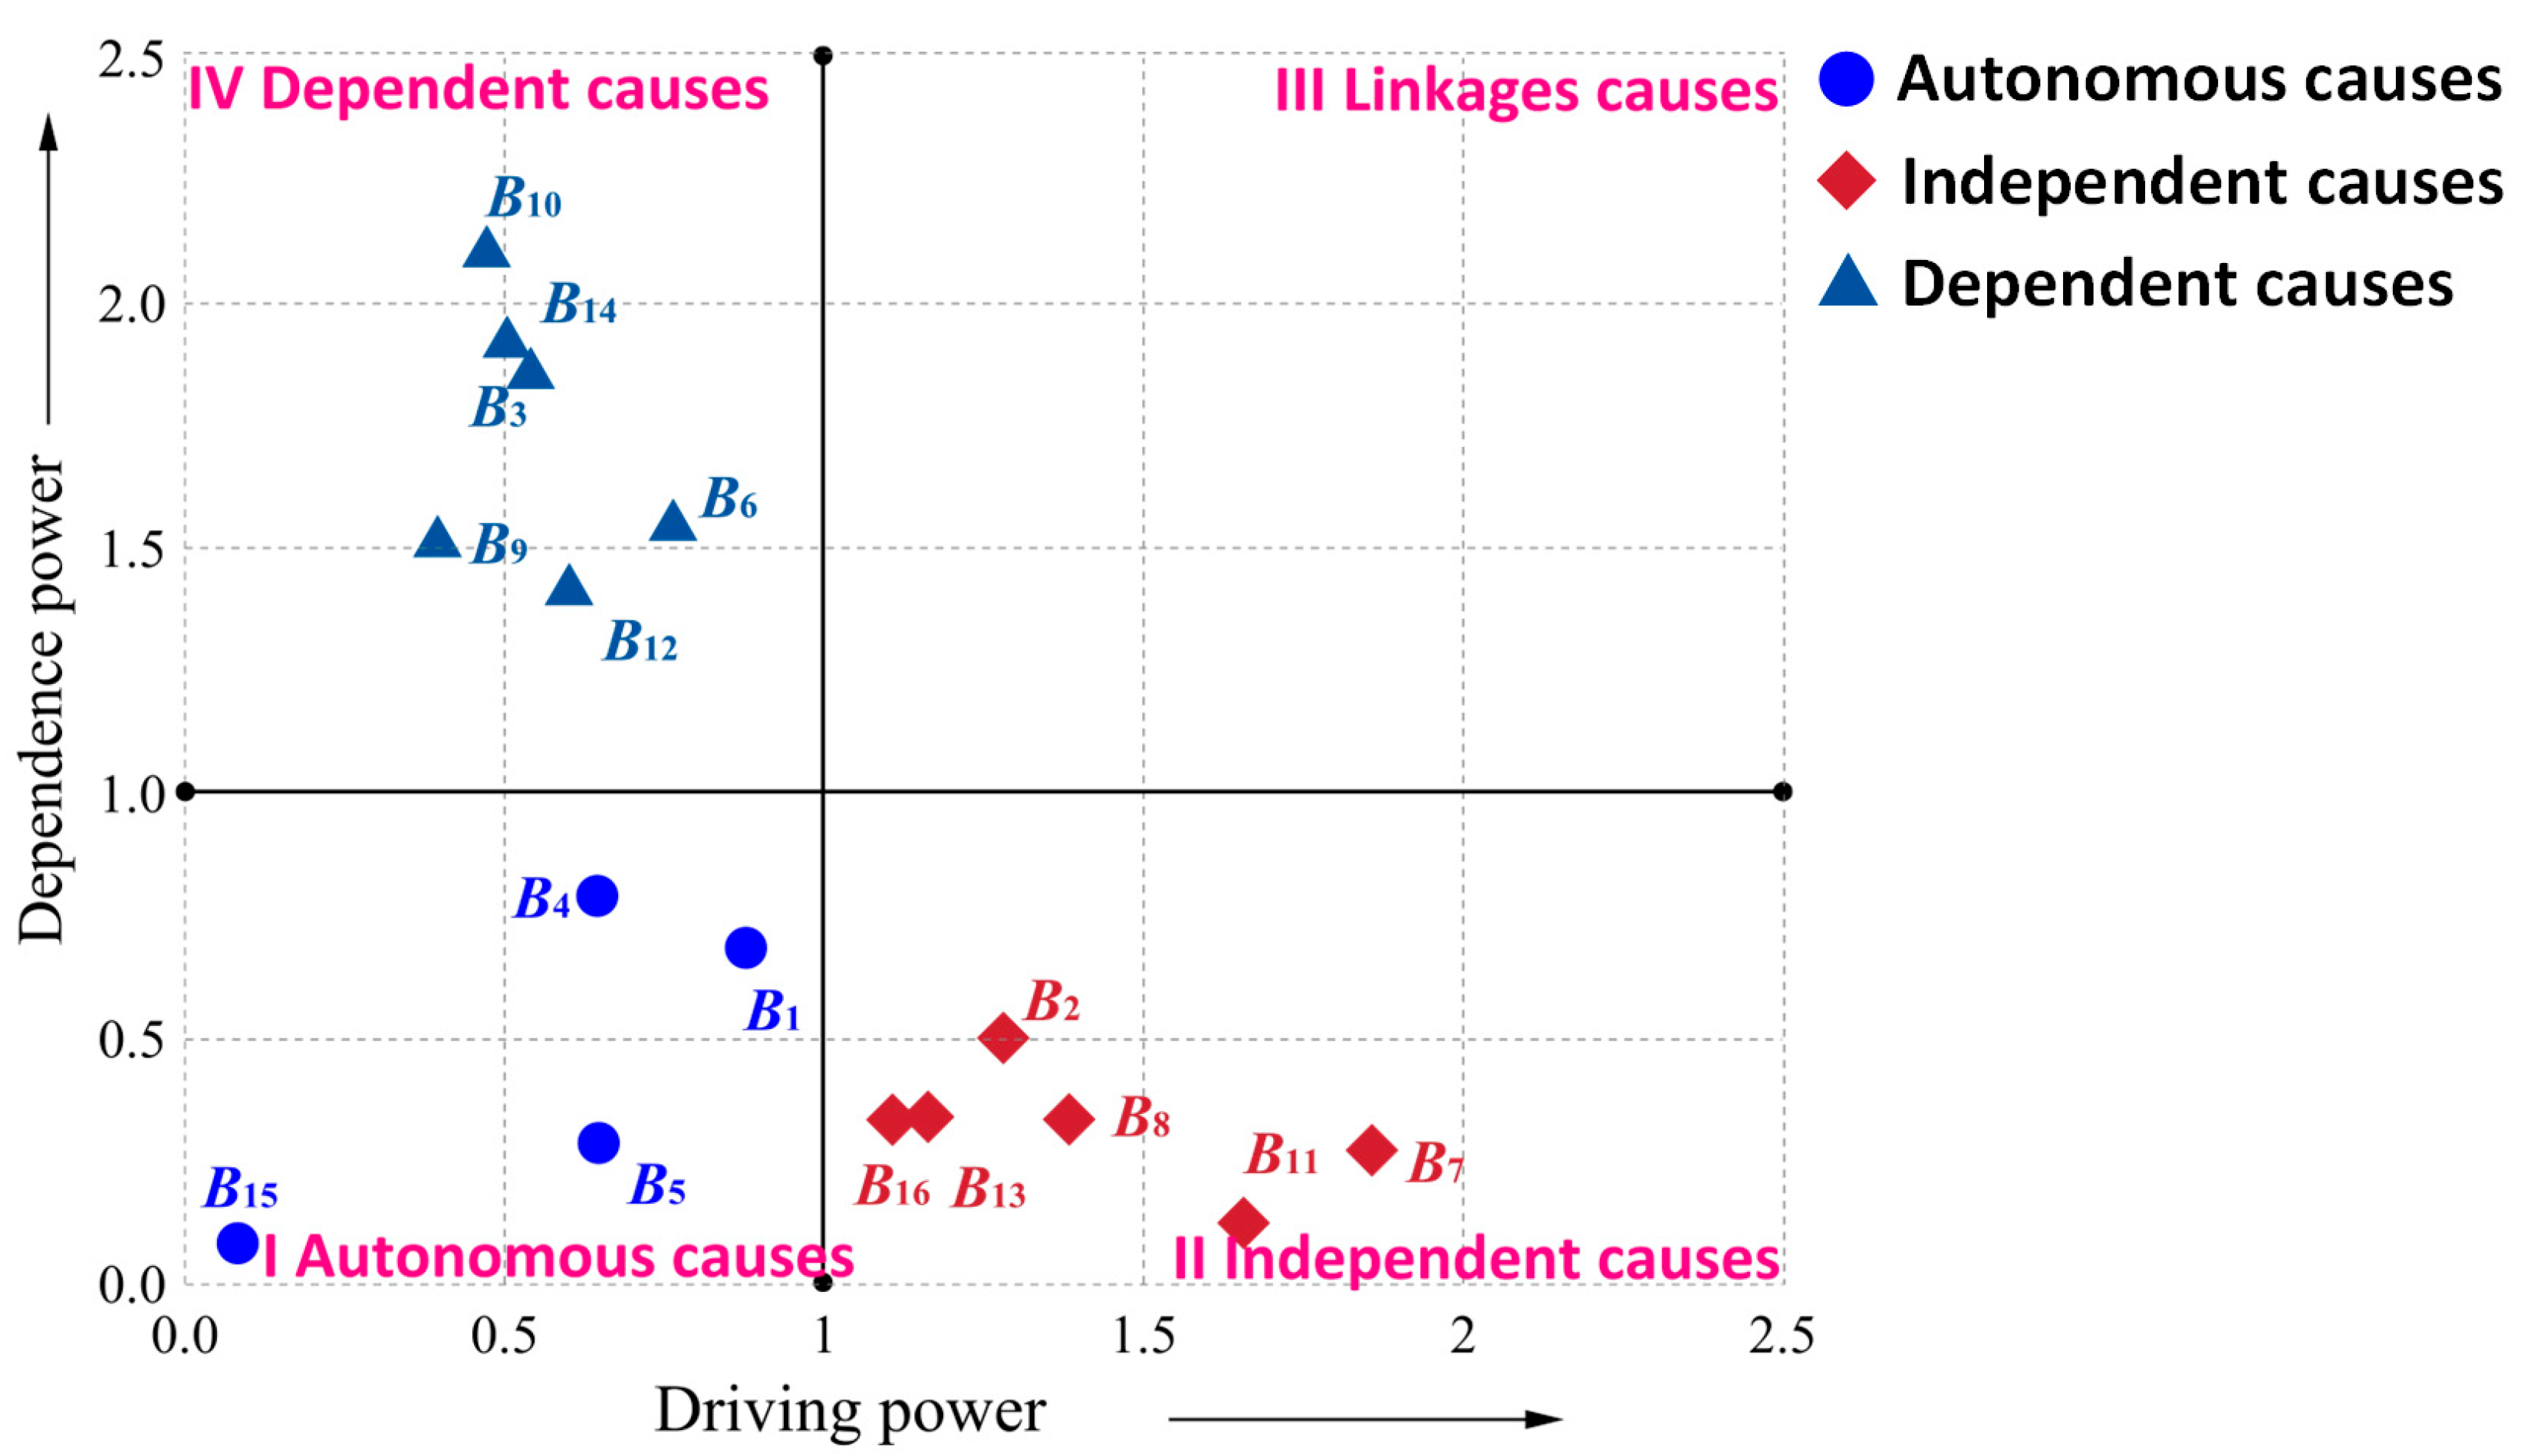
Figure 6.
Analysis of prominent factors.

Figure 7.
MICMAC causes classification without using Grey theory.

Table 1.
Research on the identification of urban problems.
| Sr. No | Material Used | Method | Identified Urban Problem | Year | Reference |
|---|---|---|---|---|---|
| 1. | Quantitative indicator-based examination and urban resident satisfaction survey | WM-TCM | Housing price, traffic operation efficiency, etc. | 2022 | [2] |
| 2. | Beijing flood-affected data | CAM | Flood problems | 2022 | [9] |
| 3. | Statistical summary of 172 articles | STA, SIA, SEA | Sustainability transitions | 2017 | [10] |
| 4. | Urban inductive loop detector data | CCT, CCG | Traffic congestion | 2018 | [11] |
| 5. | Urban blight data | CM, SD | Urban blight | 2021 | [12] |
| 6. | Rating of performance values of sub-criteria | Bipolar NS-DEMATEL | Urban sustainable development problem | 2020 | [13] |
| 7. | Pipeline blocking state recognition of unbalanced data | RF | Pipeline blockage | 2021 | [14] |
| 8. | Annual maximum daily rainfall data | MCDA | Flood problems | 2019 | [15] |
| 9. | Measurement index system result of the level of high-quality urban development in the central region | Dagum-Gini | Gap in the high-quality development of cities | 2023 | [16] |
| 10. | A real case of the municipality of Hamedan, Iran | GIS, BWM, MARCOS | Improper management of healthcare waste | 2021 | [17] |
| 11. | Multi-source spatial data in Beijing | SMM | Urban ecological carrying capacity | 2022 | [18] |
| 12. | Data on the water quality of Cikapundung River | FI | Urban river water quality | 2019 | [19] |
| 13. | Urban vacant land data in Chengdu, China | GIS, MGWR | Land vacancy problem | 2023 | [20] |
| 14. | Geospatial and statistical data | EM | Inefficiency in urban land use | 2020 | [21] |
| 15. | Land use spatial conflicts in the Urban Agglomeration around Hangzhou Bay | MLR, SAR, GWR | Land use conflict | 2019 | [22] |
| 16. | Data on carbon dioxide emissions in 41 typical cities in Southwest China | US | Urban sprawl on carbon dioxide emissions | 2022 | [23] |
| 17. | Comprehensive nationwide evaluation and intercomparison of published quantitative datasets | CEM | Non-degradable pollutants such as metals and metalloids | 2022 | [24] |
| 18. | Data on the expansion of the water network | OSTI | Use and development of the land and water | 2016 | [25] |
| 19. | Existing benefits and costs of different types of green roofs and green walls | RV, AAQ | Problems with urban densification | 2021 | [26] |
| 20. | Data on the land ecological risk | AHP, EM, CWM, TOPSIS, | Land ecological security status | 2023 | [27] |
| 21. | Satellite remote sensing (RS) historical data and geographic data | DTM | The growth of population, cities expand and encroach on forests and plants | 2022 | [28] |
| 22. | Meteorological data concerning wind speed and direction | ASM, PCA | Air pollution in urban-industrial areas | 2021 | [29] |
| 23. | Data on the leakage detection of urban water supply network | DBSCAN, MFCN | Unplanned nature of the water supply network | 2021 | [30] |
| 24. | Data on the intensity of land-use conflicts | LERA | Land-use conflicts problems | 2020 | [31] |
| 25. | 12345-hotline data collected in Sanya City | NLP, SMLM | Conventional top-down designed urban problem | 2022 | [32] |
Method: WM-TCM: Western Medicine method and Traditional Chinese Medicine method, CAM: Case Analysis method, STA: Socio-Technical Approach, SIA: Socio-Institutional Approach, SEA: Socio-Ecological Approach, CCT: Causal Congestion Trees, CCG: Causal Congestion Graphs, CM: Cognitive Maps, SD: System Dynamics, RF: Random Forest, MCDA: Multiple Criteria Decision Analysis, GIS: Geographic Information System, BWM: Best-Worst Method, MARCOS: Measurement of Alternatives and Ranking according to Compromise Solution, SMM: Spatial Model methods, FI: Field Interviews, MGWR: Multi-scale Geographically Weighted Regression, EM: Error Matrix, MLR: Multiple Linear Regression, SAR: Spatial Auto Regressive, GWR: Geographically Weighted Regression, US: Urban Sprawl model, CEM: Comprehensive Evaluation Method, OSTI: Open Satellite Time-series Imagery, RV: Results Variability, AAQ: Assessment of Average Quantification, AHP: Analytic Hierarchy Process, EM: Entropy method, CWM: Combination Weighting method, TOPSIS: Technique for Order Preference by Similarity to Ideal Solution, DTM: Digital Twin model, ASM: Application of Statistical methods, PCA: Principal Component Analysis, DBSCAN: Density Based Spatial Clustering of Applications with Noise, MFCN: Multiscale Fully Convolutional Networks, LERA: Landscape Ecological Risk Assessment, NLP: Natural Language Processing, SMLM: Supervised Machine Learning methods.
Table 3.
Grade grayscale.
| Linguistic Terms | Grey Numbers |
|---|---|
| No influence (N) | [0, 0] |
| Very low influence (VL) | [0, 0.25] |
| Low influence (L) | [0.25, 0.5] |
| High influence (H) | [0.5, 0.75] |
| Very high influence (VH) | [0.75, 1] |
Table 4.
Overall grey direct-relationship matrix.
| B1 | B2 | B3 | B4 | B5 | B6 | B7 | B8 | B9 | B10 | B11 | B12 | B13 | B14 | B15 | B16 | |
|---|---|---|---|---|---|---|---|---|---|---|---|---|---|---|---|---|
| B1 | (0, 0) | (0.417, 0.583) | (0.417, 0.667) | (0.417, 0.667) | (0.25, 0.5) | (0.333, 0.583) | (0.083, 0.167) | (0.167, 0.333) | (0.25, 0.5) | (0.333, 0.5) | (0, 0.083) | (0.167, 0.333) | (0.167, 0.333) | (0.333, 0.583) | (0.083, 0.167) | (0.083, 0.25) |
| B2 | (0.5, 0.75) | (0, 0) | (0.5, 0.75) | (0.583, 0.833) | (0, 0.25) | (0.5, 0.75) | (0.167, 0.25) | (0.083, 0.167) | (0.25, 0.5) | (0.583, 0.833) | (0.25, 0.417) | (0.25, 0.5) | (0.5, 0.667) | (0.667, 0.917) | (0.167, 0.25) | (0.167, 0.333) |
| B3 | (0.167, 0.333) | (0.167, 0.333) | (0, 0) | (0.083, 0.167) | (0.167, 0.333) | (0.333, 0.583) | (0.167, 0.333) | (0, 0.083) | (0.417, 0.667) | (0.583, 0.833) | (0.083, 0.167) | (0.083, 0.25) | (0.167, 0.333) | (0.5, 0.75) | (0.083, 0.167) | (0.083, 0.25) |
| B4 | (0, 0.083) | (0.083, 0.25) | (0.333, 0.583) | (0, 0) | (0.167, 0.333) | (0.25, 0.417) | (0.083, 0.25) | (0.083, 0.25) | (0.25, 0.417) | (0.583, 0.833) | (0, 0) | (0.25, 0.5) | (0.167, 0.333) | (0.417, 0.667) | (0.167, 0.25) | (0.083, 0.25) |
| B5 | (0, 0) | (0, 0.083) | (0.333, 0.583) | (0, 0.083) | (0, 0) | (0.333, 0.583) | (0.083, 0.25) | (0, 0.083) | (0.25, 0.417) | (0.667, 0.917) | (0.083, 0.167) | (0.25, 0.417) | (0.083, 0.25) | (0.5, 0.75) | (0.167, 0.333) | (0.083, 0.25) |
| B6 | (0.167, 0.333) | (0.167, 0.333) | (0.417, 0.667) | (0.5, 0.667) | (0.167, 0.333) | (0, 0) | (0.167, 0.333) | (0.167, 0.333) | (0.25, 0.417) | (0.333, 0.5) | (0.083, 0.167) | (0.417, 0.667) | (0.167, 0.333) | (0.5, 0.75) | (0.167, 0.333) | (0.167, 0.333) |
| B7 | (0.5, 0.75) | (0.167, 0.333) | (0.5, 0.75) | (0.333, 0.5) | (0.333, 0.5) | (0.333, 0.583) | (0, 0) | (0.583, 0.833) | (0.5, 0.75) | (0.583, 0.833) | (0.417, 0.667) | (0.417, 0.583) | (0.167, 0.333) | (0.5, 0.75) | (0.167, 0.333) | (0.667, 0.917) |
| B8 | (0.167, 0.417) | (0.083, 0.25) | (0.5, 0.75) | (0.25, 0.417) | (0.333, 0.5) | (0.5, 0.75) | (0.333, 0.5) | (0, 0) | (0.583, 0.833) | (0.583, 0.833) | (0.083, 0.25) | (0.5, 0.75) | (0.167, 0.333) | (0.583, 0.833) | (0.083, 0.25) | (0.333, 0.5) |
| B9 | (0.083, 0.25) | (0, 0.083) | (0.5, 0.75) | (0, 0) | (0.167, 0.333) | (0.333, 0.583) | (0, 0) | (0, 0) | (0, 0) | (0.333, 0.583) | (0.083, 0.167) | (0.25, 0.417) | (0, 0) | (0.25, 0.417) | (0, 0) | (0.083, 0.167) |
| B10 | (0.083, 0.25) | (0.083, 0.25) | (0.333, 0.5) | (0, 0.083) | (0.083, 0.25) | (0.25, 0.417) | (0, 0) | (0, 0) | (0.25, 0.417) | (0, 0) | (0.167, 0.25) | (0.333, 0.583) | (0.083, 0.167) | (0.417, 0.583) | (0.083, 0.25) | (0.083, 0.25) |
| B11 | (0.583, 0.833) | (0.667, 0.917) | (0.5, 0.75) | (0.333, 0.5) | (0.083, 0.167) | (0.333, 0.583) | (0.25, 0.417) | (0.333, 0.5) | (0.25, 0.417) | (0.583, 0.833) | (0, 0) | (0.25, 0.417) | (0.583, 0.833) | (0.417, 0.667) | (0.083, 0.25) | (0.25, 0.417) |
| B12 | (0.083, 0.25) | (0.167, 0.25) | (0.25, 0.417) | (0.25, 0.417) | (0.333, 0.5) | (0.333, 0.583) | (0.083, 0.25) | (0.333, 0.583) | (0.25, 0.5) | (0.25, 0.417) | (0.083, 0.167) | (0, 0) | (0, 0.083) | (0.25, 0.417) | (0, 0.083) | (0.083, 0.25) |
| B13 | (0.417, 0.583) | (0.75, 1) | (0.5, 0.75) | (0.25, 0.417) | (0, 0.083) | (0.5, 0.75) | (0.083, 0.25) | (0, 0.083) | (0.083, 0.25) | (0.583, 0.833) | (0.167, 0.25) | (0.417, 0.667) | (0, 0) | (0.5, 0.75) | (0, 0.083) | (0.083, 0.25) |
| B14 | (0, 0.083) | (0.167, 0.333) | (0.583, 0.833) | (0, 0.083) | (0, 0.083) | (0.167, 0.333) | (0.083, 0.25) | (0.083, 0.25) | (0.5, 0.667) | (0.667, 0.917) | (0.083, 0.167) | (0.25, 0.417) | (0.083, 0.167) | (0, 0) | (0, 0.083) | (0, 0.083) |
| B15 | (0, 0) | (0, 0) | (0, 0) | (0, 0) | (0, 0) | (0.167, 0.333) | (0.083, 0.167) | (0, 0) | (0.25, 0.417) | (0.167, 0.333) | (0, 0) | (0.417, 0.667) | (0, 0.083) | (0, 0.083) | (0, 0) | (0, 0.083) |
| B16 | (0.417, 0.667) | (0, 0.083) | (0.167, 0.417) | (0.25, 0.417) | (0.167, 0.333) | (0.417, 0.667) | (0.333, 0.5) | (0.417, 0.667) | (0.333, 0.583) | (0.333, 0.583) | (0, 0) | (0.5, 0.75) | (0.083, 0.25) | (0.417, 0.667) | (0, 0.083) | (0, 0) |
Table 5.
Normalized gray direct relationship matrix .
| B1 | B2 | B3 | B4 | B5 | B6 | B7 | B8 | B9 | B10 | B11 | B12 | B13 | B14 | B15 | B16 | |
|---|---|---|---|---|---|---|---|---|---|---|---|---|---|---|---|---|
| B1 | (0, 0) | (0.044, 0.062) | (0.044, 0.071) | (0.044, 0.071) | (0.027, 0.053) | (0.035, 0.062) | (0.009, 0.018) | (0.018, 0.035) | (0.027, 0.053) | (0.035, 0.053) | (0, 0.009) | (0.018, 0.035) | (0.018, 0.035) | (0.035, 0.062) | (0.009, 0.018) | (0.009, 0.027) |
| B2 | (0.053, 0.08) | (0, 0) | (0.053, 0.08) | (0.062, 0.088) | (0, 0.027) | (0.053, 0.08) | (0.018, 0.027) | (0.009, 0.018) | (0.027, 0.053) | (0.062, 0.088) | (0.027, 0.044) | (0.027, 0.053) | (0.053, 0.071) | (0.071, 0.097) | (0.018, 0.027) | (0.018, 0.035) |
| B3 | (0.018, 0.035) | (0.018, 0.035) | (0, 0) | (0.009, 0.018) | (0.018, 0.035) | (0.035, 0.062) | (0.018, 0.035) | (0, 0.009) | (0.044, 0.071) | (0.062, 0.088) | (0.009, 0.018) | (0.009, 0.027) | (0.018, 0.035) | (0.053, 0.08) | (0.009, 0.018) | (0.009, 0.027) |
| B4 | (0, 0.009) | (0.009, 0.027) | (0.035, 0.062) | (0, 0) | (0.018, 0.035) | (0.027, 0.044) | (0.009, 0.027) | (0.009, 0.027) | (0.027, 0.044) | (0.062, 0.088) | (0, 0) | (0.027, 0.053) | (0.018, 0.035) | (0.044, 0.071) | (0.018, 0.027) | (0.009, 0.027) |
| B5 | (0, 0) | (0, 0.009) | (0.035, 0.062) | (0, 0.009) | (0, 0) | (0.035, 0.062) | (0.009, 0.027) | (0, 0.009) | (0.027, 0.044) | (0.071, 0.097) | (0.009, 0.018) | (0.027, 0.044) | (0.009, 0.027) | (0.053, 0.08) | (0.018, 0.035) | (0.009, 0.027) |
| B6 | (0.018, 0.035) | (0.018, 0.035) | (0.044, 0.071) | (0.053, 0.071) | (0.018, 0.035) | (0, 0) | (0.018, 0.035) | (0.018, 0.035) | (0.027, 0.044) | (0.035, 0.053) | (0.009, 0.018) | (0.044, 0.071) | (0.018, 0.035) | (0.053, 0.08) | (0.018, 0.035) | (0.018, 0.035) |
| B7 | (0.053, 0.08) | (0.018, 0.035) | (0.053, 0.08) | (0.035, 0.053) | (0.035, 0.053) | (0.035, 0.062) | (0, 0) | (0.062, 0.088) | (0.053, 0.08) | (0.062, 0.088) | (0.044, 0.071) | (0.044, 0.062) | (0.018, 0.035) | (0.053, 0.08) | (0.018, 0.035) | (0.071, 0.097) |
| B8 | (0.018, 0.044) | (0.009, 0.027) | (0.053, 0.08) | (0.027, 0.044) | (0.035, 0.053) | (0.053, 0.08) | (0.035, 0.053) | (0, 0) | (0.062, 0.088) | (0.062, 0.088) | (0.009, 0.027) | (0.053, 0.08) | (0.018, 0.035) | (0.062, 0.088) | (0.009, 0.027) | (0.035, 0.053) |
| B9 | (0.009, 0.027) | (0, 0.009) | (0.053, 0.08) | (0, 0) | (0.018, 0.035) | (0.035, 0.062) | (0, 0) | (0, 0) | (0, 0) | (0.035, 0.062) | (0.009, 0.018) | (0.027, 0.044) | (0, 0) | (0.027, 0.044) | (0, 0) | (0.009, 0.018) |
| B10 | (0.009, 0.027) | (0.009, 0.027) | (0.035, 0.053) | (0, 0.009) | (0.009, 0.027) | (0.027, 0.044) | (0, 0) | (0, 0) | (0.027, 0.044) | (0, 0) | (0.018, 0.027) | (0.035, 0.062) | (0.009, 0.018) | (0.044, 0.062) | (0.009, 0.027) | (0.009, 0.027) |
| B11 | (0.062, 0.088) | (0.071, 0.097) | (0.053, 0.08) | (0.035, 0.053) | (0.009, 0.018) | (0.035, 0.062) | (0.027, 0.044) | (0.035, 0.053) | (0.027, 0.044) | (0.062, 0.088) | (0, 0) | (0.027, 0.044) | (0.062, 0.088) | (0.044, 0.071) | (0.009, 0.027) | (0.027, 0.044) |
| B12 | (0.009, 0.027) | (0.018, 0.027) | (0.027, 0.044) | (0.027, 0.044) | (0.035, 0.053) | (0.035, 0.062) | (0.009, 0.027) | (0.035, 0.062) | (0.027, 0.053) | (0.027, 0.044) | (0.009, 0.018) | (0, 0) | (0, 0.009) | (0.027, 0.044) | (0, 0.009) | (0.009, 0.027) |
| B13 | (0.044, 0.062) | (0.08, 0.106) | (0.053, 0.08) | (0.027, 0.044) | (0, 0.009) | (0.053, 0.08) | (0.009, 0.027) | (0, 0.009) | (0.009, 0.027) | (0.062, 0.088) | (0.018, 0.027) | (0.044, 0.071) | (0, 0) | (0.053, 0.08) | (0, 0.009) | (0.009, 0.027) |
| B14 | (0, 0.009) | (0.018, 0.035) | (0.062, 0.088) | (0, 0.009) | (0, 0.009) | (0.018, 0.035) | (0.009, 0.027) | (0.009, 0.027) | (0.053, 0.071) | (0.071, 0.097) | (0.009, 0.018) | (0.027, 0.044) | (0.009, 0.018) | (0, 0) | (0, 0.009) | (0, 0.009) |
| B15 | (0, 0) | (0, 0) | (0, 0) | (0, 0) | (0, 0) | (0.018, 0.035) | (0.009, 0.018) | (0, 0) | (0.027, 0.044) | (0.018, 0.035) | (0, 0) | (0.044, 0.071) | (0, 0.009) | (0, 0.009) | (0, 0) | (0, 0.009) |
| B16 | (0.044, 0.071) | (0, 0.009) | (0.018, 0.044) | (0.027, 0.044) | (0.018, 0.035) | (0.044, 0.071) | (0.035, 0.053) | (0.044, 0.071) | (0.035, 0.062) | (0.035, 0.062) | (0, 0) | (0.053, 0.08) | (0.009, 0.027) | (0.044, 0.071) | (0, 0.009) | (0, 0) |
Table 6.
The Grey total relationship matrix .
| B1 | B2 | B3 | B4 | B5 | B6 | B7 | B8 | B9 | B10 | B11 | B12 | B13 | B14 | B15 | B16 | |
|---|---|---|---|---|---|---|---|---|---|---|---|---|---|---|---|---|
| B1 | (0.01, 0.057) | (0.053, 0.114) | (0.066, 0.173) | (0.055, 0.124) | (0.034, 0.104) | (0.053, 0.153) | (0.016, 0.06) | (0.023, 0.076) | (0.044, 0.14) | (0.063, 0.171) | (0.006, 0.043) | (0.034, 0.121) | (0.026, 0.082) | (0.06, 0.168) | (0.014, 0.051) | (0.016, 0.074) |
| B2 | (0.067, 0.151) | (0.018, 0.077) | (0.086, 0.213) | (0.077, 0.158) | (0.012, 0.094) | (0.078, 0.196) | (0.027, 0.08) | (0.019, 0.074) | (0.052, 0.165) | (0.1, 0.237) | (0.035, 0.085) | (0.051, 0.163) | (0.065, 0.13) | (0.103, 0.231) | (0.024, 0.068) | (0.027, 0.097) |
| B3 | (0.026, 0.085) | (0.026, 0.083) | (0.021, 0.095) | (0.018, 0.066) | (0.024, 0.08) | (0.05, 0.141) | (0.022, 0.07) | (0.006, 0.047) | (0.059, 0.145) | (0.083, 0.187) | (0.015, 0.048) | (0.024, 0.103) | (0.024, 0.075) | (0.072, 0.17) | (0.013, 0.046) | (0.015, 0.069) |
| B4 | (0.007, 0.056) | (0.016, 0.071) | (0.052, 0.147) | (0.007, 0.044) | (0.024, 0.078) | (0.04, 0.121) | (0.013, 0.061) | (0.013, 0.061) | (0.041, 0.118) | (0.081, 0.183) | (0.005, 0.03) | (0.04, 0.125) | (0.023, 0.072) | (0.061, 0.157) | (0.021, 0.053) | (0.014, 0.066) |
| B5 | (0.006, 0.045) | (0.007, 0.052) | (0.052, 0.141) | (0.007, 0.05) | (0.006, 0.04) | (0.048, 0.131) | (0.013, 0.058) | (0.005, 0.043) | (0.04, 0.113) | (0.088, 0.184) | (0.014, 0.045) | (0.039, 0.112) | (0.014, 0.061) | (0.069, 0.159) | (0.021, 0.06) | (0.014, 0.064) |
| B6 | (0.027, 0.093) | (0.028, 0.091) | (0.067, 0.175) | (0.063, 0.124) | (0.027, 0.089) | (0.02, 0.097) | (0.025, 0.078) | (0.025, 0.08) | (0.046, 0.135) | (0.064, 0.173) | (0.015, 0.052) | (0.061, 0.157) | (0.026, 0.082) | (0.077, 0.186) | (0.022, 0.068) | (0.025, 0.085) |
| B7 | (0.071, 0.167) | (0.035, 0.119) | (0.092, 0.236) | (0.055, 0.137) | (0.051, 0.133) | (0.069, 0.203) | (0.014, 0.067) | (0.075, 0.154) | (0.085, 0.212) | (0.108, 0.263) | (0.053, 0.118) | (0.075, 0.193) | (0.032, 0.108) | (0.094, 0.24) | (0.025, 0.084) | (0.083, 0.168) |
| B8 | (0.031, 0.117) | (0.022, 0.096) | (0.084, 0.211) | (0.041, 0.113) | (0.048, 0.12) | (0.078, 0.196) | (0.044, 0.105) | (0.011, 0.058) | (0.087, 0.199) | (0.098, 0.234) | (0.018, 0.07) | (0.076, 0.187) | (0.028, 0.093) | (0.093, 0.221) | (0.015, 0.068) | (0.046, 0.114) |
| B9 | (0.014, 0.058) | (0.006, 0.041) | (0.064, 0.137) | (0.006, 0.033) | (0.023, 0.066) | (0.045, 0.113) | (0.004, 0.025) | (0.004, 0.026) | (0.011, 0.053) | (0.05, 0.128) | (0.012, 0.037) | (0.035, 0.092) | (0.005, 0.028) | (0.04, 0.106) | (0.003, 0.02) | (0.012, 0.045) |
| B10 | (0.015, 0.064) | (0.016, 0.063) | (0.049, 0.12) | (0.007, 0.046) | (0.014, 0.061) | (0.037, 0.104) | (0.004, 0.029) | (0.005, 0.03) | (0.038, 0.101) | (0.017, 0.078) | (0.021, 0.047) | (0.045, 0.116) | (0.014, 0.048) | (0.057, 0.129) | (0.011, 0.047) | (0.013, 0.056) |
| B11 | (0.08, 0.171) | (0.089, 0.176) | (0.09, 0.226) | (0.056, 0.136) | (0.022, 0.092) | (0.067, 0.193) | (0.038, 0.103) | (0.046, 0.113) | (0.055, 0.167) | (0.105, 0.25) | (0.011, 0.049) | (0.054, 0.166) | (0.076, 0.155) | (0.084, 0.222) | (0.017, 0.072) | (0.039, 0.113) |
| B12 | (0.016, 0.074) | (0.024, 0.071) | (0.045, 0.133) | (0.035, 0.09) | (0.042, 0.097) | (0.05, 0.139) | (0.015, 0.063) | (0.04, 0.097) | (0.041, 0.127) | (0.049, 0.143) | (0.014, 0.046) | (0.014, 0.075) | (0.007, 0.049) | (0.046, 0.135) | (0.004, 0.038) | (0.015, 0.069) |
| B13 | (0.058, 0.129) | (0.092, 0.167) | (0.081, 0.198) | (0.044, 0.113) | (0.01, 0.07) | (0.075, 0.183) | (0.017, 0.074) | (0.009, 0.06) | (0.032, 0.128) | (0.094, 0.219) | (0.026, 0.066) | (0.063, 0.166) | (0.013, 0.058) | (0.083, 0.201) | (0.007, 0.047) | (0.018, 0.082) |
| B14 | (0.008, 0.054) | (0.024, 0.076) | (0.077, 0.163) | (0.007, 0.049) | (0.007, 0.05) | (0.031, 0.105) | (0.013, 0.056) | (0.013, 0.057) | (0.065, 0.135) | (0.088, 0.18) | (0.014, 0.045) | (0.038, 0.107) | (0.015, 0.053) | (0.018, 0.082) | (0.003, 0.034) | (0.005, 0.047) |
| B15 | (0.002, 0.019) | (0.002, 0.017) | (0.007, 0.035) | (0.003, 0.019) | (0.004, 0.019) | (0.023, 0.065) | (0.01, 0.03) | (0.003, 0.017) | (0.031, 0.071) | (0.024, 0.07) | (0.002, 0.012) | (0.048, 0.097) | (0.001, 0.022) | (0.006, 0.043) | (0.001, 0.01) | (0.002, 0.025) |
| B16 | (0.053, 0.129) | (0.011, 0.068) | (0.044, 0.158) | (0.039, 0.104) | (0.029, 0.095) | (0.064, 0.168) | (0.042, 0.097) | (0.053, 0.118) | (0.056, 0.157) | (0.064, 0.185) | (0.007, 0.038) | (0.071, 0.17) | (0.017, 0.074) | (0.069, 0.183) | (0.005, 0.045) | (0.01, 0.055) |
Table 7.
Dominance probability rate matrix .
| B1 | B2 | B3 | B4 | B5 | B6 | B7 | B8 | B9 | B10 | B11 | B12 | B13 | B14 | B15 | B16 | |
|---|---|---|---|---|---|---|---|---|---|---|---|---|---|---|---|---|
| B1 | 18.30% | 60.67% | 78.88% | 64.55% | 49.62% | 70.21% | 21.50% | 33.50% | 63.82% | 76.98% | 6.38% | 55.36% | 37.63% | 75.30% | 14.36% | 30.48% |
| B2 | 76.01% | 32.57% | 91.21% | 82.67% | 38.85% | 86.65% | 36.87% | 31.23% | 71.74% | 98.59% | 41.86% | 70.98% | 71.03% | 100.00% | 29.08% | 44.48% |
| B3 | 39.02% | 38.17% | 41.86% | 25.94% | 35.79% | 66.39% | 29.45% | 10.00% | 71.09% | 88.32% | 12.20% | 46.00% | 33.11% | 81.03% | 10.25% | 27.08% |
| B4 | 17.48% | 28.68% | 68.72% | 0.00% | 34.82% | 57.44% | 21.56% | 22.11% | 56.84% | 86.99% | 0.00% | 58.42% | 30.89% | 74.46% | 17.47% | 25.47% |
| B5 | 8.76% | 14.34% | 67.29% | 12.42% | 4.32% | 63.21% | 19.87% | 6.38% | 55.19% | 90.91% | 8.69% | 54.42% | 21.99% | 78.16% | 22.73% | 23.65% |
| B6 | 42.82% | 42.15% | 79.59% | 68.62% | 41.14% | 42.16% | 35.01% | 36.36% | 63.64% | 78.03% | 15.26% | 74.26% | 37.48% | 84.99% | 28.27% | 38.36% |
| B7 | 80.17% | 55.20% | 94.66% | 67.59% | 65.23% | 82.94% | 25.81% | 80.86% | 90.79% | 100.00% | 62.08% | 84.67% | 50.41% | 95.71% | 38.17% | 86.69% |
| B8 | 52.81% | 42.43% | 90.32% | 55.23% | 60.41% | 86.30% | 53.95% | 19.42% | 90.97% | 97.59% | 28.27% | 85.03% | 43.13% | 95.11% | 26.60% | 57.71% |
| B9 | 20.11% | 5.22% | 72.25% | 0.00% | 27.09% | 56.99% | 0.00% | 0.00% | 15.39% | 63.30% | 0.75% | 45.17% | 0.00% | 52.65% | 0.00% | 9.07% |
| B10 | 23.91% | 23.55% | 61.01% | 9.38% | 21.60% | 51.07% | 0.00% | 0.00% | 50.06% | 32.81% | 12.08% | 57.75% | 12.27% | 67.02% | 10.49% | 18.44% |
| B11 | 85.41% | 90.87% | 93.65% | 68.06% | 41.01% | 81.27% | 50.49% | 57.53% | 73.34% | 100.00% | 12.53% | 72.67% | 81.57% | 90.73% | 29.59% | 54.41% |
| B12 | 30.53% | 30.60% | 62.50% | 44.11% | 50.17% | 65.76% | 23.21% | 49.07% | 59.72% | 66.42% | 10.15% | 30.24% | 12.19% | 63.57% | 1.84% | 27.06% |
| B13 | 67.20% | 92.32% | 88.23% | 56.41% | 26.95% | 84.20% | 30.83% | 20.54% | 56.30% | 95.48% | 28.04% | 76.62% | 19.57% | 89.33% | 10.48% | 35.00% |
| B14 | 16.02% | 33.44% | 83.08% | 12.30% | 12.56% | 49.23% | 18.27% | 18.63% | 72.31% | 90.33% | 8.76% | 52.23% | 15.81% | 35.07% | 0.00% | 9.74% |
| B15 | 0.00% | 0.00% | 0.00% | 0.00% | 0.00% | 26.52% | 0.00% | 0.00% | 32.96% | 29.91% | 0.00% | 52.79% | 0.00% | 6.40% | 0.00% | 0.00% |
| B16 | 65.04% | 25.66% | 67.25% | 51.47% | 44.51% | 77.14% | 50.16% | 62.22% | 72.12% | 79.28% | 1.55% | 80.88% | 30.79% | 81.36% | 8.04% | 16.77% |
Table 8.
Reachability Matrix .
| B1 | B2 | B3 | B4 | B5 | B6 | B7 | B8 | B9 | B10 | B11 | B12 | B13 | B14 | B15 | B16 | |
|---|---|---|---|---|---|---|---|---|---|---|---|---|---|---|---|---|
| B1 | 1 | 1 | 1 | 1 | 0 | 1 | 0 | 0 | 1 | 1 | 0 | 1 | 0 | 1 | 0 | 0 |
| B2 | 1 | 1 | 1 | 1 | 0 | 1 | 0 | 0 | 1 | 1 | 0 | 1 | 1 | 1 | 0 | 0 |
| B3 | 0 | 0 | 1 | 0 | 0 | 1 | 0 | 0 | 1 | 1 | 0 | 0 | 0 | 1 | 0 | 0 |
| B4 | 0 | 0 | 1 | 1 | 0 | 1 | 0 | 0 | 1 | 1 | 0 | 1 | 0 | 1 | 0 | 0 |
| B5 | 0 | 0 | 1 | 0 | 1 | 1 | 0 | 0 | 1 | 1 | 0 | 1 | 0 | 1 | 0 | 0 |
| B6 | 0 | 0 | 1 | 1 | 0 | 1 | 0 | 0 | 1 | 1 | 0 | 1 | 0 | 1 | 0 | 0 |
| B7 | 1 | 1 | 1 | 1 | 1 | 1 | 1 | 1 | 1 | 1 | 1 | 1 | 1 | 1 | 0 | 1 |
| B8 | 1 | 0 | 1 | 1 | 1 | 1 | 1 | 1 | 1 | 1 | 0 | 1 | 0 | 1 | 0 | 1 |
| B9 | 0 | 0 | 1 | 0 | 0 | 1 | 0 | 0 | 1 | 1 | 0 | 0 | 0 | 1 | 0 | 0 |
| B10 | 0 | 0 | 1 | 0 | 0 | 1 | 0 | 0 | 1 | 1 | 0 | 1 | 0 | 1 | 0 | 0 |
| B11 | 1 | 1 | 1 | 1 | 0 | 1 | 1 | 1 | 1 | 1 | 1 | 1 | 1 | 1 | 0 | 1 |
| B12 | 0 | 0 | 1 | 0 | 1 | 1 | 0 | 0 | 1 | 1 | 0 | 1 | 0 | 1 | 0 | 0 |
| B13 | 1 | 1 | 1 | 1 | 0 | 1 | 0 | 0 | 1 | 1 | 0 | 1 | 1 | 1 | 0 | 0 |
| B14 | 0 | 0 | 1 | 0 | 0 | 0 | 0 | 0 | 1 | 1 | 0 | 1 | 0 | 1 | 0 | 0 |
| B15 | 0 | 0 | 0 | 0 | 0 | 0 | 0 | 0 | 0 | 0 | 0 | 1 | 0 | 0 | 1 | 0 |
| B16 | 1 | 0 | 1 | 1 | 0 | 1 | 1 | 1 | 1 | 1 | 0 | 1 | 0 | 1 | 0 | 1 |
Table 9.
Accessibility matrix .
| B1 | B2 | B3 | B4 | B5 | B6 | B7 | B8 | B9 | B10 | B11 | B12 | B13 | B14 | B15 | B16 | |
|---|---|---|---|---|---|---|---|---|---|---|---|---|---|---|---|---|
| B1 | (0.01, 0.057) | (0.053, 0.114) | (0.066, 0.173) | (0.055, 0.124) | (0, 0) | (0.053, 0.153) | (0, 0) | (0, 0) | (0.044, 0.14) | (0.063, 0.171) | (0, 0) | (0.034, 0.121) | (0, 0) | (0.06, 0.168) | (0, 0) | (0, 0) |
| B2 | (0.067, 0.151) | (0.018, 0.077) | (0.086, 0.213) | (0.077, 0.158) | (0, 0) | (0.078, 0.196) | (0, 0) | (0, 0) | (0.052, 0.165) | (0.1, 0.237) | (0, 0) | (0.051, 0.163) | (0.065, 0.13) | (0.103, 0.231) | (0, 0) | (0, 0) |
| B3 | (0, 0) | (0, 0) | (0.021, 0.095) | (0, 0) | (0, 0) | (0.05, 0.141) | (0, 0) | (0, 0) | (0.059, 0.145) | (0.083, 0.187) | (0, 0) | (0, 0) | (0, 0) | (0.072, 0.17) | (0, 0) | (0, 0) |
| B4 | (0, 0) | (0, 0) | (0.052, 0.147) | (0.007, 0.044) | (0, 0) | (0.04, 0.121) | (0, 0) | (0, 0) | (0.041, 0.118) | (0.081, 0.183) | (0, 0) | (0.04, 0.125) | (0, 0) | (0.061, 0.157) | (0, 0) | (0, 0) |
| B5 | (0, 0) | (0, 0) | (0.052, 0.141) | (0, 0) | (0.006, 0.04) | (0.048, 0.131) | (0, 0) | (0, 0) | (0.04, 0.113) | (0.088, 0.184) | (0, 0) | (0.039, 0.112) | (0, 0) | (0.069, 0.159) | (0, 0) | (0, 0) |
| B6 | (0, 0) | (0, 0) | (0.067, 0.175) | (0.063, 0.124) | (0, 0) | (0.02, 0.097) | (0, 0) | (0, 0) | (0.046, 0.135) | (0.064, 0.173) | (0, 0) | (0.061, 0.157) | (0, 0) | (0.077, 0.186) | (0, 0) | (0, 0) |
| B7 | (0.071, 0.167) | (0.035, 0.119) | (0.092, 0.236) | (0.055, 0.137) | (0.051, 0.133) | (0.069, 0.203) | (0.014, 0.067) | (0.075, 0.154) | (0.085, 0.212) | (0.108, 0.263) | (0.053, 0.118) | (0.075, 0.193) | (0.032, 0.108) | (0.094, 0.24) | (0, 0) | (0.083, 0.168) |
| B8 | (0.031, 0.117) | (0, 0) | (0.084, 0.211) | (0.041, 0.113) | (0.048, 0.12) | (0.078, 0.196) | (0.044, 0.105) | (0.011, 0.058) | (0.087, 0.199) | (0.098, 0.234) | (0, 0) | (0.076, 0.187) | (0, 0) | (0.093, 0.221) | (0, 0) | (0.046, 0.114) |
| B9 | (0, 0) | (0, 0) | (0.064, 0.137) | (0, 0) | (0, 0) | (0.045, 0.113) | (0, 0) | (0, 0) | (0.011, 0.053) | (0.05, 0.128) | (0, 0) | (0, 0) | (0, 0) | (0.04, 0.106) | (0, 0) | (0, 0) |
| B10 | (0, 0) | (0, 0) | (0.049, 0.12) | (0, 0) | (0, 0) | (0.037, 0.104) | (0, 0) | (0, 0) | (0.038, 0.101) | (0.017, 0.078) | (0, 0) | (0.045, 0.116) | (0, 0) | (0.057, 0.129) | (0, 0) | (0, 0) |
| B11 | (0.08, 0.171) | (0.089, 0.176) | (0.09, 0.226) | (0.056, 0.136) | (0, 0) | (0.067, 0.193) | (0.038, 0.103) | (0.046, 0.113) | (0.055, 0.167) | (0.105, 0.25) | (0.011, 0.049) | (0.054, 0.166) | (0.076, 0.155) | (0.084, 0.222) | (0, 0) | (0.039, 0.113) |
| B12 | (0, 0) | (0, 0) | (0.045, 0.133) | (0, 0) | (0.042, 0.097) | (0.05, 0.139) | (0, 0) | (0, 0) | (0.041, 0.127) | (0.049, 0.143) | (0, 0) | (0.014, 0.075) | (0, 0) | (0.046, 0.135) | (0, 0) | (0, 0) |
| B13 | (0.058, 0.129) | (0.092, 0.167) | (0.081, 0.198) | (0.044, 0.113) | (0, 0) | (0.075, 0.183) | (0, 0) | (0, 0) | (0.032, 0.128) | (0.094, 0.219) | (0, 0) | (0.063, 0.166) | (0.013, 0.058) | (0.083, 0.201) | (0, 0) | (0, 0) |
| B14 | (0, 0) | (0, 0) | (0.077, 0.163) | (0, 0) | (0, 0) | (0, 0) | (0, 0) | (0, 0) | (0.065, 0.135) | (0.088, 0.18) | (0, 0) | (0.038, 0.107) | (0, 0) | (0.018, 0.082) | (0, 0) | (0, 0) |
| B15 | (0, 0) | (0, 0) | (0, 0) | (0, 0) | (0, 0) | (0, 0) | (0, 0) | (0, 0) | (0, 0) | (0, 0) | (0, 0) | (0.048, 0.097) | (0, 0) | (0, 0) | (0.001, 0.01) | (0, 0) |
| B16 | (0.053, 0.129) | (0, 0) | (0.044, 0.158) | (0.039, 0.104) | (0, 0) | (0.064, 0.168) | (0.042, 0.097) | (0.053, 0.118) | (0.056, 0.157) | (0.064, 0.185) | (0, 0) | (0.071, 0.17) | (0, 0) | (0.069, 0.183) | (0, 0) | (0.01, 0.055) |
Table 10.
Reachable set, antecedent set, and intersection.
| Reachability Set | Antecedent Set | Intersection Level | Level | |
|---|---|---|---|---|
| B1 | 1, 2, 3, 4, 6, 9, 10, 12, 14 | 1, 2, 7, 8, 11, 13, 16 | 1, 2 | L4 |
| B2 | 1, 2, 3, 4, 6, 9, 10, 12, 13, 14 | 1, 2, 7, 11, 13 | 1, 2, 13 | L4 |
| B3 | 3, 6, 9, 10, 14 | 1, 2, 3, 4, 5, 6, 7, 8, 9, 10, 11, 12, 13, 14, 16 | 3, 6, 9, 10, 14 | L1 |
| B4 | 3, 4, 6, 9, 10, 12, 14 | 1, 2, 4, 6, 7, 8, 11, 13, 16 | 4, 6 | L3 |
| B5 | 3, 5, 6, 9, 10, 12, 14 | 5, 7, 8, 12 | 12, 5 | L3 |
| B6 | 3, 4, 6, 9, 10, 12, 14 | 1, 2, 3, 4, 5, 6, 7, 8, 9, 10, 11, 12, 13, 16 | 3, 4, 6, 9, 10, 12 | L2 |
| B7 | 1, 2, 3, 4, 5, 6, 7, 8, 9, 10, 11, 12, 13, 14, 16 | 7, 8, 11, 16 | 8, 16, 11, 7 | L6 |
| B8 | 1, 3, 4, 5, 6, 7, 8, 9, 10, 12, 14, 16 | 7, 8, 11, 16 | 8, 16, 7 | L5 |
| B9 | 3, 6, 9, 10, 14 | 1, 2, 3, 4, 5, 6, 7, 8, 9, 10, 11, 12, 13, 14, 16 | 3, 6, 9, 10, 14 | L1 |
| B10 | 3, 6, 9, 10, 12, 15 | 1, 2, 3, 4, 5, 6, 7, 8, 9, 10, 11, 12, 13, 14, 16 | 3, 6, 9, 10, 12, 14 | L1 |
| B11 | 1, 2, 3, 4, 6, 7, 8, 9, 10, 11, 12, 13, 14, 16 | 7, 11 | 11, 7 | L6 |
| B12 | 3, 5, 6, 9, 10, 12, 14 | 1, 2, 4, 5, 6, 7, 8, 10, 11, 12, 13, 14, 15, 16 | 5, 6, 10, 12, 14 | L2 |
| B13 | 1, 2, 3, 4, 6, 9, 10, 12, 13, 14 | 2, 7, 11, 13 | 2, 13 | L5 |
| B14 | 3, 9, 10, 12, 14 | 1, 2, 3, 4, 5, 6, 7, 8, 9, 10, 11, 12, 13, 14, 16 | 3, 9, 10, 12, 14 | L1 |
| B15 | 12, 15 | 15 | 15 | L3 |
| B16 | 1, 3, 4, 6, 7, 8, 9, 10, 12, 14, 16 | 7, 8, 11, 16 | 8, 16, 7 | L5 |
Table 11.
Driving power , Dependence power , and their defuzzification.
| Driving Power | Dependence Power | Driving Power | Dependence Power | |
|---|---|---|---|---|
| B1 | (0.437, 1.221) | (0.369, 0.92) | 0.879 | 0.683 |
| B2 | (0.698, 1.72) | (0.287, 0.654) | 1.282 | 0.499 |
| B3 | (0.284, 0.738) | (0.972, 2.525) | 0.542 | 1.853 |
| B4 | (0.323, 0.895) | (0.436, 1.052) | 0.646 | 0.789 |
| B5 | (0.342, 0.881) | (0.147, 0.391) | 0.648 | 0.285 |
| B6 | (0.398, 1.046) | (0.773, 2.138) | 0.765 | 1.543 |
| B7 | (0.991, 2.517) | (0.138, 0.372) | 1.859 | 0.270 |
| B8 | (0.737, 1.876) | (0.186, 0.443) | 1.385 | 0.333 |
| B9 | (0.21, 0.537) | (0.753, 2.096) | 0.396 | 1.510 |
| B10 | (0.243, 0.649) | (1.152, 2.814) | 0.473 | 2.102 |
| B11 | (0.89, 2.239) | (0.064, 0.167) | 1.658 | 0.122 |
| B12 | (0.287, 0.849) | (0.71, 1.955) | 0.602 | 1.412 |
| B13 | (0.636, 1.561) | (0.187, 0.45) | 1.164 | 0.338 |
| B14 | (0.286, 0.667) | (1.027, 2.59) | 0.505 | 1.917 |
| B15 | (0.049, 0.107) | (0.001, 0.01) | 0.083 | 0.006 |
| B16 | (0.566, 1.524) | (0.177, 0.45) | 1.108 | 0.332 |
Table 12.
Prominence , Net effect , and their deblurring.
| Prominence | Net Effect | Prominence | Net Effect | |
|---|---|---|---|---|
| B1 | (0.806, 2.141) | (0.068, 0.301) | 1.562 | 0.196 |
| B2 | (0.985, 2.374) | (0.411, 1.066) | 1.780 | 0.783 |
| B3 | (1.256, 3.263) | (−1.787, −0.688) | 2.395 | −1.312 |
| B4 | (0.759, 1.947) | (−0.157, −0.113) | 1.434 | −0.143 |
| B5 | (0.489, 1.272) | (0.195, 0.49) | 0.933 | 0.363 |
| B6 | (1.171, 3.184) | (−1.092, −0.375) | 2.308 | −0.778 |
| B7 | (1.129, 2.889) | (0.853, 2.145) | 2.130 | 1.589 |
| B8 | (0.923, 2.319) | (0.551, 1.433) | 1.718 | 1.052 |
| B9 | (0.963, 2.633) | (−1.559, −0.543) | 1.906 | −1.114 |
| B10 | (1.395, 3.463) | (−2.165, −0.909) | 2.575 | −1.629 |
| B11 | (0.954, 2.406) | (0.826, 2.072) | 1.781 | 1.536 |
| B12 | (0.997, 2.804) | (−1.106, −0.423) | 2.015 | −0.810 |
| B13 | (0.823, 2.011) | (0.449, 1.111) | 1.502 | 0.827 |
| B14 | (1.313, 3.257) | (−1.923, −0.741) | 2.422 | −1.412 |
| B15 | (0.05, 0.117) | (0.048, 0.097) | 0.089 | 0.077 |
| B16 | (0.743, 1.974) | (0.389, 1.074) | 1.440 | 0.775 |
Table 13.
Hierarchy comparison table of the causes of urban problems.
| Level | Causes of Urban Problems Using Grey Theory | Causes of Urban Problems |
|---|---|---|
| L1 | B3, B9, B10, B14 | B3, B4, B6, B9, B10, B14 |
| L2 | B6, B12 | B7, B8, B11, B16 |
| L3 | B4, B5, B15 | B1, B2, B5, B12 |
| L4 | B1, B2 | B13, B15 |
| L5 | B8, B13, B16 | |
| L6 | B7, B11 |
Disclaimer/Publisher’s Note: The statements, opinions and data contained in all publications are solely those of the individual author(s) and contributor(s) and not of MDPI and/or the editor(s). MDPI and/or the editor(s) disclaim responsibility for any injury to people or property resulting from any ideas, methods, instructions or products referred to in the content. |
© 2024 by the authors. Licensee MDPI, Basel, Switzerland. This article is an open access article distributed under the terms and conditions of the Creative Commons Attribution (CC BY) license (https://creativecommons.org/licenses/by/4.0/).
Share and Cite
MDPI and ACS Style
Chen, W.; Tian, Y.; Wang, Y.; Yan, H.; Wang, Y. Cause Identification and Coupling Relationship Analysis of Urban Problems: A Case Study of Poor Parking Convenience. Buildings 2024, 14, 516. https://doi.org/10.3390/buildings14020516
AMA Style
Chen W, Tian Y, Wang Y, Yan H, Wang Y. Cause Identification and Coupling Relationship Analysis of Urban Problems: A Case Study of Poor Parking Convenience. Buildings. 2024; 14(2):516. https://doi.org/10.3390/buildings14020516
Chicago/Turabian StyleChen, Wei, Yishuai Tian, Yanhua Wang, Hang Yan, and Yong Wang. 2024. "Cause Identification and Coupling Relationship Analysis of Urban Problems: A Case Study of Poor Parking Convenience" Buildings 14, no. 2: 516. https://doi.org/10.3390/buildings14020516
Note that from the first issue of 2016, this journal uses article numbers instead of page numbers. See further details here.