
Summer Thermal Challenges in Emergency Tents: Insights into Thermal Characteristics of Tents with Air Conditioning

1
College of Architecture and Environment, Sichuan University, Chengdu 610065, China
2
Institute for Disaster Management and Reconstruction, Sichuan University, Chengdu 610207, China
3
MOE Key Laboratory of Deep Earth Science and Engineering, Sichuan University, Chengdu 610225, China
*
Author to whom correspondence should be addressed.
Buildings 2024, 14(3), 710; https://doi.org/10.3390/buildings14030710
Submission received: 1 February 2024
/
Revised: 24 February 2024
/
Accepted: 29 February 2024
/
Published: 7 March 2024
(This article belongs to the Special Issue Indoor Air Quality: Differences in Working Environments for Different Practitioners)
Abstract
:Emergency tents face challenges in harsh weather conditions and sometimes require the use of air conditioning for indoor thermal environment control. However, their lightweight structure makes their control methods different from conventional buildings. This study focuses on the indoor thermal environment and thermal comfort of air-conditioned tents during summer. Through experimental measurements, this study captures the distribution of air temperatures and inner surface temperatures within a tent, thus providing an understanding of the characteristics of indoor thermal environment in air-conditioned settings. Additionally, the numerical simulations conducted using the ANSYS FLUENT 2021 R1 calculate the Predicted Mean Vote (PMV) and Predicted Percentage Dissatisfied (PPD), thus contributing to a detailed analysis of the indoor thermal comfort states. The experiment revealed that the mean radiative temperature (MRT) inside the tent can exceed the air temperature by more than 10 °C. Even when the air temperature is around 26 °C, the excessively high MRT can cause occupants to feel uncomfortable, with the PMV exceeding 1.4 and the PPD surpassing 50%. Furthermore, the high MRT results in an increased demand for cooling airflow, with the cooling loss through gaps becoming a significant part in the cooling load. To ensure a comfortable thermal environment, the air-conditioning set temperature needs to be adjusted according to the weather conditions. For instance, even at the same air temperature of 35 °C, when solar radiation increases from 400 W/m2 to 1000 W/m2, the set temperature needs to be reduced from 24.7 °C to 20.7 °C. The findings of this study provide an important reference for establishing summer air-conditioning strategies for emergency tents.
1. Introduction
As a critical infrastructure for tasks such as temporary shelter and emergency treatment during disaster relief [1,2,3], the internal thermal environment of emergency tents directly affects the rest quality and work efficiency of both disaster-affected populations and medical personnel. Nevertheless, fabric-manufactured tents face challenges in withstanding harsh weather conditions [4,5]. Fabrics are only a few millimeters thick, which enables tents to respond quickly in emergency situations but also leads to low thermal storage and poor thermal insulation. In contrast to the temperature wave ‘’time lag’’ and ‘’decrement factor’’ observed in conventional buildings, the temperatures inside tents are amplified and exhibit minimal delay. Indoor air temperatures in tents can exceed outdoors by more than 10 °C. Prolonged stays in such environments elevate the risk of diseases. In Wang et al.’s survey of individuals residing in emergency tents [6], medical visits increased by 55.4%. Heat exposure also has a direct impact on the emotional and physical health of medical staff. Jegodka et al. [7] conducted a questionnaire survey on health care workers in hot environments, and the results showed that most of the respondents said they felt exhausted, tired, dissatisfied, and irritable, while 91.3% of the respondents thought their work was difficult, and 80.2% had physical discomfort such as back pain, sleep disorders, exhaustion, or headache. It is evident that establishing a safe and healthy thermal environment within a tent is a crucial concern.
Over the past several decades, many researchers have carried out research studies on the thermal environment of tents heated in winter [8,9,10,11]. As for summer climate conditions, many studies examined how to improve the thermal environment of tents, such as through the use of aluminum foil [12], retro-reflective materials [13], shading [14], phase-change materials [15], and other passive measures [16,17]. Many scholars have also focused their research on creating a comfortable thermal environment and energy conservation within tents. Salvalai et al. [10] developed a multi-layer insulation material consisting of an aluminum/plastic-type reflective foil, a plastic bubble film, and a foam material, with a thickness of 60 mm and a thermal conductivity of 0.85 W/(m2·K). When applied to tents used by the United Nations High Commissioner for Refugees (UNHCR), their dynamic analysis using the Trnsys v.17 Environment indicated a projected reduction of over half in heat consumption. Obyn et al. [4] conducted experiments in Burkina Faso, Africa, measuring and showing that the interior temperature of UNHCR tents was as high as 51.4 °C when the outdoor temperature was approximately 40 °C. They further discussed the accuracy of simulating tent thermal environments using the building energy simulation software EnergyPlus. Poschl [5] conducted a study on the thermal environment and thermal comfort of UNHCR tents under the climatic conditions in the United Kingdom. Susanti [18] used Fanger’s thermal comfort model to predict the average Predicted Mean Vote (PMV) and Predicted Percentage Dissatisfied (PPD) to evaluate the thermal environment of single-layer and double-layer emergency tents. Moreover, researchers are increasingly inclined to the view that passive measures alone may not eliminate the discomfort arising from excessive indoor temperatures [19]. Emergency tents face challenges in harsh weather conditions and sometimes require the use of air conditioning for indoor thermal environment control. However, research on the indoor thermal environment and thermal comfort conditions of tents under air-conditioned settings is still relatively scarce and incomplete.
So, can active measures create a healthy and comfortable thermal environment inside tents? In 2021, Tao [20] conducted cooling experiments on medical tents in Guangzhou city in China in August. It was found that in a hot environment of 40.9 °C, two air-conditioning units with a cooling capacity of 3.65 kW each were unable to bring the temperature inside a tent to below 30 °C. This indicates that, under high-temperature conditions in the summer, significant challenges persist in achieving a favorable indoor thermal environment and managing energy consumption, even when employing air-conditioning equipment. The interior thermal regulation of tents exhibits characteristics that differ significantly from conventional buildings: a lightweight structure, a low thermal storage capacity, poor insulation performance, and poor airtightness. Unlike regular buildings that undergo insulation treatment, tents are temporarily set up on the ground, leading to a marked difference in thermal inertia between the ground and the tent canopy. These characteristics render the thermal environment of tents unique. It is also the reason why conventional methods of thermal environment regulation for regular buildings cannot be directly applied to tent environments.
In summary, existing studies have not answered the question regarding whether a thermal comfort environment inside tents could be built by using an air conditioner. Therefore, as shown in Figure 1, the current study specifically investigates the thermal conditions within tents cooled by air conditioners under hot summer conditions by employing a combination of experimental and simulation approaches. The PMV-PPD model is used to evaluate the thermal comfort inside the tent environment. Furthermore, this study discusses the thermal comfort and heat transfer characteristics of tents under different cooling supply and weather conditions. The findings of this study provide a theoretical basis for establishing summer air-conditioning strategies for emergency tents.
2. Materials and Methods
2.1. Experimental Setup
In May 2018, the WHO certified an IEMT in Chengdu as the highest-level nonmilitary IEMT. In order to analyze the thermal environment characteristics of an emergency tent under air-conditioned conditions using experimental measurements, a tent equipped with an air conditioner was selected for study, as illustrated in Figure 2. The tent selected for this study is a semi-foldable frame tent with the specific dimensions of 6000 mm × 5000 mm × 2700 mm (length × width × height). Designed specifically for field conditions or emergencies, this tent serves a multitude of functions, including triage for casualties; establishment of medical facilities, kitchens, dining areas, and personnel rest areas; and other emergency shelter and office purposes in the field. The tent features a lightweight enclosure structure. The total weight of the tent is approximately 250 kg, with a wind resistance grade of 8. It is constructed from steel and aluminum alloy and covered with 550 g/m² white PVC-coated fabric. The thickness of the fabric is less than 5 mm, and it has a thermal conductivity of 0.0814 W/(m·°C). The tent is non-transparent with a surface absorptivity of 0.65. Specifically, the roof is insulated with an enclosed air space of around 50 mm, covering an area of 12.7 m2, and providing a heat resistance of 0.12 [m2KW−1]. The east and west walls each span an area of 9.5 m2, offering a heat resistance of 0.06 [m2KW−1]). Similarly, the south and north walls cover 11.2 m2 each, with a heat resistance of 0.06 [m2KW−1].
Figure 2 illustrates the standard tent structure and the placement of the air conditioner during the summer experiment. The experiment was conducted on 5 June, during which measurements of both the indoor and outdoor thermal environments were collected. The experimental instruments used are listed in Figure 2, and their relevant parameters are provided in Table 1. For testing the indoor thermal environment, we employed T-type thermocouples to measure the air temperature inside the tent and the temperature of its inner surface. To comprehensively understand the distribution of the internal thermal environment, we positioned a total of seven measurement points on both the horizontal and vertical planes inside the tent, as depicted in Figure 2. This included three points centrally located at heights of 0.6 m, 1.2 m, and 1.8 m, and four points positioned 1 m away from each wall at a height of 1.2 m [21]. The temperature measurement points were positioned on the enclosure structure of the tent in each direction to measure both internal and external surface temperatures. The outdoor thermal conditions were assessed through measurements of solar radiation intensity and outdoor temperature.
The emergency medical team employed an FKWD-70RG air conditioner model to regulate the thermal and humid environment within the tent. With a weight of 180 kg and dimensions measuring 1200 mm × 710 mm × 615 mm (length × width × height), the air conditioner boasts a rated heating and cooling capacity of no less than 7 kW, while featuring a rated heating capacity of 8.5 kW and an air supply volume of at least 1400 m³/h. Owing to practical considerations, including the reliance on a generator to power the tent’s air-conditioning equipment, the testing period for the air-conditioning conditions was conducted during the hours between 15:00 and 19:15 on 5 June. The specific experimental conditions and schedule are outlined in Table 2. During this experimental period, the tent maintained a controlled environment with all doors and windows being securely sealed. Notably, there were no internal heat sources, including lighting, equipment, or personnel, that could influence the tent’s interior conditions.
2.2. Numerical Simulation Model
In order to delve deeper into the heat transfer mechanisms of the tent and perform a comprehensive thermal comfort analysis, the indoor thermal environment of air-conditioned tents was simulated numerically using the ANSYS Fluent software. The physical model is visually represented in Figure 3. The model comprises three essential components: the tent, the external space, and soil. Notably, the tent model faithfully reproduces the actual tent’s 3D dimensions, incorporating all doors and windows for a precise representation. For an authentic representation of the external environment’s impact on the thermal conditions of the tent, the model introduces an external space with a height of 10.0 m centered around the tent. Additionally, a soil layer with a thickness of 5.0 m is incorporated, forming a square ground area with a side length of 25.0 m.
A crucial aspect in formulating the tent model is the representation of the tent’s air tightness characteristics. Meticulous observations during the experiment revealed that air leakage in the tent is predominantly concentrated at the junction between the tent and the ground, as well as around doors and windows. Because of the softness of the fabric material, it is difficult to measure and quantify these gaps. Consequently, the constructed tent model incorporates 2 mm gaps that are precisely located at areas identified as areas of potential air leakage, notably at the junction between the tent and the ground, and around doors and windows. These gaps are set to the “Internal” boundary conditions that connect the indoor and outdoor environments.
The mesh division utilizes the “Poly-Hexcore” technique, generating a total of 11,841,849 grids. The “Wall” boundaries are configured with a 5-layer boundary, and the inverse orthogonal quality is meticulously adjusted to below 0.6. The chosen turbulence model is the k-e Realizable model, with the wall function utilizing the scalable model. Simultaneously, the radiation model opted for is the S2S model. The solar radiation model is activated, considering the latitude and longitude of Chengdu in the GMT + 8 time zone. The pitched roofs of the tent face north and south. The simulation assumes the treatment of air as an “incompressible ideal gas”. Furthermore, the simulation employs the “Pressure-Based” solver with the “Coupled” algorithm. In terms of the pressure term, the chosen format is “Body Force Weighted”, while the momentum term adopts the “First-order upwind” format.
It is assumed that the thermal conductivity of the soil is 1.5 (m2 K)/W, the density is 1500 kg/m3, and the heat capacity is 1080 J/(kg K). The bottom of the soil region is set as the temperature boundary condition, and the annual average outdoor air temperature of Chengdu is taken, which is about 24.6 °C. The four surrounding surfaces are set as adiabatic boundary conditions. The initial temperature of the soil region is defined according to the steady periodic solution [22]:
where Tom is the annual mean temperature of outdoor air, in °C; ω is the angular frequency, in rad/s; t is time, in s; z is the depth of the soil, in m; positive denotes the downward direction vertical to ground; and α is soil heat diffusion coefficient, in m2/s.
According to the physical model of the tent, eight air inlets with a radius of about 0.2 m are preset below the windows of the north and south walls. One of them is selected as the air supply inlet and set to the “mass flow” boundary condition. The air supply pressure is 200 Pa and the air supply temperature is 16 °C.
2.3. PMV-PPD Model
Fanger’s Predicted Mean Vote (PMV) model has been widely utilized in conventional buildings [23], serving as a comprehensive index that accounts for four environmental factors: air temperature, air humidity, air velocity, and mean radiant temperature. Additionally, it considers two human-related factors: clothing thermal resistance and metabolic rate. The PMV index represents the thermal sensation of the majority of people in the same thermal environment. The Predicted Percentage Dissatisfied (PPD) index is used to reflect physiological and psychological differences in thermal sensation among individuals. The application of the PMV-PDD model to temporary buildings and among medical staff groups has been recognized [24]. Hence, this study chooses to employ the PMV model for assessing the thermal environment of emergency tents [18,25]. In this simulation, it is assumed that the clothing insulation of the human body is 0.3 clo.
where is the metabolic heat production rate of humans, in ; is the rate of mechanical work accomplished, in ; is the water vapor pressure in ambient air, in kPa; is the air temperature, in °C; is the clothing area factor, which is dimensionless; is the clothing surface temperature and is the mean radiant temperature, both in °C; and is the clothing surface heat transfer coefficient, in .
PPD is calculated as follows:
The calculation formula for the average radiant temperature is as follows [26]:
where is the projected area of the body, that is, the area of the human body projected onto a plane perpendicular to the direction of the radiant source, . Ar the effective radiation area of the person. D is the distance from to the human body P. is the angle between the normal vector of the radiant surface and the line connecting point P with the center of the radiant surface .
3. Results
3.1. Experimental Results
During the experiment, as shown in Figure 4, the outdoor air temperature fluctuates slightly around 32.5 °C, and the solar radiation drops from 900 to 0 W/m2. The wind speed is zero most of the time and rarely exceeds 1 m/s.
Figure 5 illustrates the temperature variations at different measurement points during the on-site experiment. Initially, upon the activation of the air conditioner, both the air temperature and the surface temperature inside the tent decrease rapidly. This can be attributed to the tent’s low thermal inertia. It could be found that the temperature inside the tent can stabilize within 10 min after the air conditioner is turned off. Additionally, during the air-conditioning phase, the tent’s temperature does not stabilize, mainly due to the continuous decrease in solar radiation intensity. This underscores the tent’s sensitivity to outdoor weather conditions.
Figure 5 also presents the horizontal and vertical distribution of air temperature within the tent, along with the surface temperature of the tent enclosure. During the air-conditioning operation, variations in air temperature are observed both horizontally and vertically within the tent. The temperatures of the enclosure structure surface, including the floor, are notably higher than the indoor air temperature. For example, at 17:00, when the air temperature drops below 26 °C, the radiant temperature can still exceed 36 °C, particularly at the roof. The radiant temperature displays an asymmetric characteristic, with a temperature difference of over 8 °C between the roof and the floor, and a temperature difference of over 5 °C between the east and west walls.
To further quantify the temperature non-uniformity within the tent, the indoor temperature uniformity is calculated using Formula (7) [27]:
where
—the instantaneous temperature uniformity at time , expressed in degrees Celsius (°C);
—the total number of temperature measurement points inside the room;
—the instantaneous temperature at measurement point , expressed in degrees Celsius (°C);
—the instantaneous average temperature of all measurement points, expressed in degrees Celsius (°C).
The results after calculating the temperature uniformity based on data from all measurement points in the experiment are illustrated in Figure 6. The overall non-uniformity ranges from 0.08 to 1.15, and none exceeds 2 °C. Therefore, from the perspective of the entire interior space of the tent, the temperature non-uniformity is relatively low and within an acceptable range.
As shown in Figure 7, the average temperatures, from highest to lowest, are as follows: roof surface > facade > ground > air. Notably, the radiant temperature of the inner surface is high and “asymmetric”, with the top surface, the facade, and the ground being 6.6 °C, 3.9 °C, and 1.9 °C higher than the air temperature, resulting in the characteristic of a “hot roof” and a “hot wall”. Importantly, in addition to the thermal response processes of air temperature and surface temperature, the sustained decrease in solar radiation intensity is a key factor contributing to the tent’s interior temperature not reaching stability. Overall, the thermal environment exhibits a rapid temperature response, high radiant temperatures, an “asymmetric” distribution of air temperature, and a large and fluctuating cooling load in response to changes in solar radiation.
3.2. Validation
The tent model described in Section 2.2 is configured with the same outdoor meteorological conditions as during the on-site experiment. By simulating the temperature inside the tent, the model’s accuracy is validated by comparing it with the temperature results obtained from the experimental testing. The simulated indoor air temperatures are the average values of seven points at the same location as the air temperature sensors in the experiment. And all other simulated surface temperatures represent the average values across the entire surface. As shown in Figure 8, the trends in the simulated results and the measured data of indoor air temperatures, roof inner and outer surface temperatures, wall inner and outer surface temperatures, and floor surface temperatures are consistent. Regardless of whether in the cooling or heating phase, the temperature response occurs within several minutes. Nevertheless, the simulated floor surface temperatures are clearly higher than the measured data. To fully replicate the floor surface temperatures, accurate thermal–physical parameters of the soil and the initial temperature state of the soil are required. However, these values were not obtained, which led to the discrepancy between the simulated and measured results. Additionally, during Phase V, the simulated outer surface temperatures are higher than the measured data. This difference might be attributed to the nighttime sky radiation cooling effect, a factor not considered in the current study. During the experiment, the wind speed at the center point of the z = 1.2 m plane was measured, and the results are consistently less than 0.1 m/s, which are similar to the simulated results. Consequently, the established model can be utilized for simulating the thermal environment of tents cooled by air conditioners.
3.3. PMV-PPD Analysis
The PMV-PPD model was utilized to evaluate the thermal environment inside the emergency tent under air-conditioned conditions. PMV can predict the thermal sensation of the majority of individuals, while PPD reflects the differences in thermal sensation among people. Section 3.2 describes the simulation of the temperature variations of the tent throughout the entire experimental period. This section takes the time point of 17:00 as an example and describes the calculation of the PMV and PPD using the model at this time point, thereby providing an analysis of the indoor thermal comfort of the tent during the experiment. Figure 9 H1-H5 illustrates the results for the XY horizontal plane at a height of Z = 1.1 m, and Figure 9 V1-V5 shows the XZ vertical plane at Y = 2.5 m.
As shown in Figure 9(H4,V4), the PMV values for both the horizontal and vertical planes range from 1.4 to 2.2. According to the standards “ASHRAE 55” [21], the thermal comfort range of PMV is −0.5~0.5. Therefore, the simulated tent thermal environment indicates a warm sensation for tent occupants. Furthermore, the PPD results shown in Figure 9(H5,V5) indicate that 50% to 80% of individuals would be dissatisfied with the thermal environment. However, it can be seen in Figure 9(H1,V1) that the air temperatures of most areas are between 26 and 27 °C, which is a comfortable temperature range for occupants in traditional buildings but opposite in emergency tents. So, it indicates that the thermoneutral air temperature for traditional buildings is not suitable for emergency tents to ensure the thermal comfort of individuals. This is attributed to the excessively high radiant temperatures, reaching 34 to 37 °C, as depicted in Figure 9(H3,V3). In addition, air speed is also a crucial factor influencing the PMV value. For areas with an air speed lower than 0.2 m/s, the PMV values exceed 1.8 and the PPD values surpass 70%.
3.4. Heat Transfer Analysis
The heat fluxes of the heat transfer process inside the emergency tent were calculated to analyze its cooling load. Taking the time point of 17:00 as an example, the heat fluxes inside the tent are shown in Figure 10. It was observed that the maximum cooling loss is due to air leakage, being approximately 4296.7 W and accounting for approximately 68.5% of the cooling supply. The remaining parts account for proportions that are all below 10%. The second largest heat flux is on the west wall surface, being 622.7 W and accounting for 9.93%. Then, the heat fluxes of the north wall, the north roof, the south wall, the south roof, the floor, and the east wall are 329.3 W, 280.2 W, 271.6 W, 262.8 W, 149.7 W, and 55.7 W, accounting for 5.25%, 4.47%, 4.33%, 4.19%, 2.39%, and 0.89%, respectively. The air leakage results in a substantial loss of cooling capacity, primarily due to the absence of a return air system in the air-conditioning system. The air leakage flow is approximately equal to the air supply flow, which is around 1400 m3/h or 0.5 kg/s. The amount of heat flux carried away by air leakage is more dependent on the location of the gap. The air supply inlet is positioned under a window and close to the floor. Thus, the cold air from the air conditioner does not fully exchange heat with the thermal environment inside the tent and leaks directly to the outside. Clearly, if a return air system could be added, the cooling load of the emergency tent could be greatly reduced.
4. Discussions
4.1. Thermal Comfort Analysis under Different Cooling Supply Conditions
Assuming that it was 1 July at 14:00, the hottest summer day outside, with an outdoor dry-bulb temperature of 35 °C and a solar radiation of 1000 W/m2. As concluded in Section 3.4, an air-conditioning system without return air can result in a significant loss of cooling capacity. Therefore, all simulations in this context consider the presence of a return air system. The cooling supplies of 4 kW, 5 kW, and 6 kW were applied, and the simulated thermal environment of the tent is illustrated in Figure 11. With an increase in cooling supplies, the indoor air temperature, MRT, PMV, and PPD all exhibited a decreasing trend. If the cooling supply was 4 kW, the air temperature was between 26 °C and 30 °C, the MRT reached 50 °C, the PMV was around 3, and the PPD ranged from 88% to 100%. Undoubtedly, a cooling supply of 4 kW was insufficient to create a thermal comfort environment inside emergency tents in hot summer. With an increase in cooling supply to 5 kW, the air temperature dropped to the range of 24 °C to 28 °C, the MRT fell below 50 °C, the PMV decreased to around 2, and the PPD was between 40% and 92%. However, the thermal environment still did not satisfy the majority of individuals. With a further increase in cooling supply to 6 kW, the PMV values were between 0.1 and 1.7, and the PPD ranged from 10% to 60%. Then, the thermal environment in the tent was sufficient to satisfy nearly half of the individuals. It was noteworthy that when the cooling supply was 6 kW, the air temperature decreased to the range of 21 °C to 25 °C, with part of the area falling below 20 °C. There existed PMV values of less than 0, indicating a slight cool sensation for individuals. With a cooling capacity of about 7 kW, it could lower the average indoor air temperature to below 25 °C, and achieve an PMV below 1 and a PDD below 50%.
4.2. Heat Transfer Analysis under Different Cooling Supply Conditions
Figure 12 demonstrates that an air-conditioning system with air return can significantly reduce the cooling loss caused by air leakage, compared to the results in Section 3.4. With an increase in the cooling capacity from 4 kW to 6 kW, there is a slight increase in the heat flux on various surfaces of the tent’s enclosure structure. However, the cooling loss caused by air leakage doubles, rising from approximately 400 W to over 800 W, and then exceeding 1500 W. Additionally, the heat transfer through the floor is in a relatively high range, at approximately 1000 W. The roof, benefiting from good insulation, exhibits a heat flux below 600 W. However, the poorly insulated south wall, which is exposed to intense solar radiation and has a larger surface area, also experiences a heat flux close to 1000 W.
4.3. Air-Conditioning Strategies for Emergency Tents
In conventional buildings, the indoor temperatures under air-conditioning conditions typically approximate the neutral temperature of the human body and are generally independent of outdoor meteorological conditions. In contrast, the thermal performance of emergency tents exhibits characteristics that differ significantly from conventional buildings, with a lightweight structure, a low thermal storage supply, poor insulation performance, and poor airtightness. These characteristics mean that outdoor meteorological conditions significantly impact the MRT inside a tent. Therefore, the design criteria for the set temperature of air conditioning in emergency tents should be correlated with outdoor meteorological conditions.
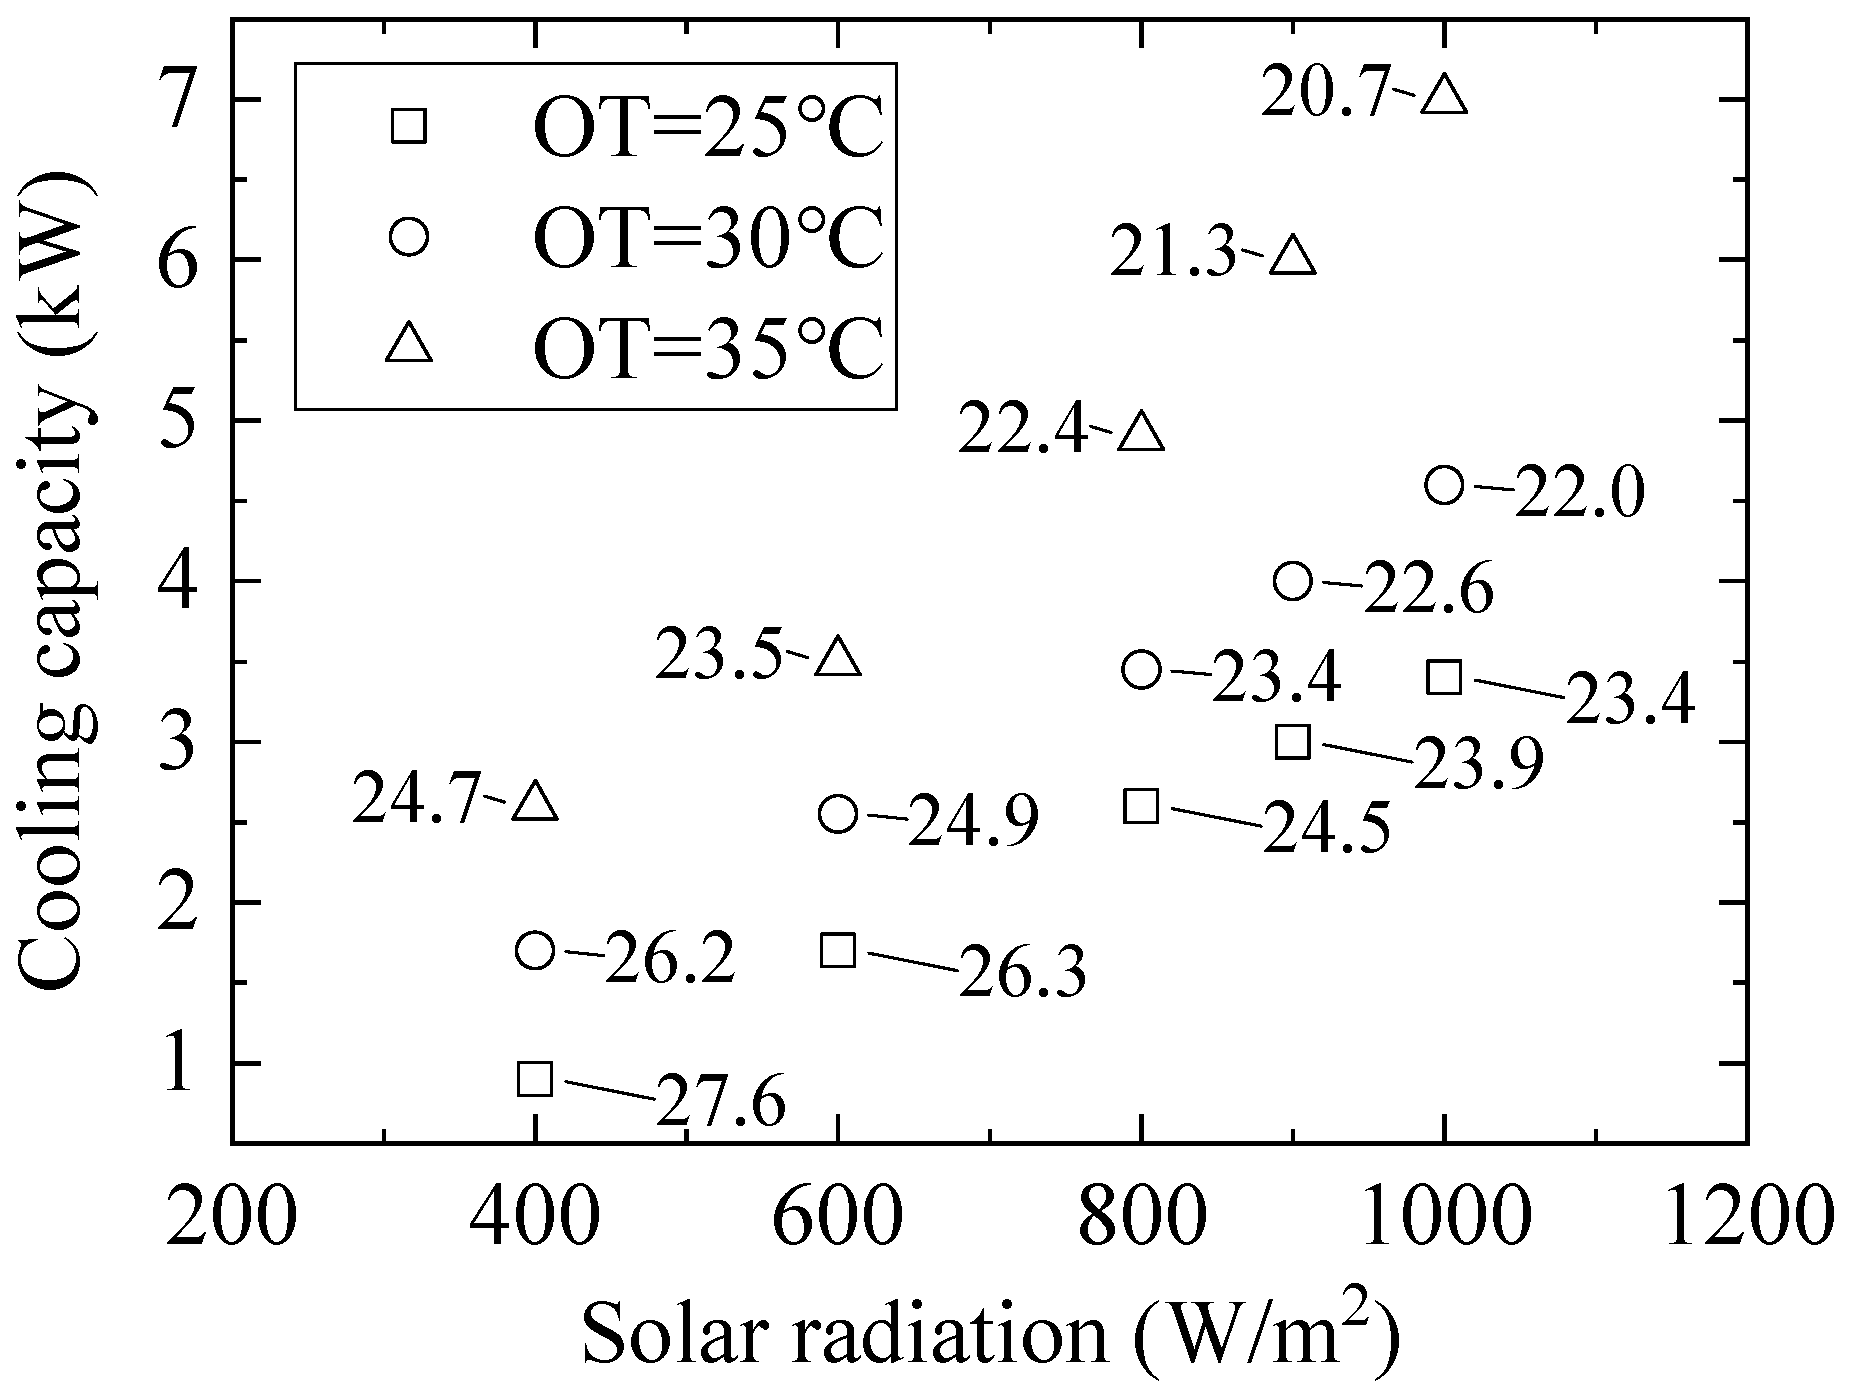
To investigate the cooling load of the tent under different meteorological conditions, 15 cases were simulated in this study. The conditions included a solar radiation increase from 400 W/m2 to 1000 W/m2, and an outdoor air temperature increase from 25 °C to 35 °C. The simulated results are shown in Figure 13. It can be observed that solar radiation has a significant impact on the cooling load, with an exponential relationship between these two variables. For instance, when the outdoor air temperature is 35 °C, the increase in the solar radiation intensity from 400 W/m2 to 1000 W/m2 results in the air-conditioning cooling capacity needing to increase from 2.5 kW to 7.0 kW.
Furthermore, as evident in the preceding results, the characteristic of high radiative temperature inside the tent necessitates lower indoor temperatures to create a comfortable thermal environment. Figure 13 indicates the average indoor temperature under each condition, providing a reference for air-conditioning set temperatures. It can be observed that as the outdoor air temperature increases or the solar radiation intensity rises, the corresponding indoor temperature for a comfortable thermal environment becomes lower. When the outdoor temperature is 25 °C and the solar radiation intensity is 400 W/m², the indoor temperature is 27.6 °C. However, when the outdoor temperature is 35 °C and the solar radiation intensity is 1000 W/m², the indoor temperature decreases to 20.7 °C.
The air supply volume and air supply temperature of air-conditioning systems are also crucial factors affecting the thermal comfort inside emergency tents. Due to the substantial cooling load of a tent, a larger air supply volume and a lower air supply temperature are necessary. When the cooling capacity of the air-conditioning system is constant, increasing the air supply volume can result in increased air leakage and loss of cooling capacity. On the other hand, reducing the air supply temperature may lead to localized areas becoming excessively cold, thus causing discomfort to occupants.
4.4. Limitation and Future Study
It is difficult to accurately reproduce air leaks in tent simulations. Because of their special way of construction, there are always some big or small gaps in tents. Even if the formation of gaps can be reduced during the design and production process, it is still difficult to ensure that gaps will not be caused during the actual construction and use process. Because of the softness of the fabric material used, it is difficult to measure and quantify these gaps. In addition, the use of air conditioning causes changes in the air pressure inside tents, which changes the shape and size of the gaps inside tents. Ignoring these gaps in the simulation model can have a misleading effect on the results. Larger-gap modeling makes the total gap area too large, while smaller-gap modeling requires more computer power. Therefore, for the model established in the current study, we assume that there are 2 mm gaps around the doors and windows, and at the joints between the tent and the ground. This may have a certain impact on the quantitative conclusions of the current study.
The effect of external wind on the thermal environment inside emergency tents has not been discussed in this study. On the one hand, the impact of external wind on the tent’s thermal environment will be constrained by air gaps. On the other hand, external wind usually lowers the external surface temperature of buildings and reduces the cooling loads. Therefore, a more conservative conclusion can be drawn if considering an external wind speed of 0.
The experiment in the current work was conducted without considering occupants, equipment, and other inner heat sources. If there were inner heat sources, the cooling load would increase. Then, the orientation of the emergency tent, as well as the outer wind speed and direction, would also influence the cooling load to some extent. Most importantly, the influence of the thermal performance of the tent on the thermal environment was not examined. If conventional insulation materials were assumed, using a small amount might not effectively block the entry of outdoor heat, while using a large amount might compromise the flexibility of the tent. Therefore, the rational use of insulation materials may be a subject for future research. Similarly, measures such as reducing the solar absorptance of the tent’s outer surface and decreasing the infrared emissivity of the inner surface, which contribute to reducing the cooling load and enhancing thermal comfort, may be considered in future studies.
5. Conclusions
An air-conditioning control strategy for emergency tents cannot be directly applied using conventional building models. With the objective of assessing whether and how air conditioning can create a healthy and comfortable indoor thermal environment for emergency tents during hot summers, this study was conducted by establishing an experimental platform and employing numerical simulation methods. The PMV-PPD model was used to evaluate the thermal environment. The important conclusions are as follows:
(1) Emergency tents with lightweight enclosure structures have minimal heat storage and poor insulation, resulting in unique thermal characteristics such as uneven temperature distribution, high radiation temperature, and asymmetric radiation under air-conditioning conditions. The difference in the mean radiant temperature and air temperature can exceed 10 °C. Even if the air temperature is around 26 °C, an excessively high mean radiant temperature can lead to occupants feeling uncomfortable, with the PMV value exceeding 1.4 and the PDD exceeding 50%.
(2) The high demand for cooling capacity in emergency tents presents a challenge for an air conditioner without return air to meet the indoor thermal comfort requirements. In contrast, an air conditioner with return air can alleviate this demand and make it easier to create a comfortable thermal environment. With a cooling capacity of about 7 kW, it can lower the average indoor air temperature to below 25 °C, and achieve an PMV below 1 and a PDD below 50%.
(3) Fabric-manufactured tents often have unavoidable gaps that are challenging to quantify. It could be concluded that the greater the air supply flow, the more significant the amount of cooling loss through these gaps. In the current study, when the airflow reaches 1 kg/s, the cooling loss through these gaps exceeds the heat fluxes from other enclosure components.
(4) The MRT inside a tent under air conditioning is greatly influenced by outdoor meteorological conditions. The air-conditioning set temperature for a tent needs to be adjusted according to the outdoor air temperature and solar radiation intensity. For example, at an outdoor temperature of 35 °C, when solar radiation increases from 400 to 1000, the air-conditioning set reference temperature needs to be adjusted from 24.7 °C to 20.7 °C.
(5) Without considering the premise of improving the thermal performance of the enclosure structure, it is not easy to create a thermal environment in an emergency tent that is satisfactory to the vast majority of people and whose PMV is close to 0. Emergency tents usually have a large cooling load. To achieve the cooling of the entire personnel activity area, it is necessary to have a large enough supply of air volume or a small enough supply of air temperature, which may cause partial cooling of the thermal environment in the local area. While increasing heat mass or insulation can improve a tent’s thermal performance, it contradicts the lightweight design of tents. Perhaps solutions like reflective coatings and radiative cooling coatings satisfy both aspects and are avenues for future research.
Author Contributions
Conceptualization, M.X. and E.L.; methodology, Y.L. and Y.J.; software, M.X. and W.Z.; validation, M.X., Y.J., and W.Z.; formal analysis, Y.J. and W.Z.; investigation, Y.L. and Y.J.; resources, E.L.; data curation, Y.L. and W.Z.; writing—original draft preparation, M.X.; writing—review and editing, E.L. and M.X.; visualization, M.X.; supervision, E.L.; project administration, E.L. and M.X.; funding acquisition, E.L. All authors have read and agreed to the published version of the manuscript.
Funding
This project is funded by the National Natural Science Foundation of China (52308107), the National Natural Science Foundation of China (No. 52078314), the Natural Science Foundation of Sichuan Province (2022NSFSC1027) and the Fundamental Research Funds for the Central Universities (2023SCU12095).
Data Availability Statement
The original data obtained in this study are included in the article. Further inquiries can be directed to the corresponding author.
Conflicts of Interest
The authors declare no conflicts of interest.
References
- Liu, Q.; Ruan, X.; Shi, P. Selection of emergency shelter sites for seismic disasters in mountainous regions: Lessons from the 2008 Wenchuan Ms 8.0 Earthquake, China. J. Asian Earth Sci. 2011, 40, 926–934. [Google Scholar] [CrossRef]
- Nappi, M.M.L.; Souza, J.C. Disaster management: Hierarchical structuring criteria for selection and location of temporary shelters. Nat. Hazards 2015, 75, 2421–2436. [Google Scholar] [CrossRef]
- Manoochehry, S.; Hoseinzadeh, E.; Taha, P.; Rasouli, H.R.; Hoseinzadeh, S.J.T.M. Field Hospital in Disasters: A Systematic Review. Trauma Mon. 2018, 24, e65126. [Google Scholar] [CrossRef]
- Obyn, S.; van Moeseke, G.; Virgo, V. Thermal performance of shelter modelling: Improvement of temporary structures. Energy Build. 2015, 89, 170–182. [Google Scholar] [CrossRef]
- Poschl, R.A. Modelling the Thermal Comfort Performance of Tents Used in Humanitarian Relief; Loughborough University: Loughborough, UK, 2017. [Google Scholar]
- Wang, Y.; Long, E.; Deng, S. Applying passive cooling measures to a temporary disaster-relief prefabricated house to improve its indoor thermal environment in summer in the subtropics. Energy Build. 2017, 139, 456–464. [Google Scholar] [CrossRef]
- Jegodka, Y.; Lagally, L.; Mertes, H.; Deering, K.; Schoierer, J.; Buchberger, B.; Bose-O’Reilly, S. Hot days and COVID-19: Online survey of nurses and nursing assistants to assess occupational heat stress in Germany during summer 2020. J. Clim. Change Health 2021, 3, 100031. [Google Scholar] [CrossRef] [PubMed]
- Pilsworth, M.N. The Calculation of Heat Loss from Tents; Defense Technical Information Center: Fort Belvoir, VA, USA, 1978. [Google Scholar]
- Cornaro, C.; Sapori, D.; Bucci, F.; Pierro, M.; Giammanco, C. Thermal performance analysis of an emergency shelter using dynamic building simulation. Energy Build. 2015, 88, 122–134. [Google Scholar] [CrossRef]
- Salvalai, G.; Imperadori, M.; Scaccabarozzi, D.; Pusceddu, C. Thermal performance measurement and application of a multilayer insulator for emergency architecture. Appl. Therm. Eng. 2015, 82, 110–119. [Google Scholar] [CrossRef]
- Crawford, C.; Manfield, P.; McRobie, A. Assessing the thermal performance of an emergency shelter system. Energy Build. 2005, 37, 471–483. [Google Scholar] [CrossRef]
- Hu, S.; Meng, Q.; Wang, C. Experimental Research of Improvement on Thermal Environment of Tents’ by Passive Cooling. J. Logist. Eng. Univ. 2007, 23, 81–83. [Google Scholar]
- Zhang, L.; Meng, X.; Liu, F.; Xu, L.; Long, E. Effect of retro-reflective materials on temperature environment in tents. Case Stud. Therm. Eng. 2017, 9, 122–127. [Google Scholar] [CrossRef]
- Liu, J.; Jiang, Y.; Gong, Z.; Yang, H. Experiment Research on Shading to Improve the Thermal Environment of Tents. MATEC Web Conf. 2016, 61, 01009. [Google Scholar] [CrossRef]
- Wang, J.; Long, E.; Liao, X.; Xu, L. Effectiveness of improving tent envelope thermal performance based on PCM. Huagong Xuebao/CIESC J. 2014, 65, 107–113. [Google Scholar] [CrossRef]
- Borge-Diez, D.; Colmenar-Santos, A.; Pérez-Molina, C.; Castro-Gil, M. Passive climatization using a cool roof and natural ventilation for internally displaced persons in hot climates: Case study for Haiti. Build. Environ. 2013, 59, 116–126. [Google Scholar] [CrossRef]
- Borge-Diez, D.; Colmenar-Santos, A.; Mur-Pérez, F.; Castro-Gil, M. Impact of passive techniques and clean conditioning systems on comfort and economic feasibility in low-cost shelters. Energy Build. 2013, 62, 414–426. [Google Scholar] [CrossRef]
- Susanti, L. Thermal Comfort Evaluation of Emergency Tent Using PMV and PPD Model. In Proceedings of the International MultiConference of Engineers and Computer Scientists, Hong Kong, China, 18–20 March 2015. [Google Scholar]
- Maracchini, G.; D’Orazio, M. Improving the livability of lightweight emergency architectures: A numerical investigation on a novel reinforced-EPS based construction system. Build. Environ. 2022, 208, 108601. [Google Scholar] [CrossRef]
- Tao, G.L.X.; Duan, D.; Li, H.; Chen, E.; Zhang, Z. Experimental study on warming and cooling in medical tent. Chin. Med. Equip. J. 2021, 42, 6. [Google Scholar]
- ANSI/ASHRAE Standard 55; Thermal Environmental Conditions for Human Occupancy. ASHRAE: Atlanta, GA, USA, 2023.
- Badache, M.; Eslami-Nejad, P.; Ouzzane, M.; Aidoun, Z.; Lamarche, L. A new modeling approach for improved ground temperature profile determination. Renew. Energy 2016, 85, 436–444. [Google Scholar] [CrossRef]
- Becker, S.; Potchter, O.; Yaakov, Y. Calculated and observed human thermal sensation in an extremely hot and dry climate. Energy Build. 2003, 35, 747–756. [Google Scholar] [CrossRef]
- Shen, X.; Zhang, H.; Li, Y.; Qu, K.; Zhao, L.; Kong, G.; Jia, W. Building a satisfactory indoor environment for healthcare facility occupants: A literature review. Build. Environ. 2023, 228, 109861. [Google Scholar] [CrossRef]
- Cao, K.; Lan, M.; Wang, H.; Li, Y.; Liu, X. The thermal environment and thermal comfort of disaster relief tents in high-temperature composite environment. Case Stud. Therm. Eng. 2023, 50, 103453. [Google Scholar] [CrossRef]
- La Gennusa, M.; Nucara, A.; Pietrafesa, M.; Rizzo, G.; Scaccianoce, G. Angle Factors and Projected Area Factors for Comfort Analysis of Subjects in Complex Confined Enclosures: Analytical Relations and Experimental Results. Indoor Built Environ. 2008, 17, 346–360. [Google Scholar] [CrossRef]
- GB/T 33658-2017; Thermal Comfort Requirements and Evaluation for Indoor Environment. Standardization Administration of China: Beijing, China, 2017.
Figure 1.
Research roadmap in current study.
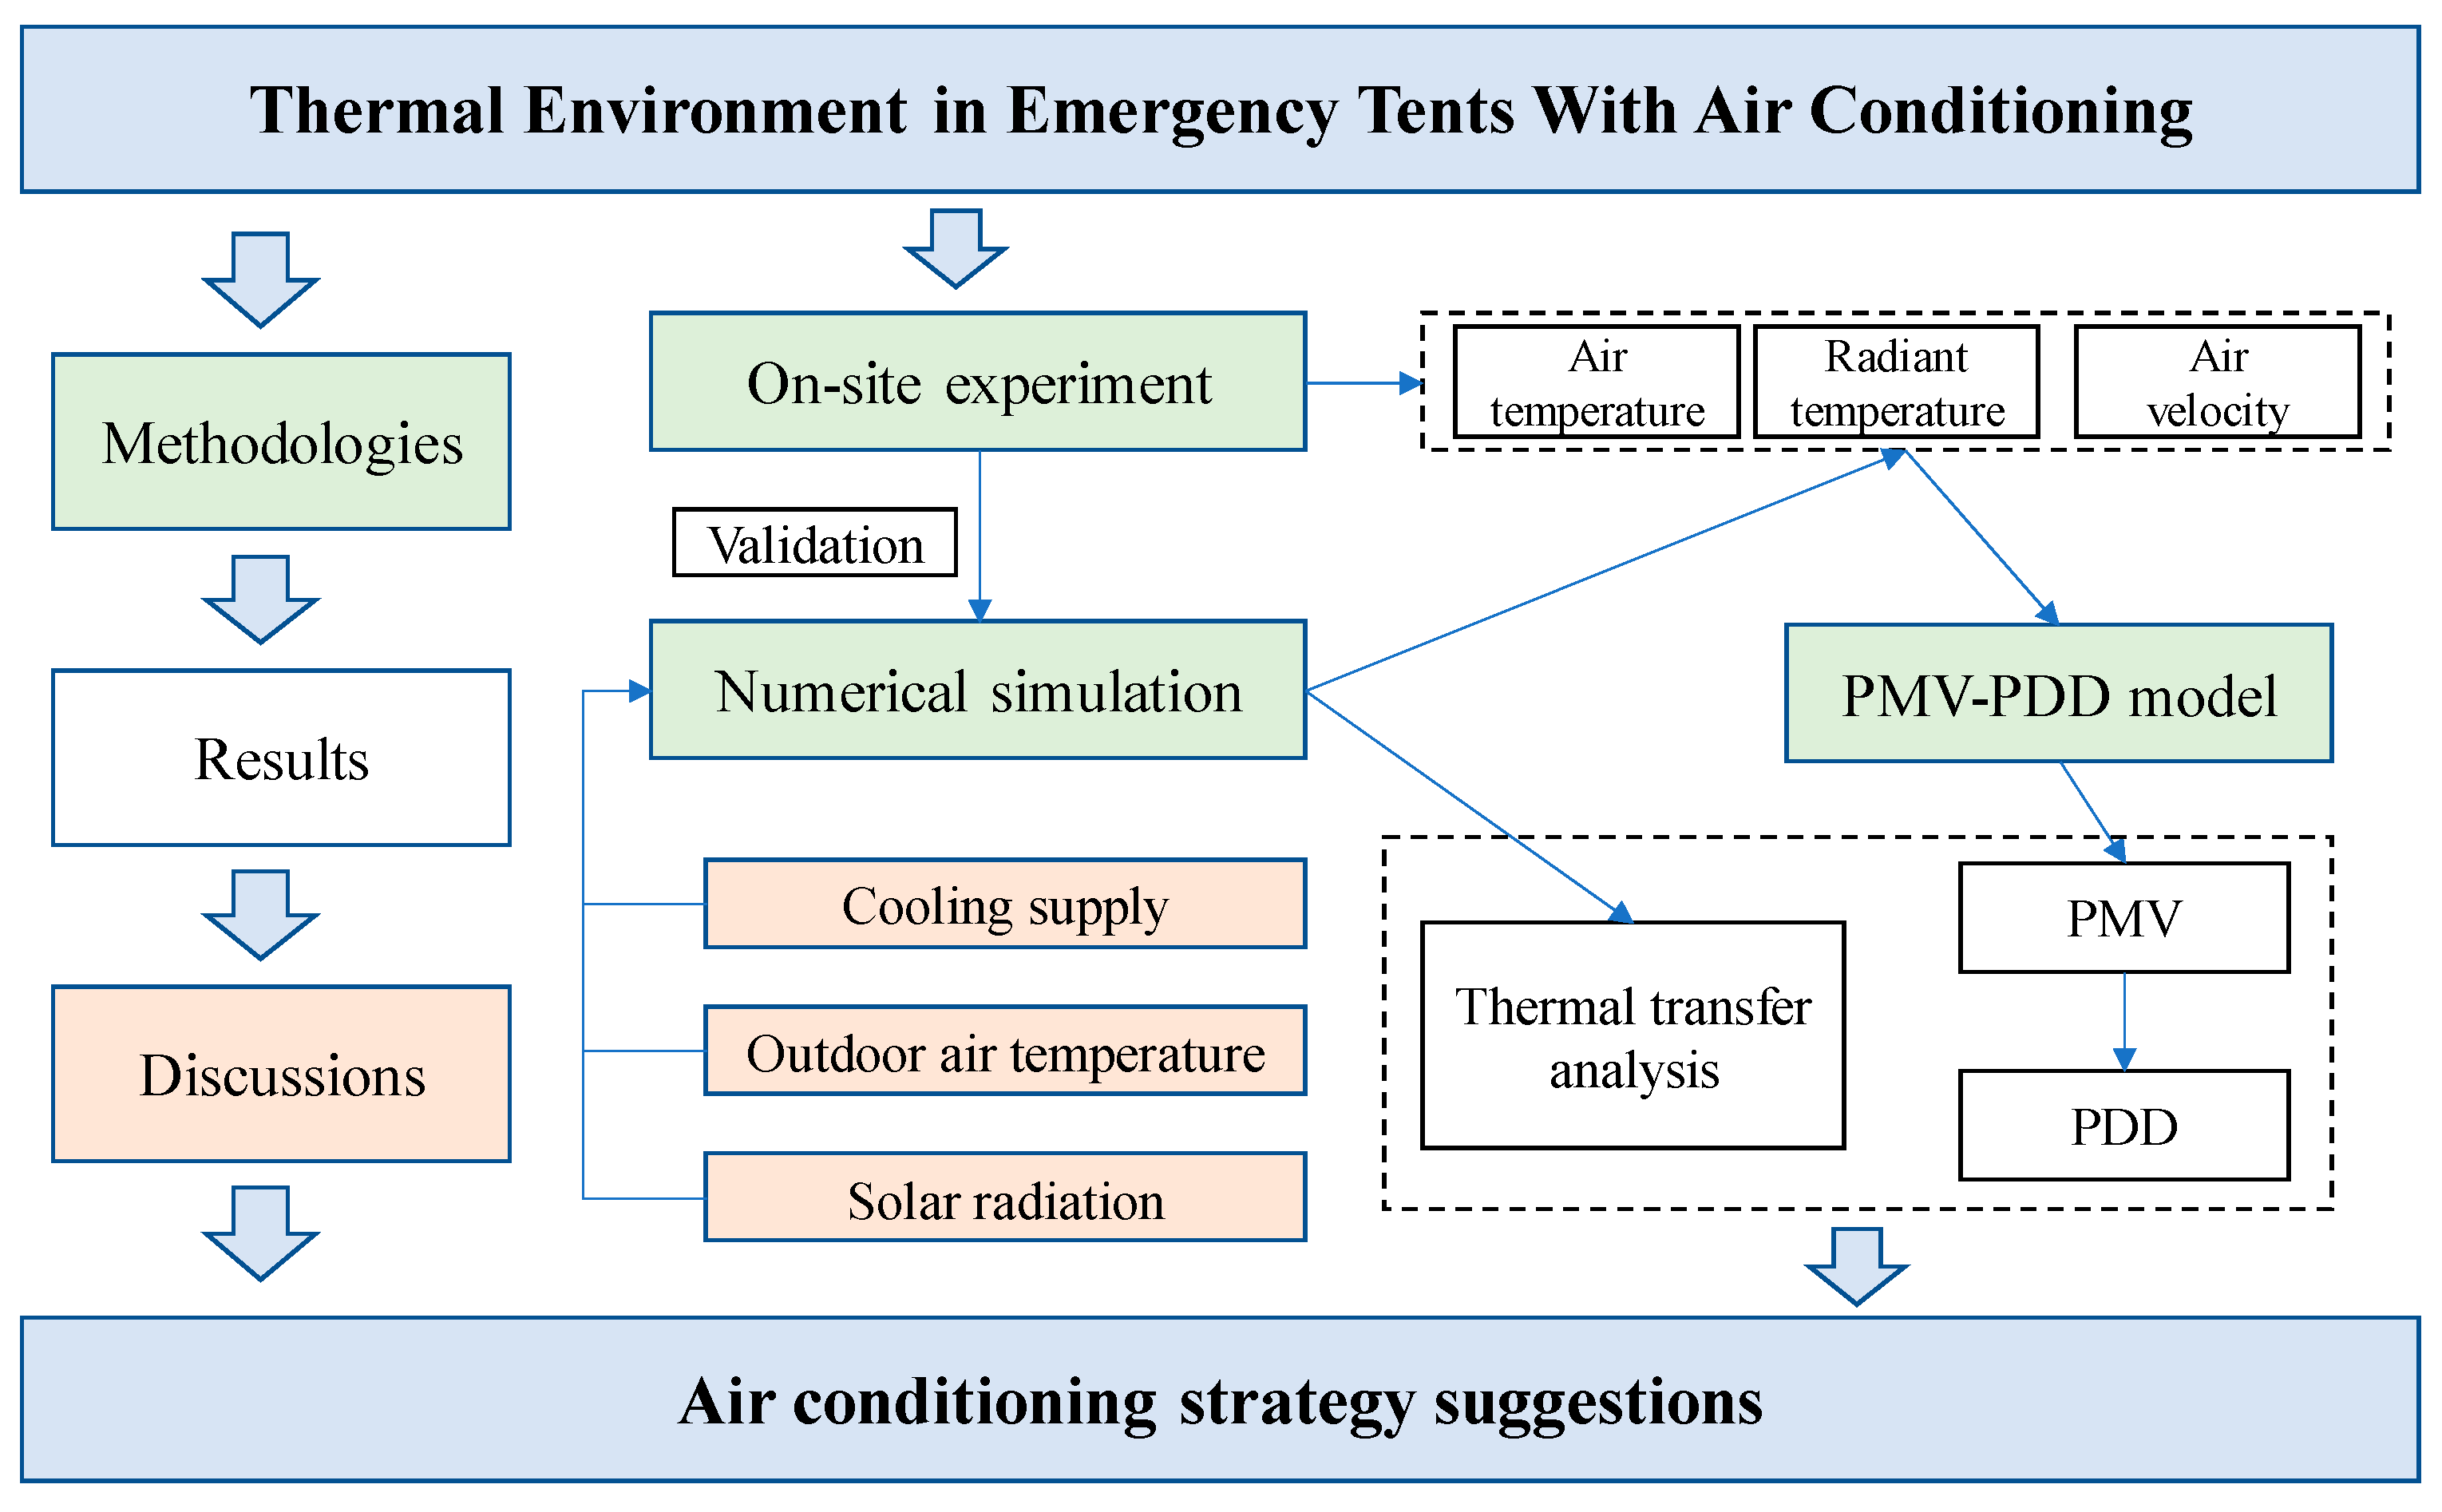
Figure 2.
Experimental setup overview.
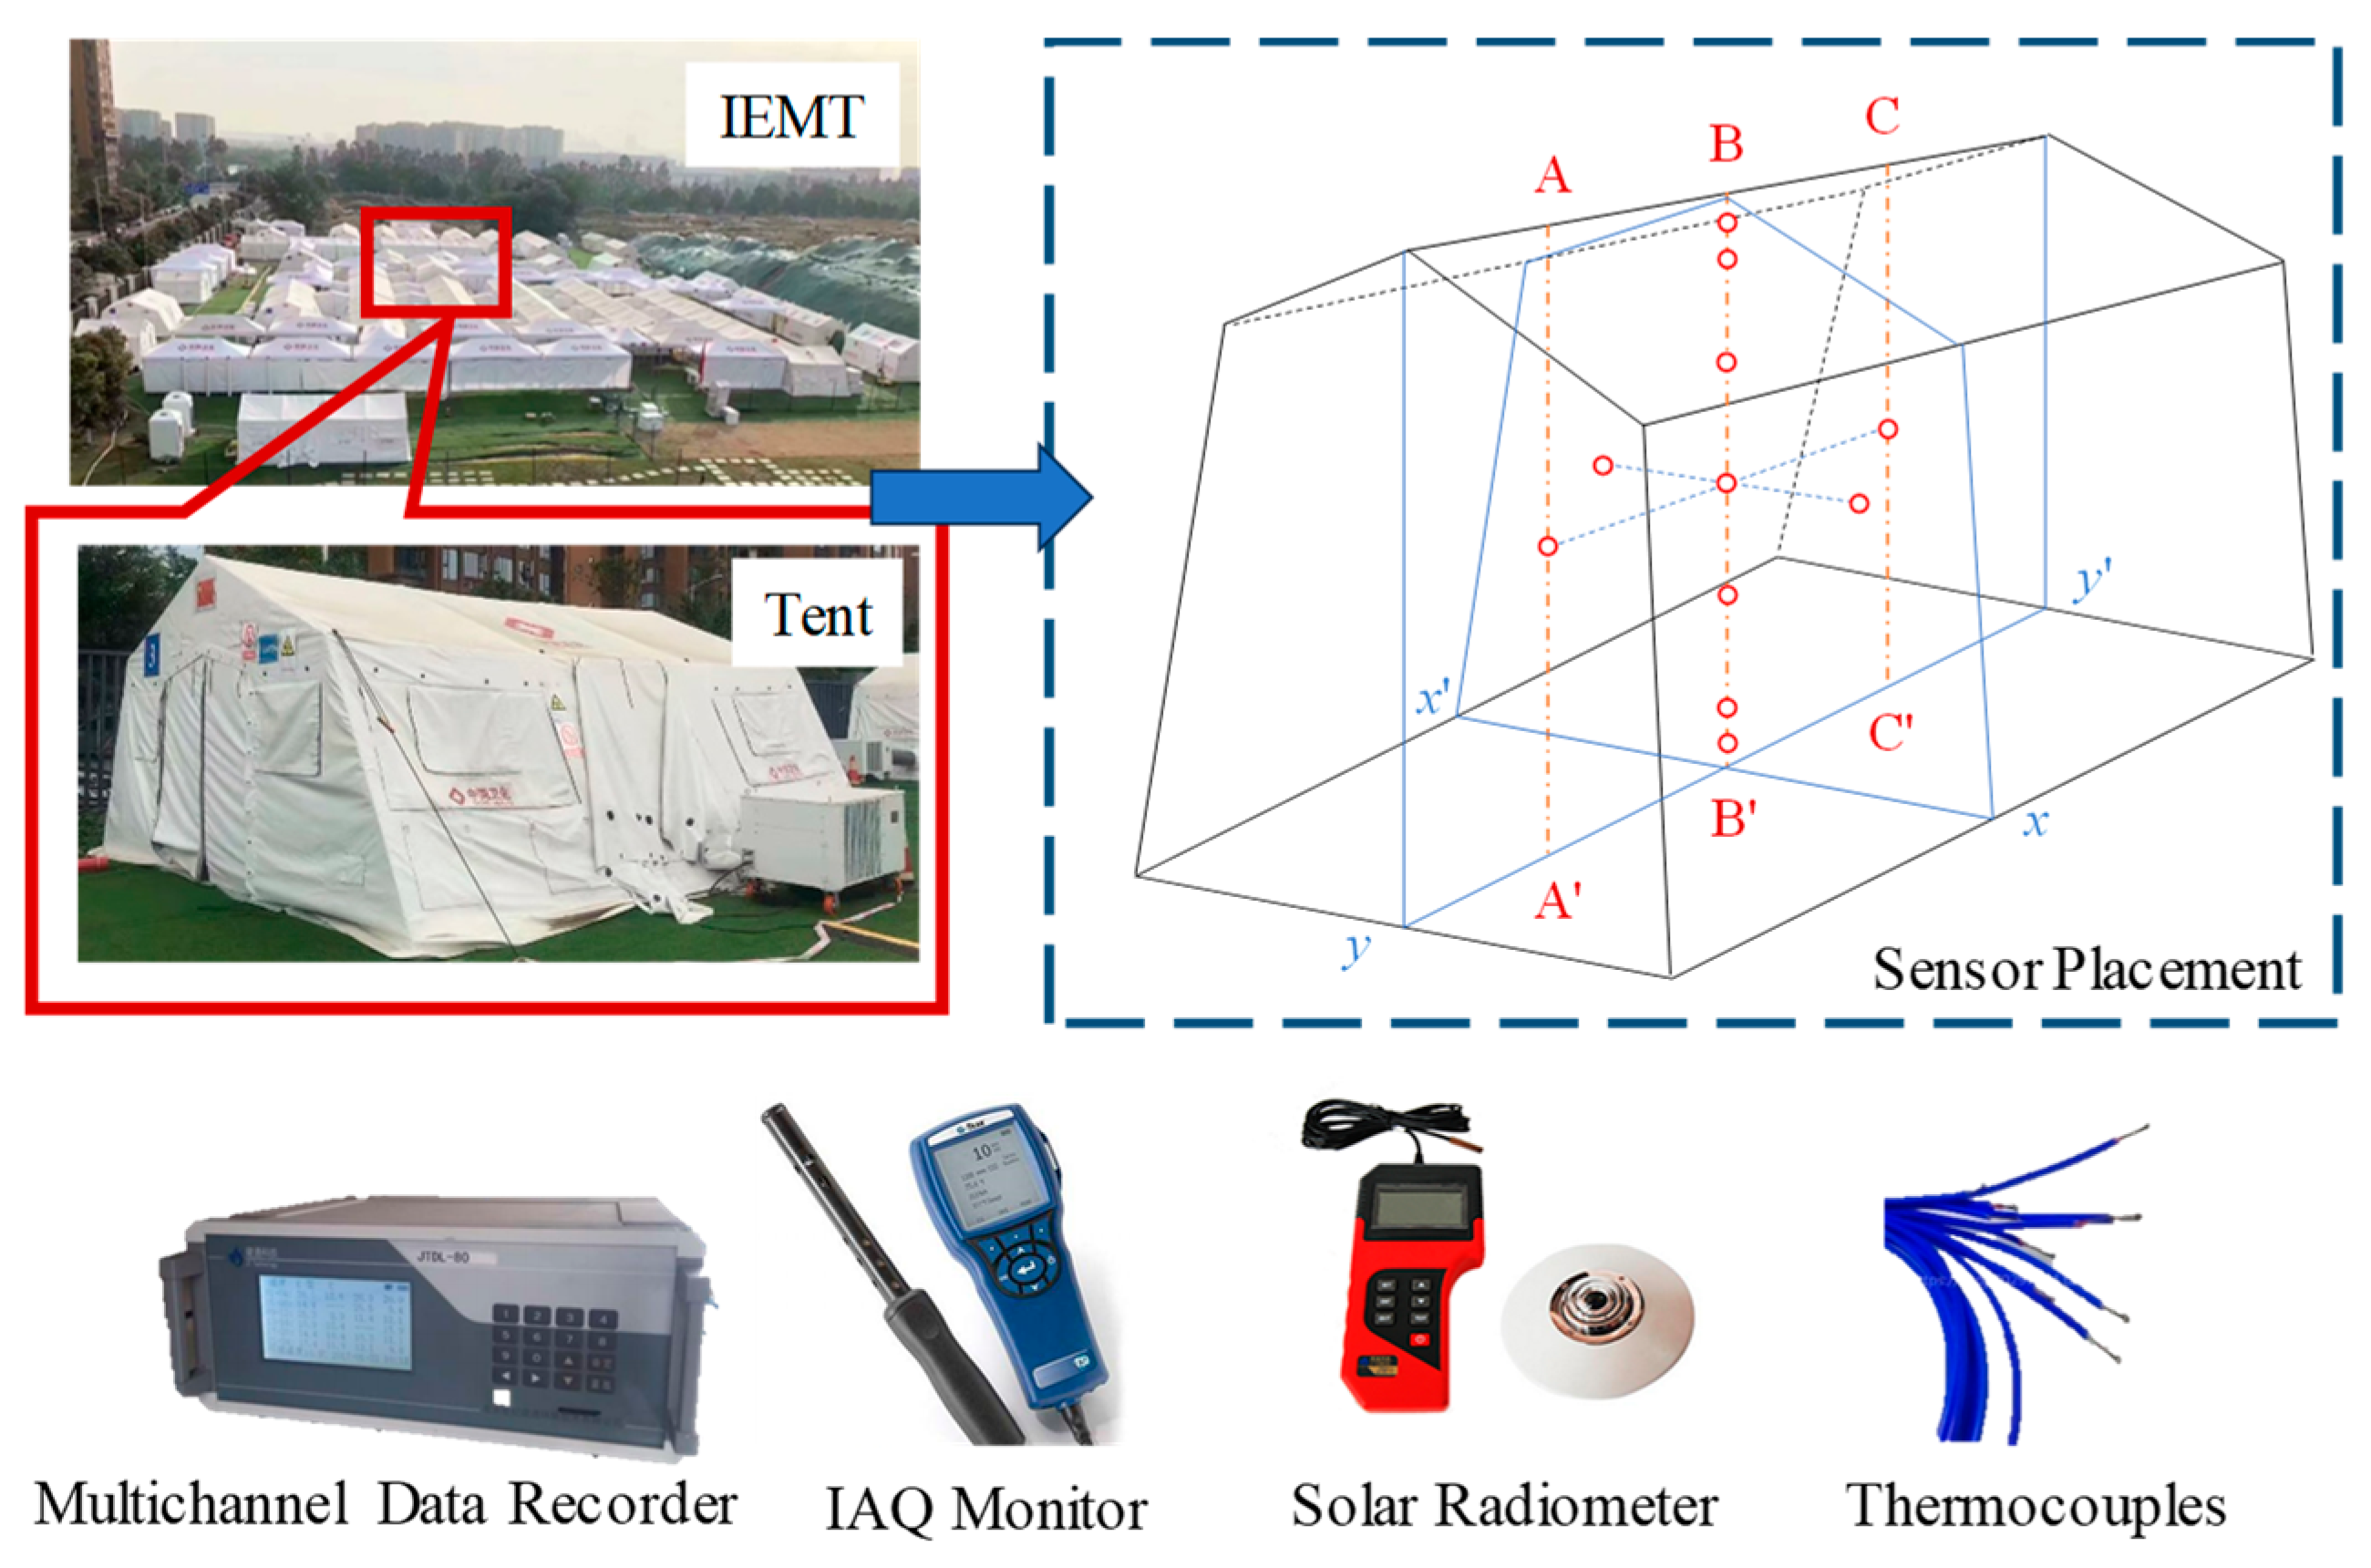
Figure 3.
Physical model of the emergency tent and mesh generation.

Figure 4.
Measured outdoor air temperature, solar radiation, and wind speed.

Figure 5.
The temperature variation curves of (a) five air temperature sensors on the horizontal plane; (b) three air temperature sensors on the vertical plane and the floor surface; (c) four inner wall surfaces; and (d) two inner roof surfaces.
Figure 5.
The temperature variation curves of (a) five air temperature sensors on the horizontal plane; (b) three air temperature sensors on the vertical plane and the floor surface; (c) four inner wall surfaces; and (d) two inner roof surfaces.
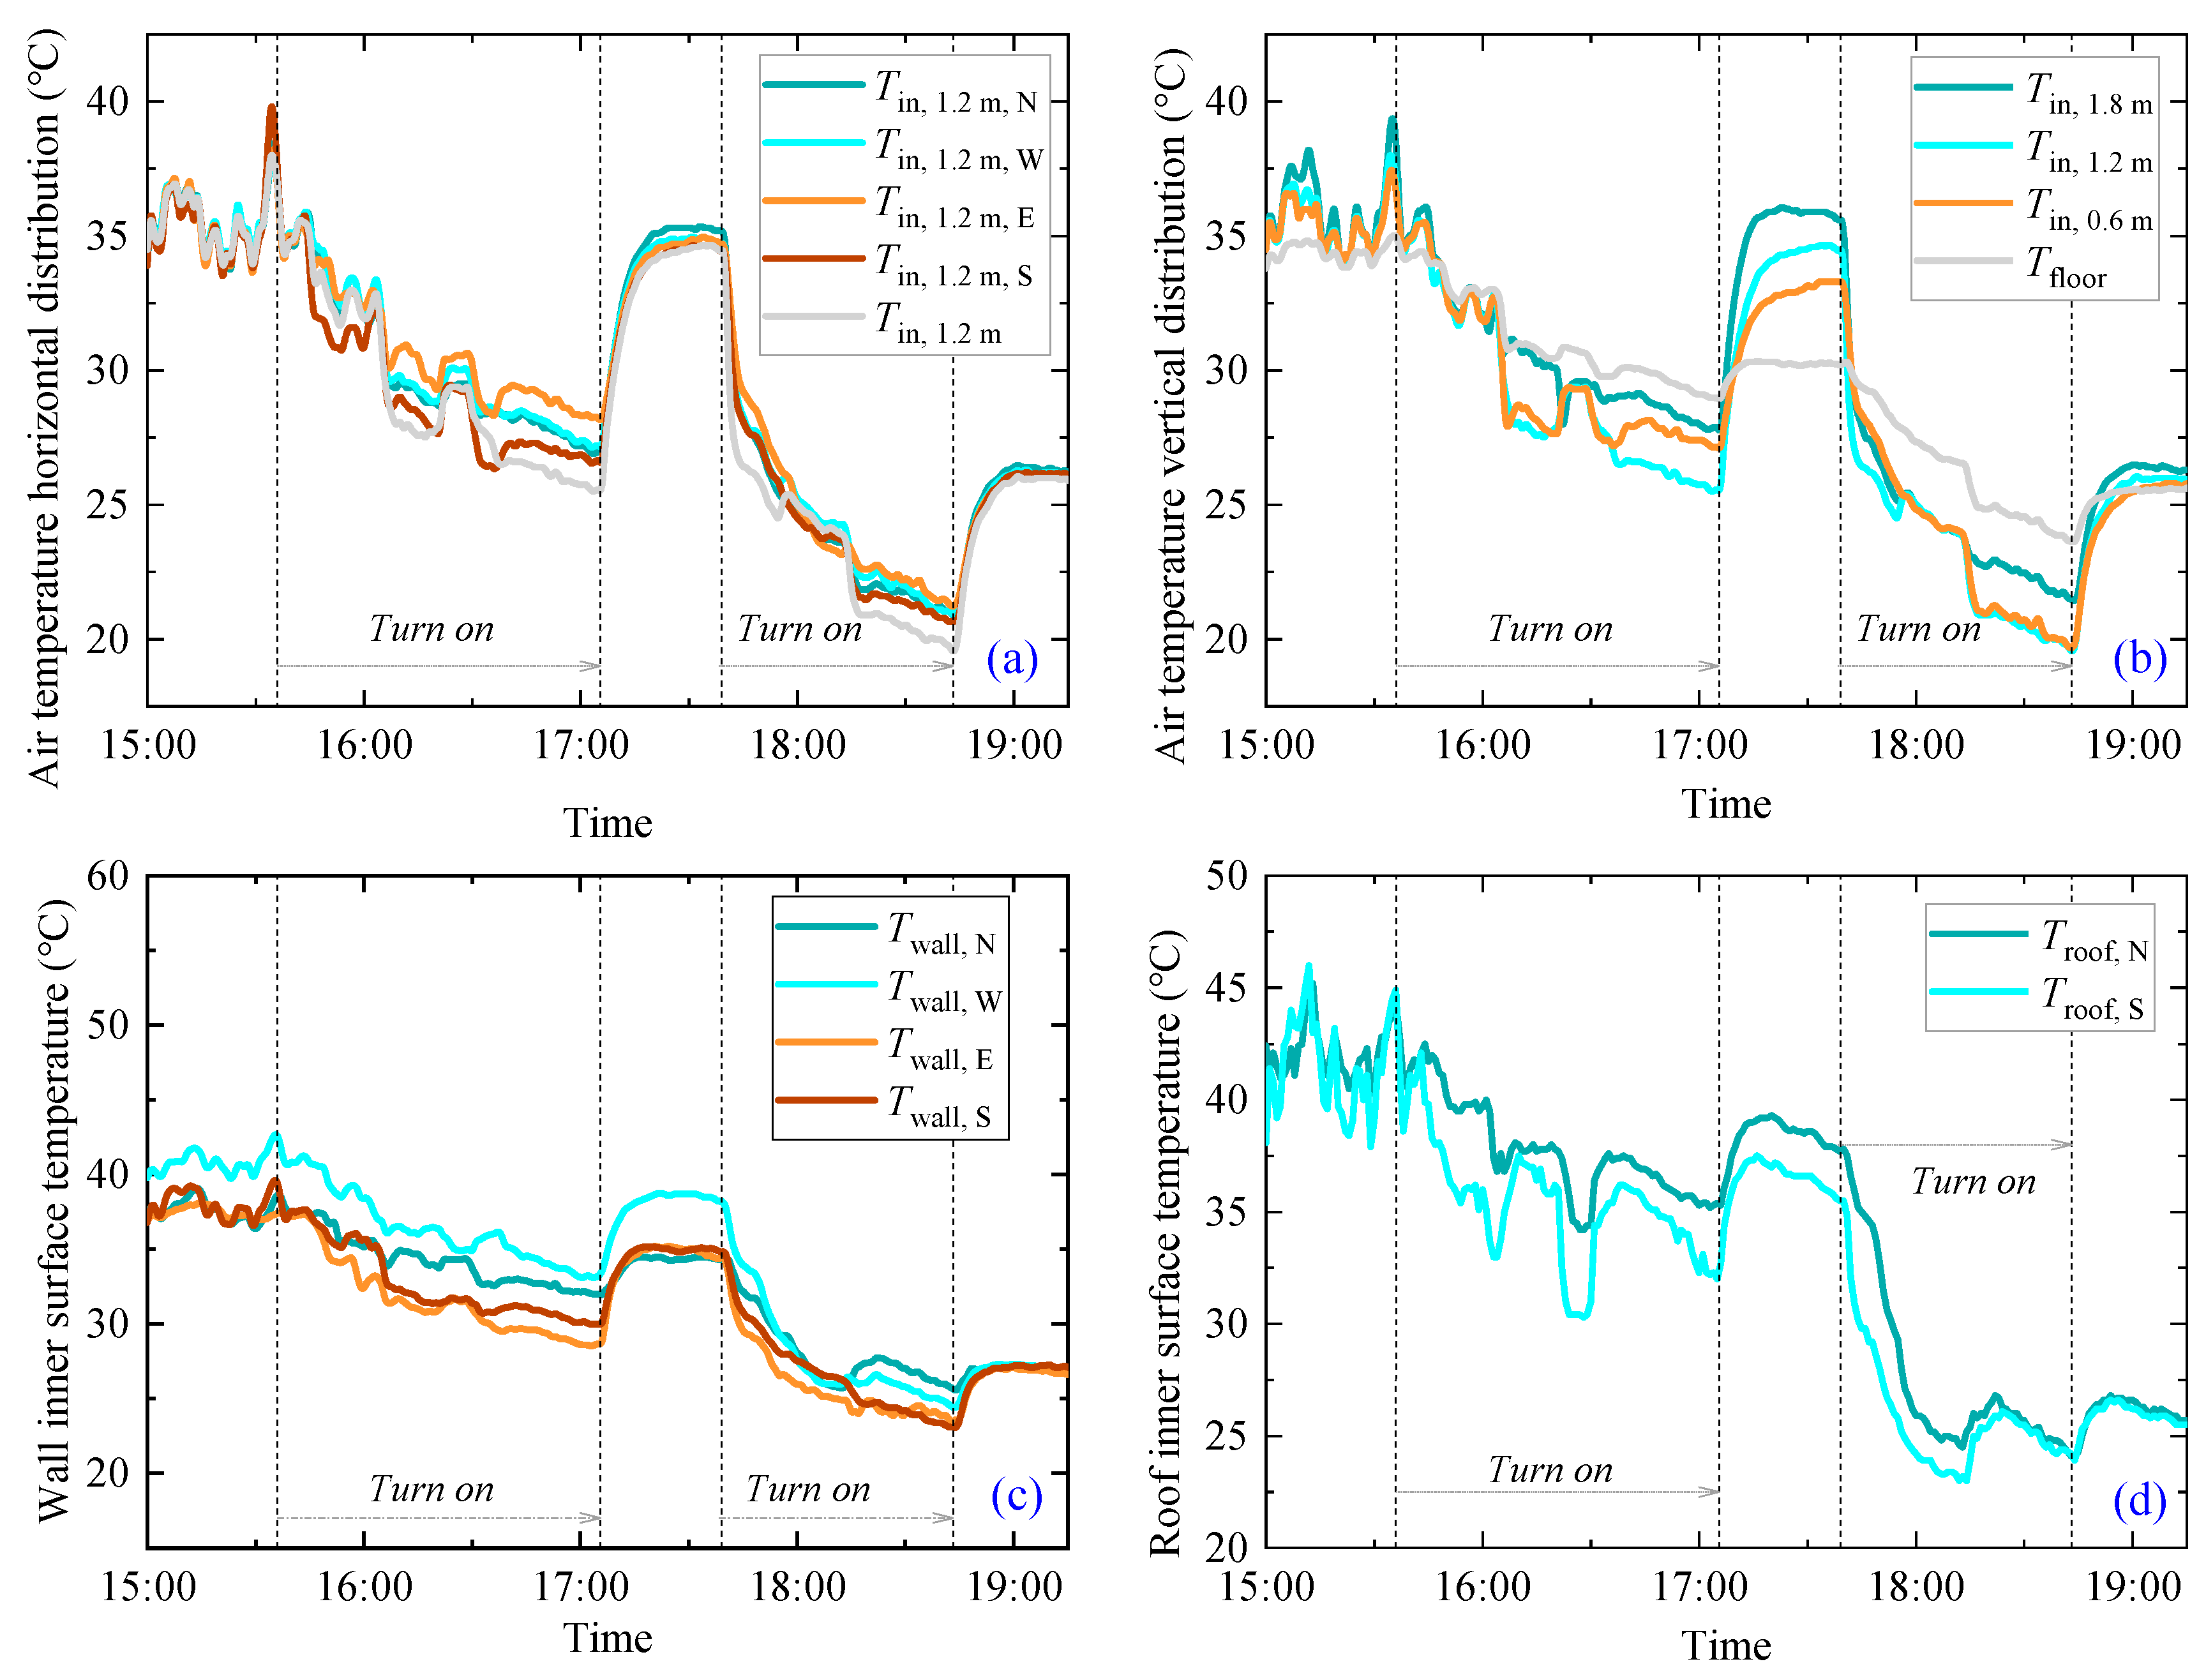
Figure 6.
The results of temperature uniformity within the tent during the experiment.
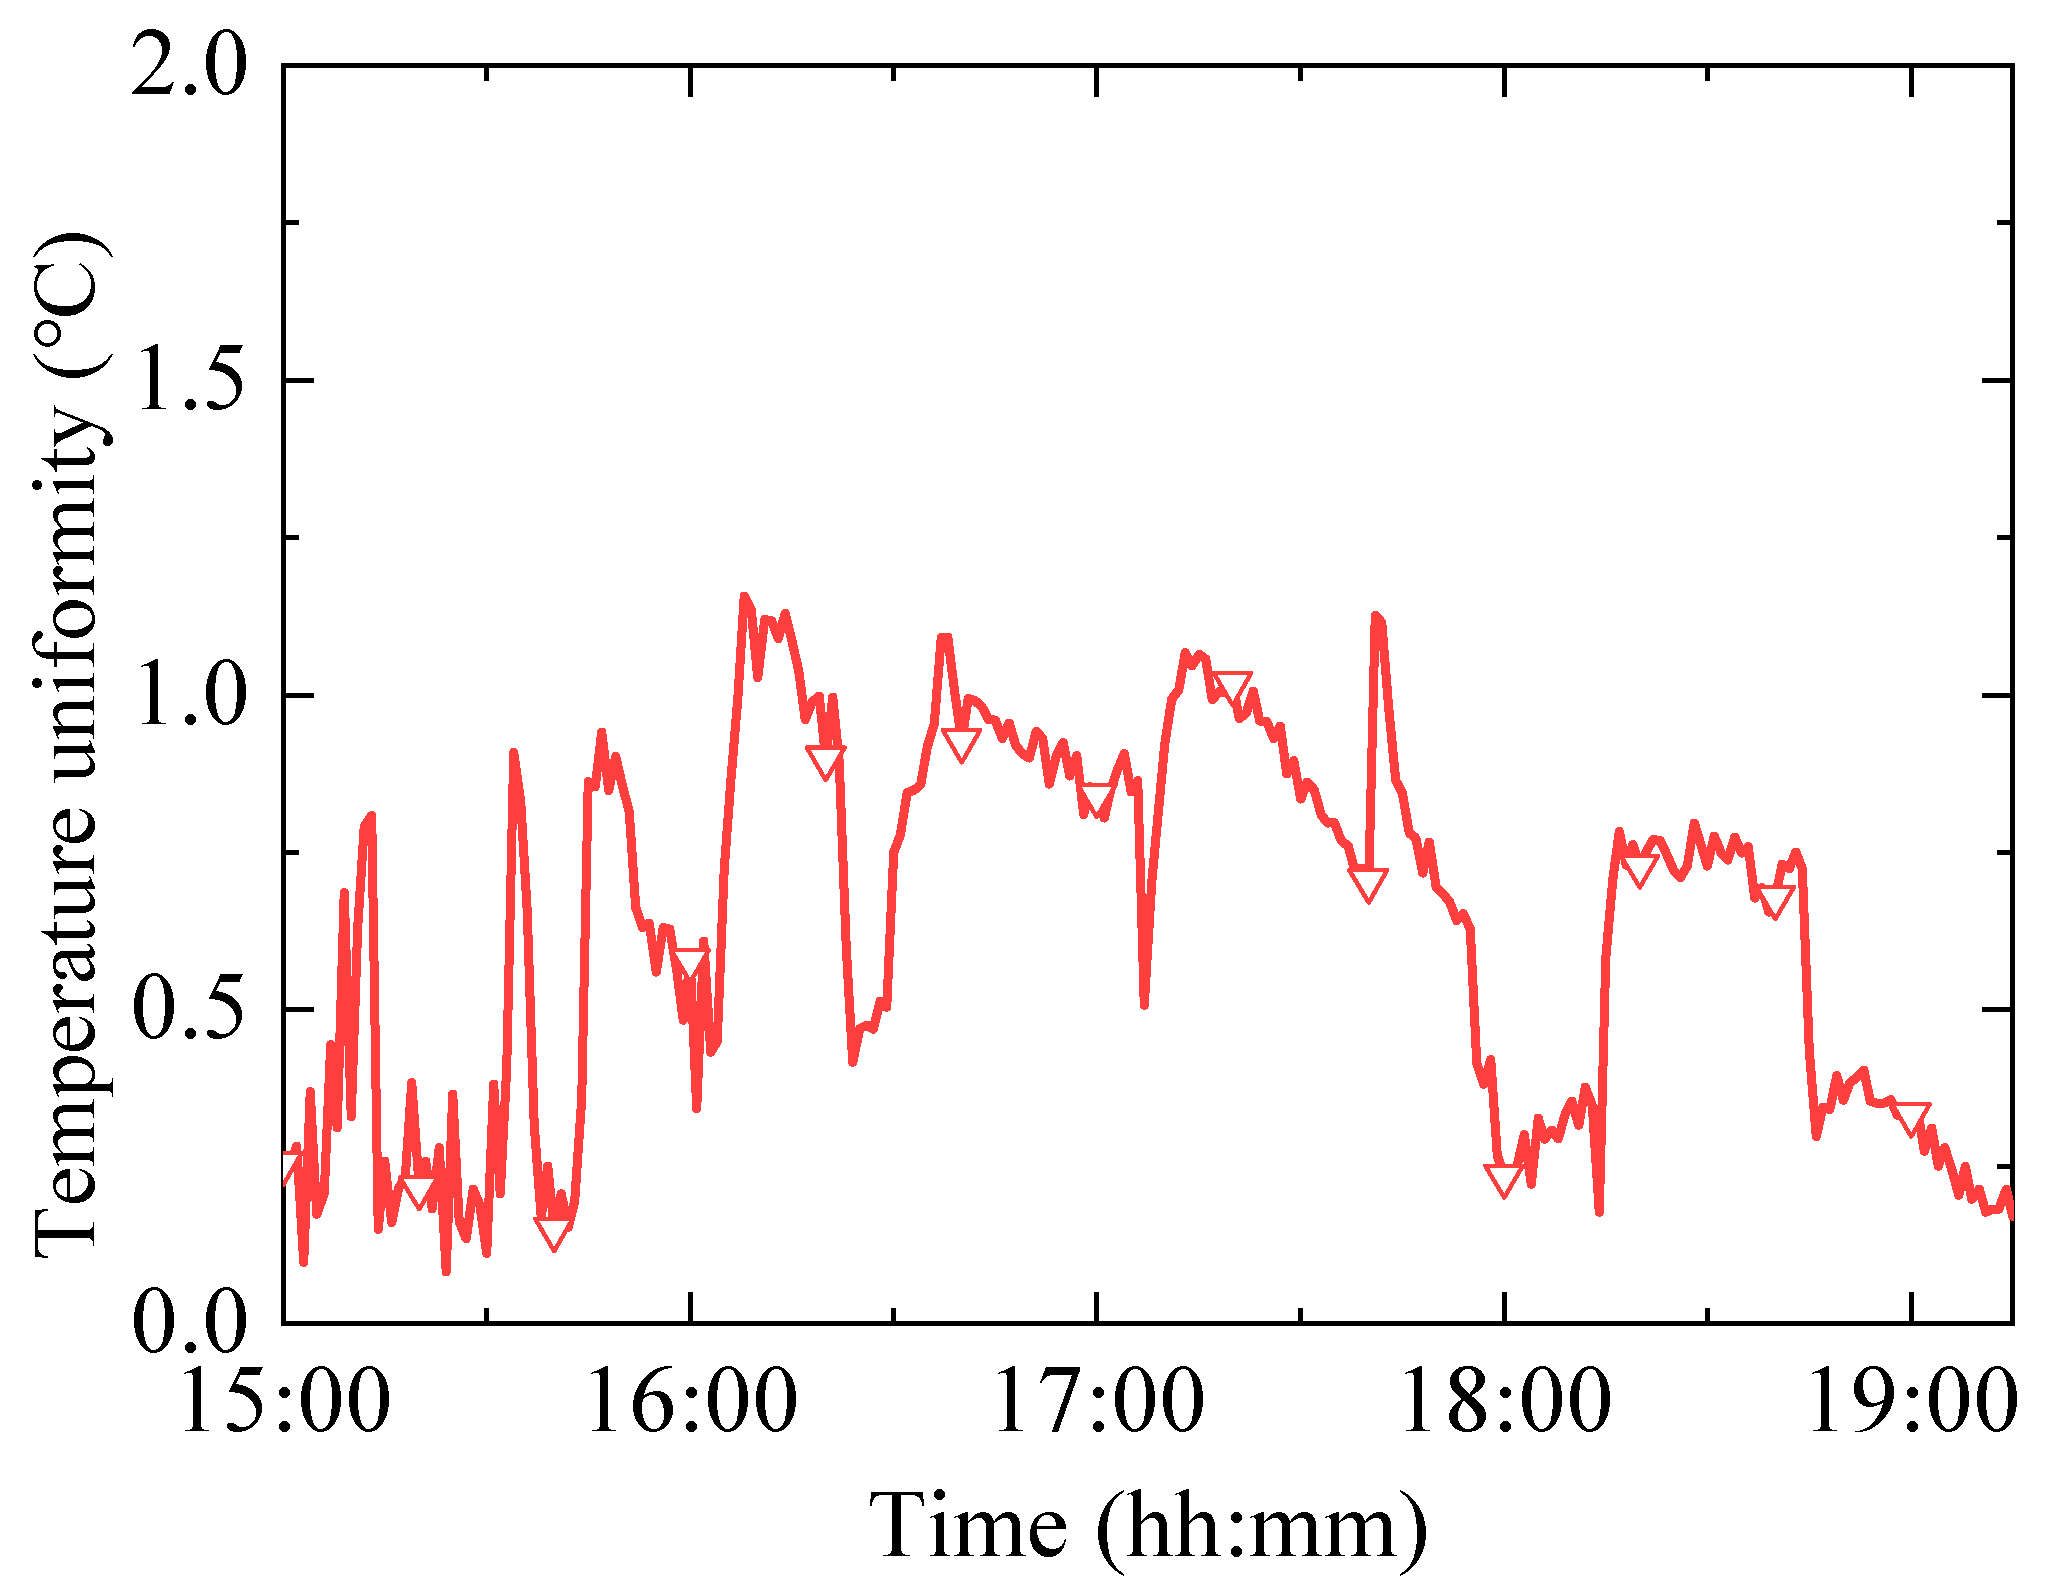
Figure 7.
The average temperature on the roof surface, the surrounding facade, the floor, and the air inside the tent during the experiment.
Figure 7.
The average temperature on the roof surface, the surrounding facade, the floor, and the air inside the tent during the experiment.
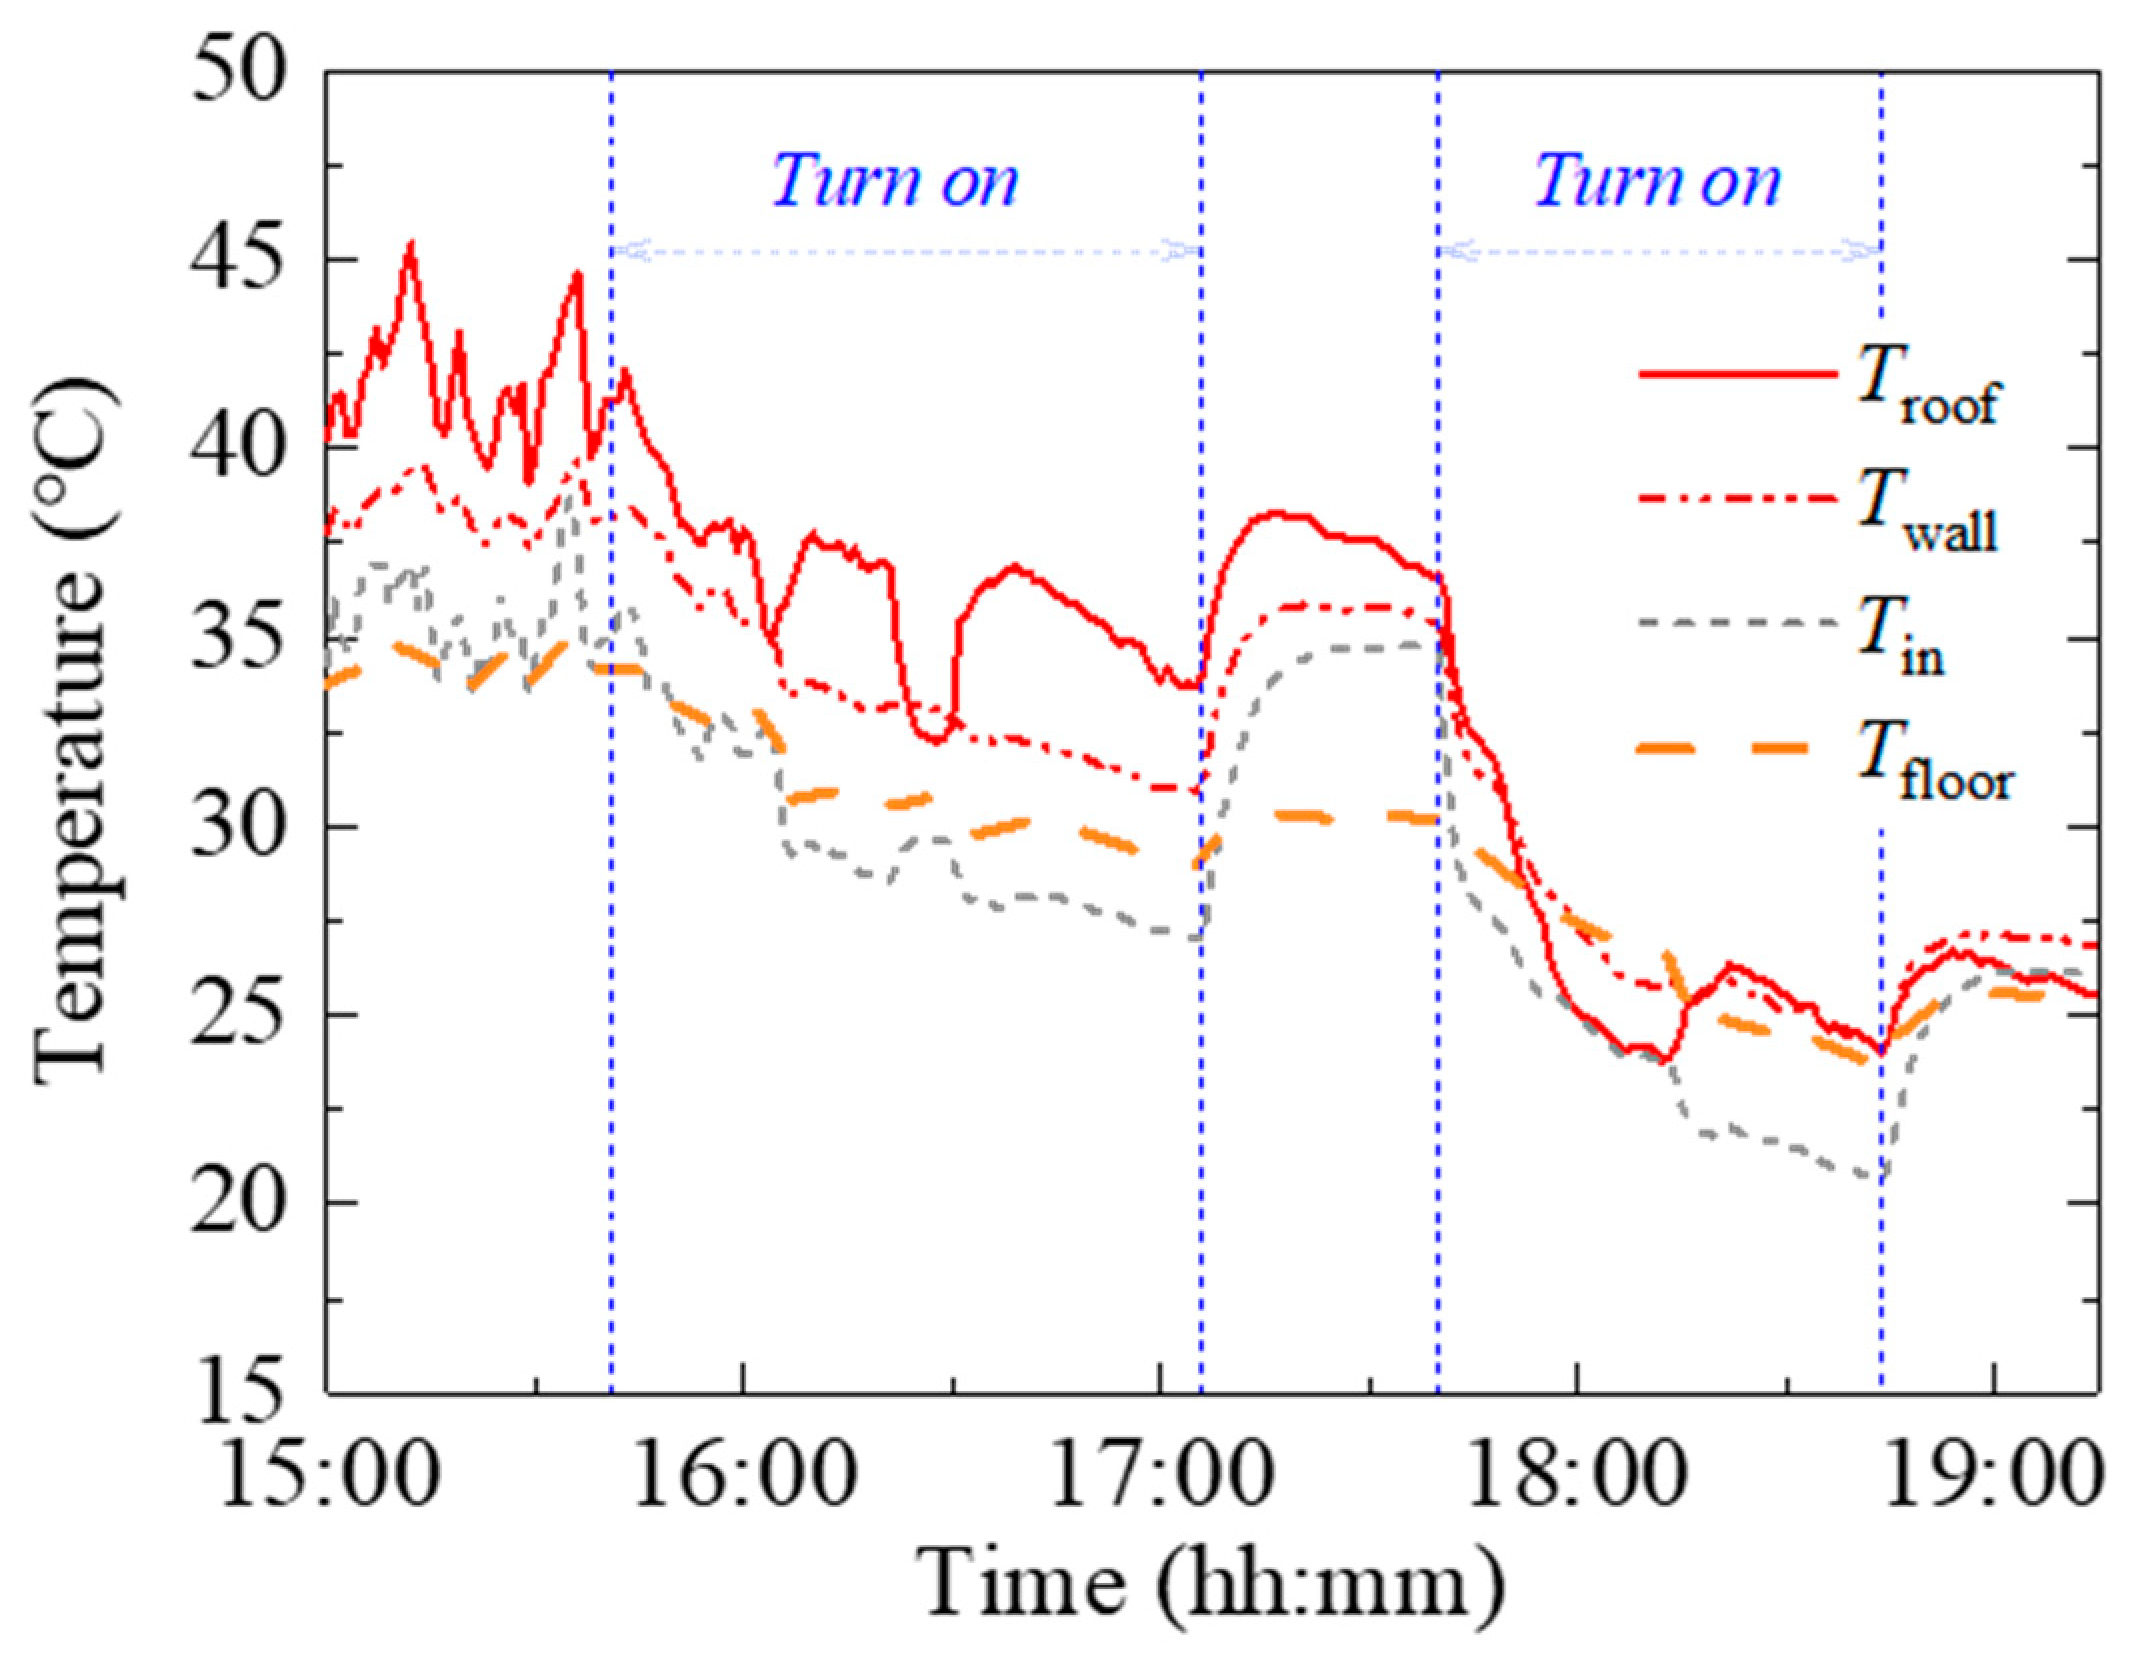
Figure 8.
Comparison of the simulated results and the measured data of (a) indoor air temperature, (b) floor surface temperature, (c) roof inner and outer surface temperature, (d) wall inner and outer surface temperature.
Figure 8.
Comparison of the simulated results and the measured data of (a) indoor air temperature, (b) floor surface temperature, (c) roof inner and outer surface temperature, (d) wall inner and outer surface temperature.
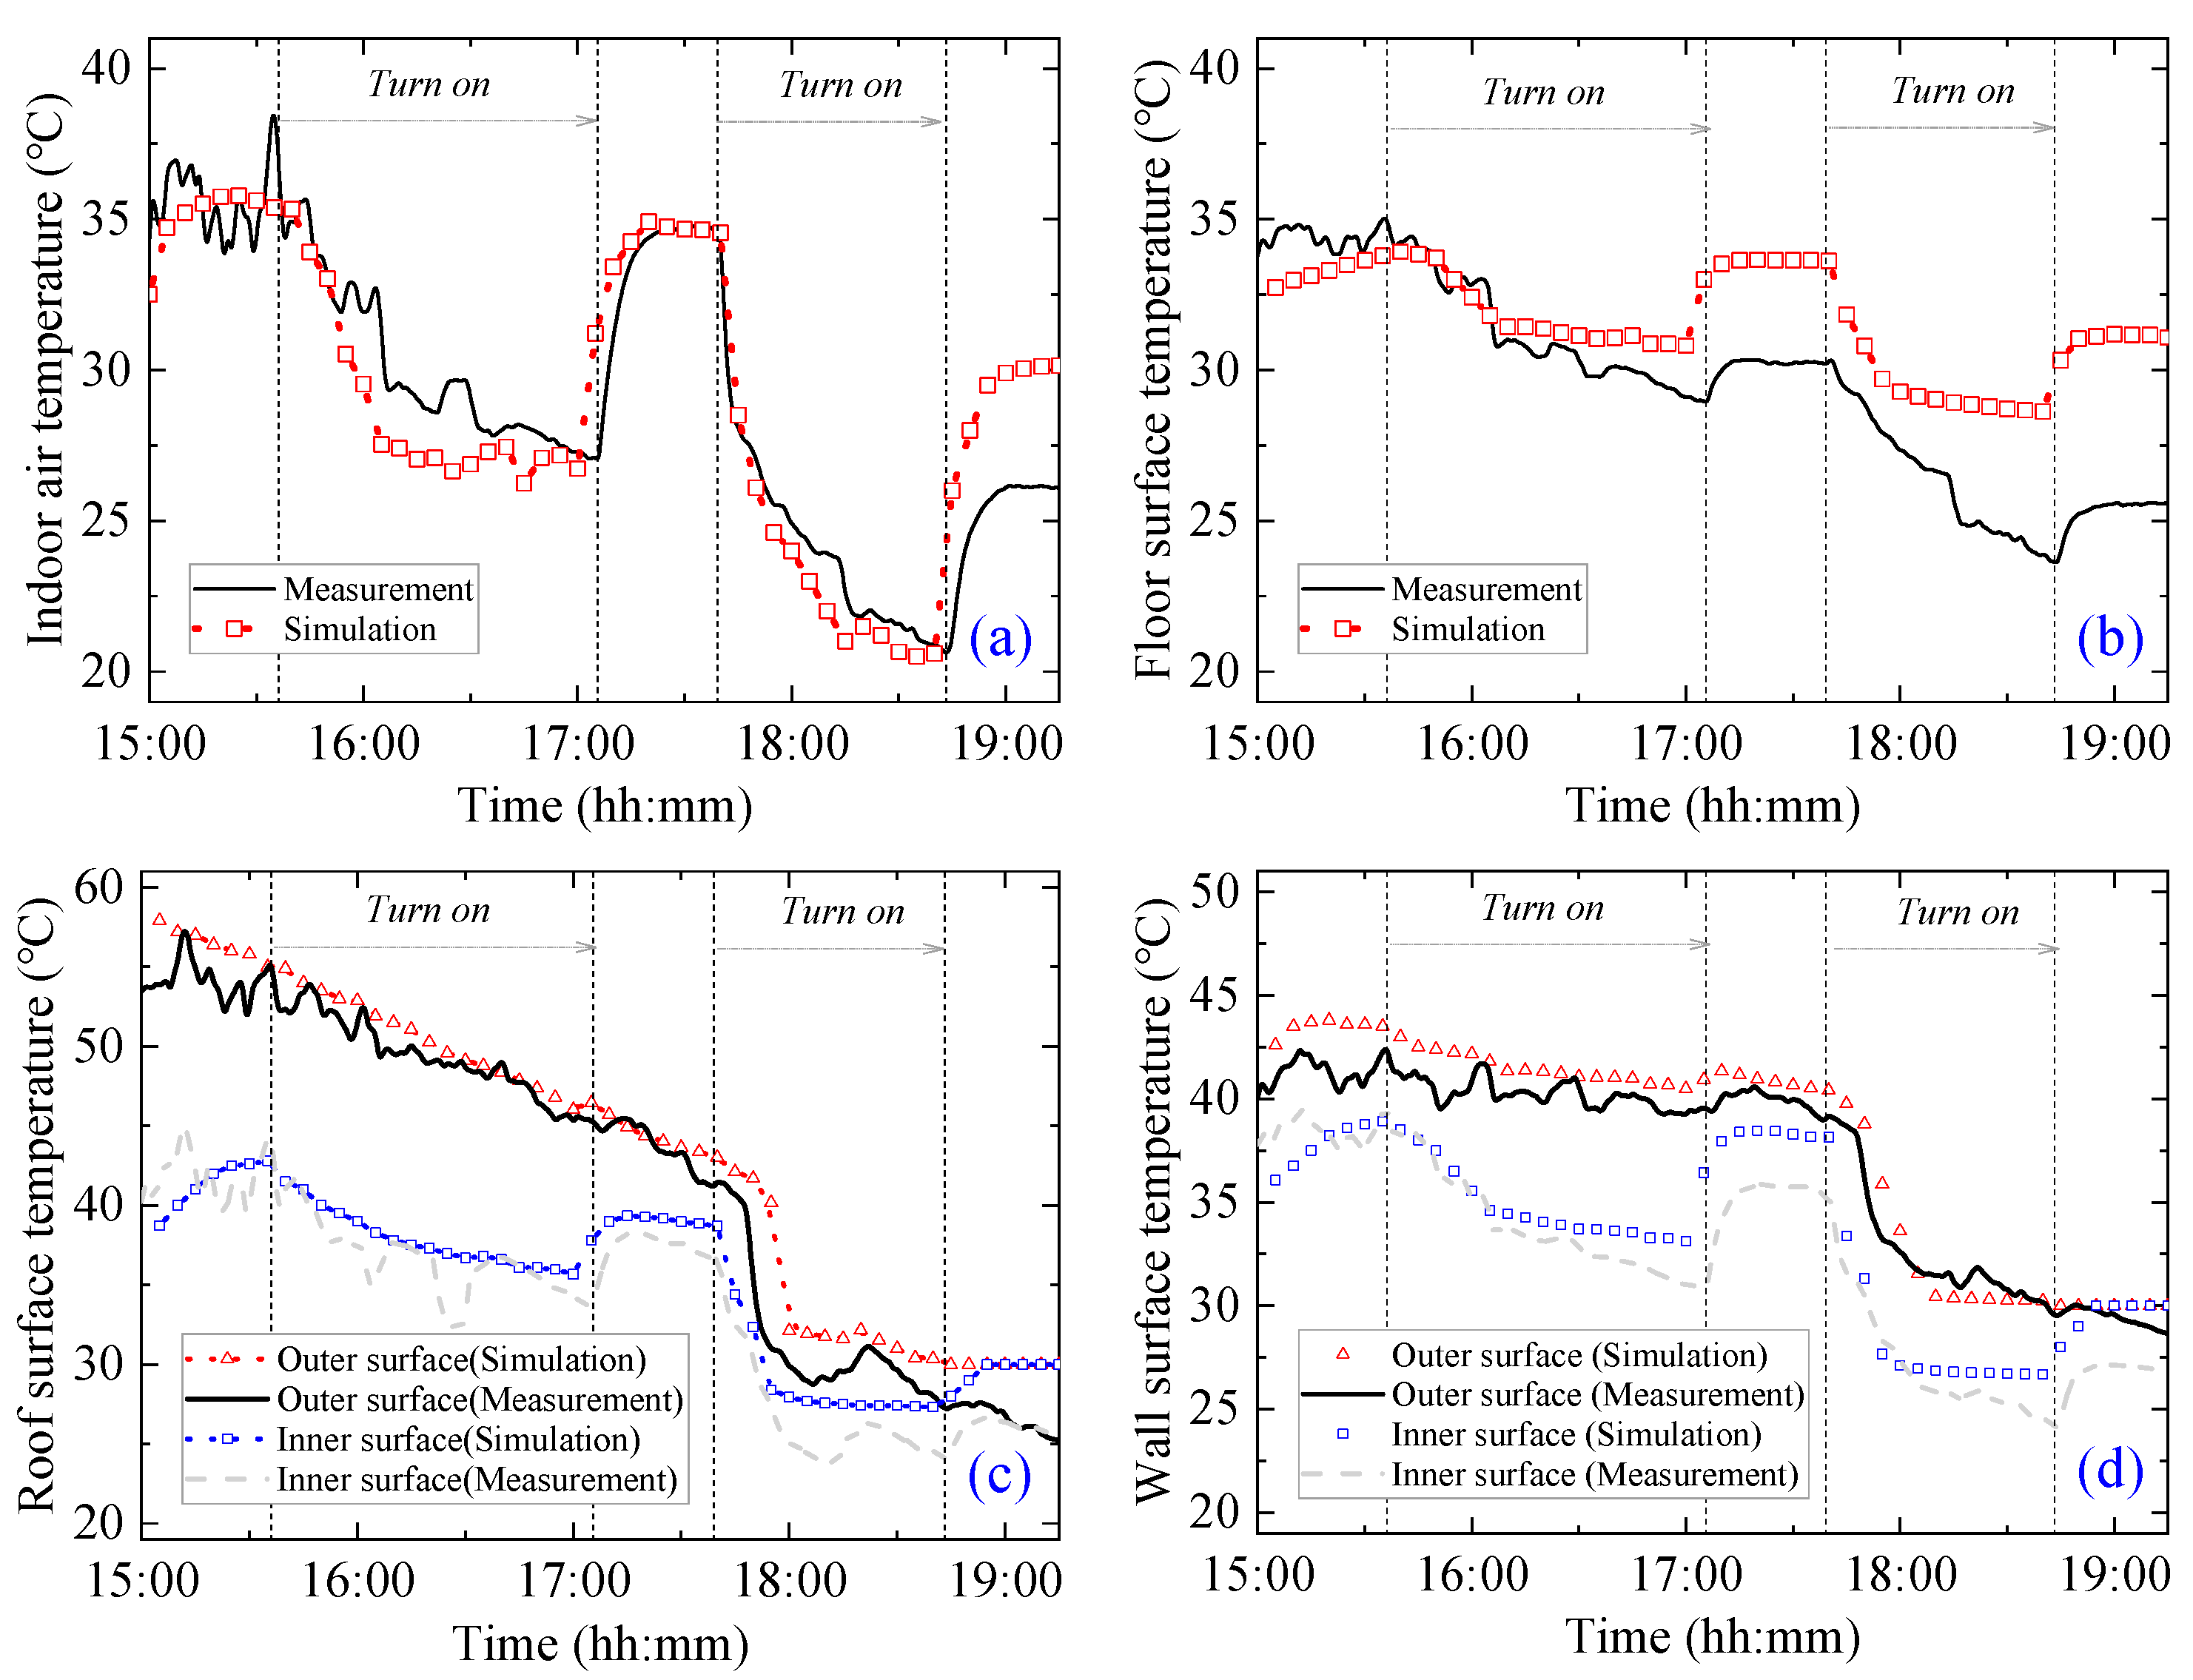
Figure 9.
Contour plots of (1) air temperature; (2) velocity; (3) MRT; (4) PMV; and (5) PPD of simulated results at 17:00. (H: horizontal section at Z = 1.1 m; V: vertical section at Y = 2.5 m).
Figure 9.
Contour plots of (1) air temperature; (2) velocity; (3) MRT; (4) PMV; and (5) PPD of simulated results at 17:00. (H: horizontal section at Z = 1.1 m; V: vertical section at Y = 2.5 m).
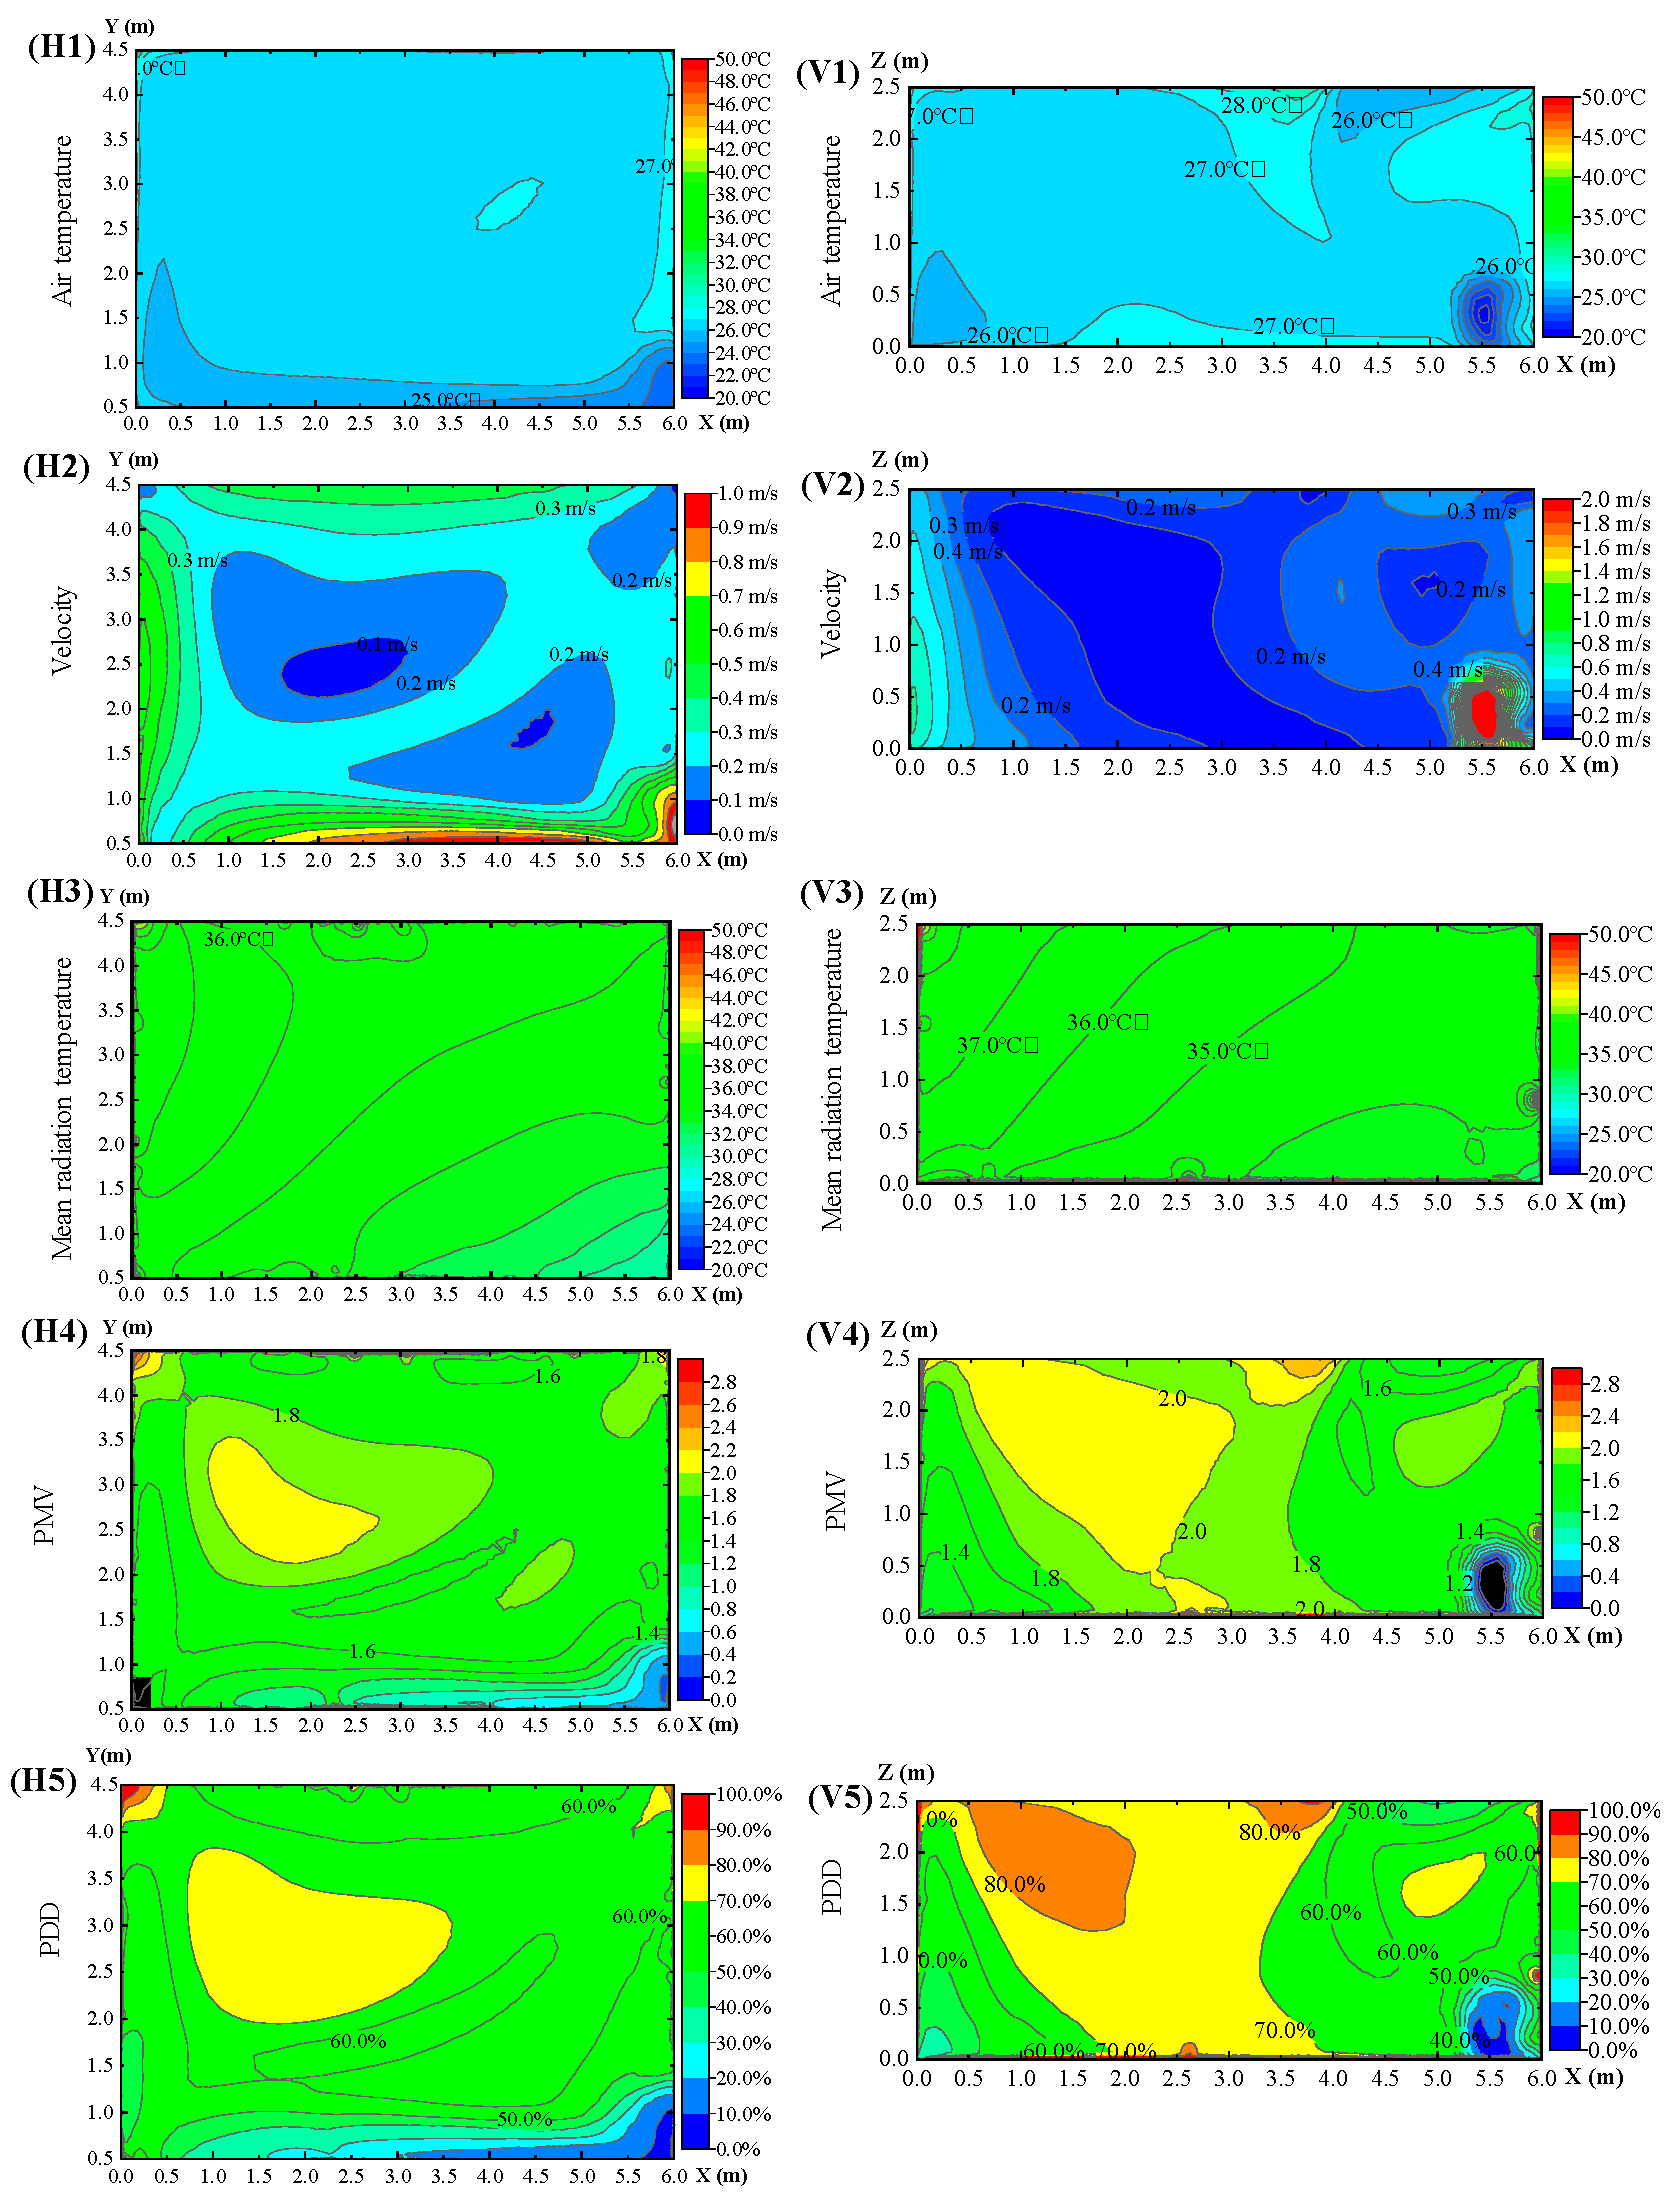
Figure 10.
Heat fluxes inside the tent.

Figure 11.
The distribution of (a) air temperature; (b) MRT; (c) PMV; and (d) PPD on the horizontal section at Z = 1.1 m with different cooling supplies.
Figure 11.
The distribution of (a) air temperature; (b) MRT; (c) PMV; and (d) PPD on the horizontal section at Z = 1.1 m with different cooling supplies.

Figure 12.
Heat fluxes on every heat transfer component of the tent.
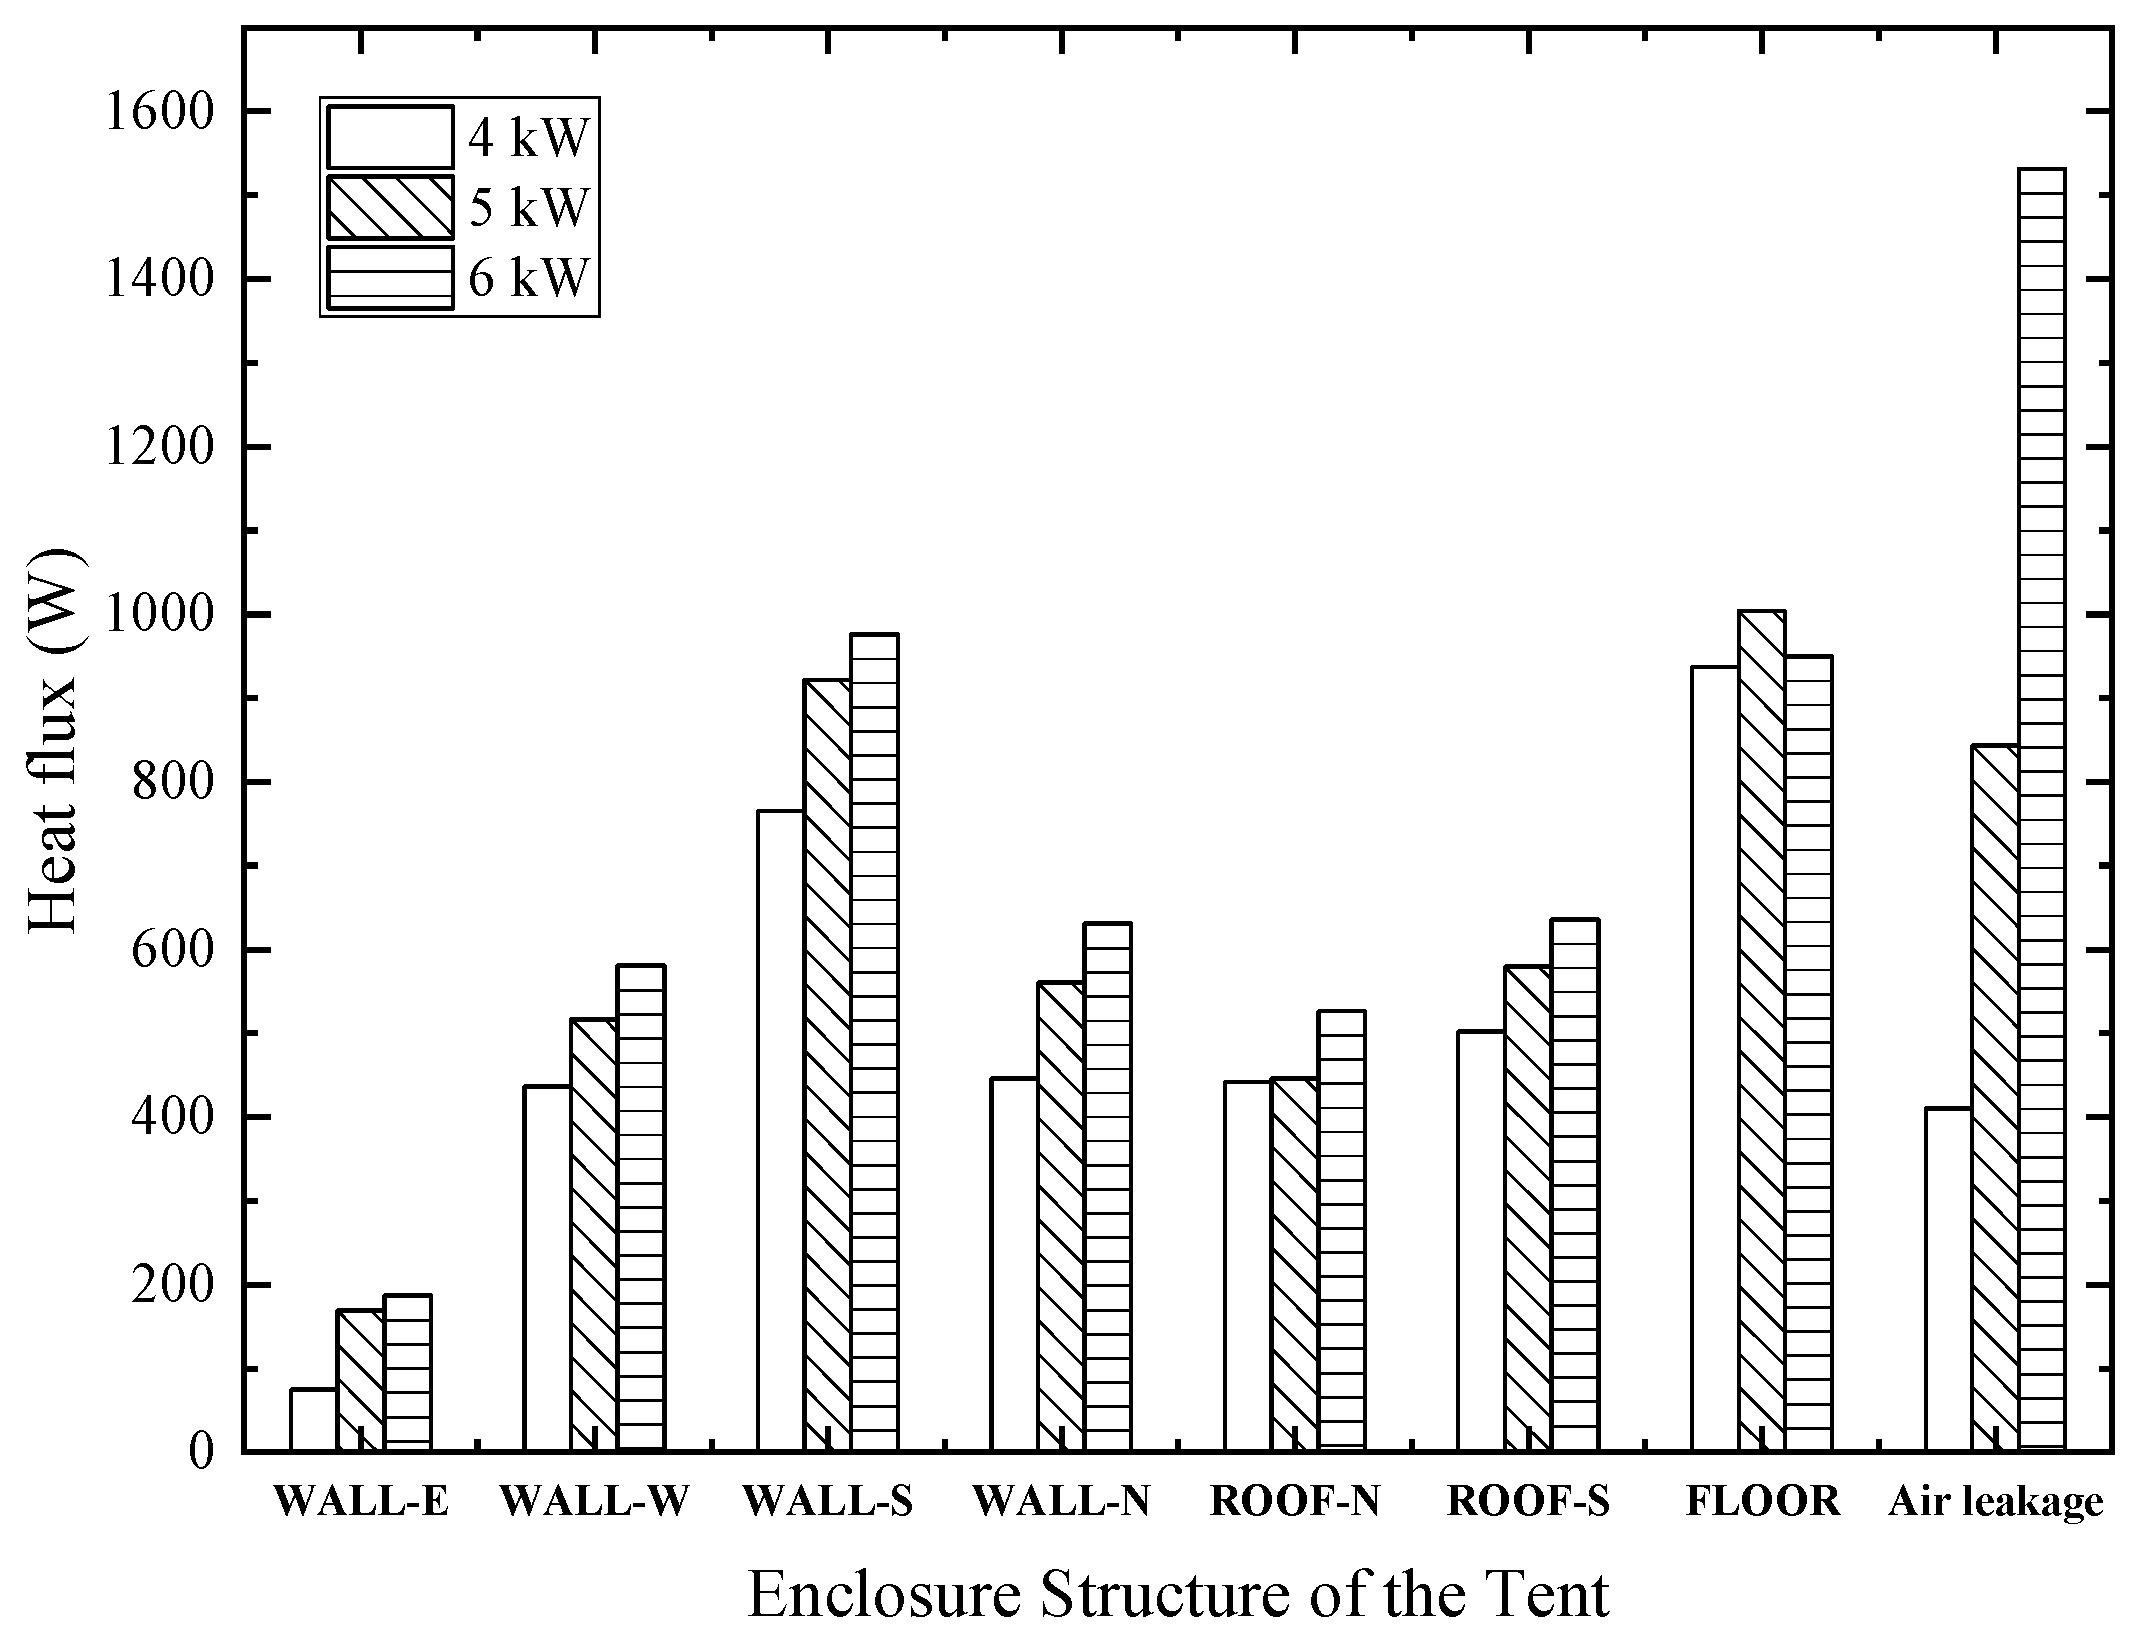
Figure 13.
The cooling capacity required to achieve indoor thermal comfort varies under different solar radiation intensities and outdoor air temperature (OT) conditions. The numerical labels in the figure represent the average indoor temperature inside the tent at these cooling capacities.
Figure 13.
The cooling capacity required to achieve indoor thermal comfort varies under different solar radiation intensities and outdoor air temperature (OT) conditions. The numerical labels in the figure represent the average indoor temperature inside the tent at these cooling capacities.

Table 1.
Model and precision of experimental testing instruments.
| Instrument Name | Model | Measuring Range | Accuracy |
|---|---|---|---|
| Solar Radiometer | JTR05 | 0~2000 W/m2 | ±2% |
| Indoor Air Quality (IAQ) Monitor | TrakPro-64 | 0~30 m/s | ±(0.1 m/s + 5%) |
| Thermocouple Sensor | T-type | −200~350 °C | ±0.5 °C |
| Multichannel Data Recorder | JTDL-80 | −20~100 °C | ±(0.5 °C + 5%) |
Table 2.
Air-conditioning operation schedule.
| Time | 15:00–15:37 | 15:37–17:05 | 17:05–17:37 | 17:37–18:40 | 18:40–19:15 |
|---|---|---|---|---|---|
| Operation | off | on | off | on | off |
Disclaimer/Publisher’s Note: The statements, opinions and data contained in all publications are solely those of the individual author(s) and contributor(s) and not of MDPI and/or the editor(s). MDPI and/or the editor(s) disclaim responsibility for any injury to people or property resulting from any ideas, methods, instructions or products referred to in the content. |
© 2024 by the authors. Licensee MDPI, Basel, Switzerland. This article is an open access article distributed under the terms and conditions of the Creative Commons Attribution (CC BY) license (https://creativecommons.org/licenses/by/4.0/).
Share and Cite
MDPI and ACS Style
Xiang, M.; Liao, Y.; Jia, Y.; Zhang, W.; Long, E. Summer Thermal Challenges in Emergency Tents: Insights into Thermal Characteristics of Tents with Air Conditioning. Buildings 2024, 14, 710. https://doi.org/10.3390/buildings14030710
AMA Style
Xiang M, Liao Y, Jia Y, Zhang W, Long E. Summer Thermal Challenges in Emergency Tents: Insights into Thermal Characteristics of Tents with Air Conditioning. Buildings. 2024; 14(3):710. https://doi.org/10.3390/buildings14030710
Chicago/Turabian StyleXiang, Mingli, Yuxuan Liao, Yonghong Jia, Wentao Zhang, and Enshen Long. 2024. "Summer Thermal Challenges in Emergency Tents: Insights into Thermal Characteristics of Tents with Air Conditioning" Buildings 14, no. 3: 710. https://doi.org/10.3390/buildings14030710
Note that from the first issue of 2016, this journal uses article numbers instead of page numbers. See further details here.