Article

Sustainability Evaluation of Residential Buildings Based on the Footprint Family: Application to Case Studies in Andalusia

by
Jaime Solís-Guzmán
1,
Paula Garzón-González
1,
Patricia González-Vallejo
2 and
Madelyn Marrero
1,*
1
ArDiTec Research Group, Department of Architectural Constructions II, Higher Technical School of Building Engineering, Universidad de Sevilla, Av. Reina Mercedes 4-a, 41012 Seville, Spain
2
ArDiTec Research Group, Department of Graphic Engineering, Higher Technical School of Engineering, Universidad de Sevilla, 41092 Seville, Spain
*
Author to whom correspondence should be addressed.
Buildings 2024, 14(4), 1131; https://doi.org/10.3390/buildings14041131
Submission received: 15 March 2024 / Revised: 11 April 2024 / Accepted: 15 April 2024 / Published: 17 April 2024
(This article belongs to the Special Issue Advances in Project Development and Construction Management)

Abstract

:
The criteria on green public procurement of the European Union establish that the economic budgets of building projects must be complemented by their derived environmental and social costs. These criteria are currently being adapted to the requirements related to the circular economy, such as the use of methods to evaluate buildings environmentally. However, most methods available in the European and Spanish markets require prior training, which makes their use difficult. This paper presents an evaluation method, CEACE, for housing construction based on the determination of their footprints (ecological, carbon, and water footprints), also called the footprint family, to which the economic and social evaluation is added, as is the quantification of the construction and demolition waste generated. This method is validated with the assessment of fifteen residential buildings in Andalusia and creates an indicator that will allow technicians, companies, and administrations to evaluate projects in accordance with the criteria of green public procurement. The method is sensitive to changes in the type of building, foundation solution, and underground construction.

1. Introduction

The application of the circular economy and resource efficiency principles to buildings has become essential. Its life cycle is associated with various environmental and socioeconomic impacts. In the EU (including extraction, manufacturing, transport, construction, and end-of-life), it accounts for approximately 50% of total energy use, 40% of total GHG emissions, 50% of raw material extraction, and one-third of all water use [1]. To this end, the EU Circular Economy Action Plan has set objectives and targets to significantly reduce resource use and develop circular flows of materials in buildings [2].
It is therefore necessary to evaluate buildings environmentally through a circularity analysis, using methodologies and tools easy to understand by potential users. Methodologies should assess the impact through indicators so that the weight of environmental impacts can be qualified and quantified throughout their life cycle, from the extraction of raw materials to their demolition. Tools that analyse such impacts have generally followed Life Cycle Assessment (LCA) methodologies [3,4,5].
In the search for simpler methodologies, other indicators have been incorporated into the construction sector that were not initially intended for this sector. Starting from this idea, this article will develop a methodology to evaluate sustainability in housing construction in Andalusia based on the use of environmental indicators based on the concept of footprint family (FF). In this case, the FF indicators used will be carbon footprint (CF), ecological footprint (EF), and water footprint (WF).
The EF [6,7], the CF [8,9], and WF [10,11] are the most prominent indicators based on FF. Fang et al. [12] studied the term footprint through a coword analysis, and the terms that appeared the most were CF, LCA, WF, and EF. Galli [13] identifies two common elements among existing footprints: the capacity to provide both a consumer and a producer viewpoint on a given environmental externality; and the possibility of being applicable on multiple geographical scales. Other authors, such as Hoekstra and Wiedmann [14], consider that the term footprint extends to the concept of “indicators of human pressure on the environment”, although it should be clarified that there are not only environmental footprints, but also social and economic footprints whose aim is to capture the entire triple bottom line of sustainability [15]. These indicators owe their success to the fact that not only are they simple to analyse, but that they are also easily applicable to environmental policies [16], such as Green Public Procurement (GPP) in the European Union [17].
As authors such as Fang [12] point out, no single footprint member is capable of capturing the full complexity of the footprint family. Therefore, in order to analyse the joint complexity of these indicators, the term footprint family is introduced, which was initially used simultaneously but independently by Giljum et al. [18] and Stoeglener and Narodislawsky [19]. Subsequently, Fang et al. [20] also used this concept to refer to an indicator composed of several fingerprint subindicators. Matuštík and Kočí [15] consider that the term footprint family generally encompasses the three most studied and analysed footprints, CF, EF, and WF, due to the intuitiveness of the term footprint, but the concept has not reached the same level of standardisation as that of LCA [21].
According to these first studies, the footprint family can be considered as an indicator that brings together various indicators in an effort to obtain basic information from each of the footprints, with special emphasis on comparative aspects [22]. It has been shown that these indicators are very interesting for use in GPP, although it is necessary to advance in their standardisation since research combining multiple footprints remains very limited in contrast to studies on a single footprint [23].
The footprint family is seldom used in building assessment. A first approach is found in Pérez-Solís [24], who analysed three footprints (CF, EF, and WF), simultaneously. Rivero-Camacho and Ferreira-Sánchez also studied the footprint family for the assessment of public buildings for educational use [25], as did Rivero-Camacho et al. [26] in the analysis of the building life cycle of a residential building. These studies enable us to affirm that the analysis of the impact of the building through the use of the footprint family is useful, and although the joint use of these indicators may generate controversy, they do enable impacts from the use of materials, machinery, and labour to be evaluated simultaneously [27,28]. Regarding the analysis of the footprint family in environmental methods, the use of CF stands out in all tools. The use of EF and WF indicators is significantly less widespread across the building sector.
In the following sections, the application of each footprint to the assessment of a construction project, together with construction and demolition waste (CDW), is reviewed. In the introductory section, a review of the state of the art is also created in relation to methodologies for evaluating the sustainability of residential buildings in Europe in order to correctly contextualise the proposed CEACE methodology. Finally, the use of the indicator in the CEACE evaluation method is explained.

1.1. Carbon Footprint

The CF is the most widely employed indicator within the LCA methodology. Its direct relationship with the GHG Control Protocols and its ease of application for environmental decision-making has been responsible for its success [16]. The main strength of CF is definitely its ability to be communicated to a broad audience [29], and it has gained popularity and helped raise public awareness in recent decades. Authors such as Matuštík and Kočí [15] advocate greater transparency in the communication of the limitations and methodological choices associated with the use of CF.
There are a wide variety of studies related to the determination of CF in construction. Schwartz et al. [30] analysed the impact of CF throughout the life cycle of buildings by applying it both in new buildings and in rehabilitation. Chastas et al. [31] evaluate the embodied energy of 95 cases of residential buildings, mainly located in Europe. They use a cradle-to-site LCA analysis, that is, an analysis covering A1–A5 life-cycle phases, which correspond to manufacturing (A1–A3) and construction (A4–A5), according to the modules defined in the standard UNE-EN 15978 [32]. The results for total carbon emissions lie in the range of 348.5–6485 kg CO2eq/m2 during a 50-year service life. Embodied emissions vary between 128 and 1350 kg CO2eq/m2 and operational emissions between 97.5 and 6032 kg CO2eq/m2. Previous studies [33] resulted in embodied carbon emissions for residential buildings lying in the range 250–750 kg CO2eq/m2, which falls within the range calculated by Chastas et al. [31]. Solís-Guzmán et al. [34] also evaluate the CF of different residential projects through an open tool. The results fit within the ranges given by Chastas et al. [31] and de Wolf [33].
Amiri et al. [35] analyse the embodied emissions generated by an educational building of 4013 m2 GFA in Reykjavik (Iceland) and propose different construction systems: a first base scenario, formed of concrete reinforced components; a second scenario using optimised concrete; and a third scenario where the nonstructural elements of Scenario 2 are replaced by wooden walls. Using tools such as those provided by Simapro and GaBi, they obtained results for all LCA indicators for phases A1–A3 and for A4. The values obtained from climate change were 664 (base scenario), 672 (Scenario 1), and 562 kg CO2 eq/m2 (Scenario 2).
A more recent study [36] looked at more than 700 buildings in five European countries from the point of view of embodied emissions throughout the life cycle of such buildings. The life span considered was 50 years, and values were obtained for the complete life cycle, 400–800 kg CO2eq/m2 for residential buildings and 100–1200 kg CO2eq/m2 for nonresidential buildings. The researchers considered that of these embodied emissions, approximately 2/3 corresponded to the so-called upfront embodied carbon, that is, the associated embodied emission before the building is put into use, which, in the LCA methodology, would be equivalent to phases A1–A5.
From these reference studies, it can be said that the construction phase of the building is the most environmentally intensive because it is concentrated over a short period of time (1–2 years). These impacts are diluted over time, although the decisions made during this stage greatly influence the remaining phases of the building’s life cycle [37]. The study on buildings across the world by Röck et al. [38], concluded that, of those that comply with energy-efficiency regulations, 20–25% of the GHG emissions of their life cycle are embodied emissions, while for high-energy-efficiency buildings, that percentage increases to 45–50%. Therefore, in nearly zero-energy buildings, as currently built in the EU, emissions from the construction phase represent a very high percentage of their emissions over their total life cycle [39], and hence it is necessary to focus more on reducing the embodied CF of the construction phase.

1.2. Ecological Footprint

The concept of ecological footprint (EF) was introduced by Mathis Wackernagel, who measured humanity’s footprint and compared it to the carrying capacity of the planet. According to its definition, the EF is the extension of land that would be necessary to supply the resources (cereals, feed, firewood, fisheries, and urban land) and absorb the emissions (CO2) of the world’s population [6].
The main strength of the EF is its conceptual simplicity and that it is an intuitive and visually graphic tool for communication [6]. The popularity of the indicator proves this point [15]. Among its weaknesses, the methodology fails to capture many of the significant human pressures on the Earth’s systems, for example, the decline of biodiversity and eutrophication [15].
In recent years, research has supported the suitability of the indicator for the analysis of the environmental impact of buildings. The EF indicator has been applied to study high-rise districts in Tehran [40], and in China it has been evaluated for peasant households [41], hotels [42], the rehabilitation of an old house [43], a residential development [44], and the life cycle of buildings, which includes project execution, use, and demolition [45].
Solís-Guzmán et al. [46] developed a model for calculating the EF for the construction phase of residential buildings. González Vallejo et al. [47] improved the previous model and applied it to approximately 100 buildings that constitute a representative set of the residential sector in Spain. This indicator has also been applied, among others, to the urbanisation phase [48] or to the entire life cycle [45]. From these studies, it can be concluded that the EF indicator adapts favourably to the characteristics of this activity, and evaluates the impacts derived from the use of material resources, machinery, and labour.

1.3. Water Footprint

Another important impact of buildings is their water consumption. According to the United Nations Environment Program, buildings and their associated industries consume 30% of fresh water worldwide, of which [49] only 12% is directly consumed, and the rest [50] is indirectly consumed by the manufacturing processes of construction materials and equipment. The WF indicator is therefore of major interest since it expresses the volume of fresh water needed to produce goods and services that are usually consumed, whether by an individual, a community, or a company [10]. In this way, the WF of an individual is not only related to their direct consumption of water, but also to their lifestyle habits, either per unit of time for individuals or communities or per unit of mass for companies [51]. The WF is presented as an indicator of water appropriation: a volume of water (usually in m3) needed for a certain purpose that is therefore made unavailable for other purposes [52].
Studies on the WF in buildings remain scarce. The first focused on indirect water consumption, such as Australian studies on indirect water consumption during the construction stage [53] and those of Crawford and Pullen [54] on indirect water consumption in the life cycle of residential buildings. The indicator has been employed in the construction in India [55], in Iran [56], and in China [57,58]. Rivero-Camacho and Marrero [59] studied the WF indicator in the complete life cycle of buildings, and Ruiz-Pérez et al. [60] assessed urban renewal projects in Andalusia. Lopes et al. [28] studied 87 industrial projects to determine the CF and WF and have established a systematic classification to enable these impacts to be evaluated.

1.4. Construction and Demolition Waste (CDW)

In the EU, 905 million tonnes of construction and demolition waste (CDW) are generated annually, which constitutes 35% of the total worldwide [61]. It is therefore of major importance to incorporate the concept of the life cycle of construction materials, in the first instance to promote the recovery of raw materials both in construction and demolition work and in treatment plants, and secondly, to minimise the impacts generated by eliminating CDW that cannot be used. Hence, another important environmental indicator in the sector involves the generation of CDW, which is included in the list of indicators of the Level(s) framework of the European Union [62].
For the CDW quantification, Wu et al. [63] classified the methodologies into: site visits, material flow analysis [64], determining the average generation [65], systems by variables [66,67,68], and cumulative calculations. The cumulative calculations are the most used [69,70,71]. Among the studies on the quantification of CDW in construction sites, the group ARDITEC has also developed an assessment model [72], which is employed by municipalities in the province of Seville for the calculation of municipal construction permit costs to ensure the correct management of CDW. The same methodology has been employed [48] for the quantification of urbanisation projects and the complete life cycle of building processes [27].

1.5. Sustainability Assessment Methods

The knowledge generated by these indicators can be oriented towards the creation of methods and certification tools that measure sustainability and introduce policies to improve the environmental performance of buildings. Focusing the analysis on sustainability assessment methods for residential buildings in Europe, one of these policies is the implementation of GPP [17]. Another involves the application of Level(s) [73], the European framework for sustainable buildings. This builds upon the objectives of both the EU Green Deal [74] and the EU Circular Economy Action Plan [2]. As a voluntary initiative, the Level(s) framework aims to promote a common language across Europe to assess and report on the sustainability of buildings. This framework proposes several indicators covering three main areas: resource use and environmental performance; health and comfort; cost, value, and risk. These have been developed based on existing standards as well as on a life-cycle approach to measure and support improvement through construction, use, and end-of-life phases for residential and office buildings.
Another initiative in the EU is a French proposal, Energy-Plus and Carbon Reduction Buildings (E+C-) Trial Scheme [75], whose main goal is to reduce the overall CF of buildings by using low-carbon and energy-efficient materials. In Italy, the compulsory minimum environmental criteria (CAM) [76] contain technical specifications for materials and components, thereby clearly promoting the circular approach in construction. In particular, CAM requires a minimum of 15% recycled content in the materials used for each construction/refurbishment intervention. They also set specific minimum recycled content thresholds for seven types of materials and require product certifications, such as environmental product declarations, environmental labelling, and producer declarations, in order to prove that products are “CAM” compliant. The criteria are mandatory for any type of building intervention in public buildings. Another Italian tool is the Itaca Protocol [77], which assesses the level of sustainability of buildings with reference not only to consumption and energy efficiency, but also taking into consideration their impact on the environment and human health.
In Spain, there are no mandatory methods created by the administration that promote GPP. There are private initiatives, such as HADES [78], which is a free method that helps in the design of buildings of a more sustainable nature. HADES is mainly oriented towards housing, although it can also be used for offices and equipment. It evaluates energy, materials and the circular economy, water, indoor environmental quality, and climate change. Another tool is VERDE [79] (Valoración de Eficiencia de Referencia de Edificios), also developed by GBC Spain, and this method aims to provide a methodology for the evaluation of the sustainability of buildings. It is a methodology that enables buildings to be conceived in a global way while including all their phases. VERDE develops tools for residential buildings, offices, rehabilitation, etc. The LCA of the building is carried out whereby the potential impacts are weighted in absolute values, and these are subsequently associated with one of the six levels of certification through a comparison with a reference building. The CO emissions caused by the manufacturing of materials employed and by the operational energy consumed are evaluated by LEED y BREEAM, which is the first initiative managed by GBCe [80], and by the second initiative known as BREEAM Spain [81]. Its methodology is based on the determination of impacts classified by categories, although these impacts do not conform to the LCA. At the end of the process, like VERDE, it is the accredited certifier who calculates the rating of the building. Another method available in Spain is ECOMETRO [82], which is an open source for the design, environmental assessment, and measurement of LCA in buildings. Among other aspects, it evaluates the carbon footprint in the construction and use phases with the aim of obtaining zero-CO2 buildings.
These four methodologies (HADES, VERDE, BREEAM, and ECOMETRO) have a life-cycle approach, which requires specialised cognisance of environmental assessment procedures. Level(s) is an extremely ambitious and demanding proposal from the point of view of the previous knowledge needed to be able to use it correctly. In Spain, there is still room for improvement for easy-to-use methods that enable self-evaluation by the user. In the region of Andalusia (Spain), the ARDITEC research group to which the authors belong has been working since 2011 on methods and tools that evaluate sustainability through the budgets of construction projects [83,84], using the open and freely accessed Andalusia Construction Cost Data Base [85], which is mandatory in public work tenders in Andalusia. The development of these investigations has enabled definitions to be made of the environmental impacts of 7000 basic costs (its CF, EF, WF, and quantification of CDW) that nourish the ACCD with environmental information [26].
In the present work, a simple methodology, based on the project budget, or more precisely, its bill of quantities and work breakdown structure of construction cost databases, is employed for the sustainability assessment. Additionally, the message is simplified by employing indicators with strong messages that are easy to understand by the general public. The method proposed integrates the three footprint indicators (CF, EF, and WF) together with the quantification of CDW. For social aspects, a questionnaire covers topics related to labour and material origin. This methodology can provide public administrations with their availability for use as a GPP assessment method.

2. Methodology

The methodology followed to obtain the objectives proposed in the article follows this sequence (Figure 1):
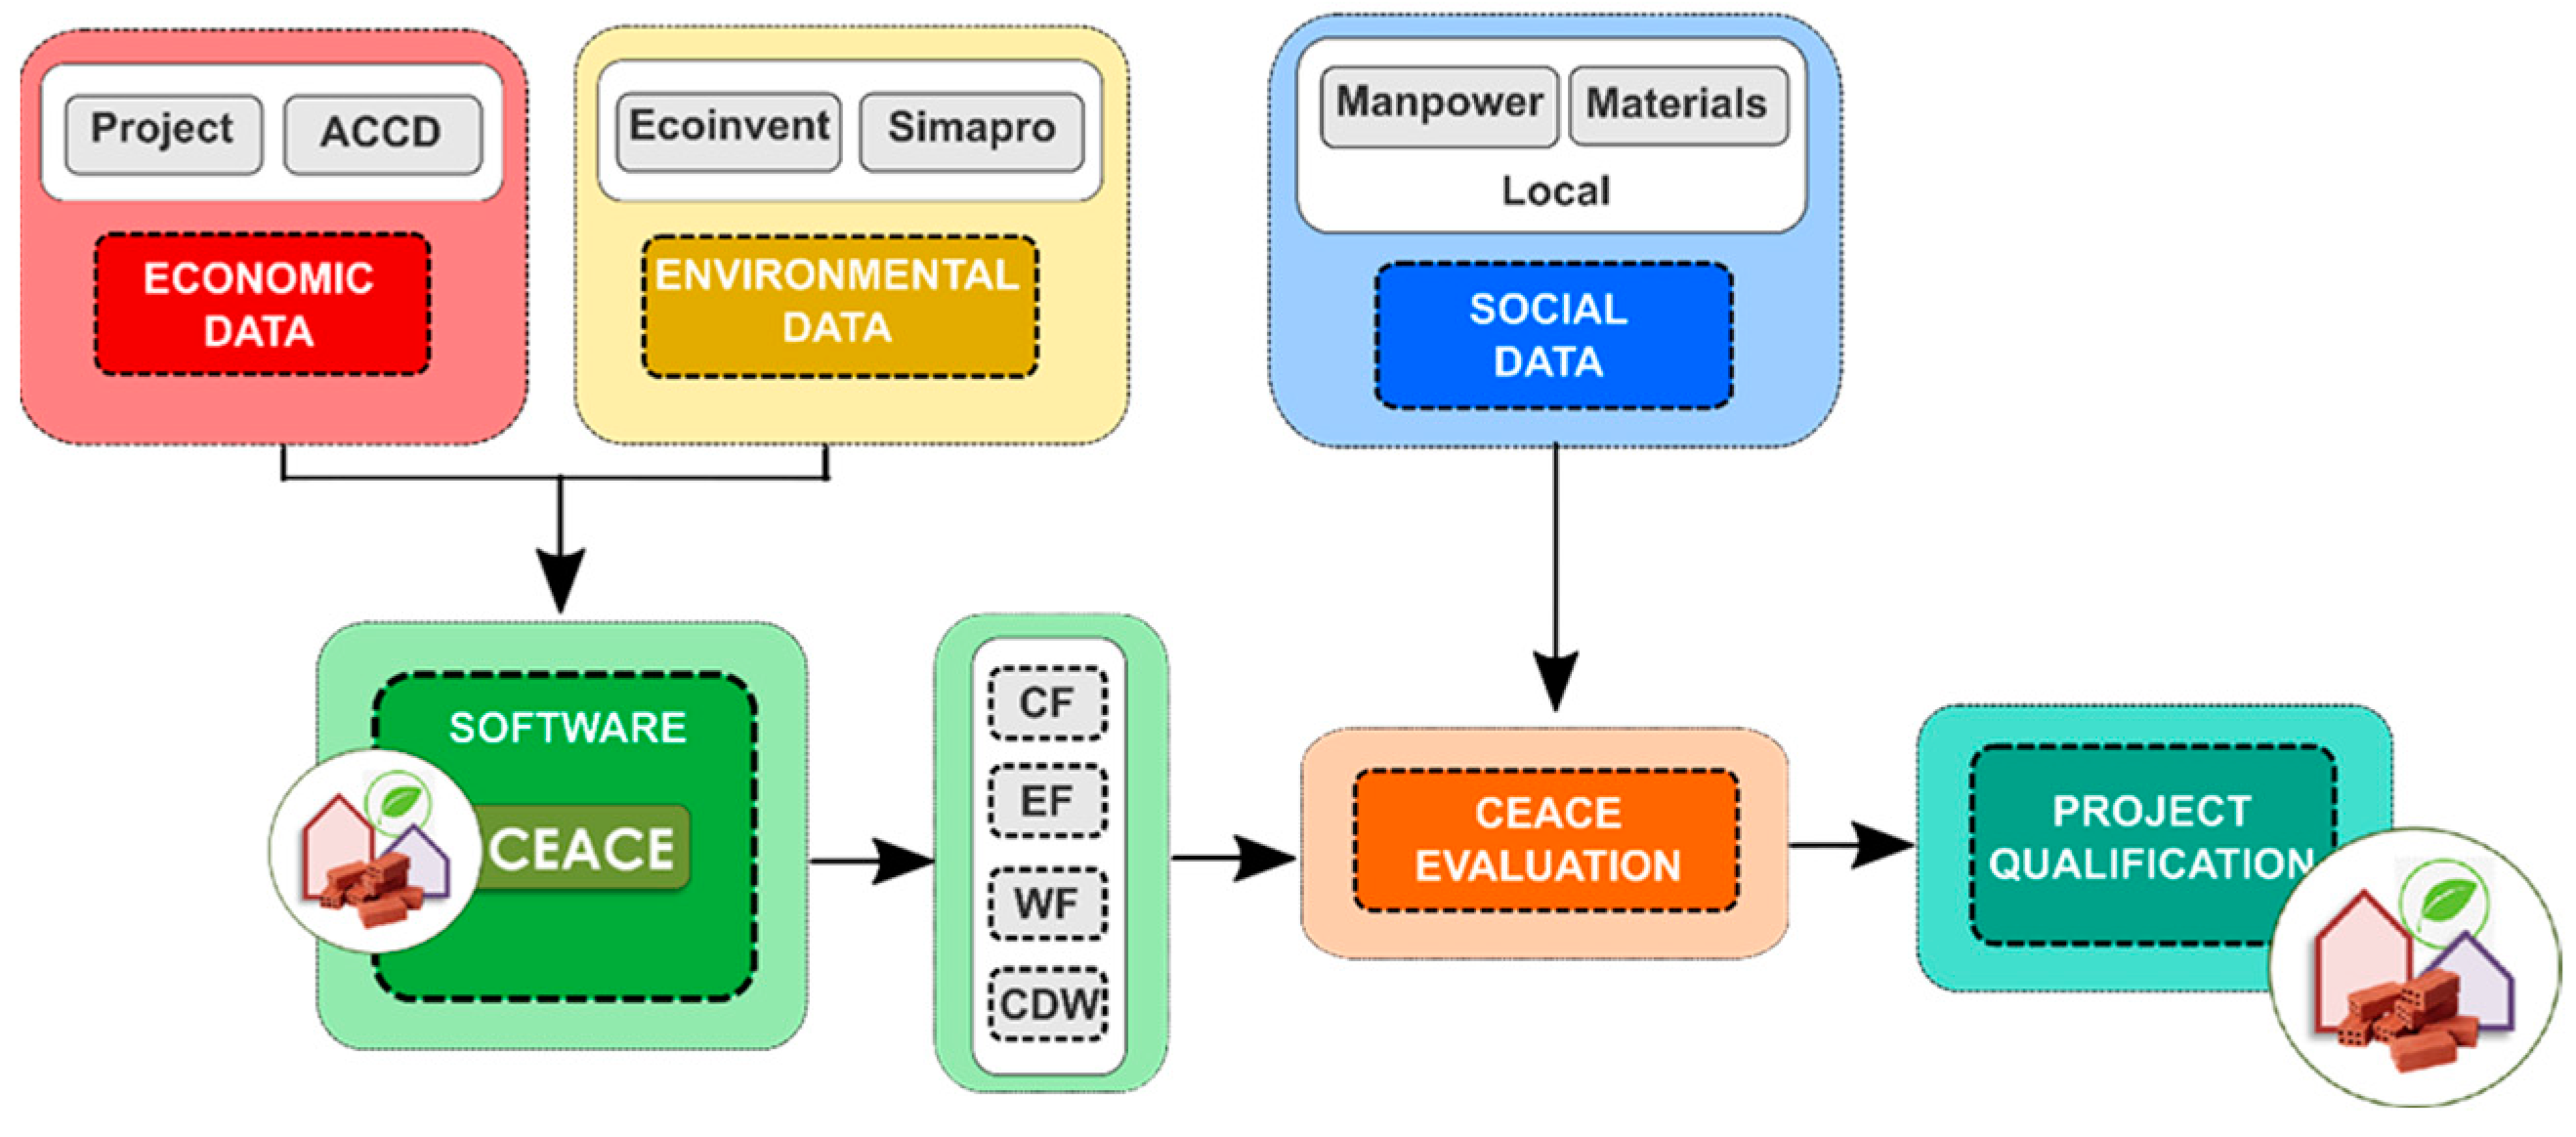
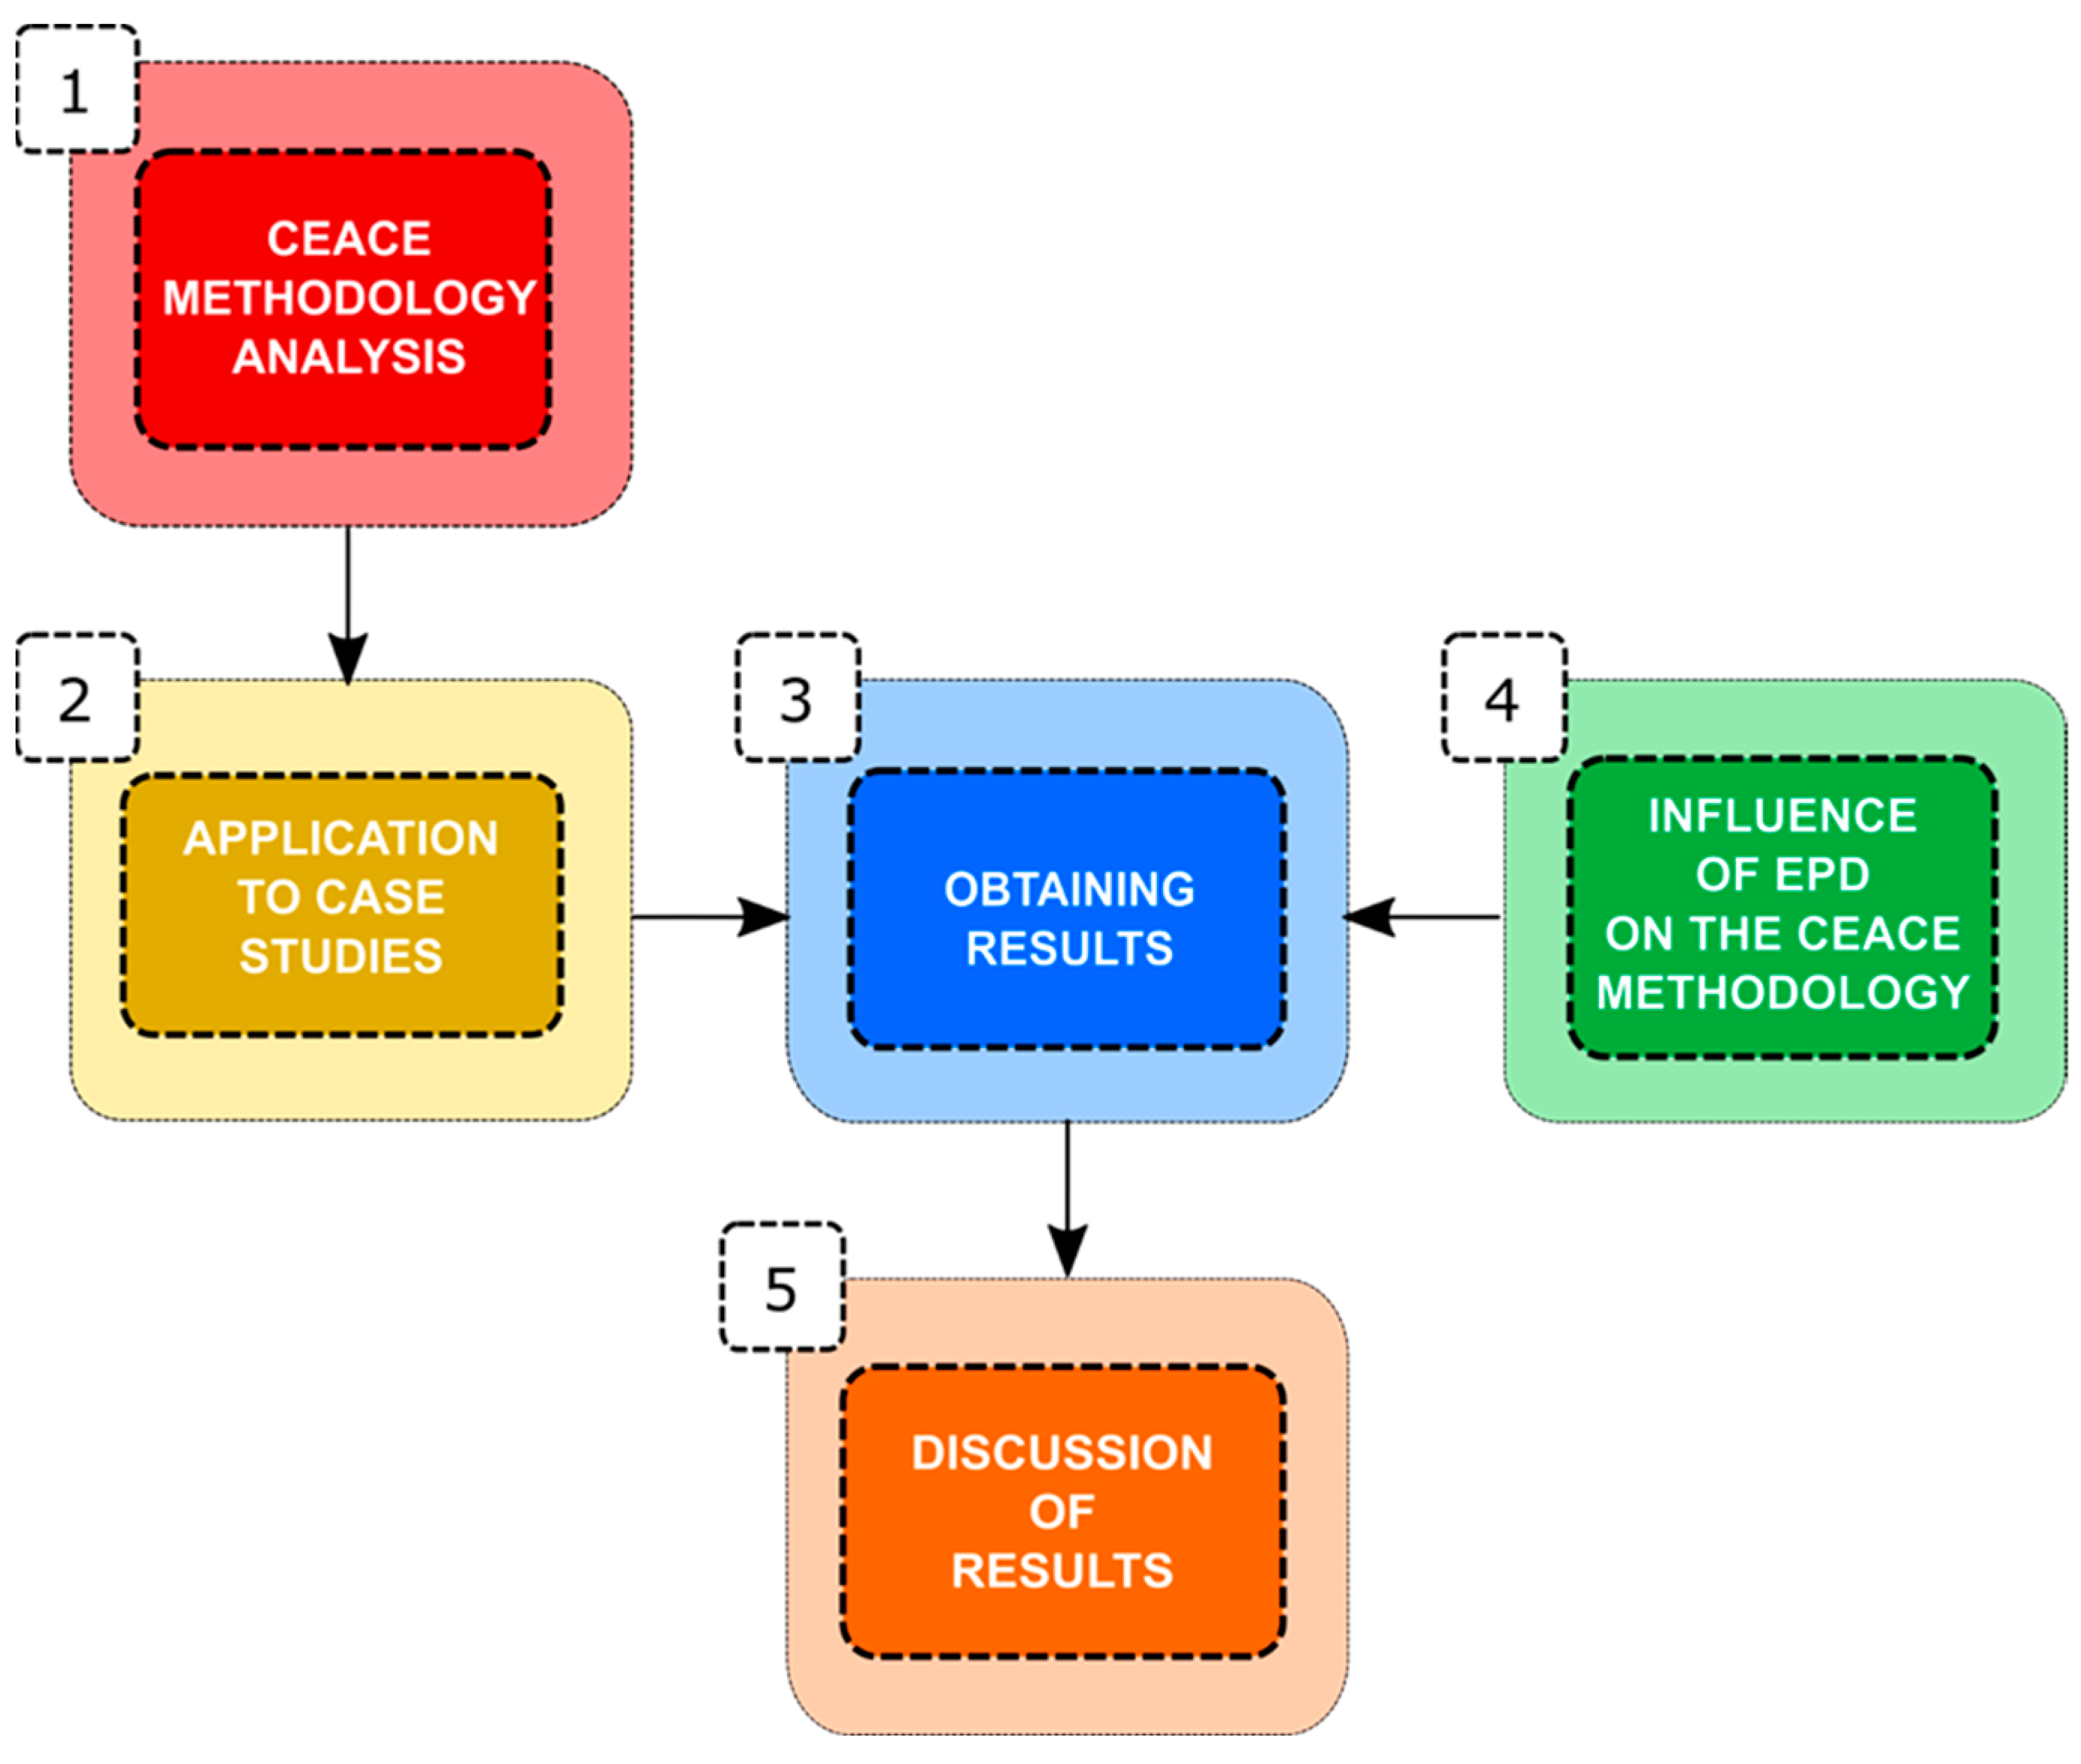
  • The analysis of the methodological development towards obtaining the CEACE method (Certificado Ecológico Andaluz de Construcción de Edificios: Andalusian Ecological Certificate for the Construction of Buildings). The input data consists of the project budget, its quantity surveying, and cost assessment, while the output data involves the project footprints, CDW, and social aspects mentioned above;
  • The CEACE method will be applied and validated through the analysis of 15 projects defined as combinations of residential projects with different constructive solutions. A sample of 200 housing projects is used for the standardisation of indicators that lead to global, economic, environmental, and social value;
  • Obtaining results: Values of the following parameters will be obtained for each of the 15 projects: Costs, CF, EF, WF, and CDW (normalised by GFA). Subsequently, an aggregate indicator (I_CEACE) will be obtained, based on a standardisation6 and weighting process analysed in Section 3.3, for each of the 15 projects, which will contain environmental, economic, and social information on them. The percentage of influence of each of the work chapters in relation to the costs, CF, EF, WF, and CDW parameters will also be determined;
  • Study of the influence of the use of Environmental Product Declarations (EPD) in the CEACE method: The project of the 15 that has generated the highest value of the I_CEACE indicator will be analyzed. Based on the analysis obtained from the CEACE method, it will be possible to determine the construction unit that generates the greatest impact, subsequently selecting the materials that compose it. Alternatives to these materials that have EPD will be sought in the market [86]. Finally, different scenarios will be evaluated to analyse the influence of the use of materials with EPD on the I_CEACE indicator;
  • Discussion of results. A critical analysis of the results will be carried out. From this discussion, it will be demonstrated that the results are sensitive to changes in the foundation and typology of the building.

3. Development of the CEACE Method

The CEACE sustainability method (Andalusian Ecological Certificate for the Construction of Buildings) [87] has several phases (Figure 2). The input data includes the budgets of the construction projects and the Andalusian Construction Cost Database, ACCD [85]. There are other databases in Spain, such as BEDEC [88] and CYPE [89], but it is the ACCD that focuses on construction in Andalusia. The calculation engine is based on the systematic classification of ACCD and on a second database generated by the group [90,91]. The latter consists of a spreadsheet that holds 7000 elements and determines the impacts of the basic elements of the budget: materials, machinery and labour, and machines. To this end, it is necessary to first determine the weight of each material consumed, the litres of fuel or electrical energy consumed by the machines, and the hours of the workers, and then to determine their footprints (Figure 2) based on EcoInvent data [92] and Simapro [93]. The formulation and calculations of the indicators can be found in Rivero-Camacho et al. [26]. The phases considered for the analysis of said impacts correspond to modules A1–A5 according to the standards [32,86].
The input data are the ACCD, the spreadsheet with the environmental data calculated for each Basic Cost (BC) in the ACCD, the project quantity surveying using the ACCD, and the social questionnaire. The method generates the evaluation in three steps (see Figure 3):
  • The economic and environmental budget (according to the indicators of the footprint family and CDW) of the project is assessed using CEACE software (https://personal.us.es/jaimesolis/, accessed on 14 March 2024) [87];
  • The environmental and economic calculations are exported to an Excel spreadsheet. The social data is then incorporated (information regarding local materials, health and safety on the construction site, and local labour);
  • The aggregate indicator (economic, environmental, and social) and the qualification of the project are determined.
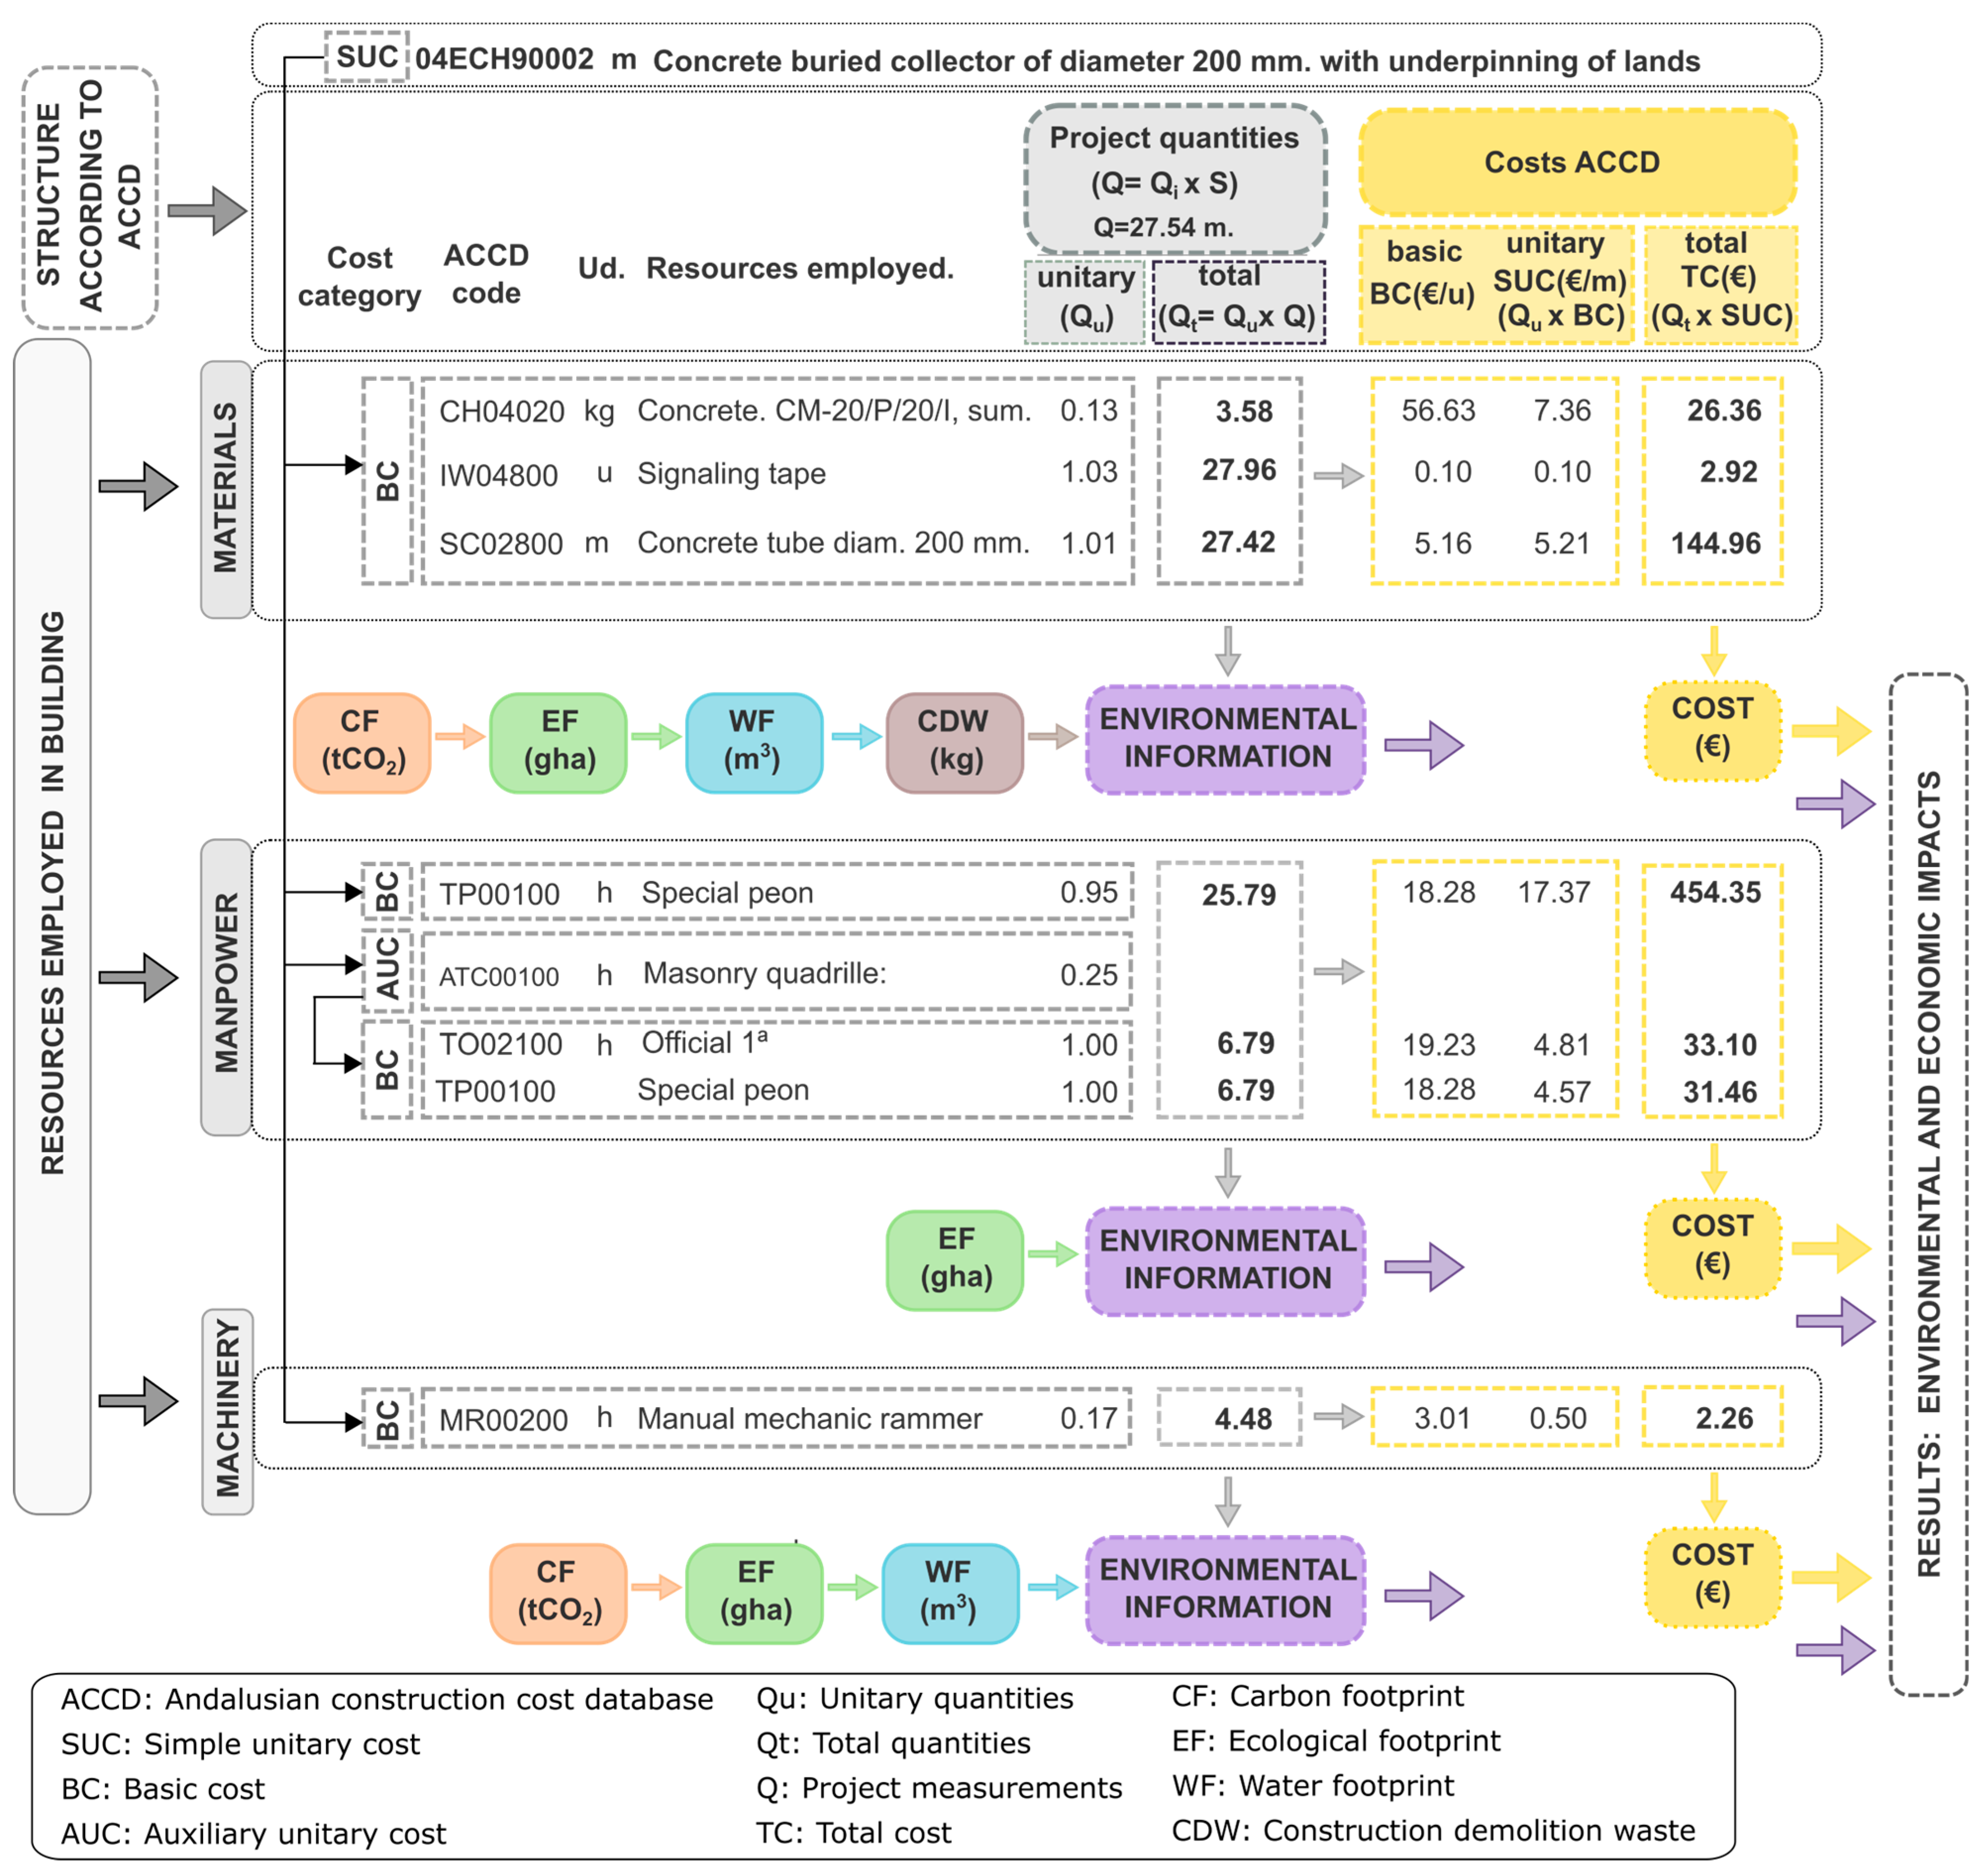
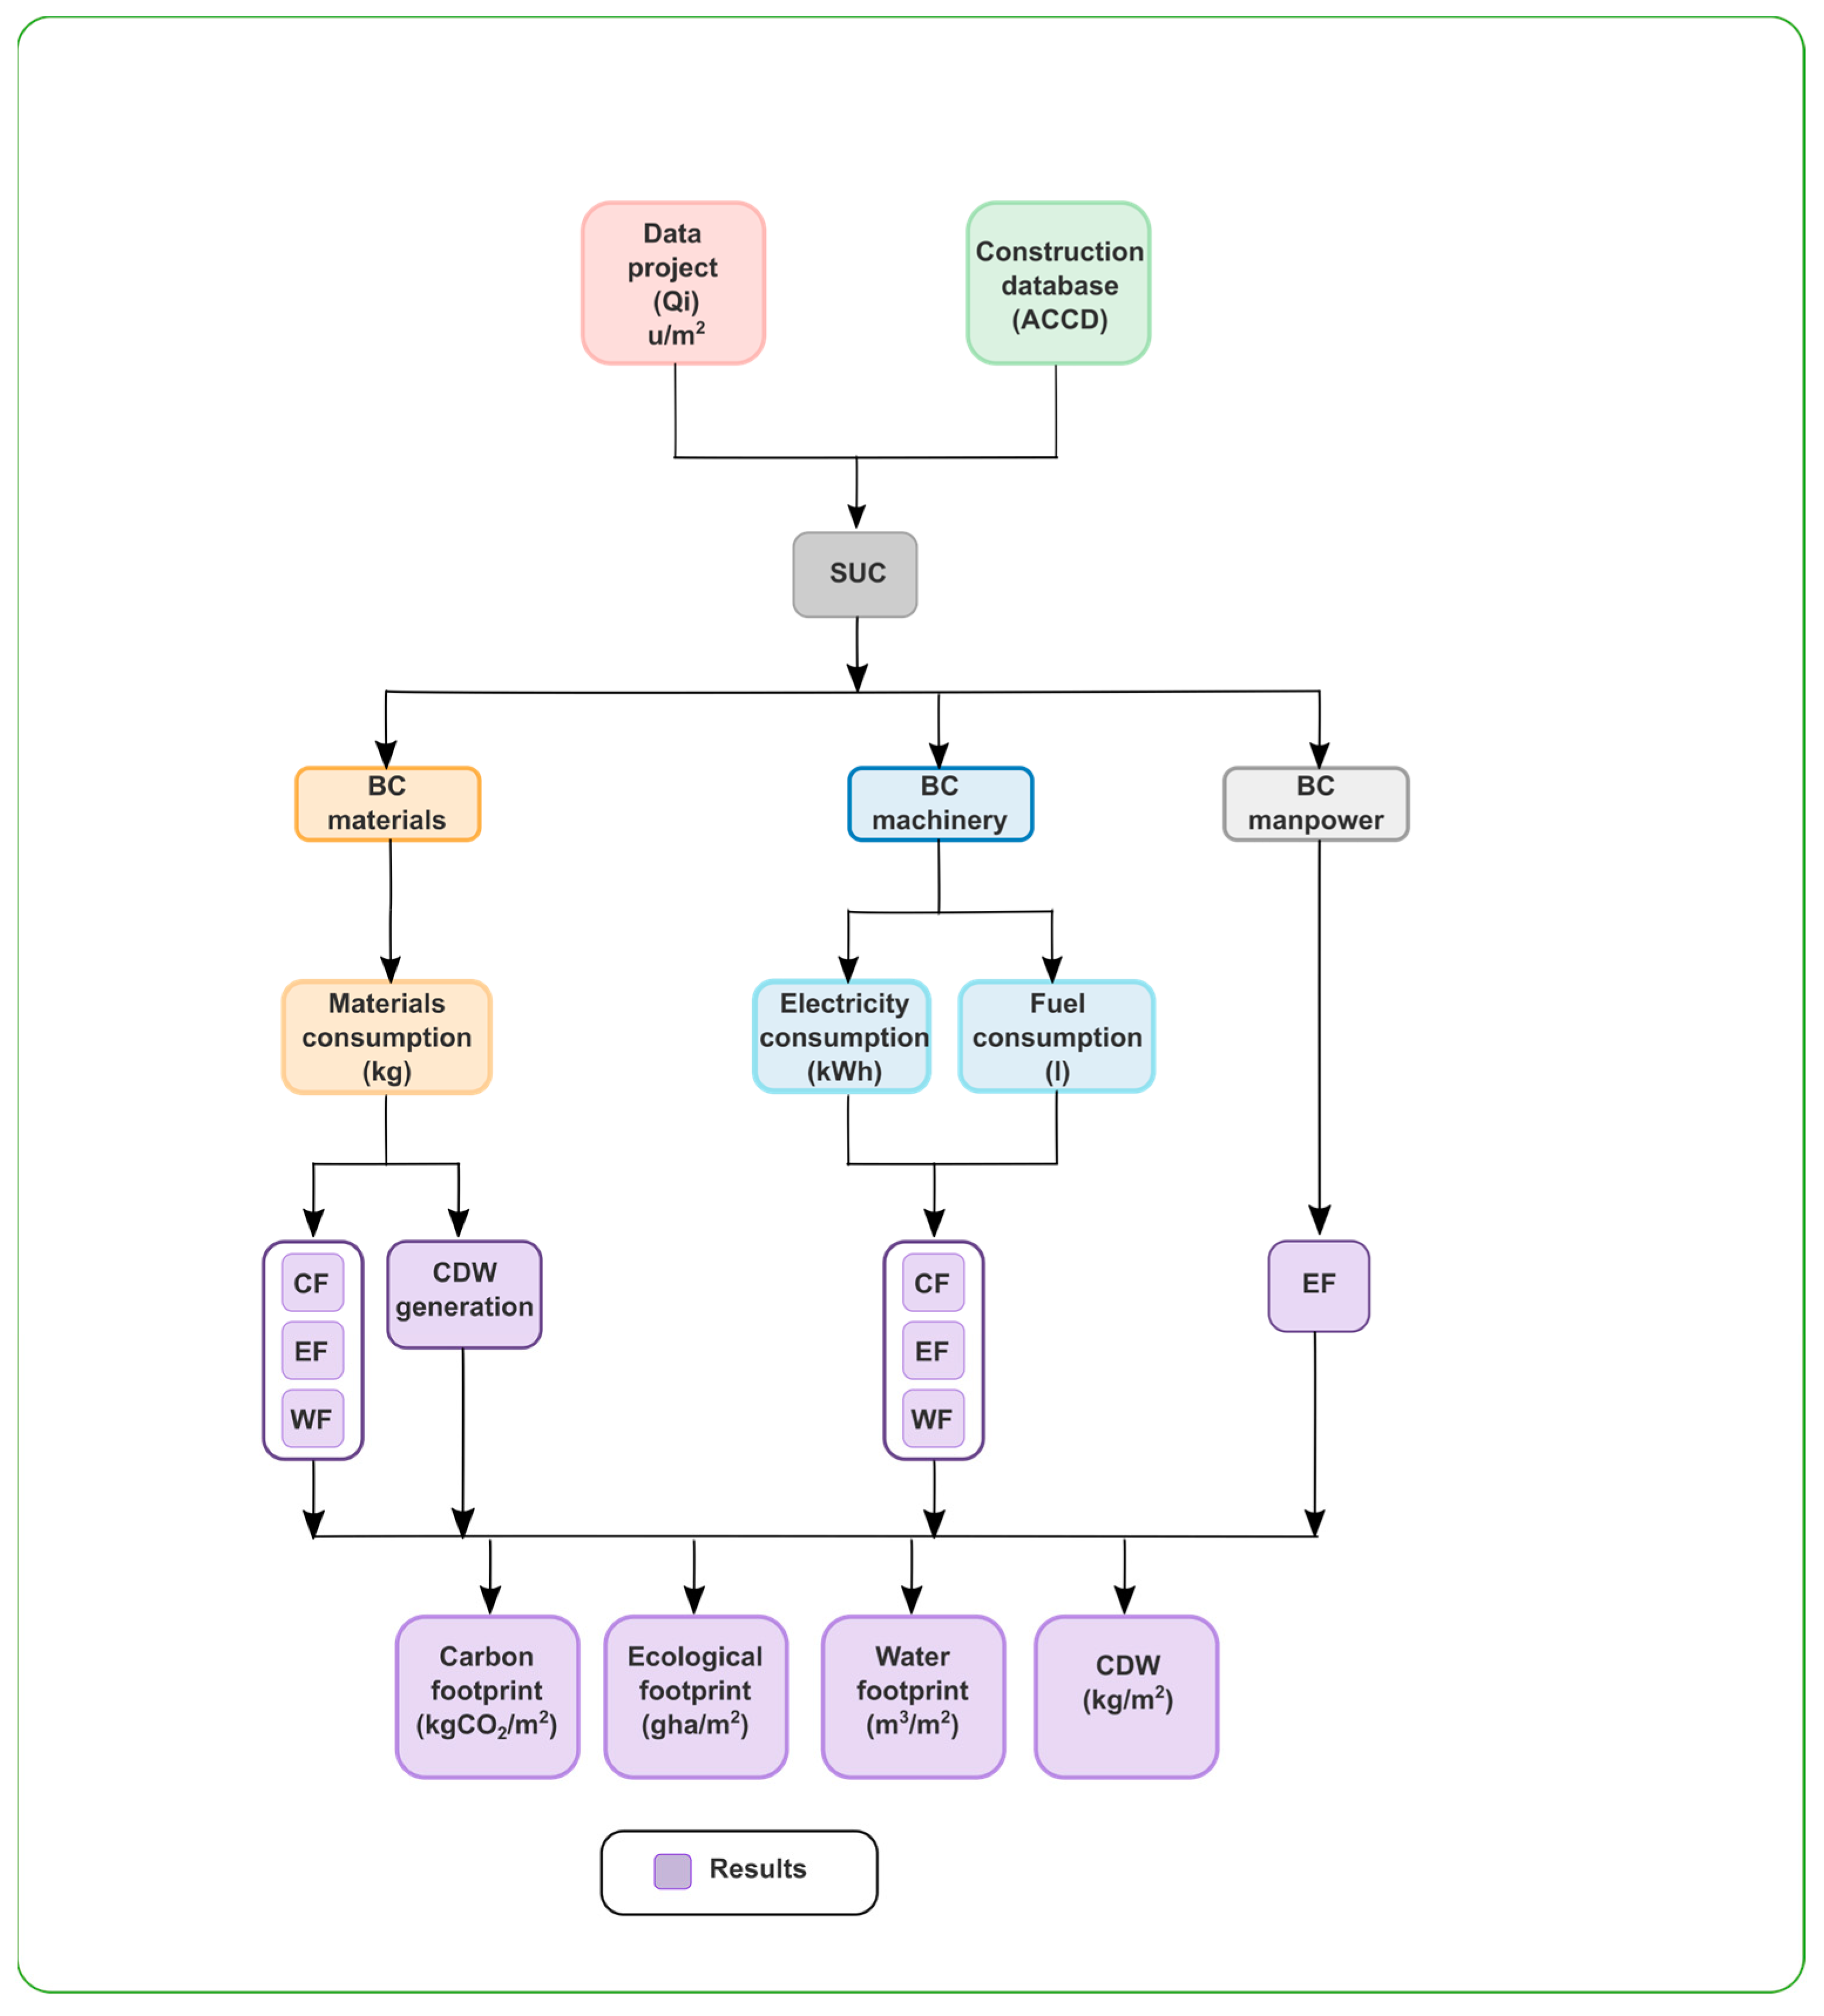
3.1. Project Budget

For the creation of the project budget, the ACCD and its systematic classification of work units, which has an alphanumeric classification, must be used. The cost structure of the ACCD is created by virtue of a hierarchy that, starting from the lower level, grows and, through the union of lower costs, more complex prices are formed. At the lower level are the basic costs (BC) (Figure 3), which are distributed among machinery, labour, and materials. The combination of these enables the Simple Unit Cost (SUC) to be generated. In Figure 3, the SUC represented is 04ECH90002 (concrete buried collector). The aggregation of the SUCs generates hierarchical divisions of a more complex nature to finally define a chapter of the budget. Each chapter represents a stage of the construction project, which begins with the cleaning of the plot and earthmoving and continues with the construction of the foundation [94].

3.2. Environmental Information

In Figure 3, there is an example of a Simple Unitary Cost (SUC) (corresponding to a work unit) where each of the Basic Costs (BC) has its own environmental information assigned in the tool, CF in tonnes of CO2eq., EF in hag, WF in m3 of water, and CDW in kg. All the SUCs are evaluated by the method as shown schematically in Figure 4.

3.3. Characteristics of the Construction Projects

In the CEACE tool, in addition to the project work units (ACCD coding) and their corresponding quantities, or Qi, the input data includes other general data, such as typology, ground floor area (GFA), and number of floors above and below ground, see Figure 3. This tool generates the economic and environmental budget (according to the EF, CF, WF, and CDW indicators) per budget chapter and per work unit; a summary is presented per chapter, and the five work units that generate the greatest impact are identified, for each impact. All the outputs from the CEACE software are stored in Excel format. The information related to social aspects, such as the use of local labour and local materials, is also added to the Excel spreadsheet.
Finally, an aggregated indicator is obtained that collects the triple information (economic, environmental, and social) and generates a sustainability indicator (I_CEACE) (Equation (1)). This level is the sum of the environmental (A), economic (E), and social (S) aspects, according to the weighting of 70% for environmental, and 15% each for economic and social aspects). The environmental aspects have been assigned the highest weight since this represents the main objective of the calculation method, although the method is versatile in the sense that the weights of each aspect can be changed according to the interests of the administrator. Other tools employ similar weighting procedures: the HADES tool [78] weights environmental aspects at approximately 60%, the economic part represents 17.4%, and the social aspects represent the remaining percentage, which include impacts on health and comfort, among others. VERDE [79] provides approximately 50% of the environmental characteristics, while the economic characteristics represent 17.4%, and the remaining portion corresponds to social aspects. In a similar way, in the recent work by Marrero et al. [95], indicators are weighted at 50% environmental; 30% social, and 20% economic.
The calculation of the indicator is as follows:
I_CEACE = (Au × Ka) + (Eu × Ke) + (Su × Ks)
where I_CEACE is the sustainability indicator; Au, Eu, and Su are the environmental, economic, and social coefficients, respectively. Ka is the environmental weighting factor (0.70), Ke is the economic weighting factor (0.15), and Ks is the social weighting factor (0.15).
In order for the indicator, I_CEACE, to always have a value between 0 and 1 (that is, to be bounded), it is necessary that the three coefficients (Au, Eu, and Su) are also normalised between 0 and 1. For the normalisation of each of the coefficients, Equation (2) is used:
zi = (xi − min(x))/(max(x) − min(x)),
where
  • zi: i normalized value from the data
  • xi: i actual value from the data
  • min (x): minimum value in the data
  • max (x): maximum value in the data
This standardisation has been made possible thanks to the data obtained from the previous work of the researchers [34,47,48], relating to environmental and economic indicators, across a sample of approximately 100 projects.
In order to obtain the coefficient Au, a standardisation process is conducted for each of the environmental indicators therein. Once the normalised values CFu, EFu, WFu, and CDWu have been obtained, Au (Equation (3)) is obtained:
Au = (CFu × Kc) + (EFu × Ke) + (WFu × Kw) + (CDWu × Kcdw),
where CFu, EFu, WFu, and CDWu are the normalised unit values of each of the indicators obtained from the CEACE method. Kc, Ke, Kw, and Kcdw are the weight coefficients of each of the indicators, carbon, ecological, and water footprints and CDW, respectively. The four indicators are considered to be equally important. Therefore the weight of each is 0.25.
The economic coefficient Eu (normalised value) is obtained in a similar way through the normalisation process by interpolating the value obtained Ep (economic budget in EUR/m2 obtained from the CEACE tool) among the economic data of projects already analysed.
Finally, the social aspect is collected in the Su coefficient obtained from Equation (4):
Su = (Slabu × Kslab) + (Smatu × Ksmat) + (Shsu × Kshs),
where Su is the social coefficient, and Slabu, Smatu, and Shsu are the CEACE unit of the three social aspects analysed: local labour (lab), use of local materials (mat), and improved health and safety (H&S) measures (hs). These unit values are obtained by Equations (5)–(7):
Slabu = 1 − (Slab/100)
Smatu = 1 − (Smat/100)
Shsu = 1 − (Shs/100)
where Slab, Smat, and Shs are project values entered by the user as a percentage from 0 to 100%.
Kslab, Ksmat, Kshs: weight coefficients of each of the indicators. Local labour is considered to have a weight of 0.5, local materials 0.25, and improved H&S is 0.25.

4. Case Studies

Fifteen combinations of residential buildings in Andalusia have been studied, which are representative of the majority of those built in the region and which have previously been studied from the economic and environmental point of view in other works, and hence the detailed measurement of material resources, labour, and machinery is available [34,47]. The environmental, social, and economic assessment is carried out on six projects, with different combinations in the number of basement or foundation floors, that give rise to 15 different typologies. A detailed analysis of each project is presented, whereby the results are differentiated per chapter in the budget. Finally, the I_CEACE indicator, which groups environmental, economic, and social criteria, is obtained through the CEACE method.
Table 1 shows the 15 typologies of the projects under study. These are projects that group several buildings of the same characteristics, selected from one to ten floors above ground and one and two floors below ground. The ground floor areas are between 2000 and 11,000 m2 above ground (GFA). All the buildings are for residential use, in four of which the ground floor is for commercial use. The structure in all cases is composed of reinforced concrete, except for typology 15, whose structure is created with masonry walls. Finally, the foundations of the chosen buildings are composed of continuous trenches, isolated concrete pads, reinforced concrete slabs, or piles, which allow comparisons depending on the type of foundation. Other features of the projects are ceramic tile flooring, brick partitions, and aluminium windows.
The 15 project budgets are input in the CEACE software, that is, work units and their corresponding quantities. The tool calculates the impacts of each work unit and groups them into chapters. Moreover, the eight items with the greatest impact are identified. Appendix A shows the complete economic and environmental budget of Project 1, obtained with CEACE software.

5. Results

Table 2 shows the results generated per GFA of each project according to cost, CF, EF, WF, and CDW.
By analysing Table 2, the projects with the greatest economic impact are revealed as Projects 13 and 14, at over EUR 650/m2, which are the semi-detached dwelling projects of the group. The general range is 475-650 EURm2. The low construction cost of the buildings is due to the fact that they are all social housing with governmental constraints in their budgets. Regarding all environmental indicators, Projects 14 and 15, semidetached and detached dwellings, respectively, are those that generate the greatest impacts. The ranges for all projects are 0.43–0.60 t CO2/m2 for CF, 0.20–0.31 hag/m2 for EF, and 100–169 kg/m2 for CDW. The projects with the lowest impact globally were 1 and 3, which contain a greater number of floors. Typologies with two floors underground (e.g., typologies 2 and 4) have the worst environmental performance. The results are similar to those obtained in other publications by the authors [47] where, as the number of floors increases, the EF per m2 is reduced until it stabilises. Regarding the influence of the foundation, with the results obtained, it cannot be concluded which type of impact is the greatest. This is not the same result as found in warehouse construction, where this element is of major importance [28]. By analysing the budget chapters, the structures have the highest CF, EF, and CDW in all projects, and the structures, and foundations have the highest WF in all projects.
In order to assess the social aspect, the following percentages were established in all projects: local labour 100%, local materials 60%, and H and S improvements 0%. Of the construction materials in Andalusia, 60% are concrete, steel, and bricks, which represent more than 60% by weight [45]. The projects are located in Seville, Andalusia’s capital, where there is local production of these three materials, and the percentage can easily be met. As for the workforce, there is no specific statistical data, and mobility in construction projects is considered low. These percentages apply equally to all 15 projects, see Table 3. Even though the indicator can be sensitive to change, for example, if H and S improve, the indicator calculation can be found in [95], and local materials are both 80%, then the social indicator (Su) passes from 0.35 to 0.1. The I_CEACE in Table 3, which is in the range 0.305–0.824, passes to 0.268–0.786.
CFu, EFu, WFu, and CDWu are the normalised unit values. Au is the normalised environmental coefficient obtained from the weighting of the four environmental parameters. Eu is the normalised economic coefficient obtained in a similar way to environmental values. It is the normalised social coefficient, obtained, in this case, from the use of local labour and materials.
When normalising all parameters, the I_CEACE (sustainability index) is tabulated between 0 and 1. Projects with the best overall rating will tend towards 0, and the worst will tend towards 1. In Table 3, the scale allows the results to be analysed quantitatively. For example, Project 14, with a value above 0.80, is the worst performing overall. Projects with lower impact move in a range between 0.30 and 0.50. Once the indicator is defined and bounded, it can then be scaled to establish impact levels.
Although the sample is small, with only 15 cases under study, a first approach to the normalization of the indicator can be made. For this purpose, the standard distribution of the I_CEACE sample, s, and its mean, x, are used. The I_norm values correspond to I_CEACE minus the mean, divided by the standard deviation. The results are shown in a 6-sigma colour scale that allows us to identify case studies grouped by how far away they are, below or above average (Table 3). The blue colour indicates that the project is in the 3s range, which corresponds to the lowest values in the extremes of the population distribution. Additionally, in the burgundy colour, those located in the extreme right are significantly more impactful. This implies that as the sample grows, the variability adjusts, so that the scale also adapts to the population being analysed, indicating the projects that are more positively or negatively significant.
We analyse Project 14 from the point of view of each chapter of the budget (Figure 5). Chapter-by-chapter data can be employed to schedule waste collection and separation as the project progresses.
In Figure 5, it can be noticed that, as expected, the foundation, structure, and brickwork are the most important. Additionally, installations are of high importance, and those are seldomly evaluated in the literature [31].

6. Study of the Influence of the Use of Environmental Product Declarations (EPD) in the CEACE Method

The following study is performed with the CEACE method, wherein the items that generate the greatest impact are determined. From among these, that which generates the greatest environmental impact is the construction unit of the reinforced concrete slab. This item is broken down into the following basic units:
  • TO00600, 0.046 h, official first-class rebar placing;
  • TO02100 0.053 h official first class;
  • TP00100 0.356 h special peon;
  • CA00320 2 kg steel B 500 S;
  • CA00620 0.99 kg electro welded steel mesh, B 500 T;
  • CB00600 4.86 U cement mortar vault;
  • CH80040 0.115 m3 fresh concrete HA-35/p/20/IIa;
  • CM00300 0.001m3 pine wood in plank;
  • CV00100 2.338 m rigid armour self-resistant beam;
  • MV00100 0.07 h vibrator.
In order to ascertain the influence that the selection of materials that have environmental information may have, it is assumed that the labour and machinery employed remain constant. From the basic costs, those that may have a high environmental impact and that may have EPD (Environmental Product Declarations) [93] are selected. EPD are used in the environmental analysis of construction products, and allow, through an evaluation based on LCA, the determination of environmental parameters (CO2 emissions, water consumption, acidification, etc.) [96,97,98].
Based on these requirements, the five costs marked in bold above are selected.
The environmental information corresponding to the CF and the WF comes from the Spanish databases of EPD [99] and from the self-declarations of certain manufacturers [100].
The waste indicator is considered as being unmodified by using EPD. In the case of the basic costs of steel and concrete, the EPD of the AENOR Spain website includes the life-cycle phases corresponding to A1–A4. In the case of vaults and joists, the information comes from environmental self-declarations, and in this case, they cover phases A1–A3. The study of the CEACE tool covers phases A1–A5, and therefore the results are comparable. The results of the comparison are shown in Table 4.
In the case of steel, the EPD has lower values than those of the CEACE software, which is reasonable since EPDs generally show improved products as compared to generic ones. Regarding concrete, the EPD values are lower in CF and EF, and similar in WF. In these materials, it has not been necessary to change units, which prevents any potential errors in that regard. In the case of vaults, it is observed that the data of CF and EF are lower than in CEACE, however, the WF shows a certain disparity. In the case of joists, all values are superior to CEACE. The causes may be that the data of the EPD are expressed in terms of units other than those of the basic costs, which can cause errors in their conversion. Secondly, the information comes from the environmental self-declarations of the manufacturer, whose information has not been verified by certifying bodies. Furthermore, the declarations refer to product families with highly diverse geometry, which can cause distortion in the results.
The new environmental information about the materials is introduced at this point in order to create basic costs with the new indicators, and finally obtain the new unit cost. By comparing the original item (with CEACE environmental indicators) and the new item (with environmental indicators from EPD), it can be ascertained as to whether there are significant differences in the environmental impact of the project (Table 5). Project 14 has been selected as an example because it was the one with the highest I_CEACE value.
The four scenarios of Project 14 correspond to:
  • Scenario of the original project. It has an elevator, and the environmental data comes from the CEACE database;
  • Similar to the stage, although it does not have an elevator. I_CEACE decreases slightly;
  • Starting from Scenario 2, the units with the greatest impact are selected. Similar materials with EPD are sought: steel rebars, concrete HA-35, and self-resistant joists. Once the information has been obtained as explained above, then the budget is assessed again with the CEACE tool;
  • Starting from Scenario 3, a new EPD is added, in this case corresponding to cement mortar vaults. Once the information has been obtained as explained above, then the budget is assessed again with the CEACE method.

7. Discussion of Results

Carbon footprint values obtained from the CEACE tool (Table 2) lie within the range calculated by others. Chastas et al. [31] evaluate residential buildings and determine a range of 0.128–1.35 t CO2/m2 for the construction phase. Similar studies by Clark and de Wolf [33,101] confirm the coherence of the data provided. The studies of Ie Den et al. [36] for the complete life cycle of residential buildings, establish two ranges, one for single-family dwellings, 0.4–0.7 t CO2/m2, and another for multifamily buildings, 0.2–1 t CO2/m2. The same authors consider that the CF for the A1–A5 phases of the life cycle is approximately 2/3 of the total CF. Therefore, by extrapolating this value to the ranges, for single-family dwellings, it would be 0.27–0.47 t CO2/m2 and for multifamily dwellings, 0.13–0.67 t CO2/m2. The results of the CEACE tool lie within this range for multifamily homes, while for single-family households (Projects 13 and 15), they are slightly above. The differences might be due to the greater variety of single-family dwellings, which can generate a wider range of values.
The ecological footprint values (Table 2) are similar to those published in previous studies by the authors [47]. The results of WF impacts (Table 2) lie in the range of 10–16 m3/m2. The studies of Lopes et al. [28] for the analysis of the WF of the construction of warehouse buildings show slightly lower values due to the simplicity of those buildings, 6–12 m3/m2. Other studies in Iran reveal higher values in the construction of residential buildings, 20.80 m3/m2 [56]. In China, a detailed case study was performed for the structure engineering of six landmark buildings in E-town, Beijing. The total virtual water of the case buildings is quantified as 1.25 × 10⁶ m3, which corresponds to an intensity of 20.83 m3/m2 per square metre of floor [58] and 26.6 m3/m2 per square metre of floor [57]. In Spain, the WF of the complete life cycle of single-family dwellings is 27 m3/m2 [59]. Therefore, the results are within the parameters analysed, although it will be necessary to delve deeper into other building typologies. Finally, the results of the CDW generated by the tool (Table 2) are comparable to previous work [72]. The ratios managed by studies of the quantification of CDW in Spain [102] for new construction show values between 0.1 and 0.17 t/m2.
In relation to obtaining the I_CEACE (Table 3), we can affirm that it is sensitive to changes, for example, in social parameters. Thus, if the H and S indicator passes from 0% to 80% and local materials pass from 60 to 80%, then the social indicator (Su) passes from 0.35 to 0.1. The I_CEACE in Table 3, which is in the range 0.305–0.824, passes to 0.268–0.786. Regarding the total values of I_CEACE (Table 3), Project 14, with a value above 0.80, is the worst performing overall. Projects with lower impact move in a range between 0.30 and 0.50.
In relation to the analysis by chapters (Figure 5), carried out on Project 14, it can be observed that the chapter that has the most influence on the indicators is that of structures, since it is representative in the four indicators: CF, EF, WF, and CDW, with percentages between 20 and 25%, except in the CDW, which is even higher, at 35%. The chapter on masonry also has a considerable influence on environmental aspects (its influence in the EF, CF, and CDW indicators exceeds 20%), and the foundations chapter has an approximate influence of 20% on the CF and EF and 30% on the WF and CDW. The installations chapter not only exerts a major economic impact but also a significant impact on WF. This analysis is similar for the rest of the projects. Those construction elements that have a greater environmental impact (structures, foundations, etc.) cause the environmental indicator Au (Eq1) to increase, and therefore also increase I_CEACE. This data can be used by the administration to demand that these impacts be reduced through concrete, steel, or bricks with environmental product declarations.
Finally, in relation to the influence of the EPDs on the CEACE method, from the results of the four scenarios (Table 4 and Table 5), it can be concluded that the EPDs from manufacturers generate less impact in all cases, except joists. The increase in the CF due to the joists is compensated by the decrease in the CF of the other materials, making the CF of the construction unit of the reinforced concrete slab lower, which makes the total CF of the project analysed (Scenarios 3 and 4) lower than that initially evaluated (Scenarios 1 and 2). A similar analysis would serve as an EF indicator.
EPD from steel manufacturers generates WF values smaller than those in the CEACE database. EPD from concrete manufacturers generates WF values similar to those in the CEACE database. In the same way, the AEPDs (self-declarations) of the vaults and joists yield much higher values than those of the CEACE base, as previously justified. The WF between Scenario 2 (without EPD), Scenario 3 (with all EPDs except vaults), and Scenario 4 (with all EPDs) increases, especially between Scenarios 2 and 4.
Regarding I_CEACE, it can be stated that EPDs in this case increase I_CEACE values, due to the influence of the WF indicator. It will be necessary to review in the future the influence of the use of self-declarations on the WF indicator, and therefore, on the I_CEACE. This study must be extrapolated to other materials to be conclusive. Therefore, this analysis verifies that the CEACE method can be employed to evaluate building projects according to CPE criteria, since it allows comparisons to be made between proposals that incorporate environmental aspects such as the use of EPDs and the use of materials certified with a lower CF and obtains lower values of I_CEACE. The difficulty in obtaining environmental information for many construction products should also be borne in mind, since most products do not have EPD, and hence the information, at least in the case of Spain, is not centralised, which greatly hinders comparative data analysis. These types of tools can provide an incentive for the dissemination of this type of environmental declaration.

8. Conclusions

This research demonstrates the usefulness of the new method proposed, CEACE, which is easy to use and understand, for the promotion of sustainability in its ecological, social, and economic dimensions. The method uses innovative indicators such as the ecological footprint, EF, and the water footprint, WF, and other widespread indicators, such as the carbon footprint, CF, and the quantification of waste, CDW. The 15 dwelling projects (single-family, multifamily, from 1 up to 10 floors) assessed have a cost range of 475 EUR to 650 EUR/m2. Regarding the CF indicator, the range is 0.43–0.65 t CO2/m2 and for the EF indicator, it is 0.20–0.31 hag/m2. The generated CDW varies between 100–170 kg/m2. These results are similar to others found in the literature.
An indicator is proposed that combines environmental, economic, and social assessment through a global indicator, I_CEACE. Fifteen projects are analysed with the method. Single-family dwellings with one or two floors show the worst behaviour of I_CEACE, and these also have the highest economic cost. The social aspect was fixed for all cases analysed. From the analysis of the tool, the budget chapters with the greatest impact are those dealing with structures and foundations. On analysing the chapter on structures, the greatest impacts are found to be related to items such as reinforced concrete slabs and beams.
The sustainability indicator I_CEACE has been shown to be sensitive to changes in the various indicators that compose it. In future work, the exhaustive study of typologies and diverse uses is proposed in order to determine reference values. Additionally, the integration of the indicator in building information modelling could be explored.

Author Contributions

Conceptualization, J.S.-G., P.G.-G., P.G.-V., and M.M.; methodology, J.S.-G. and M.M.; software, J.S.-G. and P.G.-V.; validation, P.G.-G., P.G.-V., and M.M.; formal analysis, J.S.-G. and M.M.; investigation, J.S.-G. and M.M.; resources, J.S.-G. and M.M.; data curation, P.G.-G. and P.G.-V.; writing—original draft preparation J.S.-G. and M.M.; writing—review and editing, J.S.-G., P.G.-G., P.G.-V., and M.M.; visualisation, P.G.-V.; supervision, J.S.-G. and M.M.; project administration, J.S.-G.; funding acquisition, J.S-G. All authors have read and agreed to the published version of the manuscript.

Funding

This research was funded by Ministry of Economy and Knowledge of the Andalusian Government (Spain), grant number AT17_5913_USE: Andalusian Ecological Certificate for Building Construction (CEACE) according to the Carbon, Ecological, and Water Footprint Environmental Indicators.

Data Availability Statement

The original contributions presented in the study are included in the article, further inquiries can be directed to the corresponding author.

Acknowledgments

This publication is the result of research conducted in the research project (AT17_5913_USE): Andalusian Ecological Certificate for Building Construction (CEACE) according to the Carbon, Ecological, and Water Footprint Environmental Indicators. Financed within the PAIDI 2020 call: Knowledge Transfer Activities by the Ministry of Economy and Knowledge of the Andalusian Government (Spain).

Conflicts of Interest

The authors declare no conflict of interest.

Abbreviations

ACCDAndalusia Construction Cost Data Base
BCBasic Cost
CAMCompulsory minimum environmental criteria
CDWConstruction and demolition waste
CEACECertificado Ecológico Andaluz de Construcción de Edificios (Andalusian Ecological Certificate for the Construction of Buildings)
CFCarbon footprint
EFEcological footprint
EPDEnvironmental Product Declarations
EUEuropean Union
FFFootprint family
GFAGround floor area
GHGGreenhouse gas
GPPGreen Public Procurement
LCALife Cycle Assessment
SUCSimple Unit Cost
WFWater footprint

Appendix A

Table A1. Economic and Environmental Budget. Project 1.
CodeUnitConceptTotal
Quantity (ud.ref)
Cost (EUR)CF (tCO2)EF (hag)WF (m3)CDW (kg)
Chapter
02. Earth Works
02ACC00001m3Hole excavation for the foundation footing in soil of medium consistency5291.014285.7211.295.6940.810.00
02RRM00001m3Earth filling carried out mechanically122.11102.570.490.2442.270.00
02TMM00002m3Soil transport, MAX. distance 5 km, loaded mechanically6614.6820,108.6394.8347.04342.620.00
Total Chapter 02. Earthworks24,496.92106.6152.98425.700.00
03. Foundation
03ACC00011kgRebar for the foundation B500S81,325.00105,722.50129.2158.822395.932649.57
03ERT80060m2Metal formwork 2 cm, in retaining wall1587.4356,083.9011.875.166802.01434.89
03HRZ80030m3Reinforced concrete, HA-25/P/40/IIa with B400S steel, in footings and pile caps, poared with crane1098.99126405.83394.69187.466148.20145,714.62
03HMM00002m3Mass concrete HM-20/P/40/I in foundations122.118244.8730.2814.51452.3413,447.68
Total Chapter 03. Foundation296,457.10566.05265.9415,798.49162,246.76
04. Sewerage
04VBP00002mReinforced PVC downpipe, 110 mm diameter1221.1024495.275.222.51887.2492.89
04CCP00031mHung PVC mainfold, 315 mm diameter244.2212963.202.891.37505.9252.80
04EAP90002uSewerage passage box, 63 × 63 cm, 1 m deep, executed in soil122.1126584.5727.4613.33297.356861.88
Total Chapter 04. Sewerage64,043.0335.5717.201690.507007.57
05. Structure
05FUA00118m2Slab formed by autoresist beams and concrete vaults (HA-35)12,088.90396,395.03835.93400.1015126.04330,368.44
05HAC00015kgRebar B500S147,875.00192,237.50234.95106.954356.574817.77
05HET00201m2Metal formwork with phenolic board cladding9280.34181,245.0441.3819.865922.41419.77
05HHJ00003m3Concrete for reinforcement in beams HA-25/P/20/Iia1221.1095,038.21360.97173.095393.56160,313.79
Total Chapter 05. Structure864,915.781473.23700.0030,798.59495,919.76
06. Masonry
06LHC00001m2Wall with ceramic breaks of 7 cm thick4029.6273,862.93147.8670.38947.2136048.22
06LPM00001m2Brick wall with 1 foot drilled bricks10623.50375,009.55844.11401.045278.41207,113.81
06DTD00001m2Brick partition wall with ceramic brick of 9 cm thick9890.88133,922.52295.50140.531832.4072,663.03
06DSS00001m2Brick partition wall with ceramic brick with mortar8914.0194,755.93121.5358.22787.1029542.06
Total Chapter 06. Masonry677,550.931409.01670.168845.12345,367.11
07. Roof
07HTF00002m2Walkable roof 1343.21102,836.1662.5329.54706.4011,666.56
Total Chapter 07. Roof102,836.1662.5329.54706.4011,666.56
08. Instalations
08FFC90100mCopper ducting, recessed, 12 mm diameter5617.0558,361.1513.156.15594.17160.27
08FGL00004uMixer washbasin faucet equipment. Premium quality732.6674,753.3073.1533.272707.56480.82
08FSI00001uLow tank toilet, white vitrified porcelain305.2745,372.2839.3618.131434.33303.01
08FSL00091uPedestal washbasin white vitrified porcelain305.2752,732.3438.9417.93672.94296.78
08NAA90101uSolar interstorage unit with fixed coil capacity 150 litres, DHW123.0047,715.3911.705.38245.4844.34
08NEE90011uInclined structure to support solar pannel of DHW76.0016,282.240.010.040.250.05
08NOC90001uFlat solar collector, absorber surface is 1.8 m276.0028,622.361.610.8339.1339.89
08NPP90001mHeat-insulated annealed cupper ducting 15 mm diameter2820.0097,628.403.951.96181.8941.93
08FDP00011uPVC siphon canister 125 mm with PVC tube 20 mm diameter, 1.9 thick976.8840,687.0545.2520.835899.88405.17
08FCC00055mHeat-insulated copper ducting, 36 mm, recessed 2320.0848,744.8816.797.52751.15206.62
08CAF00102uHeat pump condenser 17,700 frig/h and 19,500 kcal/h120.0094,3603.20112.6552.182363.03426.85
08MAA90011uElevator without motor, 400 kg and 5 persons capacity3.0071,114.7022.9215.361139.25199.99
08CCE00000m2Radiator with single panel sheet of steel and 2-way wrench185.7633,934.6415.477.21326.7962.30
08CAW00001mTwo conductor circuits, 1.5 mm28303.4629,062.119.124.371565.59103.48
08ERR00246mGeneral power supply line 3 × 95 + 2 × 50 mm2 inside PVC tube2564.30348,411.4455.2325.234995.41626.47
08ELL00002uRecessed switch for light1587.4370,053.2919.399.132566.69211.33
08ETT00002uRecessed power outlet 1/16 A with 1.5 mm22686.4190,021.6018.178.802648.87203.20
08EPP00152mGround electric connection with bare popper wire of 35 mm22197.9725,342.592.851.58116.5020.44
Total Chapter 08. Instalations2,122,442.96499.72235.9028,248.893832.94
09. Isolation
09TPP00030m2Sprayed polyurethane wall insulation 20 mm8914.0132,179.5829.0712.252172.88267.42
Total Chapter 09. Isolation32,179.5829.0712.252172.88267.42
10. Finishes
10WRC00001mCeramic tile 14 × 28 cm1098.9914,122.022.841.4847.14229.87
10TET00005m2Continuos ceiling with smooth plater pates, metal frame976.8816,577.656.072.9897.731029.20
10SSS00010m2Concrete screed with HM-20, 15 cm thickness1221.1026,033.8549.2723.701107.1523,454.67
10SCS00001m2Flooring ceramic tile 14 × 28 cm9768.78190,686.59223.99105.383983.0320,928.36
10CGG00028m2Trimmed and plastered on walls, includes plaster mortar33,458.10424,917.879.548.42655.3828947.95
10CEE00006m2Plastering and striped for tiling21,002.90288,579.8531.7718.65536.034506.93
10AAL00003m2White tile 15 × 15 cm with adhesive5250.72102,914.11116.5353.952187.948218.58
Total Chapter 10. Finishes1,063,831.94439.99214.558614.4087,315.56
11. Carpentry, safety and security elements
11SRM00001m2Rolled steel security mesh with plates and square bars122.116506.025.302.43150.310.22
11SPP00001m2Manually activated roller shutter with slats of 1.0 mm thick854.7741,823.9045.4421.021658.77257.82
11SBA00001mStell railing with 14 mm diamter bars732.6645,131.8636.3216.641030.831.32
11MPB00151m2Main door, with frame1587.43189,475.64−11.61-6.611623.951036.59
11LVA00127m2Aluminum casement window type II (1.5 to 3 m wide)732.6678,130.8617.487.08457.3549.94
11LPA00125m2Aluminum hinged door732.6676,394.46123.9648.863162.50316.20
Total Chapter 11. Carpentry, safety and security elements437,462.74216.8989.418083.711662.08
12. Glazing and synthetic products
12NNI80001m2Window glass, 8 mm thick1343.2132,035.5610.604.78579.53149.34
Total Chapter 12. Glazing and synthetic products32,035.5610.604.78579.53149.34
13. Paints
13EAA00001m2Acrylic elastomer paint14,836.3054,449.2223.9210.00728.55445.09
13EEE00001m2Greasy enamel paint1648.4811,737.181.850.86200.6040.16
13IPP00001m2Plastic paint on bricks, gypsum or cement34,837.90142,487.01124.2453.606111.601397.70
13IEE00002m2Grasy enamel painting on wood carpentry3870.8735,960.3814.446.381201.09150.35
Total Chapter 13.Paints244,633.79164.4670.838241.842033.29
TOTAL5,962,886.485013.732363.56114,206.041,117,468.40

References

  1. European Comission. LEVEL(S) Taking Action on the TOTAL Impact of the Construction Sector; European Comission: Brussels, Belgium, 2019. [Google Scholar]
  2. European Comission. A New Circular Economy Action Plan; European Comission: Brussels, Belgium, 2020. [Google Scholar]
  3. Jang, H.J.; Wang, S.J.; Tae, S.H.; Zheng, P.F. Establishment of an Environmental Impact Factor Database for Building Materials to Support Building Life Cycle Assessments in China. Buildings 2024, 14, 228. [Google Scholar] [CrossRef]
  4. Barbhuiya, S.; Das, B.B. Life Cycle Assessment of Construction Materials: Methodologies, Applications and Future Directions for Sustainable Decision-Making. Case Stud. Constr. Mater. 2023, 19, e02326. [Google Scholar] [CrossRef]
  5. Warrier, G.A.; Palaniappan, S.; Habert, G. Classification of Sources of Uncertainty in Building LCA. Energy Build. 2024, 305, 113892. [Google Scholar] [CrossRef]
  6. Wackernagel, M.; Rees, W. Our Ecological Footprint: Reducing Human Impact on the Earth; New Society: Gabriola Island, BC, Canada, 1996. [Google Scholar]
  7. Galli, A.; Antonelli, M.; Wambersie, L.; Bach-Faig, A.; Bartolini, F.; Caro, D.; Iha, K.; Lin, D.; Mancini, M.S.; Sonnino, R.; et al. EU-27 Ecological Footprint Was Primarily Driven by Food Consumption and Exceeded Regional Biocapacity from 2004 to 2014. Nat. Food 2023, 4, 810–822. [Google Scholar] [CrossRef] [PubMed]
  8. Osman, A.I.; Farghali, M.; Dong, Y.; Kong, J.; Yousry, M.; Rashwan, A.K.; Chen, Z.; Al-Fatesh, A.; Rooney, D.W.; Yap, P.-S. Reducing the Carbon Footprint of Buildings Using Biochar-Based Bricks and Insulating Materials: A Review. Environ. Chem. Lett. 2024, 22, 71–104. [Google Scholar] [CrossRef]
  9. Weidema, B.P.; Thrane, M.; Christensen, P.; Schmidt, J.; Lokke, S. Carbon Footprint: A Catalyst for Life Cycle Assessment? J. Ind. Ecol. 2008, 12, 3–6. [Google Scholar] [CrossRef]
  10. Chapagain, A.K.; Hoekstra, A.Y. Water Footprints of Nations (Value of Water Research Report Series/Unesco-IHE No. 16); UNESCO-IHE Institute for Water Education: Delft, The Netherlands, 2004. [Google Scholar]
  11. Sunitha, S.; Akash, A.U.; Sheela, M.N.; Kumar, J.S. The Water Footprint of Root and Tuber Crops. Environ. Dev. Sustain. 2024, 26, 3021–3043. [Google Scholar] [CrossRef]
  12. Fang, K.; Song, S.; Heijungs, R.; de Groot, S.; Dong, L.; Song, J.; Wiloso, E.I. The Footprint’s Fingerprint: On the Classification of the Footprint Family. Curr. Opin. Environ. Sustain. 2016, 23, 54–62. [Google Scholar] [CrossRef]
  13. Galli, A. Footprints—Environmental Science—Oxford Bibliographies. Available online: https://www.oxfordbibliographies.com/view/document/obo-9780199363445/obo-9780199363445-0046.xml (accessed on 11 November 2022).
  14. Hoekstra, A.Y.; Wiedmann, T.O. Humanity’s Unsustainable Environmental Footprint. Science 2014, 344, 1114–1117. [Google Scholar] [CrossRef] [PubMed]
  15. Matuštík, J.; Kočí, V. What Is a Footprint? A Conceptual Analysis of Environmental Footprint Indicators. J. Clean. Prod. 2021, 285, 124833. [Google Scholar] [CrossRef]
  16. Bare, J.C.; Hofstetter, P.; Pennington, D.W.; Haes, H.A.U. Midpoints versus Endpoints: The Sacrifices and Benefits. Int. J. Life Cycle Assess. 2000, 5, 319–326. [Google Scholar] [CrossRef]
  17. European Comission. Public Procurement for a Circular Economy; European Comission: Brussels, Belgium, 2017. [Google Scholar]
  18. Giljum, S.; Burger, E.; Hinterberger, F.; Lutter, S.; Bruckner, M. A Comprehensive Set of Resource Use Indicators from the Micro to the Macro Level. Resour. Conserv. Recycl. 2011, 55, 300–308. [Google Scholar] [CrossRef]
  19. Stoeglehner, G.; Narodoslawsky, M. Implementing Ecological Footprinting in Decision-Making Processes. Land Use Policy 2008, 25, 421–431. [Google Scholar] [CrossRef]
  20. Fang, K.; Heijungs, R.; De Snoo, G.R. Theoretical Exploration for the Combination of the Ecological, Energy, Carbon, and Water Footprints: Overview of a Footprint Family. Ecol. Indic. 2014, 36, 508–518. [Google Scholar] [CrossRef]
  21. Galli, A.; Wiedmann, T.; Ercin, E.; Knoblauch, D.; Ewing, B.; Giljum, S. Integrating Ecological, Carbon and Water Footprint into a Footprint Family of Indicators: Definition and Role in Tracking Human Pressure on the Planet. Ecol. Ind. 2012, 16, 100–112. [Google Scholar] [CrossRef]
  22. Laurent, A.; Owsianiak, M. Potentials and Limitations of Footprints for Gauging Environmental Sustainability. Curr. Opin. Environ. Sustain. 2017, 25, 20–27. [Google Scholar] [CrossRef]
  23. Vanham, D.; Leip, A.; Galli, A.; Kastner, T.; Bruckner, M.; Uwizeye, A.; van Dijk, K.; Ercin, E.; Dalin, C.; Brandão, M.; et al. Environmental Footprint Family to Address Local to Planetary Sustainability and Deliver on the SDGs. Sci. Total Environ. 2019, 693, 133642. [Google Scholar] [CrossRef] [PubMed]
  24. Pérez-Solís, J. Evaluación de La Footprint Family En Edificación (Footprint Family Evaluation in Buildings). Master’s Thesis, Universidad de Sevilla, Seville, Spain, 2014. [Google Scholar]
  25. Rivero-Camacho, C.; Ferreira-Sánchez, A. Application of the “Footprint Family” for the Environmental Evaluation of Public Buildings in Spain. Case Study: Educational Center. Rev. Habitat Sustentable 2021, 11, 72–85. [Google Scholar] [CrossRef]
  26. Rivero-Camacho, C.; Martín-del-Río, J.J.; Marrero-Meléndez, M. Evolution of the Life Cycle of Residential Buildings in Andalusia: Economic and Environmental Evaluation of Their Direct and Indirect Impacts. Sustain. Cities Soc. 2023, 93, 104507. [Google Scholar] [CrossRef]
  27. Marrero, M.; Rivero-Camacho, C.; Alba-Rodríguez, M.D. What Are We Discarding during the Life Cycle of a Building? Case Studies of Social Housing in Andalusia, Spain. Waste Manag. 2020, 102, 391–403. [Google Scholar] [CrossRef]
  28. Lopes, R.; Silva, D.; Rivero-Camacho, C.; Rusu, D.; Marrero, M. Methodology for Improving the Sustainability of Industrial Buildings via Matrix of Combinations Water and Carbon Footprint Assessment. Sustainability 2022, 14, 15297. [Google Scholar] [CrossRef]
  29. Alvarez, S.; Carballo-Penela, A.; Mateo-Mantecón, I.; Rubio, A. Strengths-Weaknesses-Opportunities-Threats Analysis of Carbon Footprint Indicator and Derived Recommendations. J. Clean. Prod. 2016, 121, 238–247. [Google Scholar] [CrossRef]
  30. Schwartz, Y.; Raslan, R.; Mumovic, D. The Life Cycle Carbon Footprint of Refurbished and New Buildings—A Systematic Review of Case Studies. Renew. Sustain. Energy Rev. 2018, 81, 231–241. [Google Scholar] [CrossRef]
  31. Chastas, P.; Theodosiou, T.; Kontoleon, K.J.; Bikas, D. Normalising and Assessing Carbon Emissions in the Building Sector: A Review on the Embodied CO2 emissions of Residential Buildings. Build. Environ. 2018, 130, 212–226. [Google Scholar] [CrossRef]
  32. UNE-EN 15978; Sustainability of Construction Works—Assessment of Environmental Performance of Buildings—Calculation Method. AENOR: Madrid, Spain, 2012.
  33. De Wolf, C. Material Quantities in Building Structures and Their Environmental Impact; MIT: Boston, MA, USA, 2014. [Google Scholar]
  34. Solís-Guzmán, J.; Rivero-Camacho, C.; Alba-Rodríguez, D.; Martínez-Rocamora, A. Carbon Footprint Estimation Tool for Residential Buildings for Non-Specialized Users: OERCO2 Project. Sustainability 2018, 10, 1359. [Google Scholar] [CrossRef]
  35. Amiri, A.; Emami, N.; Ottelin, J.; Sorvari, J.; Marteinsson, B.; Heinonen, J.; Junnila, S. Embodied Emissions of Buildings—A Forgotten Factor in Green Building Certificates. Energy Build. 2021, 241, 110962. [Google Scholar] [CrossRef]
  36. Le Den, X.; Steinmann, J.; Röck, M.; Birgisdottir, H.; Horup, L.H.; Tozan, B.; Sørensen, A. Towards Embodied Carbon Benchmarks for Buildings in Europe—Summary Report; Rambøll: London, UK, 2022. [Google Scholar] [CrossRef]
  37. Radhi, H.; Sharples, S. Global Warming Implications of Facade Parameters: A Life Cycle Assessment of Residential Buildings in Bahrain. Environ. Impact Assess. Rev. 2013, 38, 99–108. [Google Scholar] [CrossRef]
  38. Röck, M.; Saade, M.R.M.; Balouktsi, M.; Rasmussen, F.N.; Birgisdottir, H.; Frischknecht, R.; Habert, G.; Lützkendorf, T.; Passer, A. Embodied GHG Emissions of Buildings—The Hidden Challenge for Effective Climate Change Mitigation. Appl. Energy 2020, 258, 114107. [Google Scholar] [CrossRef]
  39. Cellura, M.; Guarino, F.; Longo, S.; Mistretta, M. Energy Life-Cycle Approach in Net Zero Energy Buildings Balance: Operation and Embodied Energy of an Italian Case Study. Energy Build. 2014, 72, 371–381. [Google Scholar] [CrossRef]
  40. Samad, P.P.; Faryadi, S.H. Determination of Ecological Footprints of Dense and High-Rise Districts, Case Study of Elahie Neighborhood, Tehran. J. Environ. Stud. 2008, 34, 63–72. [Google Scholar]
  41. Zhao, X.Y.; Mao, X.W. Comparison Environmental Impact of the Peasant Household in Han, Zang and Hui Nationality Region: Case of Zhangye, Gannan and Linxia in Gansu Province. Acta Ecol. Sin. 2013, 33, 5397–5406. [Google Scholar] [CrossRef]
  42. Li, B.; Cheng, D.-J. Hotel Ecological Footprint Model: Its Construction and Application. Chin. J. Ecol. 2010, 7, 31. [Google Scholar]
  43. Bin, G.; Parker, P. Measuring Buildings for Sustainability: Comparing the Initial and Retrofit Ecological Footprint of a Century Home—The REEP House. Appl. Energy 2012, 93, 24–32. [Google Scholar] [CrossRef]
  44. Li, D.Z.; Hui, E.C.M.; Leung, B.Y.P.; Li, Q.M.; Xu, X. A Methodology for Eco-Efficiency Evaluation of Residential Development at City Level. Build. Environ. 2010, 45, 566–573. [Google Scholar] [CrossRef]
  45. Rivero-Camacho, C.; Martín-Del-Río, J.J.; Solís-Guzmán, J.; Marrero, M. Ecological Footprint of the Life Cycle of Buildings. In Environmental Footprints and Eco-Design of Products and Processes; Springer: Singapore, 2021; pp. 1–39. [Google Scholar] [CrossRef]
  46. Solís-Guzmán, J.; Marrero, M.; Ramírez-de-Arellano, A. Methodology for Determining the Ecological Footprint of the Construction of Residential Buildings in Andalusia (Spain). Ecol. Indic. 2013, 25, 239–249. [Google Scholar] [CrossRef]
  47. González-Vallejo, P.; Marrero, M.; Solís-Guzmán, J. The Ecological Footprint of Dwelling Construction in Spain. Ecol. Indic. 2015, 52, 75–84. [Google Scholar] [CrossRef]
  48. Marrero, M.; Puerto, M.; Rivero-Camacho, C.; Freire-Guerrero, A.; Solís-Guzmán, J. Assessing the Economic Impact and Ecological Footprint of Construction and Demolition Waste during the Urbanization of Rural Land. Resour. Conserv. Recycl. 2017, 117, 160–174. [Google Scholar] [CrossRef]
  49. United Nations Environment Program (UNEP). Eco-Housing Guidelines for Tropical Regions; UNEP Regional Resource Centre for Asia and the Pacific: Bangkok, Thailand, 2006. [Google Scholar]
  50. GBC Australia. Building the Business Case for Green Buildings in Australia; GBC Australia: Sidney, Australia, 2008. [Google Scholar]
  51. ISO 14046:2014; Environmental Management—Water Footprint—Principles, Requirements and Guidelines. International Organization for Standardization: Geneva, Switzerland, 2014. Available online: https://www.iso.org/standard/43263.html (accessed on 22 September 2022).
  52. Hoekstra, A.Y. Water Footprint Assessment: Evolvement of a New Research Field. Water Resour. Manag. 2017, 31, 3061–3081. [Google Scholar] [CrossRef]
  53. McCormack, M.; Treloar, G.J.; Palmowski, L.; Crawford, R. Modelling Direct and Indirect Water Requirements of Construction. Build. Res. Inf. 2007, 35, 156–162. [Google Scholar] [CrossRef]
  54. Crawford, R.H.; Pullen, S. Life Cycle Water Analysis of a Residential Building and Its Occupants. Build. Res. Inf. 2011, 39, 589–602. [Google Scholar] [CrossRef]
  55. Bardhan, S. Assessment of Water Resource Consumption in Building Construction in India. Ecosyst. Sustain. Dev. 2011, 144, 1743–3541. [Google Scholar] [CrossRef]
  56. Heravi, G.; Abdolvand, M.M. Assessment of Water Consumption during Production of Material and Construction Phases of Residential Building Projects. Sustain. Cities Soc. 2019, 51, 101785. [Google Scholar] [CrossRef]
  57. Han, M.Y.; Chen, G.Q.; Meng, J.; Wu, X.D.; Alsaedi, A.; Ahmad, B. Virtual Water Accounting for a Building Construction Engineering Project with Nine Sub-Projects: A Case in E-Town, Beijing. J. Clean. Prod. 2016, 112, 4691–4700. [Google Scholar] [CrossRef]
  58. Meng, J.; Chen, G.Q.; Shao, L.; Li, J.S.; Tang, H.S.; Hayat, T.; Alsaedi, A.; Alsaadi, F. Virtual Water Accounting for Building: Case Study for E-Town, Beijing. J. Clean. Prod. 2014, 68, 7–15. [Google Scholar] [CrossRef]
  59. Rivero-Camacho, C.; Marrero, M. Water Footprint of the Life Cycle of Buildings: Case Study in Andalusia, Spain. In Green Energy Technol; Ren, J., Ed.; Springer Nature: Cham, Switzerland, 2022; pp. 135–165. [Google Scholar] [CrossRef]
  60. Ruiz-Pérez, M.R.; Alba-Rodríguez, M.D.; Marrero, M. Evaluation of Water Footprint of Urban Renewal Projects. Case Study in Seville, Andalusia. Water Res. 2022, 221, 118715. [Google Scholar] [CrossRef] [PubMed]
  61. European Commission 2016 Eurostat—Data Explorer. Available online: https://ec.europa.eu/eurostat (accessed on 15 February 2024).
  62. Donatello, S.; Dodd, N. Level(s) Indicator 2.2: Construction and Demolition Waste and Materials User Manual: Introductory Briefing, Instructions and Guidance (Publication Version 1.1); European Commision: Brussels, Belgium, 2021. [Google Scholar]
  63. Wu, Z.; Yu, A.T.W.; Shen, L.; Liu, G. Quantifying Construction and Demolition Waste: An Analytical Review. Waste Manag. 2014, 34, 1683–1692. [Google Scholar] [CrossRef] [PubMed]
  64. Cochran, K.M.; Townsend, T.G. Estimating Construction and Demolition Debris Generation Using a Materials Flow Analysis Approach. Waste Manag. 2010, 30, 2247–2254. [Google Scholar] [CrossRef] [PubMed]
  65. Yost, P.A.; Halstead, J.M. A Methodology for Quantifying the Volume of Construction Waste. Waste Manag. Res. 1996, 14, 453–461. [Google Scholar] [CrossRef]
  66. Aguirre, C.; Latorre, M.V.; Burboa, R.; Montecinos, P. Diagnóstico de La Generación de Residuos Sólidos de Construcción de Edificación En Obras de Edificación En Altura En La Región Metropolitana. Rev. Construcción 2005, 4, 38–46. [Google Scholar]
  67. Mokhtar, S.N.; Mahmood, N.Z.; Hassan, C.R.C.; Masudi, A.F.; Sulaiman, N.M. Factors That Contribute to the Generation of Construction Waste at Sites. Adv. Mat. Res. 2011, 163, 4501–4507. [Google Scholar] [CrossRef]
  68. Wimalasena, B.A.D.S.; Ruwanpura, J.Y.; Hettiaratchi, J.P.A. Modeling Construction Waste Generation towards Sustainability. In Proceedings of the Construction Research Congress 2010: Innovation for Reshaping Construction Practice—Proceedings of the 2010 Construction Research Congress, Banff, Alta, Canada, 8–10 May 2010; pp. 1498–1507. [Google Scholar] [CrossRef]
  69. Coelho, A.; De Brito, J. Economic Analysis of Conventional versus Selective Demolition—A Case Study. Resour. Conserv. Recycl. 2011, 55, 382–392. [Google Scholar] [CrossRef]
  70. Llatas, C. A Model for Quantifying Construction Waste in Projects According to the European Waste List. Waste Manag. 2011, 31, 1261–1276. [Google Scholar] [CrossRef] [PubMed]
  71. Mercader-Moyano, P.; Ramírez-De-Arellano-Agudo, A. Selective Classification and Quantification Model of C&D Waste from Material Resources Consumed in Residential Building Construction. Waste Manag Res. 2013, 31, 458–474. [Google Scholar] [CrossRef]
  72. Solís-Guzmán, J.; Marrero, M.; Montes-Delgado, M.V.; Ramírez-de-Arellano, A. A Spanish Model for Quantification and Management of Construction Waste. Waste Manag. 2009, 29, 2542–2548. [Google Scholar] [CrossRef] [PubMed]
  73. Level(s). Available online: https://environment.ec.europa.eu/topics/circular-economy/levels_en (accessed on 23 September 2022).
  74. A European Green Deal|European Commission. Available online: https://ec.europa.eu/info/strategy/priorities-2019-2024/european-green-deal_en (accessed on 23 September 2022).
  75. Positive-Energy and Low Carbon Buildings. Available online: http://www.batiment-energiecarbone.fr/en/ (accessed on 23 September 2022).
  76. Italian Government. Criteri Ambientali Minimi per l’Edilizia (Minimum Environmental Criteria for construction); Ministry of Environment: Rome, Italy, 2017.
  77. Itaca. Available online: https://www.itaca.org/valutazione_sostenibilita.asp# (accessed on 23 September 2022).
  78. GBC Spain HADES Herramienta de Ayuda al Diseño Para Una Edificación Más Sostenible. Available online: http://www.gbce.es/ (accessed on 5 February 2024).
  79. GBC Spain VERDE. Available online: https://gbce.es/certificacion-verde/herramientas_verde/verde_edificios_2022/ (accessed on 7 February 2023).
  80. SpainGBC LEED Certificate. Available online: http://www.spaingbc.org/web/leed-4.php (accessed on 30 November 2023).
  81. BREEAM ES Website. Available online: http://www.breeam.es/ (accessed on 30 December 2023).
  82. Asociación Ecómetro Ecometro LCA Tool Website. Available online: http://acv.ecometro.org/ (accessed on 30 December 2018).
  83. Ruiz-Pérez, M.R.; Alba-Rodríguez, M.D.; Castaño-Rosa, R.; Solís-Guzmán, J.; Marrero, M. HEREVEA Tool for Economic and Environmental Impact Evaluation for Sustainable Planning Policy in Housing Renovation. Sustainability 2019, 11, 2852. [Google Scholar] [CrossRef]
  84. OERCO2. Construction Material Life Cycle Website. Available online: http://oerco2.eu/ (accessed on 1 January 2023).
  85. ACCD. Andalusian Construction Cost Database (ACCD). Consejería de Obras Pública y Vivienda de La Junta de Andalucía. Available online: https://www.juntadeandalucia.es/organismos/fomentoarticulaciondelterritorioyvivienda/areas/vivienda-rehabilitacion/planes-instrumentos/paginas/bcca-jul-2023.html (accessed on 1 February 2024).
  86. UNE-EN-15804; Sustainability of Construction Works—Environmental Product Declarations—Core Rules for the Product Category of Construction Products. AENOR: Madrid, Spain, 2020.
  87. Ceace Project CEACE. Available online: https://personal.us.es/jaimesolis/ (accessed on 23 September 2022).
  88. ITeC BEDEC Website. Available online: https://metabase.itec.cat/vide/es/bedec (accessed on 31 December 2023).
  89. Cype Ingenieros, S.A. Cypetherm HE PLus. Available online: https://bimserver.center/bim_store.asp (accessed on 30 December 2023).
  90. Freire-Guerrero, A.; Alba-Rodríguez, M.D.; Marrero, M. A Budget for the Ecological Footprint of Buildings Is Possible: A Case Study Using the Dwelling Construction Cost Database of Andalusia. Sustain. Cities Soc. 2019, 51, 101737. [Google Scholar] [CrossRef]
  91. Rivero-Camacho, C. Estudio de Huellas En El Ciclo de Vida Del Edificio Residencial (Study of Footprints in the Life Cycle of the Residential Building); University of Seville: Seville, Spain, 2020. [Google Scholar]
  92. Ecoinvent Centre. Ecoinvent Database. Available online: https://ecoinvent.org/database/ (accessed on 5 February 2024).
  93. SimaPro. Available online: https://simapro.com/ (accessed on 17 May 2023).
  94. Marrero, M.; Ramirez-De-Arellano, A. The Building Cost System in Andalusia: Application to Construction and Demolition Waste Management. Constr. Manag. Econ. 2010, 28, 495–507. [Google Scholar] [CrossRef]
  95. Marrero, M.; Rivero-Camacho, C.; Martínez-Rocamora, A.; Alba-Rodríguez, D.; Lucas-Ruiz, V. Holistic Assessment of the Economic, Environmental, and Social Impact of Building Construction. Application to Housing Construction in Andalusia. J. Clean. Prod. 2024, 434, 140170. [Google Scholar] [CrossRef]
  96. AzariJafari, H.; Guest, G.; Kirchain, R.; Gregory, J.; Amor, B. Towards Comparable Environmental Product Declarations of Construction Materials: Insights from a Probabilistic Comparative LCA Approach. Build. Environ. 2021, 190, 107542. [Google Scholar] [CrossRef]
  97. Cardoso, V.E.M.; Sanhudo, L.; Silvestre, J.D.; Almeida, M.; Costa, A.A. Challenges in the Harmonisation and Digitalisation of Environmental Product Declarations for Construction Products in the European Context. Int. J. Life Cycle Assess. 2024. [Google Scholar] [CrossRef]
  98. Soust-Verdaguer, B.; Palumbo, E.; Llatas, C.; Velasco Acevedo, Á.; Fernández Galvéz, M.D.; Hoxha, E.; Passer, A. The Use of Environmental Product Declarations of Construction Products as a Data Source to Conduct a Building Life-Cycle Assessment in Spain. Sustainability 2023, 15, 1284. [Google Scholar] [CrossRef]
  99. AENOR Global EPD AENOR—Declaraciones GlobalEPD En Vigor. Available online: https://www.aenor.com/certificacion/certificacion-de-producto/declaraciones-ambientales-de-producto/declaraciones-globalepd-en-vigor (accessed on 13 February 2023).
  100. ANDECE DAP Spain Declaraciones Ambientales ANDECE—ANDECE. Available online: https://www.andece.org/declaraciones-ambientales-andece/ (accessed on 14 February 2023).
  101. Clark, D. What Colour Is Your Building? Measuring and Reducing the Energy and Carbon Footprint of Buildings; RIBA Publishing: London, UK, 2012; ISBN 978-1859464472. [Google Scholar]
  102. Granados, H.; Fernández-Castillo, J.; Lçopez-Asiaín, J. Ratios Nacionales de Generación de RCD (Spanish Ratio of CDW Generation); CGATE and CSCAE: Madrid, Spain, 2020. [Google Scholar]
Figure 1. Work methodology description.
Buildings 14 01131 g001
Figure 2. Methodology for obtaining CEACE evaluation by calculating the carbon footprint (CF), ecological footprint (EF), water footprint (WF), construction and demolition waste (CDW), and social data.
Buildings 14 01131 g002
Figure 3. Environmental information collected by the unit cost (SUC).
Buildings 14 01131 g003
Figure 4. Environmental information (CF, EF, WF, and CDW) is obtained for each basic cost (BC), which is part of a work unit or simple unit cost (SUC) in the construction project.
Buildings 14 01131 g004
Figure 5. Percentage of influence of the chapters of work per m2.
Buildings 14 01131 g005
Table 1. Characteristics of the selected projects.
ProjectFloors above GroundFloors below GroundGross Floor Area (GFA)Number of DwellingsGround Floor UseFoundation
110111,100.88120DwellingsReinforced concrete slab
210211,100.88120PremisesReinforced concrete slab
3515550.5060DwellingsIsolated concrete pad
4525550.5060DwellingsReinforced concrete slab
5515550.5060DwellingsPiles
6424440.4048PremisesReinforced concrete slab
7414440.4048DwellingsReinforced concrete slab
8414440.4048PremisesPiles
9414440.4048DwellingsIsolated concrete pad
10313330.2536DwellingsIsolated concrete pad
11313330.2536PremisesPiles
12313330.2536DwellingsReinforced concrete slab
13203836.1724DwellingsIsolated concrete pad
14213836.1740DwellingsIsolated concrete pad
15102696.5713DwellingsConcrete trenches
Table 2. Results of the CEACE tool (per GFA).
Total per GFA in m2
ProjectCost
(EUR/m2)
CF
(t CO2/m2)
EF
(hag/m2)
WF
(m3/m2)
CDW
(kg/m2)
1537.150.4520.21310.29100.66
2534.070.4990.23511.14109.28
3474.120.4320.20410.02102.87
4570.360.5680.26712.58120.69
5541.780.4860.23510.81118.08
6593.030.6010.28613.11138.27
7519.930.4850.22911.49102.43
8497.450.4640.22811.69115.81
9510.640.4590.21611.31106.10
10539.370.5080.24012.03126.57
11477.270.5160.25311.80127.61
12570.640.5350.25312.15123.03
13665.060.5560.27213.51126.50
14699.640.6570.31216.54159.93
15550.900.6550.30915.14169.27
Table 3. I_CEACE of projects evaluated.
Unitary ValuesCoefficients I_CEACEI_norm_CEACE
Project CFuEFuWFuCDWuAuEuSu
10.3940.4020.2860.3790.3650.250.350.345−0.499
20.5340.5370.3840.4570.4780.240.350.423−0.250
30.3350.3490.2550.3990.3340.120.350.305−0.626
40.7390.7310.5470.5600.6440.320.350.5510.157
50.4950.5380.3450.5360.4790.260.350.426−0.241
60.8350.8410.6080.7190.7510.360.350.6320.415
70.4920.4970.4240.3950.4520.210.350.401−0.320
80.4320.4950.4450.5160.4720.170.350.408−0.298
90.4150.4210.4030.4280.4170.200.350.373−0.410
100.5590.5670.4840.6130.5560.250.350.480−0.069
110.5850.6440.4590.6230.5780.130.350.476−0.082
120.6390.6420.4980.5810.5900.320.350.5130.036
130.7020.7560.6530.6130.6810.500.350.6050.330
141.0001.0001.0000.9150.9790.570.350.8241.028
150.9960.9810.8401.0000.9540.280.350.7620.830
Normalization scale:
−2 to −3−1 to −20 to −10 to 11 to 22 to 3s 0.313
−3 s−2 s−ss+1 s+2 sx0.501
Table 4. Comparison of environmental values between CEACE and information from the EPDs.
MaterialCF (t CO2)EF (hag)WF (m3)
CEACEEPDCEACEEPDCEACEEPD
Steel rebars (kg)1.460 × 10−30.563 × 10−30.659 × 10−30.275 × 10−32.700 × 10−22.980 × 10−3
Cement mortar vaults (u)1.480 × 10−30.564 × 10−30. 709 × 10−30.275 × 10−31.468 × 10−20.840
Reinforced concrete HA-35 (m3)4.020 × 10−12.850 × 10−11.920 × 10−11.389 × 10−16.0006.260
Self-resistant joists (m)5.010 × 10−36.351 × 10−32.400 × 10−33.095 × 10−37.070 × 10−21.127
Table 5. Impact scenarios (Project 14).
Project 14
Scenarios
CF (t CO2/m2)EF (hag/m2)WF (hag/m2)I_CEACE
10.6570.31216.5450.720
20.6470.30516.0500.695
30.6280.29719.6550.748
40.6210.29425.6120.741
Disclaimer/Publisher’s Note: The statements, opinions and data contained in all publications are solely those of the individual author(s) and contributor(s) and not of MDPI and/or the editor(s). MDPI and/or the editor(s) disclaim responsibility for any injury to people or property resulting from any ideas, methods, instructions or products referred to in the content.

