
Smarter Window Selection for Smarter Energy Consumption: The Case of the United Arab Emirates

1
Department of Civil Engineering, Liwa College, Abu Dhabi 41009, United Arab Emirates
2
Department of Civil Engineering, Jordan University of Science and Technology, Irbid 22110, Jordan
Buildings 2024, 14(4), 876; https://doi.org/10.3390/buildings14040876
Submission received: 29 January 2024
/
Revised: 14 March 2024
/
Accepted: 15 March 2024
/
Published: 24 March 2024
(This article belongs to the Topic Sustainable and Smart Building)
Abstract
:The energy consumption levels of buildings in the United Arab Emirates (UAE) are among the highest in the world. One of the main reasons for this energy consumption is the need to cool buildings due to the hot climate of the UAE. As a large part of the heat accumulated inside buildings comes from windows, in this study, the effects of window size and direction in a typical building in the UAE on energy consumption and thermal performance are investigated through numerical modeling. The modeling process includes thermal conductivity, thermal convection, and solar radiation simulation. The energy performance of any building at any location can be obtained based on local weather data and the computational thermal characteristics of the building elements, such as its walls, roofs, windows, and doors. The study covered all different seasons of the year and different orientations for the windows, allowing the daily and yearly energy consumption associated with the windows to be obtained. Furthermore, the energy consumption was obtained for solar radiation and heat gain separately for both single- and double-glazed windows. It was found that north-facing windows consume significantly less annual energy (36% less), when compared with windows facing in the other three directions. Furthermore, the east- and west-facing windows consumed about 41% and 35% more daily cooling energy in August, when compared to north- and south-facing windows, respectively. The use of a window with a height equal to that of the wall can cause a clear greenhouse effect; hence, it is recommended to limit the window’s height to two-thirds of the wall height, which can save about one-third of the associated yearly cooling energy. This study should be considered as a general guideline, as the thermal performance of any specific building will be affected by its own thermal characteristics.
1. Introduction
The United Arab Emirates (UAE) has a desert climate characterized by high temperatures and low rainfall. The summers are scorching, with average temperatures exceeding 40 °C [1], while the winters are milder, with temperatures ranging from 15 °C to 25 °C. Humidity levels can be high, particularly in the coastal areas, and sandstorms are common during certain times of the year.
The levels of electrical energy generation and consumption in buildings in the UAE are among the highest in the world, as shown in Figure 1 [2]. The annual average electricity generated in the UAE recently reached about 14,000 kWh, which is higher than the amount generated in the United States of America (about 12,000 kWh) and much higher than that of a country such as the United Kingdom (about 4800 kWh) and the world average (about 3600 kWh). While the world generated 26,446 TWh of electricity in 2020, the UAE generated 137 TWh of electricity [2], indicating that the UAE represents about 0.52% of the world’s electricity generation. One main reason for this energy generation is the desire to cool buildings due to the hot, humid climate of the UAE.
A large part of the heat accumulated inside buildings comes from the windows. In hot regions, in addition to thermal conductivity, windows allow solar radiation to enter buildings, thus increasing the internal temperature. Energy consumption is required for the cooling of the building and, so, windows indirectly cause some energy consumption. Using sustainable architectural design solutions—such as smaller window sizes in terms of the window-to-wall ratio (WWR)—could reduce the cooling loads. In addition to window size, the direction (north, south, east, or west) that the window faces can have a significant effect on the heat gain and cooling requirements of buildings.
The objective of this research paper is to study the effects of windows on cooling energy consumption in hot climates; thus, the case of the United Arab Emirates is considered, and the thermal performance of a room with windows of different sizes in a typical building is investigated. It should be noted that this study should be considered as a general guideline, as the thermal performance of any specific building will be affected by its own thermal characteristics.
2. Literature Review
A quick review of the literature indicated that this topic has been gaining interest at a high rate over the past ten years. Several studies have investigated the optimization of the window-to-wall ratio in different climates and countries. Abdoli Naser et al. [3] investigated appropriate dimensions for the WWR and appropriate glazing for windows in order to reduce energy consumption in cold and dry climates in Iran. They found that the optimum WWR is in the range of 20% to 40%. Albatayneh et al. [4] studied the WWR, among other variables, in order to optimize the thermal performance of buildings in the warm Saharan Mediterranean climate. Alhagla et al. [5] studied the balancing of windows for better daylighting performance and energy consumption in Egypt. Alwetaishi and Benjeddou [6] showed that the WWR in schools in various regions with different climatic conditions in the Kingdom of Saudi Arabia should range from 20% to 30% for optimal daylight and energy performance. A thermal and energy consumption performance study of an office building in Algeria was conducted by Badeche and Bouchahm [7]. They concluded that, in a semi-arid climate, window orientation is the most important parameter; meanwhile, in the Mediterranean climate, glazing was found to be more important. The shading variable was the main parameter in the cool climate area. Bataineh and Al Rabee [8] investigated energy performance for a single one-story residential building in three different Mediterranean climates. Goia [9] searched for the best WWR in different cold European climates for an office building. He found that the optimum ratio is between 30% and 45%, and the total energy consumption may rise from 5% to 25% when the WWR is out of this range.
Goyal et al. [10] conducted research on the optimal WWR in a composite climate in India with respect to the daylight and energy performance. Jewel Rana et al. [11] studied the influence of the WWR on the cooling energy consumption rate of office buildings in Bangladesh, which is characterized by a subtropical monsoon climate. They showed an almost linear relationship between the WWR and the required cooling energy for distinct locations in the country. Kharvari [12] investigated the optimum value of window-to-floor ratio (WFR) rather than the WWR, considering Useful Daylight Illuminance, Daylight Autonomy, and Annual Sunlight Exposure, and utilized a multi-objective optimization scheme for the Mediterranean hot summer and continental dry summer climates. However, they did not consider the energy consumption performance of the windows.
Montaser Koohsari and Heidari [13] studied the approximate WWR in addition to the width-to-height ratio (WHR) in Iran, and conducted artificial lighting and thermal analyses whilst maintaining the best interior living conditions. Their research showed that heating and lighting energy demand is more affected by the WWR than cooling energy demand in the studied location, and showed that the optimum WWR is in the range of 15% to 25%. Through the use of a questionnaire, Liu et al. [14] conducted an optimization analysis assessing the energy efficiency of the WWR for three diverse types of housing buildings in China under both cooling and heating loads. The climate considered was the hot summer, cold winter zone of China, and they found a slightly non-linear relationship between energy use and the WWR; however, the energy consumption was considered in terms of total consumption, not due to windows alone. Their results indicated that, for multi-story and high-rise dwellings, the best WWR was in the range of 40% to 50%. Sorooshnia et al. [15] conducted multi-objective optimization to balance the outdoor visual view, thermal comfort inside buildings, and energy usage in a semi-tropical climate in Australia (i.e., in the southern hemisphere), using a method combining simulation and field measurement. Other related studies can be found in [16,17,18]. Other researchers have investigated the effects of different human factors on energy consumption and thermal comfort inside buildings. Özbey and Turhan [19,20] investigated the mean radiant temperature and angle factors of a room in a university office building, and found that the position of the occupant could affect their thermal feeling and, hence, the energy consumption trend. However, human factors and human comfort are beyond the scope of this research and, therefore, will not be considered in this work.
As can be seen from the review, most of the existing research has been conducted in moderate or cold climates. Only very few studies on hot climates, such as that of the United Arab Emirates climate considered in this research, could be found. In addition, previous research has demonstrated that the results are very dependent on the geographical location of the study, and results obtained for one geographical location cannot be adopted directly when considering other locations. In this study, the effects of windows on the energy consumption and thermal performance of a typical room in a building in the United Arab Emirates are investigated, covering all months of the year. The nature of the weather in the UAE does not require the heating of buildings, as temperatures rarely drop to a low level. Therefore, buildings in the UAE are rarely equipped with heating sources. In fact, cooling sources are sometimes needed in the winter months, when the temperature rises slightly above average. Such a case was not found in the existing literature and, hence, is investigated in this study.
3. Modeling
The energy consumption of the cooling system in a building is mainly the result of two parts: thermal energy gain and solar radiation. The thermal energy, , gained or lost through a window (or any surface area) is the result of the temperature difference between the inside and outside of the building, and is usually calculated per unit time—that is, as the rate of heat flow—at time t as follows:
where is the surface area of the building window, is the window’s U-value, is the constant temperature maintained inside the building, and is the outside air temperature at time t, which changes according to the time of the day and the season. The outside air temperature and the weather data also depend on the geographic location of the building. Typical U-values of a glass window are listed in Table 1.
When solar radiation enters a building through a window, part of this energy is reflected by the window, while another part is transmitted to the inside of a building and converted into thermal energy that warms up the interior of the building, as illustrated in Figure 2. A small part is absorbed by the window which, in turn, is either reflected again to the outside or transmitted to the inside. This is represented by the solar heat gain coefficient (SHGC), which specifies the percentage of solar radiation that is transmitted through the window; typical values are listed in Table 2.
3.1. Three-Dimensional Modeling
In order to study the effects of windows on energy consumption, the software Energy3D (version 8.7.4) was utilized. Energy3D [23] is three-dimensional numerical simulation software originally developed to model the thermal performance of buildings, utilizing solar renewable energy if desired. The energy performance of any building at any location around the world can be obtained using the software, based on the weather data of that location and the computational thermal characteristics of the building elements, such as its walls, roofs, windows, and doors. The software allows users to calculate daily and yearly energy consumption due to heating and cooling of a building. The software can simulate the Sun’s movement through the Heliodon Simulator, as seen in Figure 3a, based on the selected geographic location. Energy3D uses a modified model for calculating solar radiation, which has been recommended by the American Society of Heating, Refrigerating, and Air-Conditioning Engineers (ASHRAE) [21]. According to this model, the total radiation on a surface is the sum of three types of radiation: direct, diffused, and reflected. It is calculated as follows:
where is the percentage of average sunshine hours of the month at the location, is direct normal solar intensity, is the incident angle of the direct sunlight relative to the surface normal (θ = 0° at noon, θ = 90° at sunrise, and θ = −90° at sunset), is a diffuse radiation factor (a month-dependent parameter defined by ASHRAE), is the albedo of the background, and is the angle between the surface and the horizontal. The albedo is the ratio of the reflected radiation from a surface to the original solar radiation, and takes a value of zero for a perfectly black surface (meaning that the radiation energy is completely absorbed by the surface) and one for a perfectly white surface (meaning that the radiation energy is completely reflected by the surface). The albedo of the soil is in the range between 0.1 and 0.4, and it is about 0.25 for green grass. The main factor that affects the albedo of a material is its color.
The direct normal solar intensity can be calculated using the following equation:
where is the power of solar radiation per square meter on a plane outside the Earth’s atmosphere and perpendicular to the sun, and AM is air mass, which is the length of the sunlight’s path through the Earth’s atmosphere L divided by thickness of atmosphere, as illustrated in Figure 3b. The value of AM depends on the time, date, and latitude of the location where solar radiation is being measured. fluctuates between 1325 W/m2 and 1415 W/m2 throughout the year, as the Earth moves around the Sun in an elliptical orbit and the distance between the Earth and the Sun changes. An approximation for the AM factor is given by the following formula:
where z is the zenith angle (the angle between the zenith and direction of the Sun’s rays). The relationship between the radiation energy and the temperature of a body is governed by the Stefan–Boltzmann law:
where is the emissivity of the object’s material and is the Stefan–Boltzmann constant. The development of and further details for the preceding formulas can be found in [24].
The effect of one window on one room’s energy consumption was investigated for this study. A room model with plan dimensions of 5 m × 5 m and a height of 3 m was constructed, as shown in Figure 4. The walls were assumed to be made of bricks, with a U-value of 0.28 W/(m2·K). The roof was made of a 150 mm reinforced concrete slab with a U-value of 1.3 W/(m2·K). It should be noted that the wall and roof properties do not affect the results, as the window’s performance was considered here, rather than that of the whole building. The air temperature of Abu Dhabi in the UAE, as illustrated in Figure 5 [25], was used in the analysis, and is considered to be representative of hot climates. Usually, a comfortable temperature inside a building is between 20 °C and 23 °C; hence, the temperature of the thermostat inside the room was set to 21 °C as a reasonable value.
3.2. Two-Dimensional Modeling
In addition to the earlier analysis, a two-dimensional thermal conductivity analysis was carried out to study the effect of the size of an east-facing window on the increase in temperature inside a regular room in a building. This convection problem is a complex process, governed by the convective heat flux from a surface to the air using the following formula:
where is the convective heat transfer coefficient of the air.
The east-facing window was chosen as it showed the highest solar radiation energy consumption, when compared to north- and south-facing windows. The configuration is illustrated in Figure 6. The walls are 3 m in height, 0.3 m in thickness, and made of bricks, while the slab is made of 0.3 m concrete. One window is installed on one wall, with a height of 1 m, 2 m, or 3 m. Two thermometers are installed in the model: one in the middle of the room and one outside. In the trial simulations, three thermometers were used inside the room: one at the center, one at 1 m from the window, and one at 1 m from the wall far from the window. After conducting several simulations, there were no significant differences noticed between the readings of the three sensors. Therefore, it was decided to take readings from the thermometer in the center of the room. The thermometers were initially set to zero, and so they measured only the increase in temperature due to solar energy. A small part of the increase in temperature will be due to thermal conduction of the walls and the roof when the Sun’s rays impact them, or from thermal convection when air circulates inside the room. However, the larger part of the increase in temperature will be due to the direct sunlight entering the room through the window. Sunlight was simulated as light particles (photons) with appropriate solar power density. The thermal analysis was conducted for summer and winter, represented according to the solar power density and the total hours of sunshine from dawn to dusk. Table 3 and Table 4 show the different thermal properties and parameters used in the simulation.
4. Results and Discussion
4.1. Three-Dimensional Analysis
First, the energy demand for a reference room without a window was calculated, as illustrated in Figure 7, indicating a total of 2512 kWh of energy per year. This value was deducted from the energy consumption of the rooms with windows, in order to determine the energy consumption due to the window only. Slight heating energy is only needed in January and February in the UAE, while cooling energy is required all year round for air conditioning. The maximum cooling energy reached around 11.5 kWh per day in August. It should be noted that the use of the unit kWh/m2 is better when comparing whole buildings, as the energy consumption is normalized to their plan areas. However, as only the energy consumption due to one window was obtained, there is no point in dividing it by the building’s plan area, which would give misleading results. Therefore, energy was obtained in units of kWh.
Next, one window was installed on one wall of the room with a different window-to-wall ratio (WWR), in order to calculate the yearly energy demand due to a single window. The energy calculations were obtained for single- and double-glazed glass windows. For single-glazed windows, the U-value was set as 5 W/(m2·K) and the solar heat gain coefficient was 0.66. For double-glazed windows, the U-value was set as 2.5 W/(m2·K) and the solar heat gain coefficient was 0.59. The results are illustrated in Figure 8. The results for the east-facing window were similar to those obtained for the west-facing window, so only the results for the latter are shown. It is clear that the energy consumption is linearly related to the WWR: the higher the WWR, the higher the energy consumption. The west- and south-facing windows showed almost identical energy consumption, but this was just a coincidence. If the analysis was conducted in other places around the world, the results would not necessarily coincide. This is shown below, when the energy consumption is divided into solar radiation and heat gain. The north-facing window showed significantly lower (36% less) energy consumption, compared to windows facing other directions. This difference became more significant for a larger WWR. Therefore, it is recommended to make the north-facing window larger when large windows are desired, compared to windows facing in other directions. The use of double-glazed windows decreased energy consumption significantly. For example, considering a west-facing window, the energy consumption decreased from 17,630 kWh for a single-glazed window to 13,070 kWh for a double-glazed window with 10% WWR, indicating an energy saving of about 26%.
The separate effects of solar radiation and heat gain crossing a window with 10% WWR for different window orientations and glazing options are illustrated in Figure 9. The results for single-glazed windows show that the daily energy consumption due to heat gain was similar for all orientations of the window, ranging from 0 in winter to 2.6 kWh in the summer. However, the daily energy consumption due to solar radiation depends significantly on the window orientation. For south-facing windows, the consumption due to solar radiation was higher at the beginning and end of the year (reaching 5.5 kWh), and lower in the middle of the year (around 1.9 kWh). This situation was reversed for the north-facing window, and was higher in the middle of the year (summer season; 3 kWh), and lower at the beginning and end of the year (winter season; 1.2 kWh). For the east- and west-facing windows, the daily energy consumption ranged from 2.6 kWh to 4.2 kWh. If a hot summer month like August is considered, the average daily energy consumption is about 6.5 kWh for east and west windows, while is it about 4.6 kWh for a north-facing window and about 4.8 kWh for a south-facing window. Therefore, the east- and west-facing windows consume about 41% and 35% more cooling energy in August, compared to north and south windows, respectively. It is clear that the effects of summer and winter on solar radiation energy consumption are more obvious with the south-facing window, compared to the north-, east-, and west-facing windows. Although it has previously been shown that the total yearly consumption of cooling energy for a south-facing window was similar to that of east- and west-facing windows, the separate thermal analysis showed their different performances regarding the solar radiation cooling energy requirement. The use of window glass tinting or coloring to reduce solar radiation inside the room is highly recommended, especially for east- and west-facing windows, which presented the highest solar radiation energy consumption during the summer season. This is shown in Figure 10, where the performance of clear single-glazed east- or west-facing windows is compared with that of a green-tinted single-glazed window. The results demonstrate that green tinting, with an SHGC of 0.55, reduced energy consumption due to solar radiation by about 17%; however, the tinting had almost no effect on the heat gain.
For double-glazed windows, the analysis showed similar behavior to that observed for the single-glazed windows, but with lower values for both solar radiation and heat gain energy consumption. However, the effect of double glazing was more obvious in terms of reducing energy consumption due to heat gain, compared to solar radiation. For example, the maximum daily energy consumption for a north-facing window due to solar radiation was about 2.9 kWh under single glazing and about 2.3 kWh with double glazing (which is around 21% lower), while the energy required for the heat gain reduced from a maximum of 2.7 kWh to around 1.3 kWh, respectively (which is around 52% lower). It should be noted that the heat gain energy consumption was slightly below zero in January for all orientations of the window, due to the fact that the atmospheric temperature was below the set point inside the building during this month.
4.2. Two-Dimensional Analysis
The results of the thermal analysis are illustrated in Figure 11, which shows the increase in temperature versus time from early morning to noon, for the inside and outside readings, and during summer and winter conditions. The thermal simulation was stopped at 12:00 p.m., as sunlight directly entered the room only between 6:00 a.m. and 12:00 p.m. The peak temperature increase inside the room occurred before 12:00 p.m. and, hence, there was no need to continue the simulation after that. This is clear from the inside thermostat reading, which started decreasing in temperature a couple of hours before 12:00 p.m. The simulation involved thermal convective heat transfer analysis, where air moves and exchanges thermal energy with its surroundings. As the thermostats measured temperature every 50 s, the results oscillated significantly. Different techniques can be used to obtain a better presentation of the results. One way is to average this oscillation in order to gain a better perspective on this trend. A moving average technique was applied to the results, with a period of 20 points for the inside thermostat and 50 points for the outside thermostat (as the oscillation of the outside readings was higher). The temperature started to increase at around half an hour after sunrise, which is around 7:30 a.m. in winter and 6:30 a.m. in summer. For a 1 m height window, the outside temperature remained higher than the inside temperature for about one and a half hours; then, the inside temperature matched the outside temperature for around one hour. After that, the inside temperature decreased again, as less sunlight entered the room. The rise in temperature inside the room reached about 4 °C in winter and about 7 °C to 8 °C in summer. The temperature results oscillated significantly with time, as the movement of air was considered in the convection analysis. For a 2 m high window, a similar behavior was noticed, but with the inside temperature reaching the outside temperature faster. The rise in temperature inside the room reached about 5 °C in winter and about 8 °C to 9 °C in summer and lasted for a longer time, when compared to the 1 m high window. When the window height was 3 m, the temperature inside the room became significantly higher than the outside temperature for a duration of about two hours. The temperature increase reached about 6 °C in winter and about 10 °C in summer. This indicates a clear greenhouse effect, where heat becomes trapped inside the room for some time, and only dissipates when the Sun rises high enough in the sky for less sunlight to enter the room. Therefore, it is recommended to limit the window height to two-thirds of the wall height, which can save about one-third of the yearly cooling energy, according to the data in Figure 8. Case studies of 1.5 m and 2.5 m window heights were analyzed, but not presented here, as it was considered that the 1 m, 2 m, and 3 m cases represented the research findings suitably.
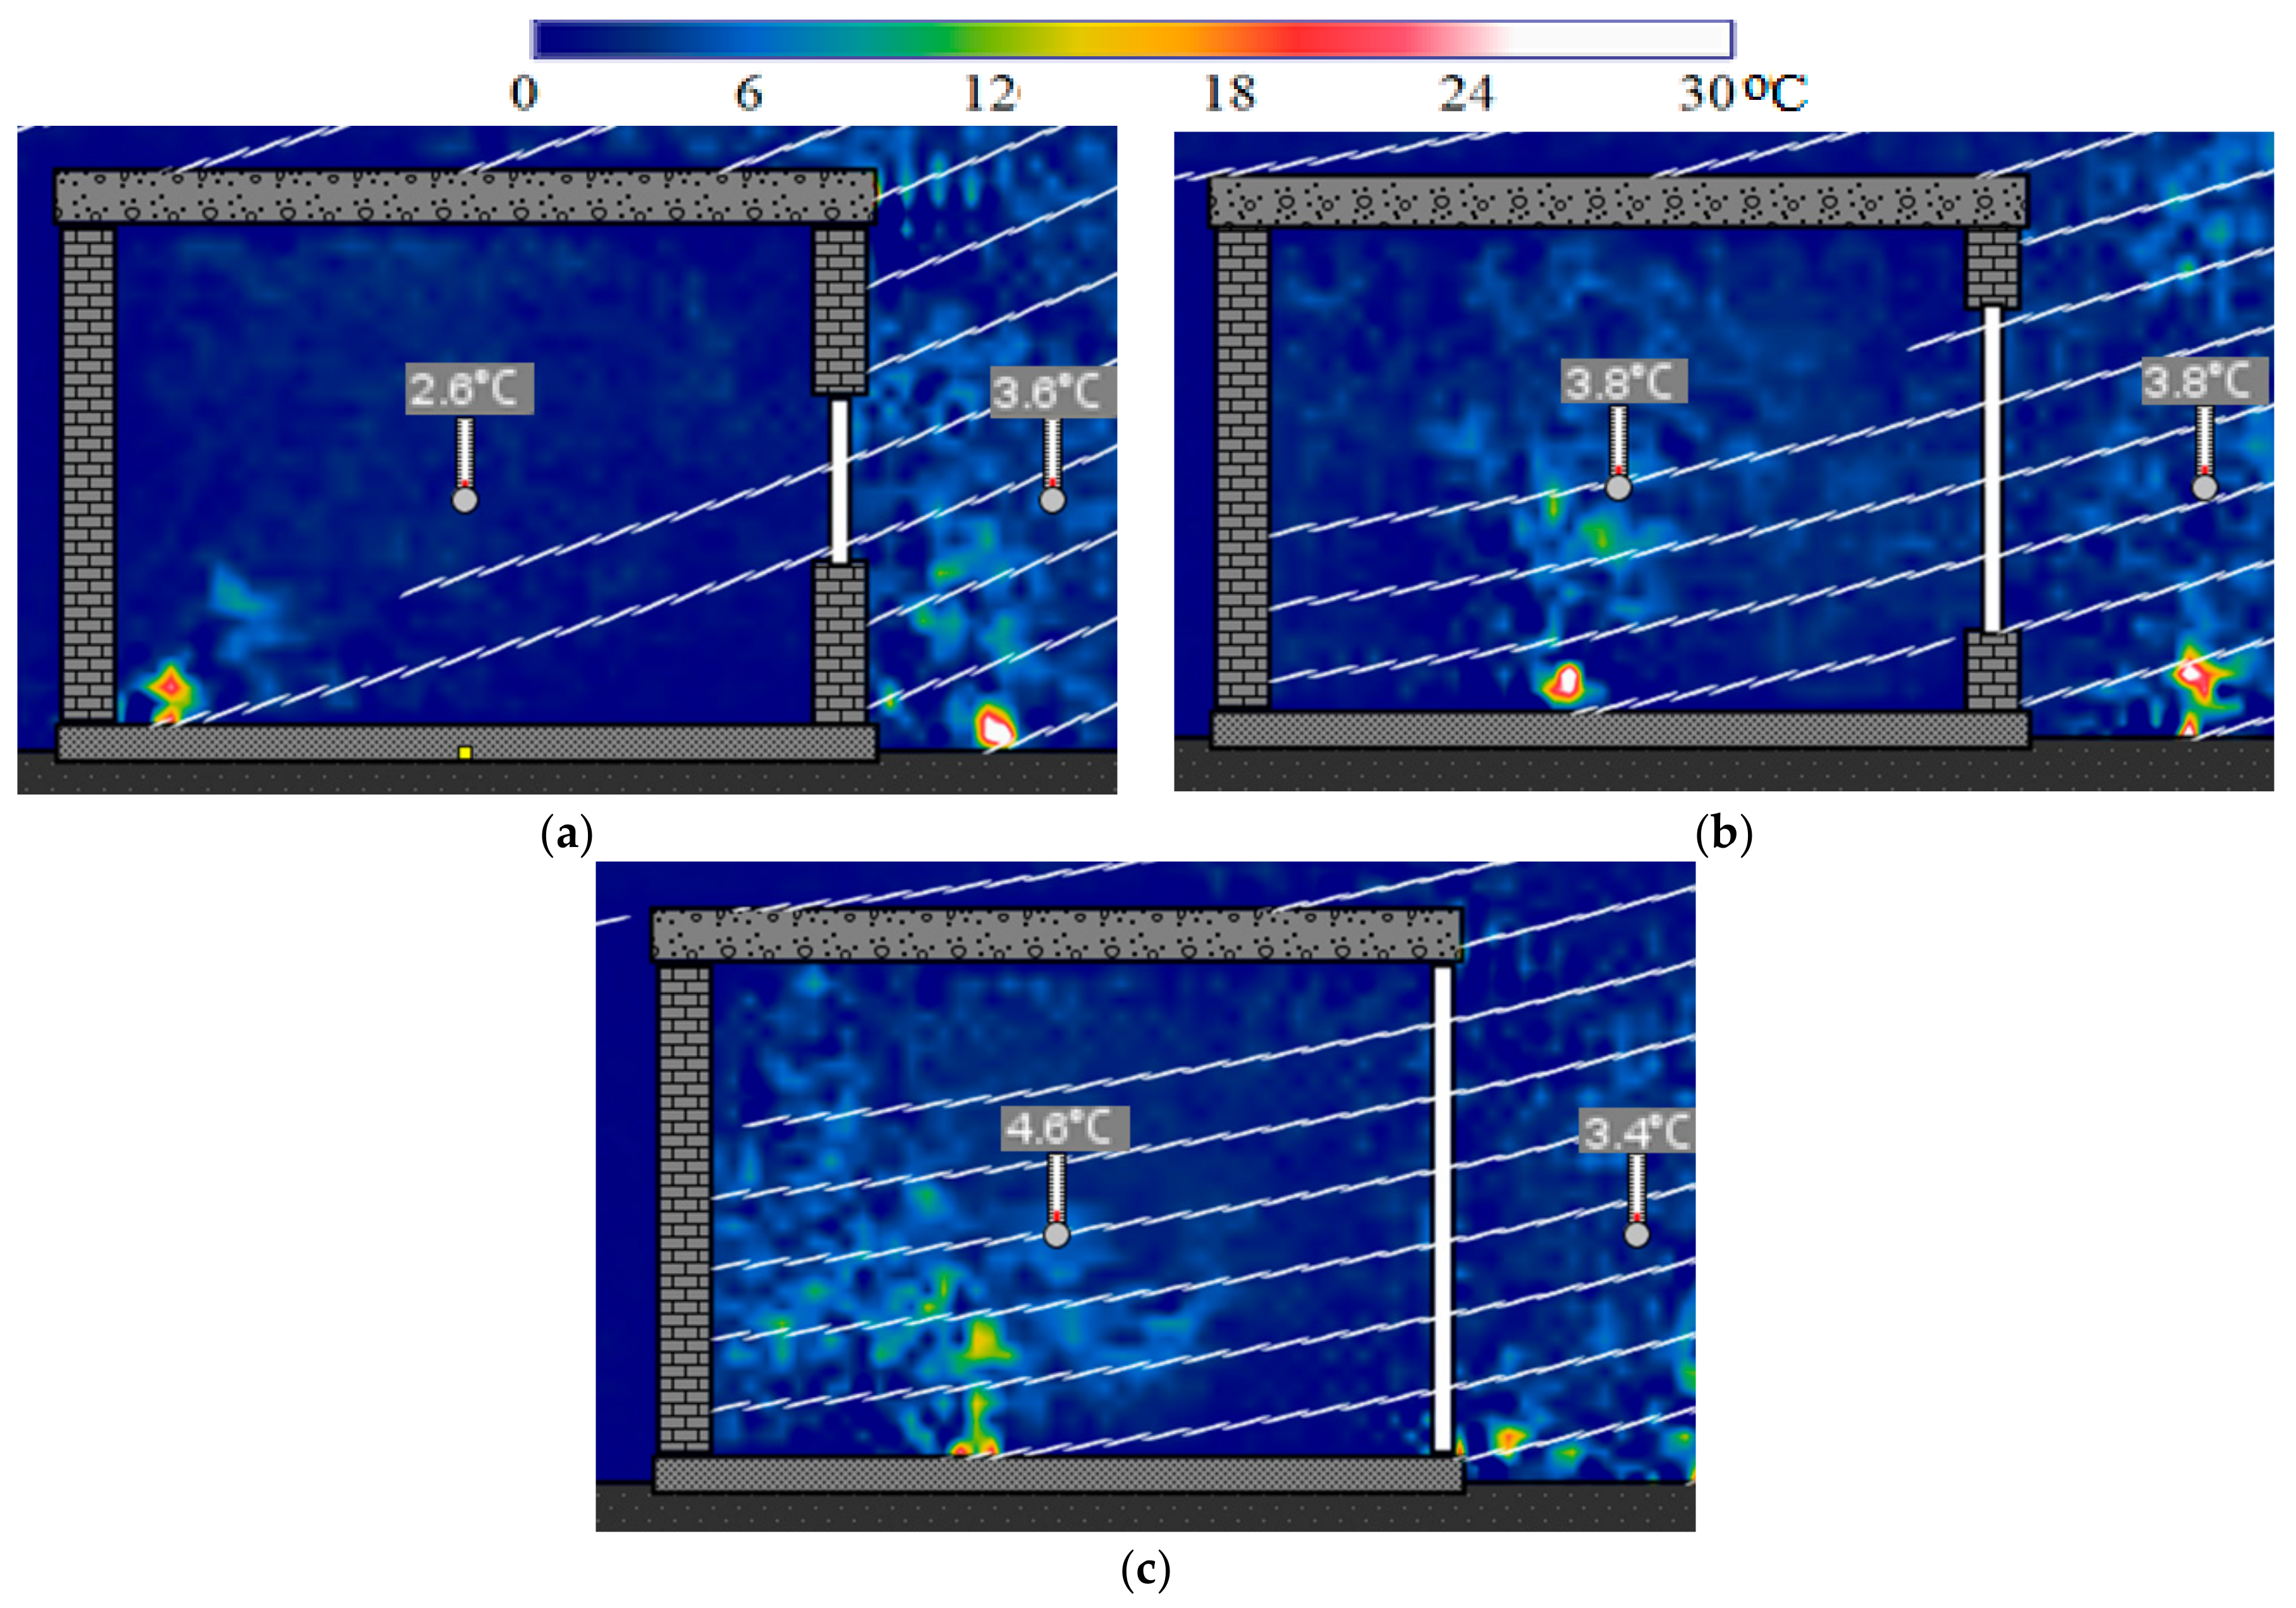
The temperature contours under winter conditions with different window heights are illustrated in Figure 12. The figure shows the influence of sunlight entering the room between 8 a.m. and 9 a.m. When the sunlight hits a solid surface, it releases concentrated thermal energy into the air. The convection of the air (considered as a fluid) dissipates the thermal energy around the room, leading to an oscillation of the thermostat readings. The larger the window size, the larger the amount of sunlight that enters the room. The temperature contours show elevated temperatures (around 20 °C) at the times when the sunlight hits a solid surface. These might be not realistic values, potentially representing singularities in the numerical calculations. Values and readings should be taken with caution from these points.
5. Limitations
For the current study, the performance of a single window in different situations was simulated. However, several limitations should be considered, listed as follows:
- The results can be affected by the surroundings of the building, such as trees, adjacent buildings, and reflective surfaces.
- While this study considered a single window, having multiple windows could lead to interaction effects.
- The convective heat transfer analysis results presented high oscillations. Different techniques should be investigated to increase the accuracy of the results.
The author encourages researchers to investigate these limitations and factors in future studies.
6. Conclusions
This study investigated the effects of window size and direction on the energy consumption and thermal behavior of a room in a typical building in the United Arab Emirates. Based on the results, the following conclusions can be listed:
- The relationship between window size (in terms of the WWR) and window-related energy consumption was found to be linear.
- North-facing windows led to significantly lower energy consumption, compared with those facing the other three directions, in the United Arab Emirates.
- The use of double-glazed windows can reduce energy consumption due to a heat gain of about 50%. Hence, it is recommended to use double-glazed windows in all directions.
- The use of window glass tinting to reduce solar radiation inside the room is highly recommended, especially for east- and west-facing windows, which presented the highest solar radiation energy consumption during the summer season. The reduction in solar radiation was about 17%.
- The use of a window with a height equal to that of the wall can cause a clear greenhouse effect, where the temperature inside the room becomes significantly higher than that outside. Hence, it is recommended to limit the window height to two-thirds of the wall’s height, which can save about one-third of the cooling energy.
- The results and conclusions of this study can be added to green building codes and standards, in order to improve the efficiency and sustainability of buildings in hot climates such as that considered in this study.
Funding
This research was funded by Liwa college, grant number IRG-ENG-001-2023. The APC was funded by Liwa college, grant number IRG-ENG-001-2023.
Data Availability Statement
The data presented in this study are available on request from the corresponding author.
Conflicts of Interest
The author declares no conflicts of interest.
References
- Available online: https://www.worldweatheronline.com/abu-dhabi-weather-averages/abu-dhabi/ae.aspx (accessed on 15 January 2024).
- Available online: https://ourworldindata.org/energy/country/united-arab-emirates (accessed on 15 January 2024).
- Abdoli Naser, S.; Haghparast, F.; Singery, M.; Sattari Sarbangholi, H. Optimization of Thermal Performance of Windows in Intermediate Housing in Cold and Dry Climate of Tabriz. Iran. J. Energy Environ. 2021, 12, 327–336. [Google Scholar] [CrossRef]
- Albatayneh, A.; Tayara, T.; Jaradat, M.; Al-Omary, M.; Hindiyeh, M.; Alterman, D.; Ishbeytah, M. Optimum Building Design Variables in a Warm Saharan Mediterranean Climate Zone. Int. J. Photoenergy 2021, 2021, 6672260. [Google Scholar] [CrossRef]
- Alhagla, K.; Mansour, A.; Elbassuoni, R. Optimizing Windows for Enhancing Daylighting Performance and Energy Saving. Alex. Eng. J. 2019, 58, 283–290. [Google Scholar] [CrossRef]
- Alwetaishi, M.; Benjeddou, O. Impact of Window to Wall Ratio on Energy Loads in Hot Regions: A Study of Building Energy Performance. Energies 2021, 14, 1080. [Google Scholar] [CrossRef]
- Badeche, M.; Bouchahm, Y. Design Optimization Criteria for Windows Providing Low Energy Demand in Office Buildings in Algeria. Environ. Sustain. Indic. 2020, 6, 100024. [Google Scholar] [CrossRef]
- Bataineh, K.; Al Rabee, A. Design Optimization of Energy Efficient Residential Buildings in Mediterranean Region. J. Sustain. Dev. Energy Water Environ. Syst. 2022, 10, 1090385. [Google Scholar] [CrossRef]
- Goia, F. Search for the Optimal Window-to-Wall Ratio in Office Buildings in Different European Climates and the Implications on Total Energy Saving Potential. Sol. Energy 2016, 132, 467–492. [Google Scholar] [CrossRef]
- Goyal, N.; Jindal, S.; Panwar, M. Analysis of Optimal Window to Wall Ratio and Orientation in Composite Climate of India. Int. J. Mech. Eng. 2022, 7, 799–807. [Google Scholar]
- Jewel Rana, M.; Hasan, R.; Sobuz, H.; Tam, V. Impact Assessment of Window to Wall Ratio on Energy Consumption of an Office Building of Subtropical Monsoon Climatic Country Bangladesh. Int. J. Constr. Manag. 2022, 22, 2528–2553. [Google Scholar] [CrossRef]
- Kharvari, F. A Field-Validated Multi-Objective Optimization of the Shape and Size of Windows Based on Daylighting Metrics in Hot-Summer Mediterranean and Dry Summer Continental Climates. J. Daylighting 2020, 7, 222–237. [Google Scholar] [CrossRef]
- Montaser Koohsari, A.; Heidari, S. Optimizing Window Size by Integrating Energy and Lighting Analyses Considering Occupants’ Visual Satisfaction. Built Environ. Proj. Asset Manag. 2021, 11, 673–686. [Google Scholar] [CrossRef]
- Liu, H.; Zhang, Z.; Ma, X.; Lu, W.; Li, D.; Kojima, S. Optimization Analysis of the Residential Window-to-Wall Ratio Based on Numerical Calculation of Energy Consumption in the Hot-Summer and Cold-Winter Zone of China. Sustainability 2021, 13, 6138. [Google Scholar] [CrossRef]
- Sorooshnia, E.; Rashidi, M.; Rahnamayiezekavat, P.; Samali, B. Optimizing Window Configuration Counterbalancing Energy Saving and Indoor Visual Comfort for Sydney Dwellings. Buildings 2022, 12, 1823. [Google Scholar] [CrossRef]
- Nouh Ma’bdeh, S.; Fawwaz Alrebei, O.; Obeidat, L.M.; Al-Radaideh, T.; Kaouri, K.; Amhamed, A.I. Quantifying Energy Reduction and Thermal Comfort for a Residential Building Ventilated with a Window-Windcatcher: A Case Study. Buildings 2023, 13, 86. [Google Scholar] [CrossRef]
- Freewan, A.A.Y. Energy-Efficient Solutions Depending on Building Forms Design with Tilted South and North Facades. Buildings 2022, 12, 753. [Google Scholar] [CrossRef]
- Freewan, A.A.; Jaradat, N.M.; Amaireh, I.A. Optimizing Shading and Thermal Performances of Vertical Green Wall on Buildings in a Hot Arid Region. Buildings 2022, 12, 216. [Google Scholar] [CrossRef]
- Özbey, M.; Turhan, C. The Importance of The Calculation of Angle Factors to Determine the Mean Radiant Temperature in Temperate Climate Zone: A University Office Building Case. Indoor Built Environ. 2022, 31, 1004–1017. [Google Scholar] [CrossRef]
- Özbey, M.; Turhan, C. A Comprehensive Comparison and Accuracy of Different Methods to Obtain Mean Radiant Temperature in Indoor Environment. Therm. Sci. Eng. Prog. 2022, 31, 101295. [Google Scholar] [CrossRef]
- ASHRAE Handbook—Fundamentals; American Society of Heating, Refrigerating, and Air Conditioning Engineers, Inc.: Atlanta, GA, USA, 1993.
- WINDOW 4.1; Lawrence Berkeley National Laboratory: Berkeley, CA, USA, 1994.
- Xie, C. Interactive Heat Transfer Simulations for Everyone. Phys. Teach. 2012, 50, 237–240. [Google Scholar] [CrossRef]
- Kreith, F. Principles of Heat Transfer, 3rd ed.; Harper and Row Publishers: New York, NY, USA, 1973. [Google Scholar]
- National Oceanic and Atmospheric Administration. Available online: https://oceanservice.noaa.gov/ (accessed on 2 January 2024).
- Islam, M.D.; Kubo, I.; Ohadi, M.; Alili, A.A. Measurement of solar energy radiation in Abu Dhabi, UAE. Appl. Energy 2009, 86, 511–515. [Google Scholar] [CrossRef]
Figure 1.
Annual average electricity generation per person in different countries [2].
Figure 1.
Annual average electricity generation per person in different countries [2].
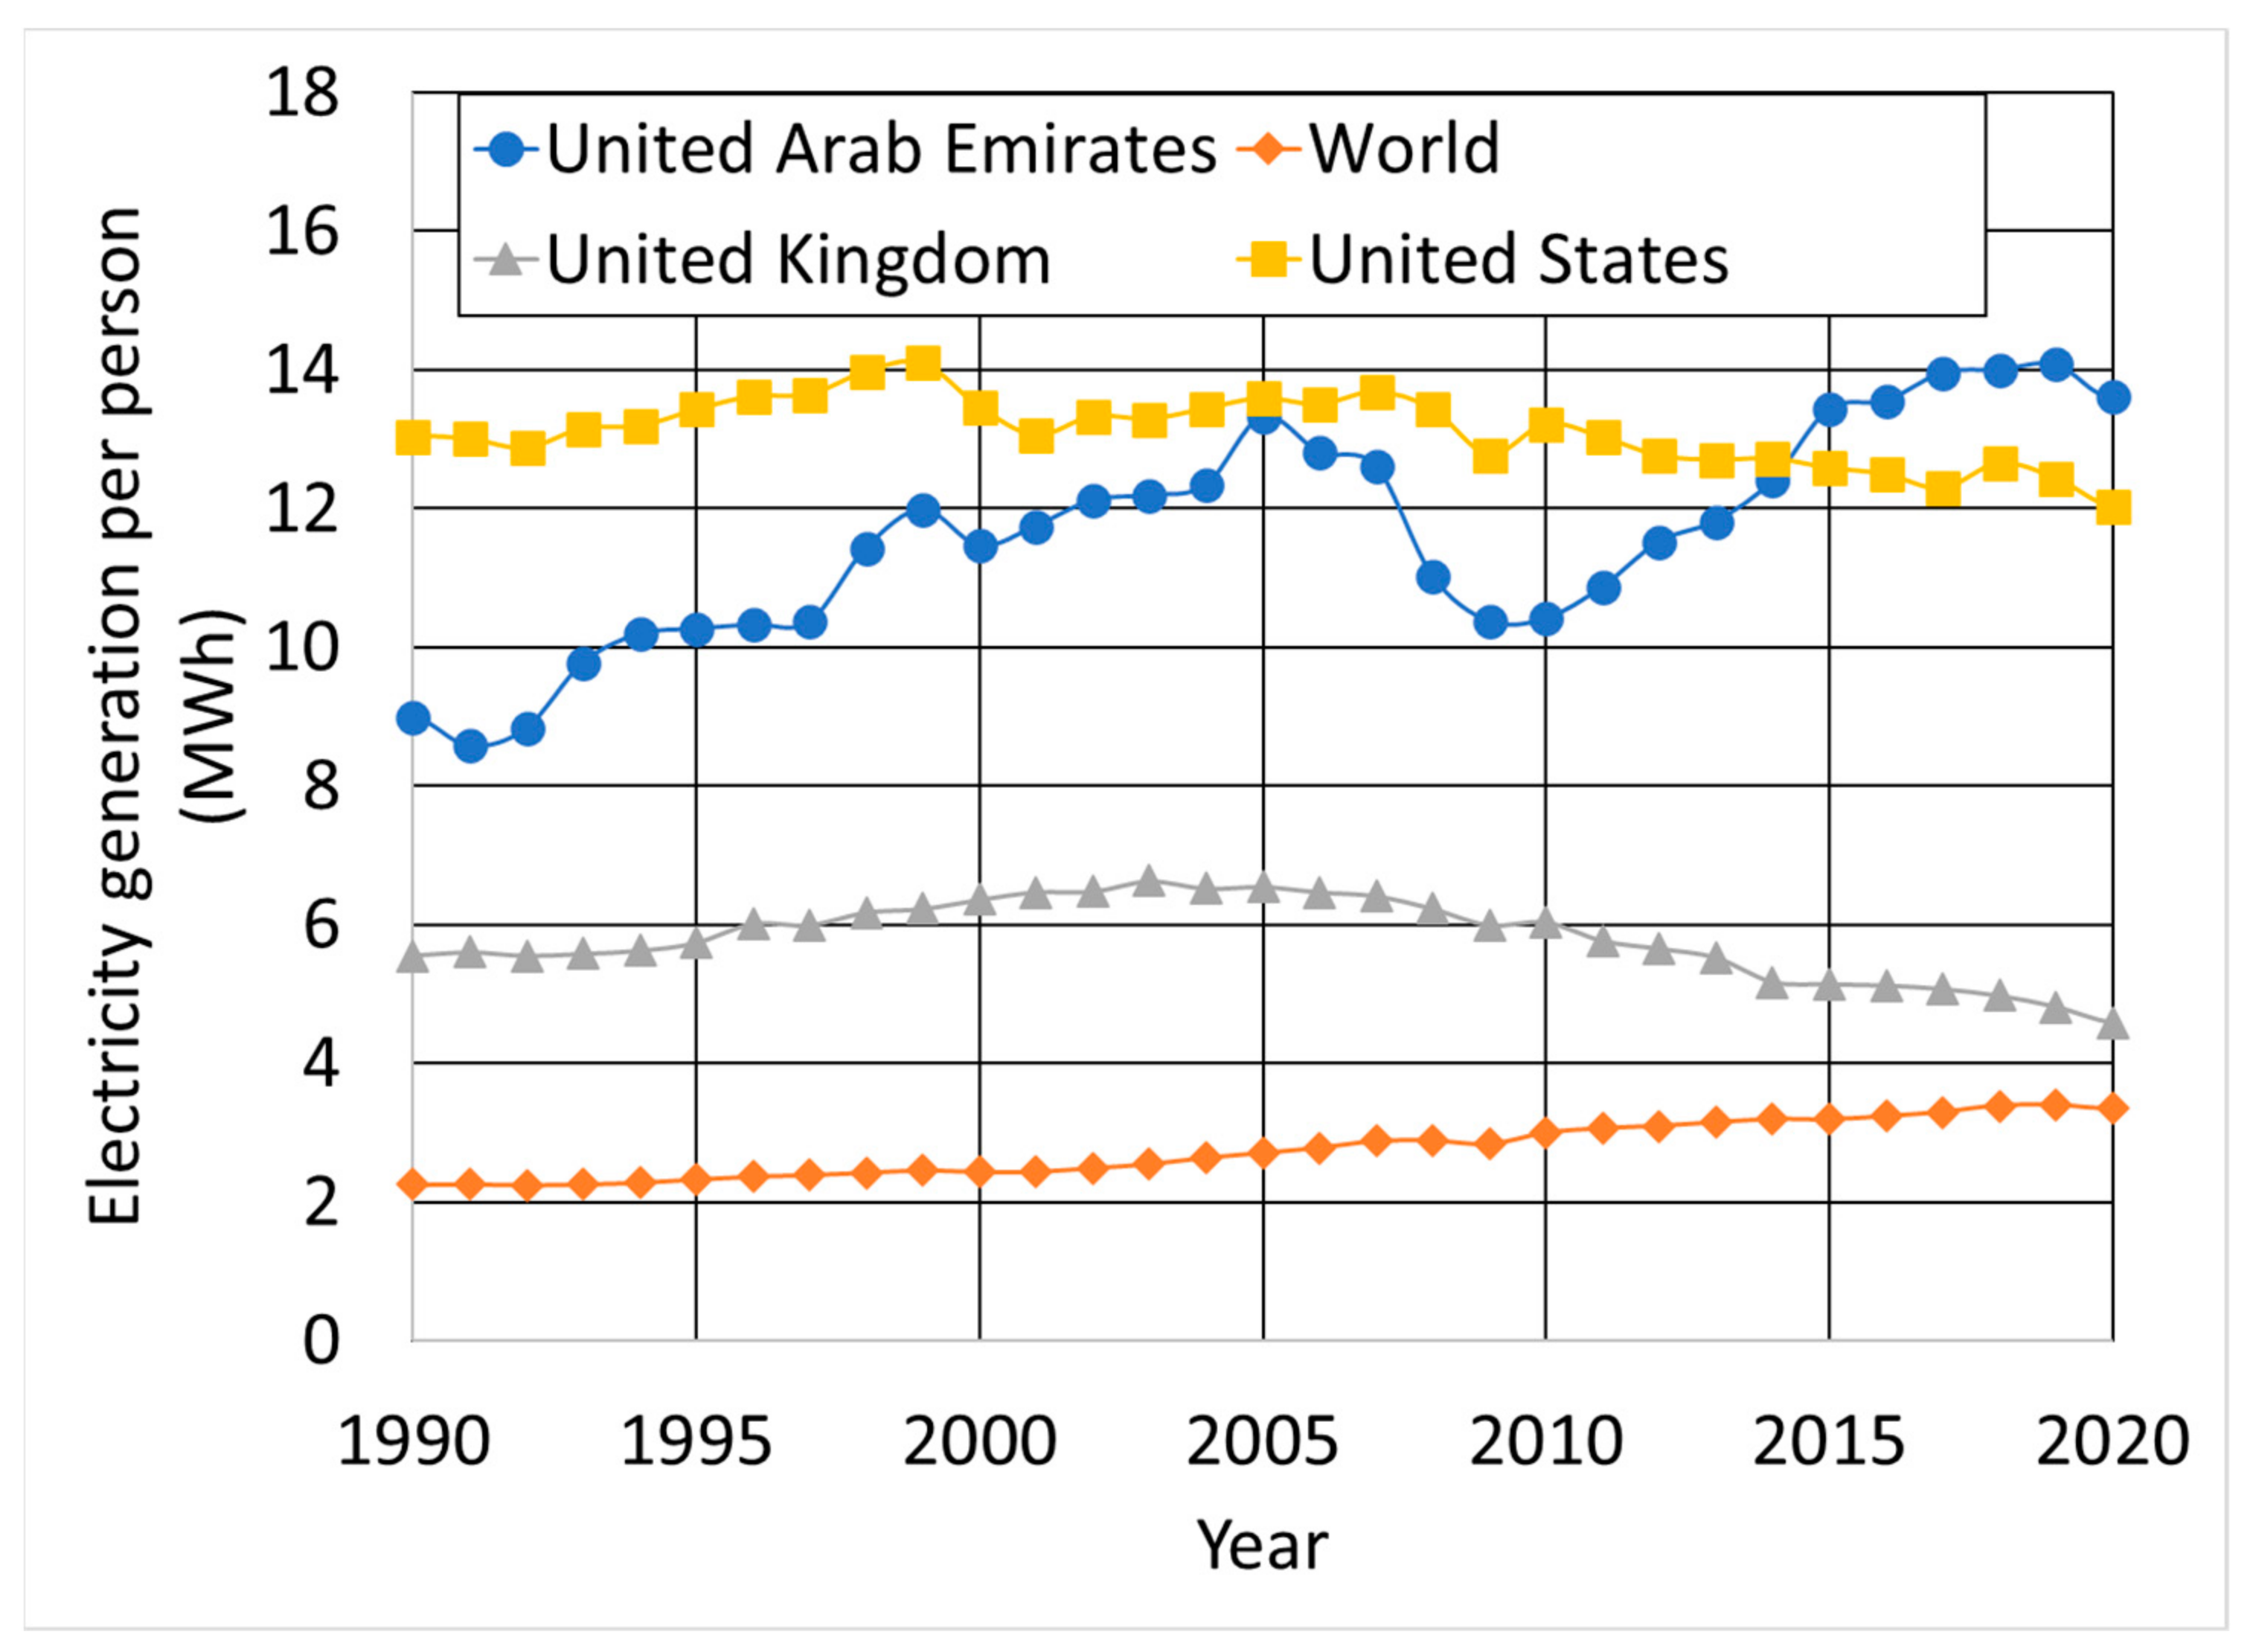
Figure 2.
Reflected and transmitted solar energy.
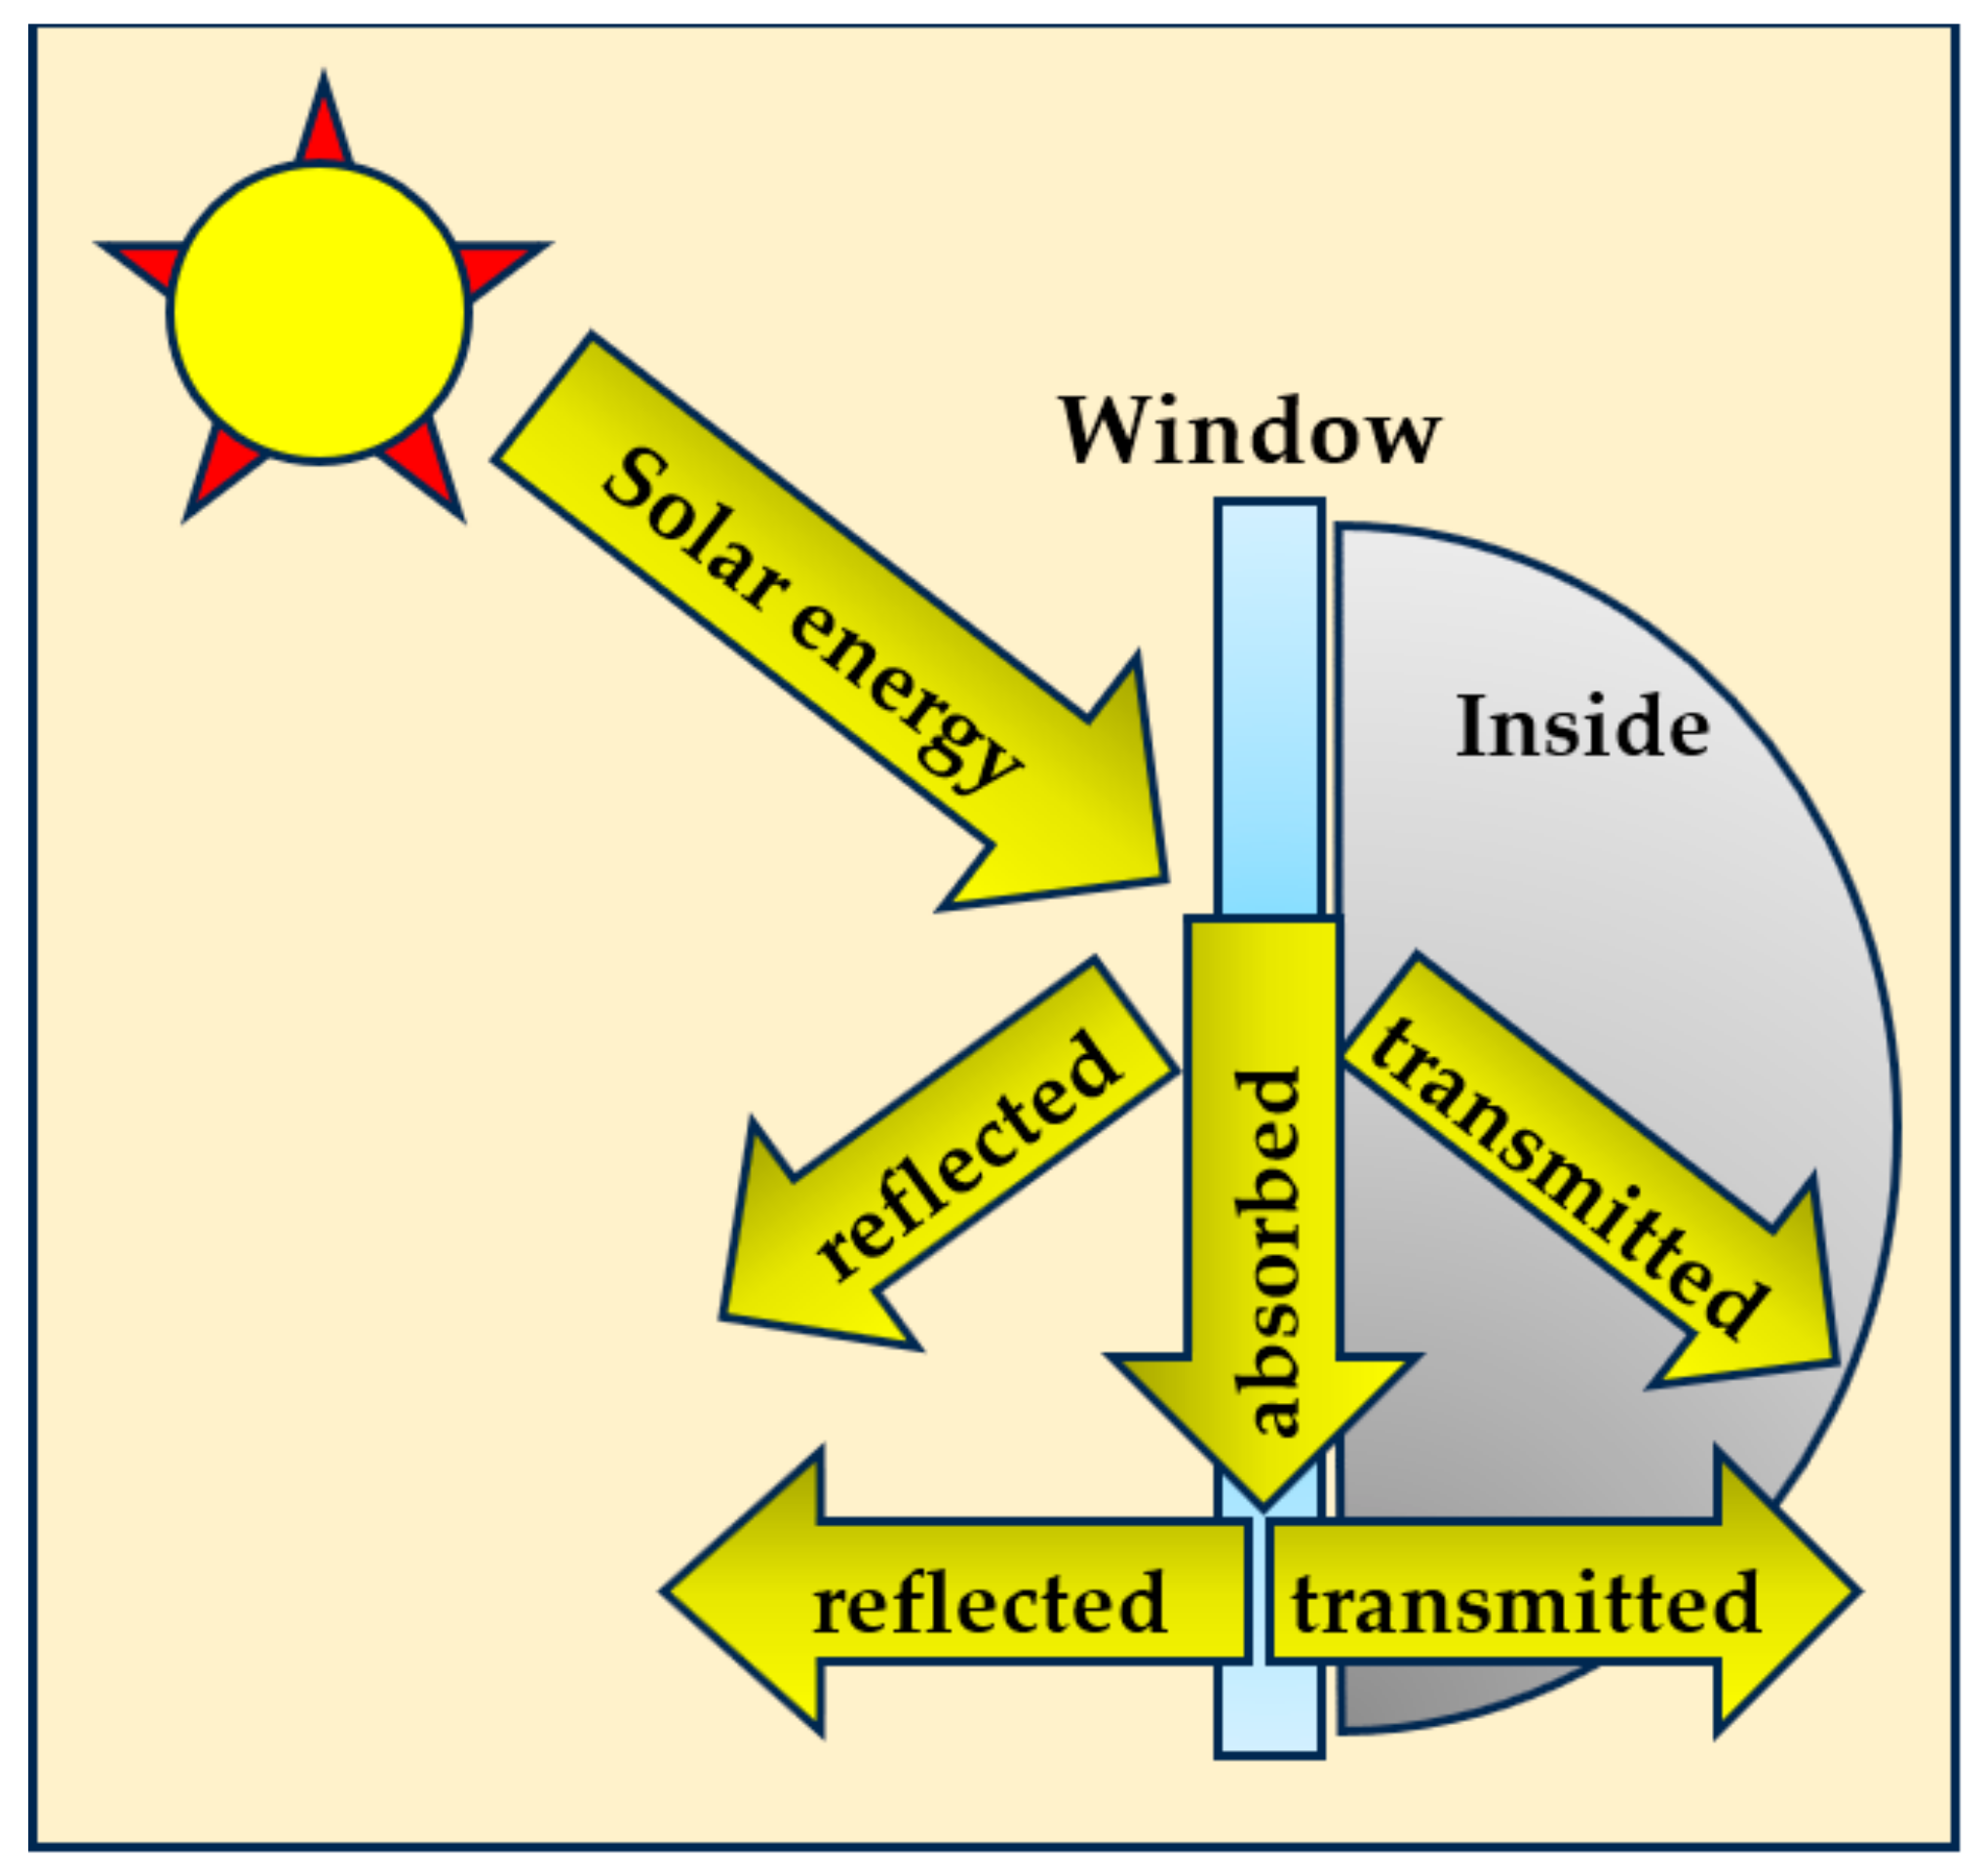
Figure 3.
(a) The Heliodon Simulator showing the Sun’s course, and (b) the path of sunlight through the atmosphere.
Figure 3.
(a) The Heliodon Simulator showing the Sun’s course, and (b) the path of sunlight through the atmosphere.
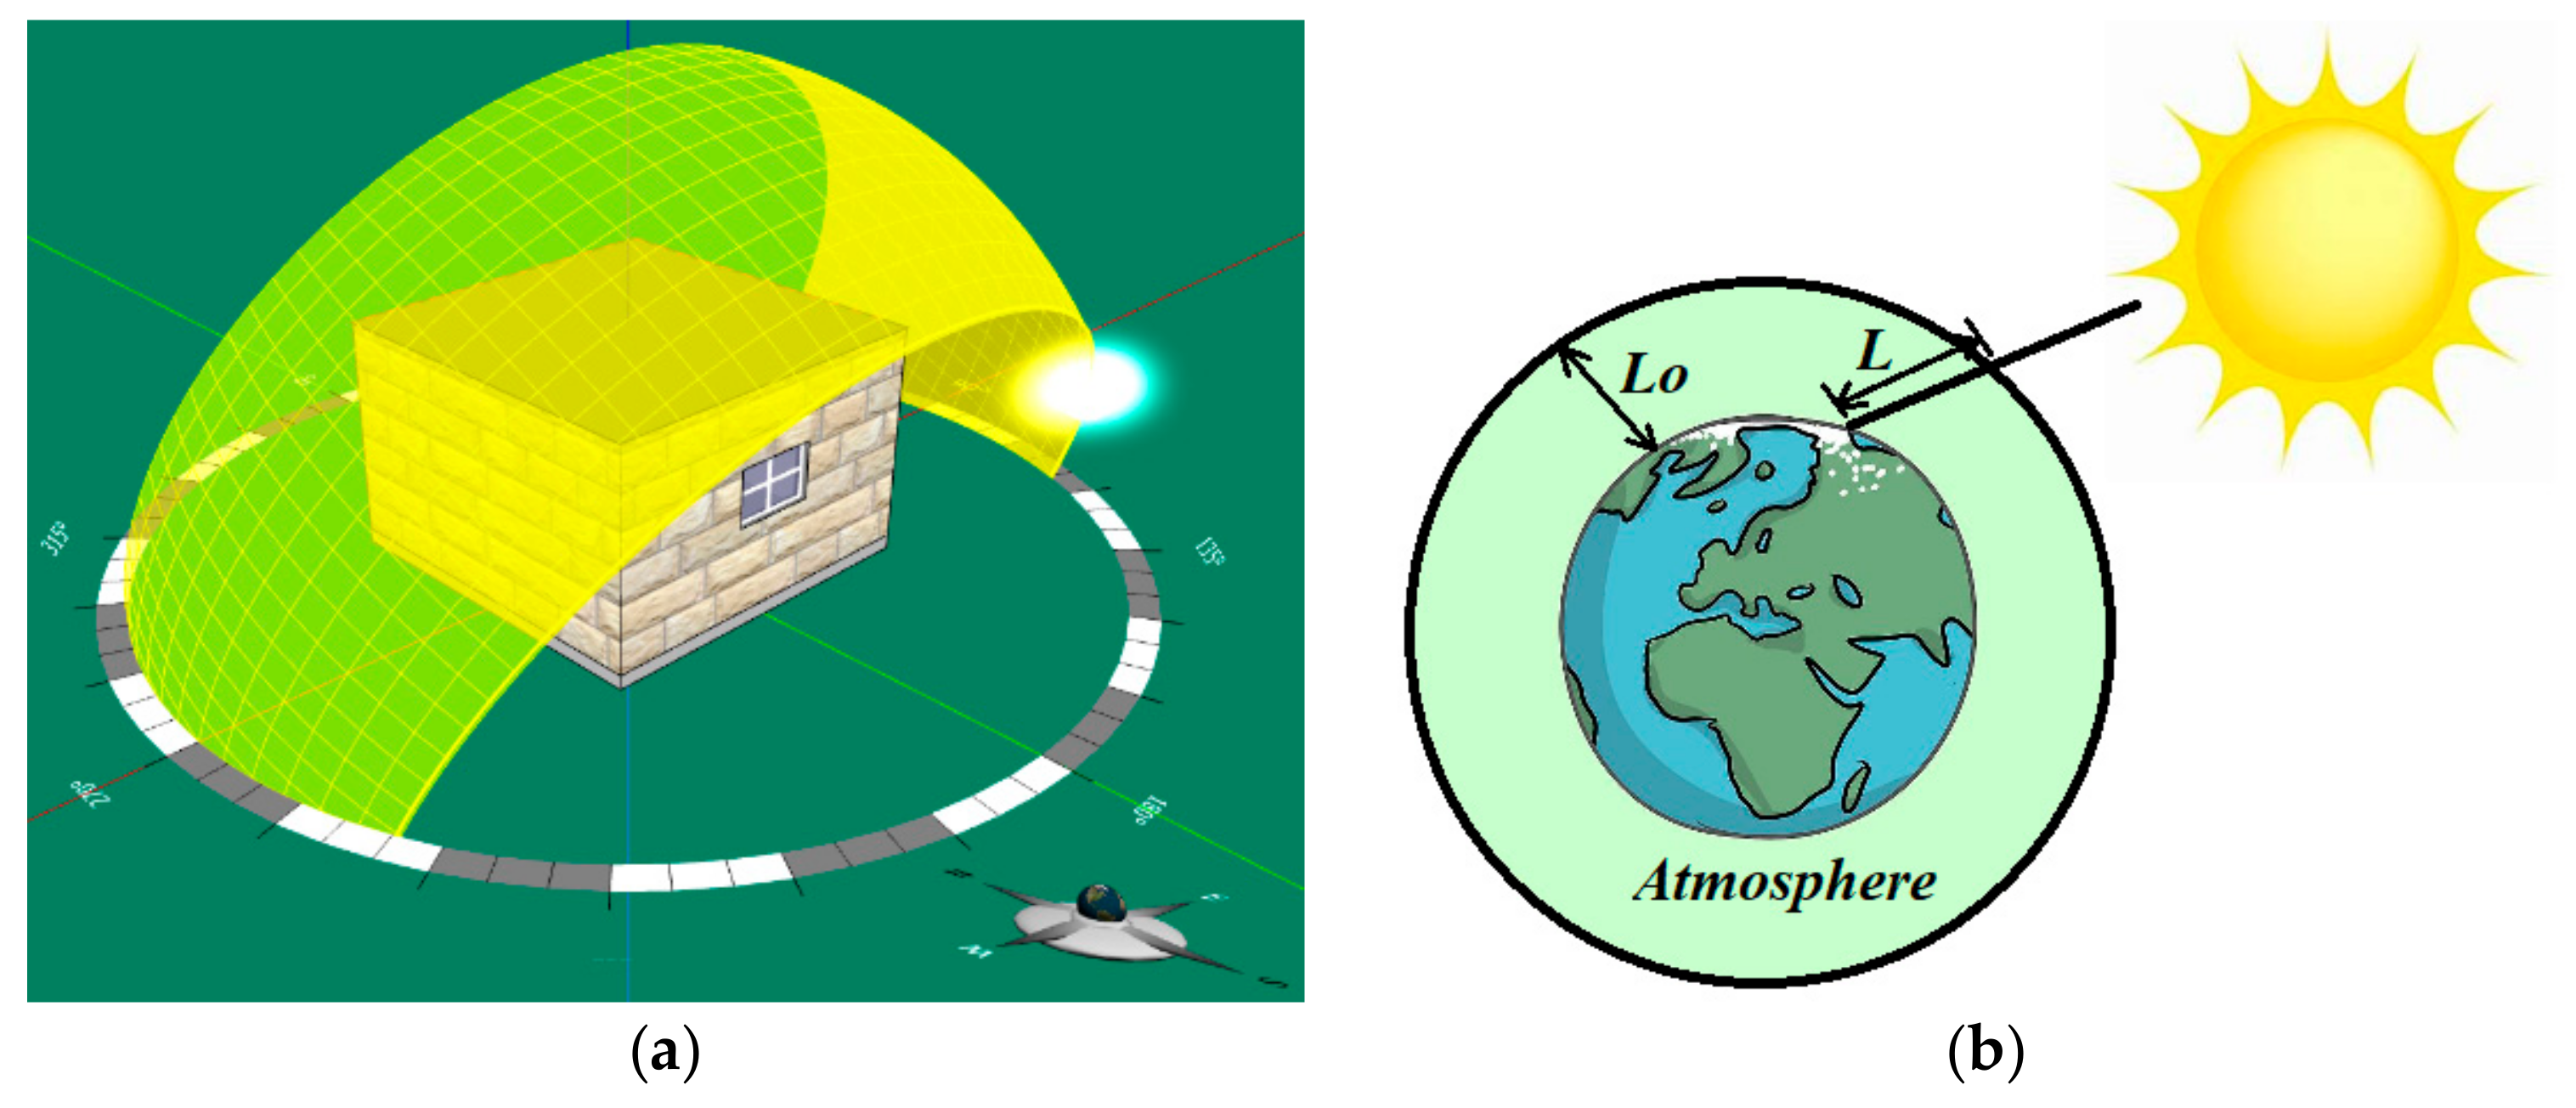
Figure 4.
Single-room model with one window.

Figure 5.
Yearly air and ground temperatures in Abu Dhabi, UAE [25].
Figure 5.
Yearly air and ground temperatures in Abu Dhabi, UAE [25].
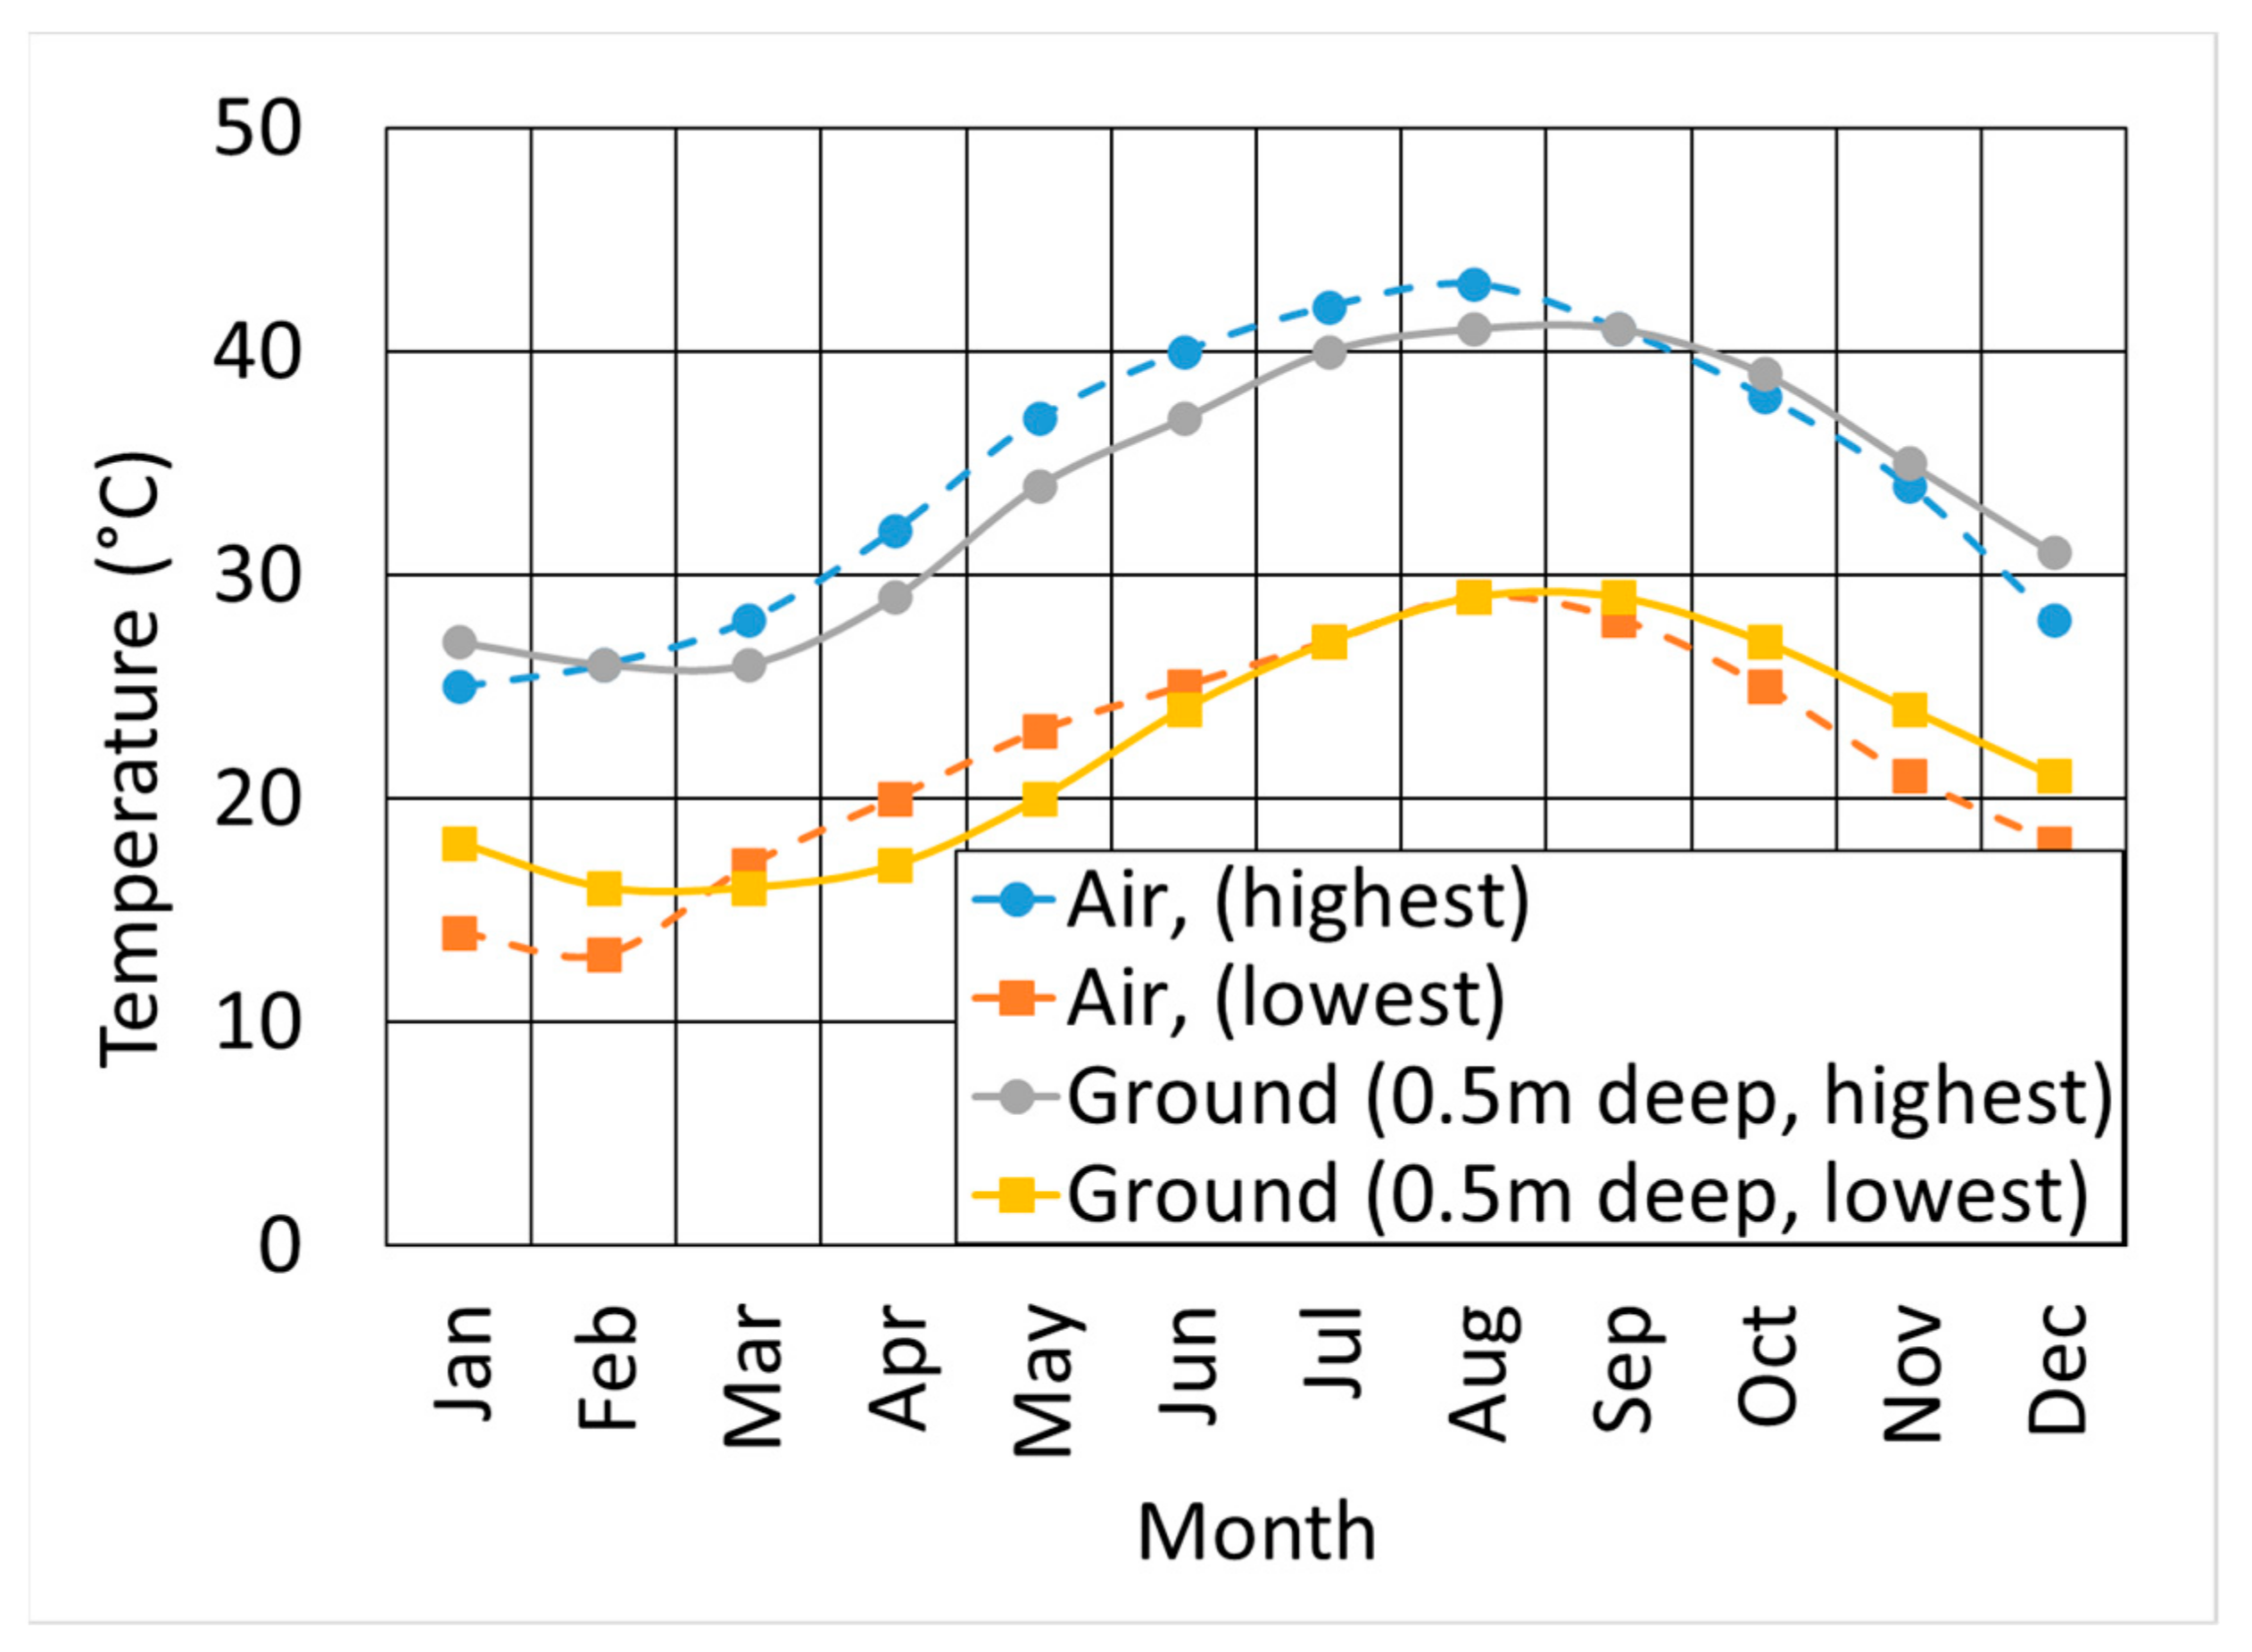
Figure 6.
Two-dimensional model of a regular room in a building.

Figure 7.
Energy demand for a reference room without windows.
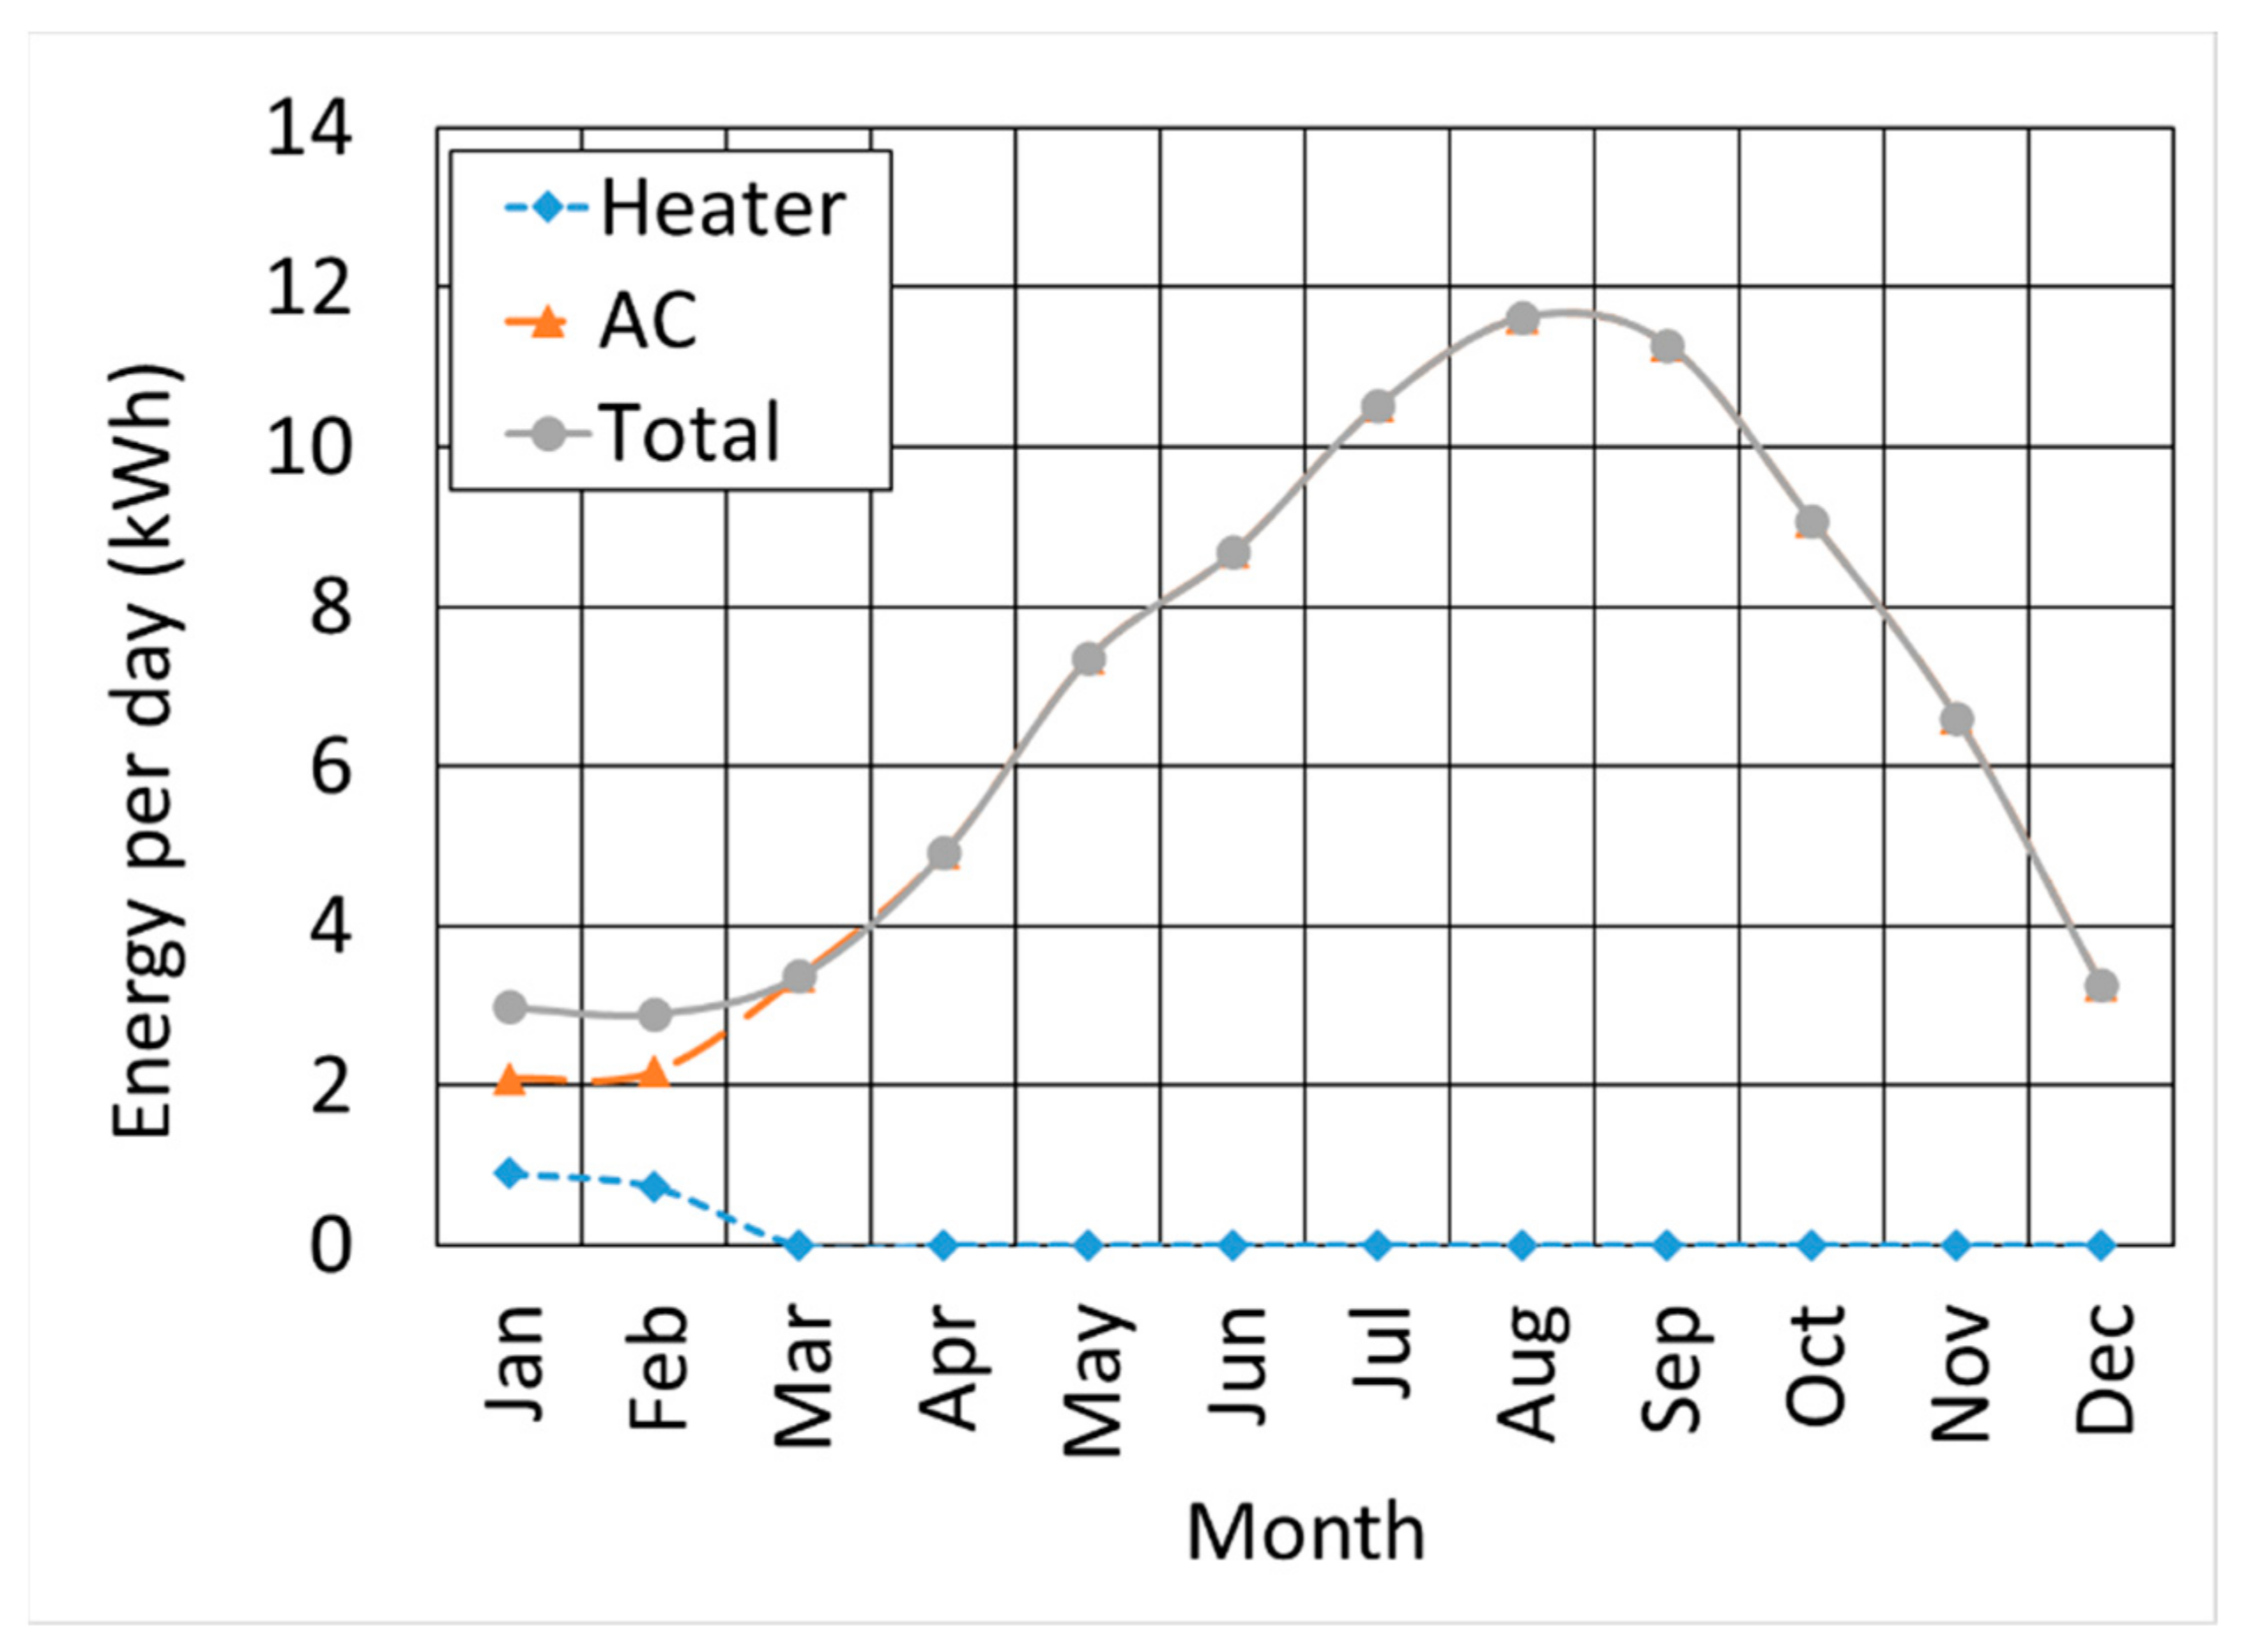
Figure 8.
Yearly energy consumption of one window for different WWRs and facing different directions: (a) single-glazed glass window and (b) double-glazed glass window.
Figure 8.
Yearly energy consumption of one window for different WWRs and facing different directions: (a) single-glazed glass window and (b) double-glazed glass window.
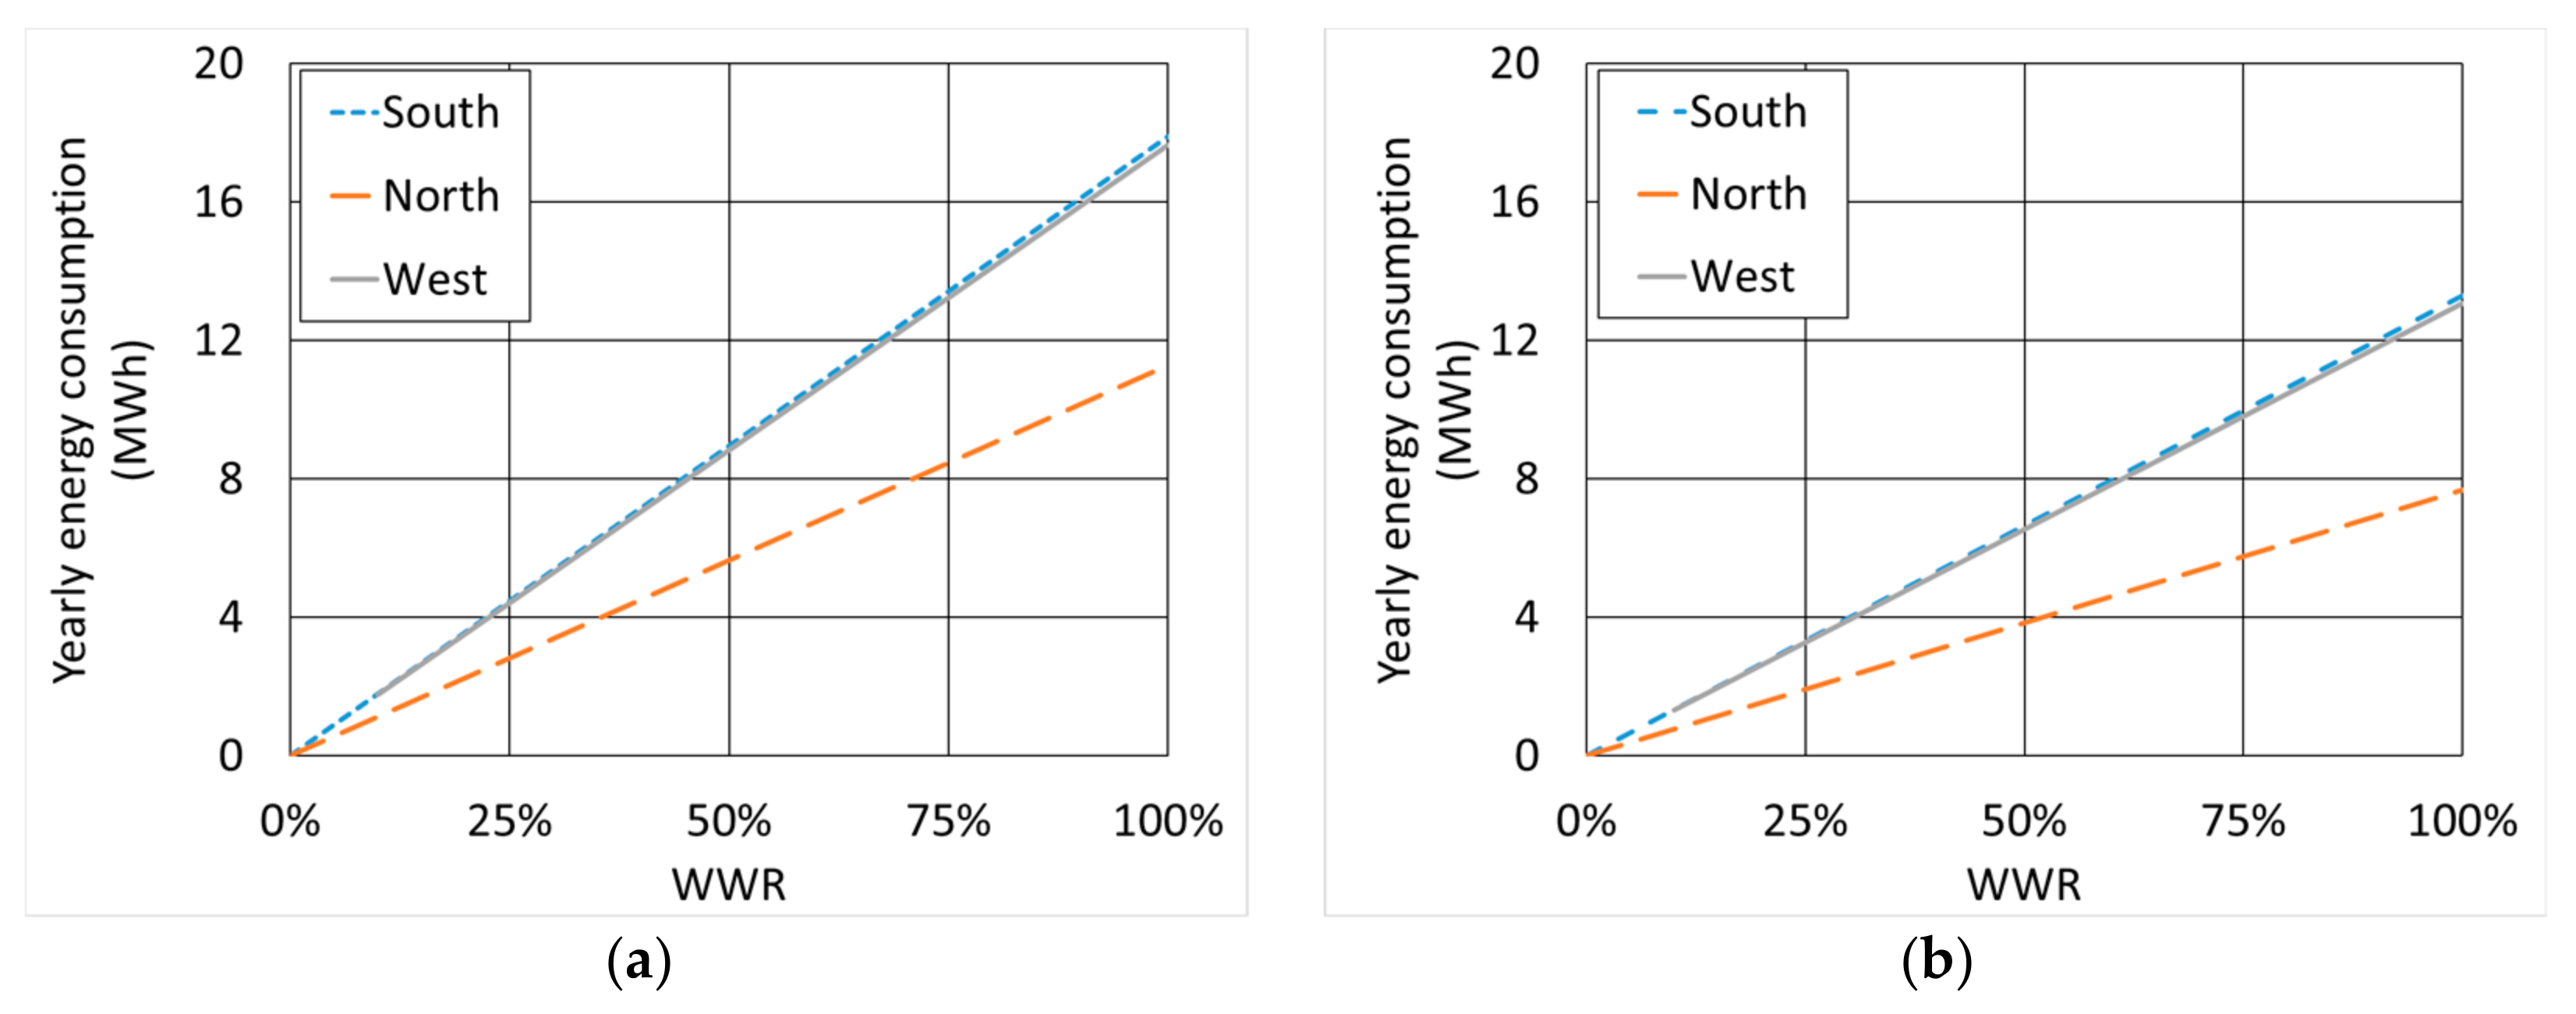
Figure 9.
Energy consumption throughout the year considering a window with 10% WWR, divided into solar radiation and heat gain, for different orientations: (a) single glazing and (b) double glazing.
Figure 9.
Energy consumption throughout the year considering a window with 10% WWR, divided into solar radiation and heat gain, for different orientations: (a) single glazing and (b) double glazing.


Figure 10.
Energy consumption throughout the year considering a window with 10% WWR, divided into solar radiation and heat gain, for clear and green-tinted single-glazed windows.
Figure 10.
Energy consumption throughout the year considering a window with 10% WWR, divided into solar radiation and heat gain, for clear and green-tinted single-glazed windows.
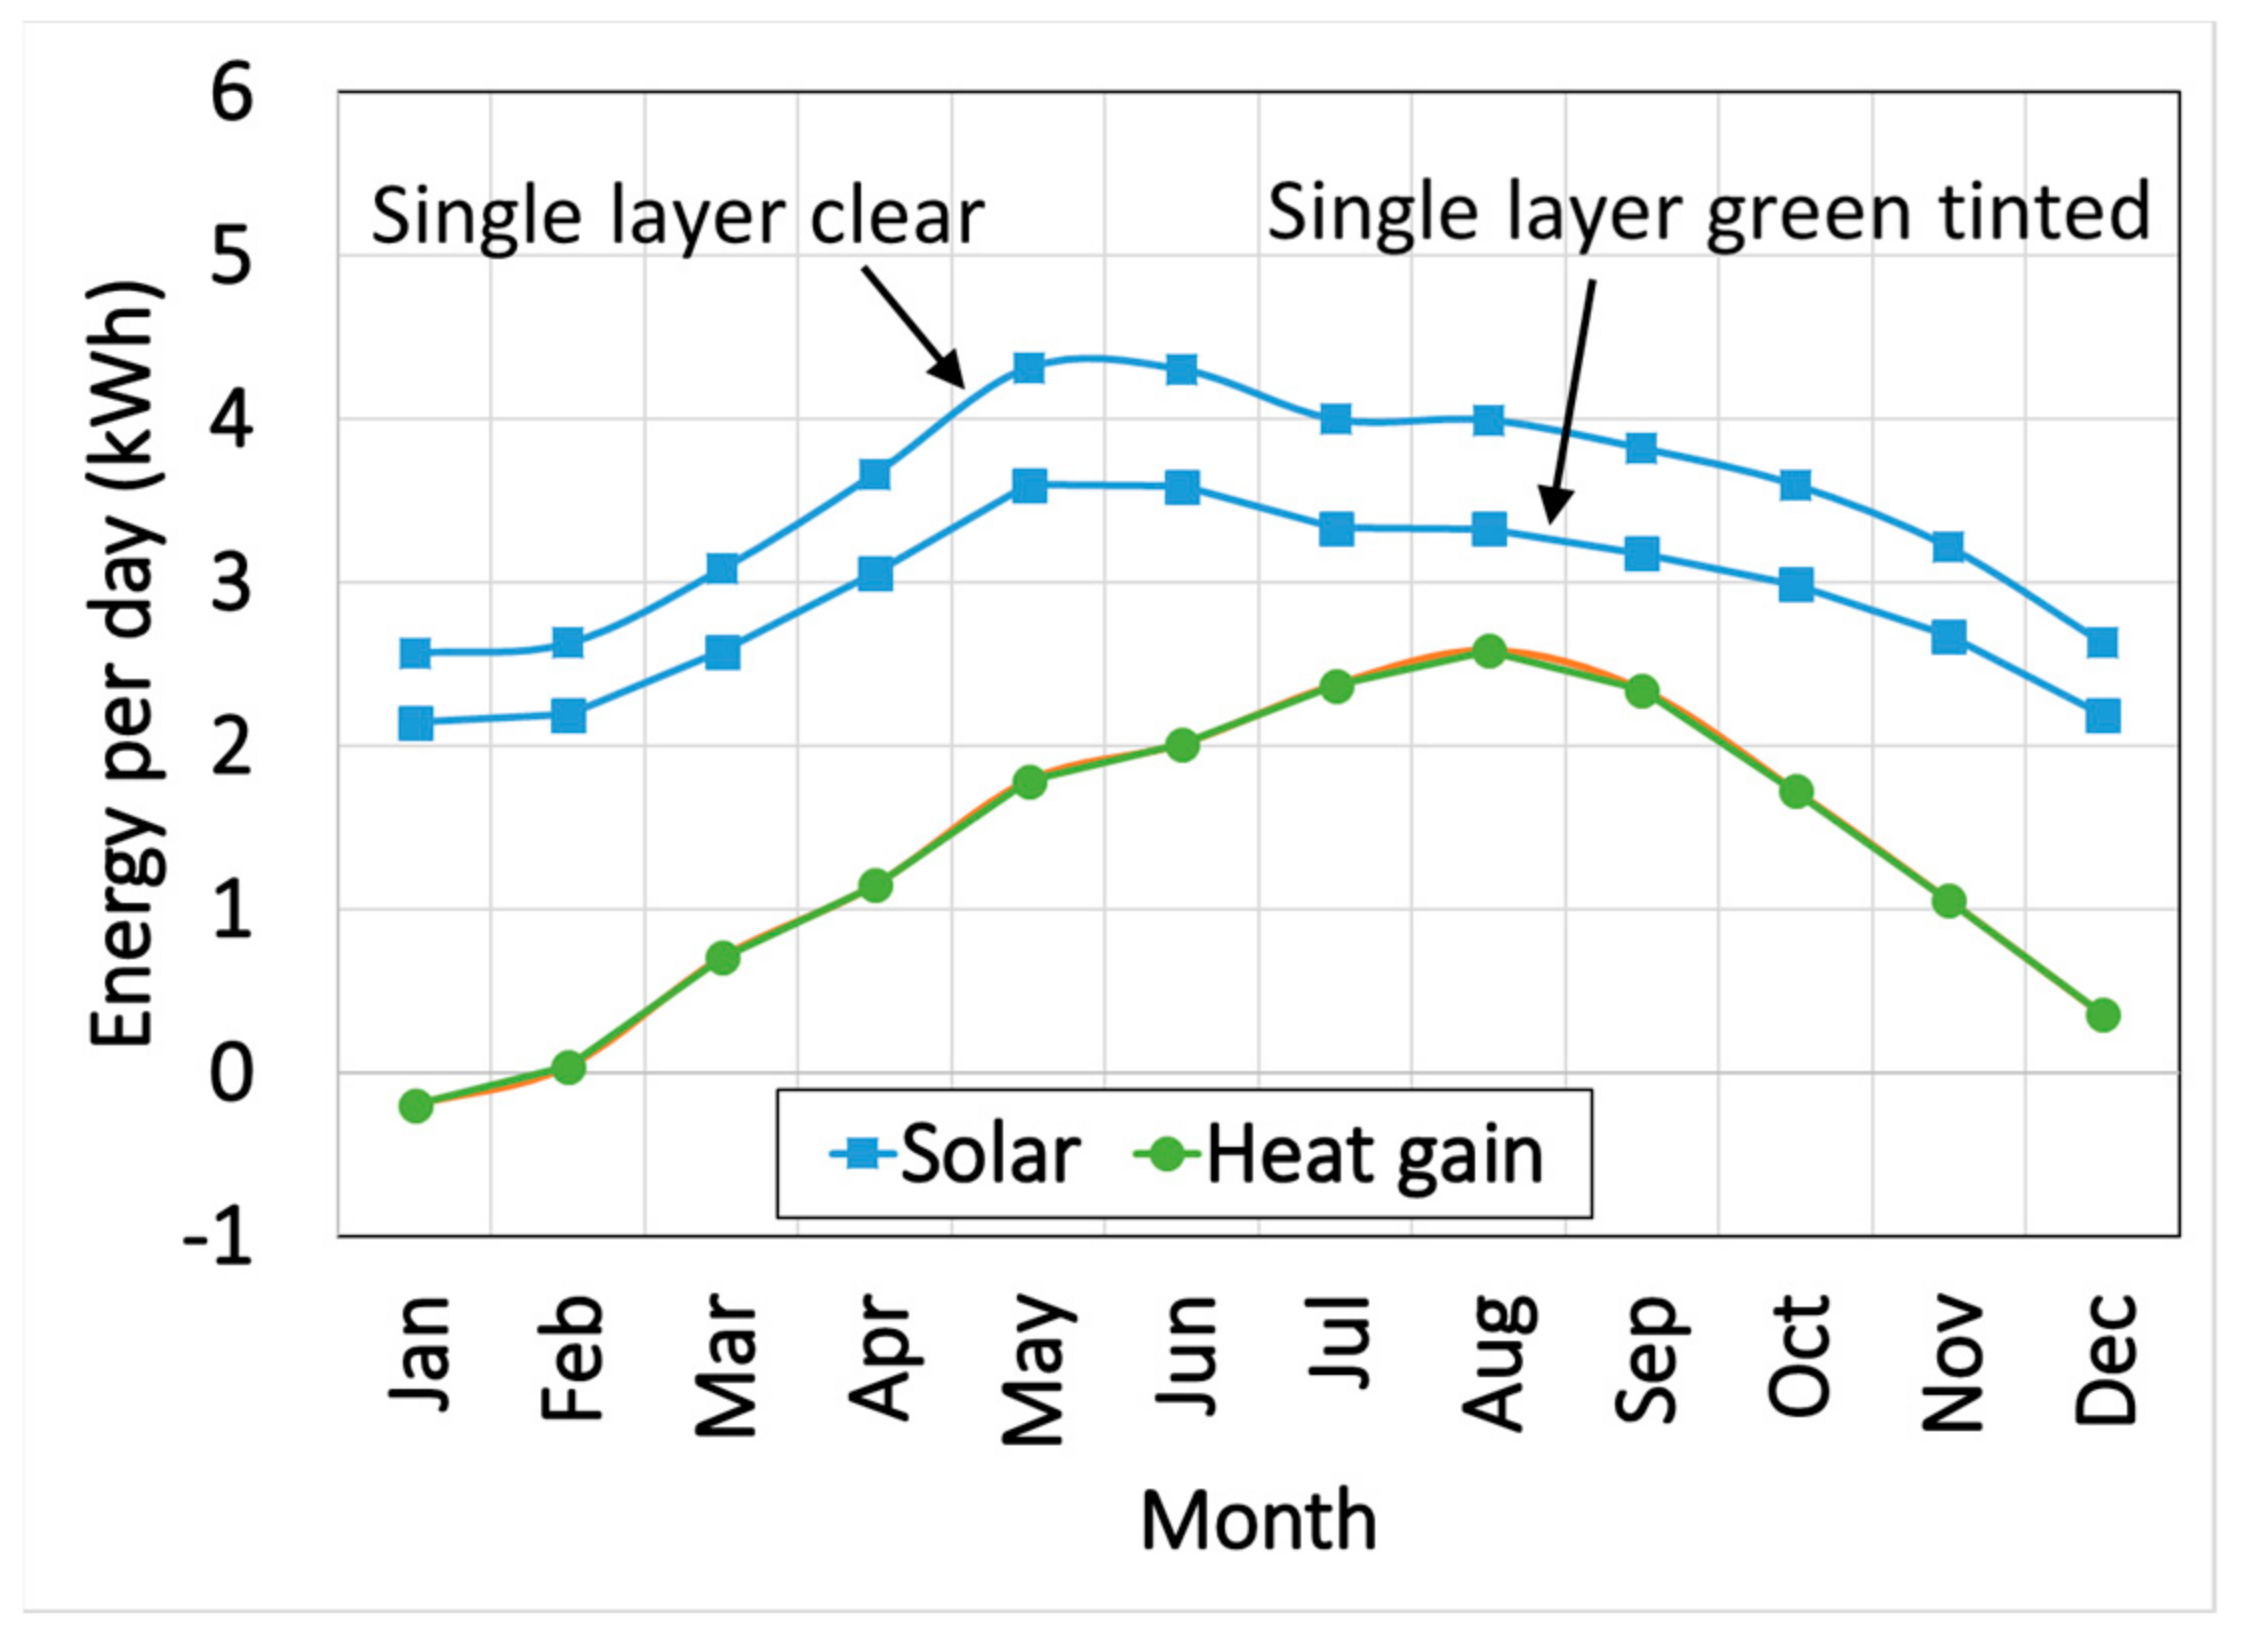
Figure 11.
The rise in temperature inside and outside the room for (a) 1 m window in winter, (b) 1 m window in summer, (c) 2 m window in winter, (d) 2 m window in summer, (e) 3 m window in winter, and (f) 3 m window in summer.
Figure 11.
The rise in temperature inside and outside the room for (a) 1 m window in winter, (b) 1 m window in summer, (c) 2 m window in winter, (d) 2 m window in summer, (e) 3 m window in winter, and (f) 3 m window in summer.
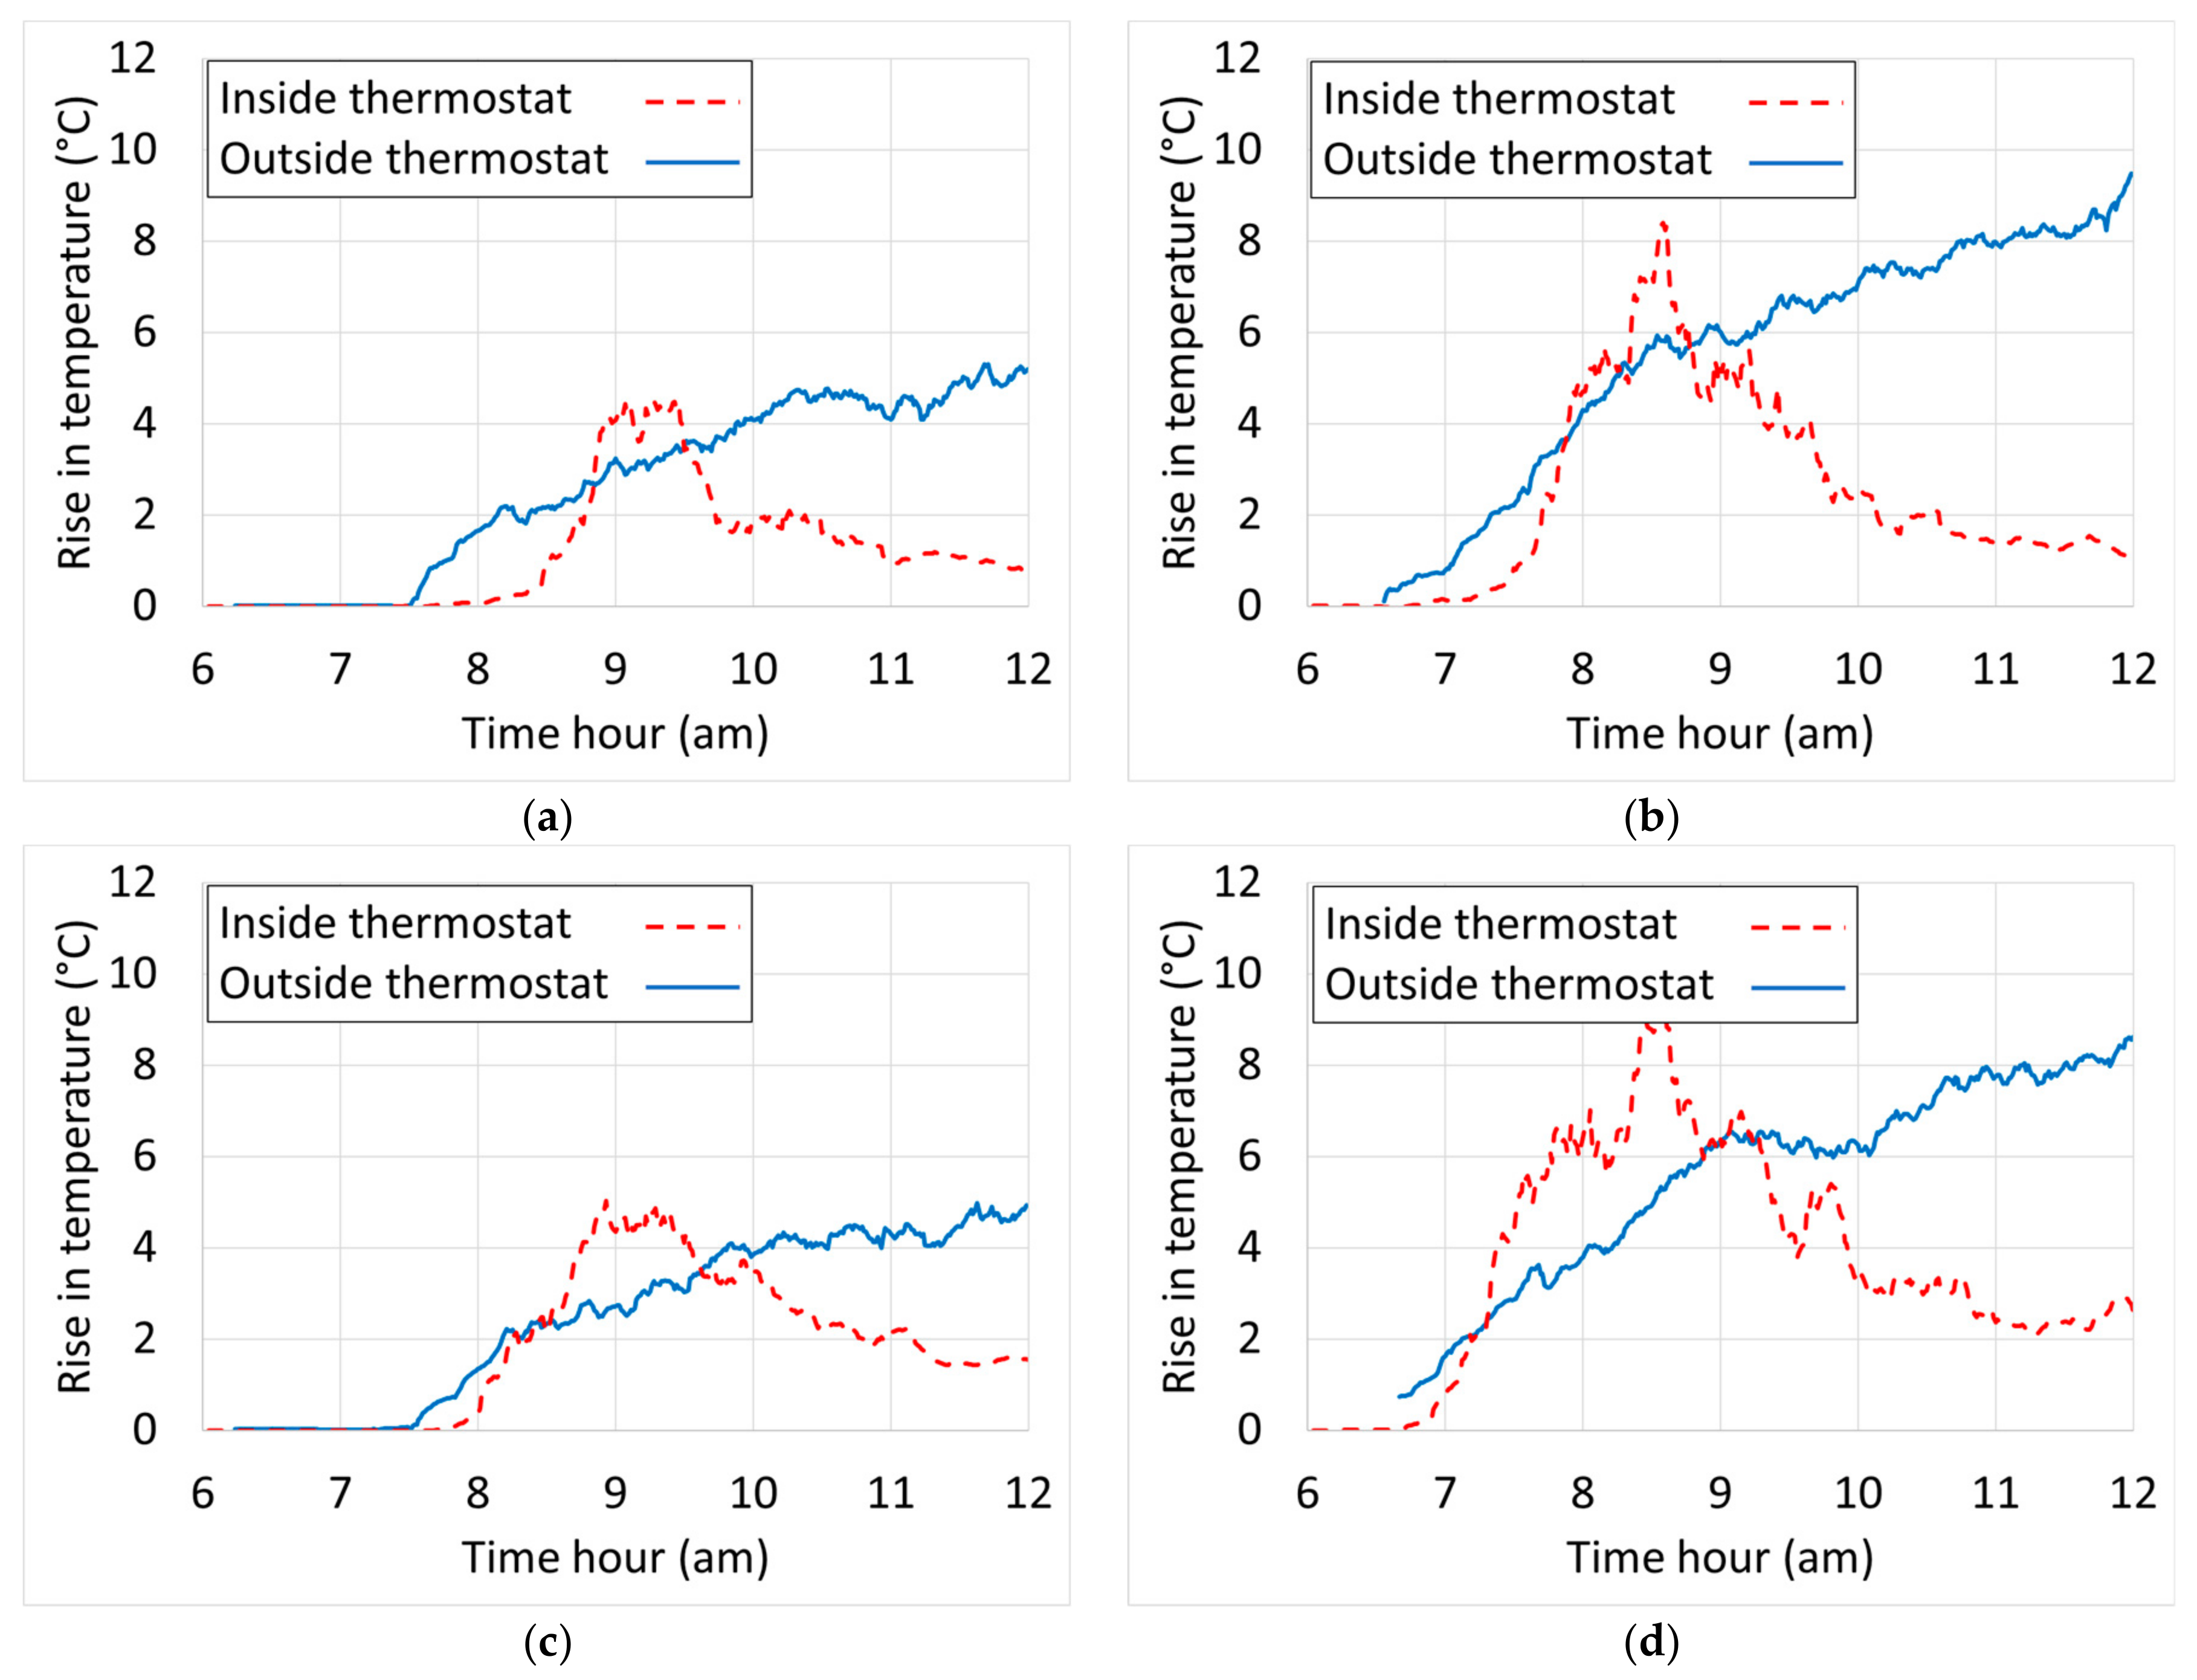
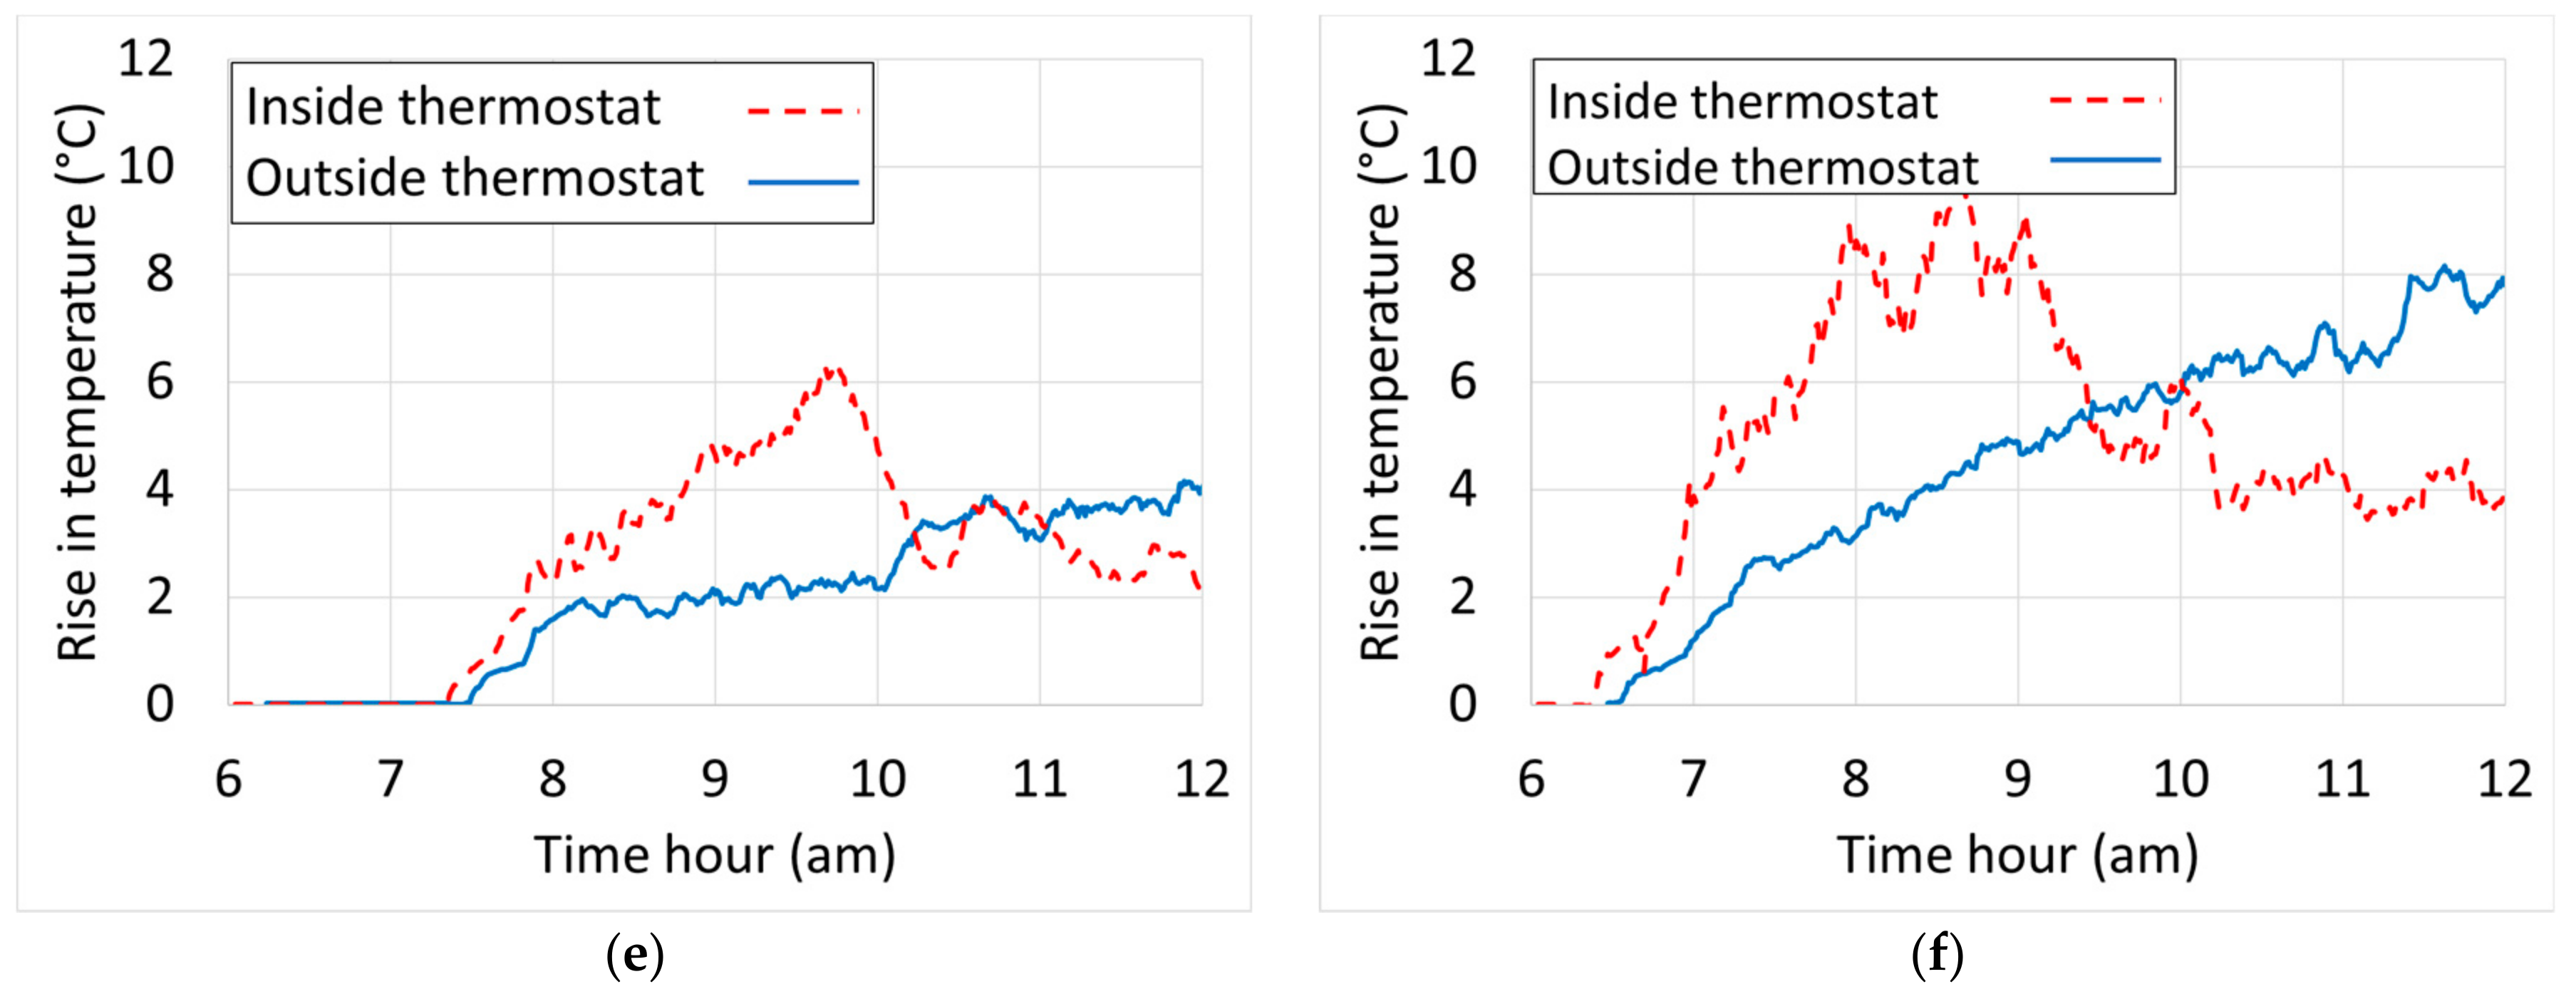
Figure 12.
Temperature contour map of convection analysis in winter conditions for east-facing window with (a) 1 m height, (b) 2 m height, and (c) 3 m height.
Figure 12.
Temperature contour map of convection analysis in winter conditions for east-facing window with (a) 1 m height, (b) 2 m height, and (c) 3 m height.

Table 1.
Typical U-values of windows [21]; e is the emittance of the low-E coated surface.
Table 1.
Typical U-values of windows [21]; e is the emittance of the low-E coated surface.
| Glazing Type | Wood or Vinyl Frame with Insulated Spacer, W/(m2·K) | Aluminum Frame with Thermal Break and Conventional Spacer, W/(m2·K) |
|---|---|---|
| Single glass | N.A. | 6.08 |
| Double glass ½″ air space | 2.73 | 3.52 |
| Double glass e = 0.2, ½″ air space | 2.21 | 2.95 |
| Double glass e = 0.1, ½″ air space | 2.10 | 2.78 |
| Double glass e = 0.1, ½″ argon space | 1.93 | 2.61 |
| Triple glass e = 0.1, ½″ argon spaces | 1.31 | 2.04 |
Table 2.
Typical values of SHGC for windows [22].
Table 2.
Typical values of SHGC for windows [22].
| Glazing Type | SHGC |
|---|---|
| Single glass, clear | 0.66 |
| Single glass, green tint | 0.55 |
| Double glass, clear, ½″ air space | 0.59 |
| Double glass, green tint, outer pane, ½″ air space | 0.47 |
| Double glass, clear, e = 0.2, ½″ air space | 0.51 |
| Double glass, spectrally selective, e = 0.04, ½″ argon space | 0.33 |
| Triple glass, e = 0.08, ⅜–½″ air or argon spaces | 0.39 |
Table 3.
Different parameters and properties used in the thermal analysis.
| Parameter | Value |
|---|---|
| Summer sun hours | From 6 a.m. to 7 p.m. |
| Summer mean daily solar radiation (W/m2) [26] | 324 |
| Winter sun hours | From 7 a.m. to 6 p.m. |
| Winter mean daily solar radiation (W/m2) [26] | 162 |
| Air kinematic viscosity (m2/s) | 0.000015 |
| Air thermal expansion coefficient (/°C) | 0.00367 |
| Thermal boundary condition | Dirichlet (constant temperature) |
Table 4.
Different thermal properties of materials used [24].
Table 4.
Different thermal properties of materials used [24].
| Air | Concrete | Block Walls | Soil | |
|---|---|---|---|---|
| Thermal conductivity (W/(m·°C)) | 0.025 | 2 | 1 | 0.2 |
| Specific heat (J/(kg·°C)) | 1000 | 880 | 880 | 830 |
| Density (kg/m3) | 1.23 | 2500 | 2000 | 1600 |
Disclaimer/Publisher’s Note: The statements, opinions and data contained in all publications are solely those of the individual author(s) and contributor(s) and not of MDPI and/or the editor(s). MDPI and/or the editor(s) disclaim responsibility for any injury to people or property resulting from any ideas, methods, instructions or products referred to in the content. |
© 2024 by the author. Licensee MDPI, Basel, Switzerland. This article is an open access article distributed under the terms and conditions of the Creative Commons Attribution (CC BY) license (https://creativecommons.org/licenses/by/4.0/).
Share and Cite
MDPI and ACS Style
Almasri, A.H. Smarter Window Selection for Smarter Energy Consumption: The Case of the United Arab Emirates. Buildings 2024, 14, 876. https://doi.org/10.3390/buildings14040876
AMA Style
Almasri AH. Smarter Window Selection for Smarter Energy Consumption: The Case of the United Arab Emirates. Buildings. 2024; 14(4):876. https://doi.org/10.3390/buildings14040876
Chicago/Turabian StyleAlmasri, Amin H. 2024. "Smarter Window Selection for Smarter Energy Consumption: The Case of the United Arab Emirates" Buildings 14, no. 4: 876. https://doi.org/10.3390/buildings14040876
Note that from the first issue of 2016, this journal uses article numbers instead of page numbers. See further details here.