Article

Mechanical Performance Optimization and Microstructural Mechanism Study of Alkali-Activated Steel Slag–Slag Cementitious Materials

1
School of Civil Engineering, Xi’an University of Architecture and Technology, Xi’an 710055, China
2
Shaanxi Key Laboratory of Geotechnical and Underground Space Engineering, Xi’an University of Architecture and Technology, Xi’an 710055, China
3
Shaanxi Building Materials Technology Group Co., Ltd., Xi’an 710018, China
*
Author to whom correspondence should be addressed.
Buildings 2024, 14(5), 1204; https://doi.org/10.3390/buildings14051204
Submission received: 13 March 2024 / Revised: 28 March 2024 / Accepted: 19 April 2024 / Published: 24 April 2024
(This article belongs to the Section Building Materials, and Repair & Renovation)

Abstract

:
The optimal proportion of alkali-activated steel slag–slag cementitious materials is investigated by considering the combined effects of steel slag content, alkali content, water glass modulus, and water–binder ratio using the Box–Behnken design in response surface methodology. Qualitative and semi-quantitative analyses of X-ray diffraction (XRD) patterns and scanning electron microscopy with energy-dispersive spectroscopy (SEM-EDS) images are conducted. The microstructural mechanism is elucidated based on the chemical composition, surface morphology, and microscale pore (crack) structures of the samples. A microreaction model for the alkali-activated steel slag and slag is proposed. The optimal composition for alkali-activated steel slag–slag cementitious materials is as follows: steel slag content, 38.60%; alkali content, 6.35%; water glass modulus, 1.23; and water–binder ratio, 0.48. The strength values predicted by the response surface model are p1d = 32.66 MPa, p7d = 50.46 MPa, and p28d = 56.87 MPa. XRD analysis confirms that the compressive strength of the sample is not only influenced by the amount of gel formed, but also, to a certain extent, by the CaCO3 crystals present in the steel slag, which act as nucleation sites. The SEM-EDS results confirm that the gel phase within the system comprises a hydrated calcium silicate gel formed through the reaction of volcanic ash and geopolymer gel formed through geo-polymerization. Analysis of the pore (crack) structure reveals that the compressive strength of the specimens is primarily influenced by porosity, with a secondary influence of the pore fractal dimension.

1. Introduction

China’s steel industry is currently experiencing robust growth with an annual production of over 1 billion tons of crude steel. Consequently, substantial amounts of smelting waste such as steel slag and ore slag are generated [1,2]. The disposal of emitted waste residues through the open-air stacking method not only occupies a substantial land area but also poses the risk of hazardous substances leaching into the soil and groundwater, thereby causing significant ecological damage [3,4]. The composition of slag resembles that of cement, with its glassy SiO2 and Al2O3 components exhibiting commendable reactivity when subjected to activators. This has led to significant advances in the production of cementitious materials. Currently, the slag recycling rate in China exceeds 80%, demonstrating significant advancements in this field [5,6]. Compared to slag, steel slag has lower hydraulic activity and higher hardness, leading to greater energy consumption during grinding. In addition, it exhibits poor volumetric stability. The recycling rate in China is currently less than 30%, which is significantly less than countries such as the United States, Japan, and Germany, where recycling rates are close to 100% [7].
Extensive research has been conducted on alkali-activated cementitious materials incorporating steel slag to enhance their recycling and utilization efficiencies. Sun et al. [8] employed a modulus of 1.5 for water glass to activate steel slag and compared it with Portland cement with a water–binder ratio of 0.45. The investigation revealed that alkali-activated steel slag exhibits a similar hydration process and resulting products to cement. However, owing to the lower degree of hydration in alkali-activated steel slag, its strength is only 30–40% of that of cementitious paste. Sun et al. [9] utilized CO2 to carbonize steel slag, resulting in the formation of carbonated steel slag (CSS). The physicochemical properties of CSS have been comprehensively characterized and the influence of the mix proportions on the strength of alkali-activated carbonated steel slag (AACSS) mortar investigated. It was observed that the 28-day strength of AACSS mortar varied between 0.52 and 12.13 MPa, depending on the mix proportions employed. Peng et al. [10] utilized water glass to activate the cementitious properties of steel slag and slag. Compressive strength tests were conducted through single-factor experiments, complemented by X-ray diffraction (XRD) and scanning electron microscopy (SEM) microscopic analyses, to investigate the material proportions and hydration characteristics. It was observed that a ratio of 4:6 for steel slag to slag, combined with the addition of 6% water glass and 1% retarding agent resulted in cementitious materials with strength comparable to that of ordinary Portland cement (42.5 R). Zhou et al. [11] employed steel slag as the primary raw material and blast furnace slag as the modifying agent. In addition, water glass with a modulus of 1.5 and 4% Na2O was added for alkali activation. By testing the hydration process, microstructure, and compressive strength of this alkali-activated composite material, it was discovered that the blast furnace slag produced more Si-O-Si bonds in the gel and refined the pore structure, which significantly increased the compressive strength of the material. Based on the comprehensive findings from the aforementioned studies, it can be inferred that the low reactivity of steel slag results in a relatively low strength when subjected to alkali activation. However, the performance of steel slag and slag can be mutually enhanced by alkali activation, leading to more thorough hydration reactions [12,13]. Consequently, composite cementitious systems with desirable mechanical properties can be prepared by carefully selecting appropriate proportions and ratios.
Currently, the optimization methods for material blending mainly consist of single-factor experiments and orthogonal experiment optimization. Single-factor experiments can only investigate the effect of a single variable on the experimental results. However, the performance of materials is usually influenced by multiple factors collectively, which means that single-factor experiments cannot comprehensively consider these factors to obtain the optimal blending ratio. Orthogonal experiment design collects comprehensive factor influence data efficiently with relatively fewer test runs, thus revealing the optimal combination of multiple factor levels. However, this method is limited to the analysis of discrete data, possessing certain limitations in terms of precision and predictive capability. Response surface methodology involves the construction of a nonlinear model to achieve a high-precision regression equation. This method comprehensively considers the interactions between various factors and determines the optimal ratio through reasonable predictions [14]. The mechanical properties of alkali-activated steel slag–slag cementitious materials are influenced by multiple indices such as the main material content, alkali content, and water glass modulus. These factors may interact with each other, and considering them individually or in pairs may not be sufficient to accurately predict material performance. Further research is required on the microreaction mechanisms and microstructure models. This study aims to investigate the optimal mix proportions of alkali-activated steel slag–slag cementitious materials under the combined influence of steel slag content, alkali dosage, water glass modulus, and water–binder ratio using the response surface methodology. Furthermore, qualitative and semi-quantitative analyses of the microscopic test results are conducted to propose a microreaction model for the alkali-activated steel slag–slag cementitious materials.

2. Materials and Methods

2.1. Materials

The steel slag used in the experiment was converter steel slag with a 28-day activity index of 70%; the slag used in the experiment was blast furnace slag with a 28-day activity index of 109%. The slag exhibited a higher level of activity. The main chemical compositions of the two materials are listed in Table 1.
The XRD patterns of the steel slag and slag are displayed in Figure 1. The XRD pattern of the slag exhibits a diffuse distribution without distinct peaks, except for gehlenite (C2AS), indicating its high glass phase content and strong reactivity. Conversely, the XRD pattern of the steel slag reveals multiple crystal types including abundant C2S, C3S, and RO phases. In this context, C2S and C3S refer to dicalcium silicate and tricalcium silicate, respectively, which are also present in cement clinker. This indicates that steel slag possesses certain cementitious properties. The RO phase is a solid solution formed by divalent oxides such as CaO, MgO, FeO, and MnO during the steelmaking process. In addition, the prolonged storage of steel slag for over a year causes a chemical reaction between free calcium oxide (f-CaO) and moisture as well as the CO2 present in the ambient air. This leads to the formation of CaCO3, which is manifested as an observable peak of CaCO3.
The alkaline activator used in the test was prepared by blending liquid water glass with NaOH particles. The purity of the NaOH exceeded 96%; the chemical composition of the water glass can be found in Table 2. The water glass modulus was adjusted to the desired range (approximately 0.8–1.6) by adding NaOH, which refers to the ratio of SiO2 to Na2O in the solution. Equation (1) was used to calculate the modulus of 100 g of water glass [15].
N = ( Y 1 / 60.09 ) / ( X 1 / 61.98 + M / 80 ) ,
where N represents the adjusted modulus of water glass; M represents the mass of NaOH to be added (g); Y1 represents the content of SiO2 in 100 g of water glass (27.27 in this test); and X1 represents the content of Na2O in 100 g of water glass (8.32 in this test).

2.2. Experimental Design
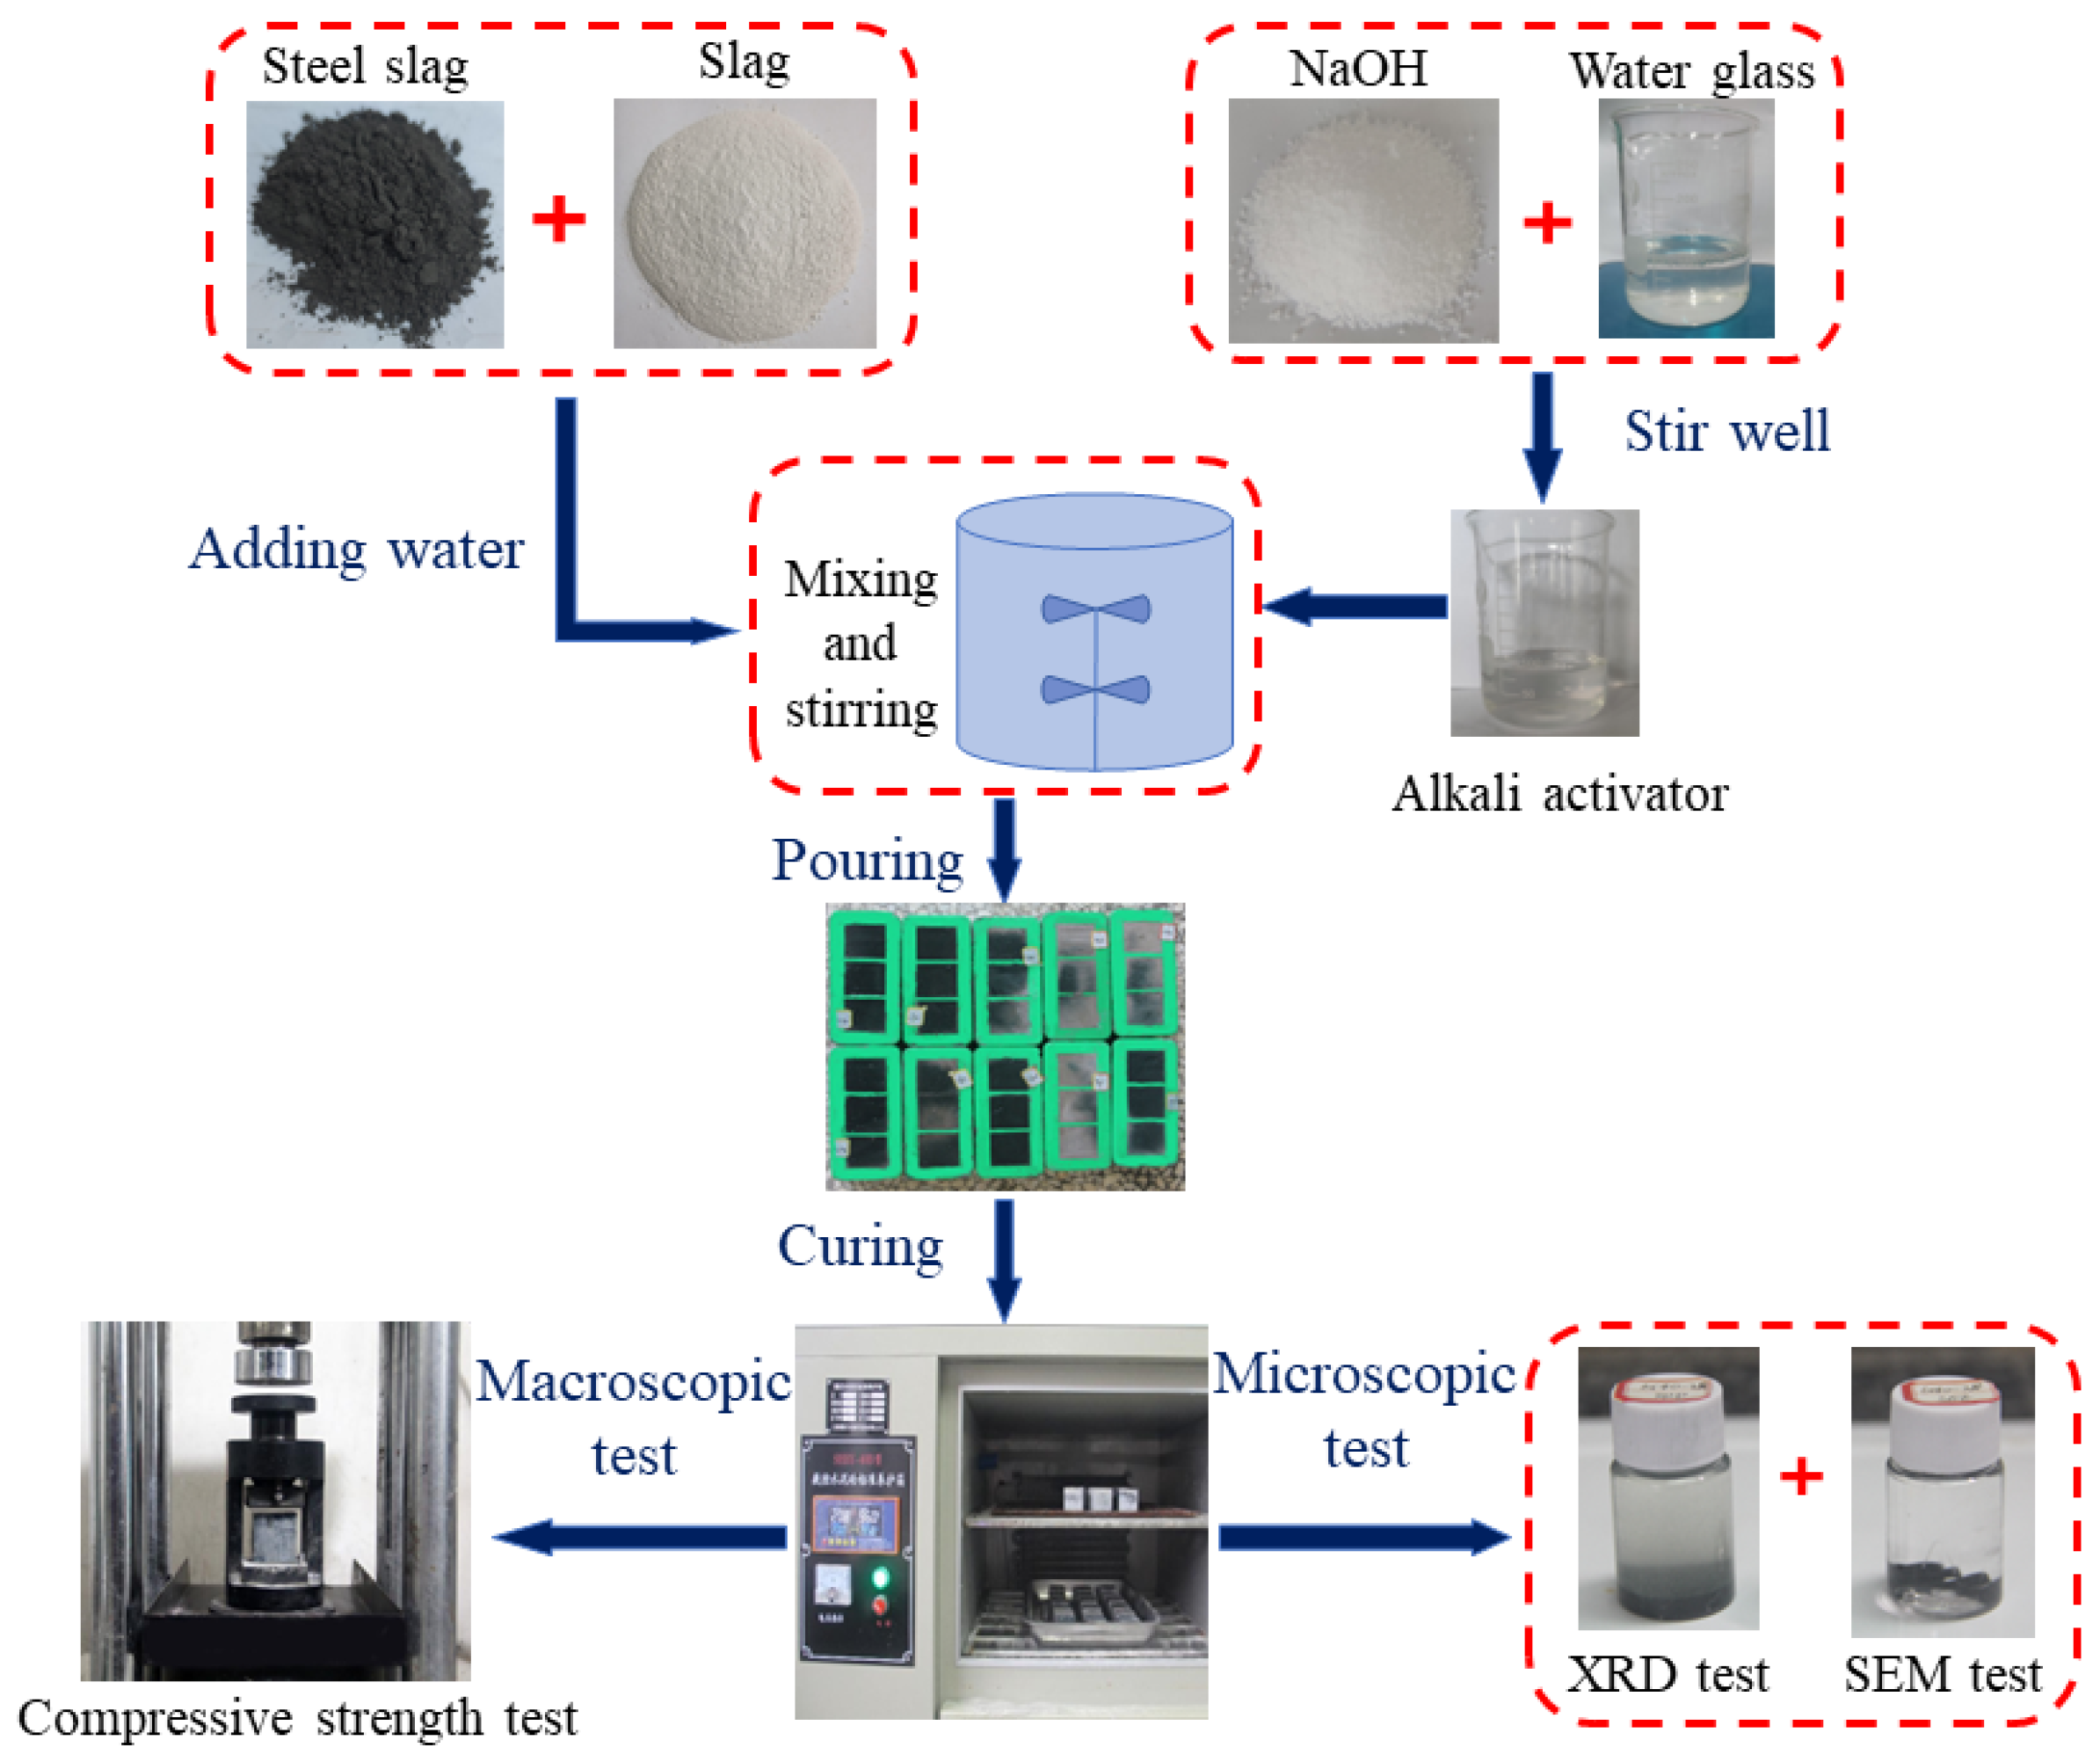
Single-factor tests were conducted to study the effects of different steel slag contents, alkali contents, water glass modulus, and water–binder ratios on the compressive strength of specimens at different ages. The specific proportions are as shown in Table 3. The steel slag content refers to the substitution of steel slag for a portion of slag as a cementitious material, with the sum of the two being 100%. The alkali content, as an external admixture, is defined as the ratio of the alkali mass to the total mass of steel slag and slag.
A four-factor, three-level test was designed based on the above single-factor test results. The four factors were the steel slag content (X1), alkali content (X2), water glass modulus (X3), and water–binder ratio (X4). Each factor was represented by three levels (−1, 0, and 1). The response variables chosen for evaluation were the compressive strengths at 1 day, 7 day, and 28 day denoted as Y1, Y2, and Y3, respectively. The design factors and test levels are listed in Table 4.

2.3. Methods

Figure 2 illustrates the experimental procedure. Initially, NaOH granules are dissolved in water, and a certain amount of water glass is added to mix thoroughly to prepare the alkali activator, which is then set aside after standing at room temperature. Subsequently, the weighed steel slag powder and slag powder are mixed for 30 s in a mortar mixer, and the prepared alkali activator and water are incorporated into the mixture. The mixer is started to gently stir for 2 min, followed by a pause for 15 s and then a rapid stir for another 2 min. Thereafter, the well-mixed slurry is poured into the test mold for casting and shaping. After demoulding, the specimens are cured to the specified age. Finally, the cured specimens at the required age are subjected to compressive strength testing, XRD analysis, and SEM examination.
Cubical samples with dimensions of 40 × 40 × 40 mm were used for the compressive strength tests. The prepared alkali-activated steel slag–slag slurry is poured into a triple test mold in two installments and vibrated to shape. After curing for 24 h in a standard box at a temperature of 20 ± 2 °C and a humidity of no less than 95%, the molds are removed. The specimens continue to be cured in the standard box until the desired age, after which compressive strength testing is conducted using a YAW-300 fully automatic pressure machine. Specimens for measuring the compressive strength at 1 day were stripped for 2 h in advance.
Three parallel specimens were poured for each ratio. To avoid excessive test errors affecting the reliability of results, the value of compressive strength was carried out according to the standard JGJ/T 70-2009 Standard for test method of performance on building mortar [16]. R1 and R2 are defined as the discrimination coefficients, and the value method is judged according to Equations (2) and (3). When R1 is equal to or lesser than 15%, the arithmetic mean value of the three parallel specimens is taken as the compressive strength value for that group. When R1 exceeds 15% and R2 is equal to or lesser than 15%, the middle value is taken as the compressive strength value for that group. If R2 exceeds 15%, the test for that group is invalidated, and new specimens should be cast.
R 1 = max ( f max f m i d ) / f m i d , ( f m i d f min ) / f m i d .
R 2 = min ( f max f m i d ) / f m i d , ( f m i d f min ) / f m i d .
where fmax, fmid, and fmin refer to the maximum, middle, and minimum values of the three specimens, respectively, in MPa.
The scanning electron microscope (JSM-7610F Plus) produced by Zeiss in Oberkochen, Germany, is used for SEM tests. The specimens cured to the specified age were broken, and the fragments in the central position were soaked in anhydrous ethanol to terminate the hydration. Finally, the SEM test samples were prepared by drying in an oven at 60 °C to constant weight. XRD was performed using a device manufactured by Rigaku Corporation, located in Tokyo, Japan, known as the Smart Lab X-ray powder diffractometer. The sample preparation process was the same as that for the SEM samples; however, they required grinding into a powder before conducting the test.

3. Optimization of Mechanical Properties by Response Surface Methodology

The response surface method is a statistical method which obtains certain data by a reasonable experimental design method, using a multiple quadratic regression equation to fit the functional relationship between factors and response values, and seeks the optimal process parameters by analyzing the regression equation to solve the multi-variable problem [17,18]. The Box–Behnken experimental design is a commonly used trial design method in response surface optimization, providing a multi-factor, three-level experimental design and its analysis. This method uses a multi-variable quadratic equation to fit the functional relationship between factors and response values, and seeks the optimal process parameters through the analysis of the regression equation to solve multi-variable problems [14,19].
The mechanical properties of steel slag–slag cementitious materials mainly refer to their strength after solidification and hardening. The steel slag content, alkali content, water glass modulus, and water–binder ratio all influenced the compressive strength of the stone bodies during the test process. To achieve an optimal mix design, the mechanical properties of the materials were optimized using the Box–Behnken design within the framework of the response surface methodology. The influencing factors were identified as steel slag content, alkali content, modulus of water glass, and water–binder ratio; the 1-day, 7-day, and 28-day compressive strengths were considered as response values. A quadratic regression model was established based on the experimental outcomes.

3.1. Single Factor Test

Analyzing the influence patterns of the different factors on the intensity facilitates the identification of suitable level factors for subsequent optimization experiments. Figure 3 displays the variation in the compressive strength under the influence of different factors, where the error bar reflects the population standard deviation. In this context, the steel slag content represents the proportion of steel slag used as a partial replacement for slag, with a combined total of 100%. In addition, the alkali content, as an external admixture, represents the ratio of the mass of the alkali to the total mass of the steel slag and slag.
To analyze the change in the compressive strength, Rp was introduced as an indicator for measuring the rate of strength alteration in Equation (4).
R p = ( p m 2 p m 1 ) / p m 1 ,
where pm1 is the compressive strength corresponding to the first two adjacent ratios (MPa); pm2 is the compressive strength corresponding to the latter of the two adjacent ratios (MPa).
The reactivity of the steel slag used in the experiments was lower than that of the slag. Consequently, in a steel slag–slag cementitious material system, a higher proportion of steel slag leads to the production of fewer hydrated cementitious materials. This results in a reduction in the compressive strength of the specimens, as indicated in Figure 3a. It is worth noting that when the steel slag content increases from 30% to 40%, the 28-day compressive strength of the specimens increases from 52.56 MPa to 53.27 MPa, and the compressive strength increased by around 1.35%. This phenomenon could be attributed to the higher CaCO3 content in the steel slag, which provides more nucleation sites in the system, facilitating the formation of hydrated gels and resulting in a modest increase in the compressive strength [20,21]. As the steel slag content continues to increase, the compensation effect of the CaCO3 crystals gradually becomes less than the strength loss caused by the reduction in slag, resulting in a continuous decline in strength. The microscopic principle of the effect of steel slag content on compressive strength is indicated in Figure 4. When the steel slag content is low, as in Figure 4a, the content of the highly active slag in the system is high, which is conducive to the formation of a large amount of gel and improves the compressive strength of the specimen. With an increase in the steel slag content, the amount of gel produced in the system gradually decreases, resulting in a decrease in the compressive strength. However, when the steel slag content is appropriate, as indicated in Figure 4b, the CaCO3 crystals in the steel slag provide nucleation sites for the growth of the gel, which can promote hydration and marginally increase the compressive strength. In the case of excessive steel slag content, as indicated in Figure 4c, although the CaCO3 crystals in the system can provide nucleation sites to promote gel formation, the low slag content results in insufficient system activity. Consequently, the synthesized gel is reduced, which leads to a continuous decrease in the compressive strength of the specimen. In Figure 3a, the change rate of strength at different curing ages reveals a significant decrease in strength when the steel slag content increases from 40% to 50%. This decline in strength indicates a sudden decrease in performance. Consequently, when considering the design factor, it is advisable to designate 40% as the central level value for steel slag content and assign 30% and 50%, respectively, as the low-level and high-level values for this factor.
The pH of the system increases with increasing alkali content. This, in turn, disrupts the Si-O-Si and Al-O-Si bonds in steel slag cementitious systems. The [SiO4]4− and [AlO4]5− species formed subsequently undergo aggregation into a three-dimensional network structure under the influence of strong alkali. The three-dimensional network structure is combined with Ca2+ and Na+ in solution to form N-A-S-H and C-A-S-H geopolymers, which enhance the compressive strength of the stone body [22,23,24]. As indicated in Figure 3b, the compressive strength of the stone body exhibits a consistent upward trend with an increase in the alkali content for 1 day. However, at a concentration of 6%, there is a notable inflection point in the compressive strength observed at both 7 day and 28 day, indicating an initial increase followed by subsequent decline. The increase in the alkali dosage directly increases the pH value of the slurry, which improves the hydration rate of the vitreous in the steel slag and slag, resulting in a significant increase in the early compressive strength. In terms of compressive strength at 7 day and 28 day, insufficient alkalinity is exhibited by the slurry with an alkali content less than 6%, leading to incomplete disintegration of the steel slag and slag. Consequently, a decrease in the strength results from the solidification process. Therefore, it is imperative for the alkali content to increase proportionally to enhance compressive strength. When the alkali content exceeds 6%, the rate of hydration product formation is accelerated by an increase in alkali concentration, leading to uneven diffusion. Consequently, localized weak areas with a limited distribution of hydration products are formed, resulting in a decrease in the compressive strength. Moreover, further reactions between the steel slag and slag are impeded by the encasement of hydration products on the particle surfaces, resulting in incomplete reactions. Therefore, as the alkali content continues to increase, the strength decreases [25,26]. An analysis of the variation rate in compressive strength reveals that an increase in alkali content from 6% to 8% leads to a decrease in the rate of change for 1 day from 145.82% to 6.8%. In addition, the rates at 7 day and 28 day transition from positive to negative values. Notably, there is a significant decline in the rate of change at each age, indicating substantial fluctuations in compressive strength before and after an alkali content of 6%. Therefore, when designing the experimental factors, it is recommended to consider an alkali content of 6% as the central level value, considering levels of 4% and 8% as low and high levels, respectively.
Water glass exhibits a double-layered structure comprising an amorphous mSiO2 core, as depicted in Figure 5 [27]. The surface of the core is characterized by the adsorption of H3SiO4− ions, with a certain amount of Na+ being adsorbed in the compact layer and another portion distributed within the diffusion layer. Furthermore, there is also distribution of OH on the outer side of the diffusion layer [28]. The activation effect of water glass can be influenced by both high and low moduli. A thin double electric layer structure is caused by a high modulus, resulting an insufficient number of Na+ and OH ions to activate the steel slag and slag, leading to a decreased compressive strength of the stone body. Conversely, a thick double electric layer structure is caused by a low modulus and excessive OH ions rapidly hydrate the active substances in the system, forming gel that adheres to the surface of steel slag and slag particles, thereby hindering further hydration reactions [29,30]. Based on Figure 3c, the compressive strength of the stone body at 1 day gradually improves as the modulus of the water glass increases. However, beyond a water-glass modulus exceeding 1.2, the strengthening effect is less pronounced. The compressive strength of the stone body at 7 day and 28 day demonstrates an initial increase, followed by a subsequent decrease, with a turning point observed at a water-glass modulus of 1.2. When the water-glass modulus is less than 1.2, a higher concentration of Na+ and OH ions is exhibited by the solution, resulting in the formation of a thicker double layer that rapidly hydrates and adheres to the active substance on the surface of the steel slag. This adhesion hinders further hydration reactions. However, with an increase in the water-glass modulus, this adhesion effect is weakened, thereby promoting more complete hydration reactions. When the modulus exceeds 1.2, during the initial stage, due to an adequate concentration of OH ions in the solution, stimulation is provided to the active substance within the system. Nevertheless, as time progresses and the ion concentration becomes insufficient, the stimulation decreases, leading to reduced compressive strength. Consequently, with an increase in the modulus value beyond this point, gradual thinning of the double layer formed by the water glass can be observed. The analysis of the variation rate in compressive strength reveals that as the water-glass modulus is increased from 1.2 to 1.4, the rate of variation at 1 day decreases from 27.25% to 2.4%, whereas the rates of strength variation at both 7 day and 28 day transition from positive values to negative values. This phenomenon indicates a substantial fluctuation in the compressive strength of the specimens around a water-glass modulus of 1.2. Therefore, when designing the experimental factors, a water-glass modulus of 1.2 should be regarded as the central value, with values of both 1.0 and 1.4 being considered as low and high levels for this factor, respectively.
The compressive strength of stone bodies is significantly influenced by the water–binder ratio, which is a critical parameter. The participation of water molecules in hydration reactions is hindered by a low water–binder ratio, resulting in glass phase particles being unable to engage in the reaction and adversely influencing the compressive strength of stone bodies. Conversely, excessive free water distribution among gels occurs owing to an excessively high water–binder ratio, leading to a loose structure of stone bodies and consequently reducing their compressive strength [31]. Therefore, in the design and fabrication of stone structures, it is essential to control the water–binder ratio to ensure appropriate moisture content, thereby improving the compactness and enhancing the compressive performance of the stone body. With an increase in the water–binder ratio, the compressive strength of stone specimens at different ages, as depicted in Figure 3d, exhibits a declining trend, indicating that the progressive augmentation of free water within the system results in a more porous structure of stone bodies. The change rate of the compressive strength at each age fluctuates significantly when the water–binder ratio increases from 0.5 to 0.55, indicating that the compressive strength of the stone body at each age changes significantly before and after the water–binder ratio of 0.5. When designing the level factor, a water–binder ratio of 0.5 should be considered as the central level value, with 0.45 and 0.55 being used as the low and high values for this factor, respectively.

3.2. Optimization of Mechanical Properties by Response Surface Methodology

3.2.1. Response Surface Equation Establishment and Variance Analysis

The current study was conducted using a Box–Behnken design; three sets of central experiments were conducted, comprising 27 groups. The detailed experimental results are presented in Table 5. The test results were subjected to quadratic regression fitting and surface variance analysis using Design-Expert 11.0 software. The equations obtained from the fitting process, along with the results of the variance analysis, are presented in Table 6. In the fitting equation, a high level of correlation was indicated by an R2 value approaching one, implying that the model achieved an acceptable fit. Moreover, a higher level of significance in the model was indicated by a larger F-value and a smaller p-value. Specifically, results were considered significant when p < 0.05, and extremely significant when p < 0.0001. As indicated in Table 6, the R2 values of Models 1, 2, and 3 are 0.98, 0.97, and 0.97, respectively. Furthermore, all three regression models demonstrate high significance (p < 0.0001), thereby substantiating the rationality and dependability of the regression model employed to analyze the influence of the four factors on compressive strength.

3.2.2. Analysis of Variance for Influencing Factors

The analysis of variance results for each influencing factor are presented in Table 7. The significance test conducted on the coefficients of the p1d fitting model reveals highly significant effects for the first-order terms (p < 0.0001). Among the quadratic terms, X22 and X32 exhibit highly significant effects; X12 and X42 exhibit significant effects. The remaining terms do not indicate any significant effects (p > 0.05). The degree of influence of the four factors on p1d is indicated by the F-value: alkali content > steel slag content > water glass modulus > water–binder ratio. The significance test of the coefficients of the fitted model for p7d indicated that the effects of X1, X2, X4, X22, X32, and X42 were extremely significant, X3, X1X2, X1X4, and X12 were significant, and the remainder were not significant. The degree of influence of the four factors on p7d is indicated by the F-value: steel slag content > alkali content > water–binder ratio > water glass modulus. A significance test for the p28d fitting model coefficients revealed significant effects of X4, X12, X22, and X32. X1, X2, X2X3, X2X4, and X42 were significant, whereas the remainder were not significant. The degree of influence of the four factors on p28d is indicated by the F-value: water–binder ratio > steel slag content > alkali content > water glass modulus. In addition, the excellent reliability of the three equations is confirmed by the insignificance of the lack of fit.
The extent of the influence exerted by the interaction effects on the response value is effectively illustrated by the response surface and contour plot. A steeper surface slope and denser distribution of contour lines indicate a more pronounced influence of this interaction on the response value, thereby enhancing its significance [32]. No significant interaction effect was observed among the factors based on the results of the p1d variance analysis. The individual effects for each factor were highly significant, whereas their interaction effects were inadequately reflected, which could be attributed to the intense nature of the early hydration reactions. Through p7d variance analysis, a significant interaction was discovered between the steel slag content and alkali content, as well as between the steel slag content and water–binder ratio. Figure 6 indicates that when all other factors are held constant at their central values, the combined effect of the two factors significantly influences p7d. Based on the findings depicted in Figure 6a, a saddle-shaped trend characterized by an initial increase followed by a subsequent decrease as the alkali content increases is demonstrated when maintaining a constant steel slag content. Conversely, p7d gradually decreases as the steel slag content increases with fixed alkali content. Notably, at an alkali content of approximately 6%, p7d attains its maximum value at the minimum steel slag concentration. Based on the findings illustrated in Figure 6b, a gradual increase is exhibited by p7d as both the steel slag content and water–binder ratio decrease. Notably, when the minimum values are reached, the maximum value of p7d is attained. Through p28d variance analysis, a significant interaction was discovered between the water glass modulus and alkali content, as well as between the alkali content and water–binder ratio. Figure 7 displays the influence of the interaction between the two factors on p28d while holding all other variables constant at their central values. The variation in p28d with increasing water glass modulus under fixed alkali content conditions is displayed in Figure 7a, which indicates a saddle-shaped trend. Similarly, a saddle-shaped variation in p28d is also induced by an increase in the alkali content when the water glass modulus remains constant. At a water glass modulus of approximately 1.2, the maximum value of p28d is reached near an alkali content of 6%. Based on the findings depicted in Figure 7b, when the alkali content is held constant, a gradual decrease in p28d is observed as the water–binder ratio increases. Conversely, when the water–binder ratio remains constant, a saddle-shaped curve is formed as p28d initially increases and then decreases with increasing alkali content. The maximum value of p28d is attained near an alkali content of 6% at the minimum water–binder ratio.

3.2.3. Response Surface Optimization Results and Validation

Through the utilization of response surface methodology, the optimal design parameters and corresponding response values can be obtained by optimizing the material proportions. Because of the importance of the compressive strength in the early, middle, and late stages of the stone body, it is desirable for the response values p1d, p7d, and p28d to be maximized within the range of material proportions. One hundred recommended schemes were generated. To enhance the recycling rate of the steel slag, we adopted a high steel slag content and large response value principle based on an optimal solution. Referring to Figure 8, we identified the optimum composition as follows: a steel slag content of 38.60%, an alkali content of 6.35%, a water glass modulus of 1.23, and a water–binder ratio of 0.48. The predicted outcomes demonstrate that the compressive strength achieves values of 32.66 MPa, 50.46 MPa, and 56.87 MPa at 1 day, 7 day, and 28 day, respectively.
Based on the convenience of construction, the optimal combination ratio mentioned above could be cumbersome in practical implementation. Therefore, in this study, a steel slag content of 40%, alkali content of 6%, water glass modulus of 1.2, and water–binder ratio of 0.5 were selected as the ideal ratios. The results from the three sets of experiments were compared with the values predicted from the response surface model; the results are presented in Figure 9. Based on Figure 9, the maximum discrepancies between the experimental and model-predicted values are 8.28%, 4.57%, and 3.6% for the three sets, respectively. Notably, the maximum error of p1d remains within a reasonable range of 10%, whereas both p7d and p28d exhibit remarkably low errors, less than 5%. These findings strongly suggest that the response surface model exhibits exceptional accuracy in predicting results when compared with experimental data, thus demonstrating its practicality for material proportion design.

4. Microscopic Mechanism
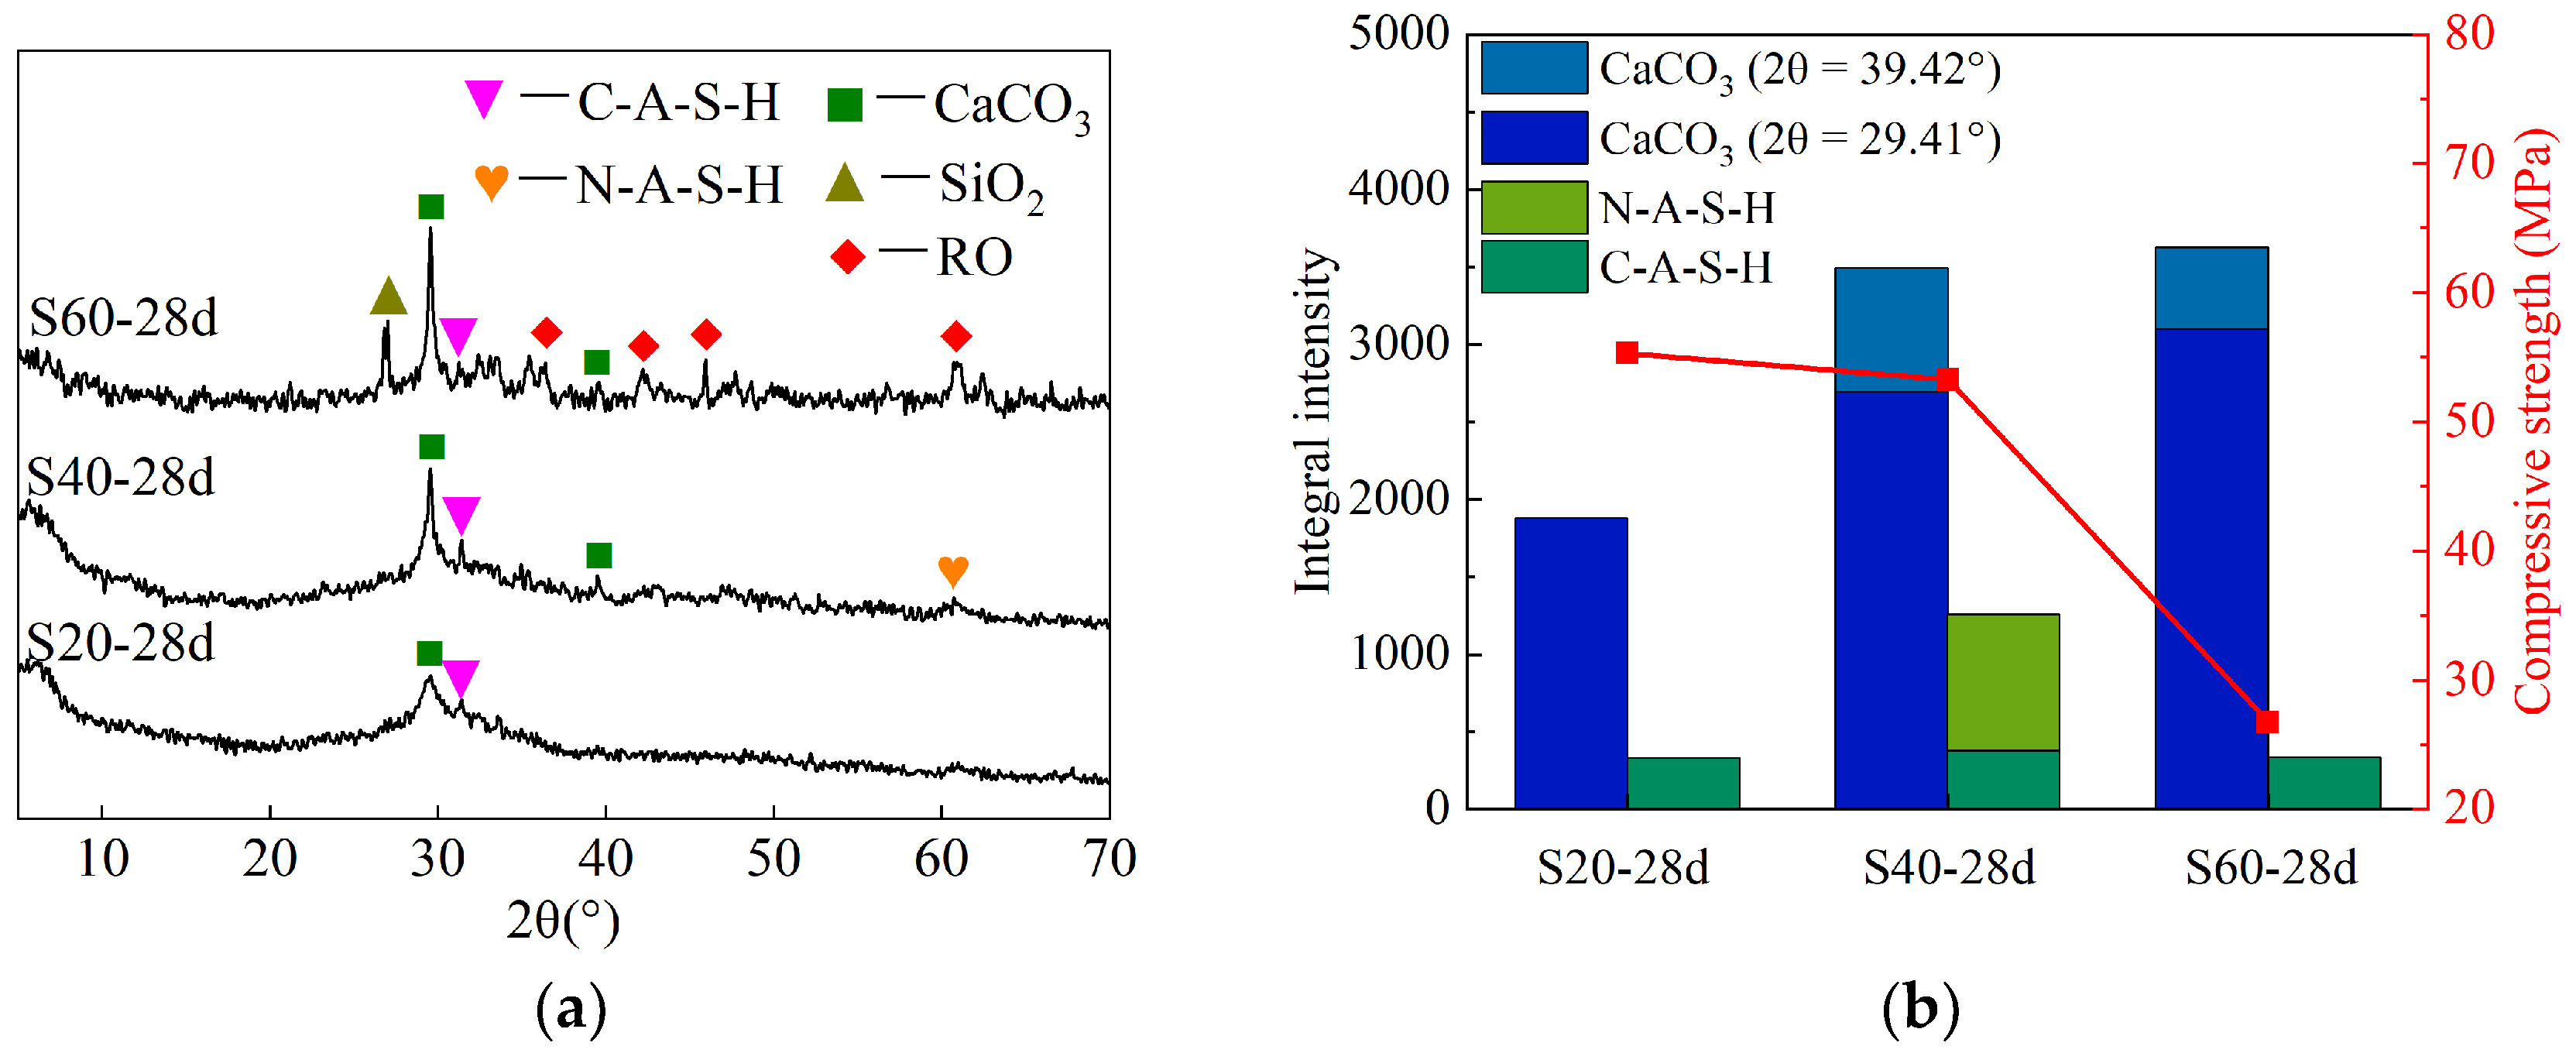
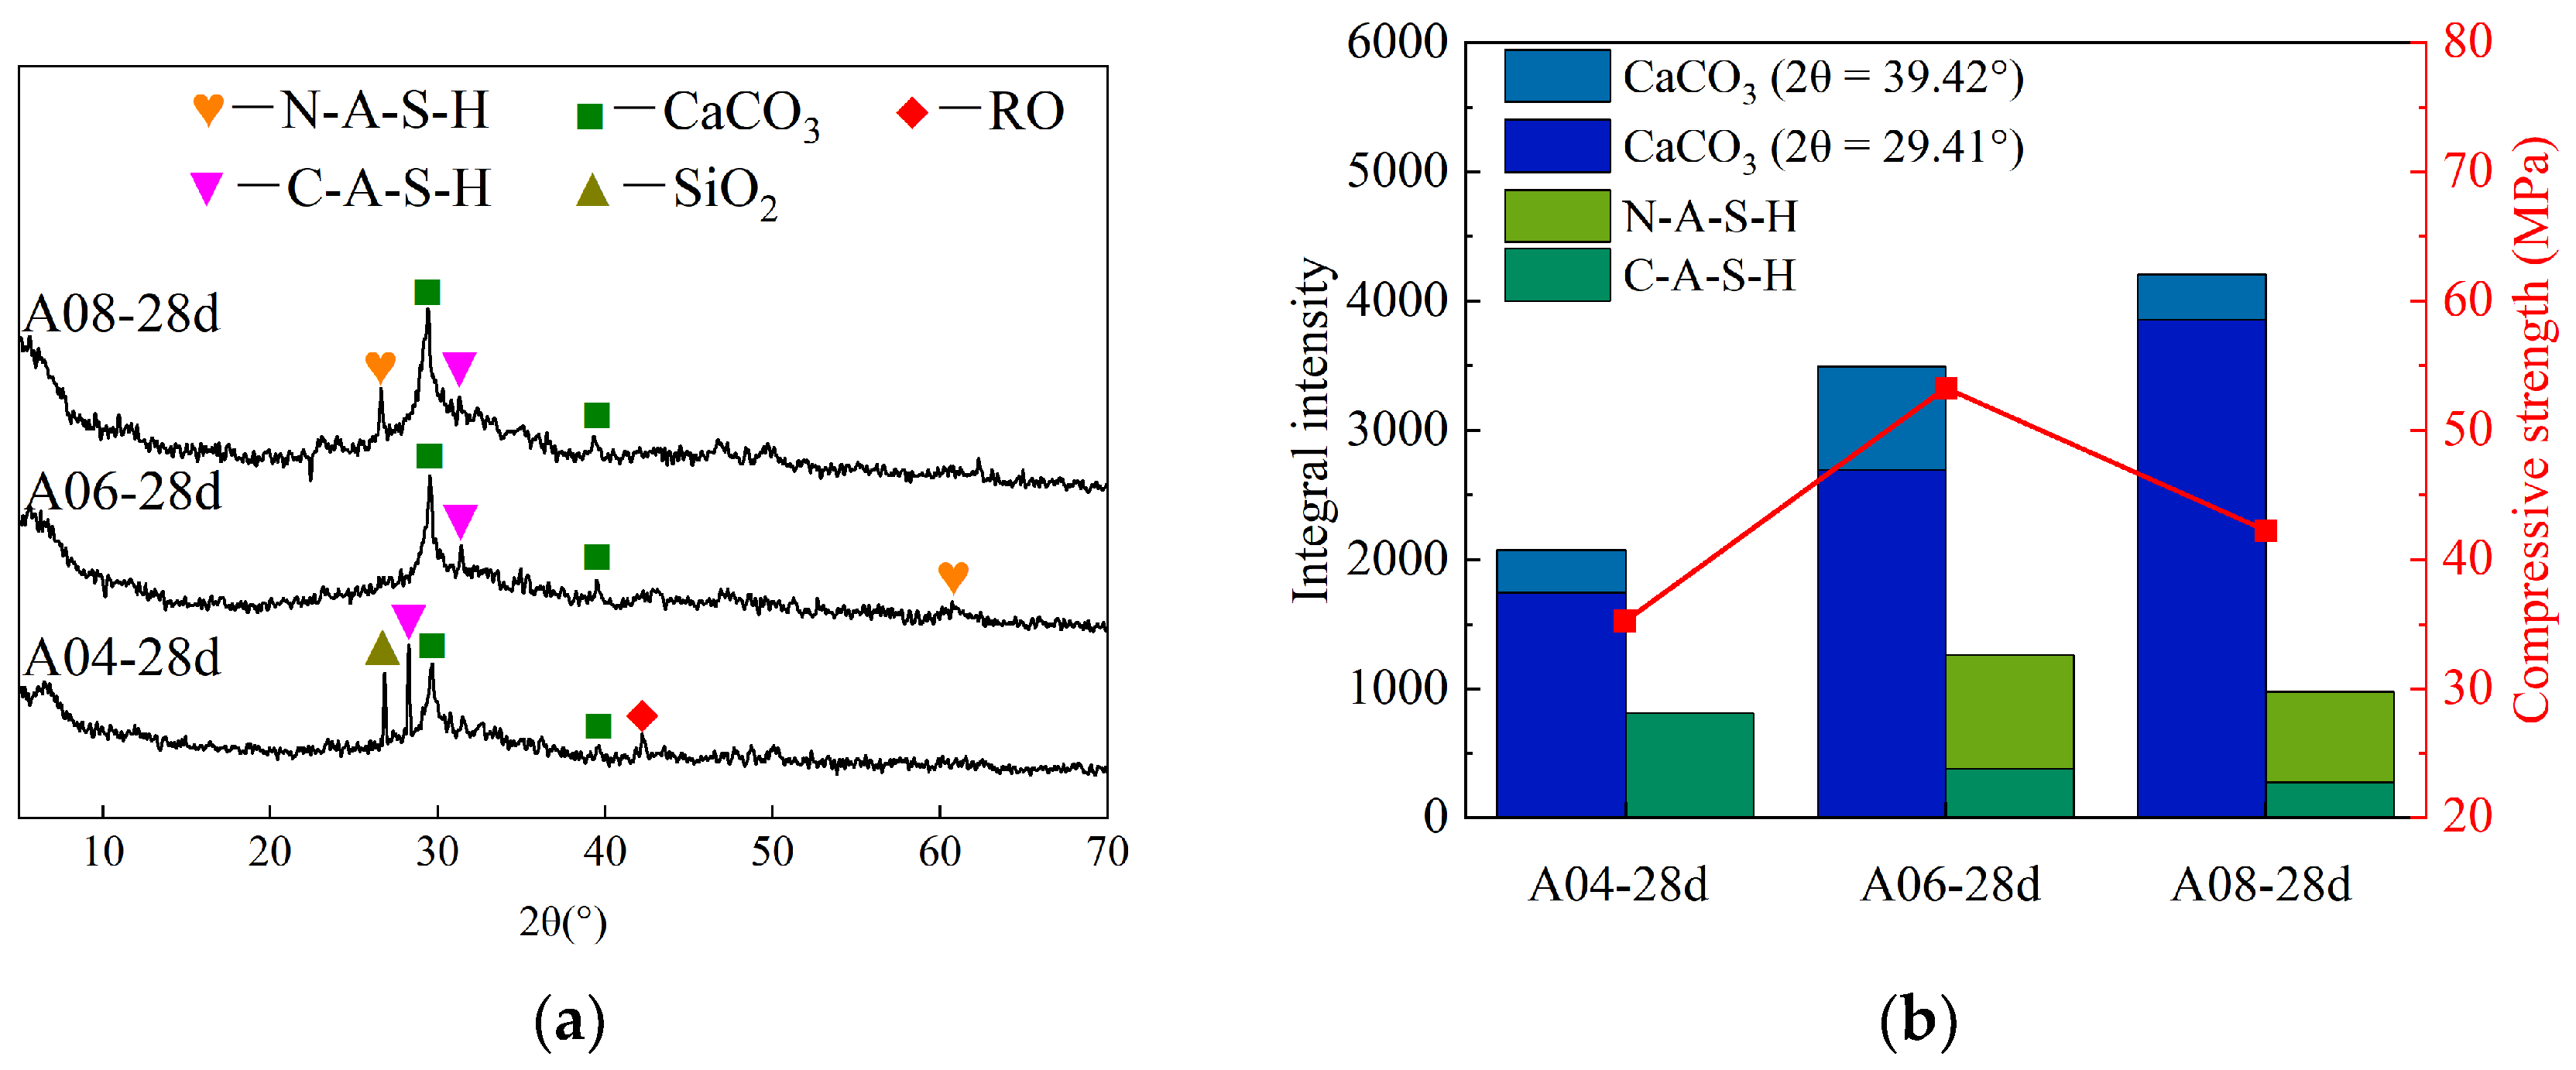
The compressive strength of stone bodies is closely related to the chemical bonding and filling density of the particles. Therefore, it is of significance to investigate the relationship between the compressive strength and hydration product content, in addition to pore volume, to reveal its micromechanism.
After a comprehensive study of the mechanical properties, it was observed that the steel slag content and alkali content significantly influenced the compressive strength at 1 day, 7 day, and 28 day. The influence of the water glass modulus on the compressive strength was relatively minor, whereas the water–binder ratio exhibited a substantial effect at 28 day. Investigations into the influence mechanism of the water–binder ratio on the compressive strength of diverse cementitious materials have reached a considerable level of maturity. Therefore, this section examines the influence of steel slag content and alkali content on the microstructure of stone bodies. The micro-test proportions are listed in Table 8.

4.1. XRD

The XRD patterns of the selected optimal mix ratios at different ages are displayed in Figure 10a. It is evident that SiO2, CaCO3, C2S, and Al2O3 are detected in the 1-day sample, primarily originating from the steel slag. Compared to the 1-day sample, peaks corresponding to C2S, SiO2, and Al2O3 are not observed in the 7-day and 28-day samples. Instead, weak C-A-S-H and N-A-S-H peaks appear at 31.4° and 60.9°, respectively. This phenomenon can be attributed to the dissolution of SiO2 and Al2O3 in the sample under alkaline conditions, which then combine with the Ca2+ and Na+ ions present in the system. Consequently, these components polymerize into a stable network structure forming a geopolymer gel. Because of its amorphous nature, only broad but short peaks are observable in the spectrum. Furthermore, during the hydration reactions, C2S actively participates in generating the calcium silicate gel (C-S-H) gel.
The variation in the integrated intensity of the XRD diffraction peaks can partially characterize the alteration in the material composition, and establishing a correlation with the macroscopic mechanical strength can facilitate a more profound understanding of the reaction mechanism underlying the materials [33]. The strength of alkaline-activated steel slag–slag materials primarily originates from two sources: the hydration gel resulting from the volcanic ash reaction and the geopolymer formed through geopolymerization. Among these, the quantity of hydration gel generated by the pozzolanic reaction is relatively small and exhibits strong dispersibility in the spectrum, which is not necessarily readily discernible in the XRD spectra. Consequently, the primary focus was to compare the integration of the geopolymer peak intensity with variations in the uniaxial compressive strength. In addition, because CaCO3 is the highest peak in the XRD spectrum and can serve as a nucleation site for cementitious materials to provide strength in the system, the integrated intensities of the CaCO3 and geological polymer diffraction peaks were compared with the uniaxial compressive strength of the corresponding samples at different ages, as indicated in Figure 10b. Based on the diagram, no readily apparent diffraction peak of the geopolymer can be observed at a curing age of 1 day. The compressive strength of the sample at this stage is mainly provided by the gel formed by the volcanic ash reaction. C-A-S-H and N-A-S-H gels are formed in the system during curing periods of 7 day and 28 day. As the curing period increases, the amount of polymer gel formed gradually increases. This is consistent with the variation pattern of the uniaxial compressive strength of the samples at different curing ages, indicating that the strength changes of the samples with different curing ages depend primarily on the geopolymerization reaction process. In addition, the peak intensity integral of CaCO3 changes only minimally in the early stage, yet increases significantly after 28 day of curing, which is likely due to the fact that more CaO in the system is converted into CaCO3 under the action of alkali and CO2 in the later stage. It is worth noting that there is no readily apparent correlation between the peak intensity integration and age change trend, indicating that the content of CaCO3 has a small influence on the compressive strength of the samples in this case.
The XRD patterns of samples with varying steel slag contents after 28 day are displayed in Figure 11a. It can be observed that a predominantly dispersed distribution is visible in the XRD spectrum when the steel slag content reaches 20%. Only one peak of CaCO3 and a minor C-A-S-H peak can be observed. This phenomenon can be explained by the fact that owing to lower steel slag content in the system, the volcanic ash reaction mainly occurs to generate C-S-H gel and undergoes a geopolymerization reaction under strong alkaline conditions to form C-A-S-H gel. When the steel slag content is 40%, compared to the S20 group, the XRD spectrum reveals the presence of N-A-S-H gel. This can be attributed to a reduction in the slag content, resulting in decreased active substances within the system and subsequently reducing gel formation from the volcanic ash reaction. Consequently, the increased participation of Ca2+, silicate ions, and aluminate ions in the geopolymerization reactions leads to the emergence of N-A-S-H and a higher abundance of C-A-S-H. When the steel slag content reaches 60%, in addition to the presence of a CaCO3 peak and C-A-S-H phase, a significant abundance of RO phase and SiO2 can also be observed in the spectrum. This can be attributed to the excessive steel slag content resulting in an augmented presence of the unreacted RO phase and SiO2 crystals within the system. Based on the results displayed in Figure 11b, it is evident that an increase in steel slag content from 20% to 40% leads to a significant enhancement in the peak integration of CaCO3. However, when the steel slag content further increases from 40% to 60%, the subsequent increase in peak integration of CaCO3 becomes relatively marginal. This phenomenon can be attributed to the higher proportion of slag present in the S20 samples, where a substantial amount of Ca2+ reacts with active SiO2, forming a C-S-H gel that impedes subsequent carbonation reactions. Consequently, within this particular group of samples, the CaCO3 primarily originates from the steel slag. Conversely, both the steel slag and carbonation pathways contribute to the formation of CaCO3 in the S40 and S60 groups, resulting in a significantly higher diffraction peak intensity than that observed for the S20 group. The integral of the peak strength of the geopolymer exhibits an initial increase followed by a subsequent decrease with increasing steel slag content, whereas the compressive strength of the samples demonstrates a marginal decline followed by a sharp reduction. This disparity can be attributed to the fact that in this case, the compressive strength of the samples is determined by both the generated hydration gel and geopolymer. When the steel slag content is 20%, the system exhibits elevated levels of active SiO2 and Al2O3, with the strength primarily attributed to gels formed through volcanic ash reactions. However, at steel slag contents of 40% and 60%, there is a decline in active components within the system, leading to a reduction in the compressive strength of the samples. Notably, Group S40 experiences a relatively minor decrease in strength compared with the significant decrease observed in Group S60. This phenomenon can be ascribed predominantly to the increased formation of geopolymers within Group S40. In addition, CaCO3 in the S40 group provides nucleation sites for the formation of hydrated gel and has a supporting role in enhancing the strength of the specimens. However, in the S60 group, owing to the low slag content, the quantity of gel generated from the volcanic ash reaction is limited and the presence of CaCO3 crystals also has a limited promoting effect on the strength growth (as indicated in Figure 4). Therefore, the 28-day strength of the specimens is influenced by the combined effects of the hydration gel, polymer gel, and CaCO3 crystal content at different steel slag blending ratios.
Figure 12a displays the XRD patterns of samples with varying alkali contents. The figure indicates that at an alkali content of 4%, the spectrum predominantly exhibits SiO2, CaCO3, C-A-S-H, and RO phases, which primarily originate from steel slag. When the alkali content is 6% and 8%, in comparison to Group A04, the peaks of SiO2 and RO are absent in the spectrum, whereas there is an increase in the peaks of N-A-S-H. This phenomenon can be primarily attributed to the incomplete dissolution of SiO2 and RO phases in steel slag due to the low alkali content, as well as the influence of low alkali concentration on reactions involving volcanic ash and geopolymerization. Consequently, in the A04 group with lower alkali content, a high concentration of Ca2+ is observed, primarily accompanied by the C-A-S-H gel peak. Meanwhile, the A06 and A08 groups with sufficient alkali content exhibit both C-A-S-H and N-A-S-H gel peaks.
Based on the results displayed in Figure 12b, the integrated intensity of the CaCO3 diffraction peak indicates a continuous increase with increasing alkaline content. This phenomenon can be attributed to the facilitation of OH and Ca2+ combination within the system due to the alkali addition, leading to the formation of Ca(OH)2. Subsequently, this compound reacts with atmospheric CO2, generating CaCO3. In addition, as the alkali dosage increases, the diffraction peak intensity of the gel gradually increases, followed by a subsequent decrease. This observation aligns with the trend observed in the compressive strength variations, suggesting that the compressive strength of the sample is predominantly influenced by the quantity of gel formed within the system.

4.2. SEM

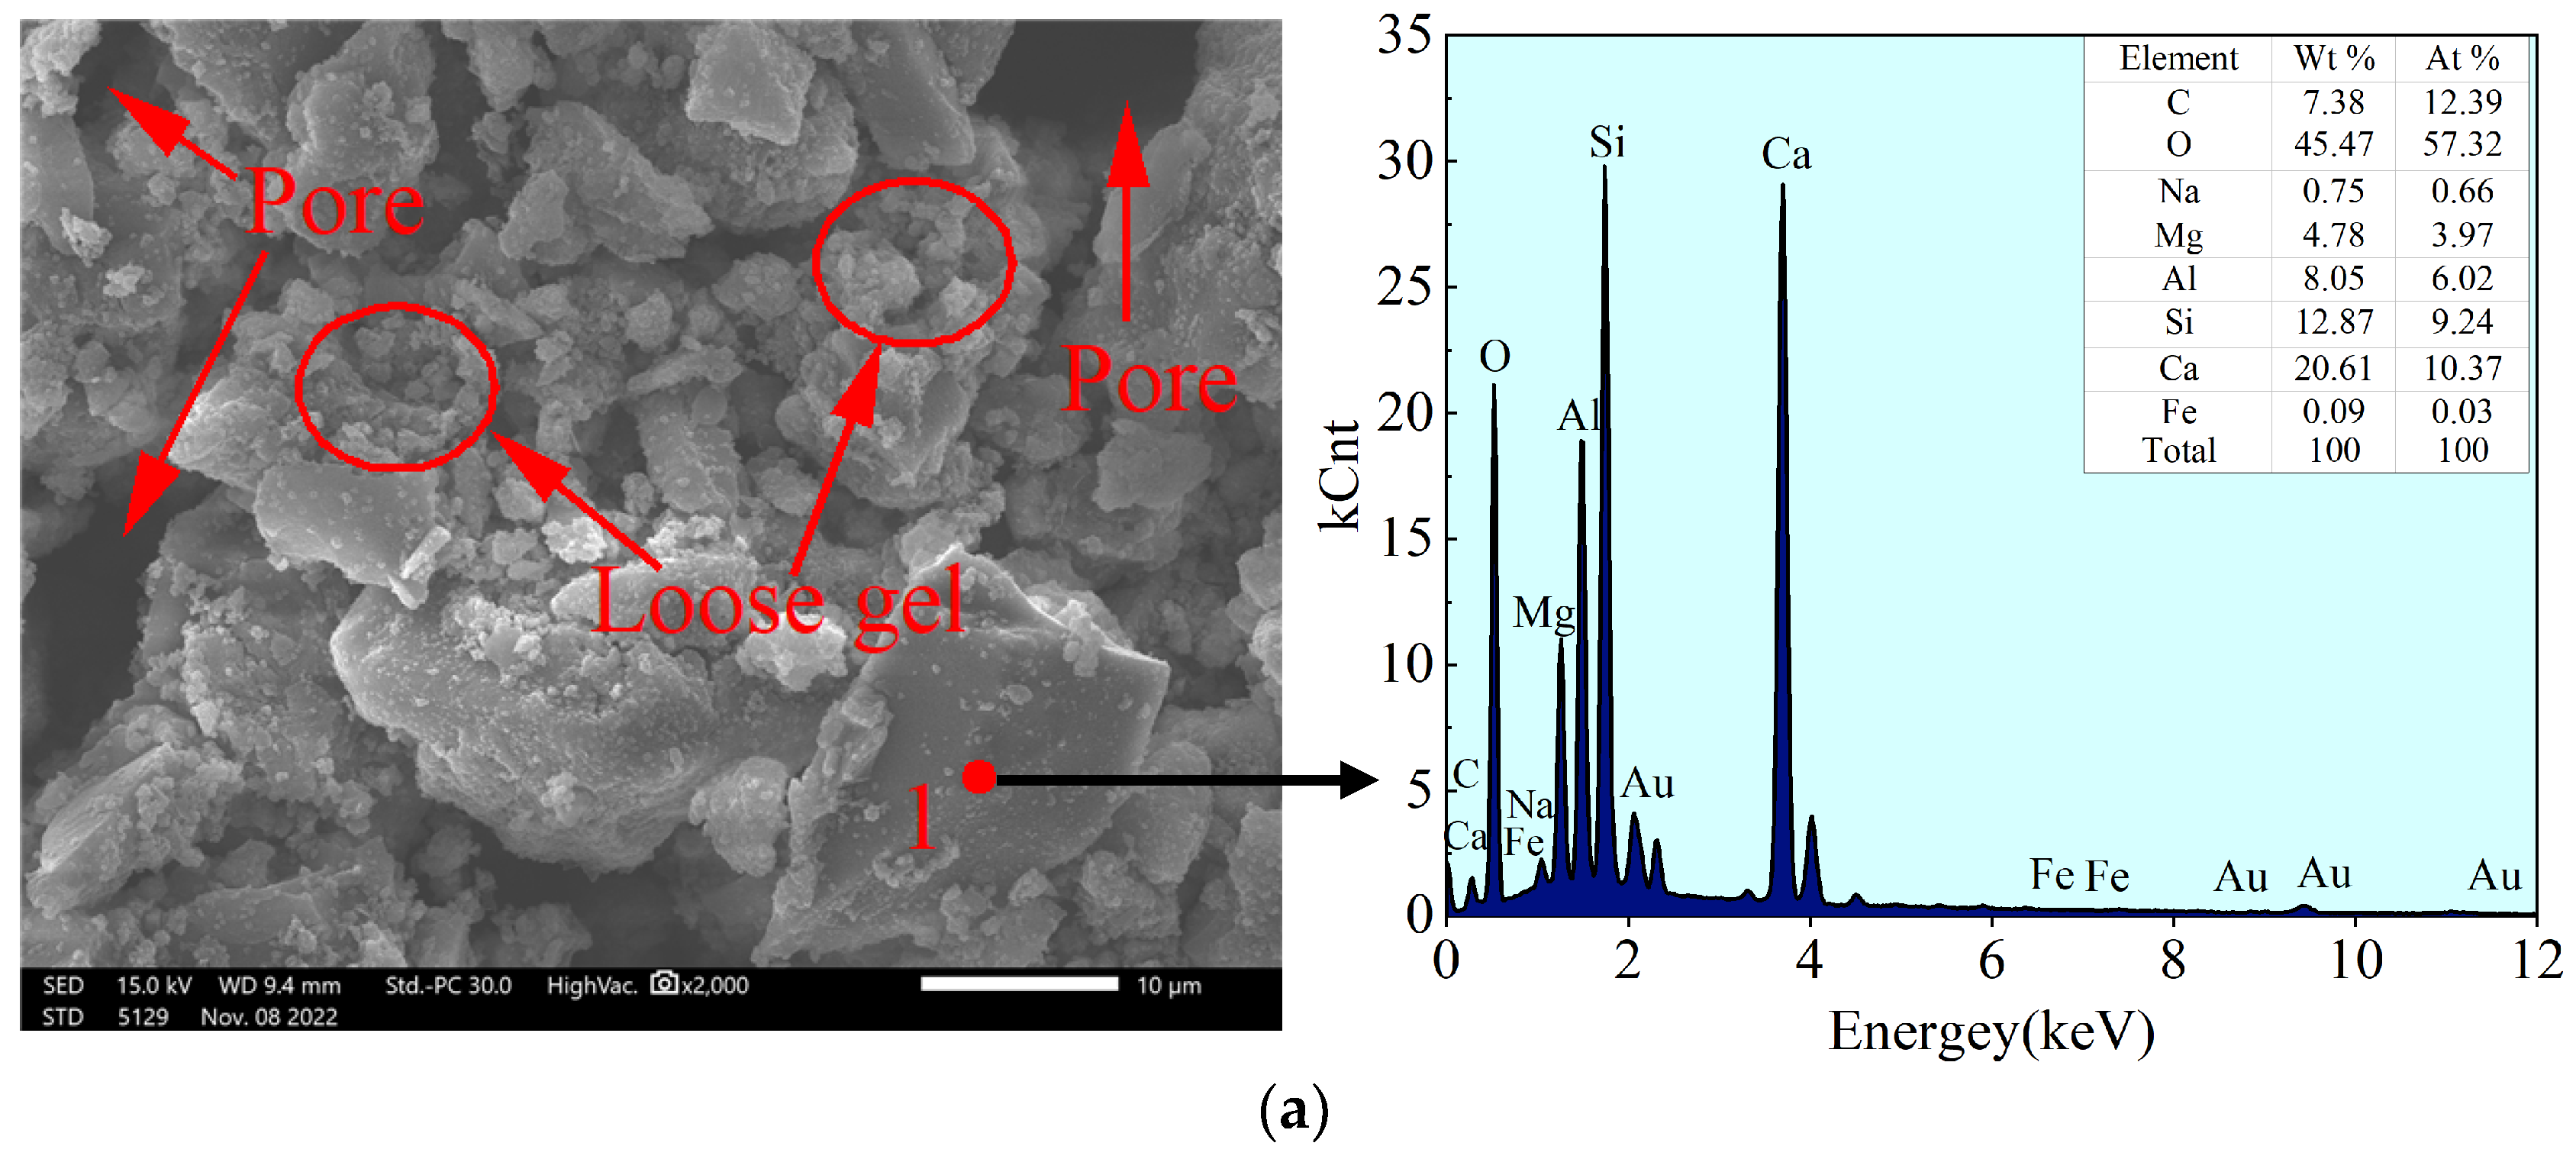
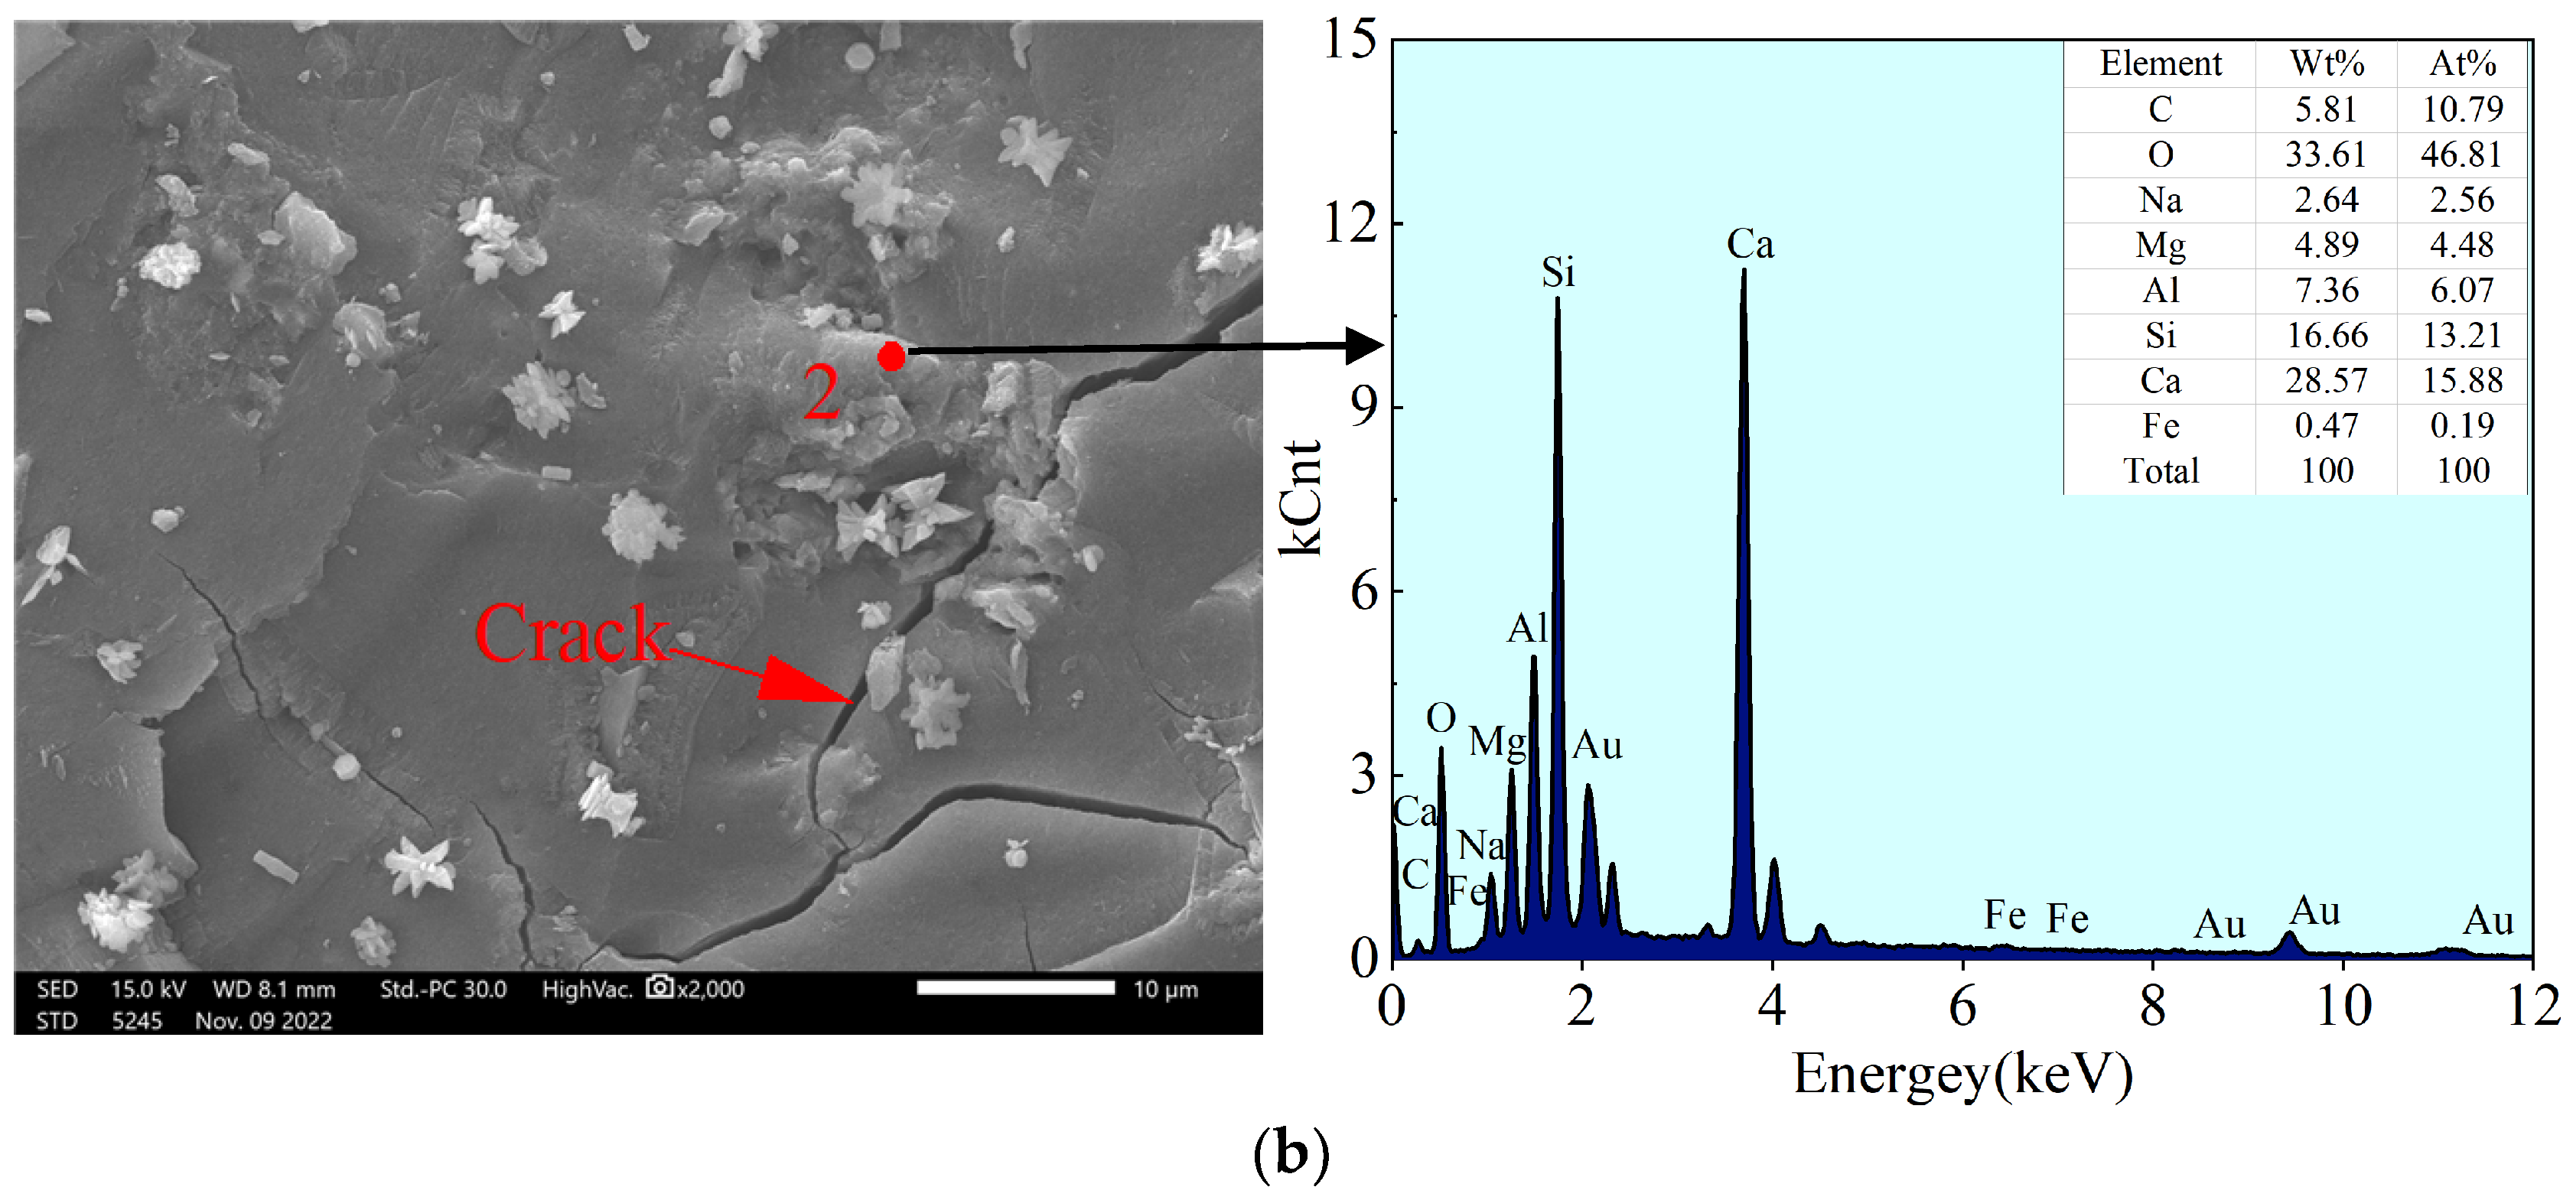
4.2.1. Morphology and Energy Spectrum Analysis

Scanning electron microscopy (SEM) enables the observation of the microstructure and morphology of samples. Samples with low strength often have loose microstructures with a large number of pores or cracks, and they are also more prone to developing pores and cracks during the vacuum process. The scanning electron microscopy with energy-dispersive spectroscopy (SEM-EDS) images of the S40 group samples at different ages are displayed in Figure 13. An analysis of Figure 13a reveals the presence of numerous pores and formation of loosely structured hydrated gels in the composition of the samples during the initial 1-day period. Based on the energy spectrum analysis, the predominant constituents identified at Point 1 include Ca, Si, Al, and Mg. Based on the XRD analysis findings, it can be inferred that the material present at this location corresponds to unreacted steel slag particles. In Figure 13b, small cracks and a dense gel are discernible. Energy spectrum analysis reveals that Point 2 primarily consists of Ca and Si, exhibiting a Ca–Si atomic ratio of 1.2, Na–Si ratio of 0.19, and Si–Al ratio of 2.18. Based on these findings, it can be inferred that the substance is a double silicon–aluminum-type (-Si-O-Al-O-Si) geopolymer. The reactions are represented by Equations (5)–(7). Under highly alkaline conditions, active SiO2 and Al2O3 dissolve and condense to form an N-A-S-H geopolymer. In addition, within this system, Ca2+ ions partially replace Na+ through ion exchange, resulting in the formation of an (N, C)-A-S-H geopolymer [34,35]. However, an excessive amount of Ca2+ leads to a decreased degree of polymerization of (N, C)-A-S-H, transforming into a low-polymerized C-A-S-H geopolymer instead [36,37]. It can be inferred that during the initial stages, the sample primarily undergoes a volcanic ash reaction resulting in the formation of a loose C-S-H gel and abundance of pores within the system. This leads to a decrease in the compressive strength of the stone body. However, as the curing progresses, a geopolymerization reaction occurs within the system, yielding a substantial amount of dense geological polymer gel. This process further refines the pore structure and enhances the compressive strength of the stone body. These findings are in acceptable agreement with the XRD results.
n ( SiO 2 , Al 2 O 3 ) + 2 nSiO 2 + 4 nH 2 O + NaOH ( Na + ) + n ( OH ) 3 - Si - O - ( - ) | Al | ( OH ) 2 - O - Si - ( OH ) 3
n ( OH ) 3 - Si - O - ( - ) | Al | ( OH ) 2 - O - Si - ( OH ) 3 + NaOH ( Na + ) ( - Si - | O | - Al - | O | - Si - | O | - ) + 4 nH 2 O
( Na + ) ( - Si - | O | - Al - | O | - Si - | O | - ) + Ca 2 + ( Na + , Ca 2 + ) ( - | Si | - O - Al - O - | Si | - O - )
The SEM-EDS images of samples with varying steel slag contents after 28 day of curing are presented in Figure 14. From Figure 14a, it can be observed that at a steel slag content of 20%, the sample surface exhibits a dense morphology without any discernible porous structure, accompanied by scattered C-S-H gel resulting from the volcanic ash reaction. The energy spectrum of Point 3 indicates that the predominant components at this location are Ca and Si with a Ca–Si atomic ratio of 1.19, Na–Si ratio of 0.38, and Si–Al ratio of 2.51. Compared with the S40-28d group displayed in Figure 13b, there is a marginal decrease in the Ca–Si ratio, whereas an increase can be observed in both the Na–Si and Si–Al ratios within this sample. These findings suggest that this point represents a compact system formed through the intricate interweaving of geological polymers and hydrated calcium silicate gel with a heightened affinity for binding Na+ ions in the generated (N, C)-A-S-H geopolymer matrix. Consequently, this sample exhibits superior uniaxial compressive strength compared to that of the S40-28d group. Based on the results in Figure 14b, it can be concluded that when the steel slag content reaches 60%, the surface of the specimen appears as a loose structure containing a large number of pores after curing for 28 day. The energy spectrum at this point indicates the predominant presence of Ca and Si, exhibiting a remarkably high atomic ratio of 1.93 between the Ca and Si. It is postulated that this particular point could represent a composite resulting from the adhesion of the C-S-H gel formed through the volcanic ash reaction along with CaCO3 particles originating from the steel slag. By observing the microstructures of the samples with different steel slag contents, an increase in the steel slag content can be observed resulting in a gradual increase in the number of pores within the sample, leading to a more porous structure and subsequently causing a decrease in compressive strength.
The SEM-EDS images of samples with different alkali contents after 28 day of curing are displayed in Figure 15. An analysis of Figure 15a reveals the emergence of a multitude of cracks of varying size, on the surface of the sample when the alkali content is 4%. The spectrum obtained at Point 5 indicates a predominance of Ca and Si, with a Ca–Si atomic ratio of 0.94, which is similar to that of hydrated calcium silicate. Therefore, it can be inferred that this point corresponds to the C-S-H gel formed by the volcanic ash reaction, which can encapsulate and bond steel slag particles that are difficult to react with [38]. However, owing to their inherently low strength and weak structural nature, cracks of varying size could appear in the sample [39,40]. Based on the observation results in Figure 15b, a small number of cracks appeared in the sample structure when the alkali content was 8%. This phenomenon can be attributed to an excessive concentration of alkali, which accelerates the rate of hydration reaction and impedes timely diffusion, leading to an uneven distribution of hydration products and ultimately resulting in crack formation. Based on the energy spectrum analysis of Point 6, elements such as Ca, Si, Na, and Al predominantly comprise this particular location. Notably, the Ca–Si atomic ratio is 0.83, which aligns with the composition of the C-S-H gel. Furthermore, a Si–Al ratio of 2.08 and Na–Si ratio of 0.82 suggest the presence of a double silicon–aluminum-type N-A-S-H geopolymer formation. Consequently, it can be inferred that Point 6 represents a combination of the C-S-H gel formed through the volcanic ash reaction and N-A-S-H gel generated via geopolymerization reaction.

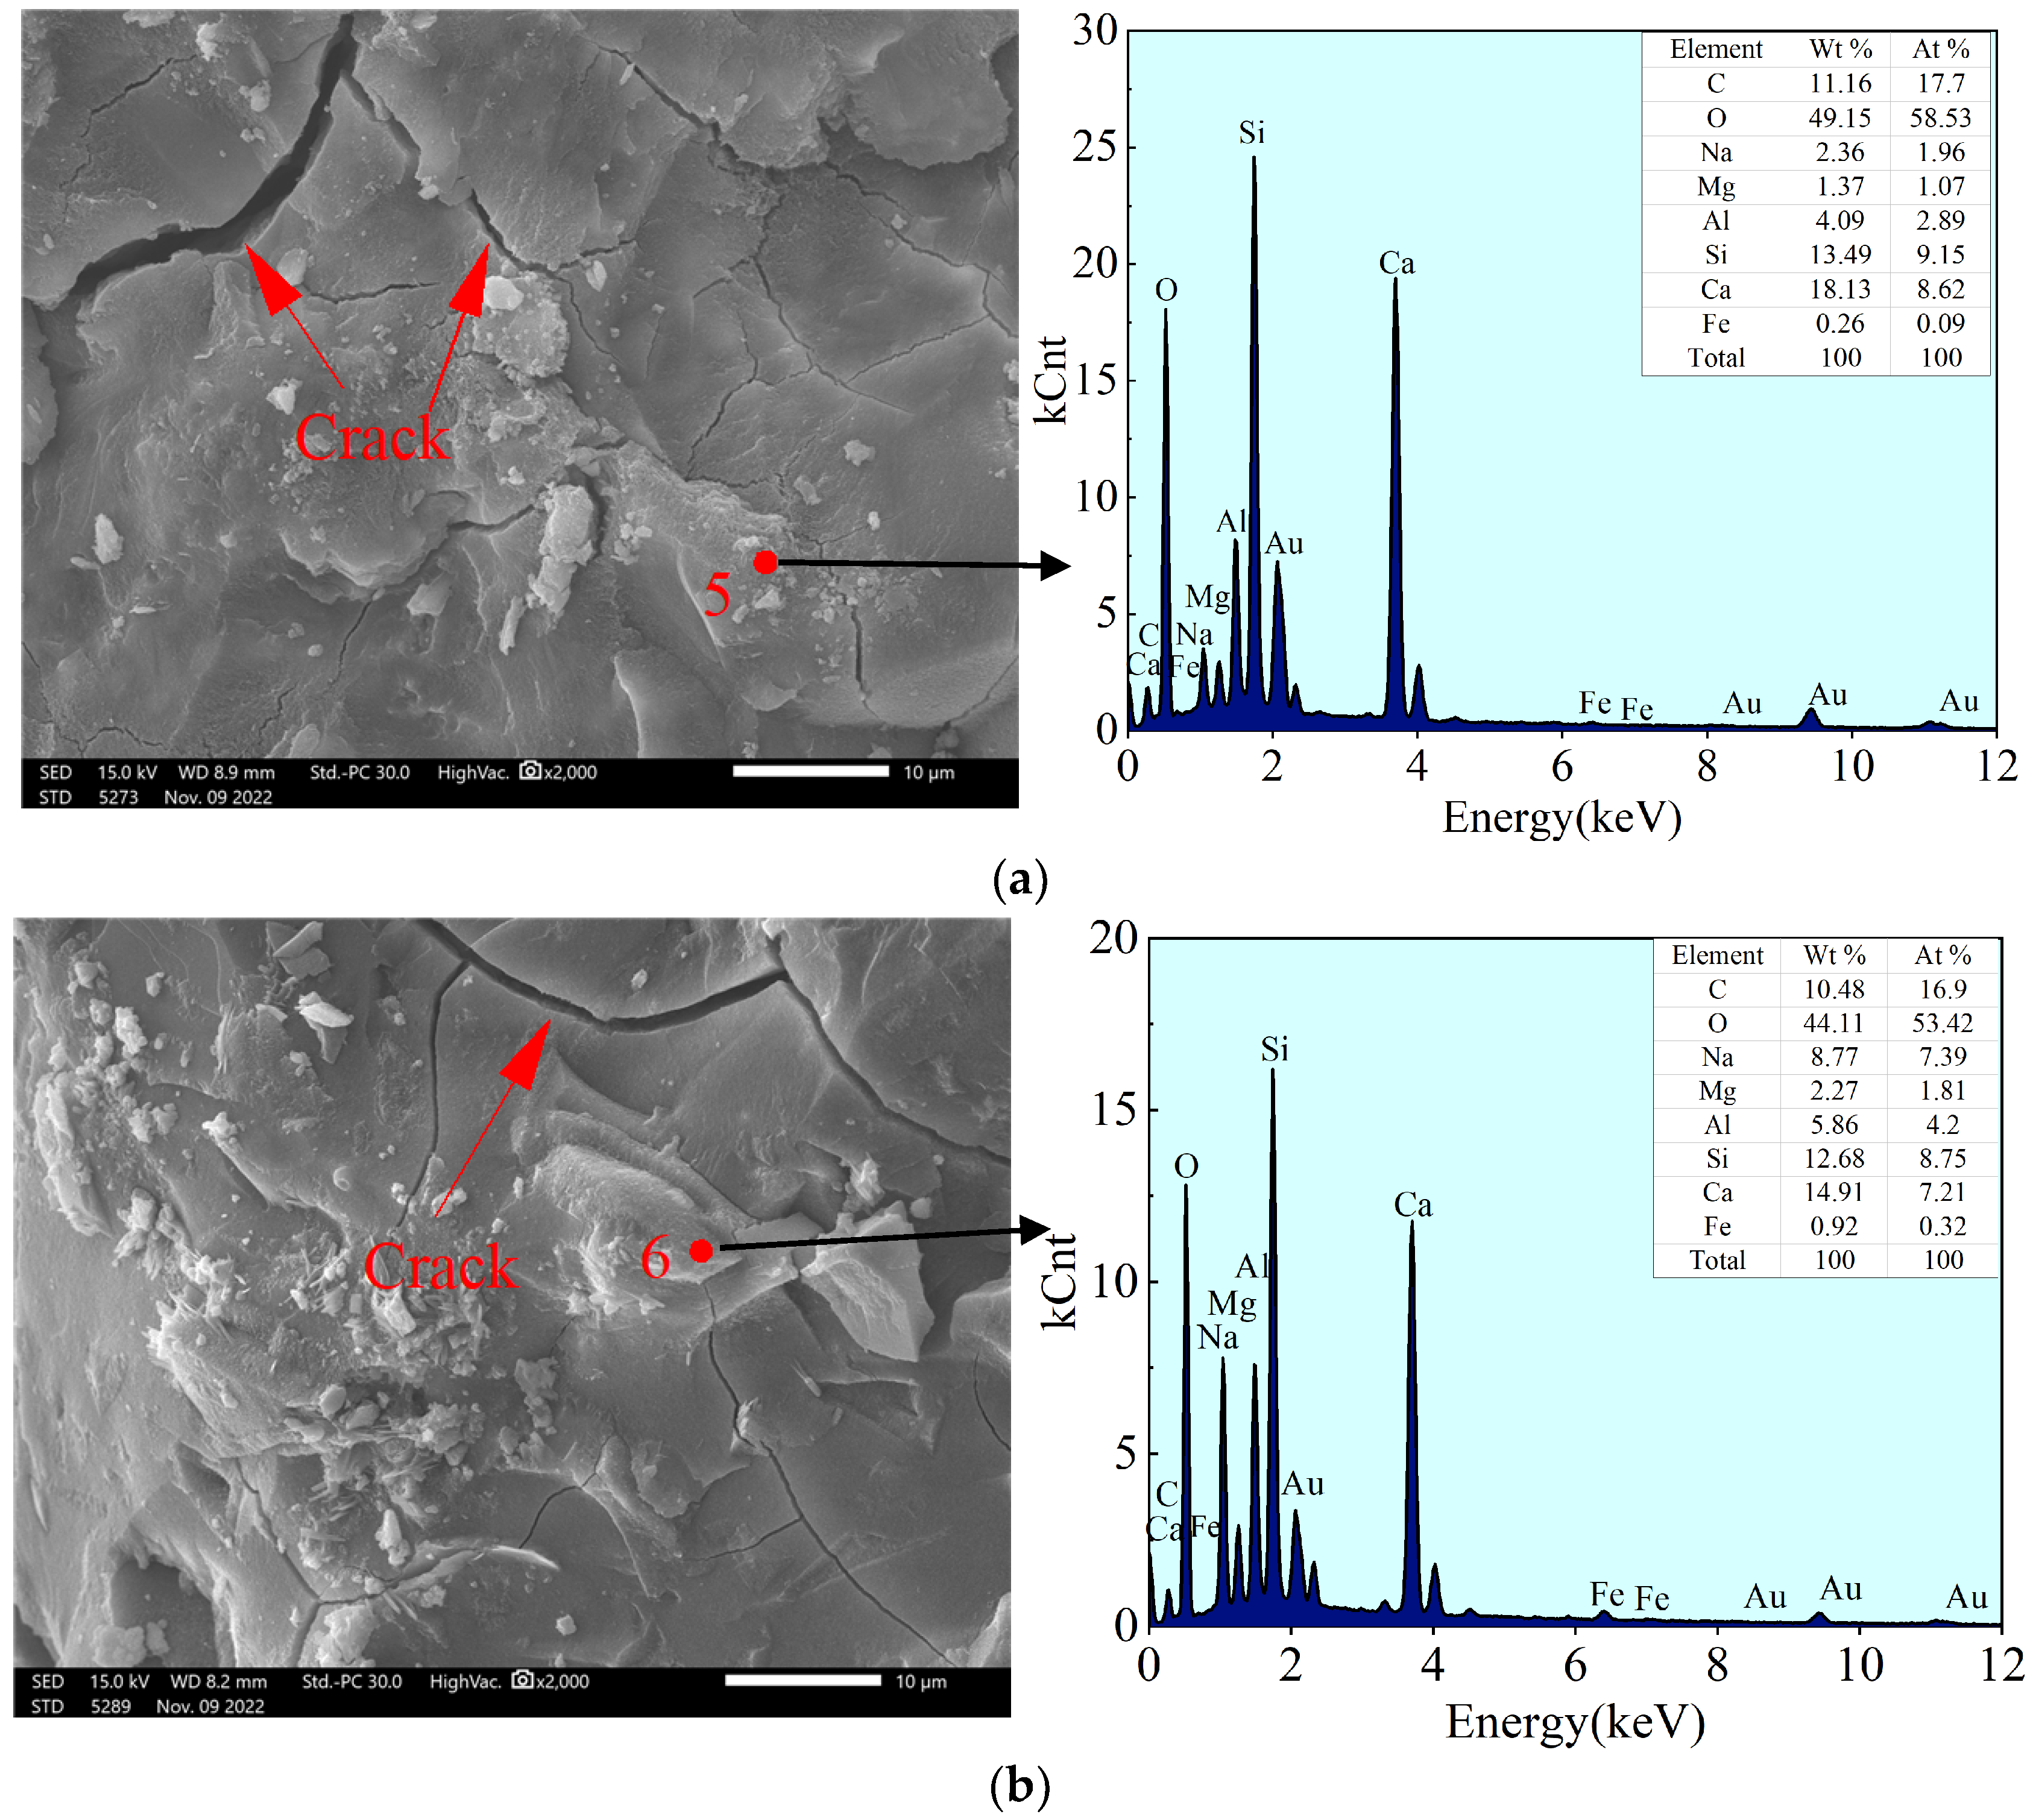
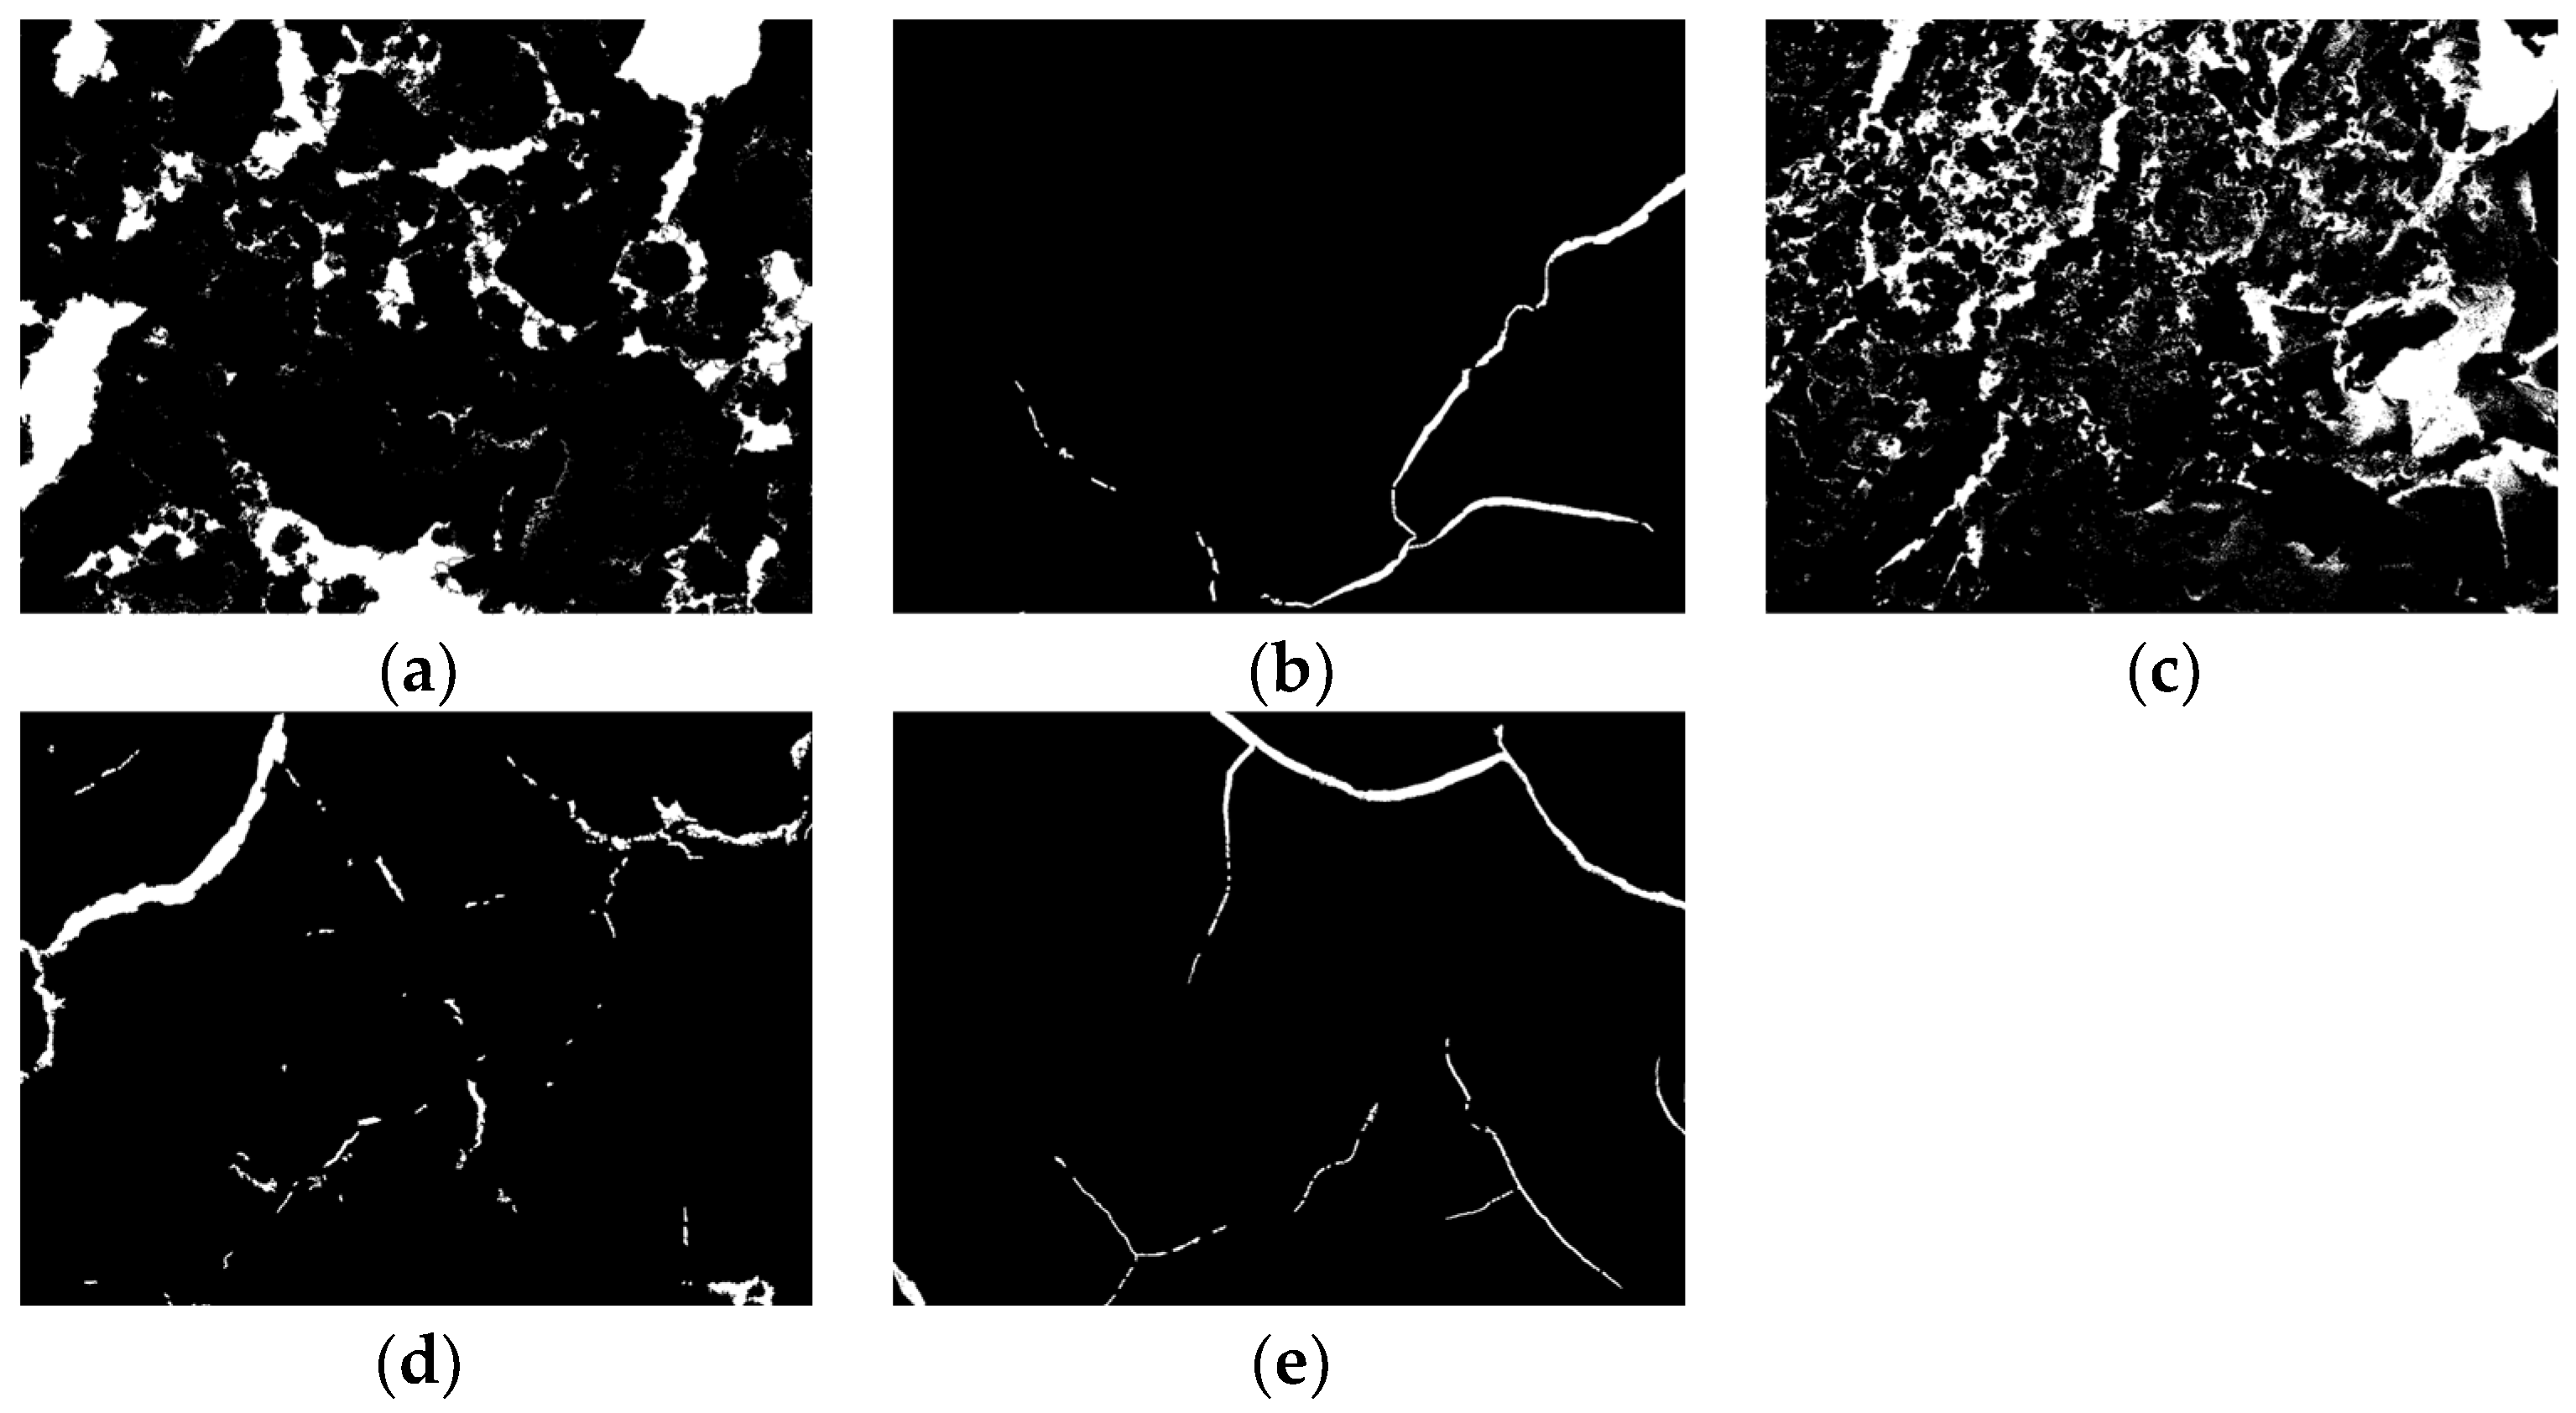
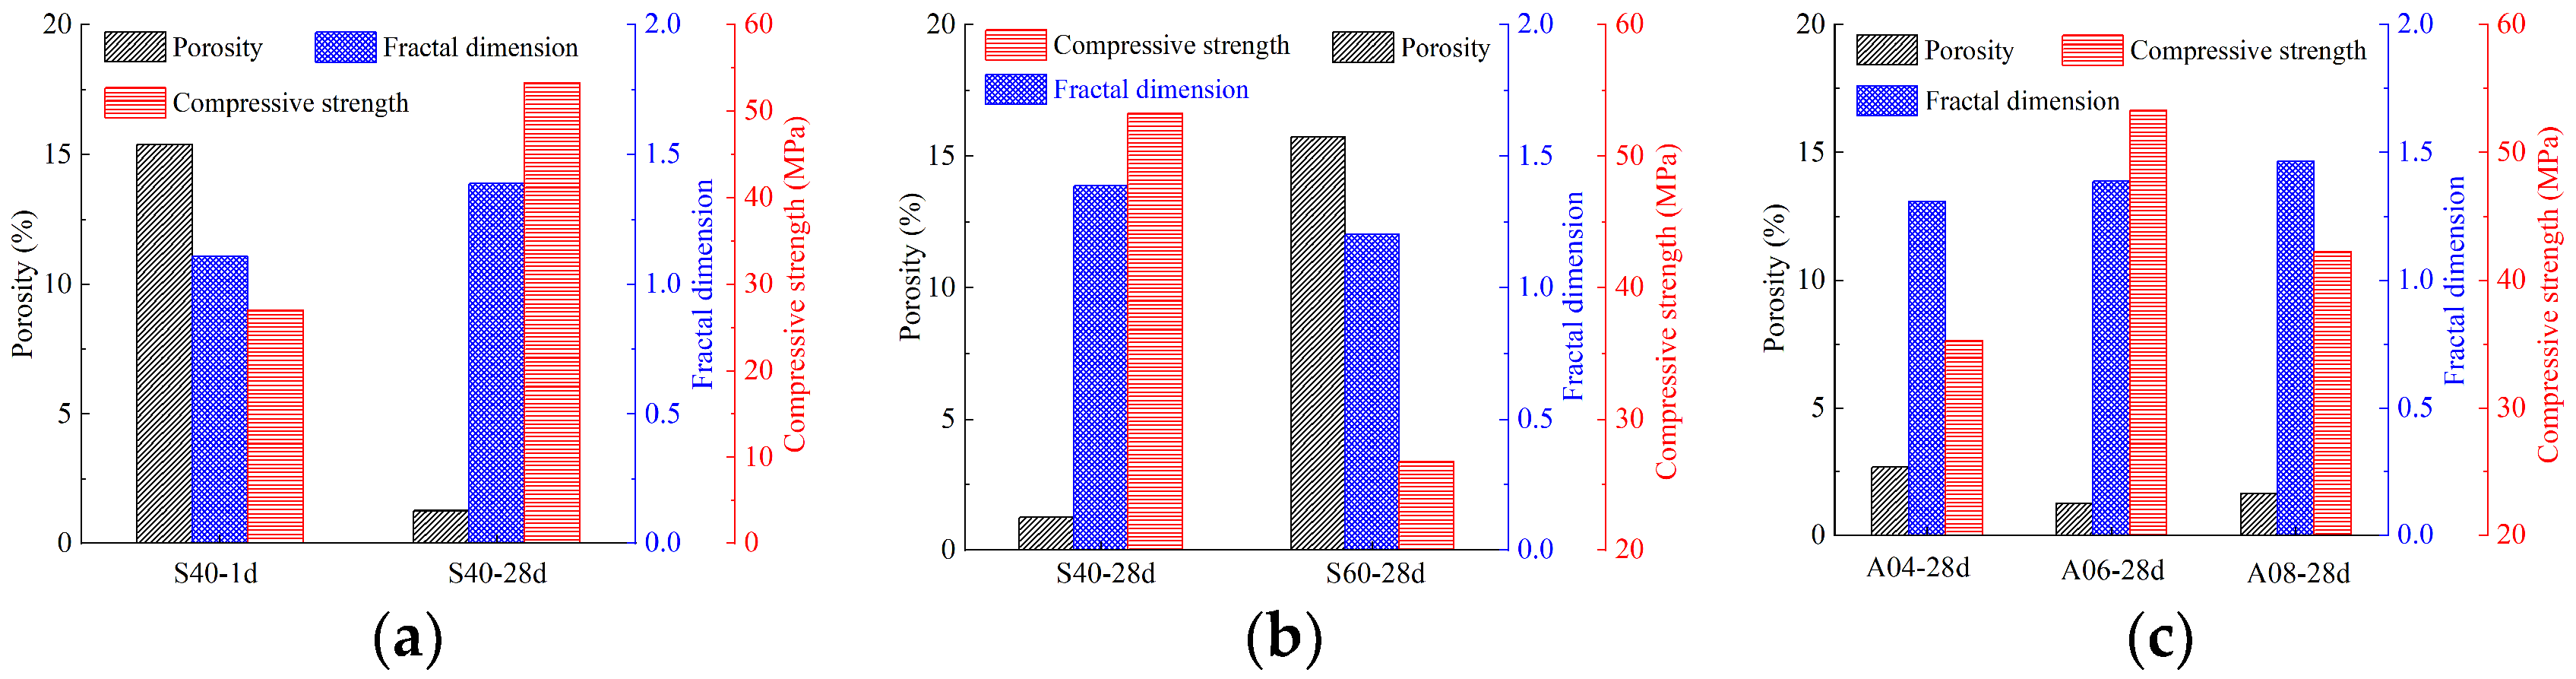
4.2.2. Pore (Crack) Gap Structure

The Particle and Crack Image Recognition and Analysis System V2.3 (PCAS) is software designed specifically for the identification and quantitative analysis of pore and crack systems. The system can automatically identify different types of pores and cracks in images and can obtain statistical parameters of microscopic pores (cracks) [41]. The PCAS system was used to perform binarization processing on a 2000-times magnified scanning electron microscope image; the processed results are displayed in Figure 16. In this figure, the white areas represent pores or cracks. After careful examination of the diagrams, it can be deduced that a porous structure is shown by graphs depicting a shorter curing age in Figure 6a and a higher steel slag content in Figure 16c, whereas a fissure structure is exhibited by the remaining three graphs. This observation suggests that loose microstructures characterized by numerous pores are exhibited by components with lower strength, whereas dense microstructures with minimal cracks are exhibited by components with higher strength. The relationships among the porosity, fractal dimension, and compressive strength of the specimens are displayed in Figure 17. The graph indicates an inverse correlation between the porosity and compressive strength. The fraction with high porosity generated less gel, which made the internal structure of the stone loose, resulting in low compressive strength. This indicates that the level of porosity is a direct factor affecting the compressive strength of the sample. The fractal dimension of the pores serves as a quantitative measure for assessing the level of complexity within pore systems, where a higher fractal dimension signifies a more intricate pore distribution throughout the system. Figure 17a,b show that the fractal dimension of the pores has a similar variation trend with the compressive strength, indicating that the fractal dimension of the pores may also affect the compressive strength of the specimen to some degree. However, according to Figure 17c, it is found that as the amount of alkali added increases, the fractal dimension of the pores also increases, but the compressive strength of the specimen follows a pattern of initial increase and then decrease, with the change in compressive strength mainly corresponding to the porosity. This observation suggests that changes in the compressive strength are primarily influenced by the porosity; the pore fractal dimension follows suit.

5. Discussion

The alkali-activated steel slag–slag cementing material has the potential to replace cement and has been widely studied by scholars in recent years. The active silica and alumina content in steel slag is lower than that in slag, and the addition of steel slag will theoretically reduce the compressive strength of the sample. However, this study found that the addition of suitable steel slag can improve the strength to a certain extent, and Song et al. [42] and Shi et al. [43] also reached the same conclusion. The presence of this phenomenon is due to the high content of insoluble materials, primarily calcium carbonate, within the steel slag. These substances serve as nucleation sites, thereby mitigating the strength loss that results from the contraction of the gel. In addition, combined with the microscopic tests and the studies of Liu et al. [39] and Wang et al. [40], it can be inferred that the strength of the alkali-activated steel slag–slag cementitious materials primarily originates from the formation of C-S-H gel through the volcanic ash reaction and geopolymer gel via the geopolymerization reaction. At present, there are few reports on the microscopic reaction process of the alkali-activated steel slag–slag cementitious materials system. Based on the strength variation, micro-products, and microstructural changes of the above-mentioned cementitious materials, and referring to the MgO-solidified soil model proposed by Cai et al. [44], a microreaction model for alkali-activated steel slag and slag is presented in Figure 18. After the introduction of alkaline activators and water into the steel slag–slag system, soluble substances dissolve within the steel slag–slag matrix, whereas the insoluble substances act as nucleation sites for gel growth, providing strength assistance to the system. In this system, under the action of alkaline activators, the dissolved active SiO2 undergoes a volcanic ash reaction to generate C-S-H gel. Under highly alkaline conditions, the remaining active SiO2 and Al2O3 react to form silicate [Si(OH)4] and aluminate [Al(OH)4] [45]. With increased curing time, [Si(OH)4] and [Al(OH)4] in the system undergo agglomeration reactions with alkali metal cations such as Na+ and Ca2+, resulting in the formation of geopolymer gels. These gels subsequently bond with the early formed C-S-H gels, constructing a compact structural network to achieve alkali-activated gel materials characterized by high density and strength.

6. Conclusions

The influence of the steel slag content, alkali content, water glass modulus, and water–binder ratio on the compressive strength of alkali-activated steel slag–slag cementitious materials was systematically investigated in this study using a single-factor experimental approach. Appropriate levels of factors were selected based on the outcomes of these individual experiments, and the mechanical properties of the cementitious material were optimized using the Box–Behnken design in response surface methodology. The experimental findings obtained from XRD and SEM-EDS were comprehensively analyzed qualitatively and semi-quantitatively, delving into the intricate microreaction mechanisms underlying these observations. The main conclusions drawn from the experimental results are as follows.
(1)
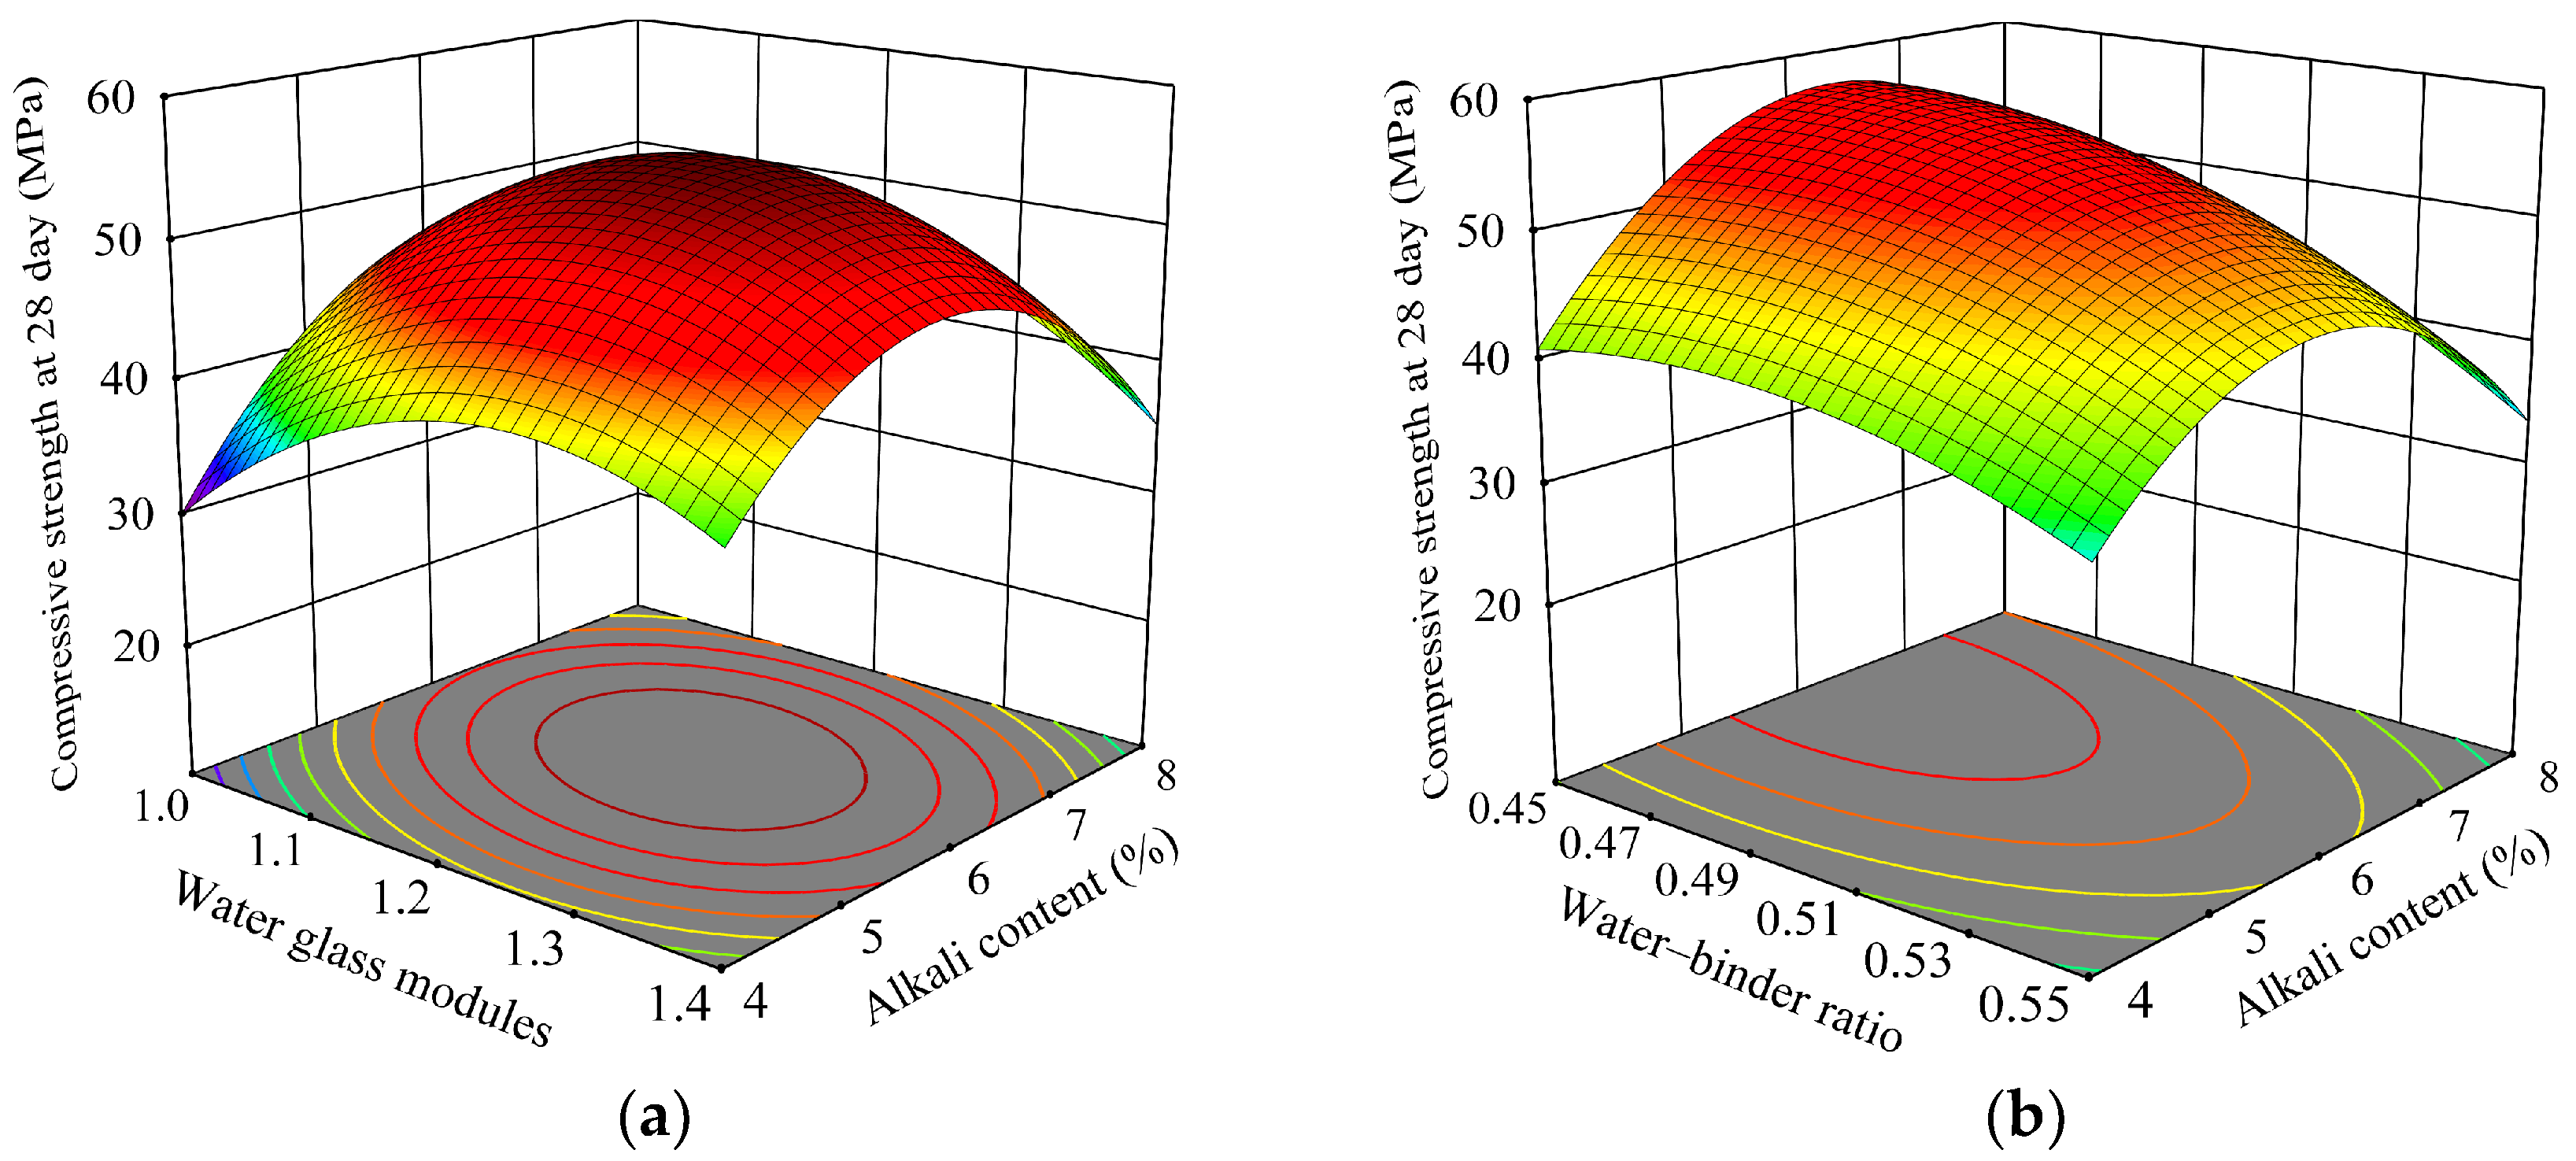
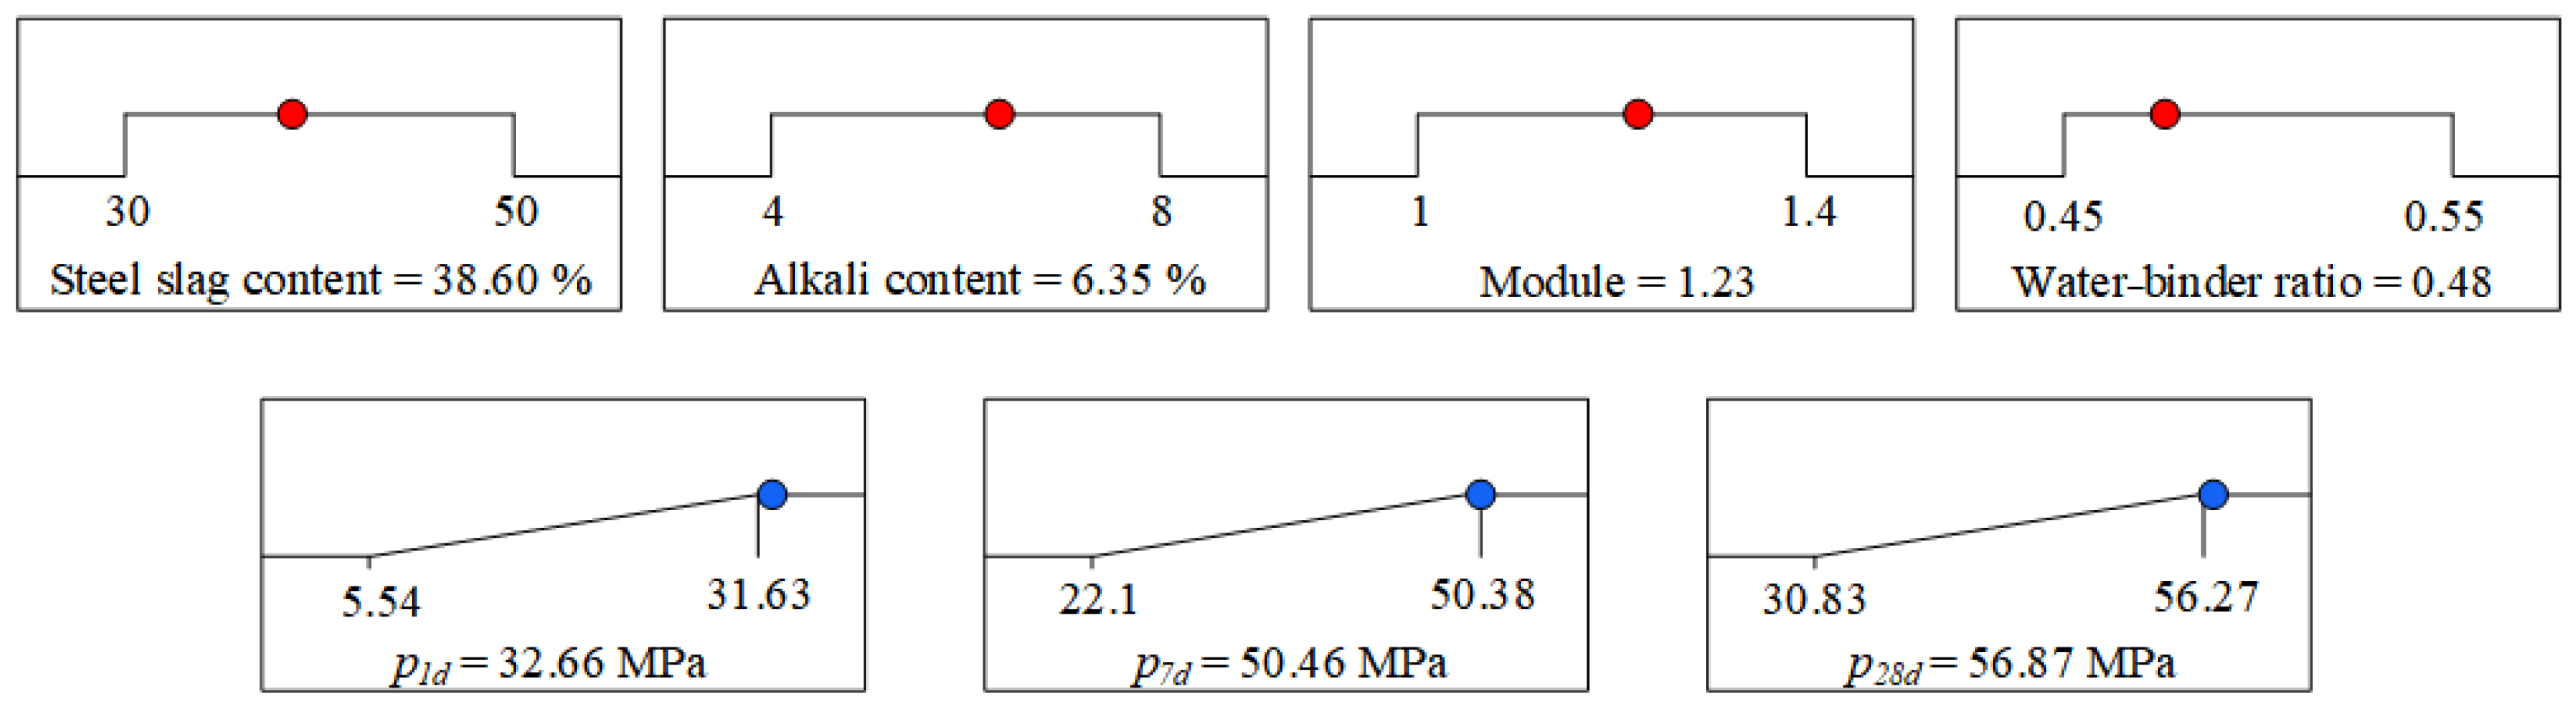
Individual variations in the four factors manifested diverse patterns of influence on the compressive strength of the specimen. The variation range of compressive strength for samples with steel slag content of approximately 40%, alkali content of approximately 6%, water glass modulus near 1.2, and water–binder ratio near 0.5 was significant, making these values suitable as the central-level value for response surface methodology. Based on the principle of maximizing steel slag content and three response values, the optimal mix ratio was determined as follows: a steel slag content of 38.596%, an alkali content of 6.348%, water glass modulus of 1.227, and water–binder ratio of 0.476. With these values, the response surface model predicted that the compressive strength at 1 day, 7 day, and 28 day would be 32.657 MPa, 50.461 MPa, and 56.867 MPa, respectively.
(2)
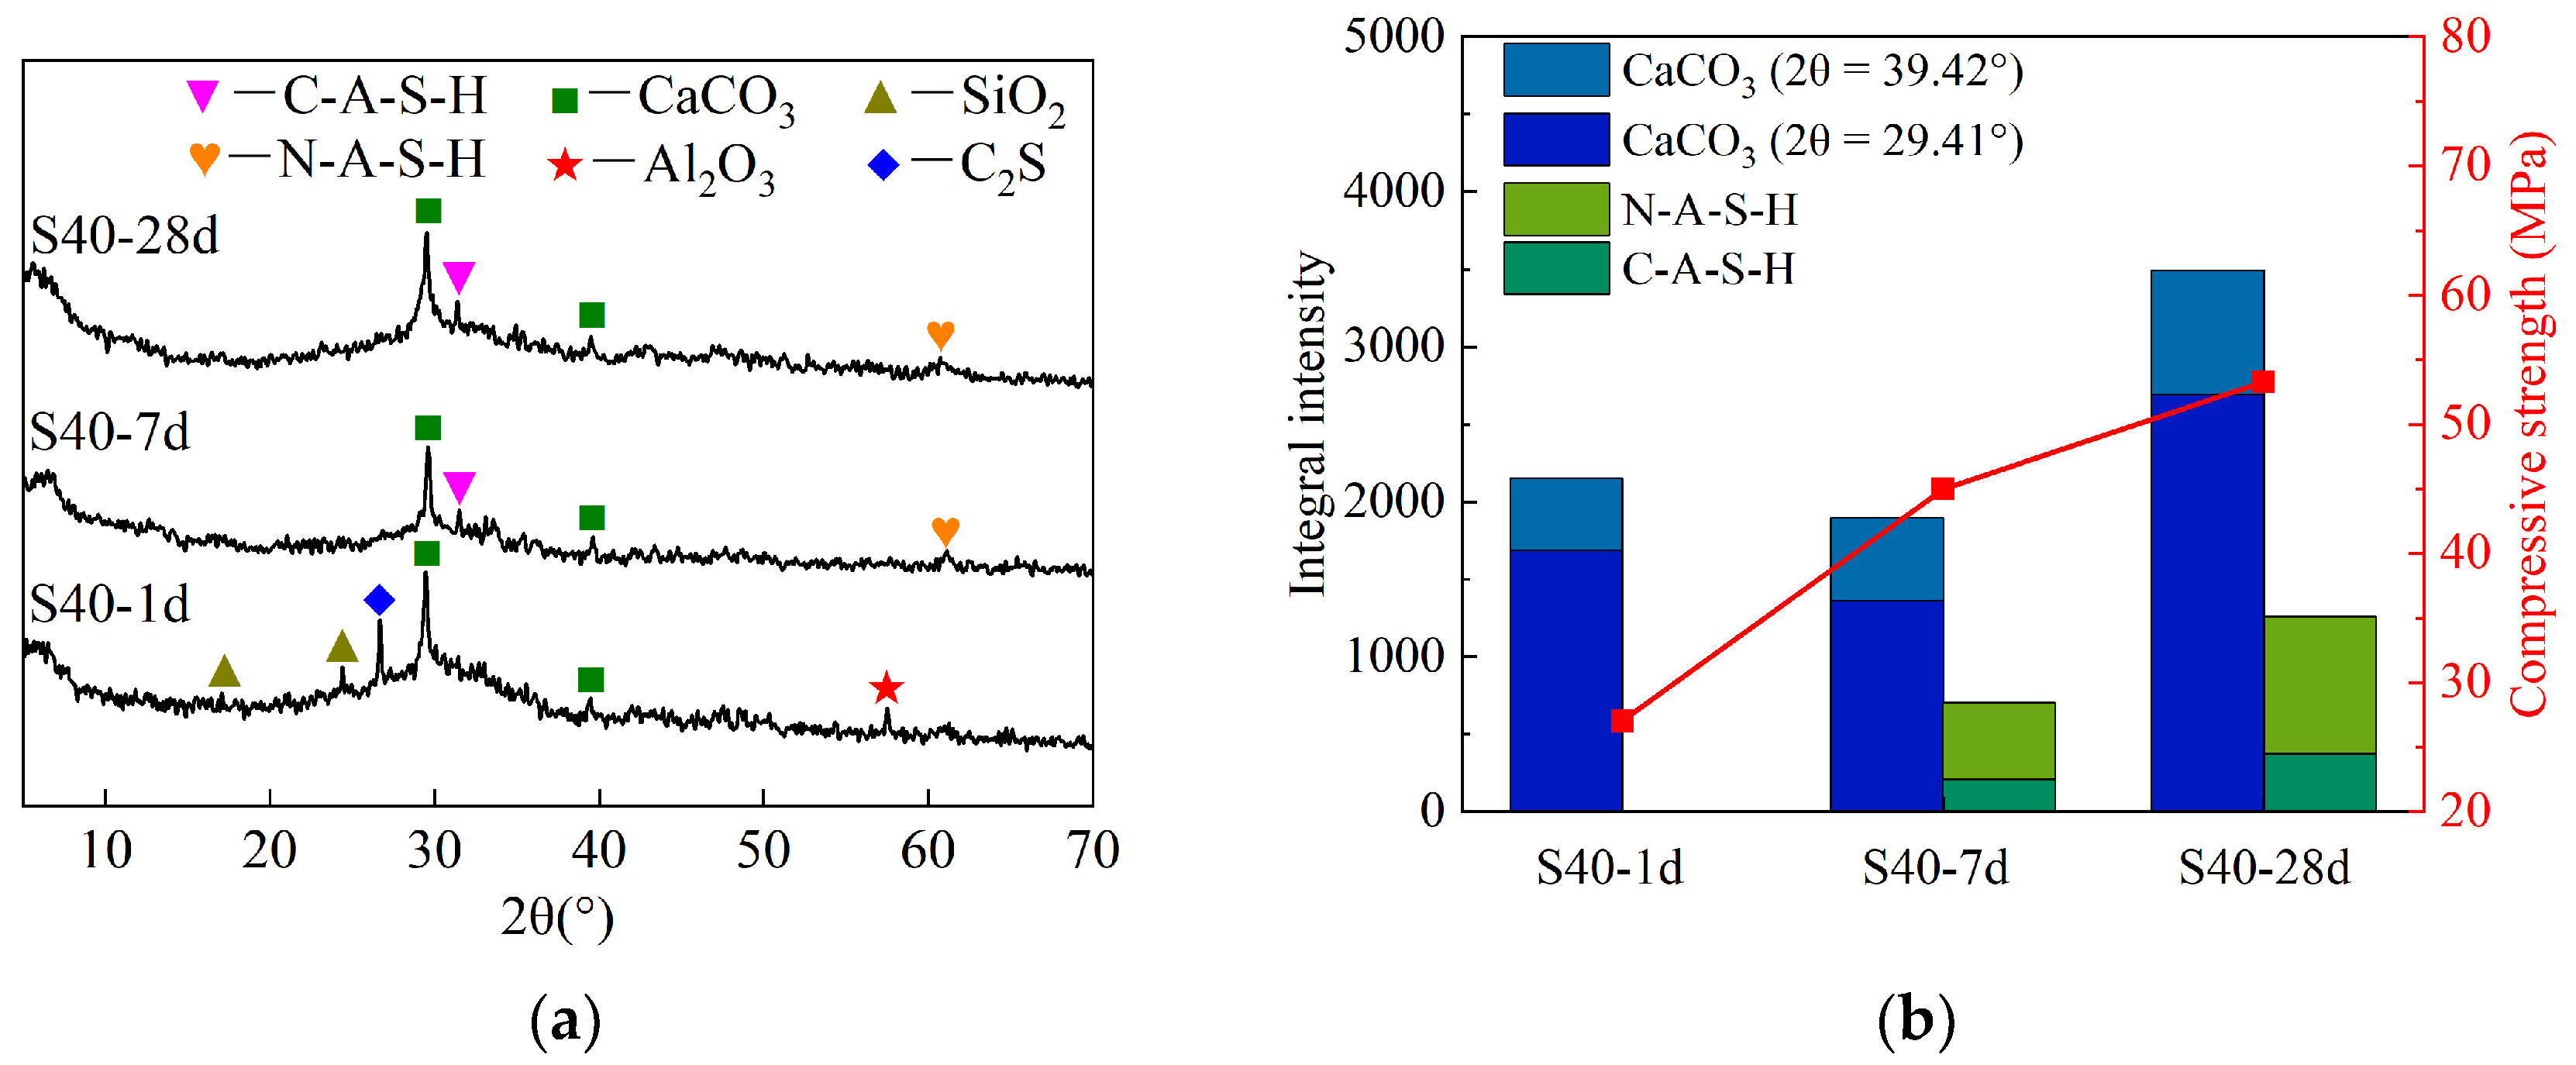
The XRD analysis revealed that the fluctuations in compressive strength among stone bodies at different curing ages primarily stem from the geopolymerization reaction process. The 28-day strength of specimens with varying steel slag contents was influenced by the hydration gel, geopolymer gel, and CaCO3 content, whereas those with varying alkali contents were influenced by the former two types of gels.
(3)
The SEM-EDS analysis indicated that the gel formed in this system mainly consisted of C-S-H gel generated by the reaction of volcanic ash and (N, C)-A-S-H gel generated by geopolymerization. The analysis of pores (cracks) in the binary form indicated that the change in compressive strength was mainly influenced by porosity, followed by the pore fractal dimension.
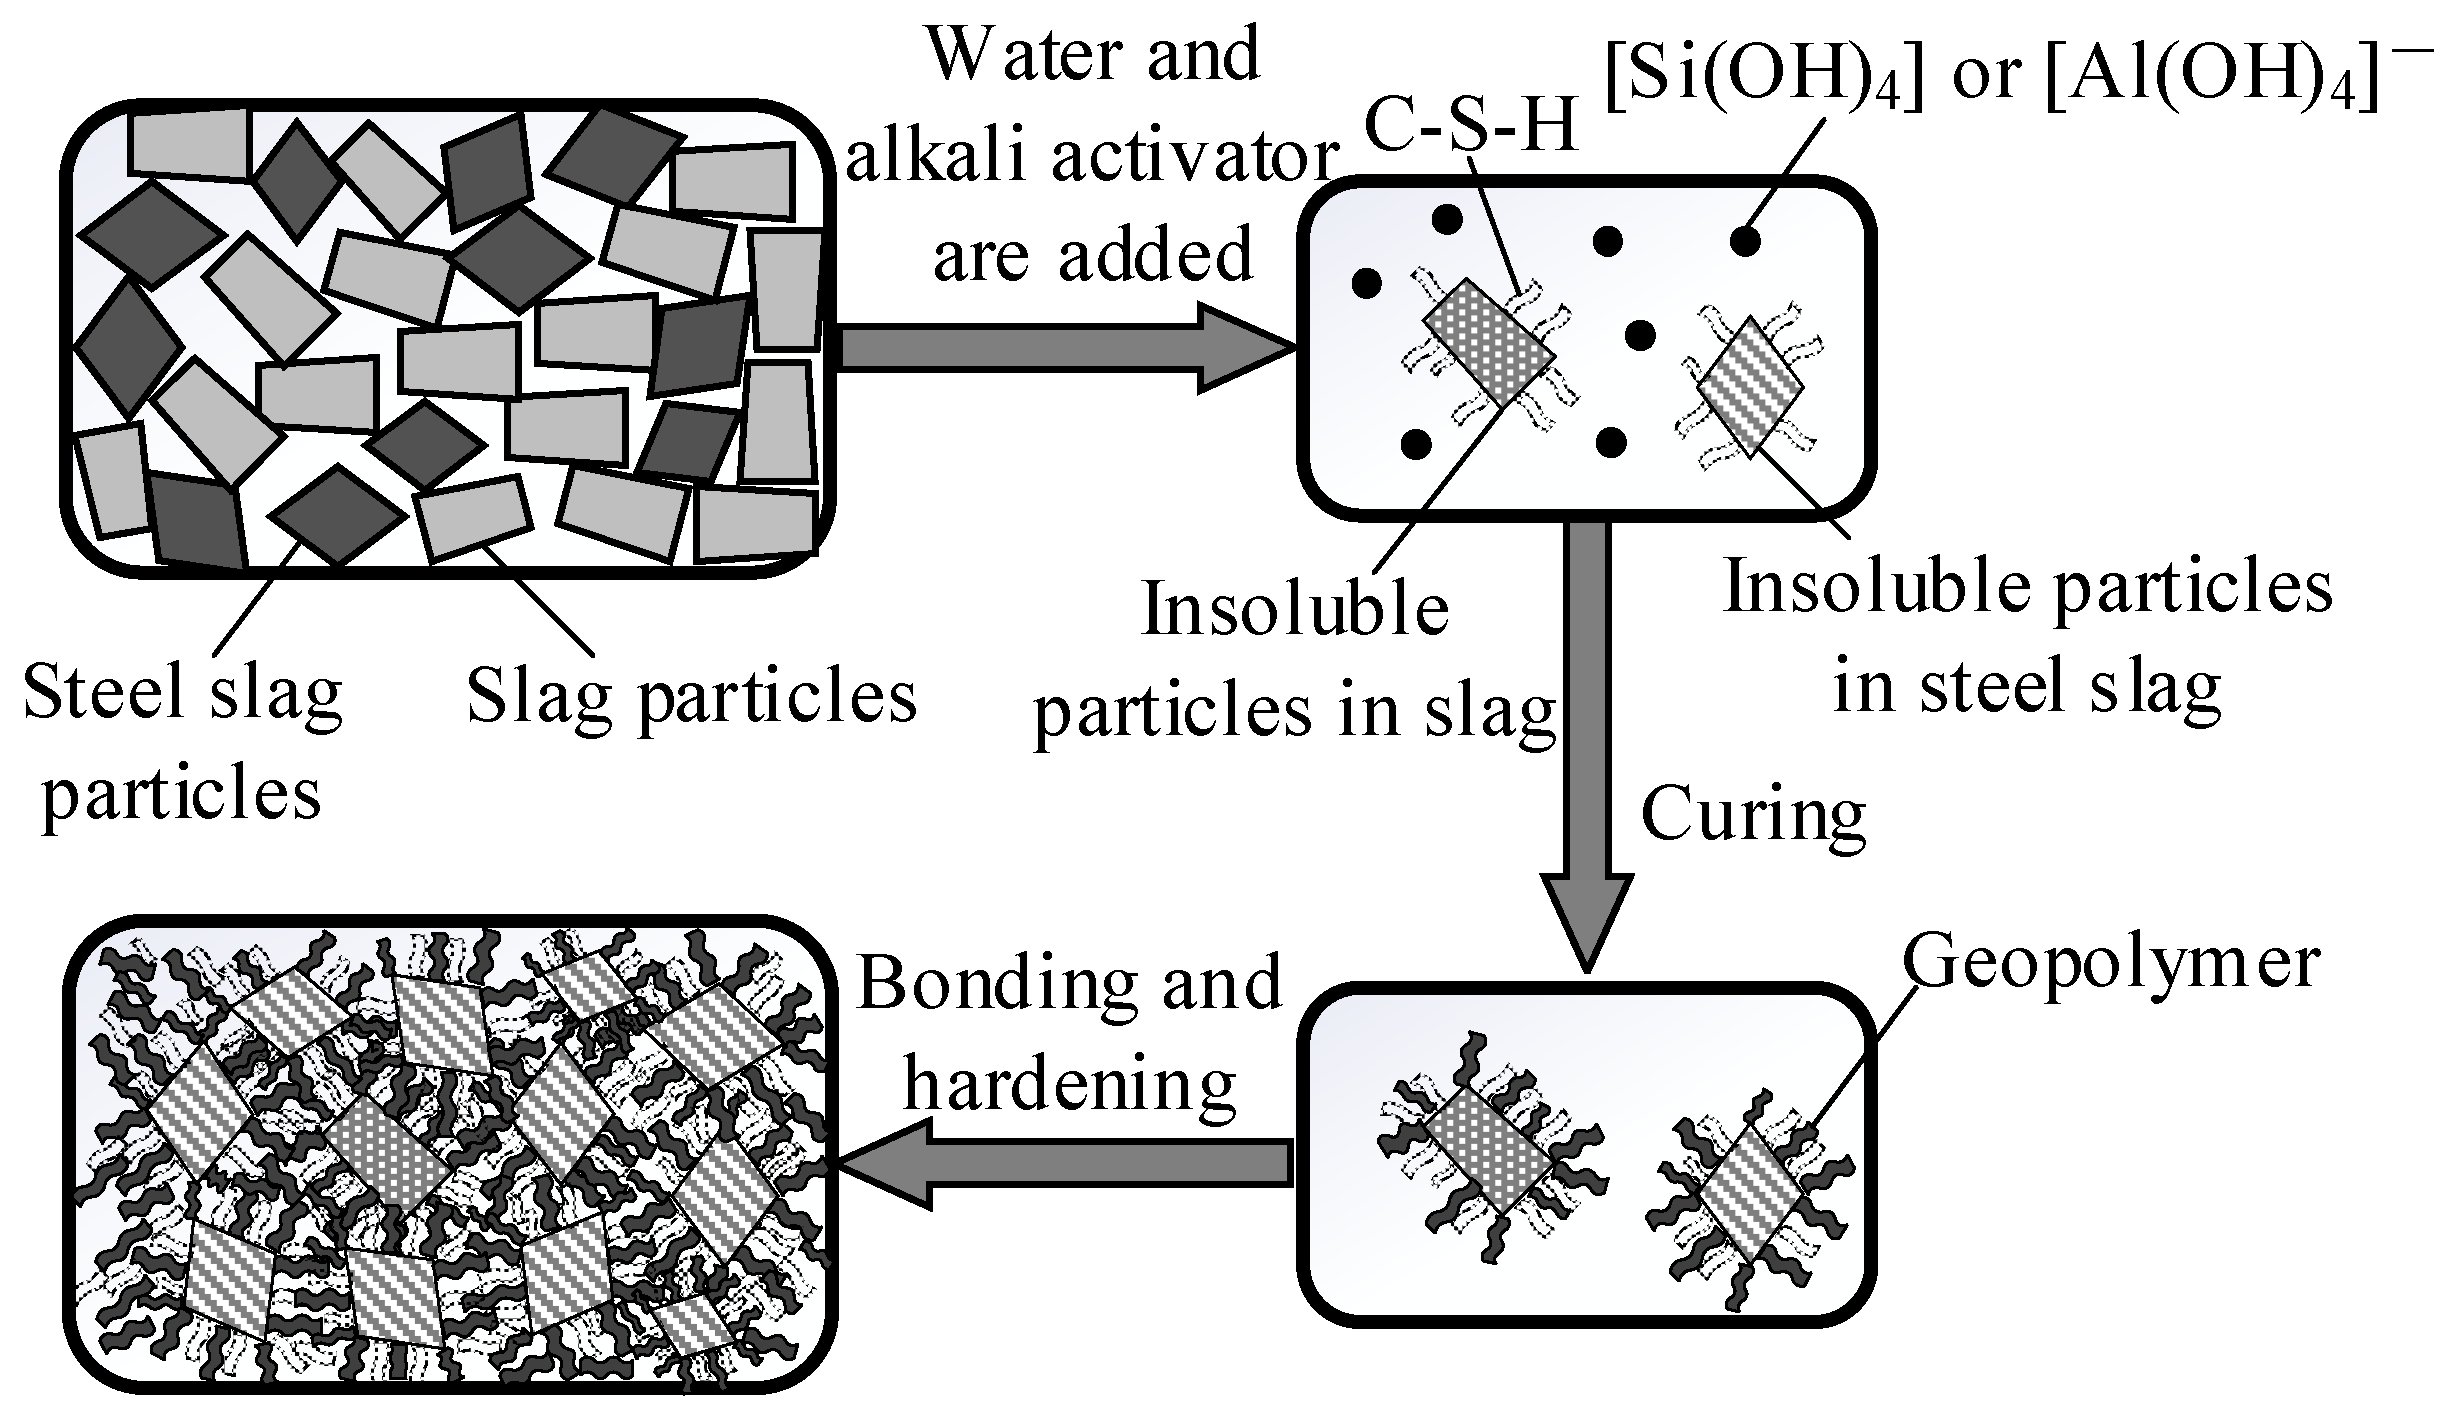
(4)
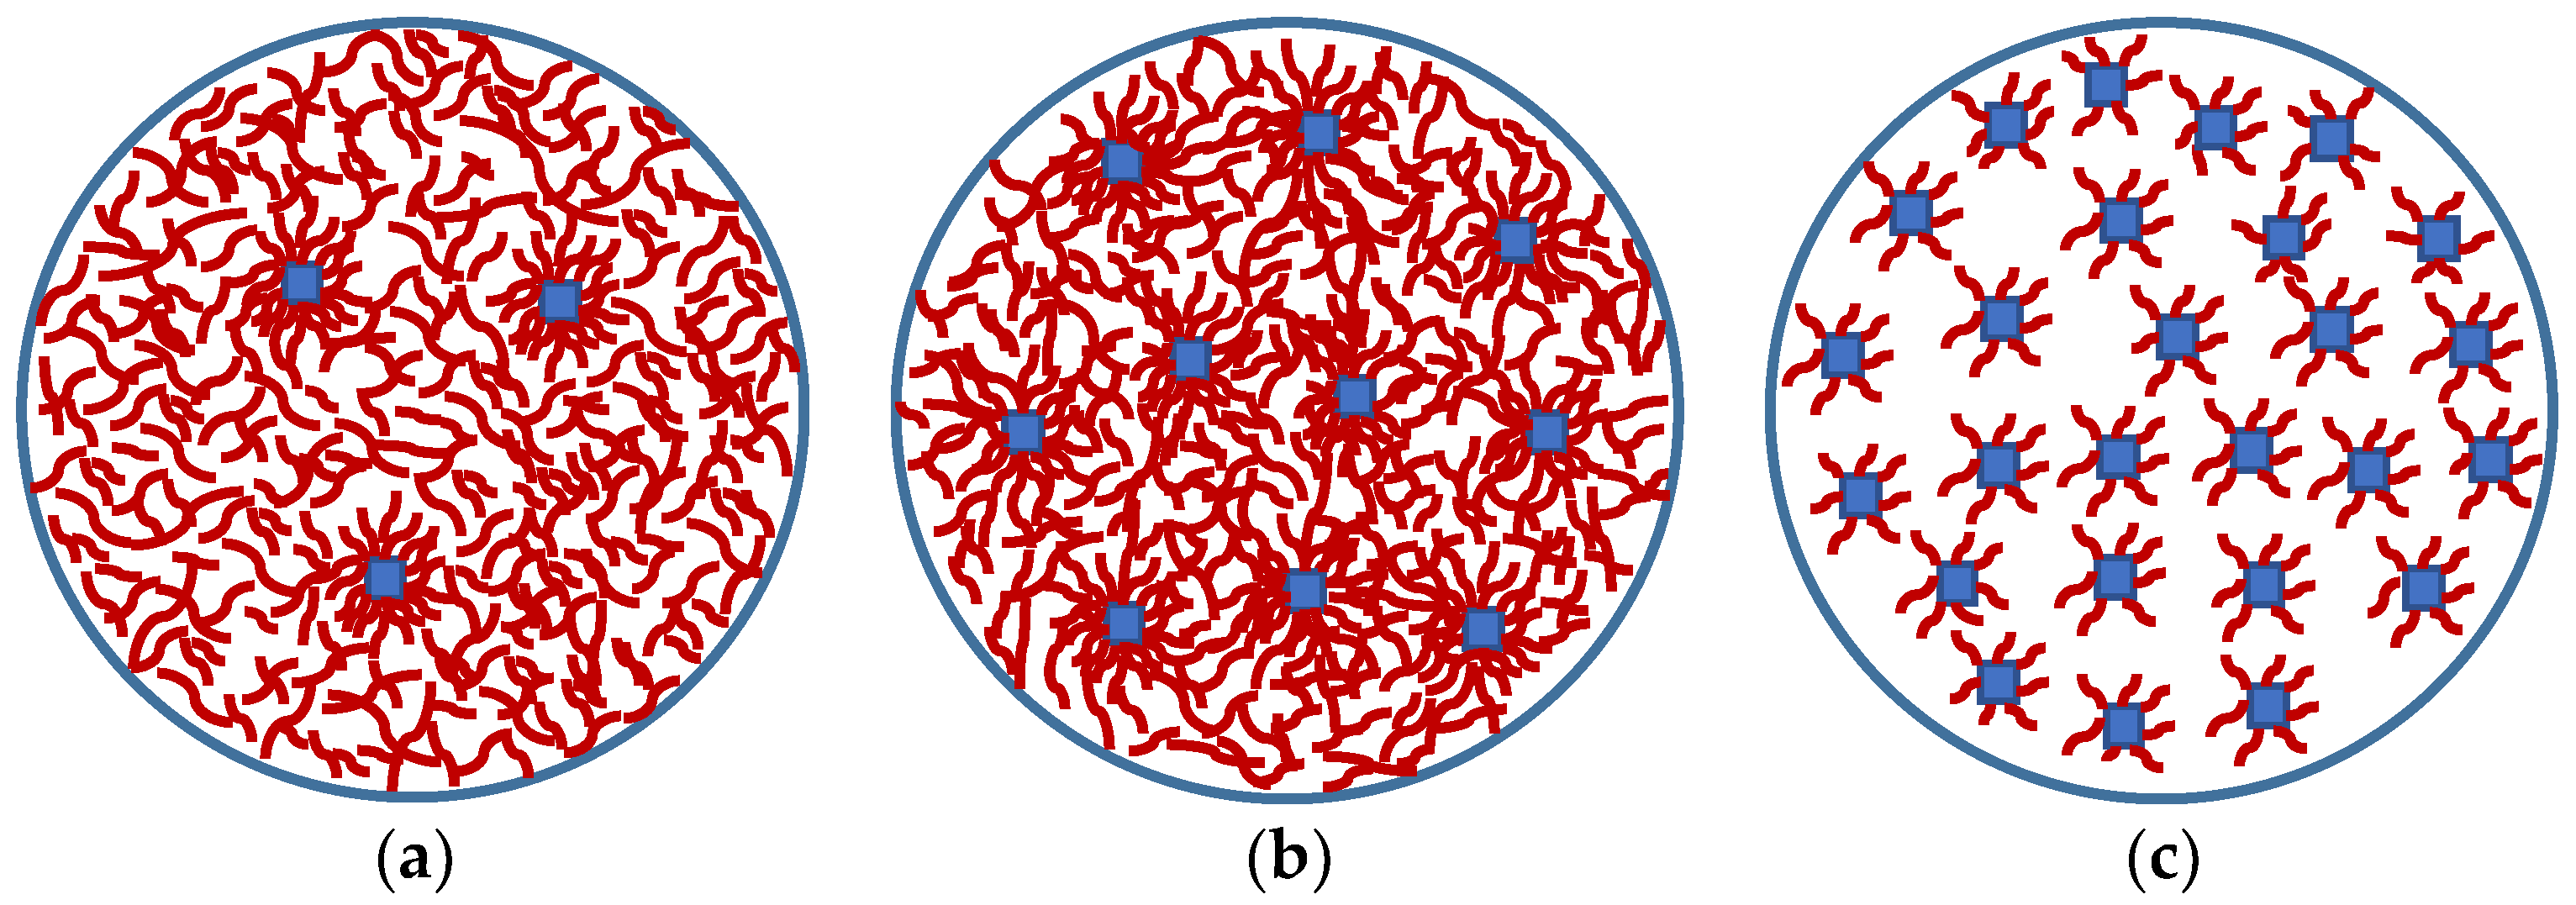
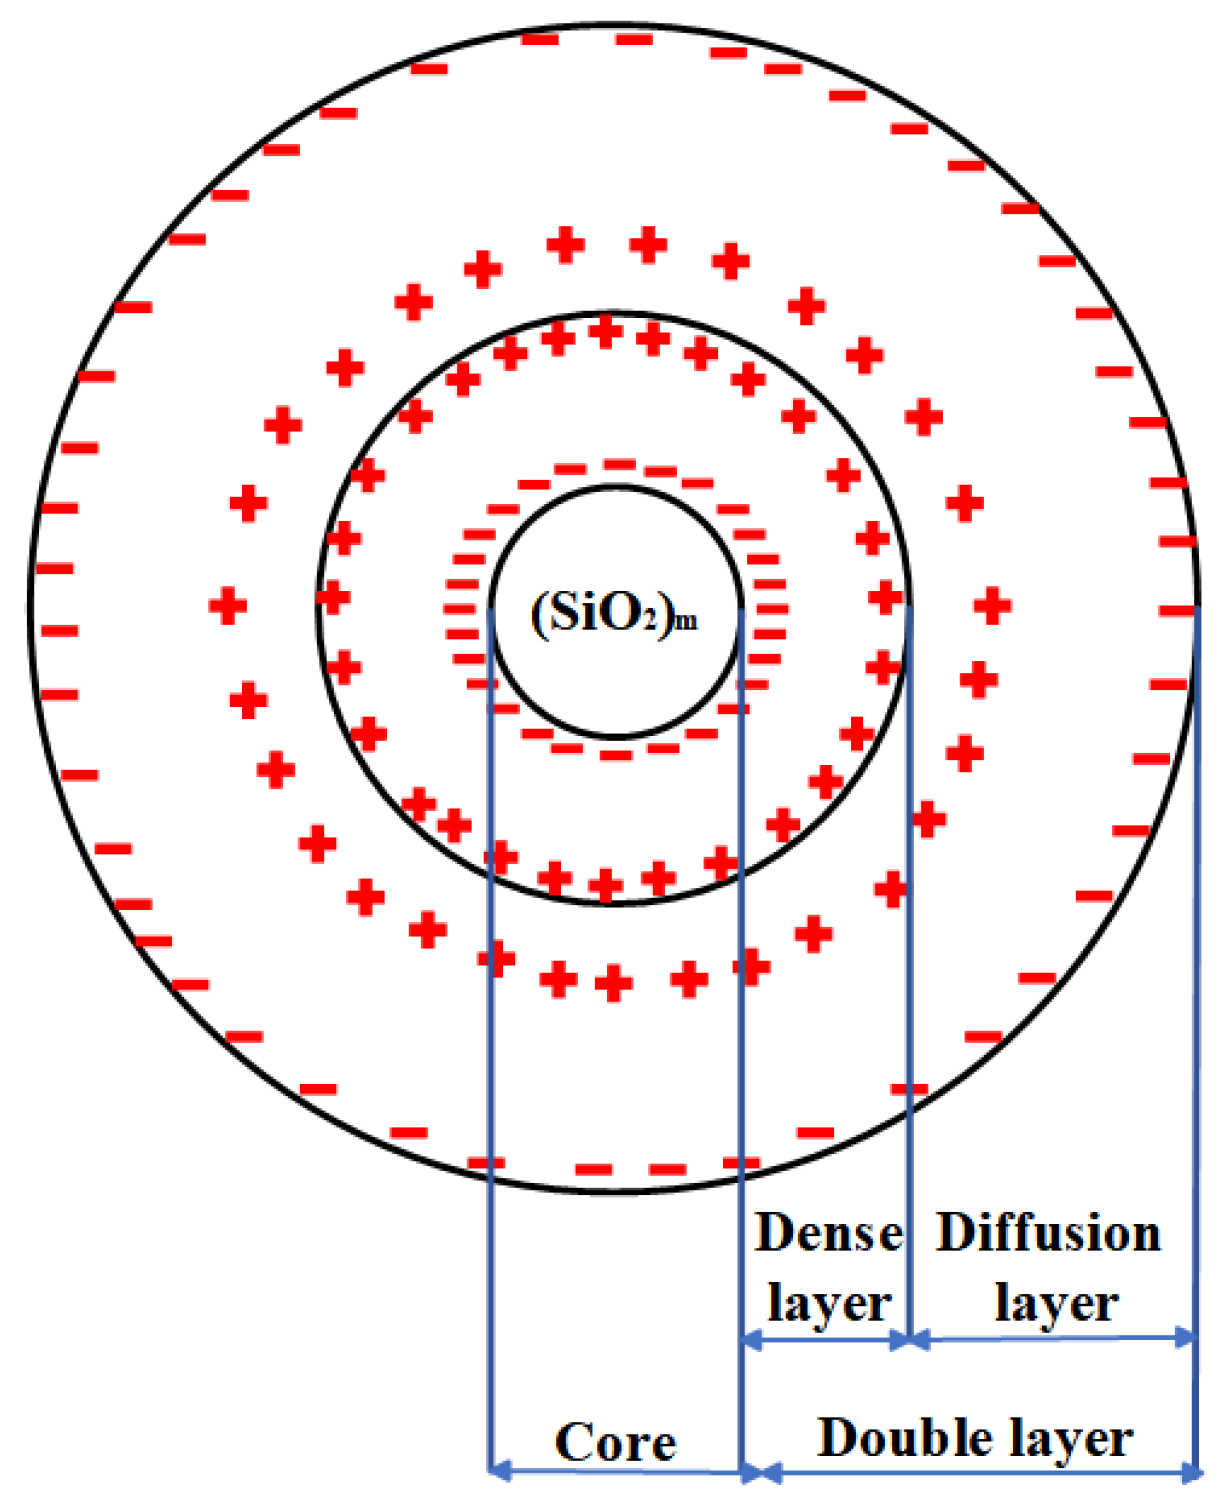
A microreaction model for alkali-activated steel slag–slag cementitious materials was proposed. This suggested that the process of alkaline activation of steel slag and blast furnace slag is essentially a combination of volcanic ash and geopolymerization reactions of active substances in the raw materials under alkaline conditions, resulting in compact adhesion with insoluble particles.

Author Contributions

Methodology, data curation, formal analysis, writing—original draft, M.W.; funding acquisition, supervision, validation, J.X.; conceptualization; supervision; X.Z.; resources, data curation, L.T.; supervision, funding acquisition, Y.M. All authors have read and agreed to the published version of the manuscript.

Funding

This work was supported by The Youth Innovation Team of Shaanxi Universities (2023–2026).

Data Availability Statement

The data presented in this study are available on request from the corresponding author.

Conflicts of Interest

Author Xuejing Zhang was employed by the company Shaanxi Building Materials Technology Group Co., Ltd. The remaining authors declare that the research was conducted in the absence of any commercial or financial relationships that could be construed as a potential conflict of interest.

References

  1. Guo, J.L.; Bao, Y.P.; Wang, M. Steel slag in China: Treatment, recycling, and management. Waste Manag. 2018, 78, 318–330. [Google Scholar] [CrossRef]
  2. Chen, G.X.; Wang, S.Y. Research on macro-microscopic mechanical evolution mechanism of cement-stabilized steel slag. J. Build. Eng. 2023, 75, 107047. [Google Scholar] [CrossRef]
  3. Tripathy, S.K.; Dasu, J.; Murthy, Y.R.; Kapure, G.; Pal, A.R.; Filippov, L.O. Utilisation perspective on water quenched and air-cooled blast furnace slags. J. Clean. Prod. 2020, 262, 121354. [Google Scholar] [CrossRef]
  4. Zhu, J.; Cui, H.; Cui, L.; Yang, S.; Zhang, C.; Liu, W.; Zheng, D. Mutual Activation Mechanism of Cement–GGBS–Steel Slag Ternary System Excited by Sodium Sulfate. Buildings 2024, 14, 631. [Google Scholar] [CrossRef]
  5. Fan, J.; Zhang, B. Repair of ordinary Portland cement concrete using alkali activated slag/fly ash: Freeze-thaw resistance and pore size evolution of adhesive interface. Constr. Build. Mater. 2021, 300, 124334. [Google Scholar] [CrossRef]
  6. Liu, Y.; Zhang, C.X. Current situation and development trends of comprehensive utilization of steel slag. Multipurp. Util. Miner. Resour. 2019, 2, 21–25. [Google Scholar]
  7. Huang, Y.; Xu, G.P.; Cheng, H.G.; Wang, J.S.; Wan, Y.F.; Chen, H. An overview of utilization of steel slag. Procedia Environ. Sci. 2012, 16, 791–801. [Google Scholar]
  8. Sun, J.W.; Zhang, Z.Q.; Zhuang, S.Y.; He, W. Hydration properties and microstructure characteristics of alkali–activated steel slag. Constr. Build. Mater. 2020, 241, 118141. [Google Scholar] [CrossRef]
  9. Sun, Z.Q.; Liu, Q.S.; Ma, S.H.; Huang, X.X.; Gan, M.; Ji, Z.Y.; Chen, X.; Fan, X. Steel slag for carbon fixation and synthesis of alkali-activated material. Constr. Build. Mater. 2022, 351, 128959. [Google Scholar] [CrossRef]
  10. Peng, X.Q.; Liu, C.; Li, S.; Jiang, Y.; Zeng, L. Research on the setting and hardening performance of alkali-activated steel slag-slag based cementitious materials. J. Hunan Univ. (Nat. Sci.) 2015, 6, 47–52. [Google Scholar]
  11. Zhou, Y.Q.; Sun, J.W.; Liao, Y.W. Influence of ground granulated blast furnace slag on the early hydration and microstructure of alkali-activated converter steel slag binder. J. Therm. Anal. Calorim. 2022, 147, 243–252. [Google Scholar] [CrossRef]
  12. Zhang, T.S.; Liu, F.T.; Li, Y.K.; Zhou, Z.H.; Chen, X. Influence of activators on the properties of steel slag cementitious materials. J. Build. Mater. 2008, 11, 469–474. [Google Scholar]
  13. Xu, Z.K.; Yue, J.C.; Pang, G.H.; Li, R.X.; Zhang, P.; Xu, S.T. Influence of the activator concentration and solid/liquid ratio on the strength and shrinkage characteristics of alkali-activated slag geopolymer pastes. Adv. Civ. Eng. 2021, 2021, 6631316. [Google Scholar] [CrossRef]
  14. Ji, X.; Wang, Z.J.; Zhang, H.B.; Wang, X.F.; Huo, J.Y.; Zhang, T.H. Optimization design and characterization of slag cementitious composites containing carbide slag and desulfurized gypsum based on response surface methodology. J. Build. Eng. 2023, 77, 107441. [Google Scholar] [CrossRef]
  15. Ding, Z.Y.; Su, Q.; Li, M.Z.; Wang, Q.; Zhou, J.H. Effect of water glass modulus on mechanical properties of geopolymer recycled aggregate concrete. J. Build. Mater. 2023, 26, 61–70. [Google Scholar]
  16. JGJ/T 70-2009; Standard for Test Method of Performance on Building Mortar. Standards Press of China: Beijing, China, 2009.
  17. Ye, G.C.; Ma, L.Q.; Li, L.; Liu, J.L.; Yuan, S.J.; Huang, G. Application of Box–Behnken design and response surface methodology for modeling and optimization of batch flotation of coal. Int. J. Coal Prep. Util. 2020, 40, 131–145. [Google Scholar] [CrossRef]
  18. Ferreira, S.L.C.; Bruns, R.E.; Ferreira, H.S.; Matos, G.D.; David, J.M.; Brandao, G.C.; da Silva, E.P.; Portugal, L.A.; Dos Reis, P.S.; Souza, A.S.; et al. Box-Behnken design: An alternative for the optimization of analytical methods. Anal. Chim. Acta. 2007, 597, 179–186. [Google Scholar] [CrossRef]
  19. Zhang, Y.; Li, Y.Z. Response surface method and its application in pharmaceutical field. J. Jilin Inst. Chem. Technol. 2012, 29, 20–26. [Google Scholar]
  20. Bentz, D.P.; Ardani, A.; Barrett, T.; Jones, S.Z.; Lootens, D.; Peltz, M.A.; Sato, T.; Stutzman, P.E.; Tanesi, J.; Weiss, W.J. Multiscale investigation of the performance of limestone in concrete. Constr. Build. Mater. 2015, 75, 1–10. [Google Scholar] [CrossRef]
  21. Zhang, X.; Qian, C.X.; Ma, Z.Y.; Li, F. Study on preparation of supplementary cementitious material using microbial CO2 fixation of steel slag powder. Constr. Build. Mater. 2022, 326, 126864. [Google Scholar] [CrossRef]
  22. Davidovits, J. Geopolymers-Inorganic polymeric new materials. J. Therm. Anal. 1991, 37, 1633–1656. [Google Scholar] [CrossRef]
  23. Amer, I.; Kohail, M.; El-Feky, M.S.; Rashad, A.; Khalaf, M.A. A review on alkali-activated slag concrete. Ain Shams Eng. J. 2021, 12, 1475–1499. [Google Scholar] [CrossRef]
  24. Hou, Y.F.; Wang, D.M.; Li, Q.; Liu, H.B. Effect of water glass performance on fly ash-based geopolymers. J. Chin. Ceram. Soc. 2008, 36, 61–64. [Google Scholar]
  25. Gebregziabiher, B.S.; Thomas, R.; Peethamparan, S. Very early-age reaction kinetics and microstructural development in alkali-activated slag. Cem. Concr. Compos. 2015, 55, 91–102. [Google Scholar] [CrossRef]
  26. Liu, J.X.; Yang, Y.M.; Wang, S.Q.; Liu, P.; Zhang, M.L.; Hai, R. Effect of chemical activator on mechanical property of red mud geopolymer mortar. Inorg. Chem. Ind. 2020, 52, 72–75. [Google Scholar]
  27. Wang, Q.; Bian, H.; Li, M.; Dai, M.; Chen, Y.; Jiang, H.; Zhang, Q.; Dong, F.; Huang, J.; Ding, Z. Effects of a water-glass module on compressive strength, size effect and stress–strain behavior of geopolymer recycled aggregate concrete. Crystals 2022, 12, 218. [Google Scholar] [CrossRef]
  28. Zhu, C.X.; Lu, C. The progress to recognize the hardening mechanism of waterglass. Inorg. Chem. Ind. 2001, 33, 22–25. [Google Scholar]
  29. Tong, G.Q.; Zhang, W.Y.; Gao, Y.T.; Tang, X.Y. Mechanical properties and micromechanism of alkali-activated fly ash geopolymer. Mater. Rep. 2022, 36, 129–134. [Google Scholar]
  30. Du, T.L.; Liu, Y.; Yu, Y.Y.; Yan, J.X.; Ji, Y.S. Influence of sodium silicate on fly ash slag geopolymer strength and stimulating mechanism. J. Highw. Transp. Res. Dev. 2021, 38, 41–49. [Google Scholar]
  31. Zhou, P.; Xie, S.L.; Li, Q. Effect of water-binder ratio on properties and pore structure of concrete. Bull. Chin. Ceram. Soc. 2018, 37, 974–978. [Google Scholar]
  32. Zhang, L.L.; Xu, J.; Wu, Z.P.; Zhao, Y.J.; Wang, T.H. Cylindrical diffusion model and parameter optimization for NaOH solution reinforcement of collapsible loess. Comput. Geotech. 2023, 158, 105376. [Google Scholar] [CrossRef]
  33. Yu, Q.Z.; Song, L.K.; Chi, Y.L.; Fan, S.H.; Li, G.H. X-ray diffraction quantitative analysis with polynomial-fit method for polycrystalline materials. Spectrosc. Spectr. Anal. 2004, 24, 248–250. [Google Scholar]
  34. Davidovits, J. Geopolymer chemistry and sustainable development, in: Geopolymer green chemistry and sustainable development solutions. In Proceedings of the Geopolymer 2005 Conference, Austin, TX, USA, 24–26 January 2005. [Google Scholar]
  35. Hajimohammadi, A.; Ngo, T.; Kashani, A. Glass waste versus sand as aggregates: The characteristics of the evolving geopolymer binders. J. Clean. Prod. 2018, 193, 593–603. [Google Scholar] [CrossRef]
  36. Deventer, J.S.J.V.; Provis, J.L.; Duxson, P.; Lukey, G.C. Reaction mechanisms in the geopolymeric conversion of inorganic waste to useful products. J. Hazard. Mater. 2007, 13, 506–513. [Google Scholar] [CrossRef] [PubMed]
  37. Guo, X.L.; Shi, H.S.; Xia, M. Effect of different calcium resouces on reaction mechanism of geopolymer. Chin. J. Mater. Res. 2016, 30, 348–354. [Google Scholar]
  38. Bernal, S.A.; Provis, J.L.; Walkley, B.; San Nicolas, R.; Gehman, J.D.; Brice, D.G.; Kilcullen, A.R.; Duxson, P.; van Deventer, J.S. Gel nanostructure in alkali-activated binders based on slag and fly ash, and effects of accelerated carbonation. Cem. Concr. Res. 2013, 53, 127–144. [Google Scholar] [CrossRef]
  39. Liu, Z.; Zhang, D.W.; Li, L.; Wang, J.X.; Shao, N.N.; Wang, D.M. Microstructure and phase evolution of alkali-activated steel slag during early age. Constr. Build. Mater. 2019, 204, 158–165. [Google Scholar] [CrossRef]
  40. Wang, Q.; Su, H.L.; Li, C.M.; Lyu, X.J. Recycling of steel slag as an alkali activator for blast furnace slag: Geopolymer preparation and its application in composite cement. Clean Technol. Environ. Policy. 2023, 25, 1617–1629. [Google Scholar] [CrossRef]
  41. Liu, C.; Shi, B.; Zhou, J.; Tang, C. Quantification and characterization of microporosity by image processing, geometric measurement and statistical methods: Application on SEM images of clay materials. Appl. Clay Sci. 2011, 54, 97–106. [Google Scholar] [CrossRef]
  42. Song, W.; Zhu, Z.; Pu, S.; Wan, Y.; Huo, W.; Song, S.; Zhang, J.; Yao, K.; Hu, L. Efficient use of steel slag in alkali-activated fly ash-steel slag-ground granulated blast furnace slag ternary blends. Constr. Build. Mater. 2020, 259, 119814. [Google Scholar] [CrossRef]
  43. Shi, K.Y.; Deng, H.Y.; Hu, J.X.; Zhou, J.Q.; Cai, X.H.; Liu, Z.W. Effects of steel slag powder content and curing condition on the performance of alkali-activated materials based UHPC matrix. Materials 2023, 16, 3875. [Google Scholar] [CrossRef] [PubMed]
  44. Cai, G.H.; Liu, S.Y.; Sun, J.J. Research on micro-mechanism of carbonated reactive MgO-stabilized silt. Chin. Civ. Eng. J. 2017, 50, 105–113. [Google Scholar]
  45. Palomo, A.; Palacios, M. Alkali-activated cementitious materials: Alternative matrices for the immobilisation of hazardous wastes Part II. Stabilisation of chromium and lead. Cem. Concr. Res. 2003, 33, 289–295. [Google Scholar] [CrossRef]
Figure 1. XRD pattern of steel slag and slag.
Buildings 14 01204 g001
Figure 2. Test procedure.
Buildings 14 01204 g002
Figure 3. Variation law of compressive strength at different factors: (a) steel slag content; (b) alkali content; (c) water glass modulus; (d) water–binder ratio.
Buildings 14 01204 g003
Figure 4. Microscopic principles illustrating influence of steel slag content on strength: (a) small amount of steel slag; (b) moderate amount of steel slag; (c) excess steel slag. (The short red curve represents the gel; the blue square represents the CaCO3 crystal).
Buildings 14 01204 g004
Figure 5. Schematic structure of water glass bilayer [29,30].
Buildings 14 01204 g005
Figure 6. Changing law of p7d under interaction: (a) steel slag content and alkali content; (b) steel slag content and water–binder ratio.
Buildings 14 01204 g006
Figure 7. Changing law of p28d under interaction: (a) alkali content and water glass modulus; (b) alkali content and water–binder ratio.
Buildings 14 01204 g007
Figure 8. Optimal combination ratio and response value. (The red dots represent the variable values, and the blue dots represent the response values.)
Buildings 14 01204 g008
Figure 9. Comparison of experimental values with model-predicted values.
Buildings 14 01204 g009
Figure 10. XRD analysis of different ages: (a) XRD pattern; (b) peak intensity integral and compressive strength.
Buildings 14 01204 g010
Figure 11. XRD analysis of different steel slag contents: (a) XRD pattern; (b) peak intensity integral and compressive strength.
Buildings 14 01204 g011
Figure 12. XRD analysis of different alkali contents: (a) XRD pattern; (b) peak intensity integral and compressive strength.
Buildings 14 01204 g012
Figure 13. SEM-EDS images of S40 group at different ages: (a) 1 day; (b) 28 day.
Buildings 14 01204 g013aBuildings 14 01204 g013b
Figure 14. SEM-EDS images of different steel slag content: (a) S20-28d; (b) S60-28d.
Buildings 14 01204 g014
Figure 15. SEM-EDS images of different alkali content: (a) A04-28d; (b) A08-28d.
Buildings 14 01204 g015
Figure 16. SEM image after binarization: (a) S40-1d; (b) S40-28d; (c) S60-28d; (d) A04-28d; (e) A08-28d.
Buildings 14 01204 g016
Figure 17. Comparison of porosity, fractal dimension, and strength: (a) ages; (b) steel slag content; (c) alkali content.
Buildings 14 01204 g017
Figure 18. Schematic diagram of alkali-activated steel slag–slag microreaction.
Buildings 14 01204 g018
Table 1. Main chemical compositions of steel slag and slag (%).
CategoryCaOFe2O3SiO2Al2O3MgOSO3MnOP2O5Na2OTiO2
Steel slag28.2618.6018.316.375.49-2.841.28-1.05
Slag35.06-25.0412.916.802.190.26-0.491.26
Table 2. Chemical composition and physical parameters of water glass.
CategorySiO2Na2OH2OModuleBaume Degree
Water glass27.27%8.32%58.2%3.239
Table 3. Single-factor experiment design.
Change
Factor
Experimental Ratio
Slag
Content
Steel Slag
Content
Alkali
Content
ModulusWater–Binder
Ratio
Steel slag content80%20%6%1.20.5
70%30%6%1.20.5
60%40%6%1.20.5
50%50%6%1.20.5
40%60%6%1.20.5
Alkali content60%40%4%1.20.5
60%40%6%1.20.5
60%40%8%1.20.5
60%40%10%1.20.5
60%40%12%1.20.5
Water glass modulus60%40%6%0.80.5
60%40%6%10.5
60%40%6%1.20.5
60%40%6%1.40.5
60%40%6%1.60.5
Water–binder ratio60%40%6%1.20.4
60%40%6%1.20.45
60%40%6%1.20.5
60%40%6%1.20.55
60%40%6%1.20.6
Table 4. Test factors and levels.
FactorParameterLevel
−101
Steel slag content (%)X1304050
Alkali content (%)X2468
Water glass modulusX31.01.21.4
Water–binder ratioX40.450.500.55
Table 5. Response surface test results.
NumberSteel Slag Content (%)Alkali Content (%)Modulus Water–Binder RatioCompressive Strength (MPa)
p1dp7dp28d
14061.20.527.04 47.01 56.27
24061.20.531.6347.3852.68
34061.20.529.9450.3855.31
440610.4521.12 34.44 50.06
54041.20.557.52 22.90 34.09
64061.40.4528.79 40.01 47.27
73081.20.530.02 43.21 44.25
85061.20.4524.56 32.82 46.79
94081.20.4531.08 43.10 50.19
1040610.5518.30 32.38 36.44
1140410.55.54 22.10 32.23
125061.20.5515.40 30.59 38.03
134041.20.459.15 29.52 42.44
143061.20.4531.26 50.26 52.32
153061.20.5523.58 37.09 43.19
1650610.512.25 27.10 33.69
175061.40.522.71 36.60 40.15
184041.40.511.61 26.06 38.79
195081.20.520.28 27.10 35.63
2040810.520.29 31.13 40.06
213041.20.513.50 30.88 34.65
2230610.521.10 38.97 42.95
234081.20.5522.44 29.22 30.92
245041.20.56.34 23.88 30.83
253061.40.530.06 43.46 44.25
264081.40.527.69 32.34 33.69
274061.40.5522.08 31.21 40.73
Table 6. Fitting equation and model variance analysis.
ModelEquationR2Fp
1Y1 = −653.29208 + 2.53633X1 + 39.98542X2 + 320.8375X3 + 1278.21667X4 − 0.03225X1X2 + 0.1875X1X3 − 0.74X1X4 + 0.83125X2X3 − 17.525X2X4 − 97.25X3X4 − 0.032471X12 − 2.23677X22 − 110.92708X32 − 1087.83333X420.9841.6<0.0001
2Y2 = −997.20208 + 0.300917X1 + 54.19875X2 + 549.45417X3 + 2261.53333X4 − 0.113875X1X2 + 0.62625X1X3 + 5.47X1X4 − 1.71875X2X3 − 18.15X2X4 − 168.5X3X4 − 0.045654X12 − 3.0326X22 − 195.88542X32 − 2247.166667X420.9733.3<0.0001
3Y3 = −729.72625 + 4.53908X1 + 61.32333X2 + 387.5X3 + 1222.38333X4 − 0.06X1X2 + 0.645X1X3 + 0.185X1X4 − 8.08125X2X3 − 27.3X2X4 + 177X3X4 − 0.066871X12 − 2.88927X22 − 187.23958X32 − 1387.83333X420.9724.1<0.0001
Table 7. Analysis of variance for influence factors.
Sourcep1dp7dp28d
F-Valuep-ValueF-Valuep-ValueF-Valuep-Value
X164.52<0.000195.23<0.000125.830.0003
X2269.93<0.000156.70<0.00019.140.0106
X355.10<0.000112.220.00441.730.2127
X437.62<0.000148.12<0.000183.64<0.0001
X1X20.55970.46885.480.03731.340.2695
X1X30.18920.67131.660.22231.550.2370
X1X40.18420.67547.900.01570.00800.9304
X2X30.14870.70650.49930.49339.730.0087
X2X44.130.06483.480.08676.940.0218
X3X41.270.28143.000.10892.920.1134
X1218.910.000929.360.000255.51<0.0001
X22143.58<0.0001207.25<0.0001165.80<0.0001
X3235.31<0.000186.47<0.000169.63<0.0001
X4213.270.003444.45<0.000114.940.0022
Lack of fit0.46210.83441.130.55721.290.5129
Table 8. Micro-test proportions.
NumberSteel Slag (%)Alkali (%)Water Glass ModulusWater–Binder Ratio
S202061.20.5
S40 (A06)4061.20.5
S606061.20.5
A044041.20.5
A084081.20.5
Disclaimer/Publisher’s Note: The statements, opinions and data contained in all publications are solely those of the individual author(s) and contributor(s) and not of MDPI and/or the editor(s). MDPI and/or the editor(s) disclaim responsibility for any injury to people or property resulting from any ideas, methods, instructions or products referred to in the content.

