
Spatial Gradient Differences in the Cooling Island Effect and Influencing Factors of Urban Park Green Spaces in Beijing
1
Beijing Advanced Innovation Center for Future Urban Design, School of Architecture and Urban Planning, Beijing University of Civil Engineering and Architecture, Beijing 100044, China
2
China Urban Construction Design & Research Institute Co., Ltd., Beijing 100120, China
*
Author to whom correspondence should be addressed.
Buildings 2024, 14(5), 1206; https://doi.org/10.3390/buildings14051206
Submission received: 7 March 2024
/
Revised: 16 April 2024
/
Accepted: 22 April 2024
/
Published: 24 April 2024
(This article belongs to the Special Issue Advanced Studies in Urban and Regional Planning)
Abstract
:Urban park green spaces exhibit significant cool island effects, which can effectively mitigate the urban heat environment. Clarifying the characteristics and differences in the cool island effects of urban parks across different spatial gradients within cities is instrumental in identifying potential issues and optimizing the structure and resource allocation of park green spaces in a scientifically rational manner. This study focuses on parks within the central urban area of Beijing, utilizing remote sensing image interpretation and land surface temperature (LST) inversion to extract relevant characteristics of park green spaces and the park cool island intensity (PCI) index. Various mathematical and statistical methods including correlation analysis, regression analysis, and cluster analysis are employed to conduct comparative studies across three gradients: within the 3rd ring road, between the 3rd and 5th ring roads, and outside the 5th ring road. The analysis reveals that both park green space characteristics and urban heat island effects exhibit spatial gradient differences, collectively influencing the cool island effects of urban park green spaces. PCI gradually decreases across the three spatial gradients. Cluster analysis identifies four distinct types of parks with different cool island effect characteristics, highlighting the need for optimization and improvement in over half of the parks. Various indicators of park green space characteristics show different correlations with PCI, with variations in correlation strength and thresholds across gradients. The fitting effects of regression equations for each characteristic indicator and PCI gradually worsen from within the 3rd ring road to outside the 5th ring road, with different factors playing important roles across gradients. This study enhances our understanding of the cool island effects of urban park green spaces and facilitates the proposition of differentiated optimization management strategies for urban park green space planning and system construction in different regions.
1. Introduction
Urbanization has altered surface structures [1], leading to increased absorption of solar radiation by urban surfaces. Simultaneously, it has brought about significant human activities such as high-density building developments, the expansion of transportation systems, and large-scale land use changes, which contribute to the emission of anthropogenic heat sources. These factors collectively result in the urban heat island (UHI) effect, characterized by a noticeable increase in urban temperatures [2]. Climate change is one of the major challenges facing the world today, and the UHI, as a significant phenomenon in the process of urbanization, is closely related to it [3]. With the intensification of global climate change, the impact of the UHI effect on the urban thermal environment and ecosystem has become more complex and serious [4]. This interaction not only has a serious negative impact on the living environment, ecosystem, and residents’ health [5,6], but also causes a series of problems such as energy waste and environmental pollution. Consequently, it has become a crucial factor constraining the sustainable development of cities [7].
Urban park green space has an obvious cold island effect, which can effectively optimize the urban thermal environment [8]. It is a cost-effective and low-carbon thermal mitigation method in cities with scarce land [9]. Previous research has indicated that green vegetation in urban parks converts a large amount of heat into water vapor through transpiration, releasing it into the atmosphere. Additionally, vegetation can shield and reflect a significant portion of solar radiation, thereby maintaining lower surface temperatures [10]. Natural or artificial water bodies such as lakes, rivers, or ponds can absorb and release considerable heat, exerting strong temperature regulation effects [11]. The microclimate environment formed by green spaces can guide heat exchange through convective effects, consequently reducing surrounding surface temperatures [12]. Factors such as the scale, morphology, landscape composition, and spatial arrangement of urban parks directly influence the formation and intensity of their cold island effects [13,14,15,16]. They are also influenced by various factors such as the surrounding built environment and land use patterns [17,18]. Clarifying the underlying mechanisms of the cold island effect in urban parks not only helps enhance their cooling effects but also provides a scientific basis for urban park planning and construction [19]. At present, many studies take several parks in the urban area as samples to analyze the correlation between their characteristics and the intensity of cold islands and then reveal the internal objective laws, which can provide reference for park site selection [20], land cover optimization [21], and vegetation composition renewal [22].
The pattern of UHI effect across the entire urban area exhibits certain spatial gradient differences [23,24], primarily due to the spatial heterogeneity of urban spatial structure, including land use types, land cover, and construction intensity [25]. Existing studies have confirmed these differences. For example, the central heat island intensity of dense urban areas in cities is the strongest [26], the new urban areas in metropolitan areas are more vulnerable to the heat island effect [27], and highly continuous dense and sprawling urban expansion will enhance the heat island effect [28]. As an integral component of urban green space systems, urban parks are directly influenced by factors such as the positioning of urban functional zones [29], socioeconomic factors [30], and differences in heat island patterns [31], which affect their intrinsic characteristics and functions. Additionally, the cold island effect of urban vegetation varies across different gradients [32]. For example, urban parks close to the city center have higher cold island intensity [33], and the different surrounding land coverage will also affect the cold island intensity of the park [34]. These multi-dimensional differences are the objective facts that can not be ignored to promote urban parks to alleviate the UHI effect, and the planning and construction of urban parks should be fully combined with these differences for more targeted and comprehensive consideration. However, at present, the multi-sample comparative study between different gradient regions needs to be improved, and the relevant potential laws are not clear, which makes it difficult to provide differentiated references for the stock renewal and fine management of urban green spaces in the reduction and quality improvement stage.
This study focuses on parks within the central urban area of Beijing, utilizing remote sensing image interpretation and surface temperature inversion techniques. The park cool island intensity (PCI) is selected as the indicator of the cold island effect, and comparative analyses are conducted across three different spatial gradients using mathematical and statistical methods. The aim is to identify the distinct characteristics of urban park green space cold island effects within each gradient, reveal inherent differences, and clarify relevant influencing factors. Such insights are expected to facilitate the proposal of differentiated optimization and management strategies for urban park green space planning and system construction in various regions.
2. Materials and Methods
2.1. Study Area
According to the Beijing City Master Plan (2016–2035), the central urban area comprises six districts: Haidian, Chaoyang, Xicheng, Dongcheng, Shijingshan, and Fengtai, totaling approximately 1378 km2. Due to factors such as high urbanization and population density, the central urban area has long been confronted with severe urban heat island issues [35]. Phenomena such as frequent hot weather, increasing heatwave occurrences, and persistently high nighttime temperatures negatively affect the energy consumption and the quality of life and health conditions of urban residents [36]. The construction of park green spaces serves as an effective means to alleviate the heat island effect in the central urban area. Presently, influenced by various factors such as urban development patterns, land use policies, and planning management, the construction status of parks across different spatial gradients within the region exhibits diversity. In the core old urban areas, park construction faces significant spatial and economic pressures due to high urban density, land scarcity, and relatively high costs. In the central areas adjoining the old urban areas and the suburbs, more available land with relatively lower density allows for the completion of park construction of a certain scale, in alignment with urban development needs. In the outermost suburban areas, although there is ample space for construction, the actual demand for use and the driving force for construction are relatively low. The current conditions of parks within the study area provide a solid foundation for researching the differences in their cold island effects (Figure 1).
In this study, the study area is divided into three spatial gradient regions: within the 3rd ring road (3), between the 3rd and 5th ring roads (3–5), and outside the 5th ring road (5). Based on the list of parks published by the Beijing Municipal Forestry and Parks Bureau, a total of 493 parks are selected as research objects, including 101 parks within the 3rd ring road, 276 parks between the 3rd and 5th ring roads, and 116 parks outside the 5th ring road.
2.2. Data Sources
The main datasets used in this study include Landsat satellite imagery, remote sensing imagery, land use data, park boundary data, land surface temperature (LST) data, Normalized Difference Vegetation Index (NDVI), and ring road data. Landsat 8 OLI_TIRS satellite imagery was downloaded from the United States Geological Survey (USGS) Earth Explorer website for surface temperature inversion. The selected satellite imagery exhibits good quality with minimal cloud cover over the study area. Radiometric calibration and atmospheric correction were conducted to mitigate the effects of sensor and atmospheric factors. Land use data with a spatial resolution of 4 m were derived from 2021 data of the High-Resolution Satellite GaoFen-2 (GF-2). The data were obtained mainly through radiometric calibration, atmospheric correction, image mosaic, geometric correction, and region cropping. Then, it was classified into forestland, grassland, water bodies, farmland, buildings, artificial surfaces, roads, and bare land, and accuracy validation was performed using the support vector machine method with an accuracy of 92.3%. The categories of artificial surfaces and roads were merged as impervious surfaces. Park boundary data were obtained from both the park AOI (Area of Interest) in Baidu Map and data publicly released by the Beijing Municipal Forestry and Parks Bureau. These datasets collectively provide comprehensive information for the analysis and evaluation of park green spaces and their cold island effects within the study area (Table 1).
2.3. Calculation of Park Cool Island Intensity
The Split-Window algorithm [37,38] was employed to compute the LST data for the study area. This method relies on the differential atmospheric absorption between two adjacent thermal infrared channels. By geometrically manipulating the brightness temperatures of these two channels, the atmospheric effects are mitigated, thus allowing for the correction of atmospheric influences. Subsequently, aided by the surface emissivity, the remote sensing inversion of LST is achieved. The Split-Window algorithm is widely recognized as one of the most extensively used and accurate methods for thermal infrared remote sensing inversion of LST.
PCI was calculated by determining the average difference in LST between the park area and the surrounding buffer zone, with
where ∆T represents the PCI, measured in degrees Celsius (°C); LSTB represents the average LST within the buffer zone, measured in degrees Celsius (°C); and LSTP represents the average LST within the park area, measured in degrees Celsius (°C).
The equidistant radius method [39] was employed to calculate the buffer zone radius. This radius is defined as the radius of a circle with an area equal to that of the park area.
where RB represents the radius of the park buffer zone, measured in meters (m); and A represents the park area, measured in square meters (m2).
2.4. Calculation of Relevant Characteristic Indicators of Park Green Spaces
In order to fully explore the potential influencing factors of the cold island effect of park green spaces, based on the effectiveness and feasibility of the research, as well as the value and feasibility of the application of the research results, we selected characteristic indicators from both the internal and external aspects of the parks. Internally, indicators such as area, perimeter, and perimeter–area ratio were chosen to represent the size and shape characteristics of the parks [40]. Additionally, the NDVI was utilized to assess the vegetation condition within the parks [41]. Furthermore, forest coverage, grassland coverage, water coverage, and impervious surface area coverage were selected to represent the basic land use composition within the parks, and most of the existing studies have been carried out around these aspects, and have achieved effective results [42,43]. As the most important vegetation type in the park, forestland is also an element that is easy to optimize the management inside the park [39]. Combined with relevant research [44] and considering the implementation of subsequent green space optimization regulation, the average patch area of forestland is selected to represent its spatial configuration characteristics. Externally, indicators including forest coverage, grassland coverage, water coverage, impervious surface area coverage, and building area coverage within the buffer zone were selected to represent the land use composition surrounding the parks. Previous studies have shown that these land characteristics around the park have a significant impact on its cold island effect [45,46]. The detailed calculation methods for each indicator are presented in Table 2.
2.5. Statistical Analysis
In ArcGIS 10.6, data pertaining to park green space indicators and LST inversion were collected and analyzed. This facilitated an examination of the characteristics of park green spaces and urban heat island effects across different spatial gradients. Based on the PCI results of each park, the distribution characteristics of cool island effects in different spatial gradients were identified. After normalizing the PCI data, K-means cluster analysis was employed to classify parks in different gradients. Pearson correlation analysis was utilized to clarify the relationship between PCI and internal and external characteristic indicators of parks across different spatial gradients. Additionally, stepwise regression analysis was employed to quantify the influence of various characteristic indicators on PCI.
3. Results
3.1. Characteristics of Park Green Spaces across Different Spatial Gradients
The park area in the study area is mainly concentrated within the range of 1 ha to 10 ha, accounting for 43.99% of the total, while those less than 1 ha account for 22.20%, those between 10 ha and 25 ha account for 15.89%, and those larger than 25 ha account for 17.92%. There are also certain differences in distribution across the three gradients, with parks within the 3rd ring road mainly concentrated within 10 ha, those between the 3rd and 5th ring roads mainly concentrated within 15 ha, and those outside the 5th ring road mainly concentrated within 35 ha.
Gradient variances exist in various characteristic indicators within the parks and their buffer zones (Figure 2). The forest cover percentage peaks between the 3rd and 5th ring roads, reaches its lowest point outside the 5th ring road within the parks, and descends to its nadir within the 3rd ring road within the buffer zones. The grassland cover percentage decreases from within the 3rd ring road to outside the 5th ring road. The water cover percentage is highest within the 3rd ring road and lowest between the 3rd and 5th ring roads. The impervious surface percentage is highest outside the 5th ring road, lowest between the 3rd and 5th ring roads within the parks, and diminishes from within the 3rd ring road to outside the 5th ring road within the buffer zones. NDVI peaks between the 3rd and 5th ring roads and is lowest outside the 5th ring road. The percentage of building area within the buffer zones decreases from within the 3rd ring road to outside the 5th ring road.
3.2. Characteristics of the UHI Effect across Different Spatial Gradients
The UHI effect in the study area generally exhibits a pattern of weaker intensity in the north and stronger intensity in the south, gradually diminishing across three spatial gradients within the 3rd ring road, between the 3rd and 5th ring roads, and outside the 5th ring road (Figure 3).
Within the parks, the average and median values of LSTP are lowest in the area between the 3rd and 5th ring roads. In the buffer zones, the average and median values of LSTB are highest in the area within the 3rd ring road and lowest in the area between the 3rd and 5th ring roads (Table 3).
3.3. Characteristics of Park Green Space Cold Island Effect across Different Spatial Gradients
The PCI gradually decreases across three spatial gradients: within the 3rd ring road, between the 3rd and 5th ring roads, and outside the 5th ring road, with average values of 1.77, 1.46, and 1.29 °C, respectively. The corresponding median values are 1.43, 1.21, and 1.17 °C (Figure 4). Spatially, parks exhibiting stronger cold island effects are predominantly concentrated in the innermost areas, while those with weaker effects are more prevalent in the outer regions, indicating a general trend of diminishing intensity from the inner to outer areas (Figure 5).
Through cluster analysis, the parks in the study area were categorized into four groups representing different characteristics of cold island effects. The distribution of these four types of parks varies across different spatial gradients (Figure 6). Within the 3rd ring road, there are more parks classified as types 2 and 4, with type 2 being the most common. In the area between the 3rd and 5th ring roads, parks classified as types 1 and 3 are more prevalent, with type 1 being the most common. Outside the 5th ring road, parks classified as types 1 and 3 are more common, with type 3 being the most prevalent (Table 4).
3.4. Factors Influencing the Cold Island Effect of Urban Park Green Spaces across Different Spatial Gradients
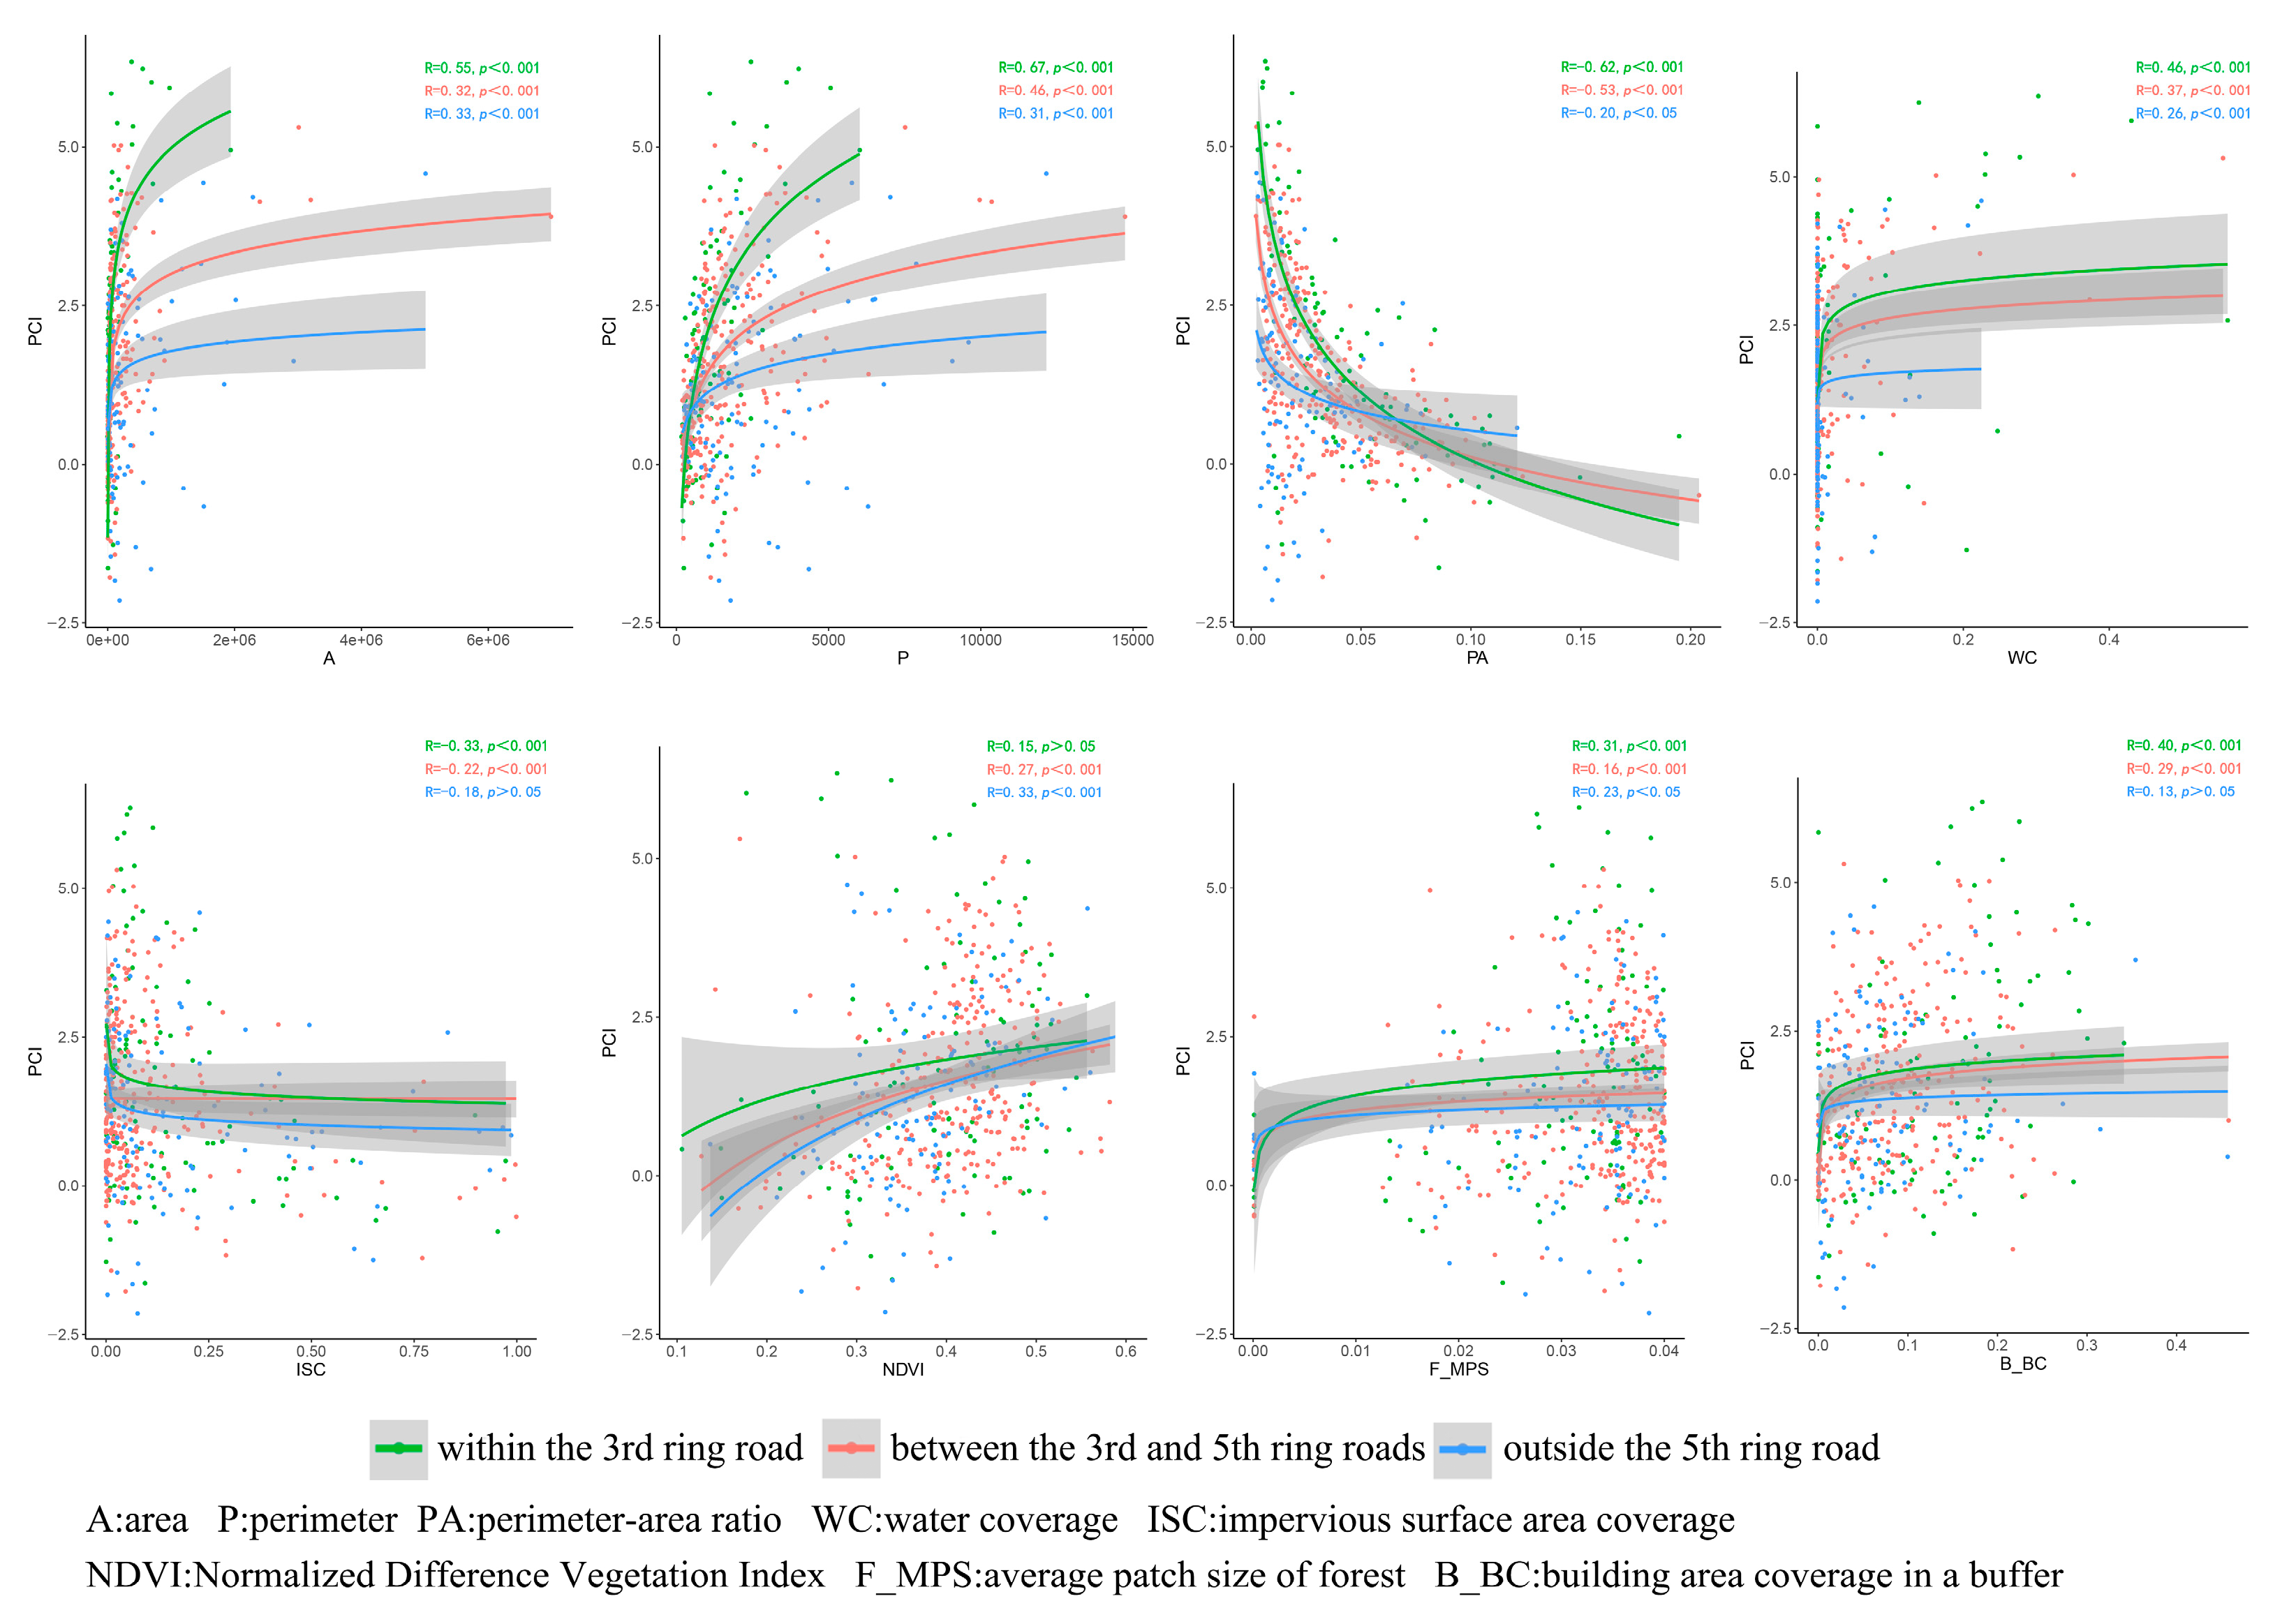
From the correlation analysis, it is evident that certain variables exhibit notable associations. Specifically, A, P, and F_MPS demonstrate significant positive correlations, albeit with varying magnitudes across different spatial gradients. PA demonstrates a significant negative correlation, with the strongest association observed within the 3rd ring road. NDVI displays a significant positive correlation between the 3rd and 5th ring roads as well as outside the 5th ring road, whereas no correlation is discernible within the 3rd ring road. In contrast, ISC exhibits a significant negative correlation within the 3rd ring road and between the 3rd and 5th ring roads, but lacks correlation outside the 5th ring road. B_ISC displays a positive correlation between the 3rd and 5th ring roads (r = 0.21, p < 0.001), while exhibiting no correlation elsewhere (p > 0.05). B_FC showcases a negative correlation between the 3rd and 5th ring roads (r = −0.131, p < 0.05), but does not demonstrate correlation elsewhere (p > 0.05). Moreover, B_GC demonstrates a negative correlation within the 3rd ring road (r = −0.22, p < 0.05), with no correlation observed elsewhere. On the other hand, B_BC presents a significant positive correlation within the 3rd ring road and between the 3rd and 5th ring roads, yet lacks correlation outside the 5th ring road. FC, GC, and B_WC exhibit no discernible correlation across the three gradients (p > 0.05).
The fitted curves of the factors exhibiting significant correlations across two or three spatial gradients reveal insights (Figure 7). In terms of positive correlations, variables such as A, P, WC, and F_MPS approach the PCI threshold first outside the 5th ring road, followed by the region between the 3rd and 5th ring roads, and finally, within the 3rd ring road. NDVI approaches the threshold first between the 3rd and 5th ring roads, followed by outside the 5th ring road. B_BC approaches the threshold first between the 3rd and 5th ring roads, followed by within the 3rd ring road. In terms of negative correlations, PA’s impact on PCI approaches the threshold first outside the 5th ring road, followed by the region between the 3rd and 5th ring roads, and finally, within the 3rd ring road. ISC approaches the threshold first between the 3rd and 5th ring roads, followed by within the 3rd ring road.
The results of the regression analysis reveal the varying performance of the regression equations across different spatial gradients, with optimal performance observed within the 3rd ring and suboptimal performance outside the 5th ring. Specifically, within the 3rd ring, factors such as P, B_BC, and F_MPS exhibit positive effects on the dependent variable, while PA, ISC, B_FC, and GC demonstrate negative effects. In the region between the 3rd and 5th ring roads, WC, NDVI, B_ISC, and B_BC exhibit positive effects, whereas PA, ISC, and B_FC demonstrate negative effects. Outside the 5th ring, NDVI, WC, B_BC, and A show positive effects on the dependent variable (Table 5).
4. Discussion
4.1. The Impact of Spatial Gradients on Urban Park Green Space Cold Island Effect
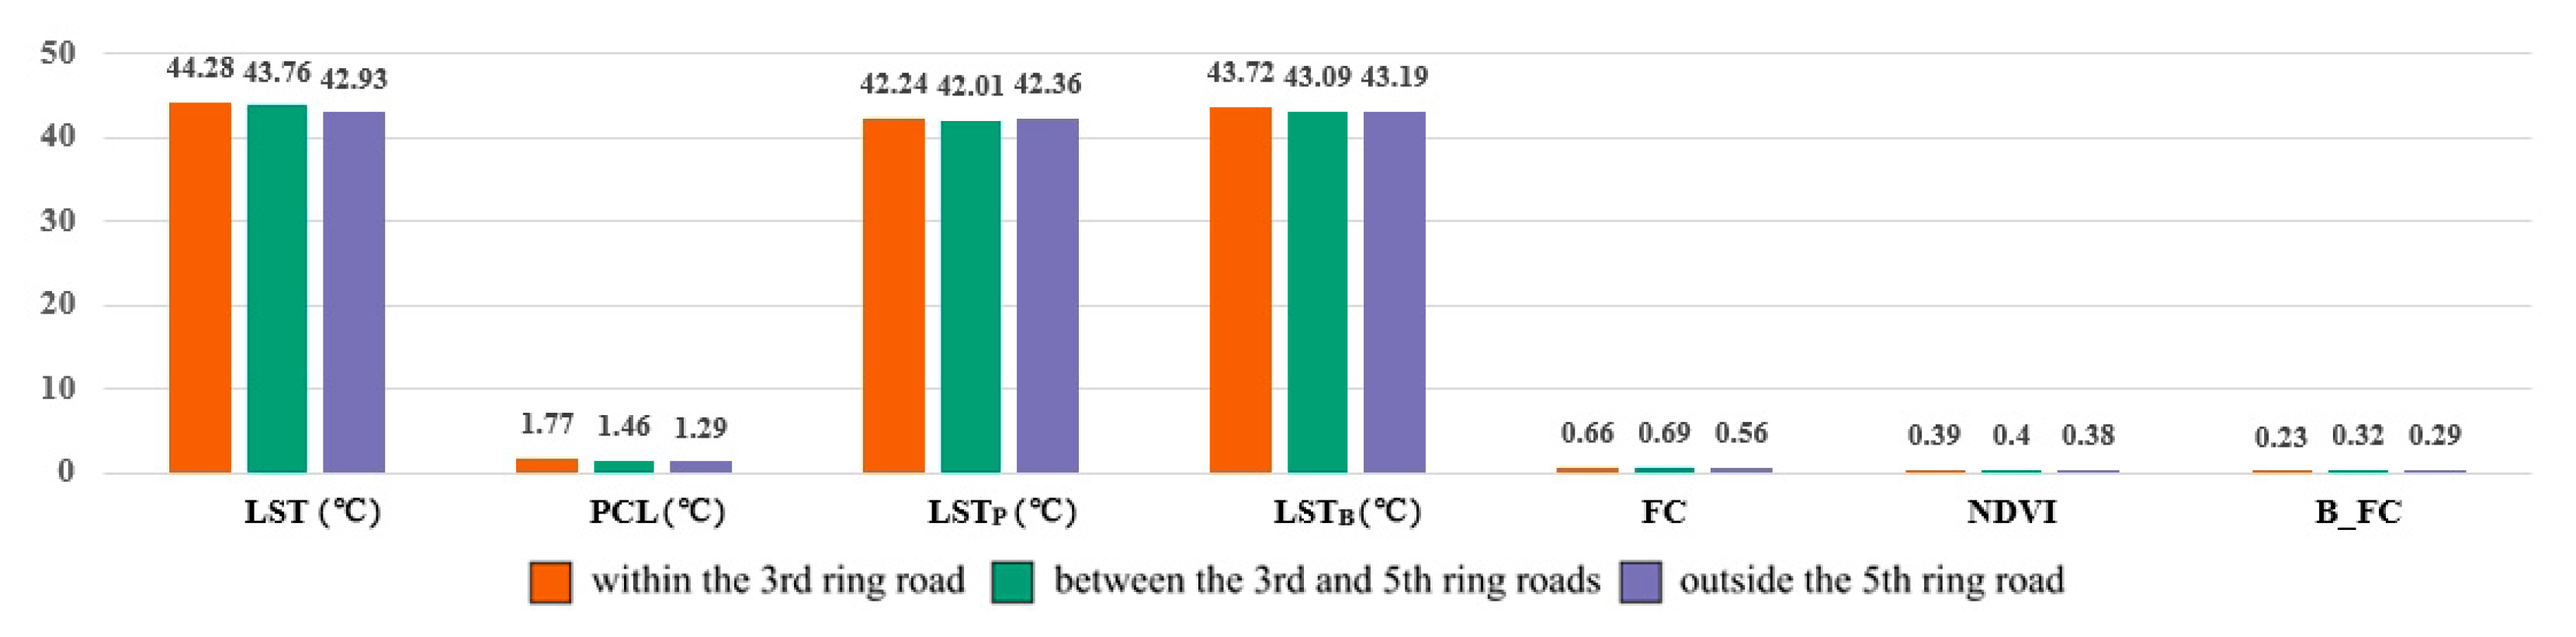
The study reveals that the intensity of the urban heat island effect in the study area gradually decreases from within the 3rd ring road to outside the 5th ring road. This trend is associated with the high density of buildings and roads, dense population, and relatively low vegetation coverage in the central urban area. Conversely, the peripheral areas of the city typically have more vegetation and open spaces, as well as lower-density buildings and roads, which helps mitigate the impact of the heat island effect. Similarly, the intensity of the cold island effect in urban parks also decreases gradually from within the 3rd ring road to outside the 5th ring road. This suggests that in areas where the heat island effect is more severe, urban parks have greater potential for providing cooling effects. In areas farther away from the city center, the surface temperature around urban parks is relatively lower, resulting in less noticeable temperature differences between the interior and exterior areas (Figure 8).
Moreover, the surface temperatures within the parks and buffer zones situated between the 3rd and 5th ring roads exhibit the most notable decrease compared to the other spatial gradients. Considering that the FC, NDVI, and B_FC are the highest among the three spatial gradients, while the ISC is the lowest, this observation may be related to the improvement in overall greenery due to the “First Isolated Green Belt” [47] plan implemented in this region. Under the guidance of this plan, several high-quality urban parks have been successively constructed, forming an urban park ring and significantly improving the living environment of the area [48].
4.2. Spatial Gradient Differences in the Relationship between Urban Park Green Space Characteristics and the UHI Effect
In the three spatial gradients, differences exist in the related characteristics between the urban park interiors and buffer zones, jointly determining the disparities in the park’s cold island effect. Most characteristic indicators exhibit a gradual decrease in correlation with PCI from within the 3rd ring road to outside the 5th ring road. This includes six positive impact indicators: A, P, WC, F_MPS, and B_BC, as well as three negative impact indicators: PA, ISC, and B_GC. On one hand, this may be due to the higher sensitivity of cold island intensity to changes in related characteristic indicators in the 3rd ring road, where the UHI intensity is higher and the park area is smaller. As the heat island intensity decreases and the park area increases, this sensitivity diminishes. On the other hand, it may be due to the more diverse characteristics of land use in the buffer zone of urban peripheral parks, resulting in a more complex impact situation (Table 6).
The correlation between NDVI and PCI gradually strengthens from within the 3rd ring road to outside the 5th ring road, implying that the cold island effect of parks on the urban periphery is more influenced by vegetation quality. Parks with higher-quality vegetation exhibit a stronger cold island effect. B_FC and B_ISC are solely correlated with PCI between the 3rd and 5th ring roads, indicating that forest coverage and impervious surface percentage have a significant impact only in the buffer zones within this range. FC shows no correlation with PCI across the three spatial gradients, but it is significantly negatively correlated with LSTP (r = −0.27, p < 0.001; r = −0.31, p < 0.001; r = −0.39, p < 0.001), indicating that the buffer zone of the park weakens the correlation between FC and PCI.
The multiple regression equations derived from the fitting analysis of pertinent characteristic indicators exhibit higher explanatory capacity within the 3rd ring road and between the 3rd and 5th ring roads. This suggests that the underlying patterns are more discernible in these two gradients, and optimization and control of indicators within these gradients yield superior outcomes compared to areas outside the 5th ring road. All three spatial gradients encompass characteristics from both park interiors and buffer zones, with park interior indicators making a more substantial contribution. Within the 3rd ring road, the most significant factor is the positive impact of the average size of forest patches within the park, signifying that the aggregation of forest patches plays a decisive and positive role in the park’s cold island effect. Between the 3rd and 5th ring roads, the most notable factor is the negative influence of the perimeter–area ratio, indicating that more complex park boundaries with greater contact with the surroundings result in diminished cooling benefits.
4.3. Different Regions Require Tailored Strategies for Optimizing and Managing Urban Park Green Spaces
Utilizing cluster analysis, tailored optimization and management strategies for urban park green spaces can be delineated according to distinct feature categories and spatial distributions. The predominant type 1 parks demonstrate a relatively subdued cold island effect, characterized by lower temperatures within the park and its surrounding buffer zones, indicative of a satisfactory cooling impact. They are predominantly situated between the 3rd and 5th ring roads and outside the 5th ring road. If the surrounding environment exacerbates the heat island effect due to urban development, it is necessary to correspondingly increase the cold island intensity of the parks’ green spaces.
Type 2 parks, typified by a weak cold island effect with elevated temperatures within both the park and buffer zones, are predominantly situated within the 3rd ring road. These parks necessitate substantial optimization and management interventions, focusing on enhancing forest patch aggregation, increasing average patch size, mitigating boundary complexity, and reducing the prevalence of impervious surfaces and grassland coverage. Type 3 parks exhibit a moderate cold island effect, with relatively high temperatures within both the park and buffer zones, indicating untapped potential for improving green space cold island intensity. They are mainly distributed between the 3rd and 5th ring roads and outside the 5th ring road. Optimization strategies may entail simplifying boundary complexity, augmenting water cover proportions, and enhancing the NDVI while minimizing impervious surface percentages. Type 4 parks, representing the minority category, manifest a robust cold island effect, characterized by lower temperatures within the park and elevated temperatures in the buffer zones. Primarily located within the 3rd ring road, these parks warrant prioritized conservation endeavors. These delineated strategies aim to optimize the cooling efficacy of urban park green spaces based on their distinctive attributes and spatial distributions, thereby contributing to the overall alleviation of the UHI effect.
The cooling island effect of green spaces is significantly influenced by seasonal variations, meteorological conditions, and urban development changes. The data used in this study primarily focus on a single time period, failing to consider the comprehensive impact of seasonal changes and long-term trends on the cold island effect. In the future, using data from multiple time points can provide a more comprehensive understanding of the dynamic changes in the cold island effect. Additionally, regarding the selection of park green space characteristics, despite the consideration of multiple representative and instructive indicators based on fundamental park attributes and relevant literature, certain factors influencing the cold island effect may have been inadvertently overlooked. In terms of research and application, the next step can also combine the classification of cold island effect characteristics with the classification standard of park green spaces, and explore the differences in emphasis and tradeoff strategies of different types of parks in the optimization and improvement of cold island effect. Furthermore, this study mainly focused on Beijing, while the geographical environment, climatic characteristics, and planning and construction differ significantly in different regions. When extrapolating the research results to other cities, it is necessary to carefully consider the specificity and heterogeneity of different regions. Future research could involve selecting more urban samples to explore the more universal mechanisms of the impact of green space cold island effects.
5. Conclusions
This study focused on Beijing and conducted a comparative analysis of the cold island effect of park green spaces across different spatial gradients. The findings indicate the following: (1) Spatial gradient differences exist in both park green space characteristics and UHI, collectively influencing the cold island effect of urban park green spaces. Within the parks and their buffer zones, the lowest average and median values of LST are observed between the 3rd and 5th ring roads. The PCI gradually decreases across three spatial gradients: within the 3rd ring road, between the 3rd and 5th ring roads, and outside the 5th ring road, with median values of 1.43 °C, 1.21 °C, and 1.17 °C, respectively. (2) Through cluster analysis, four distinct types of parks with different cold island effect characteristics were identified. Over half of the parks, mainly belonging to types 2 and 3, require optimization and improvement, whereas only about one-fifth of the parks exhibit a strong cold island effect (type 4). For type 2 parks, specific optimization measures include planting more trees and vegetation, expanding existing green spaces and merging smaller patches, removing unnecessary structures that disrupt the continuity of green spaces to simplify park boundaries, replacing impermeable surfaces such as concrete or asphalt with permeable materials, and replacing some grassy areas with trees or shrubs. For type 3 parks, specific optimization measures include removing unnecessary structures that disrupt the continuity of green spaces to simplify park boundaries, expanding the area of water bodies, planting more trees and vegetation, and replacing impermeable surfaces such as concrete or asphalt with permeable materials. (3) Various park green space characteristics exhibit disparate correlations with PCI, and these correlations display discrepancies in strength and thresholds across different gradients. (4) The effectiveness of regression equations in predicting PCI declines progressively from within the 3rd ring road to outside the 5th ring road. Within the 3rd ring road, factors such as F_MPS, PA, and ISC exert substantial influences on PCI, whereas between the 3rd and 5th ring roads, PA, WC, and NDVI emerge as significant factors impacting PCI. Building upon previous studies that primarily focused on the overall perspective, this study adopted a less-explored approach by considering different spatial gradients. By investigating the influence mechanisms of the cold island effect under varying gradients of urban park green spaces and UHI patterns, it uncovered certain characteristics and patterns that were not identified in previous holistic studies. This contributes to identifying potential issues related to spatial gradient changes. The findings have expanded the understanding of the cold island effect of urban park green spaces to some extent. They aid in proposing diverse optimization management strategies for urban park green space planning and system construction in different regions, thereby enabling parks to better manifest their cold island effect and mitigate the adverse impacts of the UHI phenomenon. However, there are still limitations in the selection of park green space characteristic indicators and the scope of research application. Further research is needed to explore more urban samples, areas, regions, and time periods in order to address these limitations.
Author Contributions
Conceptualization, C.X. and H.Z.; methodology, C.X.; investigation, C.X. and W.W.; software, C.X. and W.W.; writing—original draft preparation, C.X.; writing—review and editing, C.X.; supervision, H.Z.; project administration, H.Z. All authors have read and agreed to the published version of the manuscript.
Funding
This research was funded by the Research and Development Project of the Ministry of Housing and Urban–Rural Development, a project supported by the Beijing Advanced Innovation Center for Future Urban Design, grant number 2022-K-024; Qinghai Province Science and Technology Achievement Transformation Special Project, grant number 2022-SF-159.
Data Availability Statement
Data are contained within the article.
Conflicts of Interest
Author Wenjing Wang was employed by the company China Urban Construction Design & Research Institute Co., Ltd. The remaining authors declare that the research was conducted in the absence of any commercial or financial relationships that could be construed as a potential conflict of interest.
References
- Dong, X.; Meng, Z.; Wang, Y.; Zhang, Y.; Sun, H.; Wang, Q. Monitoring Spatiotemporal Changes of Impervious Surfaces in Beijing City Using Random Forest Algorithm and Textural Features. Remote Sens. 2021, 13, 153. [Google Scholar] [CrossRef]
- Hendel, M.; Azos-Diaz, K.; Tremeac, B. Behavioral adaptation to heat-related health risks in cities. Energy Build. 2016, 152, 823–829. [Google Scholar] [CrossRef]
- Levermore, G.; Parkinson, J.; Lee, K.; Laycock, P.; Lindley, S. The increasing trend of the urban heat island intensity. Urban Clim. 2018, 24, 360–368. [Google Scholar] [CrossRef]
- Halder, B.; Bandyopadhyay, J.; Banik, P. Evaluation of the Climate Change Impact on Urban Heat Island Based on Land Surface Temperature and Geospatial Indicators. Int. J. Environ. Res. 2021, 15, 819–835. [Google Scholar] [CrossRef]
- Kamal, A.; Mahfouz, A.; Sezer, N.; Hassan, I.G.; Wang, L.L.; Rahman, M.A. Investigation of urban heat island and climate change and their combined impact on building cooling demand in the hot and humid climate of Qatar. Urban Clim. 2023, 52, 101704. [Google Scholar] [CrossRef]
- Yang, X.; Chen, B.; Hu, K. A Review of Impacts of Urbanization on Extreme Heat Events. Prog. Geogr. 2015, 34, 1219–1228. [Google Scholar]
- Eugenia, K.; Ming, C. Impact of Urbanization and Land-use Change on Climate. Nature 2003, 423, 528–531. [Google Scholar]
- Yu, Z.; Guo, Q.; Sun, R. Impacts of Urban Cooling Effect Based on Landscape Scale: A Review. J. Appl. Ecol. 2015, 26, 636–642. [Google Scholar]
- Gao, Z.; Zaitchik, B.F.; Hou, Y.; Chen, W. Toward park design optimization to mitigate the urban heat Island: Assessment of the cooling effect in five U.S. cities. Sustain. Cities Soc. 2022, 81, 103870. [Google Scholar] [CrossRef]
- Wang, X.; Kong, F.H.; Yin, H.; Xu, H.; Li, J.; Pu, Y. Characteristics of Vegetation Shading and Transpiration Cooling Effects During Hot Summer. Acta Ecol. Sin. 2018, 38, 4234–4244. [Google Scholar]
- Du, H.; Song, X.; Jiang, H.; Kan, Z.; Wang, Z.; Cai, Y. Research on the Cooling Island Effects of Water Body: A Case Study of Shanghai, China. Ecol. Indic. 2016, 67, 31–38. [Google Scholar] [CrossRef]
- Hien, W.; Liang, T.; Denia, K.D.; Hideki, T. Greenery as a Mitigation and Adaptation Strategy to Urban Heat. Nat. Rev. Earth Environ. 2021, 2, 166–181. [Google Scholar]
- Feyisa, G.L.; Dons, K.; Meilby, H. Efficiency of Parks in Mitigating Urban Heat Island Effect: An Example From Addis Ababa. Landsc. Urban Plan. 2014, 123, 87–95. [Google Scholar] [CrossRef]
- Yue, X.; Lin, J.; Yang, Y. Mitigation Role of Urban Green Space in Reducing Heat Island Effect—A Case Study of Central Urban Area of Baoding City. Landsc. Arch. 2018, 25, 66–70. [Google Scholar]
- Zhao, H.; Hu, M.; Zhu, J.; Huang, T.; Zhang, Y.; Li, Y.; Yan, M. Blue-green Space Cooling Effect and Its Influencing Factors in Metropolitan Area: A Case Study on the Area Within the 5th ring Road in Beijing. Acta Ecol. Sin. 2023, 43, 4904–4919. [Google Scholar]
- Yin, R.; Fang, J.; Zhu, D.; Hu, Y. Measurement of Cooling Efficiency in Urban Parks and Strategies for Climate Adaptation Design. Chin. Landsc. Arch. 2022, 38, 121–126. [Google Scholar]
- Du, H.; Cai, W.; Xu, Y.; Wang, Z.; Wang, Y.; Cai, Y. Quantifying the Cool Island Effects of Urban Green Spaces Using Remote Sensing Data. Urban For. Urban Green. 2017, 27, 24–31. [Google Scholar] [CrossRef]
- Qiu, K.; Jia, B. The Roles of Landscape Both Inside the Park and the Surroundings in Park Cooling Effect. Sustain. Cities Soc. 2020, 52, 101864. [Google Scholar] [CrossRef]
- Su, W.; Chang, Q. Nature-based Solutions for Urban Heat Mitigation and Implementation Path Thereof: A Case Study of Beijing. Landsc. Arch. 2022, 29, 26–32. [Google Scholar]
- García-Haro, A.; Arellano, B.; Roca, J. Quantifying the influence of design and location on the cool island effect of the urban parks of Barcelonaes. J. Appl. Remote Sens. 2023, 17, 034512. [Google Scholar] [CrossRef]
- Zhu, W.; Sun, J.; Yang, C.; Liu, M.; Xu, X.; Ji, C. How to Measure the Urban Park Cooling Island? A Perspective of Absolute and Relative Indicators Using Remote Sensing and Buffer Analysis. Remote Sens. 2021, 13, 3154. [Google Scholar] [CrossRef]
- Hwang, B.; Sou, H.D.; Oh, J.H.; Park, C.R. Cooling effect of urban forests on the urban heat island in Seoul, South Korea. PLoS ONE 2023, 18, e0288774. [Google Scholar] [CrossRef]
- Xue, X.; He, T.; Xu, L.; Tong, C.; Ye, Y.; Liu, H.; Xu, D.; Zheng, X. Quantifying the Spatial Pattern of Urban Heat Islands and the Associated Cooling Effect of Blue–green Landscapes Using Multisource Remote Sensing Data. Sci. Total Environ. 2022, 843, 156829. [Google Scholar] [CrossRef]
- Yi, Y.; Shen, G.; Zhang, C.; Sun, H.; Zhang, Z.; Yin, S. Quantitative analysis and prediction of urban heat island intensity on urban-rural gradient: A case study of Shanghai. Sci. Total Environ. 2022, 829, 154264. [Google Scholar] [CrossRef]
- You, X.; LI, Q.; Meng, Q. Research on Spatial Patterns and Morphological Differentiation Control Strategy of Urban Heat Islands—A Case Study of Downtown Area of Guangzhou City. Landsc. Arch. 2021, 28, 74–79. [Google Scholar]
- Kabisch, N.; Remahne, F.; Ilsemann, C.; Fricke, L. The urban heat island under extreme heat conditions: A case study of Hannover, Germany. Sci. Rep. 2023, 13, 23017. [Google Scholar] [CrossRef]
- You, M.; Huang, J.; Guan, C. Are New Towns Prone to Urban Heat Island Effect? Implications for Planning Form and Function. Sustain. Cities Soc. 2023, 99, 104939. [Google Scholar] [CrossRef]
- Debbage, N.; Shepherd, J.M. The urban heat island effect and city contiguity. Comput. Environ. Urban Syst. 2015, 54, 181–194. [Google Scholar] [CrossRef]
- Wang, Q.; Peng, J.; Yu, S.; Dan, Y.; Dong, J.; Zhao, X.; Wu, J. Key Attributes of Greenspace Pattern for Heat Mitigation Vary with Urban Functional Zones. Landsc. Arch. 2023, 38, 2965–2979. [Google Scholar] [CrossRef]
- Yang, J.; Guo, R.; Li, D.; Wang, X.; Li, F. Interval-thresholding Effect of Cooling and Recreational Services of Urban Parks in Metropolises. Sustain. Cities Soc. 2022, 79, 103684. [Google Scholar] [CrossRef]
- Melaas, E.K.; Wang, J.A.; Miller, D.L.; Friedl, M.A. Interactions between urban vegetation and surface urban heat islands: A case study in the Boston metropolitan region. Environ. Res. Lett. 2016, 11, 054020. [Google Scholar] [CrossRef]
- Qiu, K.; Zhang, H.; Gao, J.; Pei, W.; Zhang, B.; Wang, M.; Wang, Q. Variation of Cool Island Effect for Urban Forest Patches Across an Urban-rural Gradient in Shanghai. Chin. J. Ecol. 2021, 40, 1409–1418. [Google Scholar]
- Algretawee, H.; Rayburg, S.; Neave, M. Estimating the effect of park proximity to the central of Melbourne city on Urban Heat Island (UHI) relative to Land Surface Temperature (LST). Ecol. Eng. 2019, 138, 374–390. [Google Scholar] [CrossRef]
- Tian, P.; Li, J.; Pu, R.; Cao, L.; Liu, Y.; Zhang, H. Assessing the cold island effect of urban parks in metropolitan cores: A case study of Hangzhou, China. Environ. Sci. Pollut. Res. Int. 2023, 30, 80931–80944. [Google Scholar] [CrossRef]
- Jiang, L.; Xie, M.; Chen, B.; Su, W.; Zhao, X.; Wu, R. Key areas and measures to mitigate heat exposure risk in highly urbanized city: A case study of Beijing, China. Urban Clim. 2024, 53, 101748. [Google Scholar] [CrossRef]
- Qiao, Z.; Huang, N.; Xu, X.; Sun, Z.; Wu, C.; Yang, J. Spatio-temporal Pattern and Evolution of the Urban Thermal Landscape in Metropolitan Beijing Between 2003 and 2017. Acta Geogr. Sin. 2019, 74, 475–489. [Google Scholar]
- Du, C.; Ren, H.; Qin, Q.; Meng, J.; Zhao, S. A Practical Split-window Algorithm for Estimating Land Surface Temperature From Landsat 8 Data. Remote Sens. 2015, 7, 647–665. [Google Scholar] [CrossRef]
- Ren, H.; Du, C.; Liu, R.; Qin, Q.; Yan, G.; Li, Z.; Meng, J. Atmospheric Water Vapor Retrieval From Landsat 8 Thermal Infrared Images. J. Geophys. Res. 2015, 120, 1723–1738. [Google Scholar] [CrossRef]
- Liao, W.; Guldmann, J.; Hu, L.; Cao, Q.; Gan, D.; Li, X. Linking Urban Park Cool Island Effects to the Landscape Patterns Inside and Outside the Park: A Simultaneous Equation Modeling Approach. Landsc. Urban Plan. 2023, 232, 104681. [Google Scholar] [CrossRef]
- Peng, J.; Dan, Y.; Qiao, R.; Liu, Y.; Dong, J.; Wu, J. How to quantify the cooling effect of urban parks? Linking maximum and accumulation perspectives. Remote Sens. Environ. 2021, 252, 112135. [Google Scholar] [CrossRef]
- Dos Santos, A.R.; de Oliveira, F.S.; da Silva, A.G.; Gleriani, J.M.; Gonçalves, W.; Moreira, G.L.; Silva, F.G.; Branco, E.R.F.; Moura, M.M.; da Silva, R.G.; et al. Spatial and temporal distribution of urban heat islands. Sci. Total Environ. 2017, 605–606, 946–956. [Google Scholar] [CrossRef] [PubMed]
- Lin, J.; Deng, Y.; Chen, S.; Li, K.; Ji, W.; Li, W. Research Progress of Urban Park Microclimate Based on Quantitative Statistical Software. Buildings 2023, 13, 2335. [Google Scholar] [CrossRef]
- Chang, C.R.; Li, M.H. Effects of urban parks on the local urban thermal environment. Urban For. Urban Green. 2014, 13, 672–681. [Google Scholar] [CrossRef]
- Jiao, M.; Zhou, W.; Qian, Y.; Wang, J.; Zheng, Z.; Hu, X.; Wang, W. Influences of Patch Size on the Cooling Capacity of Urban Greenspace: Progresses, Problems and Perspectives. Acta Ecol. Sin. 2021, 41, 9154–9163. [Google Scholar]
- Xue, S.; Yuan, L.; Wang, K.; Wang, J.; Pei, Y. Comparing the Impact of Urban Park Landscape Design Parameters on the Thermal Environment of Surrounding Low-Rise and High-Rise Neighborhoods. Forests 2023, 14, 1682. [Google Scholar] [CrossRef]
- Liang, Z.; Li, Z.; Fan, Z. Seasonal impacts of built environment and its interactions on urban park cooling effects in Nanjing, China. Build. Environ. 2023, 242, 110580. [Google Scholar] [CrossRef]
- Sun, Z. Thermal Environment Characteristic and Cooling Effect of Greenery in Beijing First Green Belt Area. Chin. J. Ecol. 2019, 38, 3496–3505. [Google Scholar]
- Wang, Y.; Chang, Q.; Li, X. Promoting sustainable carbon sequestration of plants in urban greenspace by planting design: A case study in parks of Beijing. Urban For. Urban Green. 2021, 64, 127291. [Google Scholar] [CrossRef]
Figure 1.
The location of the study area.
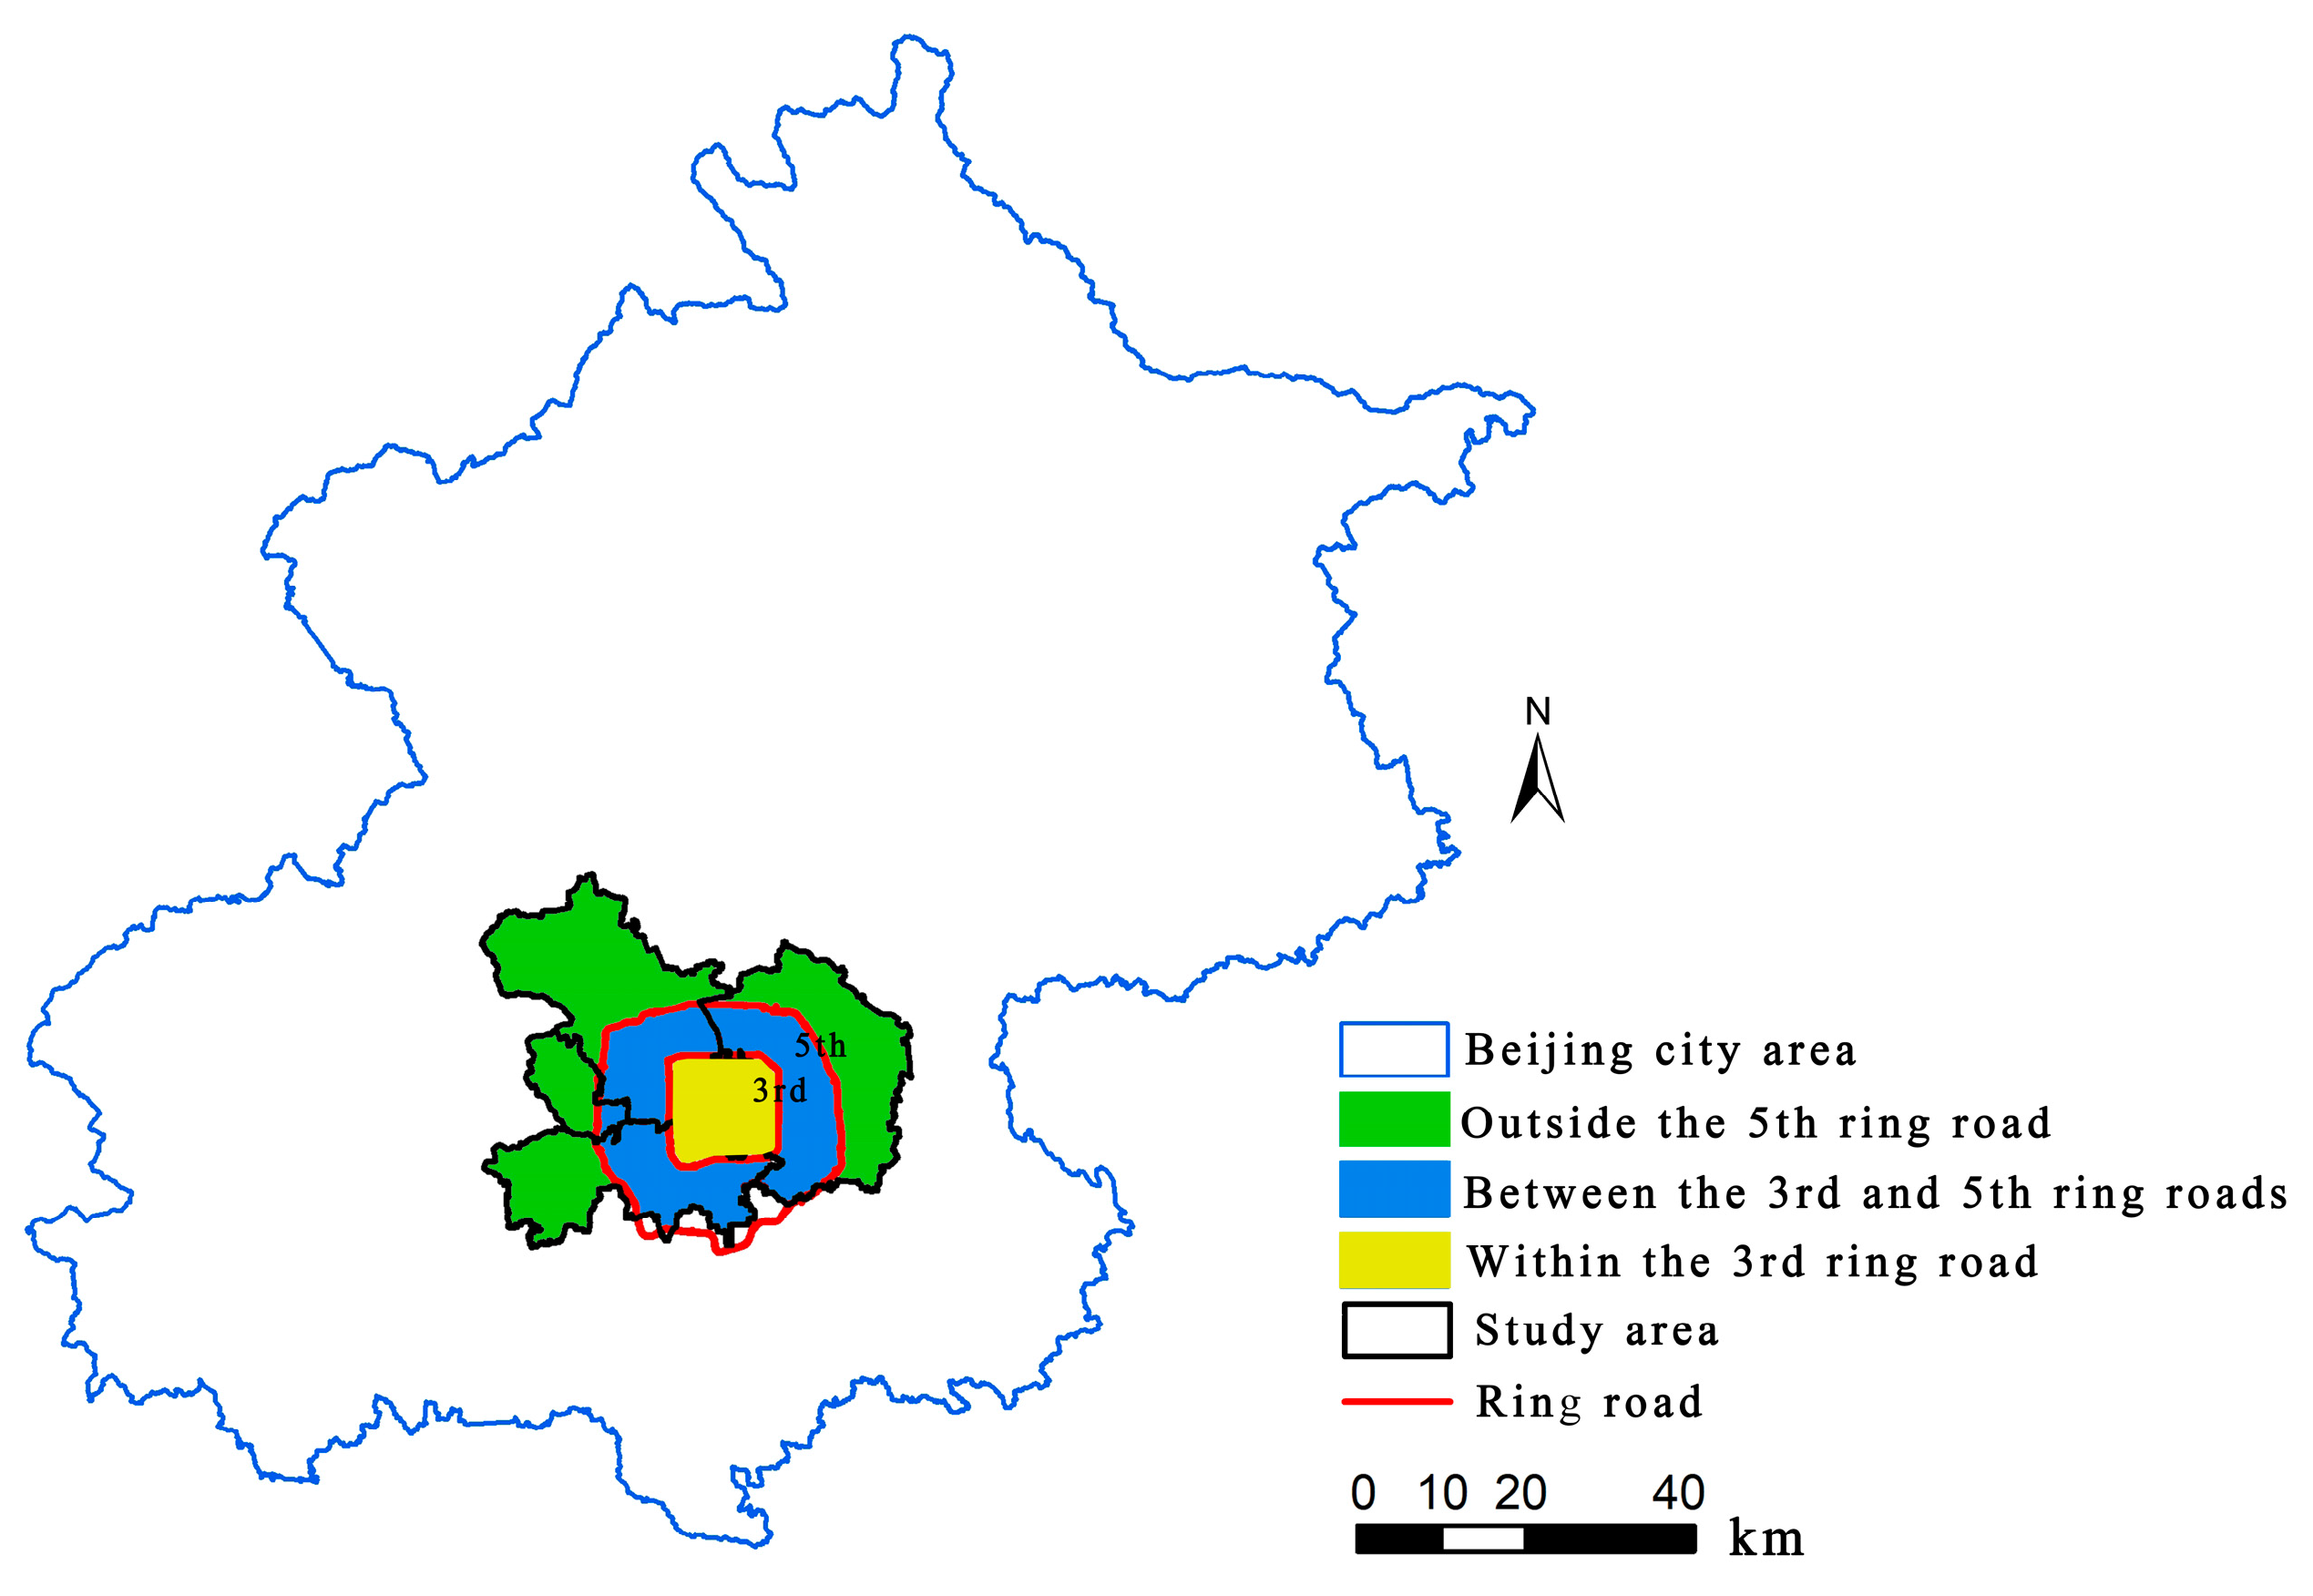
Figure 2.
Various characteristic indicators within parks and their buffer zones across different spatial gradients.
Figure 2.
Various characteristic indicators within parks and their buffer zones across different spatial gradients.
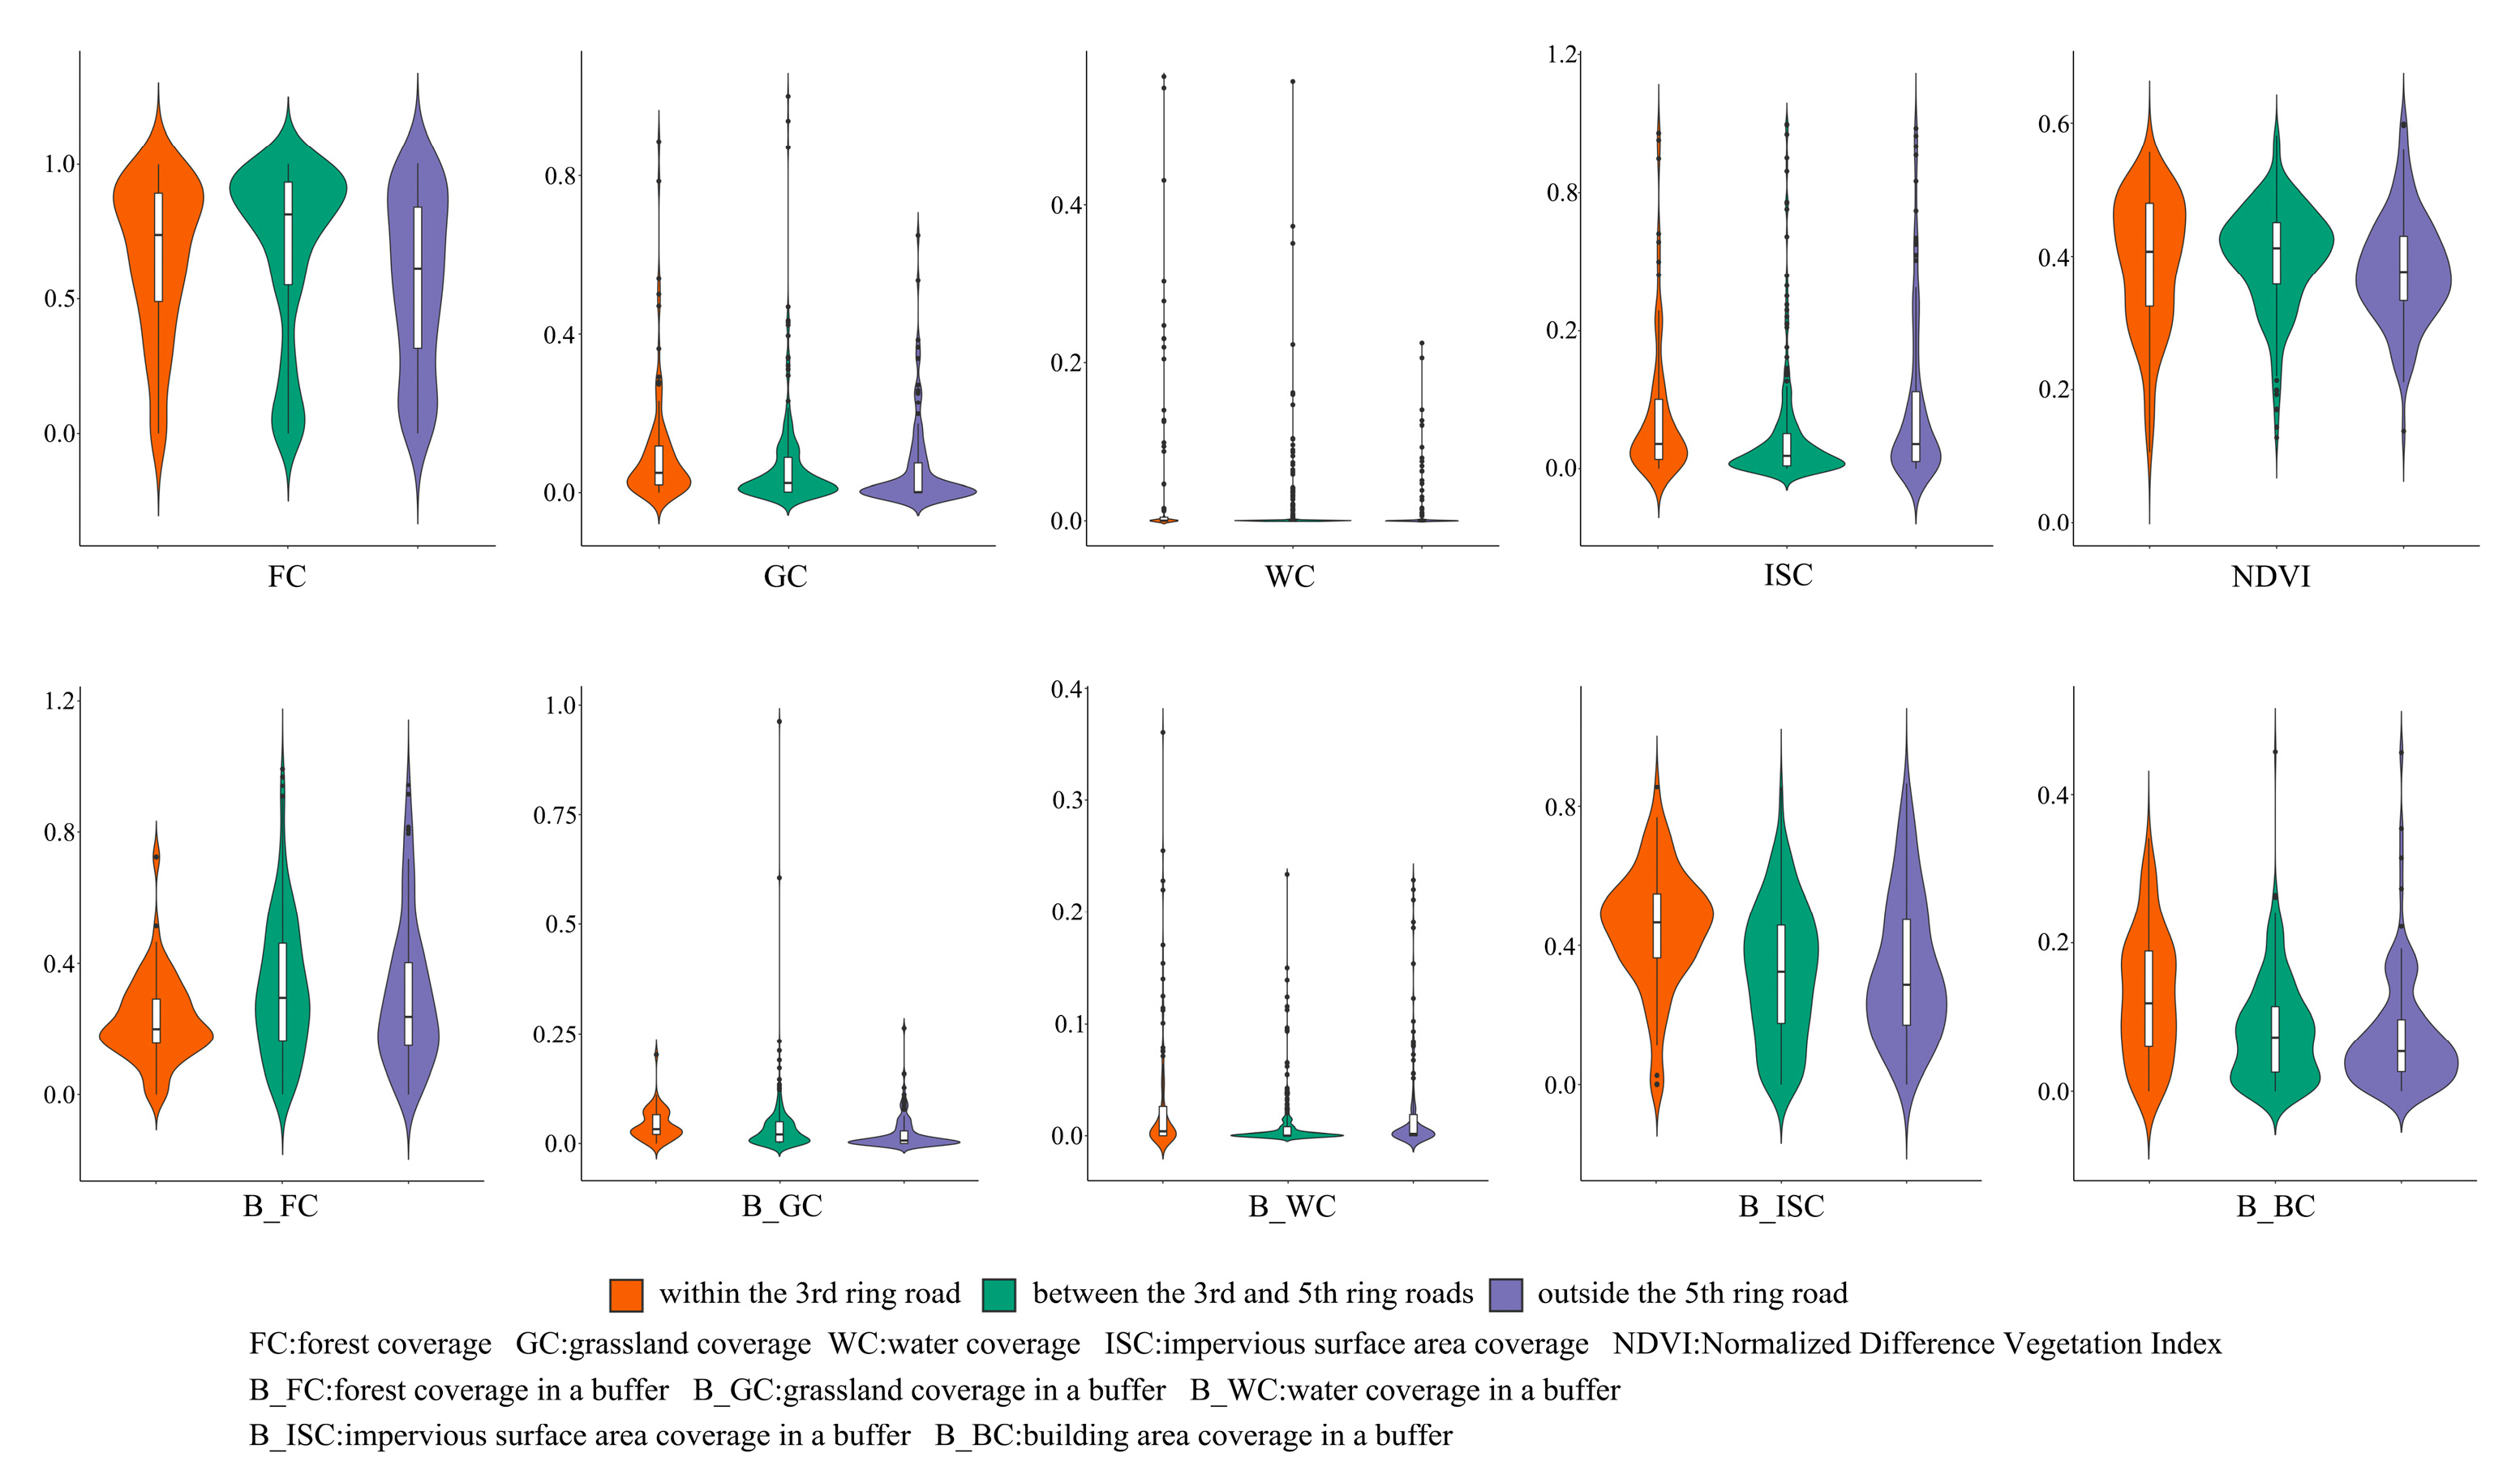
Figure 3.
Distribution of LST in the study area.
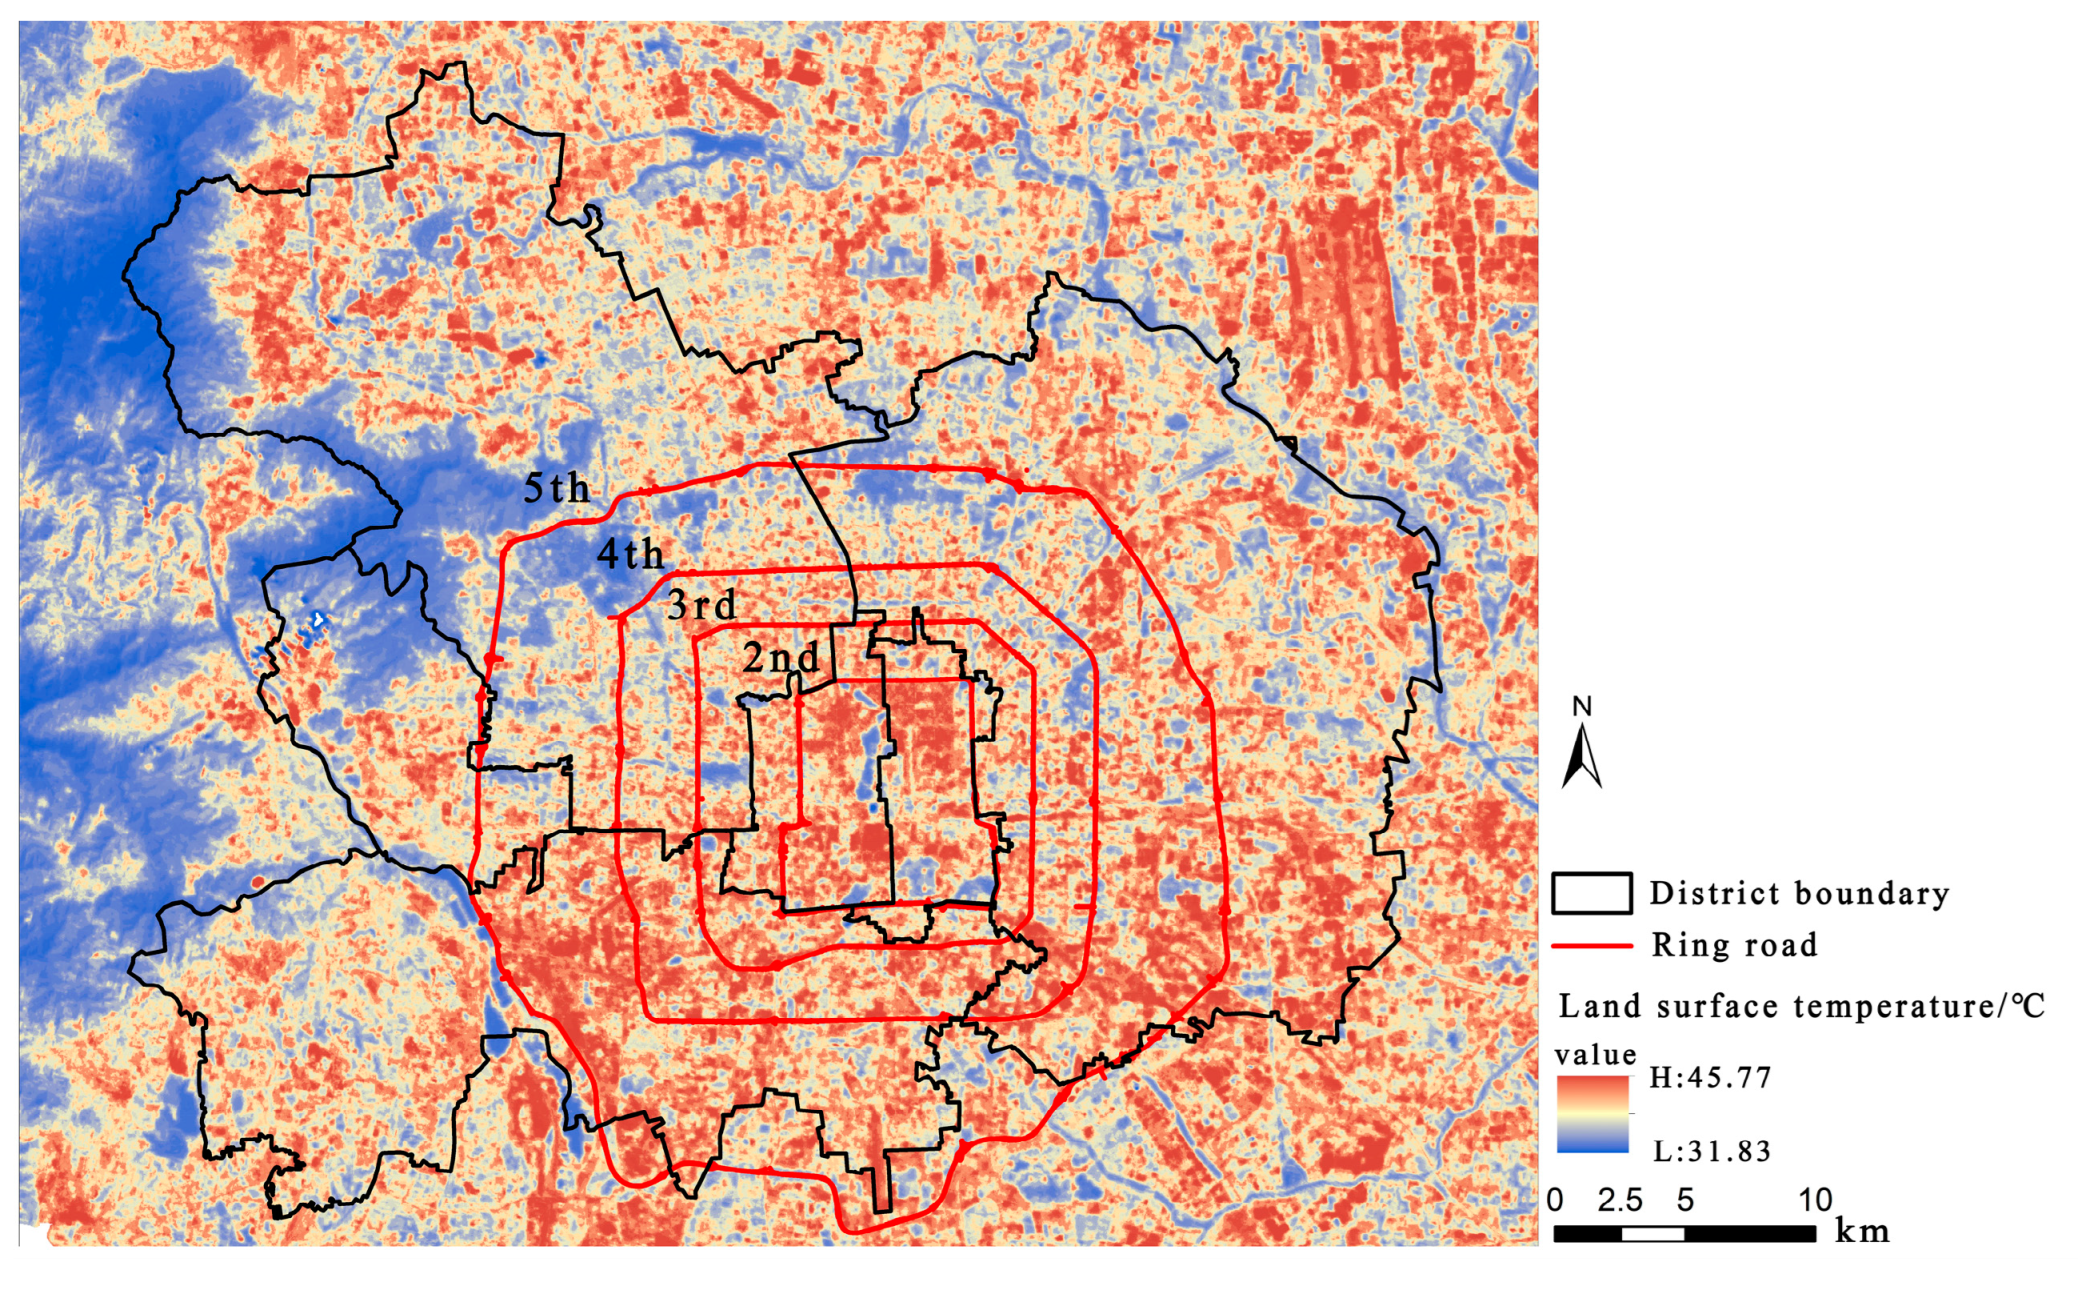
Figure 4.
The PCI varies across different spatial gradients.

Figure 5.
Distribution of cold island effect in park green spaces across different spatial gradients.
Figure 5.
Distribution of cold island effect in park green spaces across different spatial gradients.

Figure 6.
Distribution of the 4 types of parks with cold island effects across different spatial gradients.
Figure 6.
Distribution of the 4 types of parks with cold island effects across different spatial gradients.
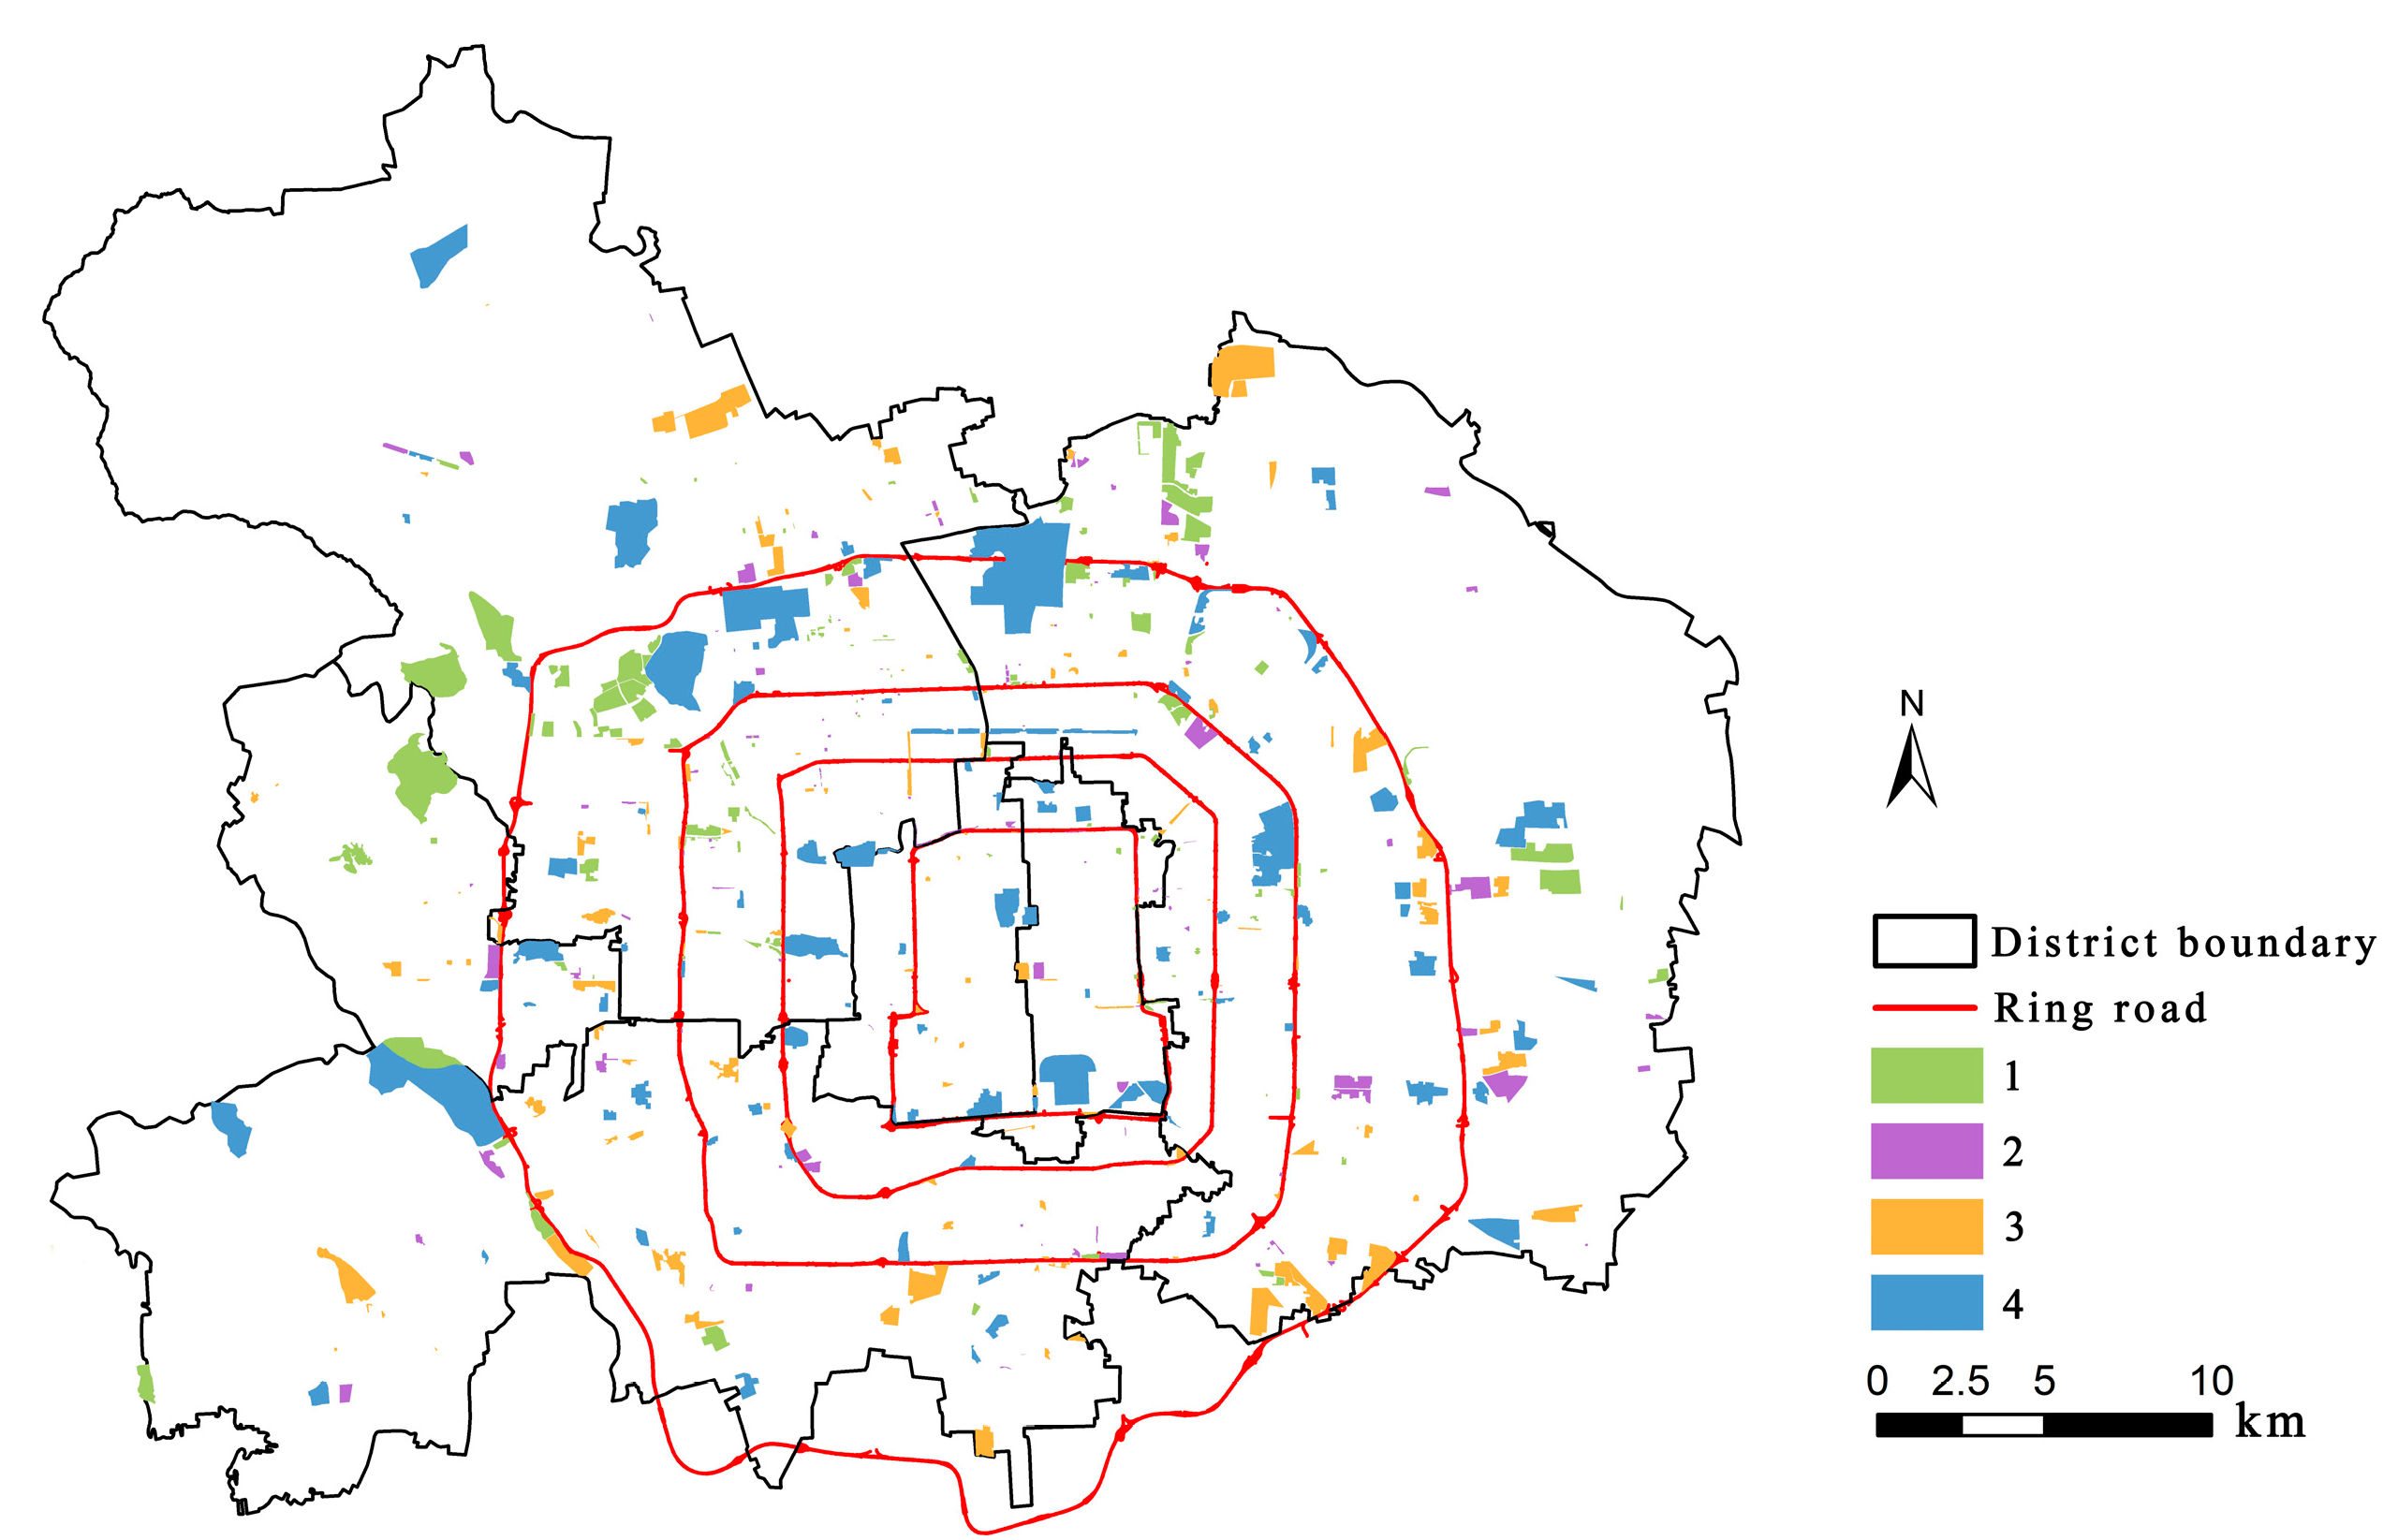
Figure 7.
The fitting situation of the factors exhibiting significant correlations across two or more spatial gradients.
Figure 7.
The fitting situation of the factors exhibiting significant correlations across two or more spatial gradients.

Figure 8.
The difference in the mean values of each indicator on three gradients.


Table 1.
Research data and sources.
| Research Data | Types | Sources |
|---|---|---|
| Landsat 8 OLI_TIRS satellite imagery | Raster data (30 m) | USGS http://earthexplorer.usgs.gov/ (accessed on 14 June 2021) |
| Remote sensing imagery | Raster data | GF-2 |
| Land use data | Raster data (4 m) | Derived from GF-2 satellite imagery |
| Park boundary data | Shapefile | AOI in Baidu Map, Beijing Municipal Forestry and Parks Bureau |
| LST data | Raster data (30 m) | Derived from Landsat satellite imagery |
| NDVI | Raster data (30 m) | Derived from Landsat satellite imagery |
| Ring road data | Shapefile | Open Street Map (OSM) |
Table 2.
Relevant characteristic indicators of park green spaces.
| Indicator (Abbreviation) | Description | Unit | Calculation Method |
|---|---|---|---|
| Area (A) | Area of a park | ha | Geometric statistics calculation in ArcGIS 10.6 |
| Perimeter (P) | Total perimeter of a park | m | Geometric statistics calculation in ArcGIS 10.6 |
| Perimeter–area ratio (PA) | Overall compactness of a park | Dimensionless | |
| NDVI | Vegetation condition within a park | Dimensionless | and represent the pixel values of the near-infrared band and the red band, respectively |
| Forest coverage (FC) | Percentage of forest cover in a park | % | |
| Grassland coverage (GC) | Percentage of grassland cover in a park | % | |
| Water coverage (WC) | Percentage of water cover in a park | % | |
| Impervious surface area coverage (ISC) | Percentage of impervious surface area in a park | % | |
| Average patch size of forest (F_MPS) | Average size of forest patches in a park | ha | Calculation using Fragstats 4.2 |
| Forest coverage in a buffer (B_FC) | Percentage of forest cover in a buffer | % | |
| Grassland coverage in a buffer (B_GC) | Percentage of grassland cover in a buffer | % | |
| Water coverage in a buffer (B_WC) | Percentage of water cover in a buffer | % | |
| Impervious surface area coverage in a buffer (B_ISC) | Percentage of impervious surface area in a buffer | % | |
| Building area coverage in a buffer (B_BC) | Percentage of building area in a buffer | % |
Table 3.
Temperature variations within parks and buffer zones across different spatial gradients.
| °C | 3 | 3–5 | 5 | |
|---|---|---|---|---|
| LSTP | Average value | 42.24 | 42.01 | 42.36 |
| Median value | 42.35 | 42.09 | 42.33 | |
| LSTB | Mean value | 43.72 | 43.09 | 43.19 |
| Median value | 43.92 | 43.26 | 43.48 |
Table 4.
Four types of parks with cold island effect characteristics across different spatial gradients.
Table 4.
Four types of parks with cold island effect characteristics across different spatial gradients.
| Type | Cluster Center | Characteristic | 3 | 3–5 | 5 | Total | ||
|---|---|---|---|---|---|---|---|---|
| PCI | LSTP | LSTB | ||||||
| 1 | 0.33 | 0.47 | 0.48 | The cold island effect is weak, with lower temperatures observed both within the park and in the buffer zone. | 17 | 92 | 34 | 143 |
| 2 | 0.32 | 0.88 | 0.86 | The cold island effect is weak, with high temperatures observed both within the park and in the buffer zone. | 33 | 62 | 26 | 121 |
| 3 | 0.49 | 0.65 | 0.75 | The cold island effect is moderate, with relatively high temperatures observed both within the park and in the buffer zone. | 24 | 71 | 38 | 133 |
| 4 | 0.73 | 0.40 | 0.74 | The cold island effect is strong, with lower temperatures observed within the park and higher temperatures in the buffer zone. | 27 | 51 | 18 | 96 |
Table 5.
Regression analysis results for different spatial gradients.
| Non-Standardized Coefficient | p | R2 | F | ||
|---|---|---|---|---|---|
| B | |||||
| 3 | Constant | 5.262 | 0.000 ** | 0.681 | F = 31.206, p = 0.000 |
| P | 0.001 | 0.000 ** | |||
| PA | −21.200 | 0.000 ** | |||
| ISC | −4.758 | 0.000 ** | |||
| B_FC | −3.176 | 0.001 ** | |||
| B_BC | 3.096 | 0.025 * | |||
| F_MPS | 72.813 | 0.001 ** | |||
| GC | −2.325 | 0.014 * | |||
| 3–5 | Constant | −0.884 | 0.003 ** | 0.580 | F = 48.424, p = 0.000 |
| PA | −13.341 | 0.000 ** | |||
| WC | 9.101 | 0.000 ** | |||
| NDVI | 5.677 | 0.000 ** | |||
| B_ISC | 1.648 | 0.000 ** | |||
| ISC | −1.782 | 0.000 ** | |||
| B_FC | −1.049 | 0.000 ** | |||
| B_BC | 1.883 | 0.043 * | |||
| 5 | Constant | −1.727 | 0.004 ** | 0.264 | F = 11.230, p = 0.000 |
| NDVI | 6.404 | 0.000 ** | |||
| WC | 10.386 | 0.002 ** | |||
| B_BC | 3.840 | 0.012 * | |||
| A | 4.286 × 10⁻⁷ | 0.022 * | |||
* p < 0.05, ** p < 0.01.
Table 6.
Correlation results of park green space-related characteristic indicators and PCI with different spatial gradients.
Table 6.
Correlation results of park green space-related characteristic indicators and PCI with different spatial gradients.
| PCI | |||
|---|---|---|---|
| 3 | 3–5 | 5 | |
| A | 0.546 ** | 0.319 ** | 0.327 ** |
| P | 0.670 ** | 0.459 ** | 0.313 ** |
| PA | −0.623 ** | −0.531 ** | −0.206 * |
| NDVI | 0.150 | 0.269 ** | 0.327 ** |
| FC | 0.119 | 0.026 | 0.151 |
| GC | −0.147 | −0.080 | −0.118 |
| WC | 0.458 ** | 0.368 ** | 0.256 ** |
| ISC | −0.332 ** | −0.220 ** | −0.178 |
| F_MPS | 0.312 ** | 0.158 ** | 0.228 * |
| F_SI | 0.175 | 0.154 * | 0.050 |
| F_PD | −0.270 | 0.029 | −0.142 |
| B_FC | 0.030 | −0.131 * | 0.061 |
| B_GC | −0.215 * | −0.013 | −0.127 |
| B_WC | −0.117 | 0.014 | −0.167 |
| B_ISC | −0.132 | 0.205 ** | 0.046 |
| B_BC | 0.405 ** | 0.291 ** | 0.133 |
* p < 0.05, ** p < 0.01.
Disclaimer/Publisher’s Note: The statements, opinions and data contained in all publications are solely those of the individual author(s) and contributor(s) and not of MDPI and/or the editor(s). MDPI and/or the editor(s) disclaim responsibility for any injury to people or property resulting from any ideas, methods, instructions or products referred to in the content. |
© 2024 by the authors. Licensee MDPI, Basel, Switzerland. This article is an open access article distributed under the terms and conditions of the Creative Commons Attribution (CC BY) license (https://creativecommons.org/licenses/by/4.0/).
Share and Cite
MDPI and ACS Style
Xu, C.; Wang, W.; Zhu, H. Spatial Gradient Differences in the Cooling Island Effect and Influencing Factors of Urban Park Green Spaces in Beijing. Buildings 2024, 14, 1206. https://doi.org/10.3390/buildings14051206
AMA Style
Xu C, Wang W, Zhu H. Spatial Gradient Differences in the Cooling Island Effect and Influencing Factors of Urban Park Green Spaces in Beijing. Buildings. 2024; 14(5):1206. https://doi.org/10.3390/buildings14051206
Chicago/Turabian StyleXu, Chao, Wenjing Wang, and He Zhu. 2024. "Spatial Gradient Differences in the Cooling Island Effect and Influencing Factors of Urban Park Green Spaces in Beijing" Buildings 14, no. 5: 1206. https://doi.org/10.3390/buildings14051206
Note that from the first issue of 2016, this journal uses article numbers instead of page numbers. See further details here.