
Mechanical Response and Stability Optimization of Shallow-Buried Tunnel Excavation Method Conversion Process Based on Numerical Investigation
1
Department of Engineering Mechanics, Hohai University, Nanjing 211100, China
2
China Coal Technology Engineering Group Huaibei Blasting Technology Research Institute Limited Company, Huaibei 235000, China
*
Author to whom correspondence should be addressed.
Buildings 2024, 14(5), 1213; https://doi.org/10.3390/buildings14051213
Submission received: 14 March 2024
/
Revised: 16 April 2024
/
Accepted: 21 April 2024
/
Published: 24 April 2024
(This article belongs to the Special Issue Research on the Construction Mechanical Behavior and Deformation Characteristics of Lining Structure)
Abstract
:Different excavation methods lead to substantial changes in the relaxation zone of the surrounding rock. The stress characteristics of the support structure become more complex during the process of excavation method conversion. It is essential to design a well-considered construction plan to minimize the disruptions caused by excavation method conversion. This work takes a tunnel in Jiangsu Province, China, as the engineering background and establishes a numerical model for the conversion from the double-side-drift method to the three-bench method. Based on a numerical investigation, this study analyzed the deformation of surrounding rock and the stress state of the support structure during the excavation method conversion. The results showed that excavation method conversion can accelerate the deformation rate of the surrounding rock, causing the support structure to bear greater pressure. This leads to a significant increase in the circumferential stress at the junction of two excavation methods. Setting up a reinforced area during the process of excavation method conversion can improve the stress state of the support structure. Finally, an analysis of the parameters of the reinforced area was conducted, and a reasonable construction plan was proposed. This study can provide guidance for subsequent construction projects.
1. Introduction
In tunnel engineering, geological conditions such as soil properties have a significant impact on the mechanical response of support structures [1,2]. Therefore, it is necessary to choose appropriate excavation methods, according to different tunnel sizes and geological conditions [3]. When the surrounding rock conditions are good, the bench method and full-section method can be employed for rapid construction [4,5]. If the conditions are poor or the tunnel span is large, the subsection excavation methods can be used to divide the tunnel into several parts, which can enhance the stability of the tunnel [6]. The subsection excavation methods have been widely applied in practical engineering projects. These methods include the double-side-drift method (DSD), the center diaphragm method (CD) and the cross diaphragm method (CRD) [7,8].
Many scholars have conducted research on the selection of excavation methods. Some studies focused on specific engineering aspects and compared tunnel safety when employing different excavation methods [9,10,11]. A small number of studies have summarized extensive engineering experience and proposed a series of criteria for selecting excavation methods [12,13,14]. During the construction of long tunnels, various excavation methods are often combined due to factors such as design changes, tight schedules, and unexpected changes in surrounding rock conditions [15]. Different excavation methods will lead to substantial changes in the relaxation zone of the surrounding rock. The stress characteristics of the support structure become more complex during the process of excavation method conversion. Therefore, improper conversion schemes can easily lead to tunnel instability, causing unfavorable impacts on the construction [16]. It is essential to design a well-considered construction plan to effectively minimize the disruptions caused by the excavation method conversion.
However, the current research on the excavation method conversion is limited. Zhang et al. [17] used the Jiaoweiqin Tunnel as the research subject and provided a clear exposition of the excavation method transition plan. The analysis of tunnel deformation confirmed the safety of the method transition. This study primarily focused on whether the excavation method conversion is feasible under current conditions and did not investigate the mechanical response of support structures. In order to effectively prevent tunnel instability during the process of excavation method conversion, it is necessary to conduct a systematic analysis of the support stress characteristics, with the proposal of reasonable reinforcement measures. Advanced support has been often employed in tunnel engineering to address issues such as weak surrounding rock, support deformation, and face instability caused by tunnel construction [18,19,20]. However, there is still a lack of comprehensive research on advanced support schemes for the excavation method conversion process.
To address the deficiencies of existing research, this study takes a tunnel project within Jiangsu Province as a case study and investigates the deformation and stress characteristics of the support structure during the conversion from the DSD method to the three-bench method. Based on numerical results and field monitoring, the response mechanisms of the tunnel were summarized, and reasonable reinforcement measures were proposed. The research findings can provide guidance for future projects of a similar nature.
2. Project Overview and Model Establishment
2.1. Tunnel Geological Conditions
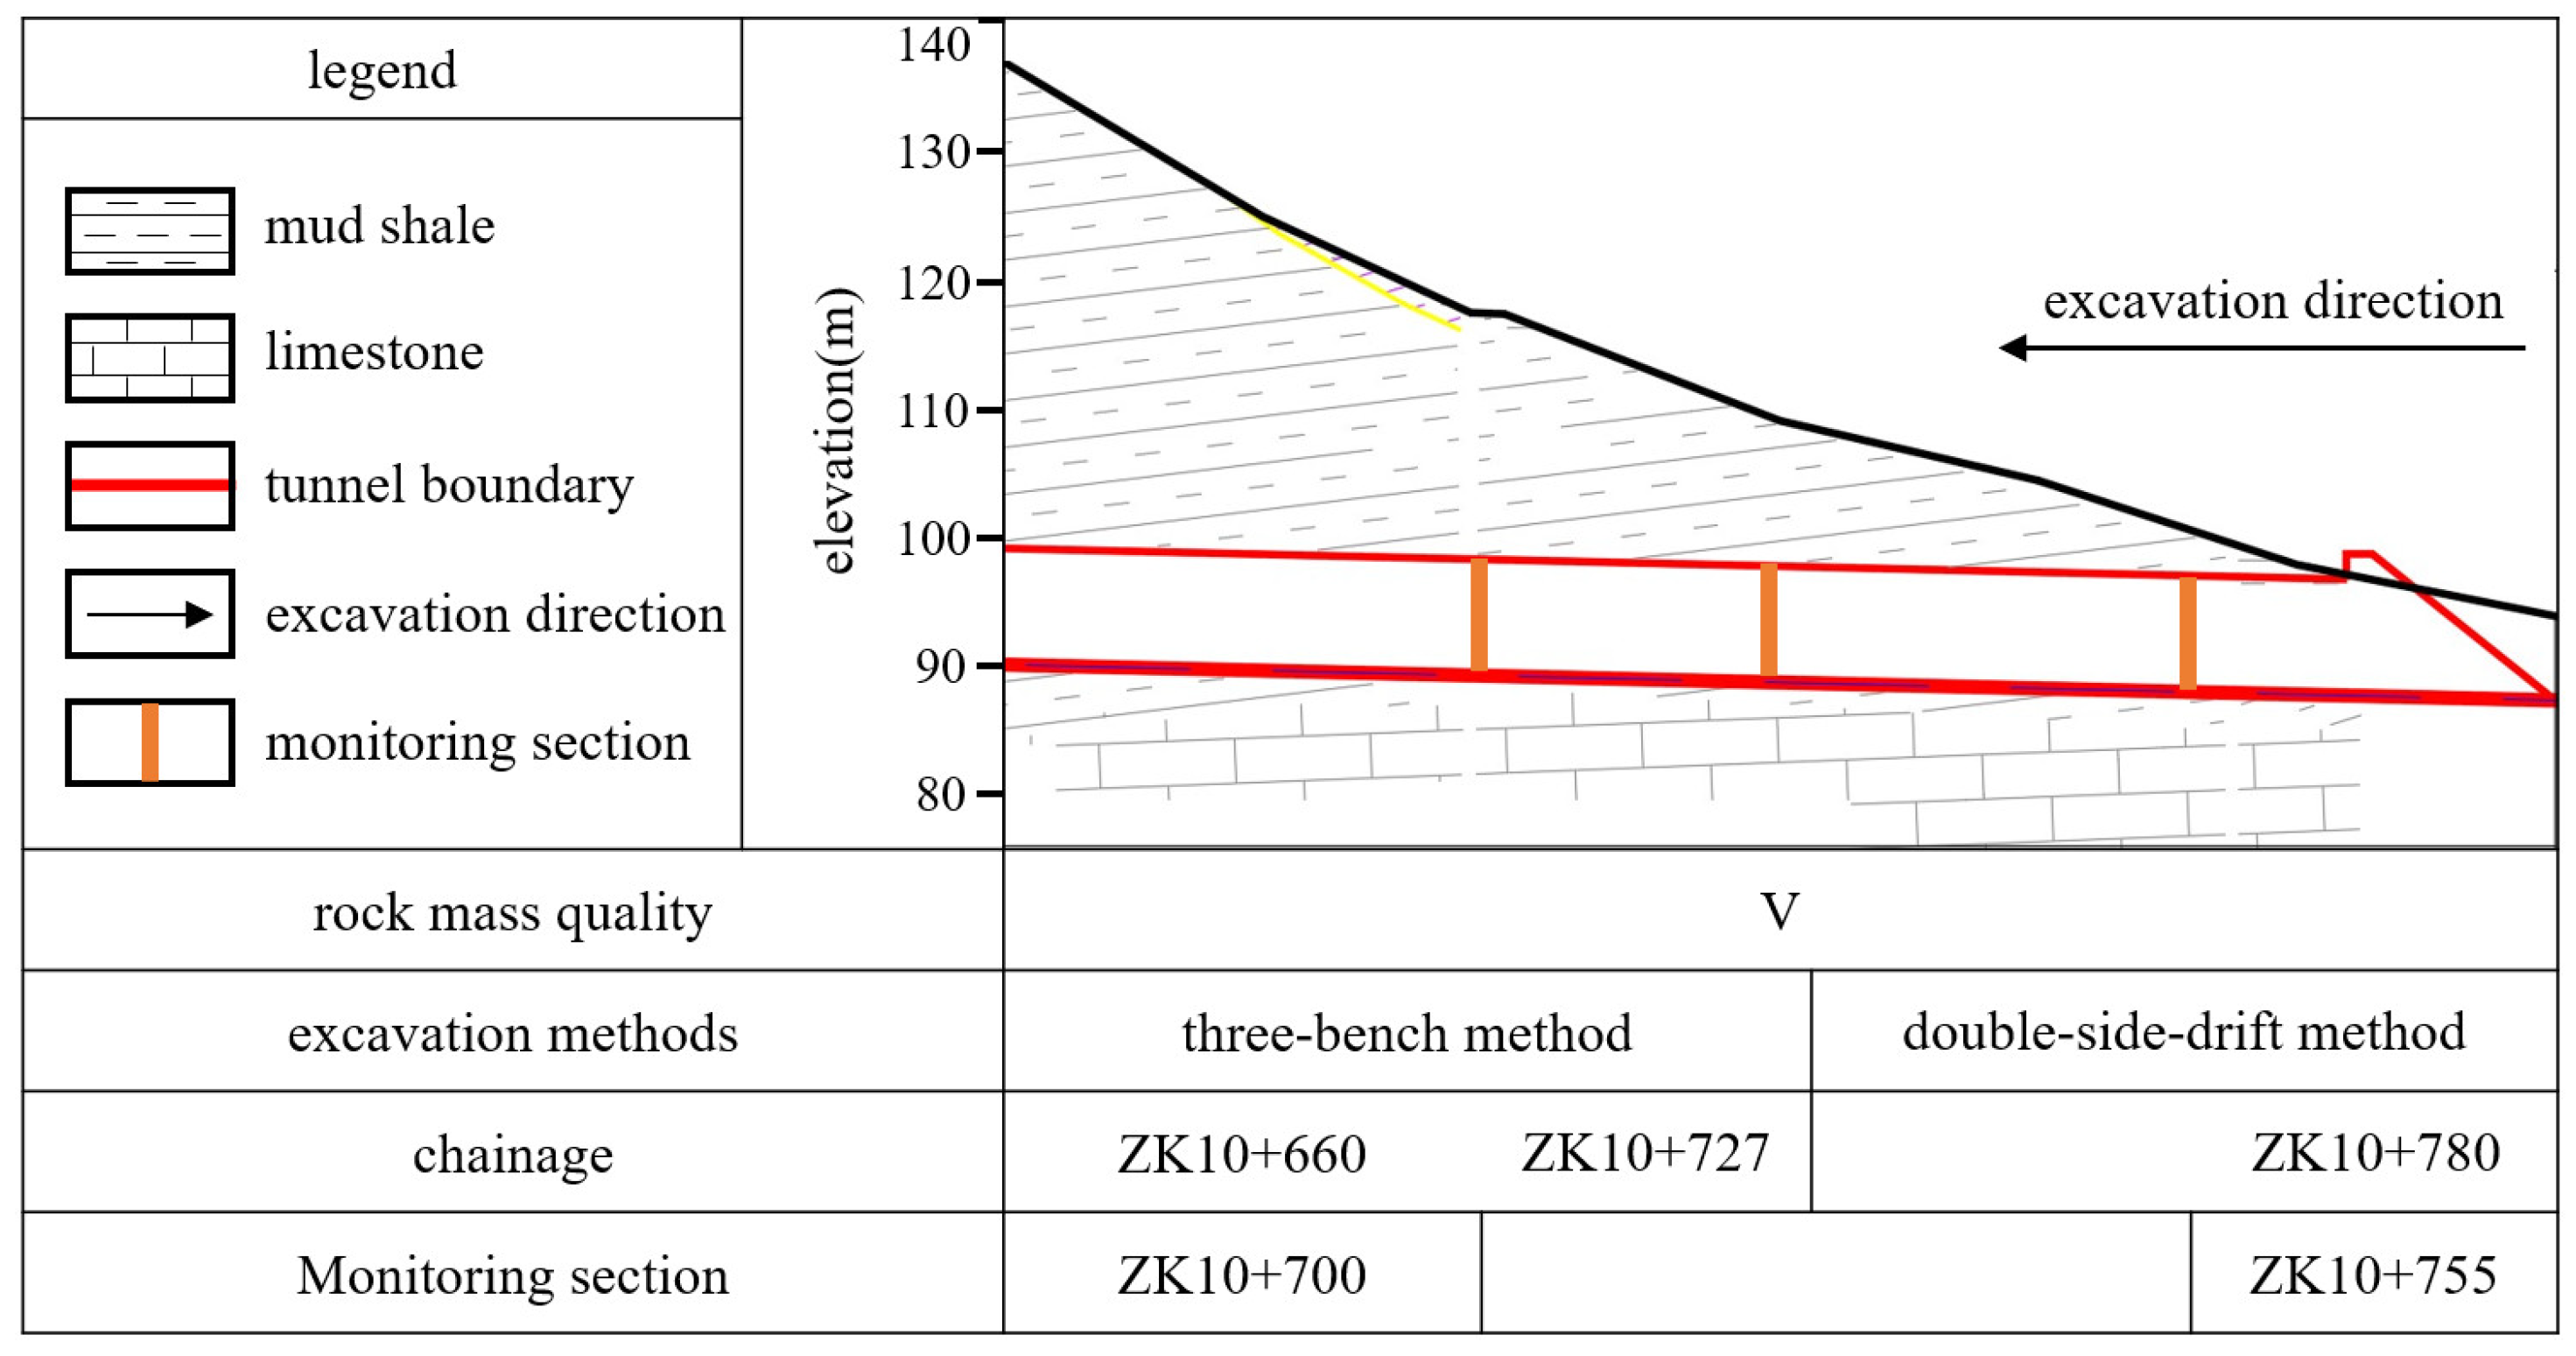
The tunnel is situated at Jiangsu Province, China, with a total length of 660 m. The maximum burial depth of the tunnel is 75 m. According to the tunnel design, the excavation span is 17.39 m, and the excavation area is 163.34 m2. As displayed in Figure 1, the tunnel exit section (from ZK10+660 to ZK10+780) has a relatively shallow burial depth. The maximum burial depth is 17.8 m, the minimum burial depth is 4.6 m. The main components of the surrounding rock are shale and limestone. According to the BQ rock mass classification system (China) [21], it is classified as Class Ⅴ. As displayed in Figure 2, the middle section and the portion above the tunnel crown are composed of highly weathered mud shale, which exhibits overall fragmentation. The lower section consists of moderately weathered mud shale with thick bedding planes.
2.2. Excavation Methods and Support Structure
The original construction plan for the tunnel was to use the DSD method or the CRD method for the Class V rock mass, and the three-bench method for the Class IV rock mass. The tunnel exit section was originally constructed using the DSD method. After excavation to ZK10+727, it was converted to the three-bench method to accelerate the excavation speed. As shown in Figure 3, the tunnel face is segmented into seven parts using the DSD method. The excavation sequence is ➀→➁→➂→➃→➄→➅; the tunnel face is segmented into three parts using the three-bench method. The excavation sequence is ➀→➁→➂.
The excavation footage is 2 m. When using the DSD method, the upper steps of the left and right sides lead the lower steps by 4 m, the upper steps in the middle lead the lower steps by 2 m, the left side leads the right side by 6 m, and the right side leads the middle step by 6 m. When using the three-bench method, the upper step leads the middle step by 4 m, and the middle step leads the lower step by 4 m.
The parameters of the support structure are as follows: C25 shotcrete with a thickness of 28 cm; φ8 steel mesh with a spacing of 20 cm × 20 cm; I22a steel arch with a longitudinal spacing is 70 cm; D25 hollow grouting bolt with a length of 4.0 m and a spacing of 70 cm × 100 cm.
2.3. Model and Parameters
This paper adopts the birth-death element within the finite element method to simulate the processes of excavation of rock mass and the installation and removal of support structures. Select ZK10+745-ZK10+705 of the tunnel for numerical simulation. According to Saint-Venant’s principle, the dimensions of the numerical model should be at least three times the diameter of the excavated tunnel in order to eliminate boundary effects [22]. Consequently, the width, length and height of the numerical model were 120, 40 and 80 m. The thickness of the surrounding rock above the tunnel is 15.9 m, based on the average burial depth. Considering the actual constraint effect of surrounding rock, we apply normal constraints to the four sides of the model, fix constraints at the bottom and leave the top surface unconstrained [23]. This model assumes homogeneity for both the rock mass and the support structure. The rock mass is simulated by 8-node hexahedron elements and follows the Mohr Coulomb criterion. Meanwhile, the support structure adopts a linear elastic model and is simulated by 4-node quadrilateral elements. The finite element model is illustrated in Figure 4. The focus of this study is on the variation patterns of deformation and stress characteristics of supporting structures. Therefore, the geological conditions in the model have been simplified, disregarding the effects of tectonic stress and groundwater.
The mechanical parameters of the rock mass were obtained from the ‘Geological Engineering Handbook’ [24]. The mechanical parameters of the support structure were obtained from the ‘Specifications for Design of Highway Tunnels’ (JTG 3370.1-2018) [25]. To simplify the numerical model, an equivalent substitution is made by converting the elastic modulus of the steel arch and steel mesh into shotcrete. The equivalent formula is given in Equation (1) [26]. The mechanical parameters of the rock mass and the support structure are listed in Table 1.
where Ec and E represent the initial and modified elastic modulus of shotcrete; Ea and Em are the elastic modulus of the steel arch and steel mesh; Sc, Sa, Sm are the cross-sectional areas of the shotcrete, steel arch and steel mesh, respectively.
3. Numerical Results
3.1. The Impact of Excavation Method Conversion on Tunnel Response
To investigate the impact of the excavation method conversion on tunnel safety, numerical simulations were conducted for the two construction conditions:
- (1)
- The DSD method is employed for excavation within the range of ZK10+745-ZK10+705 (no conversion).
- (2)
- The DSD method is employed for excavation within the range of ZK10+745-ZK10+727; the three-bench method is employed for excavation within the range of ZK10+727-ZK10+705 (conversion).
ZK10+727 is the junction point between the DCD method and the three-bench method. Therefore, the numerical results at ZK10+727 are selected for analysis, including tunnel deformation and the stress state of the support structure.
3.1.1. Deformation Analysis of the Surrounding Rock
During the excavation process of a shallow-buried tunnel, the pressure arch cannot naturally form in the rock mass above the tunnel. The self-bearing capacity of the surrounding rock is not fully utilized. The surrounding rock pressure is approximately equal to the weight of the rock mass above the tunnel. Therefore, vertical displacement is one of the crucial indicators reflecting the stability of the tunnel. The isoline map of vertical displacement at the completion of the construction simulation is illustrated in Figure 5. Vertical displacement significantly increases under the influence of the excavation method conversion. The vault settlement increases from 7.64 mm to 8.56 mm, with a difference of 0.91 mm; the invert uplift increases from 6.65 mm to 7.53 mm, with a difference of 0.88 mm.
The evolution process of vault settlement and invert uplift at ZK10+727 is shown in Figure 6. Since there are significant differences in the construction procedures between the DSD method and the three-bench method, it is difficult to compare each excavation step with one another. Therefore, the distance between the ZK10+727 section and the excavation face is used as the abscissa to uniformly describe the two different excavation processes. It can be observed that both the vault settlement and invert uplift undergo three stages: rapid deformation, continuous deformation and slow deformation. At the end of the continuous deformation stage, the difference in vault settlement between the two construction conditions is 0.67 mm, accounting for 73.6% of the final difference; the difference in invert uplift is 0.87 mm, representing 98.9% of the final difference.
This indicates that the impact of excavation method conversion on tunnel response is mainly evident in the early stages of construction and gradually increases as construction progresses. At this time, the initial support structure of the tunnel has just been constructed, and excessive displacement development will cause the initial support to bear greater pressure, thus causing hidden dangers to the safety of tunnel construction.
3.1.2. Stress Analysis of the Support Structure
The circumferential stress nephogram of shotcrete is shown in Figure 7. It can be observed that there is an obvious stress increase at ZK10+727. The distribution of the circumferential stress in shotcrete at ZK10+727 is illustrated in Figure 8. Stress is defined as positive in compression and negative in tension. When the DCD method is employed for the entire excavation process, the shotcrete is under compression, and the circumferential stress is uniform and symmetrically distributed. After the excavation method conversion, the circumferential stress of the shotcrete at the arch and sidewalls tends to increase, with the maximum increase of 1.90 MPa occurring at the left wall waist (E). The maximum stress appears at the left arch foot (D), which is 1.66 MPa higher than that without conversion. It is noteworthy that tensile stress occurs at the middle invert (H), with a value of 0.22 MPa.
During the construction process, the stress state of the support structure continuously changes. In order to propose effective reinforcement measures to enhance the stability of the tunnel, it is essential to analyze the evolution of circumferential stress in shotcrete. Due to the symmetrical distribution of circumferential stress, an analysis at positions A–H is shown in Figure 9.
In these two conditions, the trend of circumferential stress development in shotcrete is significantly different. When excavation is carried out using the DCD method, the evolution process of stress can be divided into two stages. The first stage involves excavation of the left and right sides. As shown in Figure 9a, during this stage, the excavation volume of the rock for each excavation step is small, resulting in a slow increase in stress. The second stage involves the excavation of the surrounding rock in the middle, during which the stress at each point increases rapidly. Point C is located at the arch shoulder, where it bears the pressure from the surrounding rock. Therefore, the stress increase is most significant at this juncture. Before the start of the second stage, the support on both sides has already completed closure, allowing it to maintain stability well in the face of stress increase. Overall, stress development is gradual.
Due to the accelerated deformation rate of the surrounding rock, the support structure bears greater vertical pressure. As shown in Figure 9b, the development of stress is highly uneven after the conversion. The circumferential stress at each point is already significant from the beginning and increases rapidly. With just one excavation step, the circumferential stress at point D (left arch foot) has already increased to 7.00 MPa, accounting for 77.95% of the final value. After the support is closed, the increase in stress slows down significantly. This is unfavorable for construction stability.
In addition, tensile stress occurs at point H (invert) and continues to decrease within the two excavation steps after the support closure. In shallow-buried tunnels, the lateral pressure from the surrounding rock is relatively low, meaning the horizontal force is insufficient to counteract the vertical squeezing, which causes tension at the invert. However, the tensile stress is minor and well below the tensile strength of the shotcrete. Safety can be ensured by enhancing monitoring and timely implementing secondary support for the invert.
In summary, the conversion of excavation methods can adversely affect the stress state of the support structure. The main risk is the excessive early stress at point D. It is necessary to take measures to enhance construction stability.
3.2. Construction Stability Optimization Measures
3.2.1. Leading Conduit Grouting Reinforcement
Leading conduit grouting is a commonly used reinforcement measure in tunnel excavation. As shown in Figure 10, the cement grout, surrounding rock, and small conduits are closely integrated, forming a reinforced area. The mechanical properties of the surrounding rock within the reinforced area are enhanced.
In order to optimize the stress state of the support structure of after ZK10+727, leading conduits are set within the range of ZK10+729-ZK10+725. According to the ‘Guidelines for Design of Highway Tunnel’ (JTG/T D70-2010) [27], φ42 × 4 mm leading conduits are selected with a length of 3.5 m; the spacing is set at 40 cm × 240 cm, with a layout scope of 120°. The thickness of the reinforced area is 1 m, and the setting angle of the small conduit is 9.2°. The finite element model of the reinforcement area is shown in Figure 11. Furthermore, the mechanical parameters of the reinforced area are adjusted to match those of the rock mass to simulate the grouting of the leading conduit [28]. The mechanical parameters of the leading conduit and the reinforced area are listed in Table 2.
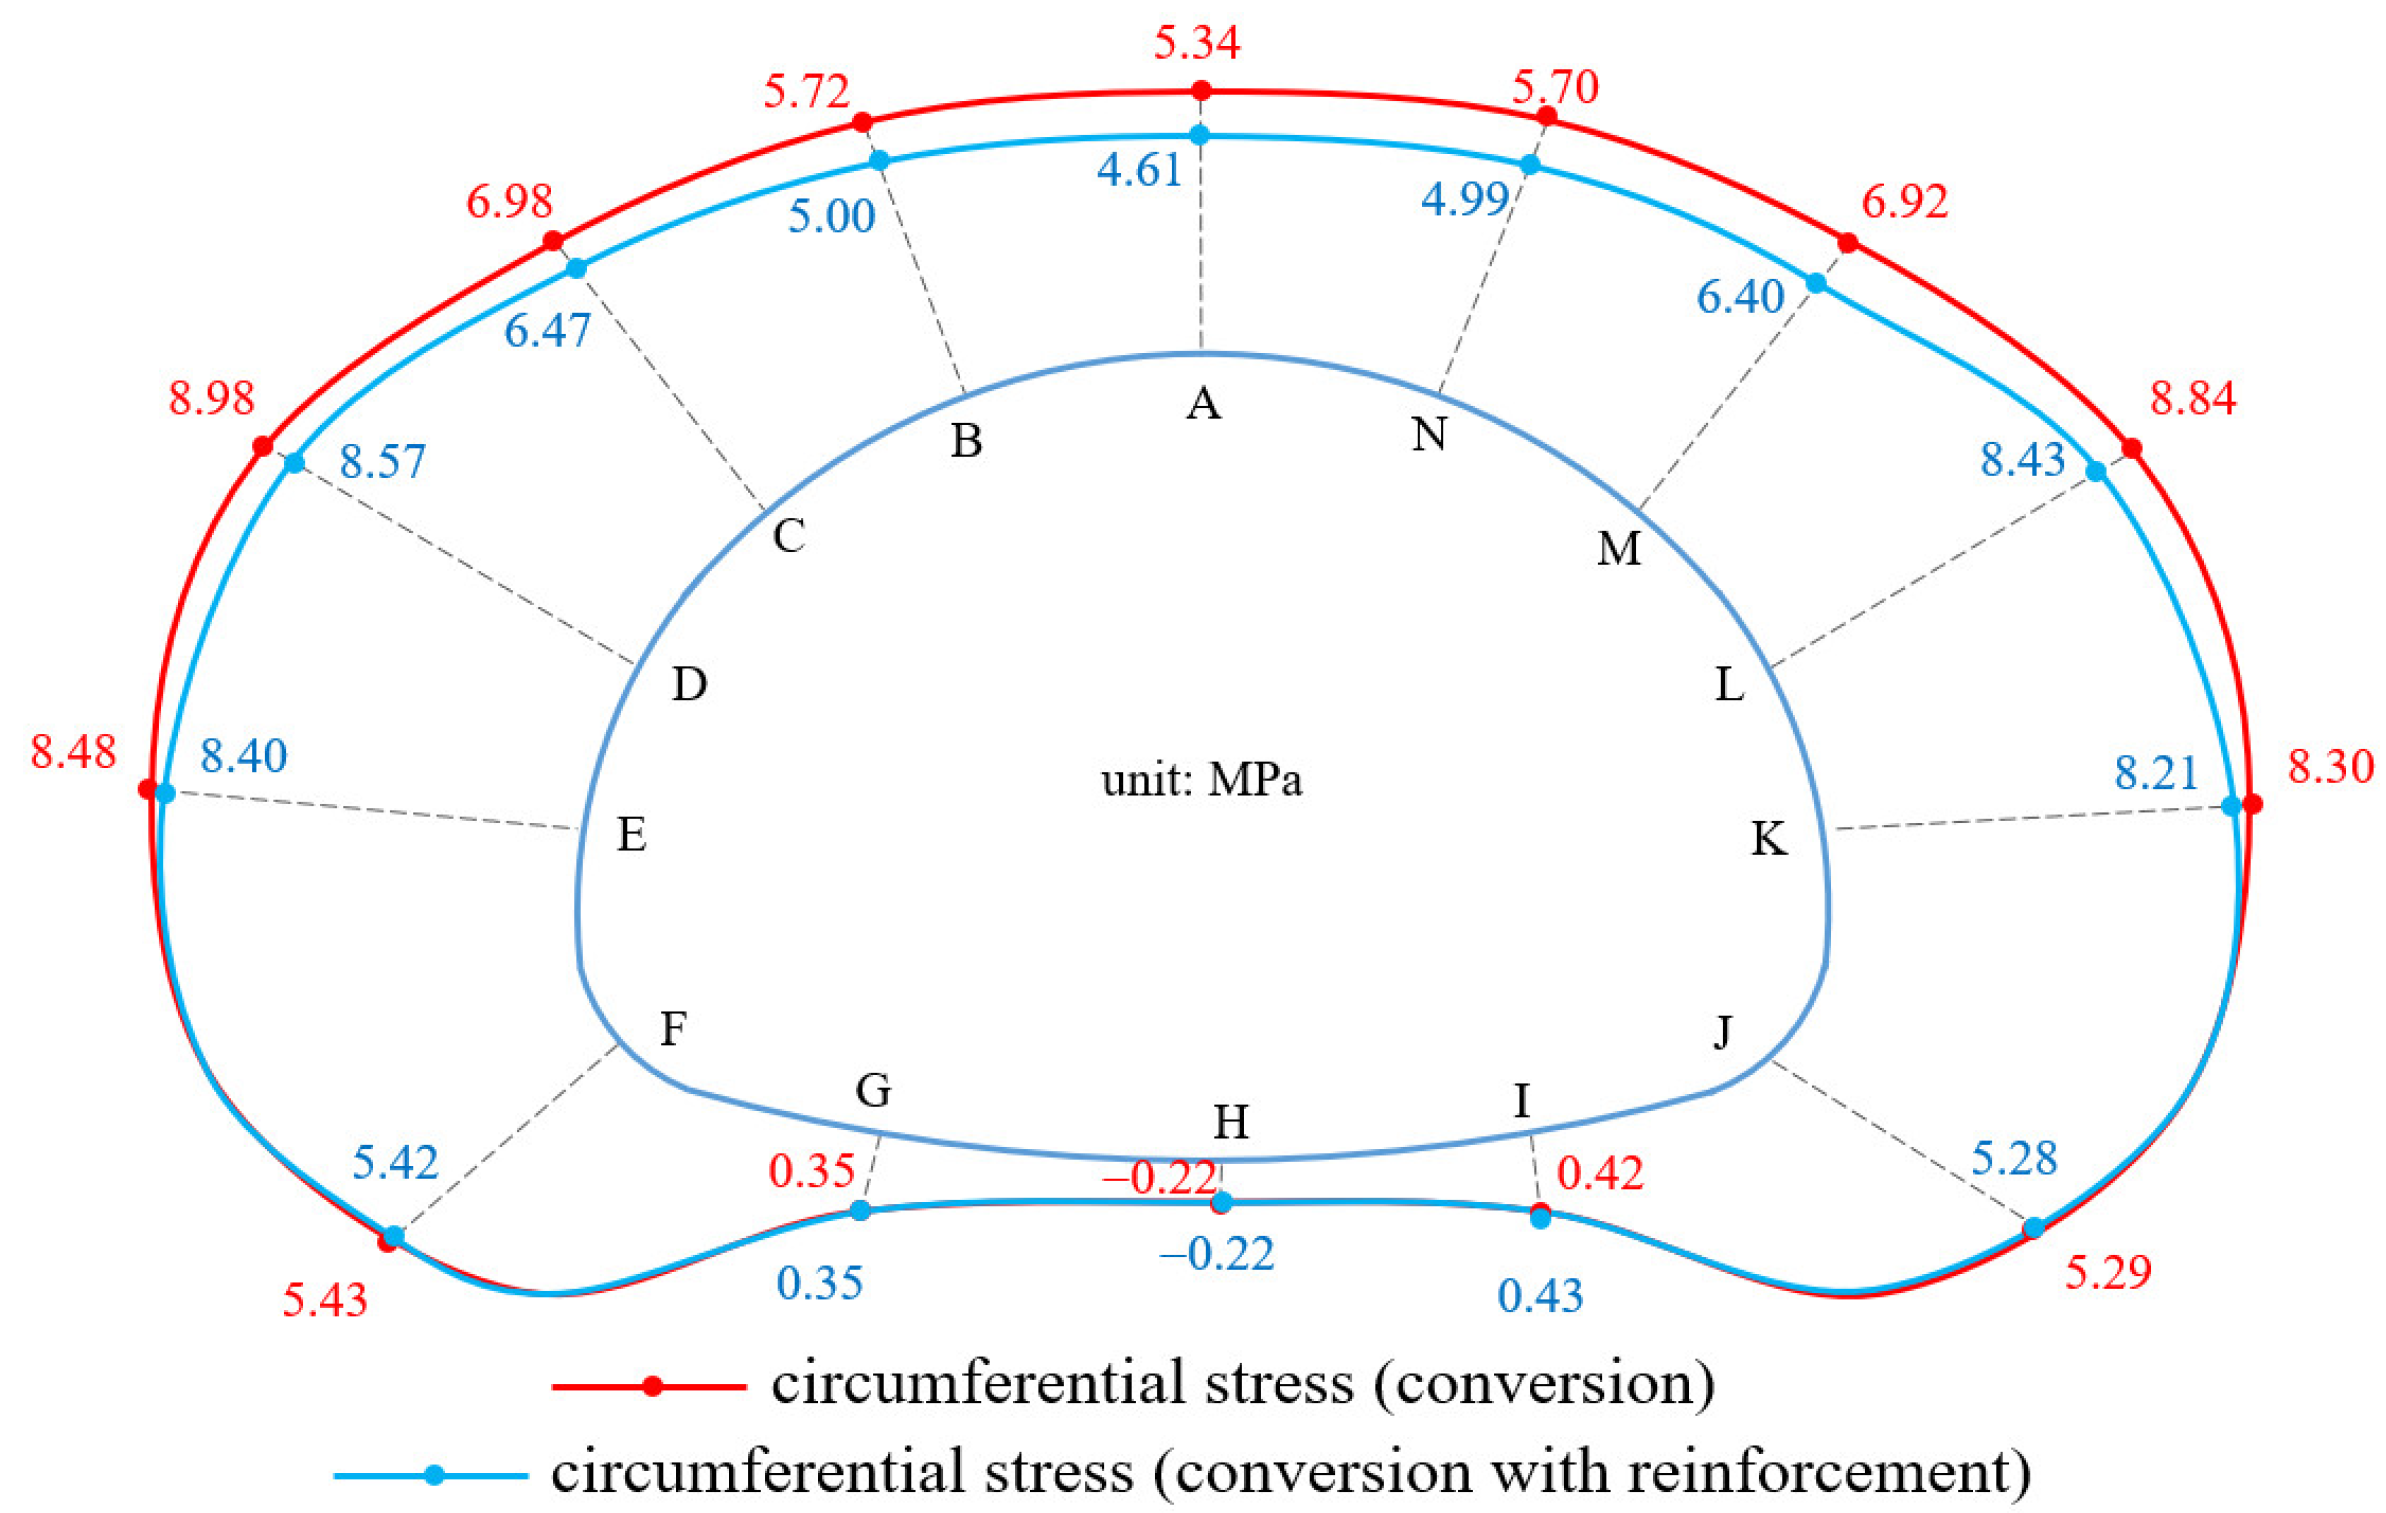
The distribution of circumferential stress in shotcrete at ZK10+727 is shown in Figure 12. It can be observed that the circumferential stress of the arch and sidewall decreases. This indicates that the reinforced area can bear a portion of the surrounding rock weight, reducing the rock pressure acting on the support structure.
Figure 13 illustrates the process of circumferential stress development at point. The final stress decreases from 8.98 MPa to 8.57 MPa, representing a reduction of 4.57%; early stress decreases from 7.00 MPa to 6.61 MPa, representing a reduction of 5.57%. This indicates that the optimization effect is limited under the current design, and it is necessary to further study the parameters of the reinforced area.
3.2.2. Parameter Studies of the Reinforced Area
The grouting volume, grouting radius, range and spacing of the leading conduit, among other parameters, will influence the reinforcement effect [29]. The above parameters are simplified to match the length, thickness, and strength of the reinforced area. The length of the reinforced area is as shown in Table 3. The thickness of the reinforced area is correlated with the setting angle of the small conduit, as shown in Table 4. According to the research in reference [30], the elastic modulus has the greatest influence on the strength of the reinforced area. To simplify the calculations, the Poisson’s ratio, cohesion and internal friction angle remain constant. The values of elastic modulus and gravity density are given in Table 5, taking the early stress and final stress at point D as the criteria for evaluation.
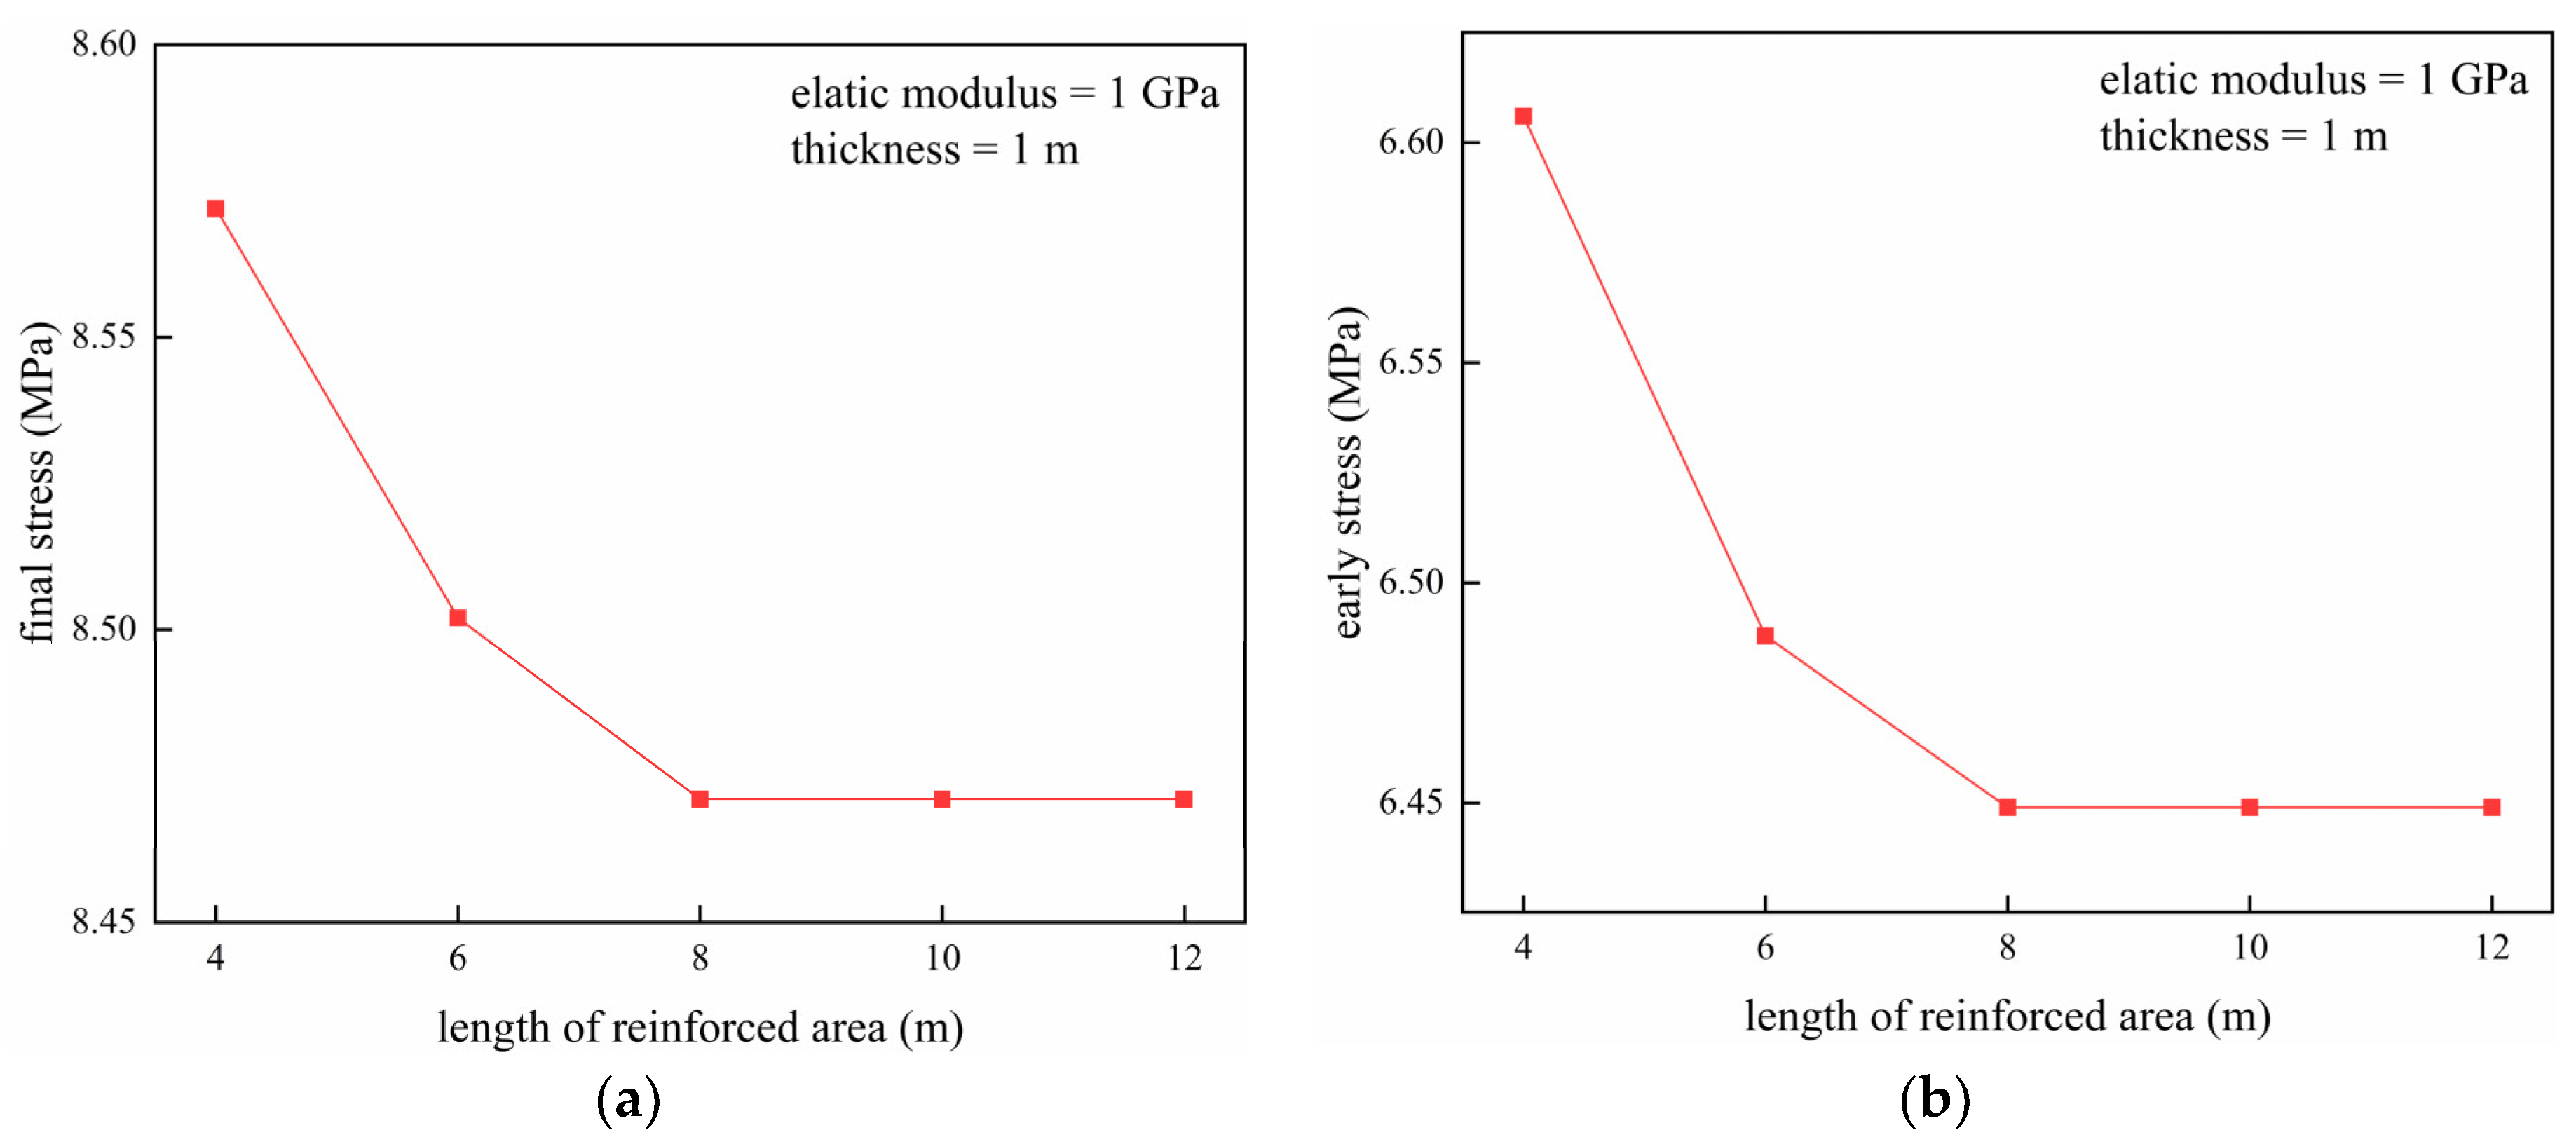
As shown in Figure 14, with the increase in the length of the reinforced area, both the final stress and the early stress show a trend of first increasing and then stabilizing. When the length increases from 4 m to 6 m and 8 m, the final stress decrease by 0.07 MPa and 0.031 MPa, respectively, while the early stress decrease by 0.118 MPa and 0.039 MPa, respectively. This indicates that increasing the length of the reinforced area has a limited effect on optimizing the stress state of the support structure. When the length reaches 8 m, further increasing the length does not further reduce the circumferential stress. This suggests that the influence range of the reinforced area is limited. In subsequent calculations, the length of the reinforced area is set to 8 m.
From Figure 15a, it is observed that when the thickness of the reinforced area increases from 1 m to 1.5 m, the final stress decreases from 8.47 MPa to 8.33 MPa; however, when the thickness is further increased, the circumferential stress changes little, with only a 0.007 MPa reduction when the thickness increases from 1.5 m to 2 m. From Figure 15b, it can be seen that the trend of change in the early stress is different from that of the final stress. When the thickness increases from 1 m to 1.5 m, the early stress decreases by 0.249 MPa; as the thickness continues to increase, the trend of reduction in early stress significantly slows down, with only a 0.095 MPa reduction when the thickness increases from 1.5 m to 2 m. This suggests that the circumferential stress will not indefinitely decrease with the increase in the thickness of the reinforced area.
Based on the mechanism of the leading conduit, increasing the thickness of the reinforced area enhances the bearing capacity of the surrounding rock over a larger zone. At the same time, the setting angle of the small conduit increases with the thickness. When the setting angle is less than 15°, the beam-arching effect of the small conduit can be effectively utilized; when the angle exceeds 15°, the small conduit primarily functions as anchors. Additionally, considering the site construction, an excessive angle of the small conduit is not conducive to grouting control. Therefore, the thickness of the reinforced area should not exceed 1.5 m.
As shown in Figure 16a, when the elastic modulus of the reinforced area increases from 1 GPa to 1.5 GPa, the final stress decreases by 0.159 MPa; when it increases from 1.5 GPa to 2 GPa, the final stress only decreases by 0.013 MPa. This is because, as the strength of the reinforced area increases, its bearing capacity correspondingly improves; at the same time, the weight of the rock mass above is also increasing, ultimately acting on the support structure. As can be seen from Figure 16b, the early stress uniformly decreases with the increase in the strength of the reinforced area. When the elastic modulus increases from 1 GPa to 2 GPa, the early stress decreases by a total of 0.337 MPa.
In summary, increasing the length, thickness and strength of the reinforced area has a greater impact on the early stress than on the final stress, which is beneficial for construction stability. Setting the length to 8 m and the thickness to 1.5 m can achieve a good effect, and the strength of the reinforced area should be enhanced as much as possible within the limits allowed by construction.
4. Comparison between Field Monitoring and Numerical Results
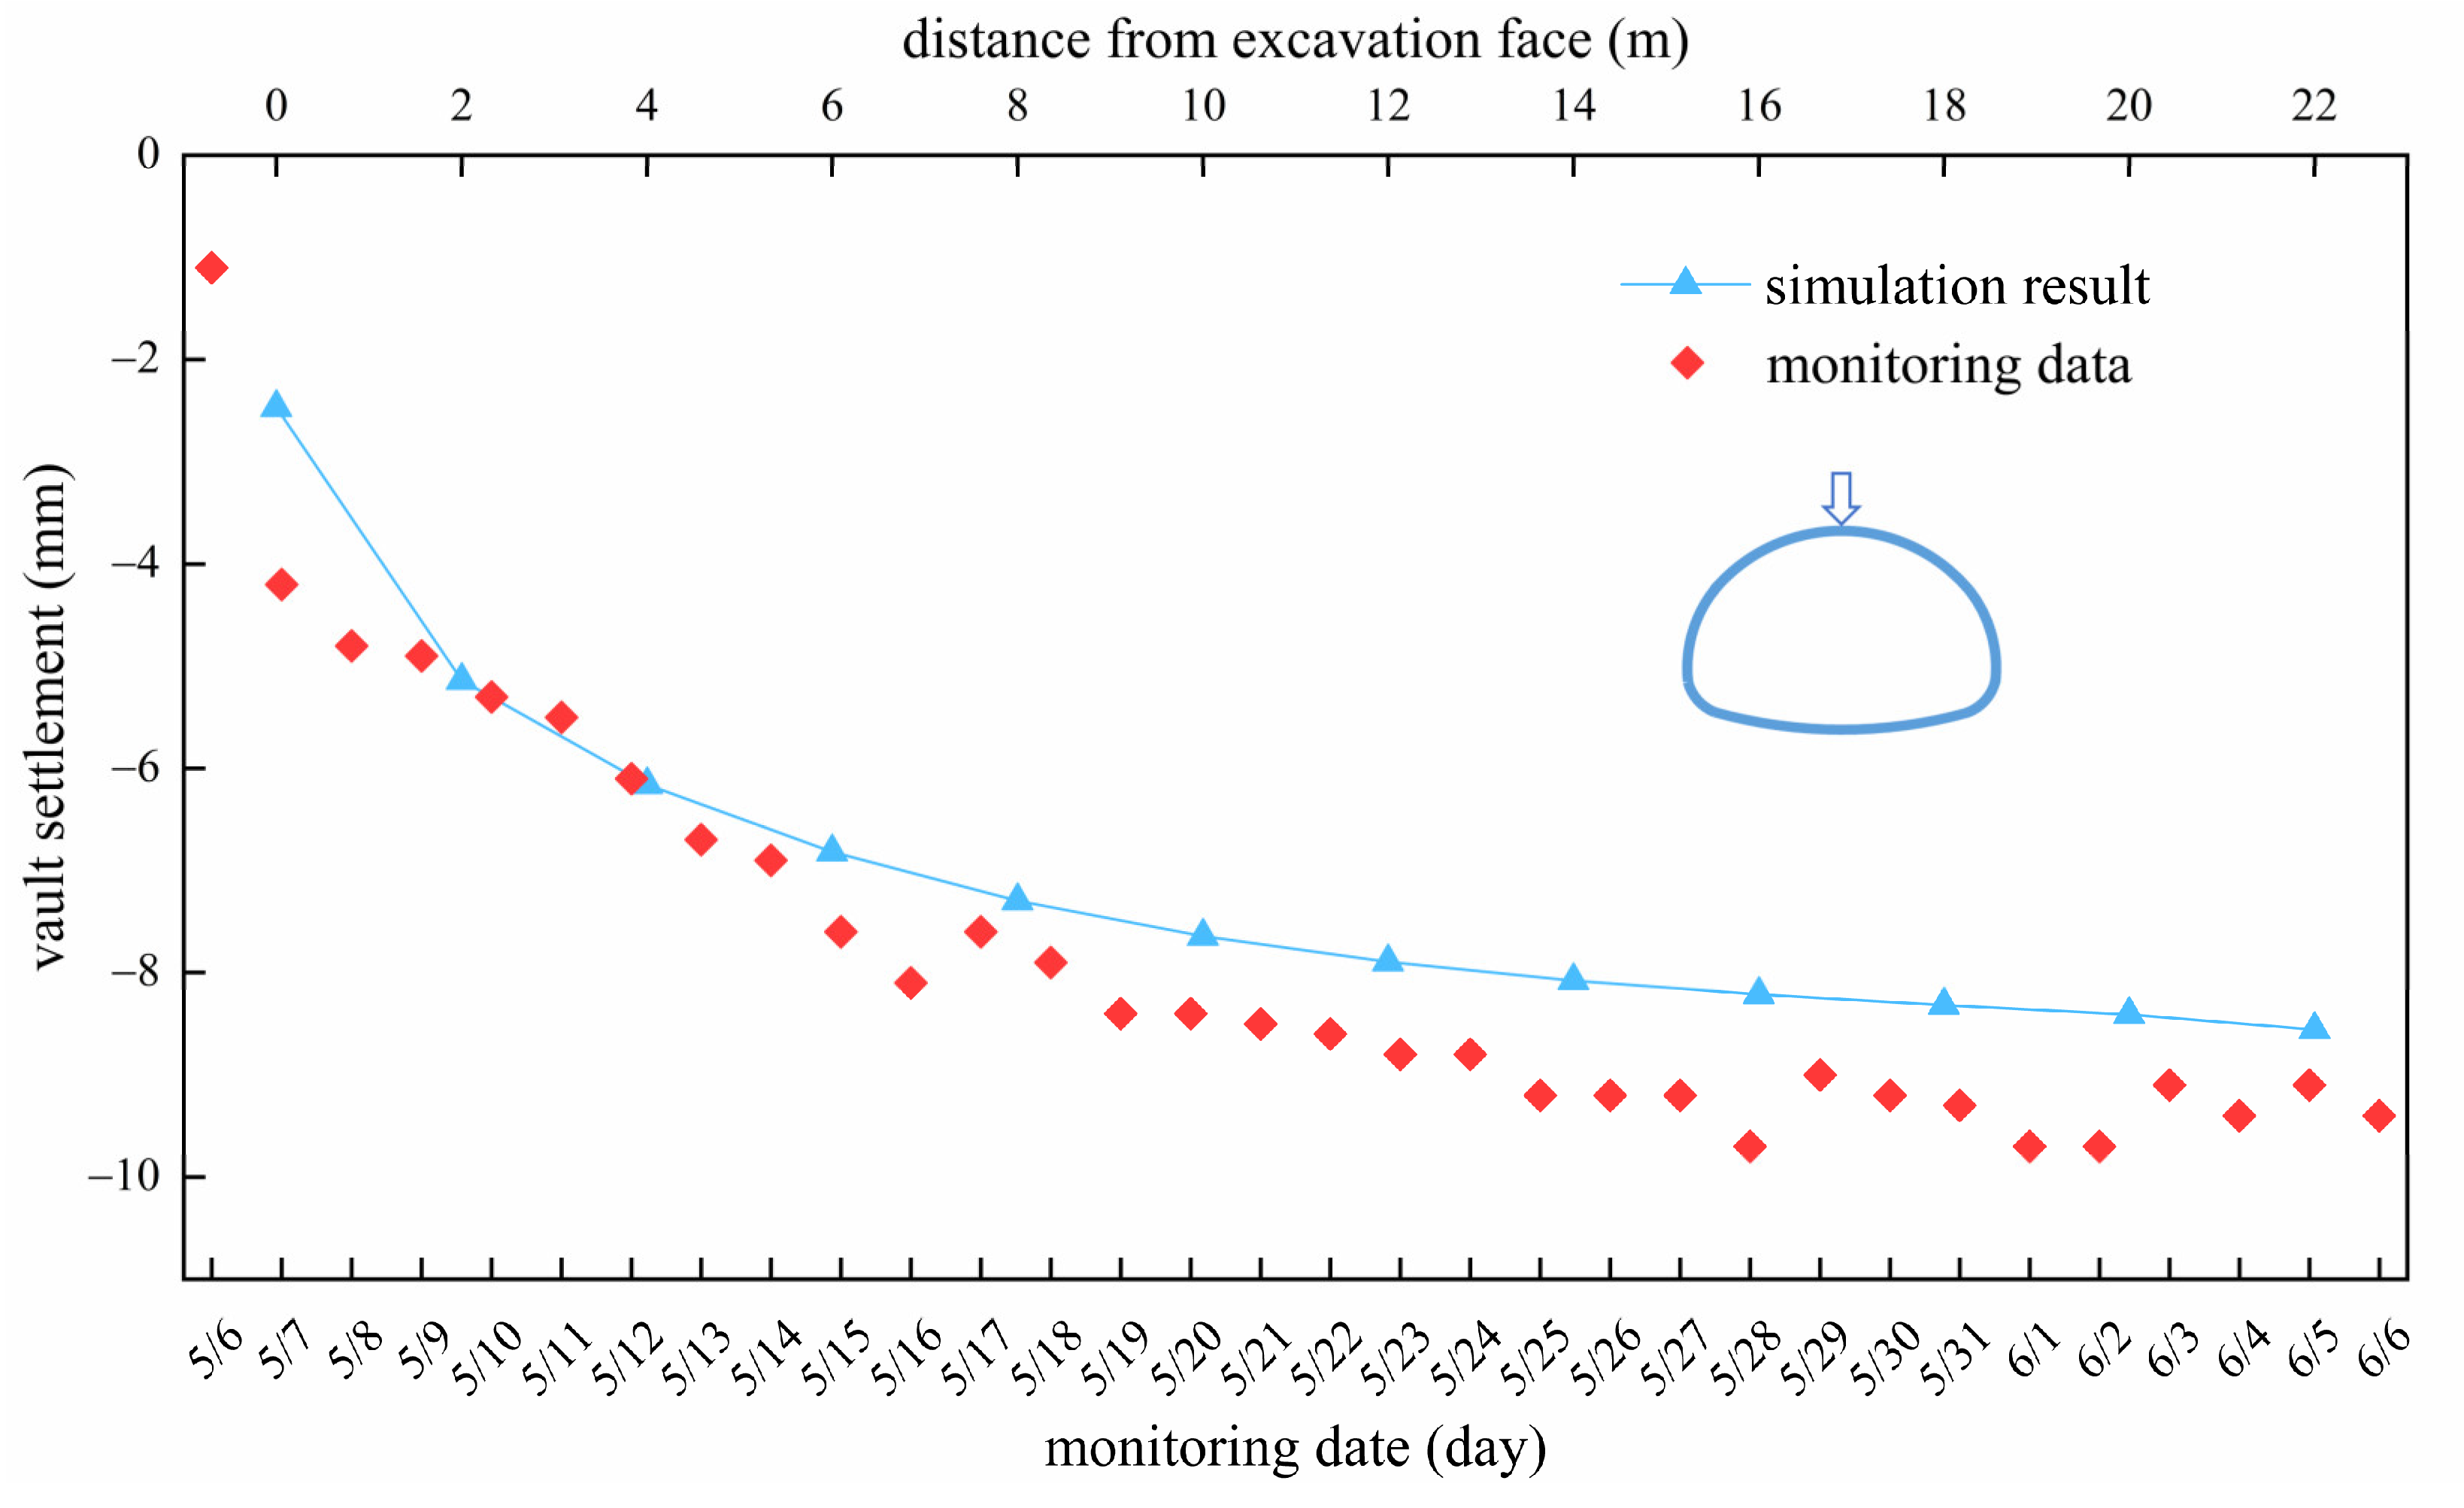
The leading conduit grouting reinforcement measure in this article has been applied in actual construction and has achieved favorable results. The displacement monitors were installed every 2 m within the range of ZK10+700 to ZK10+755 during the construction process.
As shown in Figure 17, a comparison was made between the numerical results and monitoring data for the vault settlement of ZK10+727 section. Due to the idealized conditions in the numerical simulation, there are some discrepancies between the numerical results and monitoring data. The numerical results are smoother than the monitoring data, and the numerical values are generally lower. However, the numerical results and monitoring data exhibit similar trends, and the average error is only 9.12%. This validates the reliability of the numerical model and confirms the feasibility of the leading conduit grouting reinforcement measure proposed in this study.
5. Conclusions
Based on a tunnel project in Jiangsu Province, a numerical model was established to analyze the conversion process from the DSD method to the three-bench method. The mechanical response of the support structure during the excavation method conversion was studied. An analysis was performed on potential adverse effects and a reasonable optimization measure was proposed. The conclusions are as follows:
- (1)
- When the excavation method is converted from the DCD method to the three-bench method, the early-stage deformation rate of the surrounding rock accelerates, resulting in the support structure bearing greater pressure.
- (2)
- The excavation method conversion leads to a significant increase in stress at the junction of the DCD method and the three-bench method, with the maximum stress occurring at the left arch foot. Moreover, within one excavation step after the conversion, the early stress at this location has already reached 77.95% of the final stress. Therefore, special attention needs to be paid to the stability at the junction during the conversion process.
- (3)
- Setting up a leading conduit during the process of excavation method conversion can help the support structure bear part of the weight of the rock mass, improving the stress state of the support structure. Both early and final circumferential stresses are reduced under the influence of the reinforced area. This suggests that establishing a reinforced area is an effective measure to enhance the stability of the excavation method conversion process.
- (4)
- Increasing the length, thickness and strength of the reinforced area can further reduce circumferential stress, and its impact on early stress is greater than that on final stress. Based on the parameter studies, the length can be set to 8 m, the thickness to 1.5 m, and the strength should be enhanced as much as possible within the limits allowed by construction. For different engineering projects, it is necessary to adjust the parameters of the reinforced area appropriately to achieve better reinforcement effects.
It should be noted that the geological conditions and support structures have been simplified, which may impose some limitations for this study. In future work, it is necessary to establish more accurate models to provide more precise guidance for practical engineering. Additionally, the leading conduit grouting reinforcement used in this paper is just one feasible solution. Further research should explore the effectiveness of other optimization measures to offer more options for different engineering projects.
Author Contributions
Writing—original draft preparation, R.P.; writing—review and editing, R.P. and B.Z.; methodology, D.J. All authors have read and agreed to the published version of the manuscript.
Funding
This research received no external funding.
Data Availability Statement
The original contributions presented in this study are included in the article. Further inquiries can be directed to the corresponding author.
Acknowledgments
The authors want to acknowledge K. Yan for his contribution to the helpful discussion and instruction on topics related to this work.
Conflicts of Interest
Author Baoliang Zhou was employed by the company China Coal Technology Engineering Group Huaibei Blasting Technology Research Institute Limited Company. The remaining authors declare that the research was conducted in the absence of any commercial or financial relationships that could be construed as a potential conflict of interest.
References
- Yin, Z.; Wang, P.; Zhang, F. Effect of particle shape on the progressive failure of shield tunnel face in granular soils by coupled FDM-DEM method. Tunn. Undergr. Space Technol. 2020, 100, 103394. [Google Scholar] [CrossRef]
- Wang, P.; Yin, Z.; Hicher, P.; Cui, Y. Micro-mechanical analysis of one-dimensional compression of clay with DEM. Int. J. Numer. Anal. Methods Geomech. 2023, 47, 2706–2724. [Google Scholar] [CrossRef]
- Zhao, J.; Tan, Z.; Yu, R.; Li, Z.; Wang, X. Mechanical responses of a shallow-buried super-large-section tunnel in weak surrounding rock: A case study in Guizhou. Tunn. Undergr. Space Technol. 2023, 131, 104850. [Google Scholar] [CrossRef]
- Li, R.; Zhang, D.; Fang, Q.; Liu, D.; Luo, J.; Fang, H. Mechanical responses of closely spaced large span triple tunnels. Tunn. Undergr. Space Technol. 2020, 105, 103574. [Google Scholar] [CrossRef]
- Luo, Y.; Chen, J.; Shi, Z.; Li, J.; Liu, W. Mechanical characteristics of primary support of large span loess highway tunnel: A case study in Shaanxi Province, Loess Plateau, NW China primary. Tunn. Undergr. Space Technol. 2020, 104, 103532. [Google Scholar] [CrossRef]
- Xue, Y.; Gong, H.; Kong, F.; Yang, W.; Qiu, D.; Zhou, B. Stability analysis and optimization of excavation method of double-arch tunnel with an extra-large span based on numerical investigation. Front. Struct. Civ. Eng. 2021, 15, 136–146. [Google Scholar] [CrossRef]
- Jiang, Q.; Song, S.-G.; Li, T.; Wang, K.; Gu, R.-H. Study on surrounding rock stability of small clear-distance twin highway tunnel with eight lanes. Geotech. Geol. Eng. 2019, 37, 593–598. [Google Scholar] [CrossRef]
- He, J.; He, S.; Liu, X.; Zheng, J. Structural design and mechanical responses of closely spaced super-span double tunnels in strongly weathered tuff strata. Front. Struct. Civ. Eng. 2022, 16, 685–703. [Google Scholar] [CrossRef]
- Yoo, C. Performance of multi-faced tunnelling—A 3D numerical investigation. Tunn. Undergr. Space Technol. 2009, 24, 562–573. [Google Scholar] [CrossRef]
- Sharifzadeh, M.; Daraei, R.; Broojerdi, M.S. Design of sequential excavation tunneling in weak rocks through findings obtained from displacements based back analysis. Tunn. Undergr. Space Technol. 2012, 28, 10–17. [Google Scholar] [CrossRef]
- Ieronymaki, E.; Whittle, A.J.; Einstein, H.H. Comparative study of the effects of three tunneling methods on ground movements in stiff clay. Tunn. Undergr. Space Technol. 2018, 74, 167–177. [Google Scholar] [CrossRef]
- Hoek, E. Big tunnels in bad rock. J. Geotech. Geoenviron. Eng. 2001, 127, 726–740. [Google Scholar] [CrossRef]
- Yu, C.; Chern, J. Expert System for D&B Tunnel Construction; Underground Space 4th Dimension of Metropolises: London, UK, 2007; pp. 799–803. ISBN 978-0-415-40807-3. [Google Scholar]
- Daraei, A.; Zare, S. A new multi-graph approach for selecting the sequential excavation method of civil tunnels. Tunn. Undergr. Space Technol. 2019, 91, 102999. [Google Scholar] [CrossRef]
- Zhu, H.; Yan, J.; Liang, W. Challenges and Development Prospects of Ultra-Long and Ultra-Deep Mountain Tunnels. Engineering 2019, 5, 384–392. [Google Scholar] [CrossRef]
- Ou, G.-Z.; Jiao, Y.-Y.; Zhang, G.-H.; Zou, J.-P.; Tan, F.; Zhang, W.-S. Collapse risk assessment of deep-buried tunnel during construction and its application. Tunn. Undergr. Space Technol. 2021, 115, 104019. [Google Scholar] [CrossRef]
- Zhang, Z.; Zhao, C.; Peng, L.; Zhang, X.; Lei, M. Research on the stability of shallow-buried large cross-section tunnel by construction method conversion. Front. Earth Sci. 2022, 10, 831169. [Google Scholar] [CrossRef]
- Liu, D.; Zhang, D.; Fang, Q.; Sun, Z.; Cao, L.; Li, A. Displacement characteristics of shallow-buried large-section loess tunnel with different types of pre-supports: A case study of new Badaling tunnel. Appl. Sci. 2019, 10, 195. [Google Scholar] [CrossRef]
- Mei, Y.; Ke, X.; Zhou, D.-B.; Zhang, S.; Yang, T. Study on the whole process application of advanced grouting pipe shed support under urban complex stratum conditions. Geomech. Energy Environ. 2023, 33, 100432. [Google Scholar] [CrossRef]
- Fan, H.; Xu, Q.; Lai, J.; Liu, T.; Zhu, Z.; Zhu, Y.; Gao, X. Stability of the loess tunnel foundation reinforced by jet grouting piles and the influence of reinforcement parameters. Transp. Geotech. 2023, 40, 100965. [Google Scholar] [CrossRef]
- Zhang, D.; Fang, Q.; Hou, Y.; Li, P.; Wong, L.N.Y. Protection of buildings against damages as a result of adjacent large-span tunneling in shallowly buried soft ground. J. Geotech. Geoenviron. Eng. 2013, 139, 903–913. [Google Scholar] [CrossRef]
- Zhao, M.; Lai, H.; Liu, Y. A Study on the Formation Mechanism and Calculation Method of Surrounding Rock Pressure in Shallow-buried Loess Tunnel Considering the Influence of Vertical Joints. KSCE J. Civ. Eng. 2023, 27, 1820–1837. [Google Scholar] [CrossRef]
- Wang, Y.; Xin, Y.; Xie, Y.; Li, J.; Wang, Z. Investigation of mechanical performance of prestressed steel arch in tunnel. Front. Struct. Civ. Eng. 2017, 11, 360–367. [Google Scholar] [CrossRef]
- Hua, J.; Zheng, J. Geological Engineering Handbook; China Architecture & Building Press: Beijing, China, 2018; ISBN 978-7-112-21642-0. (In Chinese) [Google Scholar]
- JTG 3370.1-2018; Specifications for Design of Highway Tunnels. China Communications Press: Beijing, China, 2018. (In Chinese)
- Lei, M.; Zhao, C.; Jia, C.; Shi, C. Study on the geological adaptability of the arch cover method for shallow-buried large-span metro stations. Tunn. Undergr. Space Technol. 2023, 132, 104897. [Google Scholar] [CrossRef]
- JTG/T D70-2010; Guidelines for Design of Highway Tunnel. China Communications Press: Beijing, China, 2010. (In Chinese)
- Morovatdar, A.; Palassi, M.; Ashtiani, R.S. Effect of pipe characteristics in umbrella arch method on controlling tunneling-induced settlements in soft grounds. J. Rock Mech. Geotech. Eng. 2020, 12, 984–1000. [Google Scholar] [CrossRef]
- Wang, H.B.; Lu, P.J.; Zong, Q. Experimental Study on Highway Tunnel Surrounding Rock Reinforced by Small Pipe Pre-Grouting. Adv. Mater. Res. 2011, 250–253, 2617–2621. [Google Scholar] [CrossRef]
- Bao, L. Research on Supporting Effect of Advanced Small Conduit in Soft Rock Tunnel; Huazhong University of Science and Technology: Wuhan, China, 2018. [Google Scholar] [CrossRef]
Figure 1.
Tunnel longitudinal profile and monitoring section.

Figure 2.
Excavation exposure of tunnel exit: (a) left tunnel face; (b) right tunnel face.
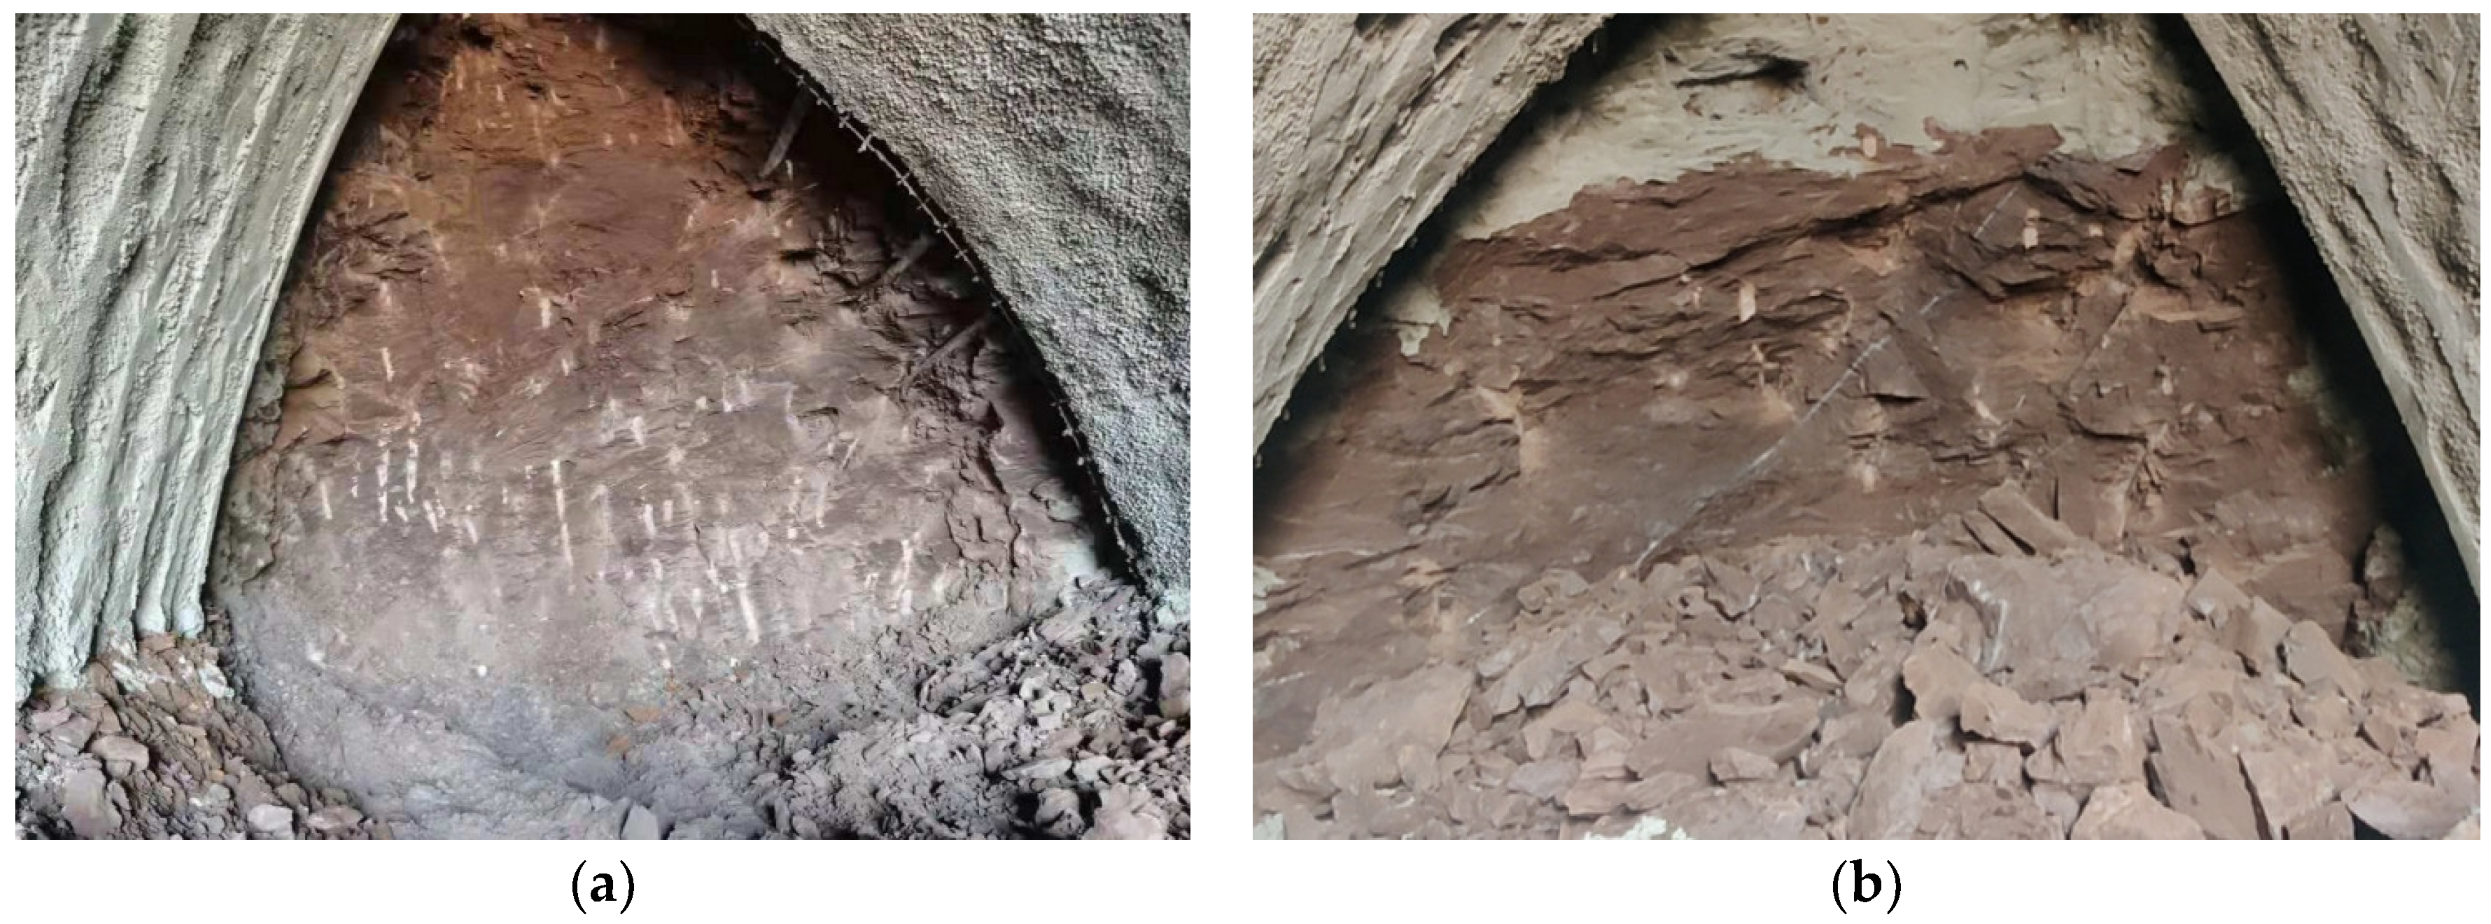
Figure 3.
Division of tunnel section: (a) DSD method; (b) three-bench method.
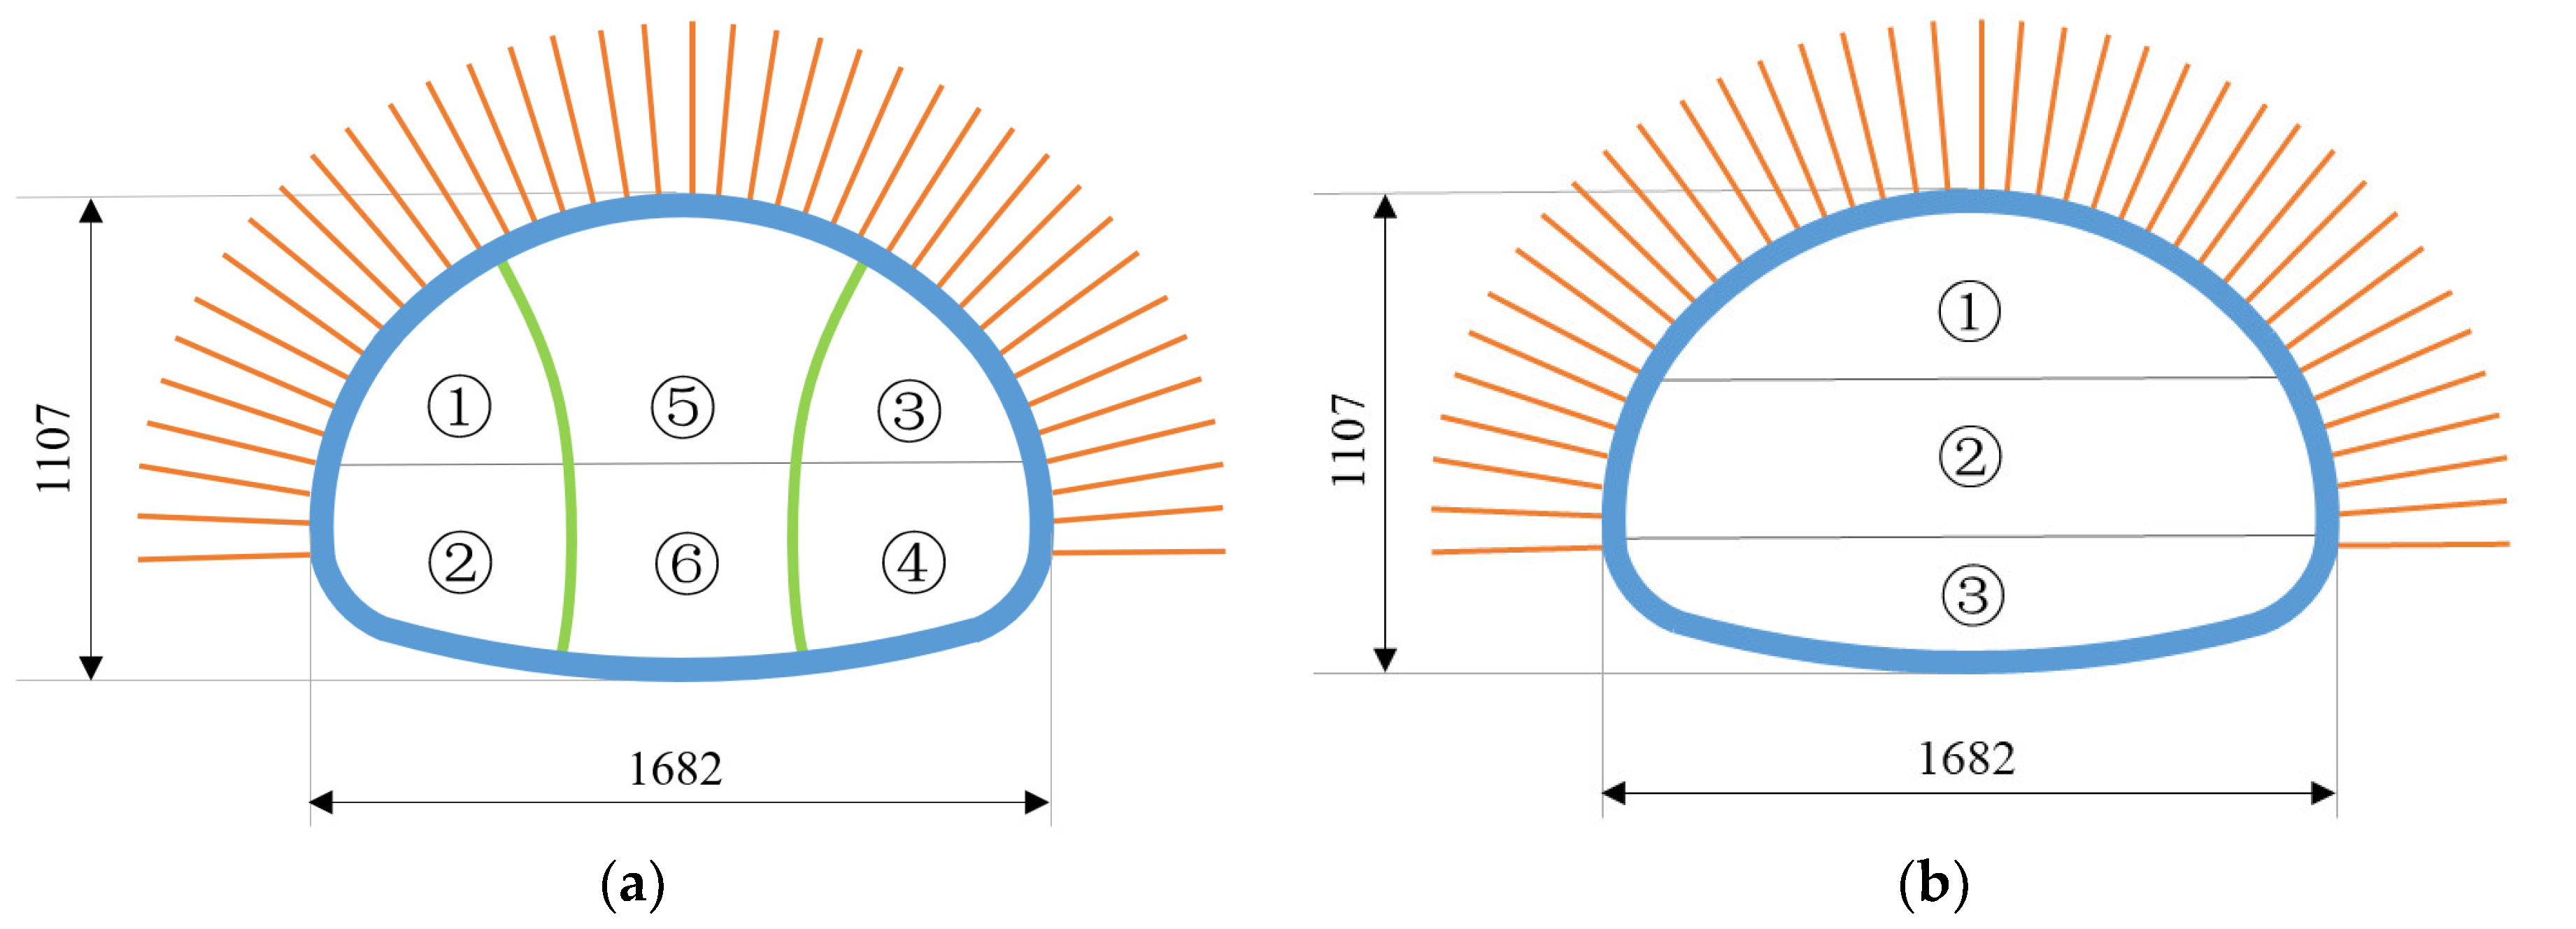
Figure 4.
Finite element model.

Figure 5.
Isoline map of vertical displacement at ZK10+727: (a) no conversion; (b) conversion.

Figure 6.
Evolution process of vault settlement and invert uplift of the surrounding rock at ZK10+727.
Figure 6.
Evolution process of vault settlement and invert uplift of the surrounding rock at ZK10+727.

Figure 7.
Circumferential stress nephogram of shotcrete: (a) no conversion; (b) conversion.

Figure 8.
Distribution of circumferential stress in shotcrete at ZK10+727 with conversion.
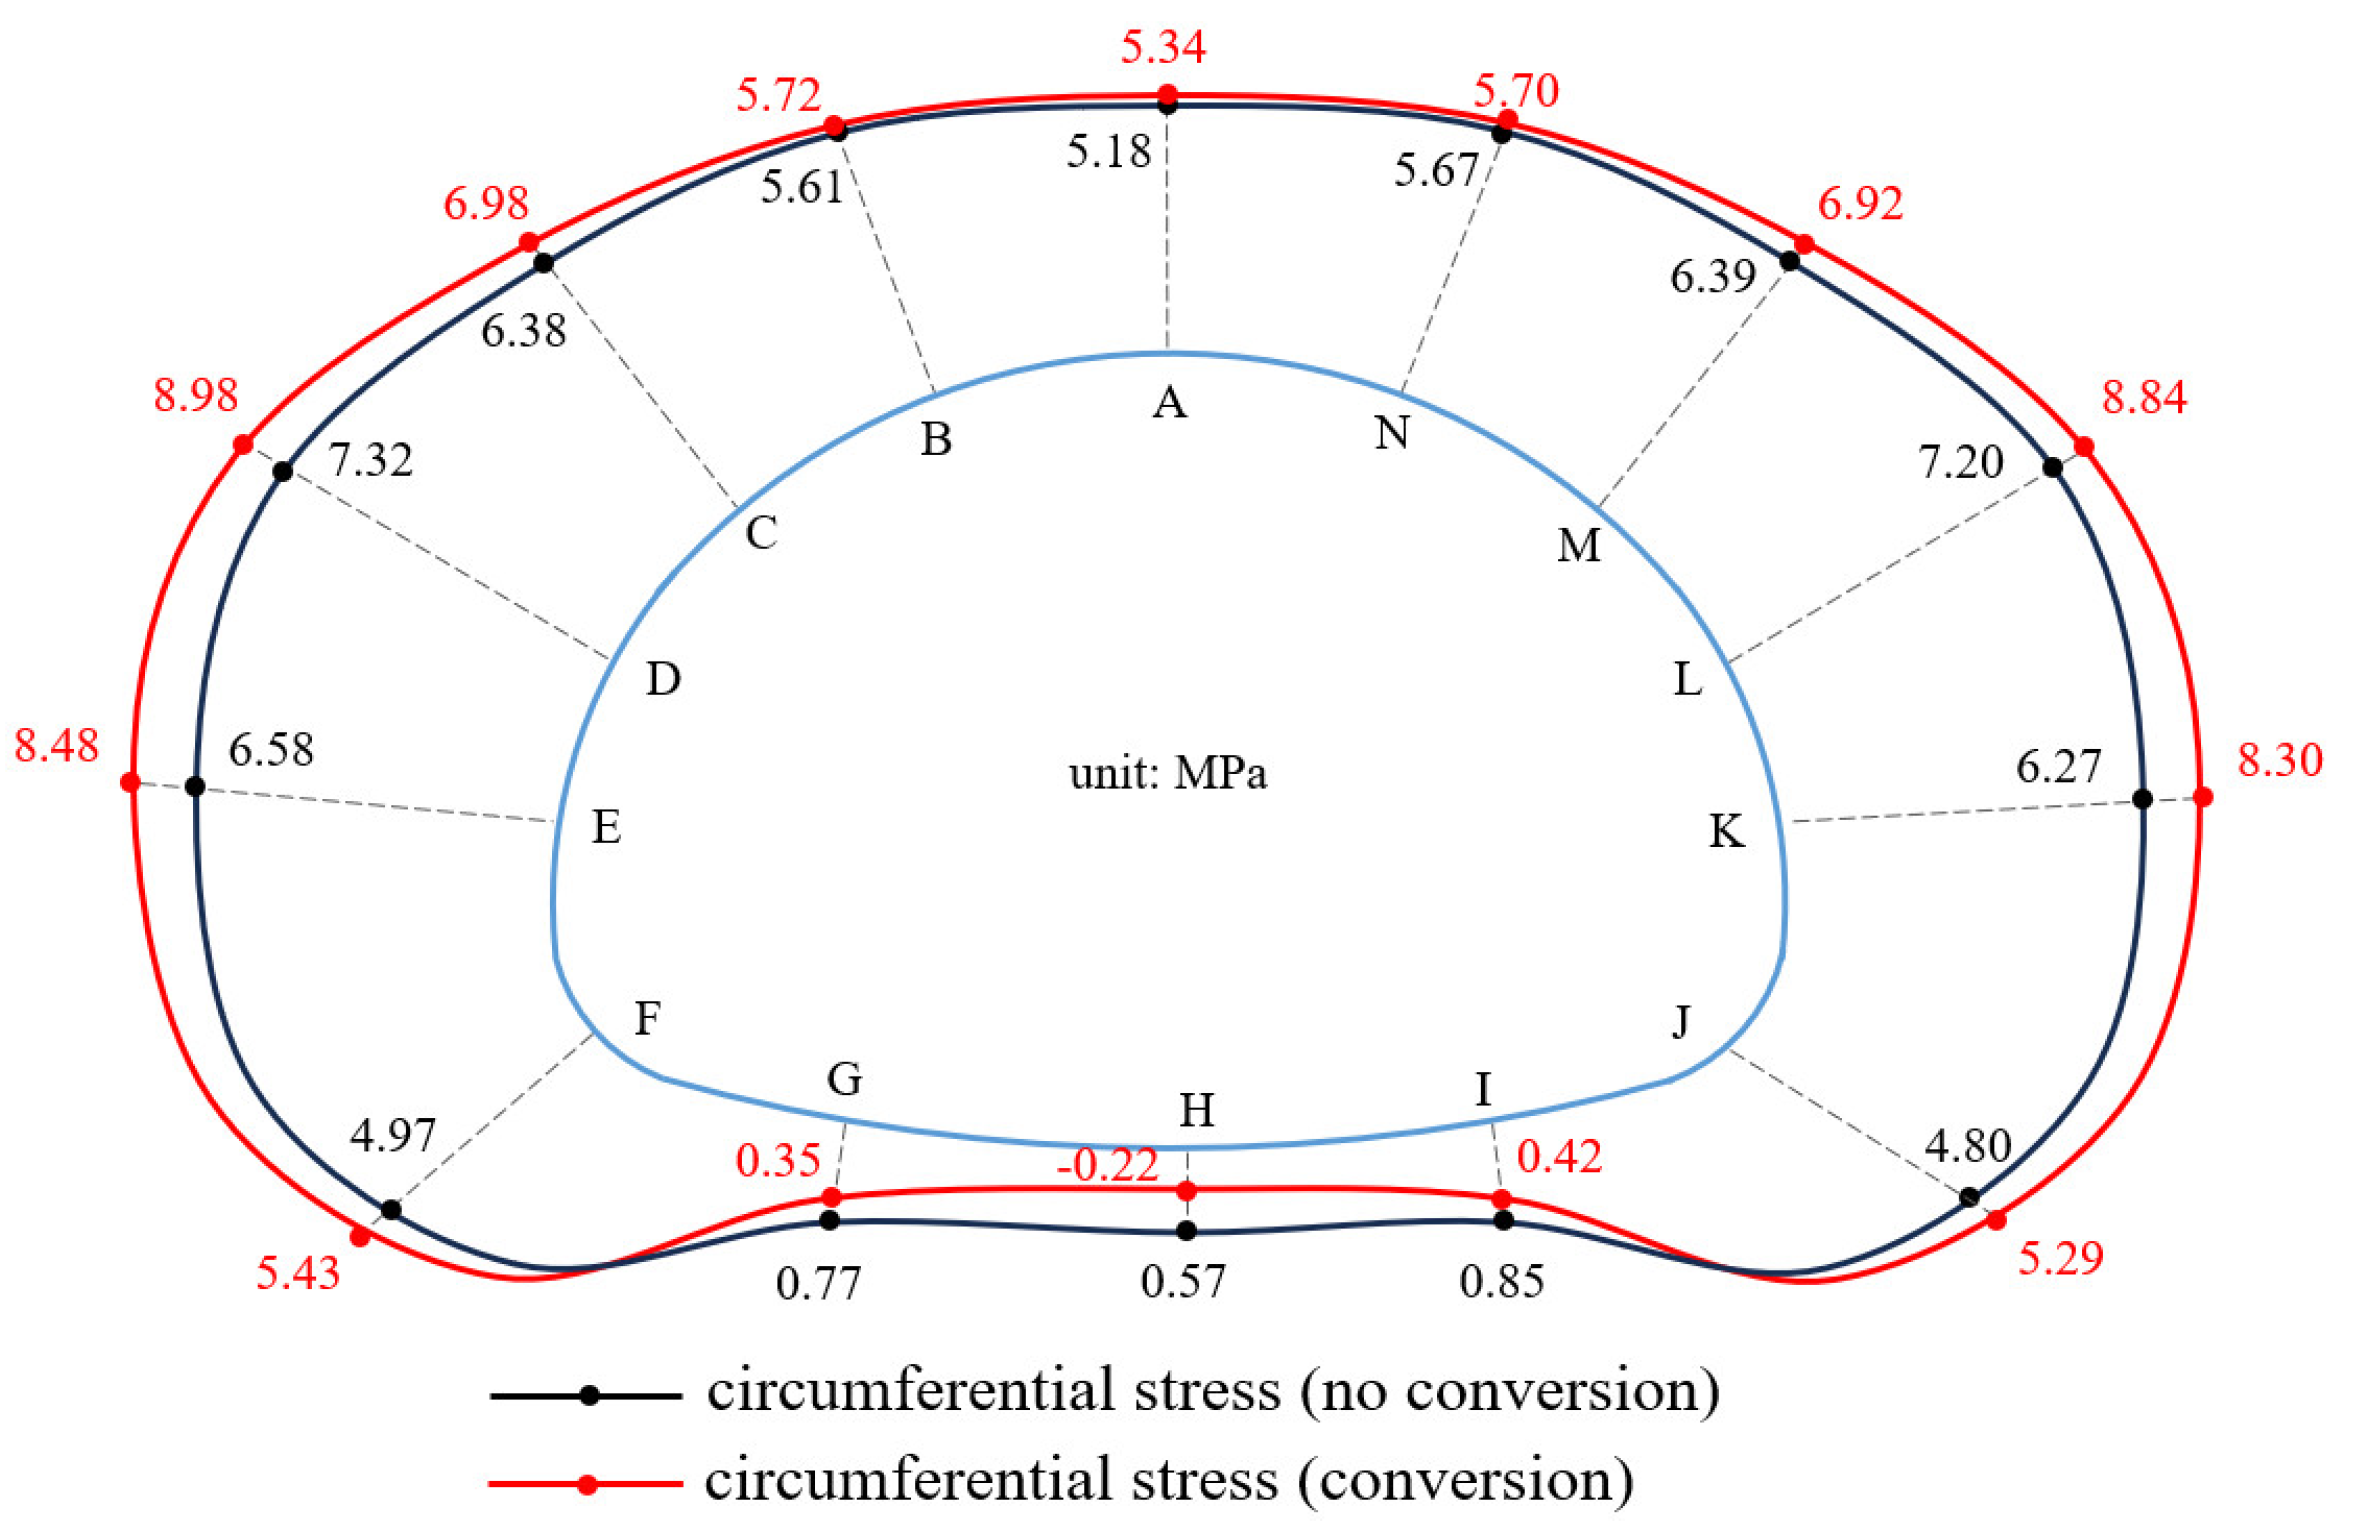
Figure 9.
Evolution process of circumferential stress in shotcrete at ZK10+727: (a) no conversion; (b) conversion.
Figure 9.
Evolution process of circumferential stress in shotcrete at ZK10+727: (a) no conversion; (b) conversion.
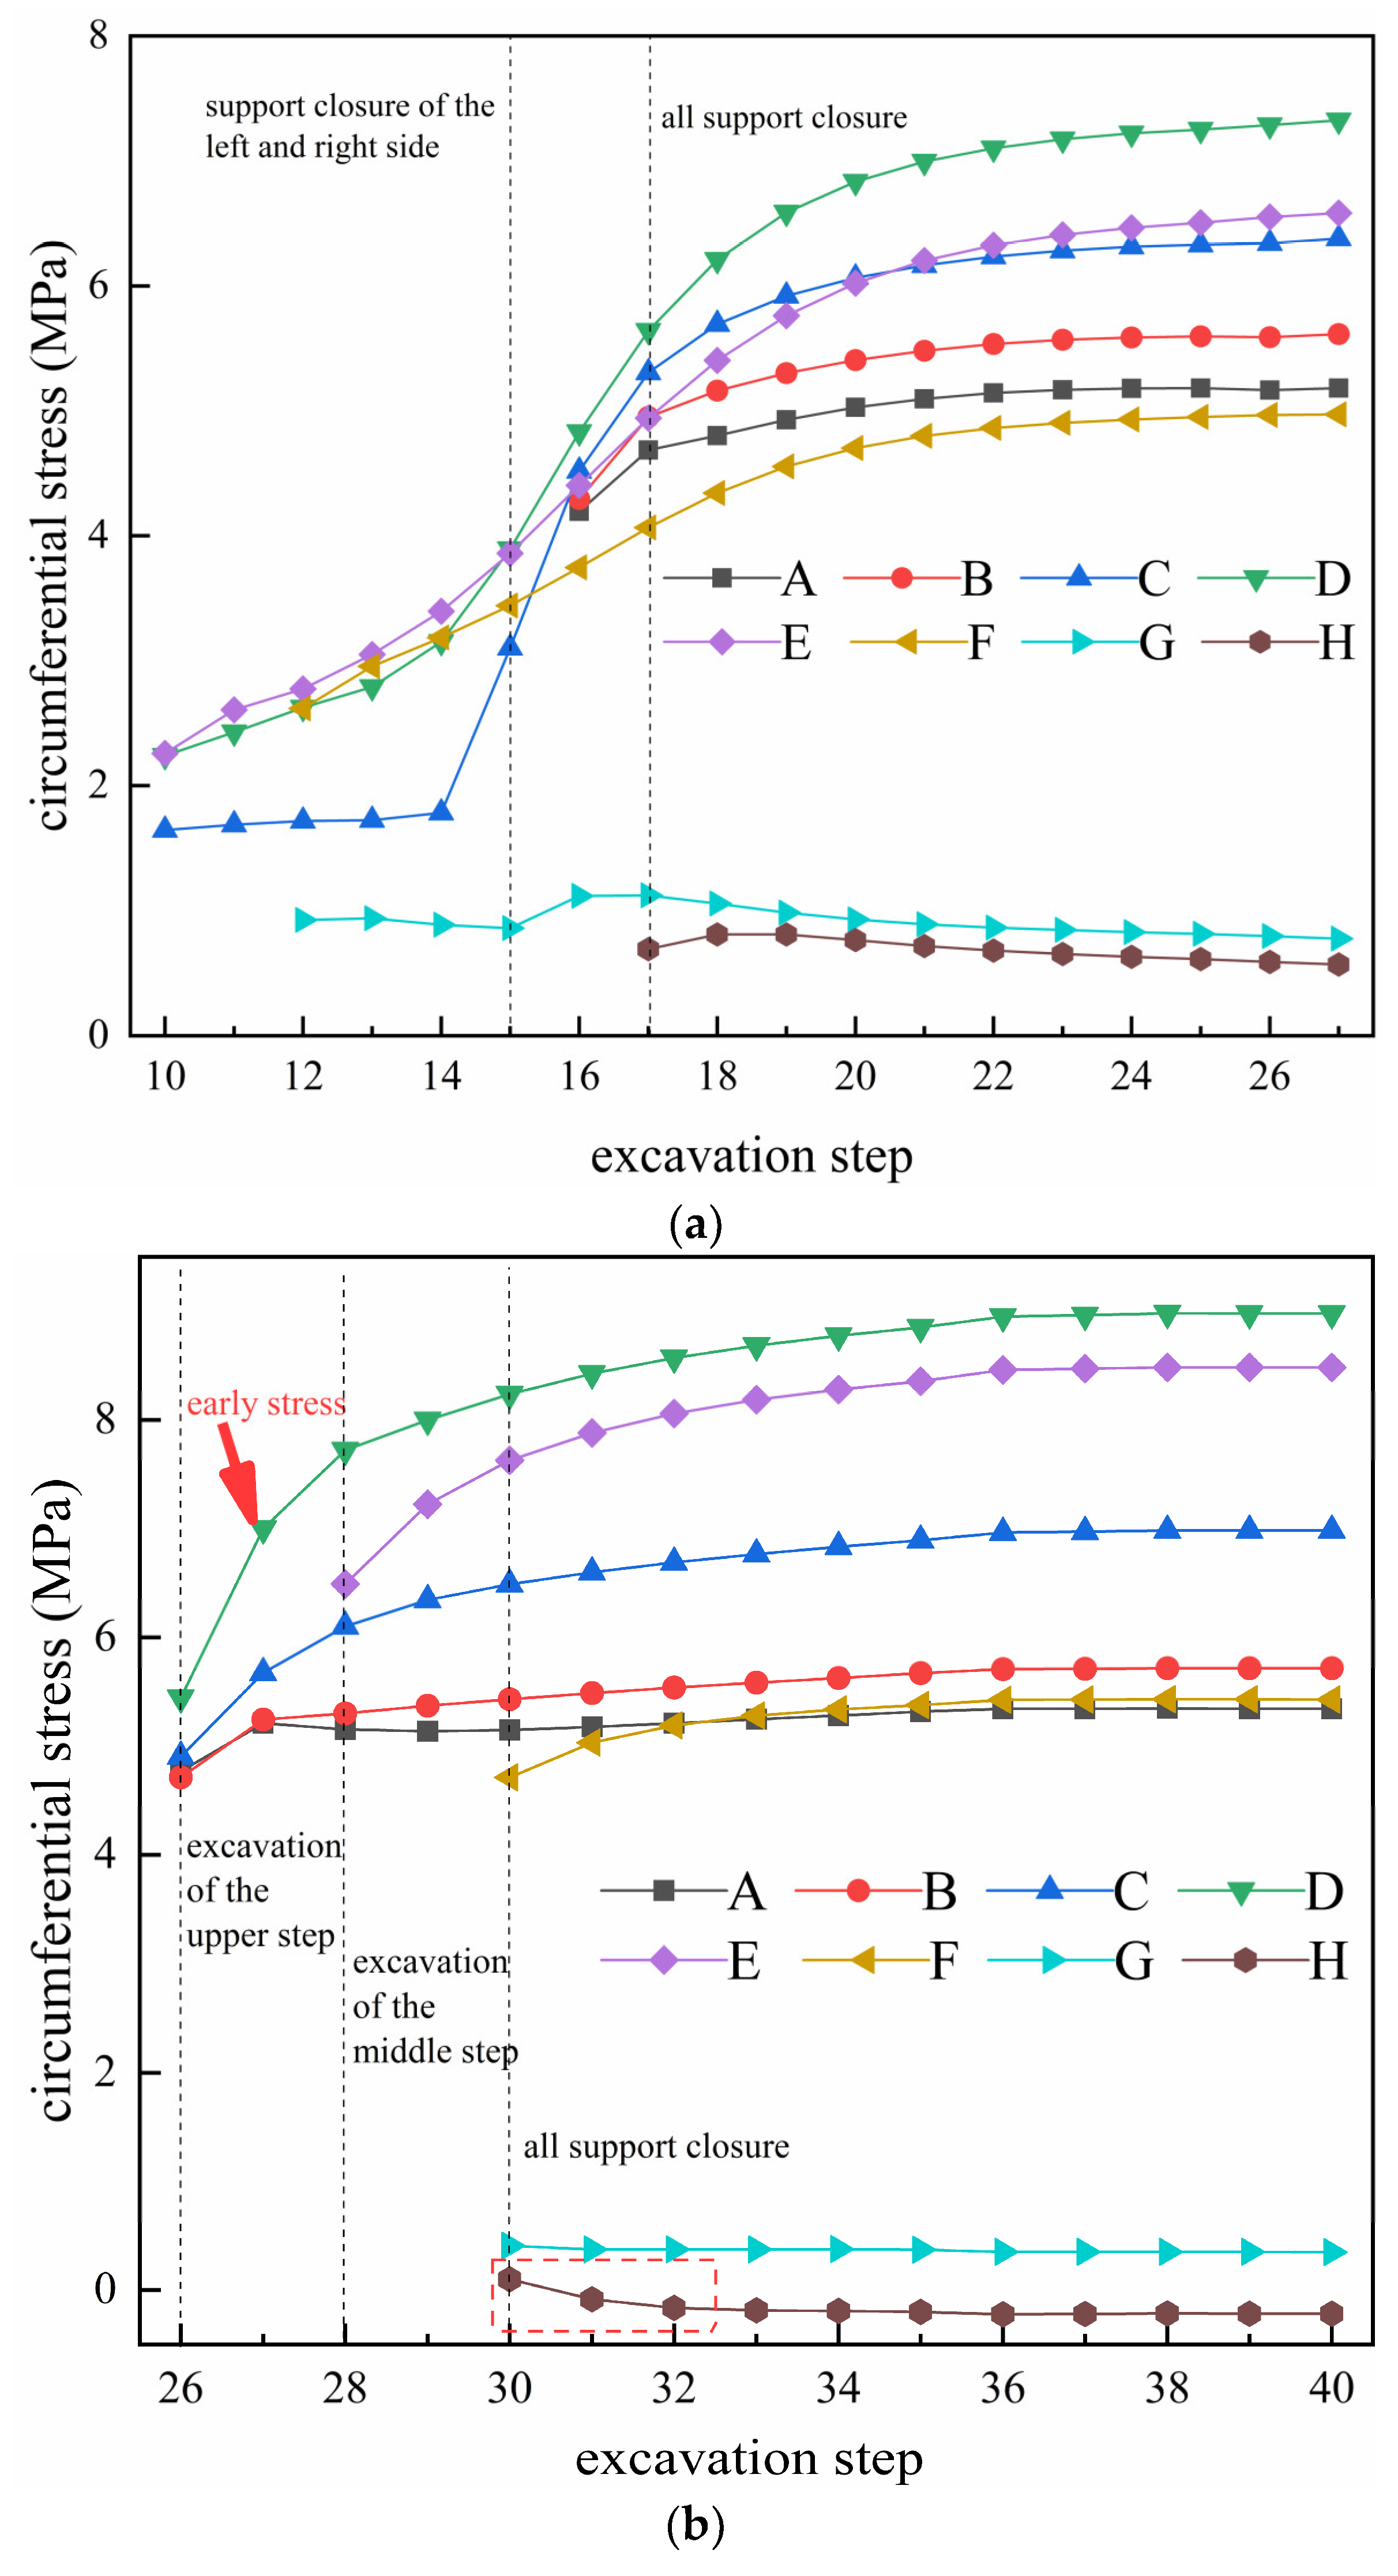
Figure 10.
Reinforcement diagram of the leading conduit.
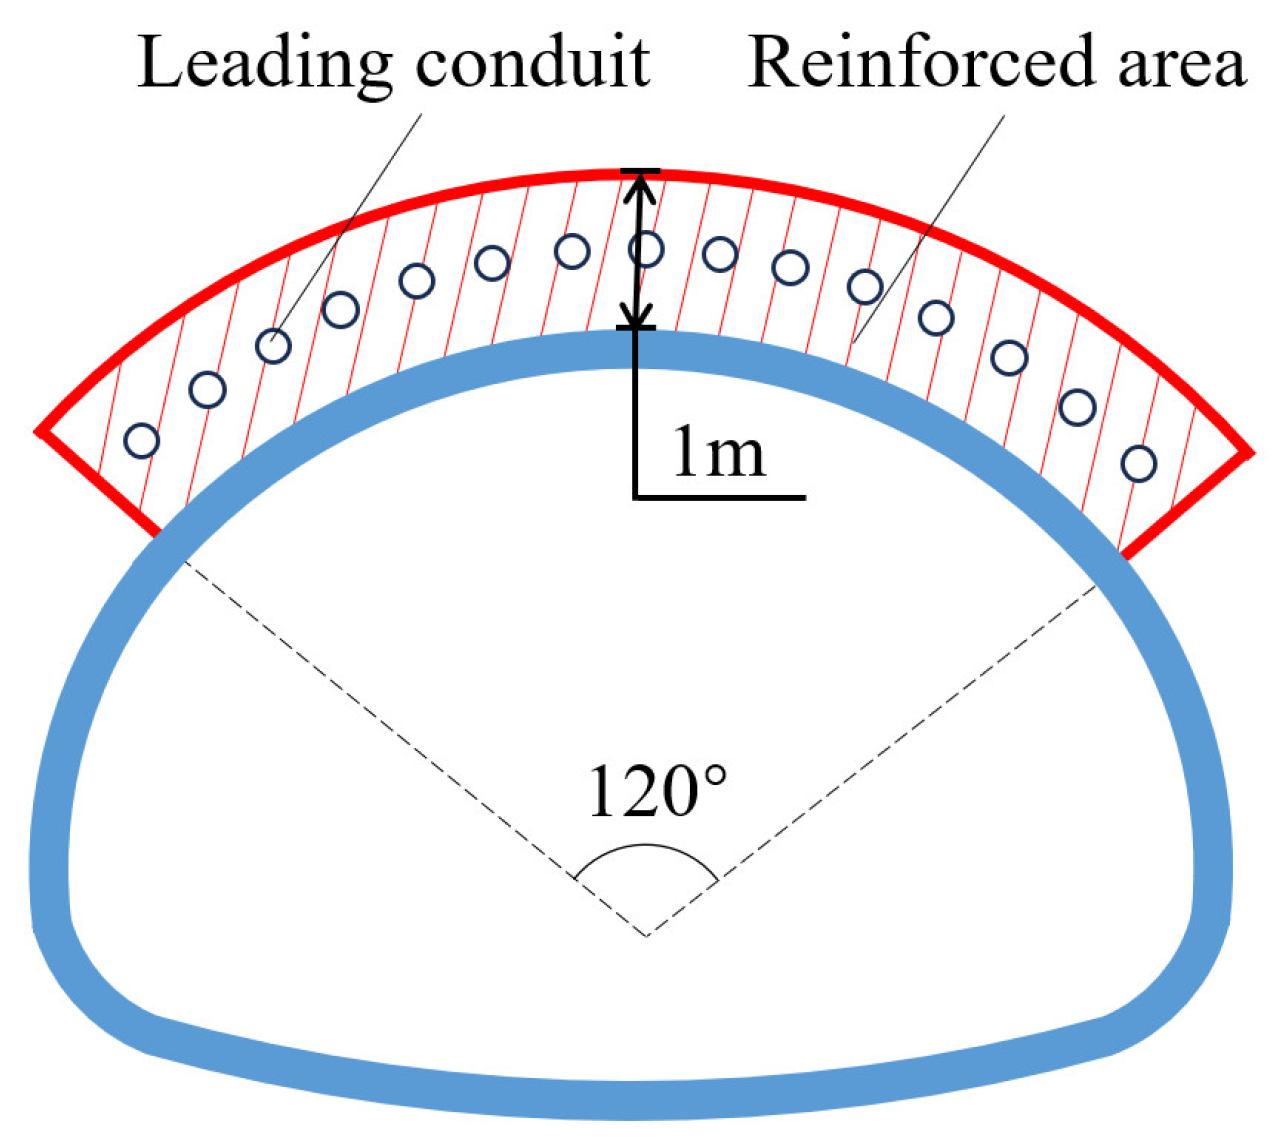
Figure 11.
Finite element model of leading conduit reinforced area.
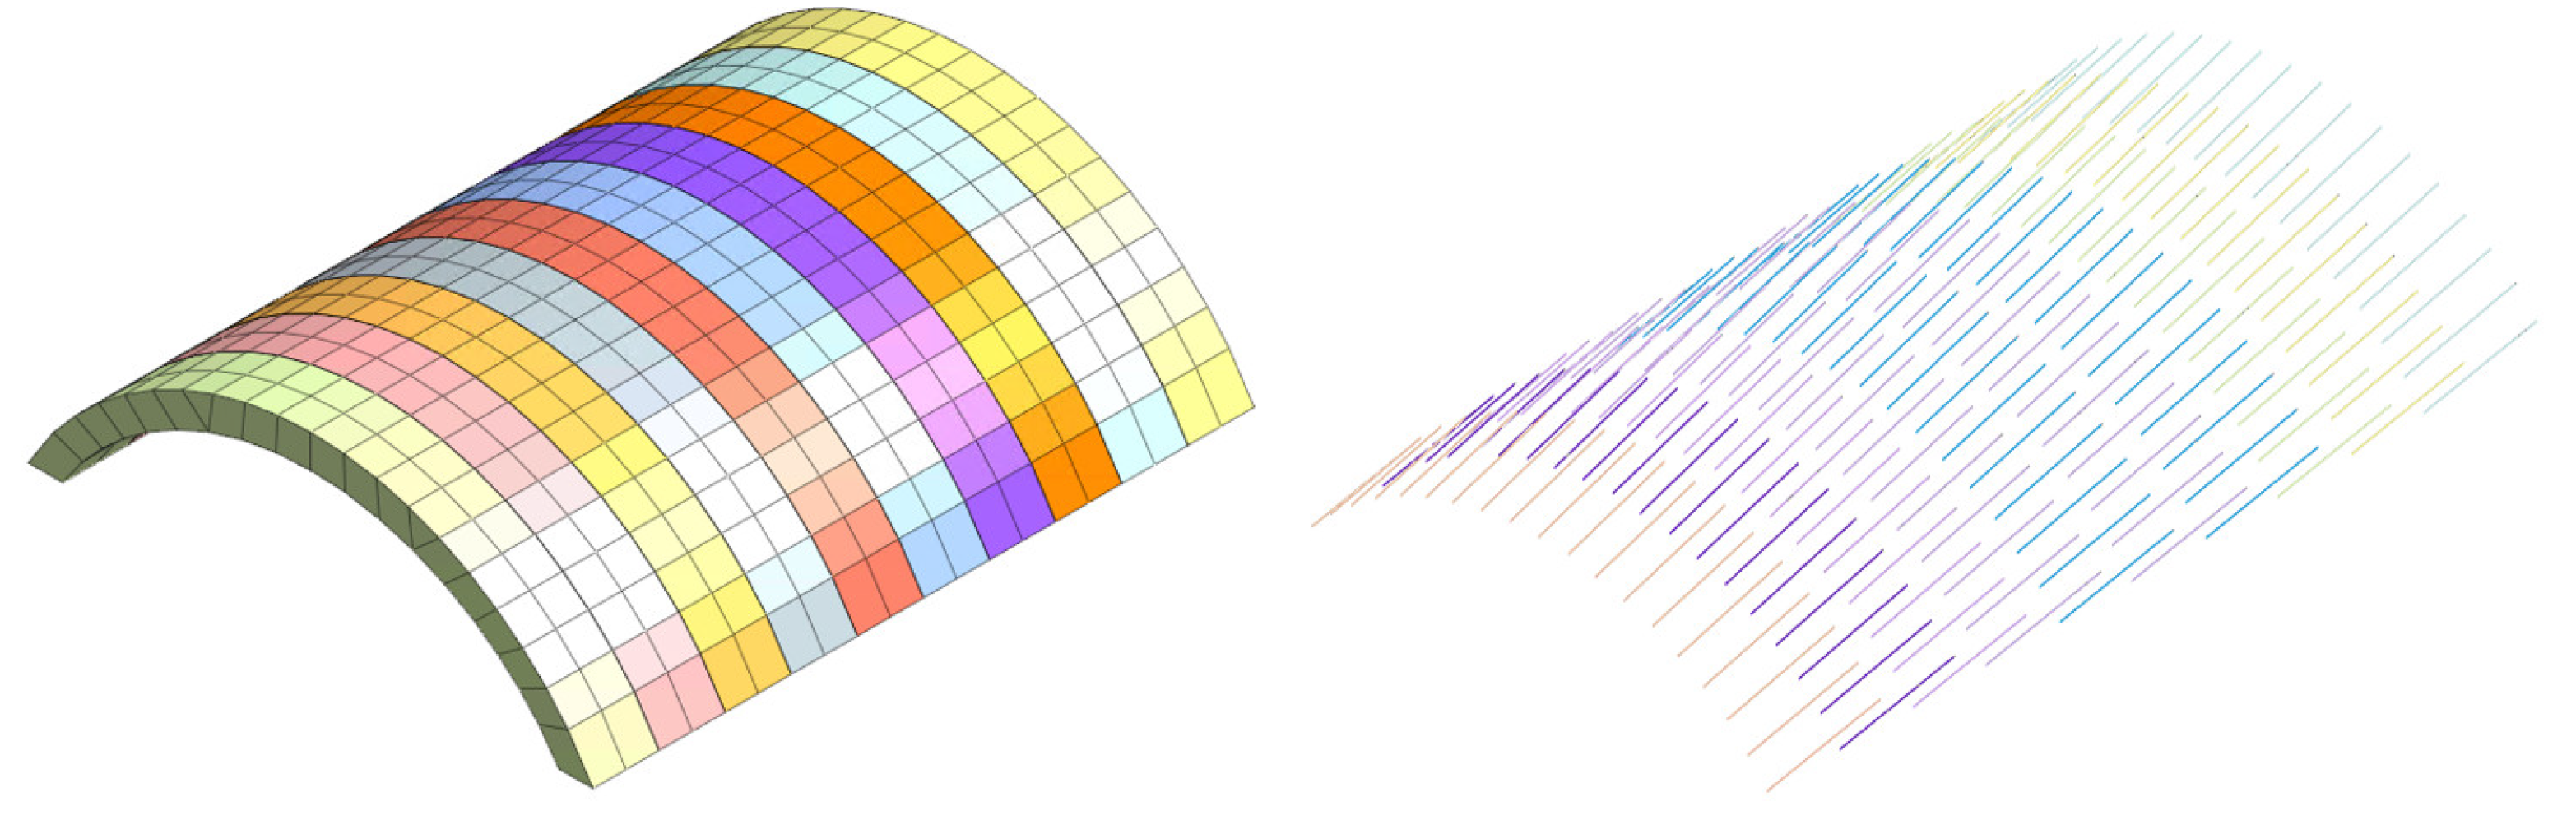
Figure 12.
Distribution and evolution process of circumferential stress of the shotcrete at ZK10+727 with reinforcement.
Figure 12.
Distribution and evolution process of circumferential stress of the shotcrete at ZK10+727 with reinforcement.

Figure 13.
Evolution process of circumferential stress at point D.
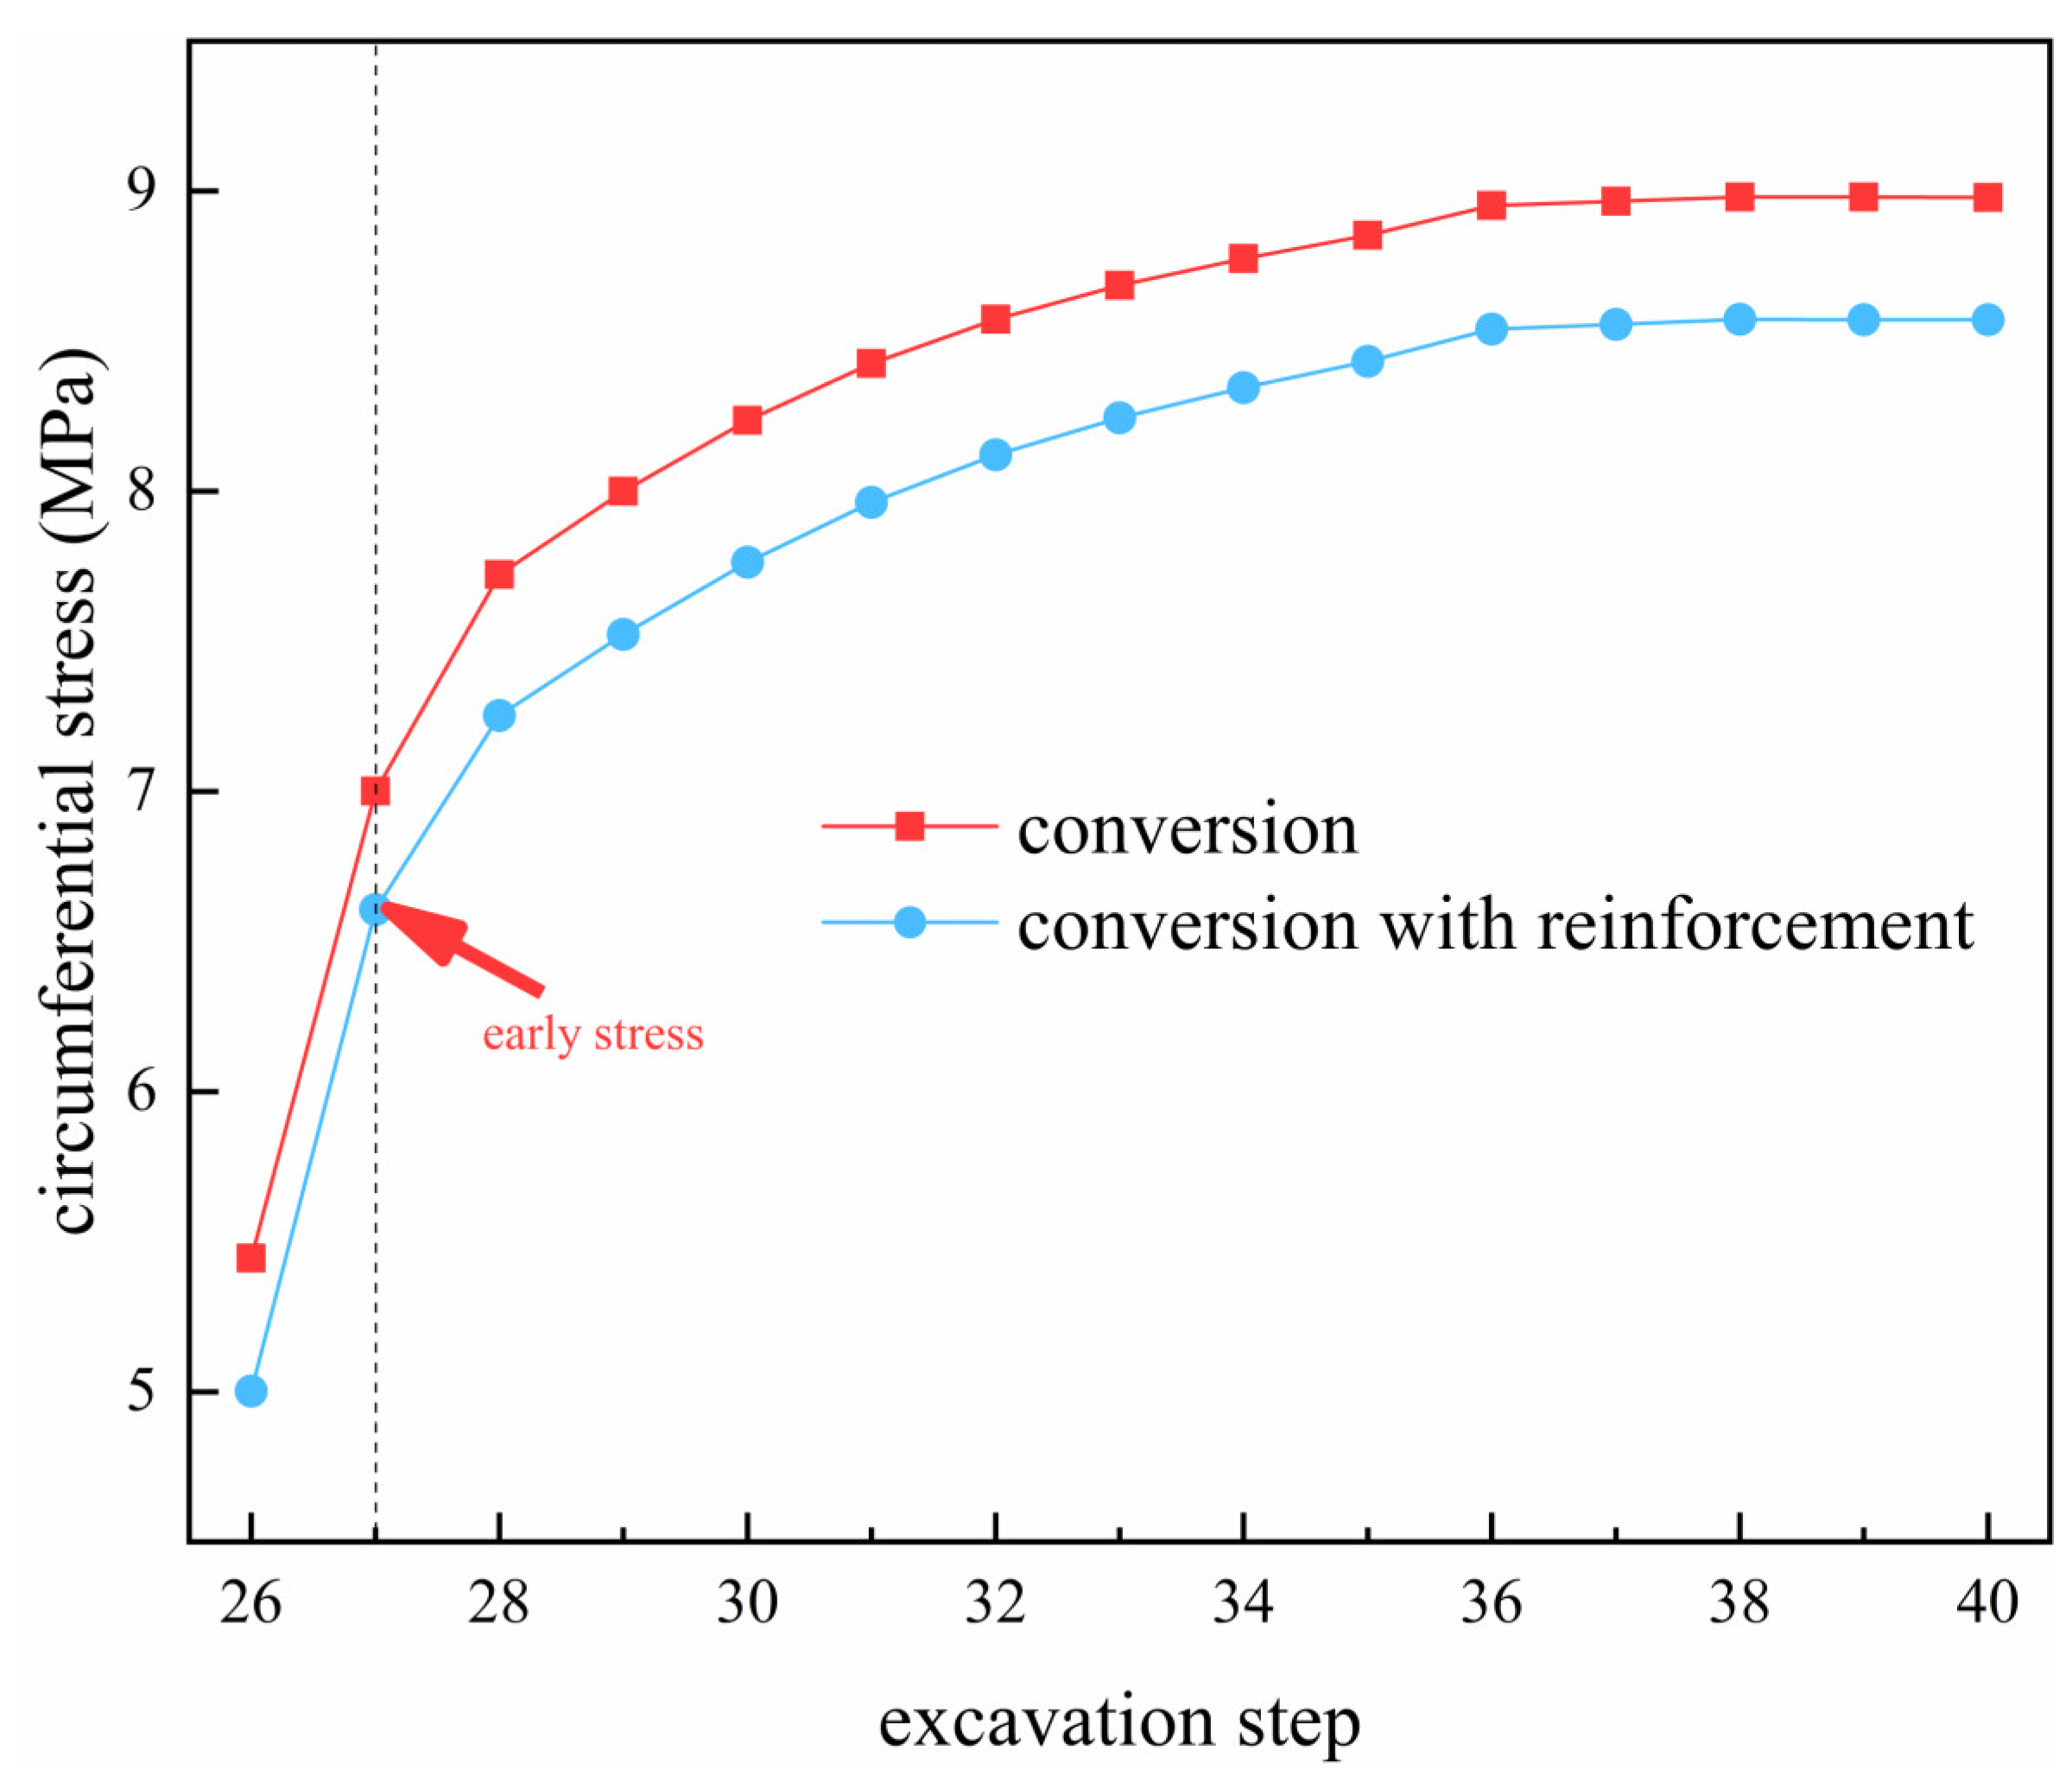
Figure 14.
The circumferential stress at point D of different lengths: (a) final stress; (b) early stress.
Figure 14.
The circumferential stress at point D of different lengths: (a) final stress; (b) early stress.

Figure 15.
The circumferential stress at point D of different thicknesses: (a) final stress; (b) early stress.
Figure 15.
The circumferential stress at point D of different thicknesses: (a) final stress; (b) early stress.
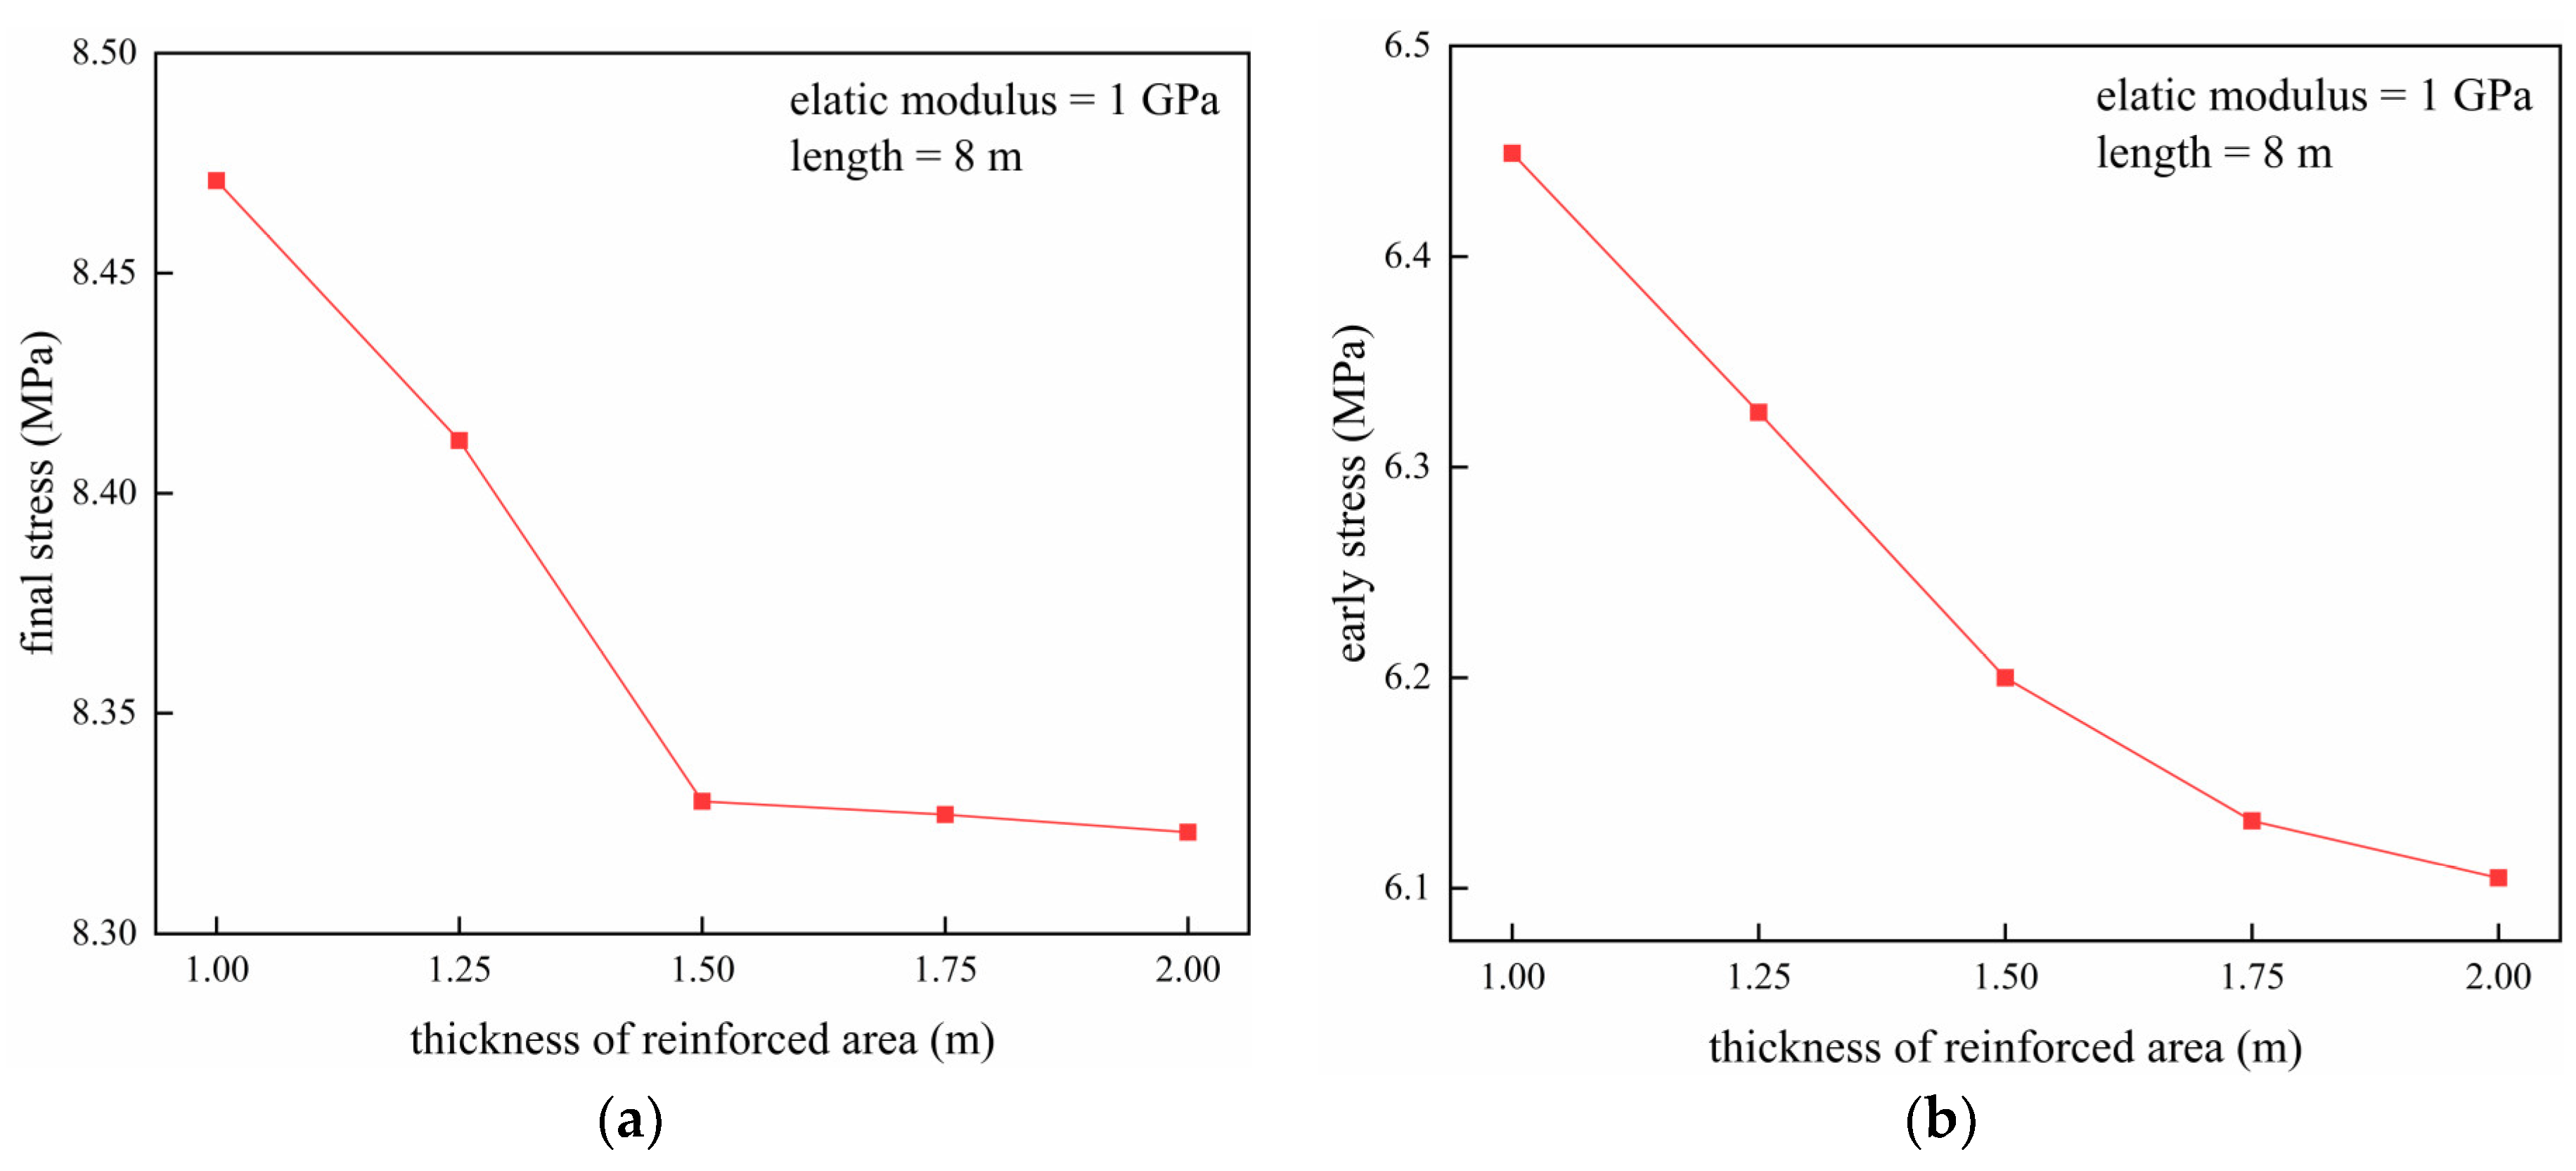
Figure 16.
The circumferential stress at point D of different mechanical parameters: (a) final stress; (b) early stress.
Figure 16.
The circumferential stress at point D of different mechanical parameters: (a) final stress; (b) early stress.
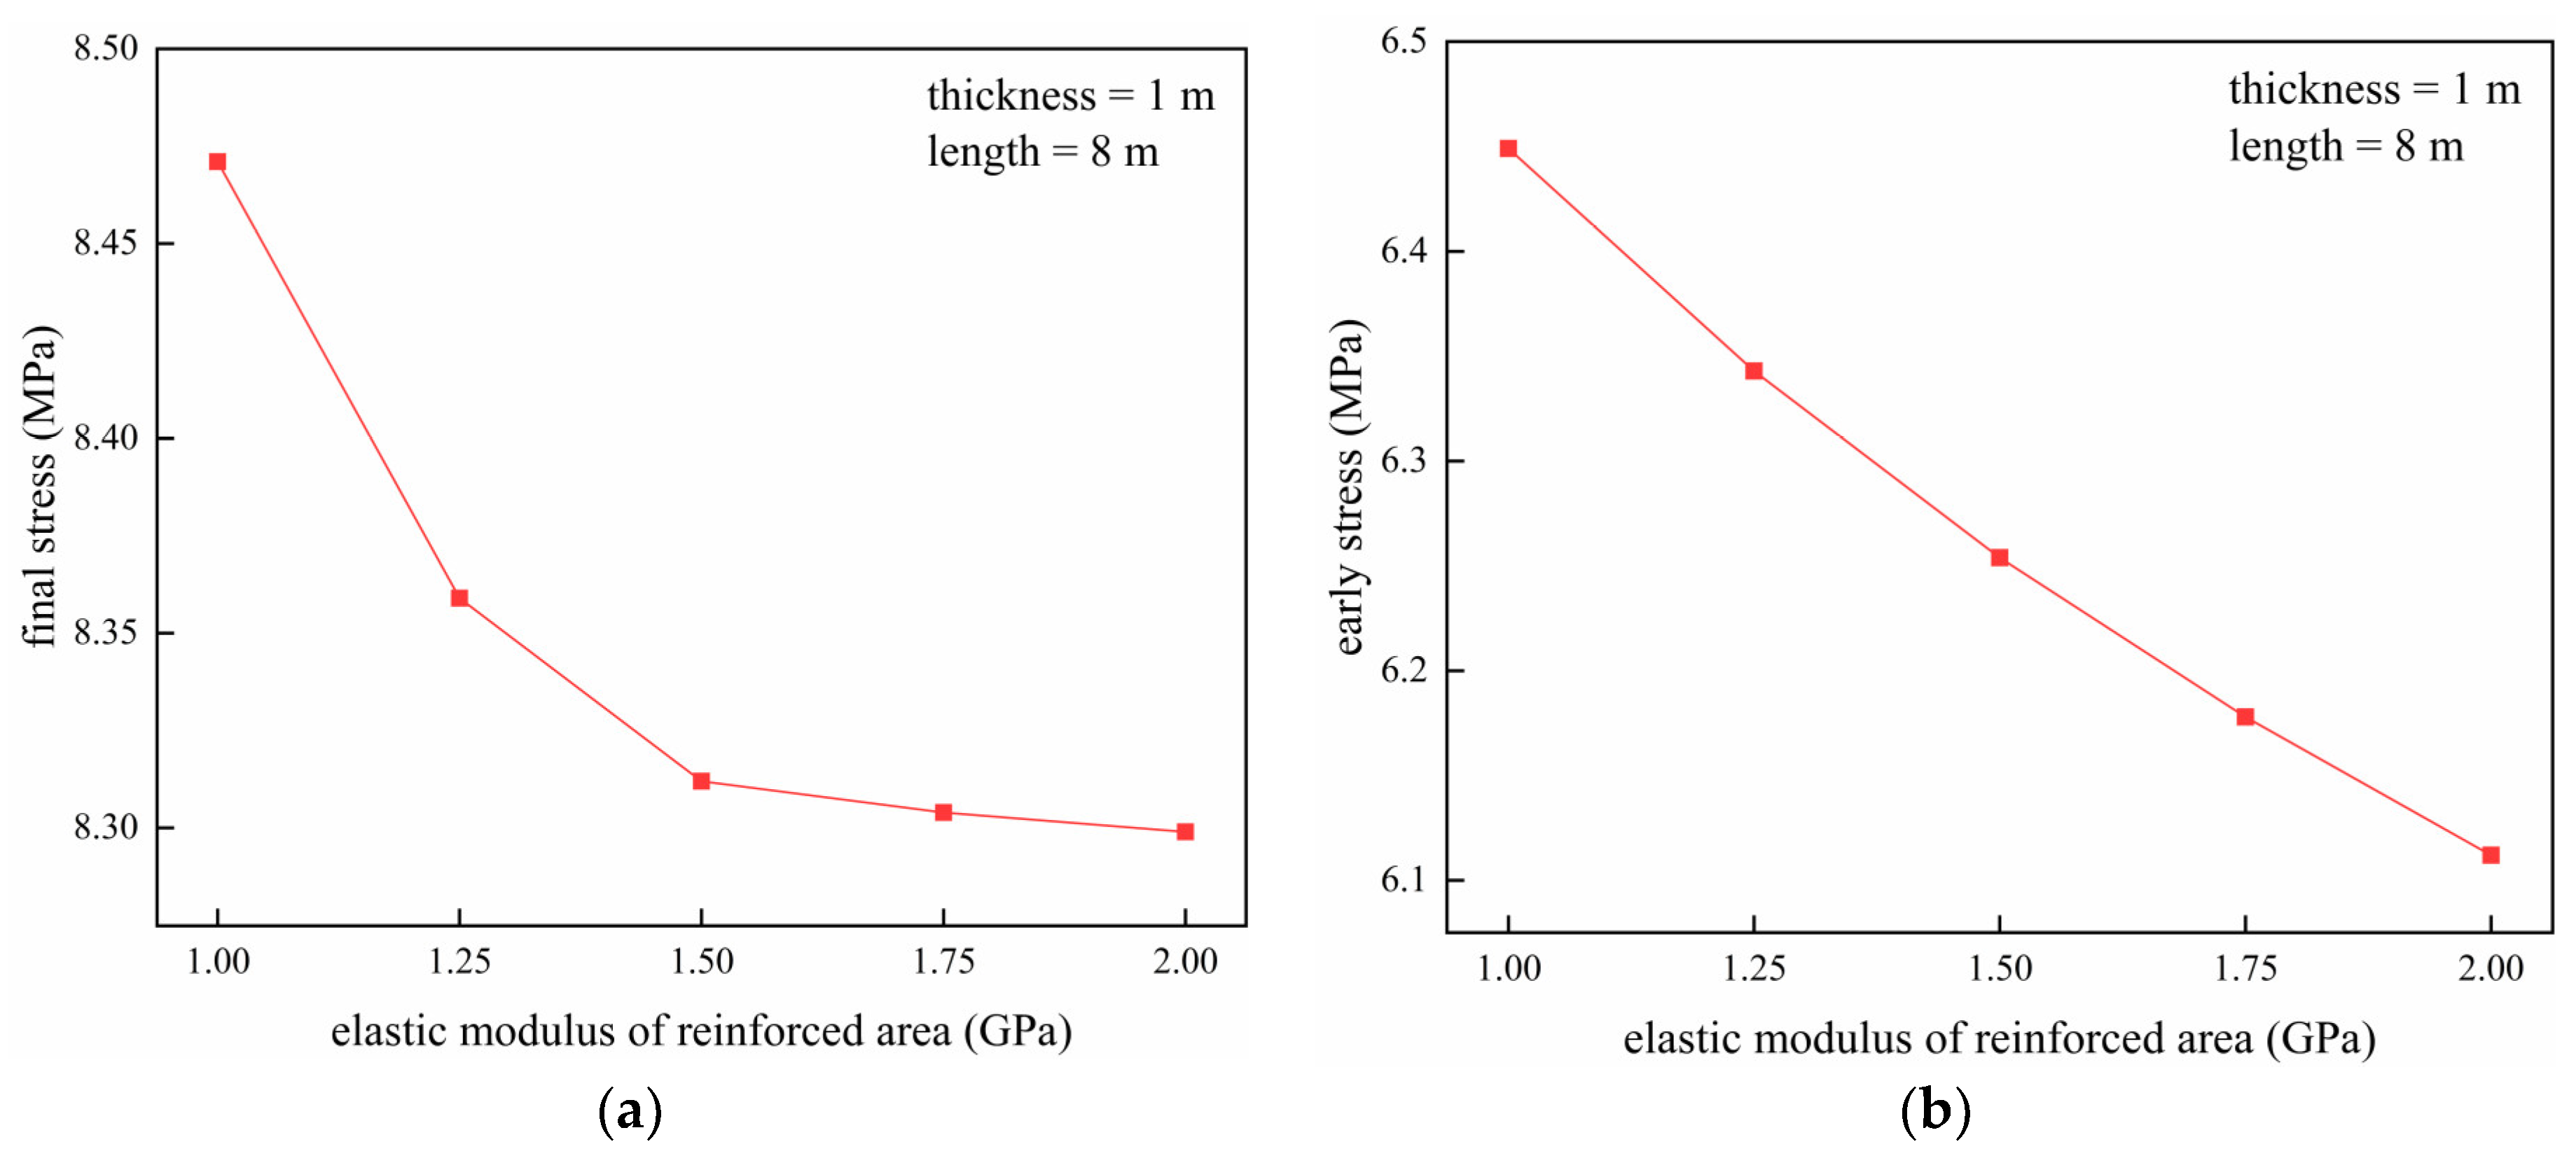
Figure 17.
Comparison of numerical results and monitoring data.


Table 1.
Mechanical parameters of surrounding rock and support structure.
| Name | Gravity Density (kN·m−3) | Poisson’s Ratio | Elastic Modulus (GPa) | Cohesion (kPa) | Internal Friction Angle (°) |
|---|---|---|---|---|---|
| highly weathered mud shale | 22.5 | 0.35 | 0.3 | 200 | 25 |
| moderately weathered mud shale | 23.5 | 0.325 | 1 | 450 | 33 |
| shotcrete | 25 | 0.2 | 28 | / | / |
| temporary support | 25 | 0.2 | 28 | / | / |
| hollow grouting bolt | 78.5 | 0.3 | 210 | / | / |
Table 2.
Mechanical parameters of leading conduit and the reinforced area.
| Name | Gravity Density (kN·m−3) | Poisson’s Ratio | Elastic Modulus (GPa) | Cohesion (kPa) | Internal Friction Angle (°) |
|---|---|---|---|---|---|
| reinforced area | 24 | 0.3 | 1 | 500 | 30 |
| leading conduit | 78.5 | 0.3 | 210 | / | / |
Table 3.
Length of reinforced area.
| Name | Range of Reinforced Area | Length (m) |
|---|---|---|
| 1 | ZK10+729~ZK10+725 | 4 |
| 2 | ZK10+729~ZK10+723 | 6 |
| 3 | ZK10+729~ZK10+721 | 8 |
| 4 | ZK10+729~ZK10+719 | 10 |
| 5 | ZK10+729~ZK10+717 | 12 |
Table 4.
Thickness of reinforced area.
| Name | Setting Angle of the Small Conduit (°) | Thickness (m) |
|---|---|---|
| 1 | 9.2 | 1 |
| 2 | 11.5 | 1.25 |
| 3 | 13.9 | 1.5 |
| 4 | 16.3 | 1.75 |
| 5 | 18.7 | 2 |
Table 5.
Mechanical parameters of reinforced area.
| Name | Gravity Density (kN·m−3) | Poisson’s Ratio | Elastic Modulus (GPa) | Cohesion (kPa) | Internal Friction Angle (°) |
|---|---|---|---|---|---|
| 1 | 24 | 0.3 | 1 | 500 | 30 |
| 2 | 24.5 | 0.3 | 1.25 | 500 | 30 |
| 3 | 25 | 0.3 | 1.5 | 500 | 30 |
| 4 | 25.5 | 0.3 | 1.75 | 500 | 30 |
| 5 | 26 | 0.3 | 2 | 500 | 30 |
Disclaimer/Publisher’s Note: The statements, opinions and data contained in all publications are solely those of the individual author(s) and contributor(s) and not of MDPI and/or the editor(s). MDPI and/or the editor(s) disclaim responsibility for any injury to people or property resulting from any ideas, methods, instructions or products referred to in the content. |
© 2024 by the authors. Licensee MDPI, Basel, Switzerland. This article is an open access article distributed under the terms and conditions of the Creative Commons Attribution (CC BY) license (https://creativecommons.org/licenses/by/4.0/).
Share and Cite
MDPI and ACS Style
Pan, R.; Zhou, B.; Jiang, D. Mechanical Response and Stability Optimization of Shallow-Buried Tunnel Excavation Method Conversion Process Based on Numerical Investigation. Buildings 2024, 14, 1213. https://doi.org/10.3390/buildings14051213
AMA Style
Pan R, Zhou B, Jiang D. Mechanical Response and Stability Optimization of Shallow-Buried Tunnel Excavation Method Conversion Process Based on Numerical Investigation. Buildings. 2024; 14(5):1213. https://doi.org/10.3390/buildings14051213
Chicago/Turabian StylePan, Rui, Baoliang Zhou, and Dongju Jiang. 2024. "Mechanical Response and Stability Optimization of Shallow-Buried Tunnel Excavation Method Conversion Process Based on Numerical Investigation" Buildings 14, no. 5: 1213. https://doi.org/10.3390/buildings14051213
Note that from the first issue of 2016, this journal uses article numbers instead of page numbers. See further details here.