
Edge AI-Enabled Road Fixture Monitoring System

1
Department of Civil, Construction and Environmental Engineering, North Dakota State University, Fargo, ND 58108, USA
2
Department of Mechanical Engineering, North Dakota State University, Fargo, ND 58108, USA
*
Authors to whom correspondence should be addressed.
Buildings 2024, 14(5), 1220; https://doi.org/10.3390/buildings14051220
Submission received: 14 March 2024
/
Revised: 20 April 2024
/
Accepted: 23 April 2024
/
Published: 25 April 2024
(This article belongs to the Special Issue Advanced Technologies for Urban and Architectural Design)
Abstract
:Effective monitoring of road fixtures is essential for urban safety and functionality. However, traditional inspections are time-consuming, costly, and error prone, while current automated solutions struggle with high initial setup costs, limited flexibility preventing wide adaptation, and reliance on centralized processing that can delay response times. This study introduces an edge AI-based remote road fixture monitoring system which automatically and continuously updates the information of the road digital twin (DT). The main component is a small-sized edge device consisting of a camera, GPS, and IMU sensors designed to be installed in typical cars. The device captures images, detects the fixture, and estimates their location by employing deep learning and feature matching. This information is transmitted to a dedicated cloud server and represented on a user-friendly user interface. Experiments were conducted to test the system’s performance. The results showed that the device could successfully detect the fixture and estimate their global coordinates. Outputs were marked and shown on the road DT, proving the integrated and smooth operation of the whole system. The proposed Edge AI device demonstrated that it could significantly reduce the data size by 80–84% compared to traditional methods. With a satisfactory object detection accuracy of 65%, the system effectively identifies traffic poles, stop signs, and streetlights, integrating these findings into a digital twin for real-time monitoring. The proposed system improves road monitoring by cutting down on maintenance and emergency response times, increasing the ease of data use, and offering a foundation for an overview of urban road fixtures’ current state. However, the system’s reliance on the quality of data collected under varying environmental conditions suggests potential improvements for consistent performance across diverse scenarios.
1. Introduction
Ensuring the safety of individuals using major infrastructure networks and urban areas is of utmost importance from both social and economic perspectives [1]. In the context of road infrastructure, the term ‘road fixture’ includes various elements like traffic signs, traffic signal poles, markings, barriers, bollards, and streetlights placed within the road reserve. These fixtures serve the crucial purpose of providing information and ensuring the safety of road users. They offer vital guidance to drivers and pedestrians, alert them to potential dangers, and help regulate traffic flow. When a road fixture is absent, the risk of accidents and injuries on the road significantly rises [2]. Hence, achieving road safety requires continuous monitoring and management of road fixtures.
Traditionally, road fixture monitoring has been performed using manual inspections and periodic surveys. These inspections are carried out by accredited surveyors who physically evaluate the road networks. This method, although necessary, has been found to be time-consuming, expensive, and prone to human mistakes in addition to requiring a lot of effort [3]. The advent of automated data collection processes is an attempt to offer a more efficient and precise method of evaluating road elements [4]. Advancements in remote sensing technology and the Internet of Things (IoT) have led to a significant change in how road fixture monitoring is conducted in recent years. Researchers have investigated the possibility of using vehicles driven by road users, which have been provided with sensors, to constantly monitor transportation infrastructure systems. These methods utilize the ubiquitous nature and portability of regular vehicles to efficiently collect data about the current infrastructure. The use of smartphones and in-vehicle devices has expanded this capability, enabling the collection of data from moving cars through crowdsourcing [5,6]. They use accelerometers and gyroscopes to detect vibrations and movements, which are indicative of road surface anomalies such as potholes, cracks, and bumps [7]. GPS modules in smartphones provide geospatial data, linking detected anomalies to specific locations, facilitating precise mapping of road conditions. Additionally, smartphone cameras contribute to visual assessments, offering pictorial evidence and further details of the road anomalies [8]. These multi-modal data streams, when aggregated, provide a comprehensive view of road infrastructure health, enabling authorities to prioritize maintenance efforts and enhance road safety efficiency. These advancements have facilitated the development of a continuous flow of data, leading to a considerable enhancement in effectiveness and a reduction in expenses for local government agencies.
In addition, the implementation of digital twin (DT) technology in infrastructure management has resulted in a profound shift. DTs, defined as functional connections between complex physical systems and their high-fidelity digital replicas, have seen significant growth across several industries, including road infrastructure management [9]. These virtual replicas, continuously updated with multisource, multisensory, and multitemporal data, enable monitoring, simulation, forecasting of potential problems, and planning for maintenance throughout the lifecycle of infrastructure. In the context of road infrastructure and smart cities, DTs have become crucial, creating comprehensive virtual copies of entire road networks [10]. These representations include dynamic elements like traffic flow, environmental conditions, and real-time infrastructure updates, far beyond traditional static road object depictions. For example, DT technology has been employed to enhance the monitoring and control of transportation systems, offering a real-time, multilevel layer model method for synchronizing physical and virtual spaces [11]. Data from physical space sensors are shared with the virtual space via technologies like 5G and Wi-Fi, allowing cloud servers to provide end users with real-time data visualizations and information operations through digital models and mobile applications. Moreover, DTs have facilitated new approaches to road maintenance systems, where cloud point data acquired through mobile mapping systems are integrated into a GIS and BIM environment, showcasing the efficiency of volumetric auscultation in surface flatness and distortion inspection [12]. In another instance, DTs were proposed to support smart city initiatives by deploying a ‘Digital Twin Box’ on roads, which included a 360° camera and IoT devices connected to an onboard computer. This system constantly sends real-time data, including live streams, GPS location, and environmental measurements, to the edge/cloud for real-time road asset monitoring, which is crucial for enabling smart mobility and self-driving vehicles [13].
Despite advancements in automated road monitoring systems, several limitations hinder their effective implementation and widespread adoption. Existing approaches typically rely on processing data within centralized databases, leading to potential bottlenecks and scalability issues due to the massive volume of data generated. This centralized processing approach may result in delays and inefficiencies in data analysis and decision making. Moreover, existing approaches often rely on specialized and expensive equipment such as LiDAR, limiting their scalability and accessibility [12].
To address the limitations of current road monitoring systems, our study introduces an integrated edge AI-based system designed for efficient and continuous monitoring of road fixtures. This system utilizes cost-effective edge devices installed in personal vehicles, circumventing the need for costly specialized equipment like LiDAR and facilitating extensive deployment across numerous vehicles. The core of our approach is edge computing, which processes data proximate to its source, thereby enhancing system responsiveness and minimizing latency. This local processing capability not only streamlines data handling but also reduces dependence on centralized databases, which results in mitigating the typical bottlenecks and scalability concerns. Our framework employs deep learning algorithms to these edge devices for precise identification and categorization of road fixtures from the captured visuals. Additionally, it incorporates advanced localization techniques to swiftly and accurately determine the positions of detected road elements, leading to the creation of detailed DT models. These models serve as a dependable basis for decision making in infrastructure management. Integration with a cloud-based DT platform and utilization of the Google Maps API enables the formation of a central, constantly updated data repository, thereby promoting accessibility and collaborative engagement among infrastructure management stakeholders.
The remainder of the paper is organized into the following sections. The next section provides a review of the literature related to the topic. Section 3 describes the technical details of the framework being proposed. Experimental setup and results are presented in Section 4. Then, Section 5 discusses the practical implications of the approach, along with future research potentials. Finally, the research is concluded in Section 6.
2. Literature Review
2.1. Remote Road Monitoring
Traditional road fixture monitoring methods rely on manual inspections or periodic surveys. These inspections are performed by accredited surveyors by either walking or driving along the roadway. If defects are detected, they are assessed and, if possible, addressed. At the end of the inspection, all the information gathered needs to be inserted into the road authorities’ central database. The collected data consist of images, descriptions, and treatments of possible road or fixture defects [14]. Therefore, this process can be time-consuming, laborious, expensive, and prone to human error [15].
Automated data collection procedures have been presented to provide more accurate and faster information on roads. Some previous studies proposed to use of instrumented vehicles equipped with several sensors such as laser scanners, road profilers, accelerometers, image and video cameras, and positioning systems for this purpose [16,17,18,19,20]. However, despite the efficiency of these dedicated vehicles, they are usually equipped with expensive sensors, which means they cannot be used in a scalable manner due to the high cost. Most transportation authorities are not able to acquire them, whereas several others can afford only a few of them because of their extremely high purchase and operational costs [21]. For these reasons, their usage is restricted as a road assessment tool, which happens once a year and only on highways.
In recent years, there has been a growing interest in using remote sensing technologies for road fixture monitoring. To overcome the abovementioned issues, researchers have proposed utilizing road users’ vehicles, such as standard cars, equipped with sensors to monitor transportation infrastructure systems [22,23,24]. This process aims to provide a continuous data stream, increasing efficiency and reducing the cost to municipal departments. Owing to the high number and mobility of these vehicles, they can efficiently collect information about the population of the existing infrastructure. For example, ref. [23] presented a novel framework for transportation infrastructure monitoring using sensors in crowdsourced moving vehicles. They utilized a vibration sensor and gyroscope through a smartphone, along with a sports camera, to collect data. Their methodology involved large-scale data collection from smartphones in vehicles to detect bridge damage, employing a data-driven approach that included mel-frequency cepstral analysis (MFCA) for feature extraction and principal component analysis (PCA) for feature decorrelation. This approach allows for the assessment of bridge health by comparing feature distributions from different vehicles, mitigating operational effects like vehicle speed and weight. In a recent study, ref. [25] presented an improved framework for the instance-aware semantic segmentation of road fixtures using mobile laser scanning data. The experimental results demonstrated that their framework reliably assigned both semantic information and instance information for mobile laser scanning point clouds of road fixtures.
Overall, remote road monitoring brings several advantages. First, it is more efficient, as it can be done much faster than manual inspections. Second, remote monitoring is more accurate, as it is less prone to human error. Third, remote monitoring is more cost-effective, as it does not require the use of personnel or vehicles. There are also several challenges associated with remote road monitoring. The accuracy of remote monitoring systems depends on the quality of the data that are collected. The quality is evaluated based on criteria such as accuracy, resolution, and the frequency of data collection. Ensuring high-quality data involves calibrating sensors regularly, using advanced algorithms to filter out noise, and integrating data from multiple sources to validate and improve accuracy. Moreover, machine learning techniques can be employed to identify and correct anomalies in the data, enhancing their reliability for monitoring applications. Furthermore, remote monitoring systems can be expensive to implement and maintain. Last but not least, these systems can generate a large amount of data, which can be difficult to manage and analyze. Considering these benefits and challenges, recent advancements in digital technologies, such as the Internet of Things (IoT), edge computing, big data, and artificial intelligence, have drawn increasing attention to remote road monitoring and maintenance tasks [26]. Among them, smart dashboard cameras have become widespread due to their advanced capabilities in road monitoring and safety enhancement [27]. These smart dashboard cameras extend beyond conventional video recording functionality; they are integrated with intelligent systems that analyze visual data in real time. Equipped with high-resolution cameras and wide-angle lenses, they capture clear and comprehensive footage of the road ahead, ensuring clarity and detail. Furthermore, they often feature GPS integration for precise location tracking of incidents [28]. This GPS functionality enables accurate timestamping and geotagging of recorded footage, enhancing its reliability and usefulness for incident investigation and analysis. In terms of functionality, smart dashboard cameras can automatically detect unusual events, such as sudden stops, swerves, or collisions, using integrated sensors and artificial intelligence algorithms [29]. Continuously monitoring the road environment and analyzing the captured footage in real time, these smart dashboards can trigger specific actions such as saving the footage or generating alerts for the driver upon detecting an event of interest. Furthermore, they can contribute to big data analytics, providing valuable insights for traffic management and urban planning. Their ability to connect with other in-vehicle systems and external networks enables a more cohesive and interactive approach to road safety, facilitating immediate response actions during emergencies. For instance, ref. [30] introduced a new approach for detecting vehicle maneuvers using deep learning visual odometry models. The method used a camera mounted on the vehicle to capture images and then processed the images using a convolutional neural network (CNN). Another study by [31] proposed a framework based on dashcam images that detects pavement markings using deep learning applications, stores the information of detected pavement markings, and analyzes their condition. These studies highlight the potential benefits of using dashcam devices along with deep learning-based detection models for road monitoring and maintenance. These benefits include having large and expandable datasets, whole road coverage, and being relatively cheap and easy to install [29].
2.2. Digital Twin and Infrastructure Management
The introduction of DT technology has brought about a significant change in infrastructure management. A DT is a virtual model of a physical system, including its environment and processes, that is continuously updated by exchanging information through physical and virtual entities [32]. Recently, there has been a significant increase in interest in the digital transformation of engineering assets [33,34,35]. The DT industry is projected to grow significantly, with an expected increase from $3.1 billion in 2020 to $48.2 billion in 2026 [36]. This indicates that DTs are already exerting a big and noteworthy impact. The concept of DT is highly significant and has been applied for various purposes, such as monitoring, management, maintenance, optimization, and prediction in several industries, including agriculture [37], healthcare [38], sport and fitness [39], construction and smart cities [40,41], and bridge infrastructure monitoring [12].
Within the realm of road infrastructure and smart cities [42], DTs have become essential because of their significant role in facilitating the development of comprehensive virtual duplicates of whole road networks. These reproductions go beyond the static representations of road fixtures by capturing dynamic elements such as traffic patterns, environmental conditions, and real-time updates on infrastructure components. The utilization of DTs in road infrastructure has been extensive and significant, such as road automated mobile mapping [12], road health monitoring [43], and sustainable urban road design [44]. Ref. [13] suggested an operational implementation of the DT concept for highways by introducing the idea of a DT box. This box consists of a 360° camera and a collection of IoT sensors that are connected to a single onboard computer. Empirical tests were carried out to confirm the practicality of this method, with a main emphasis on the processes of detection and recognition. Ref. [45] developed a geometric model of transportation infrastructure using GIS to expedite the advancement of road transportation. They utilized data fusion techniques to calculate DT data at various levels. The resulting simulation reflects the physical and operational rules governing the transportation infrastructure.
A fundamental benefit of DTs in infrastructure management is their capacity to enable real-time monitoring. Ref. [46] introduced a DT system designed to gather and deliver real-time and precise traffic data as well as identify important places for driving actions and detecting changes in road conditions, such as damage or variations in friction. In their study, ref. [47] developed an extensive DT framework specifically for the monitoring and maintenance process in road and bridge construction, which consists of six distinct steps. Through integration into ‘Smart X Platforms’, they effectively consolidated 15 types of data about road and bridge management. Gathering and analyzing real-time information enables proactive decision making and the implementation of predictive maintenance procedures. In this regard, ref. [48] proposed a highway tunnel performance prediction model based on the DT concept and machine learning (ML) technology. This model highlights a data-driven management strategy for preventive maintenance. A DT-based decision support tool was presented by [49] to help road operators with the tasks of road inspection, maintenance, and improvement. Initially, the structure of the suggested tool was introduced, including the primary elements and capabilities. The system relies on a DT that replicates actual road assets to combine various data sources and facilitate the transformation of detailed data into comprehensive information. Subsequently, the road pavement data are incorporated into the decision tree and analyzed using machine learning clustering methods according to their situation and quality.
As suggested by [50], the integration of DTs into road infrastructure would significantly enhance monitoring and prediction accuracy, leading to more efficient decision making. A comprehensive approach to managing road infrastructure, informed by continuous real-time upgrading and data-informed decision making, could substantially improve road safety and maintenance planning. However, the seamless real-world integration of recent technological innovations, informed by continuous real-time upgrading and data-driven decision making, still suffers from several important issues, including the integration of multiple data sources, the need for real-time synchronization, and the management of huge datasets.
2.3. Current Gap and Research Objective and Contributions
Although remote road monitoring and DT technology have demonstrated promising outcomes, there are still significant gaps and obstacles that require attention in order to establish a more comprehensive and efficient road fixture monitoring system. Ref. [51] highlighted an important discrepancy between the optimistic outlook presented by DT and the actual technological capabilities in the field of transportation infrastructure. Several vital technical requirements remain unfulfilled. The collection and synchronization of accurate and continuous data across a vast network of road infrastructure and integration data from various sources, including IoT dashcams, DTs, and external databases, pose a challenge. Furthermore, it is crucial to ensure that the great amount of data generated by advanced monitoring systems with multimodal sensors is easily accessible and user-friendly. The development of an intuitive user interface that enables easy interpretation and interaction with the monitoring data is an area that requires focused attention.
A critical challenge also exists in finding the accurate location of road elements. Current systems often face challenges in accurately determining the exact position of identified objects with the level of precision required for dependable DT representations. This deficiency impedes effective decision making and timely response to infrastructure issues.
Considering these practical gaps, the primary objective of this research is to develop and validate an integrated system that tackles the challenges in current remote road fixture monitoring approaches. This innovative framework incorporates a road fixture DT, employs automated identification techniques, and features a user interface designed for remote monitoring. Rigorous practical testing underlines its effectiveness. The method relies on an edge AI device specifically designed for common personal road vehicles and cutting-edge deep learning algorithms to comprehensively analyze video footage or images of road fixtures. This analysis involves detection of the fixture category, determining the precise location, and the ability to assess the fixture condition. The framework also incorporates a road DT, which provides an up-to-date database of analyzed information for relevant authorities. This study contributes significantly to the field of road fixture monitoring and management by:
- Proposing a cost-effective and scalable solution for automated monitoring using readily available technology, including processing on edge devices to alleviate bottlenecks associated with centralized data processing;
- Overcoming limitations in accurate localization of road fixture elements;
- Developing a user-friendly interface for enhanced usability and interaction with monitoring data;
- Establishing a cloud-based DT platform for continuous data synchronization and accessibility.
By addressing these key challenges, the proposed system promises a transformative approach to automated road fixture monitoring, promoting enhanced infrastructure safety, efficiency, and cost effectiveness.
3. Methodology
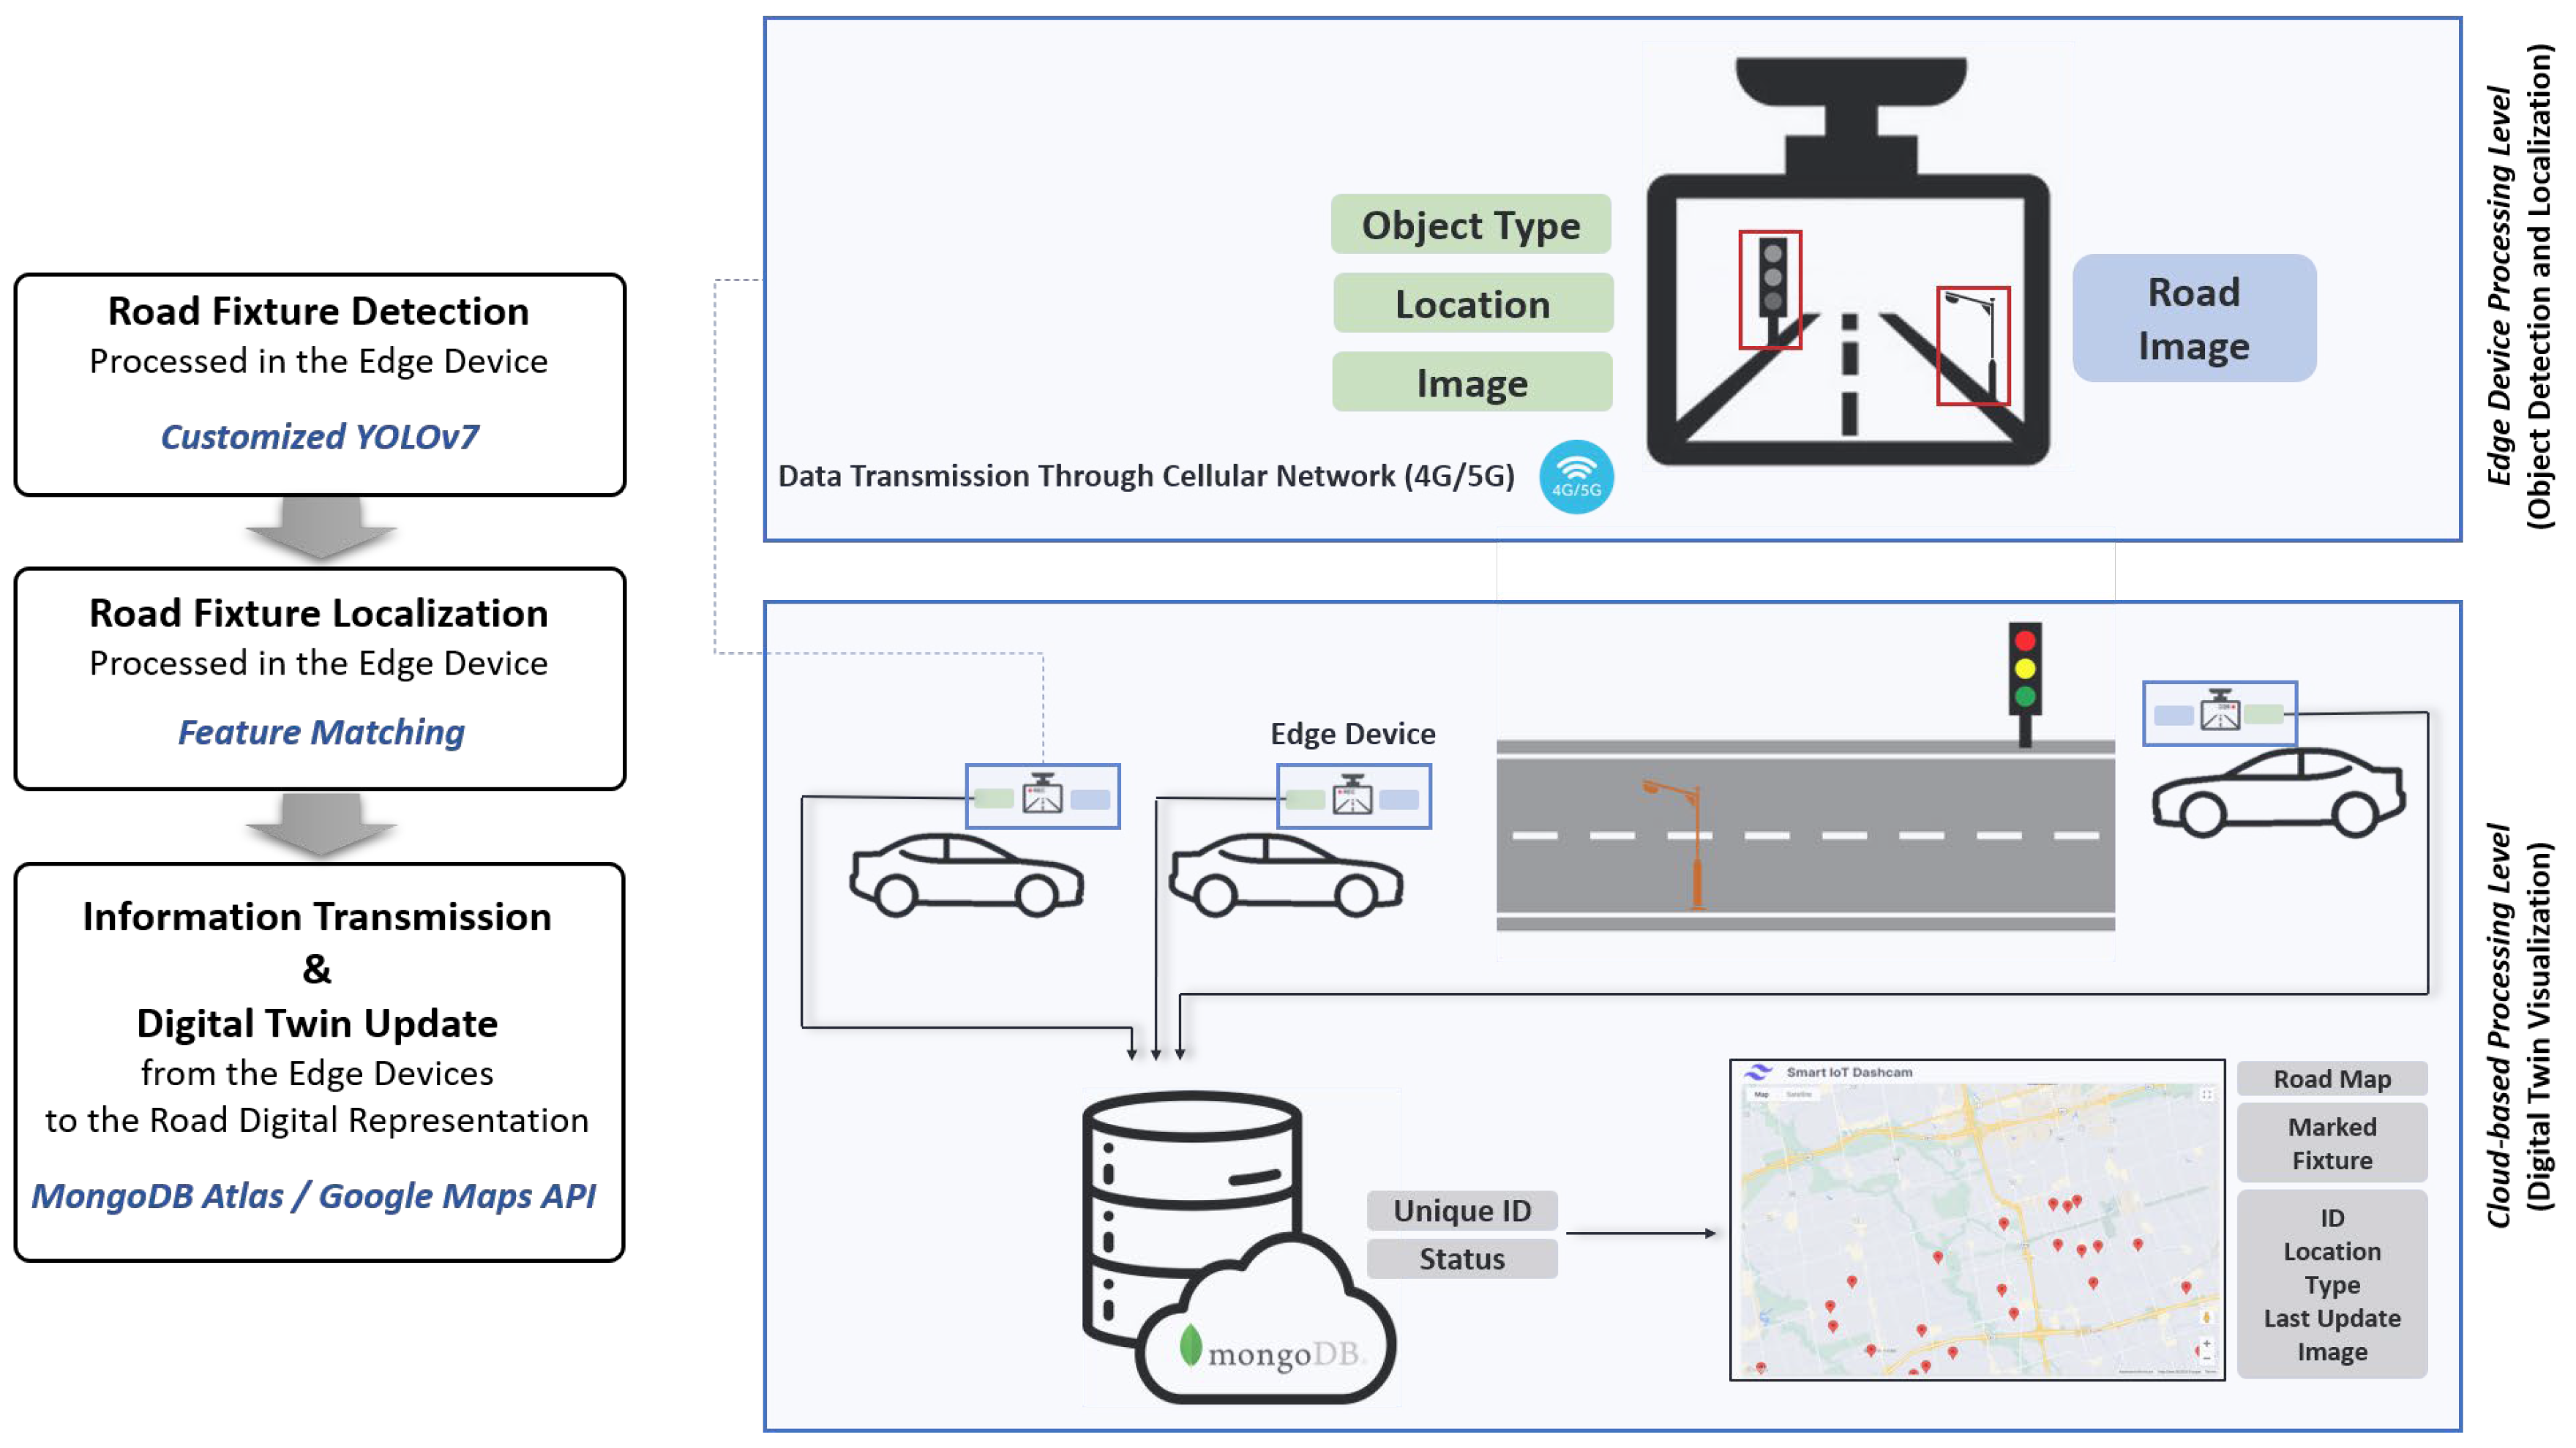
This study outlines a systematic framework for remote road fixture monitoring, as depicted in Figure 1. This system is intended to be comprehensive while remaining fast, accessible, and practical. The proposed system involves object detection, geospatial localization, and DT visualization. Notably, object detection and localization are performed on an edge device, a custom-built device equipped with multiple sensors. Utilizing advanced computer vision and deep learning techniques, the device achieves real-time identification of road fixture elements. Subsequently, built-in sensor data from cameras, GPS, and Inertial Measurement Units (IMUs) are integrated to localize detected objects within a global coordinate system. The extracted information is then transmitted to a cloud database to be stored in a structured and accessible manner. Eventually, the location of the fixture is marked on the road map, along with the corresponding information, including the object’s image, geographical location, and its temporal and assessment details.
3.1. Object Detection
In the first module of the proposed remote road fixture monitoring system, the use of a computer vision algorithm for the detection of road fixtures is the primary focus of attention. The YOLOv7 algorithm [15] was employed for object detection in this module. YOLOv7 represents the latest advancement in the YOLO (You Only Look Once) series of object detection algorithms, known for their efficiency in processing images in real-time scenarios [52]. The accuracy and detection speed of YOLOv7 have both significantly increased compared to previous YOLO models, particularly the widely used YOLOv5. These improvements are beneficial for the objective of the proposed system study, which substantially depended on fast and accurate detection. Additionally, this latest version is capable of image segmentation, a feature that can further be used in the condition assessment analysis of the detected road fixture.
For applications that require detection of objects outside these categories, the YOLO model would need to be further trained or fine-tuned on a dataset that includes the desired object types. This additional training would allow the model to learn and accurately detect new or specific objects. For this purpose, an image dataset consisting of approximately 900 images of three primary road fixture categories was collected from the web. Subsequently, these images were carefully annotated based on the objects, specifically road fixtures, using the Computer Vision Annotation Tool (CVAT). CVAT [53] is an open-source, web-based tool that facilitates the detailed annotation of images and videos for computer vision applications. Designed to support a wide range of annotation tasks, including bounding boxes, polygons, polylines, and points, CVAT enhances the efficiency of the annotation process with features such as automatic annotation using deep learning models and a user-friendly interface that simplifies the management of large datasets. The tool’s support of the YOLO format allows for direct use of annotated data in training object detection models. Furthermore, CVAT offers a user-friendly interface that simplifies the task of manual annotation while providing tools for team collaboration, which is essential for large-scale annotation projects. Using the dataset, the YOLOv7 model was customized for the objective of real-time road fixture detection as the planned output of this module.
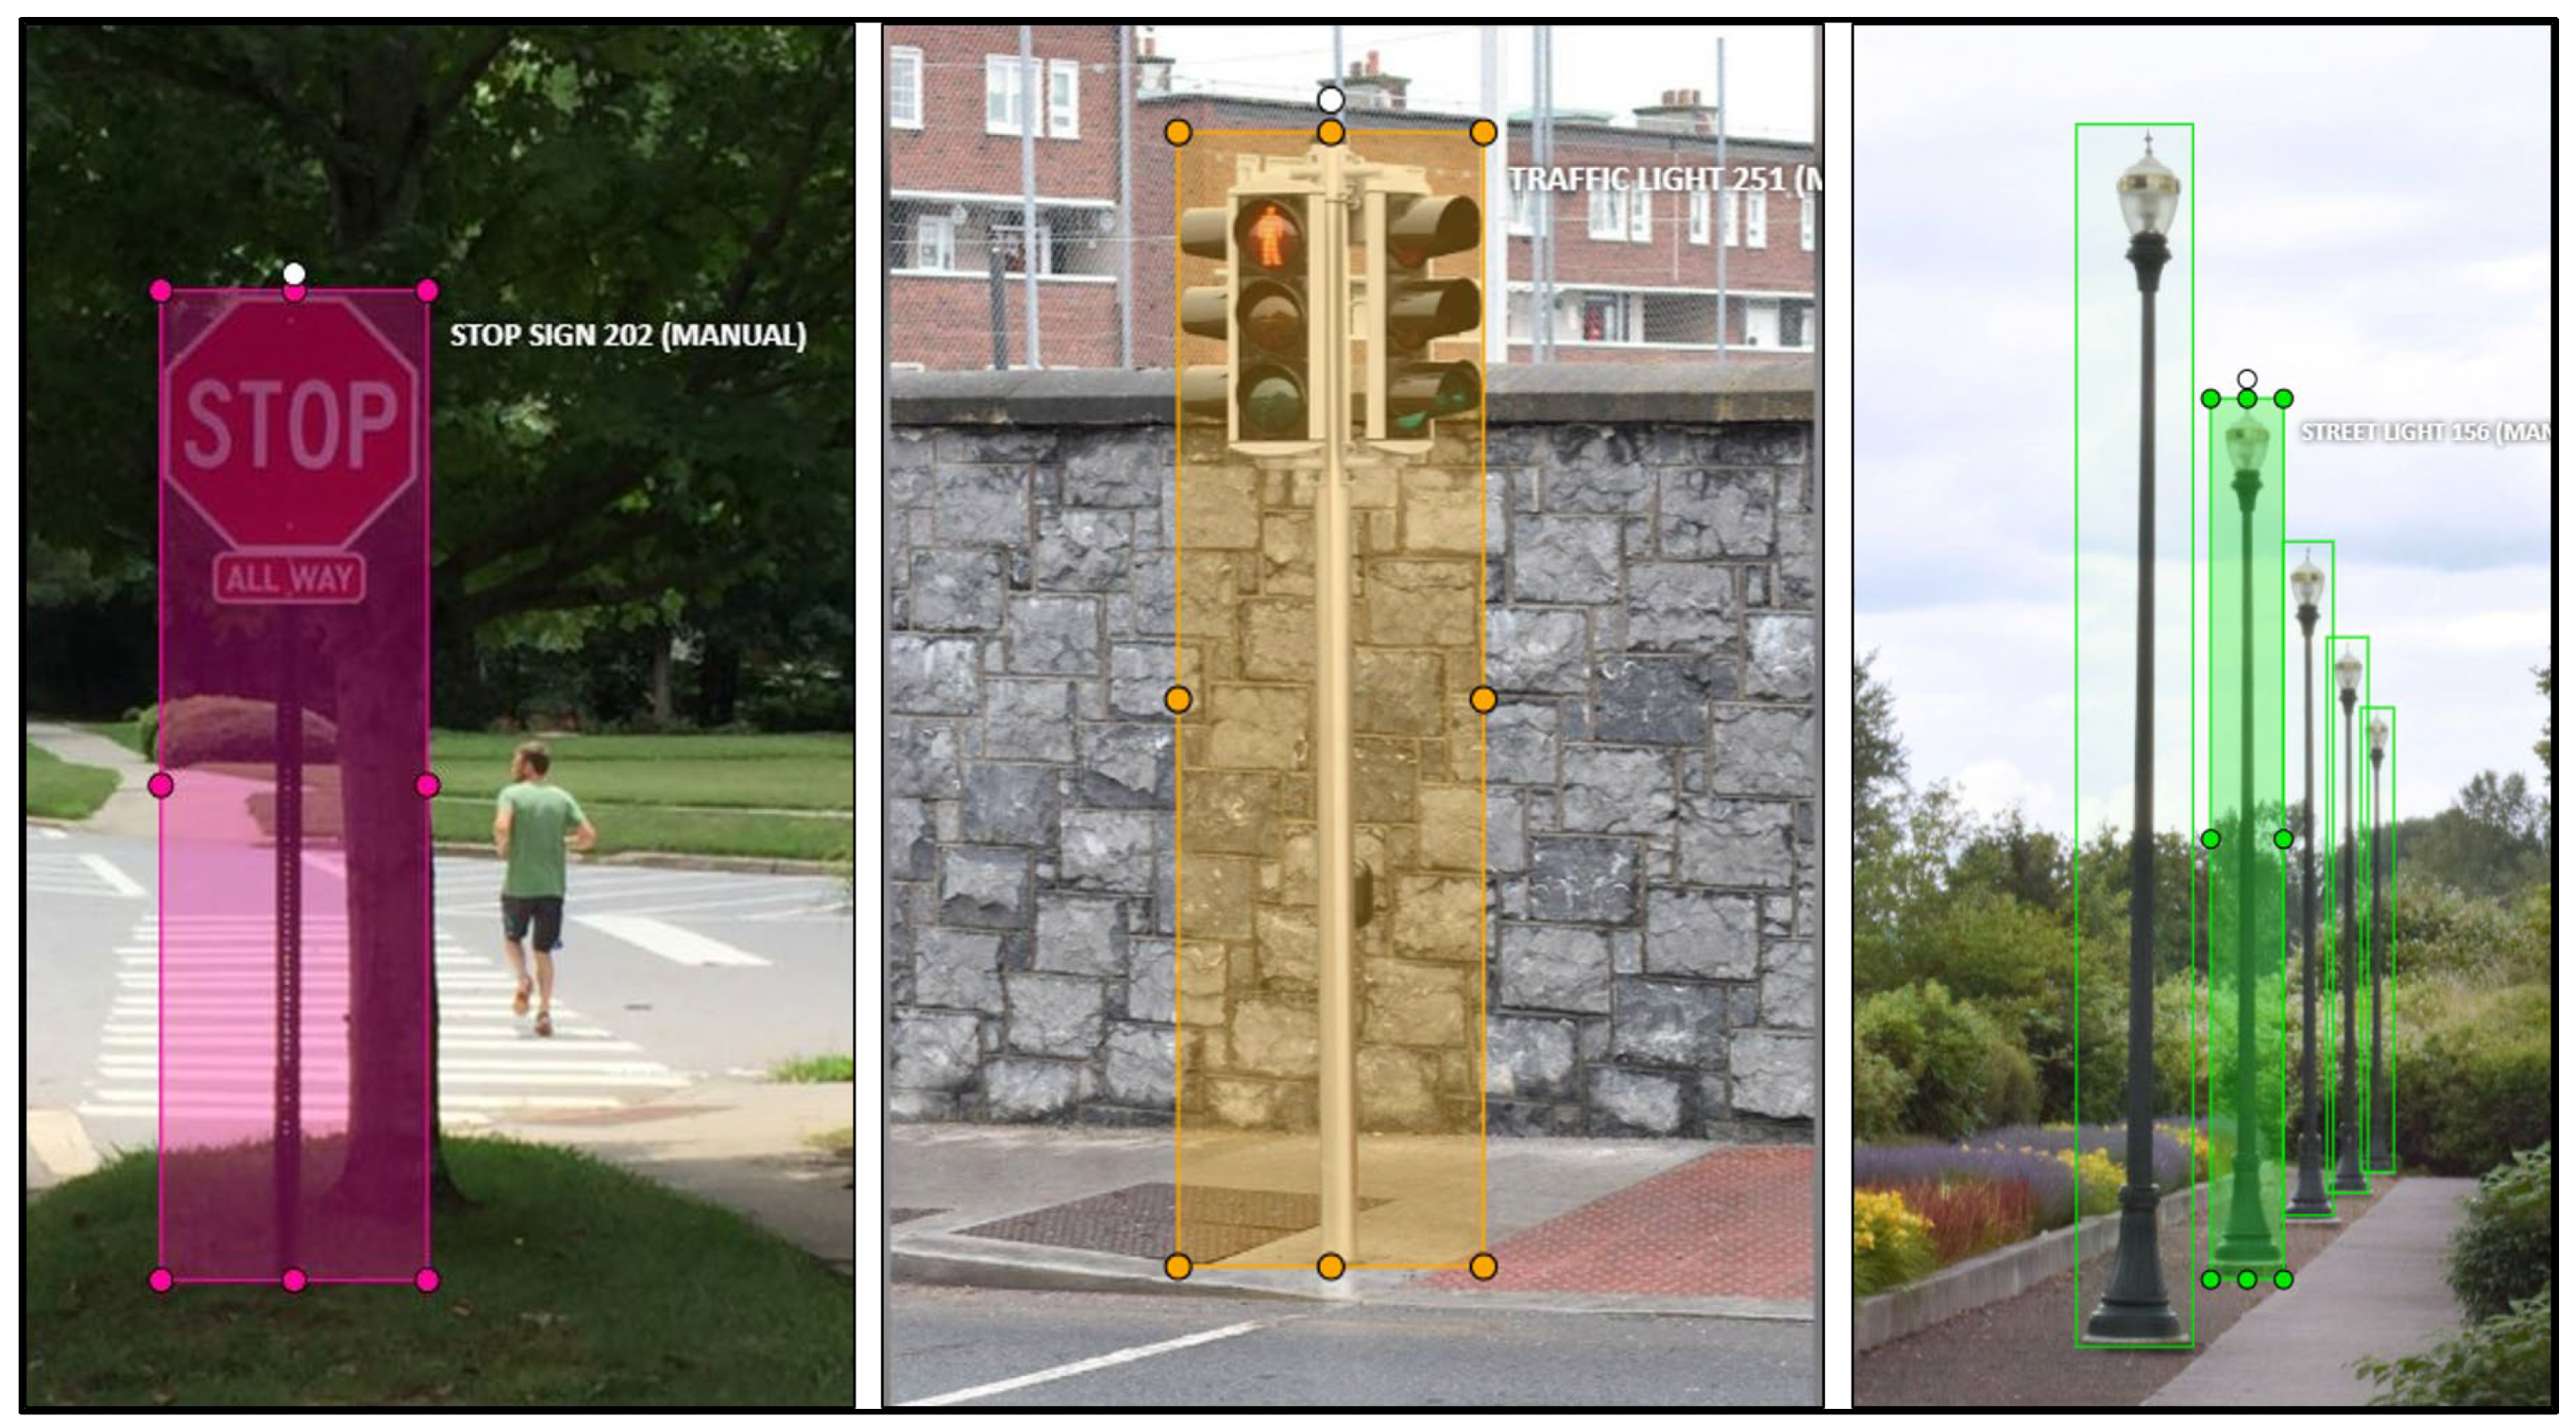
The dataset consists of approximately 900 images featuring three types of road fixtures—traffic lights, stop signs, and streetlights—sourced from various online platforms to ensure a diverse visual representation. Each image was carefully selected to reflect the range of conditions typically found in real-world scenarios. The dataset is structured into training, testing, and validation sets, comprising 80%, 10%, and 10% of the images, respectively. Accompanying each image is an annotation file that specifies the object’s class and bounding box coordinates, meticulously detailed to enhance model training and evaluation accuracy. Annotations were precisely crafted using CVAT to ensure accuracy and consistency across the dataset, facilitating effective model training and evaluation. To provide a clear understanding of the data used, examples of the annotated images are shown in Figure 2.
3.2. Geospatial Localization
This methodology integrates sensor data from cameras, GPS, and IMUs to achieve the localization of detected objects within a global coordinate system. Figure 3 illustrates the process of the detected object’s geospatial localization.
Initially, the images captured by the camera underwent object detection, resulting in pixel coordinates (), which are then translated into a vector using intrinsic camera parameters, such as the dimensions of the camera frame width in pixels (), camera frame height in pixels (), the angle between the device level (parallel to the ground) and the camera in degrees, and the horizontal (hfov) and vertical (vfov) angles of the field of view. The angle between the camera and the car’s level was set vertically aligned with the vehicle’s frontal direction to ensure optimal field of view and image quality. This positioning was determined through preliminary tests that evaluated the camera’s ability to capture clear and comprehensive views of the road fixture. The horizontal positioning provided a balanced perspective, minimizing perspective distortion while maximizing the coverage area. Distance to center frame was calculated (Equation (1)). The detected objects’ pixel locations from multiple images were merged to refine their calculated locations. This improved the accuracy of the vectors representing the lateral displacement (Equation (2)) and vertical displacement (Equation (3)) of the detected target from the center of the camera frame. From here, () were obtained by fusing data from the IMU and GPS across multiple images, refining the estimation of the target’s coordinates. Subsequently, the global vector was converted into GPS coordinates through Williams’ aviation formula, also known as the flat earth approximation, which provides a simplified approach for converting local Cartesian coordinates (X, Y) to latitude and longitude offsets (∆Lat, ∆Lon) (Equations (4) and (5)) on the Earth’s surface. This formula assumes a flat Earth within the region of interest. The latitude offset (∆Lat) indicates the north–south displacement and is calculated by dividing the vertical distance (Y component of the vector) by the Earth’s radius R (approximately 6378 km). The longitude offset (∆Lon) denotes the east–west displacement and is computed by dividing the horizontal distance (X component of the vector) by the Earth’s radius multiplied by the cosine of the reference latitude. These offsets are then added to the current GPS coordinates ( to determine the target object’s GPS coordinates (Equations (6) and (7)). The mathematical equations are as follows:
In cases where GPS data are temporarily unavailable for a device, which may occur in environments with obstructed signals, such as urban canyons, tunnels, or areas with dense foliage, the proposed system estimates the trajectory based on the last known GPS coordinates and the motion detected through the IMU sensors. It allows for a continuous update of the road fixture’s position, ensuring minimal disruption to the monitoring system’s performance despite the temporary loss of GPS data. When GPS data become available later, it resumes using both GPS and IMU data to establish a global reference frame, facilitating the transformation of the initially obtained local coordinates into accurate global coordinates. This process involves aligning the local and global coordinate systems through translation and rotation transformations based on known camera positions.
3.3. Digital Twin Platform
The main objective of this research is to present a DT of road infrastructure containing specific information about its fixture. To do so, a cloud-based database has been developed. This cloud database is connected to the Google Maps API [54], enabling continuous synchronization and data transfer. At predefined time intervals, the cloud database transmits the newly collected data to the Google Maps API, which subsequently updates the user interface.
The data collection and integration aspect of this process is central to the proposed system functionality. As mentioned in previous sections, edge devices play a critical role by detecting road fixtures, capturing their category information, images, estimated geo-locations, and timestamps. These data, gathered from multiple devices deployed across road networks, constitute the primary source of information for the DT platform. A router is used to transmit the collected data over cellular networks to the cloud-based analysis platform. For each newly detected object, the system creates a dedicated folder within the DT platform. These folders serve as repositories for essential information, including the object’s location, category, date, time of the last update, and the updated image. This organized structure ensures that data related to each object are readily accessible and can be retrieved efficiently.
One significant challenge in developing the proposed system is the prevention of information duplication for individual objects. Variability in sensor data and image capture can lead to discrepancies in location estimates, potentially resulting in the creation of multiple records for the same object. To streamline data integration and mitigate redundancy, our system preliminarily employs a zone-based categorization approach. In this method, objects are categorized based on their geographical proximity within predefined zones. A proximity threshold is established, allowing the system to identify objects within close proximity to each other. If a newly detected object falls within the threshold distance of an existing object of the same category, it is considered the same object, and the existing object’s data are updated accordingly. Conversely, if the object falls outside the threshold, it is treated as a new object, and a unique identifier is created for it. However, this mechanism is a preliminary step to handle data duplication, and a more sophisticated approach needs to be developed in future updates to accurately differentiate between unique and repetitive detections in dense urban environments. The data storage process is presented in Figure 4.
In this process, the zoning method further enhances computational efficiency. As the database accumulates a significant number of objects, conducting direct comparisons between all objects becomes resource intensive. To address this challenge, the zoning method divides the database into zones corresponding to geographical regions. When processing new objects, the algorithm focuses exclusively on the zone relevant to the object’s location, reducing the computational burden and optimizing system performance.
The user interface (UI) of the DT platform is crucial to making monitoring data accessible and user friendly. In this study, the UI is designed to comprise object markers on a map, with detailed information available on the left side. Users can access comprehensive information about road fixture objects by clicking on the corresponding markers. Furthermore, the images stored in the cloud database hold the potential for implementing image processing techniques to assess the condition of road fixture objects. This additional layer of analysis enhances the platform’s capability to monitor and manage road infrastructure effectively. This feature enables users to assess the condition of the road infrastructure quickly and efficiently, which is important for making informed decisions regarding maintenance and repair efforts.
4. System Evaluation and Results
4.1. Experimental Setup
This experiment assesses the applicability of the proposed framework in real-world scenarios, with primary objectives aimed at evaluating the edge device’s ability to detect various road fixture, specifically traffic poles, stop signs, and streetlights, and determining their locations while also reducing the data size sent to the central database. The detailed procedure involved the design of the device, training an object detection model with a custom dataset, and implementing a localization model for detected objects. The edge device, specifically designed for this project, comprises an onboard computer, a camera, an SD card, GPS, and IMU sensors, as shown in Figure 5. Raspberry Pi 4 (Raspberry Pi Ltd., Cambridge, UK) was used as the onboard computer. The Raspberry Pi camera module v2 via CSI (Camera Serial Interface) as the camera module, SAM-M10Q via USB as the GPS module, and BNO055 via SPI as the IMU module were used in this research, with a 4 GB micro-SD card as the primary storage for the OS, machine learning models, images, videos, and sensor data logs for analysis. The device equipped with advanced computing capabilities allows the preliminary analysis of data on site, i.e., within the vehicle itself. The code for this was written in the Python language, with development tools and libraries essential for deep learning, such as TensorFlow and OpenCV. The corresponding pseudocode is shown in Algorithm 1.
| Algorithm 1. ObjectGPSCoordinates (N, M, C, G, I) |
| Parameters: N: Total number of iterations M: Number of frames to process within each iteration C: Set of parameters for camera initialization (frame width and height, horizontal and vertical FOV) G: Data structure for real-time GPS data I: Data structure for real-time IMU data |
| 1: Initialize_Camera(C) // Setup camera with given parameters 2: Initialize_GPS(G) // Establish connection to GPS for real-time data 3: Initialize_IMU(I) // Setup IMU for orientation and movement data 4: n ← 0 5: while n < N do 6: for i = 1 to M do 7: frame[i] ← Capture_Image_From_Camera() 8: // Detect objects within the captured frame 9: detected_objects[i] ← Detect_Road_Fixture(frame[i]) 10: j ← 0 11: while j < length(detected_objects[i]) do 12: object ← detected_objects[i][j] 13: // Extract pixel coordinates of the detected object 14: coordinates ← Get_Pixel_Coordinates(object) 15: // Convert pixel coordinates to global geographical coordinates 16: global_position ← Convert_To_Global_Coordinates(coordinates, GPS, IMU) 17: // Transmit detected object information to the cloud 18: Transmit_To_Cloud(global_position, frame[i]) 19: Return global_position # Return the GPS coordinates of the detected object 20: j ← j + 1 21: end while 22: end for 23: n ← n + 1 24: end while 25: Return object’s GPS coordinates |
A field test was conducted near the NDSU campus in Fargo, USA, in a region with diverse road fixtures to evaluate the effectiveness of our proposed Edge AI device compared to the conventional. These experiments demonstrate the reduction in data size using the Edge AI device as compared to the conventional approach that transmits all images without any object detection or location estimation. GPS, IMU, and image data were collected for 5 min in five locations for both the proposed method and the conventional method, and it was repeated five times. The car was driven at 60 km/h on average, and the device was installed on the dashboard of the vehicle near the windshield to maintain a strong signal connection with GPS satellites without obstructing the driver’s field of view or interfering with the vehicle’s operating controls.
In our proposed approach, the detection and localization models ran inside the proposed edge device, and only the images where road fixture was detected were sent to the central data station along with their respective locations, while all captured images were sent to the central station in the conventional approach. In the conventional approach, each image was captured every two seconds to balance comprehensive spatial coverage of road fixtures, given typical urban vehicle speeds, with the computational and storage capacities of the edge device. The images were stored in JPEG format with an average size of 3 MB, and approximately 150 images were captured each time. The collected data were sent to the central data station through a cellular network router.
4.2. Evaluation and Results
The experiments demonstrated significant data reduction using our proposed Edge AI device compared to the conventional approach. With the conventional method, the system captured approximately 30 images within a 1 km distance and sent all the images to the central station without detecting road fixtures or locations. Over 5 min, it captured about 150 images along with GPS and IMU data. The total size of the data generated each time ranged from 409 to 478 MB.
In contrast, our proposed approach sent significantly fewer images under the same conditions—approximately 2 to 5 images within the same 1 km distance and between 22 to 28 images over 5 min. The number of images depended on several parameters, including the speed of the vehicle, the density of road fixtures, and the camera’s predefined sampling rate. In areas with more complex scenes or dense road fixtures, the system might send more images to ensure comprehensive coverage. The processing time for each image, influenced by the scene’s complexity, the number and type of road fixtures, and the image’s data size, ranged from 12 to 25 s. The total size of the data generated ranged from 51 to 96 MB each time. A comparison between the two approaches for each location, based on data collected over 5 min, is presented in Table 1, indicating a significant decrease in data size with the proposed method.
During the field test, the device achieved an aggregate accuracy of 65% in identifying road fixtures, along with a recall rate of 78% and a precision rate of 72%. This denotes that the trained object detection algorithm accurately recognized 65% of all existing road fixtures, with a recall rate of 78%, signifying the proportion of correctly identified road fixture relative to the actual total. The precision rate of 72% further illustrates the ratio of correctly identified road fixtures to the entirety of detected fixtures. The accuracy varied depending on the type of fixture, with traffic poles achieving the highest accuracy and streetlights the lowest. The operational speed of the monitoring vehicle was identified as a factor that can influence the accuracy of the object detection system. High vehicle speeds can introduce motion blur into the captured images, potentially affecting the clarity needed for optimal object detection. While the system, utilizing the YOLOv7 algorithm, is engineered to accommodate various image quality challenges, including motion blur, preliminary observations suggest a correlation between increased vehicle speed and a decrease in detection performance. Though YOLOv7 is known for its efficiency processing images, making it suitable for edge computing scenarios, its computational cost is influenced by several factors, including the image resolution, the complexity of the neural network model, and the hardware specifications of the edge device. Figure 6 shows the identification of a traffic pole, stop sign, and streetlight from various viewpoints by the proposed model.
Despite the overall success of the experiment, certain challenges were encountered during the field test, and potential limitations should be considered. Additionally, the accuracy of the detected objects’ location was verified by comparing them to ground truth data obtained through manual inspections of the same locations. The location errors for traffic poles and stop signs were calculated and are presented in Table 2, revealing a 4.3 to 4.5 m error for traffic poles, a 4.6 to 5.7 m error for stop signs, and a 5.3 to 6.5 m error for streetlights. These errors serve as indicators of precision and reliability in real-world scenarios.
To develop the road digital twin platform, we designed a web application capable of receiving, processing, and storing data from devices deployed in the field. Hosted on Vercel, our application benefits from the platform’s ease of deployment and scalability, essential for managing the data-intensive nature of our system. The GPS coordinates of detected objects, along with their categories and image data, were computed on the edge device and sent directly to our server in JSON format. The web application’s back end, which handles data processing and storage, utilizes MongoDB Atlas [55], a fully managed cloud database offering the flexibility of a NoSQL database. Communication between the field devices and our web application is managed through a REST API, enabling the transmission of collected data in JSON format. Upon a receive request from device, the data undergo processing and are stored in the MongoDB Atlas, with each new entry assigned a unique ID.
To improve user experience, especially in real-time data visualization, we integrated Pusher into our platform. Pusher, a real-time communication service, allows for the live updating of the UI, ensuring that the displayed data are current and dynamic. Additionally, the web application integrates MongoDB Atlas with the Google Maps API through the user interface to dynamically display spatial data on the map. This process involves retrieving the latest spatial data from the database and formatting them as needed to ensure compatibility with the Google Maps API before rendering them on the map interface within our UI. The final representation of these fixtures on the map is presented in Figure 7. The screenshots were taken directly from the URL dedicated to our project and connected to the database server, which receives data in real time.
5. Discussion
The proposed system for remote road fixture monitoring, leveraging edge devices and DTs, carries significant practical implications for both current and future road infrastructure management. These implications extend beyond the immediate system implementation and address broader aspects of transportation and urban planning.
One of the key practical implications of this system is its ability to facilitate data collection and storage. By efficiently capturing details about road fixtures, including geolocation and category information, through the utilization of cost-effective devices that can be readily installed on vehicles traveling road networks, the system simplifies the process of maintaining an up-to-date digital replica of road infrastructure. These data streamline inventory management and serve as a valuable resource for transportation authorities. Moreover, this data-capturing capability is not limited only to road fixtures; it can be extended to encompass a wide range of other objects.
Beyond the current application, the proposed system offers scalability and adaptability due to its modular design. Its architecture allows for easy integration with other edge devices and sensors, such as weather monitoring systems or traffic management tools. This adaptability makes it suitable for a variety of transportation applications, including urban road planning, highway management, and even public transit systems. On the other hand, the cloud-based structured storage of data serves as a robust foundation for advanced analysis. Specifically, employing rigorous deep learning and image processing techniques on the fixture images can enable real-time assessment of their conditions and monitoring of changes over time. This not only aids in more proactive maintenance but also improves overall safety by identifying potential hazards promptly. These practical advantages result in cost savings and a significant reduction in road downtime due to maintenance activities, which benefits both road users and responsible authorities.
The system’s ability to collect, analyze, and present data in an accessible manner empowers decision makers. Transportation authorities and urban planners can utilize these data to make informed decisions about road design, fixture maintenance, and infrastructure expansion. Moreover, while the current application may primarily cater to expert users in road fixture monitoring and inventory, the system’s intuitive user interface ensures that the data presented can be readily interpreted, even by those without specialized expertise. This user friendliness ensures that the system’s insights are accessible to a wide range of professionals, further augmenting its practical utility in the field of road infrastructure management and beyond.
While the proposed remote road fixture monitoring system demonstrates significant potential for improving efficiency and accuracy, it is imperative to recognize its limitations to guide future enhancements. The system’s performance heavily relies on the continuous and high-quality data stream from dashcam-like devices. Fluctuations in data quality, due to factors such as device malfunctions or environmental interferences, can impair the accuracy of data processing, object detection, and localization, subsequently affecting the reliability of digital twin updates and visualizations. Additionally, while utilizing cost-effective edge devices offers an economical solution, maintaining and managing a large-scale device network could impose considerable infrastructural and computational demands. The method’s reliance on sensor fusion for enhancing geospatial localization accuracy might still be susceptible to inaccuracies due to camera angle discrepancies, sensor limitations, and varying environmental conditions. Moreover, the extensive collection and sharing of image data within the system necessitates robust measures for ensuring data security and user privacy, requiring effective encryption and data anonymization protocols to mitigate potential risks. Also, the financial implications of broad deployment, alongside the reliance on external APIs like Google Maps for visualization, present additional operational and economic considerations. Finally, while the current implementation of the system employs YOLOv7 for object detection, we acknowledge its limitations, particularly in detecting small objects with high accuracy. Although YOLOv7 offers balanced performance in terms of speed and accuracy, cutting-edge developments in object detection algorithms, such as YOLOv8 and YOLOv9, promise improvements in universality, generalization ability, and computational efficiency.
Looking forward, future research should focus on developing advanced algorithms for data filtration and analysis to enhance the system’s resilience against inconsistencies in data. Potential variations in the camera’s angle due to vehicular dynamics in more diverse driving conditions should be accounted for, and advanced stabilization mechanisms and adaptive orientation correction algorithms should be explored to maintain the camera’s optimal angle under a broader range of operating conditions. Strategies for data storage in scenarios of internet inaccessibility will ensure continuous system updates. On the other hand, investigating more sophisticated AI models, multimodal sensor fusion incorporating GPS, gyroscopes, and accelerometers, as well as regular calibration of sensors, could significantly improve road fixture detection and categorization accuracy, particularly in complex environments. Moreover, exploring alternative deep learning architectures optimized for resource-constrained devices can further enhance detection accuracy and computational efficiency on edge devices. Lastly, the integration of additional internet-connected devices, such as environmental sensors, could expand the system’s capabilities, providing a more comprehensive infrastructure monitoring solution. Through the use of different sensors as well as advanced image processing algorithms for condition evaluation, the system could generate richer, more detailed DT. Future research should focus on this integration to leverage the full potential of the system, enabling a wider range of data collection and an enhanced representation of infrastructure conditions.
6. Conclusions
This study presents a comprehensive solution for remote monitoring and management of road fixtures within urban environments. Our research attempts to overcome the limitations of existing monitoring systems. The development of an edge device, designed specifically for the purpose of this research and comprised of camera and location sensors, was the first step. This device is designed for data collection and analysis through a vast network of personal cars on roads, eliminating the need for complicated and equipment-installed inspection vehicles. By leveraging recent deep learning algorithms and edge computing capabilities, our solution achieves real-time processing of data directly on the device, enhancing efficiency and scalability while minimizing reliance on centralized databases. We used a feature matching technique to accurately localize the fixture on the images captured by the device. Furthermore, the integration of a cloud-based road DT platform facilitates continuous synchronization and accessibility of monitoring data, which enables informed decision making and subsequent timely intervention implementation. The user-friendly interface enhances usability and interaction with monitoring data, bridging the gap between sophisticated technology and practical utility for transportation authorities and infrastructure managers. Our system has proven its ability to accurately identify, categorize, and locate road fixture elements through a thorough testing and validation approach in a real-world scenario.
Overall, this research contributes significantly to the field of road fixture monitoring and management by introducing an automated system that is continuously updated with new information related to fixture categories, conditions, and precise locations. This approach eliminates the need for expensive specialized equipment and expert involvement. Moreover, the user interface plays a vital role in connecting advanced technology with practical usability for transportation authorities and infrastructure management. Acknowledging the limitations presented in Section 5, future research endeavors should focus on enhancing data analysis algorithms, incorporating other sensors in the edge device while improving sensor fusion techniques, considering challenges of low-quality images due to weather or lighting conditions, and developing a temporary storage solution for situations in which connection is lost. By concentrating on these areas, we can improve the system’s capabilities, leading to a more thorough and efficient road fixture monitoring solution.
Author Contributions
Conceptualization, Y.J. and I.J.; methodology, M.Y.H. and I.S.D.; writing—original draft preparation, M.Y.H. and I.S.D.; writing—review and editing, Y.J. and I.J.; supervision, Y.J. and I.J. All authors have read and agreed to the published version of the manuscript.
Funding
This work was supported by the National Science Foundation under Grant OIA-2218046.
Data Availability Statement
The data presented in this study are available on request from the corresponding author.
Conflicts of Interest
The authors declare no conflicts of interest.
References
- D’Aranno, P.; Di Benedetto, A.; Fiani, M.; Marsella, M. Remote Sensing Technologies for Linear Infrastructure Monitoring. Int. Arch. Photogramm. Remote Sens. Spat. Inf. Sci. 2019, 42, 461–468. [Google Scholar] [CrossRef]
- Li, F.; Elberink, S.O.; Vosselman, G. Pole-Like Road Furniture Detection and Decomposition in Mobile Laser Scanning Data Based on Spatial Relations. Remote Sens. 2018, 10, 531. [Google Scholar] [CrossRef]
- Seraj, F.; Meratnia, N.; Havinga, P.J.M. RoVi: Continuous transport infrastructure monitoring framework for preventive maintenance. In Proceedings of the 2017 IEEE International Conference on Pervasive Computing and Communications, PerCom 2017, Big Island, HI, USA, 13–17 March 2017; pp. 217–226. [Google Scholar] [CrossRef]
- Finogeev, A.; Finogeev, A.; Fionova, L.; Lyapin, A.; Lychagin, K.A. Intelligent monitoring system for smart road environment. J. Ind. Inf. Integr. 2019, 15, 15–20. [Google Scholar] [CrossRef]
- El-Wakeel, A.S.; Li, J.; Noureldin, A.; Hassanein, H.S.; Zorba, N. Towards a Practical Crowdsensing System for Road Surface Conditions Monitoring. IEEE Internet Things J. 2018, 5, 4672–4685. [Google Scholar] [CrossRef]
- Jabbar, R.; Shinoy, M.; Kharbeche, M.; Al-Khalifa, K.; Krichen, M.; Barkaoui, K. Urban Traffic Monitoring and Modeling System: An IoT Solution for Enhancing Road Safety. In Proceedings of the 2019 International Conference on Internet of Things, Embedded Systems and Communications, IINTEC 2019—Proceedings, Tunis, Tunisia, 20–22 December 2019; pp. 13–18. [Google Scholar] [CrossRef]
- Sattar, S.; Li, S.; Chapman, M. Road Surface Monitoring Using Smartphone Sensors: A Review. Sensors 2018, 18, 3845. [Google Scholar] [CrossRef] [PubMed]
- Zang, K.; Shen, J.; Huang, H.; Wan, M.; Shi, J. Assessing and Mapping of Road Surface Roughness based on GPS and Accelerometer Sensors on Bicycle-Mounted Smartphones. Sensors 2018, 18, 914. [Google Scholar] [CrossRef] [PubMed]
- Opoku, D.G.J.; Perera, S.; Osei-Kyei, R.; Rashidi, M. Digital twin application in the construction industry: A literature review. J. Build. Eng. 2021, 40, 102726. [Google Scholar] [CrossRef]
- Lu, Q.; Parlikad, A.K.; Woodall, P.; Don Ranasinghe, G.; Xie, X.; Liang, Z.; Konstantinou, E.; Heaton, J.; Schooling, J. Developing a Digital Twin at Building and City Levels: Case Study of West Cambridge Campus. J. Manag. Eng. 2020, 36, 05020004. [Google Scholar] [CrossRef]
- Niaz, A.; Khan, S.; Niaz, F.; Shoukat, M.U.; Niaz, I.; Yanbing, J. Smart City IoT Application for Road Infrastructure Safety and Monitoring by Using Digital Twin. In Proceedings of the 2022 International Conference on IT and Industrial Technologies, ICIT 2022, Shanghai, China, 22–25 August 2022. [Google Scholar] [CrossRef]
- Sofia, H.; Anas, E.; Faiz, O. Mobile mapping, machine learning and digital twin for road infrastructure monitoring and maintenance: Case study of mohammed VI bridge in Morocco. In Proceedings of the 2020 IEEE International Conference of Moroccan Geomatics, MORGEO 2020, Casablanca, Morocco, 11–13 May 2020. [Google Scholar] [CrossRef]
- El Marai, O.; Taleb, T.; Song, J. Roads Infrastructure Digital Twin: A Step Toward Smarter Cities Realization. IEEE Netw. 2021, 35, 136–143. [Google Scholar] [CrossRef]
- Radopoulou, S.C.; Brilakis, I. Improving Road Asset Condition Monitoring. Transp. Res. Procedia 2016, 14, 3004–3012. [Google Scholar] [CrossRef]
- Wang, C.Y.; Bochkovskiy, A.; Liao, H.Y.M. YOLOv7: Trainable bag-of-freebies sets new state-of-the-art for real-time object detectors. In Proceedings of the IEEE/CVF Conference on Computer Vision and Pattern Recognition, Vancouver, BC, Canada, 17–24 June 2023; pp. 7464–7475. [Google Scholar]
- Zalama, E.; Gómez-García-Bermejo, J.; Medina, R.; Llamas, J. Road Crack Detection Using Visual Features Extracted by Gabor Filters. Comput.-Aided Civil Infrastruct. Eng. 2014, 29, 342–358. [Google Scholar] [CrossRef]
- Schnebele, E.; Tanyu, B.F.; Cervone, G.; Waters, N. Review of remote sensing methodologies for pavement management and assessment. Eur. Transp. Res. Rev. 2015, 7, 7. [Google Scholar] [CrossRef]
- Wang, J.; Lindenbergh, R.; Menenti, M. SigVox—A 3D feature matching algorithm for automatic street object recognition in mobile laser scanning point clouds. ISPRS J. Photogramm. Remote Sens. 2017, 128, 111–129. [Google Scholar] [CrossRef]
- Ravi, R.; Bullock, D.; Habib, A. Pavement distress and debris detection using a mobile mapping system with 2d profiler lidar. Transp. Res. Rec. 2021, 2675, 428–438. [Google Scholar] [CrossRef]
- Li, F.; Lehtomäki, M.; Elberink, S.O.; Vosselman, G.; Kukko, A.; Puttonen, E.; Chen, Y.; Hyyppä, J. Semantic segmentation of road furniture in mobile laser scanning data. ISPRS J. Photogramm. Remote Sens. 2019, 154, 98–113. [Google Scholar] [CrossRef]
- Hadjidemetriou, G.M.; Vela, P.A.; Christodoulou, S.E. Automated Pavement Patch Detection and Quantification Using Support Vector Machines. J. Comput. Civil Eng. 2018, 32, 04017073. [Google Scholar] [CrossRef]
- Mei, Q.; Gül, M. A crowdsourcing-based methodology using smartphones for bridge health monitoring. Struct. Health Monit. 2019, 18, 1602–1619. [Google Scholar] [CrossRef]
- Mei, Q.; Gül, M.; Shirzad-Ghaleroudkhani, N. Towards smart cities: Crowdsensing-based monitoring of transportation infrastructure using in-traffic vehicles. J. Civ. Struct. Health Monit. 2020, 10, 653–665. [Google Scholar] [CrossRef]
- Matarazzo, T.J.; Santi, P.; Pakzad, S.N.; Carter, K.; Ratti, C.; Moaveni, B.; Osgood, C.; Jacob, N. Crowdsensing Framework for Monitoring Bridge Vibrations Using Moving Smartphones. Proc. IEEE 2018, 106, 577–593. [Google Scholar] [CrossRef]
- Li, F.; Zhou, Z.; Xiao, J.; Chen, R.; Lehtomäki, M.; Elberink, S.O.; Vosselman, G.; Hyyppä, J.; Chen, Y.; Kukko, A. Instance-Aware Semantic Segmentation of Road Furniture in Mobile Laser Scanning Data. IEEE Trans. Intell. Transp. Syst. 2022, 23, 17516–17529. [Google Scholar] [CrossRef]
- Karimzadeh, A.; Shoghli, O. Predictive Analytics for Roadway Maintenance: A Review of Current Models, Challenges, and Opportunities. Civil. Eng. J. 2020, 6, 602–625. [Google Scholar] [CrossRef]
- Haresh, S.; Kumar, S.; Zia, M.Z.; Tran, Q.H. Towards Anomaly Detection in Dashcam Videos. In Proceedings of the IEEE Intelligent Vehicles Symposium, Las Vegas, NV, USA, 19 October–13 November 2020; pp. 1407–1414. [Google Scholar] [CrossRef]
- Choi, J.G.; Kong, C.W.; Kim, G.; Lim, S. Car crash detection using ensemble deep learning and multimodal data from dashboard cameras. Expert. Syst. Appl. 2021, 183, 115400. [Google Scholar] [CrossRef]
- Cao, M.T.; Tran, Q.V.; Nguyen, N.M.; Chang, K.T. Survey on performance of deep learning models for detecting road damages using multiple dashcam image resources. Adv. Eng. Inform. 2020, 46, 101182. [Google Scholar] [CrossRef]
- Zekany, S.A.; Dreslinski, R.G.; Wenisch, T.F. Classifying Ego-Vehicle Road Maneuvers from Dashcam Video; Classifying Ego-Vehicle Road Maneuvers from Dashcam Video. In Proceedings of the 2019 IEEE Intelligent Transportation Systems Conference (ITSC), Auckland, New Zealand, 27–30 October 2019. [Google Scholar] [CrossRef]
- Kim, Y.; Song, K.; Kang, K. Framework for Machine Learning-Based Pavement Marking Inspection and Geohash-Based Monitoring. In Proceedings of the International Conference on Transportation and Development 2022, Seattle, WA, USA, 31 May–3 June 2022; pp. 123–132. [Google Scholar] [CrossRef]
- Van Der Horn, E.; Mahadevan, S. Digital Twin: Generalization, characterization and implementation. Decis. Support. Syst. 2021, 145, 113524. [Google Scholar] [CrossRef]
- Vieira, J.; Martins, J.P.; de Almeida, N.M.; Patrício, H.; Morgado, J.G. Towards Resilient and Sustainable Rail and Road Networks: A Systematic Literature Review on Digital Twins. Sustainability 2022, 14, 7060. [Google Scholar] [CrossRef]
- Khojastehpour, M.; Sahebi, S.; Samimi, A. Public acceptance of a crowdsourcing platform for traffic enforcement. Case Stud. Transp. Policy 2022, 10, 2012–2024. [Google Scholar] [CrossRef]
- Jeong, I.; Jang, Y.; Sharmin Dola, I.; Younesi Heravi, M. A Framework for Remote Road Furniture Monitoring System Using Smart IoT Dashcams and Digital Twin. In Proceedings of the Computing in Civil Engineering 2023: Resilience, Safety, and Sustainability—Selected Papers from the ASCE International Conference on Computing in Civil Engineering, Corvallis, OR, USA, 25–28 June 2023; pp. 1080–1088. [Google Scholar] [CrossRef]
- Mylonas, G.; Kalogeras, A.; Kalogeras, G.; Anagnostopoulos, C. Alexakos, and L. Munoz. Digital Twins from Smart Manufacturing to Smart Cities: A Survey. IEEE Access 2021, 9, 143222–143249. [Google Scholar] [CrossRef]
- Monteiro, J.; Barata, J.; Veloso, M.; Veloso, L.; Nunes, J. Towards sustainable digital twins for vertical farming. In Proceedings of the 2018 13th International Conference on Digital Information Management, ICDIM 2018, Berlin, Germany, 24–26 September 2018; pp. 234–239. [Google Scholar] [CrossRef]
- Liu, Y.; Zhang, L.; Yang, Y.; Zhou, L.; Ren, L.; Wang, F.; Liu, R.; Pang, Z.; Deen, M.J. A Novel Cloud-Based Framework for the Elderly Healthcare Services Using Digital Twin. IEEE Access 2019, 7, 49088–49101. [Google Scholar] [CrossRef]
- Barricelli, B.R.; Casiraghi, E.; Gliozzo, J.; Petrini, A.; Valtolina, S. Human Digital Twin for Fitness Management. IEEE Access 2020, 8, 26637–26664. [Google Scholar] [CrossRef]
- Azfar, T.; Weidner, J.; Raheem, A.; Ke, R.; Cheu, R.L. Efficient Procedure of Building University Campus Models for Digital Twin Simulation. IEEE J. Radio Freq. Identif. 2022, 6, 769–773. [Google Scholar] [CrossRef]
- Ferré-Bigorra, J.; Casals, M.; Gangolells, M. The adoption of urban digital twins. Cities 2022, 131, 103905. [Google Scholar] [CrossRef]
- Khosravi, H.; Abrishami, M.; Mehrian, M.R.; Chamberlain, B. The positive impact of transit-oriented-development characteristics on Metro Station usage: A case study of Tehran’s metro stations and TOD index calculation. Cities 2024, 148, 104840. [Google Scholar] [CrossRef]
- Lai, X.; Kan, Z.; Sun, W.; Song, X.; Tian, B.; Yuan, T. Digital twin-based non-destructive testing for structural health monitoring of bridges. Nondestruct. Test. Eval. 2024, 39, 57–74. [Google Scholar] [CrossRef]
- Jiang, F.; Ma, L.; Broyd, T.; Chen, W.; Luo, H. Digital twin enabled sustainable urban road planning. Sustain. Cities Soc. 2022, 78, 103645. [Google Scholar] [CrossRef]
- Wang, Y.; Wang, W.; Liu, J.; Chen, T.; Wang, S.; Yu, B.; Qin, X. Framework for geometric information extraction and digital modeling from LiDAR data of road scenarios. Remote Sens. 2023, 15, 576. [Google Scholar] [CrossRef]
- Zhao, L.; Han, G.; Li, Z.; Shu, L. Intelligent Digital Twin-Based Software-Defined Vehicular Networks. IEEE Netw. 2020, 34, 178–184. [Google Scholar] [CrossRef]
- Hidayat, F.; Supangkat, S.H.; Hanafi, K. Digital Twin of Road and Bridge Construction Monitoring and Maintenance. In Proceedings of the ISC2 2022—8th IEEE International Smart Cities Conference, Pafos, Cyprus, 26–29 September 2022. [Google Scholar] [CrossRef]
- Yu, G.; Zhang, S.; Hu, M.; Ken Wang, Y. Prediction of highway tunnel pavement performance based on digital twin and multiple time series stacking. Adv. Civil. Eng. 2020, 2020, 8824135. [Google Scholar] [CrossRef]
- Consilvio, A.; Hernández, J.S.; Chen, W.; Brilakis, I.; Bartoccini, L.; Di Gennaro, F.; van Welie, M. Towards a digital twin-based intelligent decision support for road maintenance. Transp. Res. Procedia 2023, 69, 791–798. [Google Scholar] [CrossRef]
- Chen, K.; Torbaghan, M.E.; Chu, M.; Zhang, L.; Garcia-Hernández, A. Identifying the most suitable machine learning approach for a road digital twin. Proc. Inst. Civil Eng. —Smart Infrastruct. Constr. 2021, 174, 88–101. [Google Scholar] [CrossRef]
- Gao, Y.; Qian, S.; Li, Z.; Wang, P.; Wang, F.; He, Q. Digital twin and its application in transportation infrastructure. In Proceedings of the 2021 IEEE 1st International Conference on Digital Twins and Parallel Intelligence, DTPI 2021, Beijing, China, 5 July—15 August 2021; pp. 298–301. [Google Scholar] [CrossRef]
- Diwan, T.; Anirudh, G.; Tembhurne, J.V. Object detection using YOLO: Challenges, architectural successors, datasets and applications. Multimed. Tools Appl. 2023, 82, 9243–9275. [Google Scholar] [CrossRef]
- Intel Corporation. Computer Vision Annotation Tool (CVAT). Available online: https://github.com/openvinotoolkit/cvat (accessed on 14 January 2024).
- Google Inc. Google Maps API. Available online: https://developers.google.com/maps/documentation (accessed on 1 January 2024).
- Inc. MongoDB. MongoDB Atlas: Database as a Service for MongoDB. Available online: https://www.mongodb.com/atlas/database (accessed on 9 January 2024).
Figure 1.
Overview of the proposed road fixture monitoring system.

Figure 2.
Instances of annotated images for training object detection model. Screens are taken from CVAT environment, where bounding boxes are drawn manually.
Figure 2.
Instances of annotated images for training object detection model. Screens are taken from CVAT environment, where bounding boxes are drawn manually.

Figure 3.
Process of geo-localization of the detected object.

Figure 4.
Data storage process.

Figure 5.
Edge device prototype.

Figure 6.
Detected object and pixel coordinates: (a) traffic pole; (b) stop sign; (c) streetlight.

Figure 7.
Fixture representation on road DT (arrows and dashed boxes were manually added to the screenshots).
Figure 7.
Fixture representation on road DT (arrows and dashed boxes were manually added to the screenshots).


Table 1.
Comparison between conventional and proposed approach from data size reduction point of view.
Table 1.
Comparison between conventional and proposed approach from data size reduction point of view.
| Case | Conventional Approach (MB) | Proposed Approach (MB) | Data Size Reduction (%) |
|---|---|---|---|
| 1 | 2119 | 331 | 84% |
| 2 | 2168 | 408 | 81% |
| 3 | 2264 | 426 | 81% |
| 4 | 2247 | 433 | 80% |
| 5 | 2246 | 406 | 81% |
Table 2.
GPS coordinates of the detected objects.
| Road Fixture | Estimated GPS Coordinates from Our Device | Estimated GPS Coordinates from Detected Road Fixture | RMS Error (m) | |
|---|---|---|---|---|
| Traffic pole | 1 | 46.90764279, −96.78438378 | 46.90117861, −96.79360287 | 4.4 |
| 2 | 46.90064577, −96.79887722 | 46.89418159, −96.80809511 | 4.5 | |
| 3 | 46.90408798, −96.79746032 | 46.89762380, −96.80667880 | 4.4 | |
| 4 | 46.90567631, −96.78438594 | 46.89921213, −96.79360469 | 4.4 | |
| 5 | 46.91645479, −96.77919637 | 46.90999061, −96.78841698 | 4.3 | |
| Stop sign | 1 | 46.897282360, −96.7855960 | 46.89081818, −96.79481331 | 4.6 |
| 2 | 46.82409764, −96.85415915 | 46.81763346, −96.86336391 | 5.3 | |
| 3 | 46.89331785, −96.79045317 | 46.88685367, −96.7996698 | 5.7 | |
| 4 | 46.88447833, −96.77829662 | 46.87801415, −96.78751173 | 5.6 | |
| 5 | 46.86501168, −96.84036913 | 46.85854750, −96.84958090 | 4.8 | |
| Streetlight | 1 | 46.88274829, −96.77203295 | 46.87628411, −96.78124776 | 6.5 |
| 2 | 46.88507764, −96.78517595 | 46.87861346, −96.79439116 | 5.3 | |
| 3 | 46.89514093, −96.78901977 | 46.88867675, −96.79823671 | 6.1 | |
| 4 | 46.81016343, −96.85989261 | 46.80369925, −96.86909498 | 5.8 | |
| 5 | 46.89641841, −96.78897575 | 46.88995423, −96.79819291 | 5.9 | |
Disclaimer/Publisher’s Note: The statements, opinions and data contained in all publications are solely those of the individual author(s) and contributor(s) and not of MDPI and/or the editor(s). MDPI and/or the editor(s) disclaim responsibility for any injury to people or property resulting from any ideas, methods, instructions or products referred to in the content. |
© 2024 by the authors. Licensee MDPI, Basel, Switzerland. This article is an open access article distributed under the terms and conditions of the Creative Commons Attribution (CC BY) license (https://creativecommons.org/licenses/by/4.0/).
Share and Cite
MDPI and ACS Style
Younesi Heravi, M.; Dola, I.S.; Jang, Y.; Jeong, I. Edge AI-Enabled Road Fixture Monitoring System. Buildings 2024, 14, 1220. https://doi.org/10.3390/buildings14051220
AMA Style
Younesi Heravi M, Dola IS, Jang Y, Jeong I. Edge AI-Enabled Road Fixture Monitoring System. Buildings. 2024; 14(5):1220. https://doi.org/10.3390/buildings14051220
Chicago/Turabian StyleYounesi Heravi, Moein, Israt Sharmin Dola, Youjin Jang, and Inbae Jeong. 2024. "Edge AI-Enabled Road Fixture Monitoring System" Buildings 14, no. 5: 1220. https://doi.org/10.3390/buildings14051220
Note that from the first issue of 2016, this journal uses article numbers instead of page numbers. See further details here.