Article

Impact of Wind Pressure Coefficients on the Natural Ventilation Effectiveness of Buildings through Simulations

by
Nayara Rodrigues Marques Sakiyama
1,
Joyce Correna Carlo
2,
Felipe Isamu Harger Sakiyama
1,
Nadir Abdessemed
3,
Jürgen Frick
4,* and
Harald Garrecht
4
1
Institute for Science, Engineering and Technology (ICET), Federal University of the Jequitinhonha and Mucuri Valleys (UFVJM), R. Cruzeiro, 01-Jardim São Paulo, Teófilo Otoni 39803-371, Brazil
2
Architecture and Urbanism Department (DAU), Federal University of Viçosa (UFV), Av P. H. Rolfs, Viçosa 36570-900, Brazil
3
Transsolar Energietechnik GmbH, Curiestrasse 2, 70563 Stuttgart, Germany
4
Materials Testing Institute (MPA), University of Stuttgart, Pfaffenwaldring 2b, 70569 Stuttgart, Germany
*
Author to whom correspondence should be addressed.
Buildings 2024, 14(9), 2803; https://doi.org/10.3390/buildings14092803
Submission received: 2 July 2024 / Revised: 3 September 2024 / Accepted: 3 September 2024 / Published: 6 September 2024

Abstract

:
Natural Ventilation Effectiveness (NVE) is a performance metric that quantifies when outdoor airflows can be used as a cooling strategy to achieve indoor thermal comfort. Based on standard ventilation threshold and building energy simulation (BES) models, the NVE relates available and required airflows to quantify the usefulness of natural ventilation (NV) through design and building evaluation. Since wind is a significant driving force for ventilation, wind pressure coefficients ( C p ) represent a critical boundary condition when assessing building airflows. Therefore, this paper investigates the impact of different C p sources on wind-driven NVE results to see how sensitive the metric is to this variable. For that, an experimental house and a measurement period were used to develop and calibrate the initial BES model. Four C p sources are considered: an analytical model from the BES software (i), surface-averaged C p values for building windows that were calculated with Computational Fluid Dynamics (CFD) simulations using OpenFOAM through a cloud-based platform (iia,b,c), and two databases—AIVC (iii) and Tokyo Polytechnic University (TPU) (iv). The results show a variance among the C p sources, which directly impacts airflow predictions; however, its effect on the performance metric was relatively small. The variation in the NVE outcomes with different C p ’s was 3% at most, and the assessed building could be naturally ventilated around 75% of the investigated time on the first floor and 60% in the ground floor spaces.

1. Introduction

Natural ventilation (NV) is a strategy that can be employed to achieve indoor thermal comfort [1], minimize building energy consumption [2,3,4], and improve air quality [5]. However, designers must check the NV effectiveness throughout project development to check whether outdoor airflows meet the required ventilation thresholds and ensure their performance. One can employ different tools [6] or metrics [7] to assess natural ventilation during the early design phases. These tools range from simple to more robust approaches, such as analytical equations, site/climate analysis tools, building energy simulations (BES), stand-alone airflow network (AFN) models or Computational Fluid Dynamic (CFD), which vary in complexity and accuracy [8,9,10,11,12].
AFN models, integrated or not into BES, and CFD are the two modeling approaches to ventilation characterization to be noted within building thermal or/and energy simulation [13]. As the most sophisticated airflow modeling method, Computational Fluid Dynamics has the ability to accurately analyze temperature profiles and air distribution in indoor spaces [14]. It uses turbulence models and numerical solution methods to solve the (often steady state) Navier–Stokes equations [15]. BES, on the other hand, allows a detailed heat-balance calculation at discrete time-steps based on the physical properties of a building, mechanical systems, and other dynamic external inputs such as weather, occupancy, lighting, equipment loads, etc. [16].
Building energy simulations have become an integral part of the building design process, since they provide a detailed prescription for building energy and thermal performance [17]. They facilitate decision-making processes, as they offer effective evaluations of different design alternatives and strategies [18], including naturally ventilated buildings.
A critical boundary condition when predicting natural ventilation is the wind pressure coefficient ( C p ), since wind is a significant driving force for infiltration and ventilation. Cóstola et al. [19] analyzed the use of C p in BES and AFN models, and identified the coefficient as one of the main sources of uncertainty, since it is influenced by wind speed and direction, building geometry, façade exposure, and opening position on the surface. The authors differentiate the ways to obtain the C p values from either direct (primary) or indirect (secondary) sources. Field experiments, wind tunnel measurements and CFD simulations are primary sources, while databases and analytical/empirical models based on the compilation of wind tunnel studies are secondary. This paper studies the impact of wind pressure coefficients ( C p ) on the wind-driven natural ventilation effectiveness (NVE) of building design [20]. The proposed metric identifies the number of hours that the NV can be used to cool a space, combining standard ventilation thresholds and AFN simulations. Additionally, it measures the outdoor airflow potential to provide thermal comfort through air changes, which could be applied during the design phase or to perform building evaluation. Moreover, this paper’s results provide valuable information to quantify the NVE of a building during the early project iterations, and complement the existing investigations into C p ’s impact on airflow rate calculations [21,22,23].

Research Scope and Methodology

This study reviews the required ventilation rates considering different international standards. The values were summarized as references for defining minimum NV airflow rates (item 2.1). Moreover, the paper discusses different ways to determine the NVE of buildings (item 2.2), focusing on the performance metric employed in this study (Section 3). Using an experimental house and monitoring data as a reference and base case (Section 4.1), primary and secondary C p values were inputted at the AFN building energy simulations (BES)—Section 5. Lastly, the paper demonstrates the impact of the different wind pressure coefficients on NVE outcomes (Section 6). Researchers and designers can use this information to choose their C p sources when developing and assessing naturally ventilated buildings.

2. Review of Air Infiltration and Ventilation Studies

2.1. Ventilation Thresholds

Ventilation is essential for building occupants’ comfort and health and is directly related to the efficient use of energy [24,25]. The parameters and conditions that govern its requirements are strictly regulated worldwide and focus mainly on cooling and loading demands in heating, ventilation, and air conditioning (HVAC) systems [26]. Nevertheless, these ventilation requirements vary widely by country, contrasting in terms of units and whether they are expressed as constant values or as a function of floor area [27].
In that sense, Table 1 summarizes the required airflow rates for buildings from different ventilation standards, which differ in terms of targets or comparable values.
Moreover, the COVID-19 pandemic has highlighted that existing ventilation design standards may fall short of minimum ventilation rates to prevent indoor contagion [43,44]. Past studies that have reviewed these standards and compared the ventilation flow rates in residential buildings in various European countries concluded that ventilation is, in practice, often poor [33,45,46,47]. As a result, more significant air change rates have been set as targets to maintain indoor quality [5], and using outdoor air as ventilative cooling has become more attractive considering the demands related to health, net-zero energy buildings (nZEBs), and climate change [48]. ASHRAE has also published independent peer-reviewed articles with guidelines for building operations during the pandemic that recommend raising outdoor air ventilation (used with caution in highly polluted areas) [49]. However, increasing ventilation rates, given current mechanical systems, would result in considerable energy expenditure. Therefore, new strategies to heat or cool spaces and users should use natural ventilation to achieve comfort levels without increasing energy consumption [50]. Aviv et al. [51] showed that this is achievable by estimating the energy savings potential of coupling natural ventilation with a radiant cooling strategy, which already accounts for the higher ventilation requirements of COVID-19.
Even before the pandemic, Persily [52] exploited the challenges involved in the ventilation requirements of ASHRAE 62.1, which have changed over the years, aiming to achieve more effective rates. The standard outlines the minimum outdoor airflow required per zone and per person, maintaining the existing values in its updated version in 2022 [53]. Although the ventilation requirements in these documents are for buildings with mechanical ventilation systems, the thresholds can reference naturally ventilated buildings. Hence, these airflow rates could be considered as minimum values that the outdoor flow must meet to provide users with acceptable comfort levels.

2.2. Assessing Natural Ventilation Performance

Supplementary to consistent threshold values, accurate airflow and heat transfer prediction is essential to quantify the airflow rates and the effects of indoor temperatures when designing naturally ventilated buildings. Chen [6] has reviewed the methods used to predict natural ventilation and discussed analytical, empirical, small-/full-scale experimental, zonal, multizone, and CFD models. CFD techniques are considered a robust tool to predict natural ventilation; however, their use is impractical for annual simulations due to computational complexity and cost. On the other hand, network models are considered more appropriate for numerically solving the multifaceted interactions between driving forces and complex geometries, resulting in sets of non-linear equations [54].

Airflow Network Models

An airflow network (AFN) model consists of nodes, e.g., rooms connected by airflow elements corresponding to discrete airflow paths such as doorways, windows, and construction cracks [55]. The pressure difference across these openings causes wind-driven airflow through the building zones, and the ventilation rate for each opening can be calculated using Equation (1) as
A F = C d A u w i n d C p
where A F is the airflow rate (m3/s) across the opening between its associated nodes of the network, C d is the discharge coefficient, A is the area of the opening (m2), u w i n d is the wind velocity (m/s), and C p is the difference in the surface-averaged wind pressure coefficient between two calculation nodes of the model. The literature suggests that C d values range between 0.60 and 0.65 for sharp-edged openings [56,57,58], although the coefficient might vary considerably depending on the opening porosity and configuration, wind angle, and Reynolds number [59,60]. Fernandes et al. [61] evaluated the coefficient for large openable windows in wind tunnel tests, providing C d values from window types typically found in Brazil and Germany. Similarly, Cruz and Viegas [62] assessed open windows on-site, where a side-hung casement window with a roller shutter may have a discharge coefficient ranging from 0.41 to 0.81. In this sense, Shirzadi et al. [63] proposed an approach to improve the accuracy of the C d values when assessing airflow calculation in BES, which combined Latin hypercube sampling and a large CFD dataset.
Moreover, the wind pressure coefficient ( C p ) is an essential value when predicting natural ventilation. It expresses a dimensionless coefficient that relates the velocity pressure on the building envelope to the velocity pressure derived from the mean wind velocity at a reference point [64]. Although the C p data obtained by primary sources are considered the most reliable [65], secondary data sources, especially databases, are the most frequently employed in BES-AFN analyses [19] since they are easier to obtain.
Table 2 summarizes the most well-known secondary sources (database and analytical models), briefly describing and referencing them.
It is essential to note the limitation of the secondary sources, since most of them only apply to rectangular-floorplan buildings. In this respect, accurate predictions of natural ventilation performance were reported when coupling a primary source, either with full-scale measurements [76] or CFD simulations [77,78,79], to BES, instead of using the analytical models provided within the software. The approach configures an attractive alternative, particularly in non-rectangular buildings [80] and when considering the urban context [81,82].
Consequently, using CFD to obtain wind pressure coefficients for AFN simulations has expanded in prevalence due to computer advances. Kastner and Dogan proposed a streamlined framework to generate C p arrays for arbitrary building shapes and contextual situations [83], releasing Eddy3D, a plugin for Rhino [84] and Grasshopper [85]. Bre and Gimenez [86] offer an online platform whereon users can request a set of desired C p data from a web-based interface “https://cpsimulator.cimec.org.ar/ (accessed on 2 June 2024)”. Moreover, Sakiyama et al. [87] compared the impacts of CFD-based C p values averaged over the whole façade and every opening to investigate their impact on ACH outputs and support a simplified CFD modeling approach when assessing naturally ventilated buildings. These examples used exterior airflow simulations in OpenFOAM [88] to disseminate NV studies that combine primary values of wind pressure coefficients with AFN analyses, especially in early design.

3. Natural Ventilation Effectiveness (NVE)—Building Performance Metric

Figure 1 compiles the steps and summarizes the equations needed to verify the effectiveness of wind-driven natural ventilation based on the methodology initially proposed by Yoon and Malkawi [20]. The metric compares the hourly airflow rate of a building to the airflow that is required to offset the cooling and ventilation load. The hourly ratios of these two airflow rates are summed and then divided by the total hours. This is a function that relates the available natural ventilation flow to the required one.

3.1. Minimum Airflow Rate

The minimum airflow ( A F m i n ) , in m3/s, is calculated by Equation (2) and follows the design requirements from ASHRAE 62.1 for ventilation in the breathing zone of occupiable spaces [53],
A F m i n = Q p P + Q a A f l o o r  
where Q p is the required outdoor airflow rate per person (set as 2.5 L/s.person); P is the zone population (largest number of people expected to occupy the zone during typical usage); Q a is the required outdoor airflow rate per unit area (set as 0.3 L/s.m2), and A f l o o r is the zone floor area.

3.2. Required Airflow Rate

The indoor temperature results from solar radiation, conduction through building materials, and heat gains, e.g., equipment, lights, and people [89]. To sustain comfortable conditions, the heat must be removed through air conditioning or natural ventilation. In this sense, cooling loads are calculated by employing energy simulations as a reference to determine the heat rate that the outdoor flow should be able to eliminate from spaces, and thus achieve the target temperature. This required airflow ( A F r e q ), or necessary wind-driven natural ventilation, that is needed to offset the cooling load is expressed in m3/s by, for T c o m f T o u t Equation (3) as
A F r e q = q ρ   c   ( T c o m f T o u t ) ,           for   T c o m f T o u t
where q is the heat rate (kJ/s) from the energy simulation, ρ is the density of air (kg/m3), set as 1.27, c is the air specific heat capacity (kJ/kg-K), equal to 1005, and T o u t is the outside temperature (K). A comfort threshold temperature T c o m f is used instead of the indoor temperature T i n with the assumption that occupants rely on mechanical systems when natural ventilation is insufficient to provide comfort. The adaptative model with 80% acceptability limits from ASHRAE Standard 55 [89] is used for the T c o m f calculations. Since the airflow metric outputted in the simulations is air change per hour (ACH), the minimum and required airflows— A F m i n and A F r e q , respectively—can be converted to ACH by Equation (4), considering the volume of the room, V .
A C H m i n / r e q = 3600 · A F m i n / r e q V
Besides this, the minimum and required airflow must be compared, so if A C H m i n is greater, it should be used as a reference rather than A C H r e q .

3.3. Available Airflow Rate

The airflow a room can achieve via natural ventilation is calculated through an AFN model, which outputs hourly air change rates. Thus, natural ventilation effectiveness (NVE) calculates the hourly relation ( α i) for each i-th hour between the available airflow rates ( A C H a v a i ) and the required ones ( A C H r e q ) , expressed in Equation (5) as
N V E = i = 1 n α i ,   where   α i = 1 ,     i f   A C H a v a i A C H r e q α i = 1 ,     i f   A C H r e q = 0 α i = A C H a v a i / A C H r e q ,     o t h e r w i s e n = t o t a l   n u m b e r   o f   h o u r s
In this study, a MatLab script automatically processes both the data related to the minimum airflow calculation and the AFN simulations.

4. Simulation Method

4.1. Reference Building and Measured Data

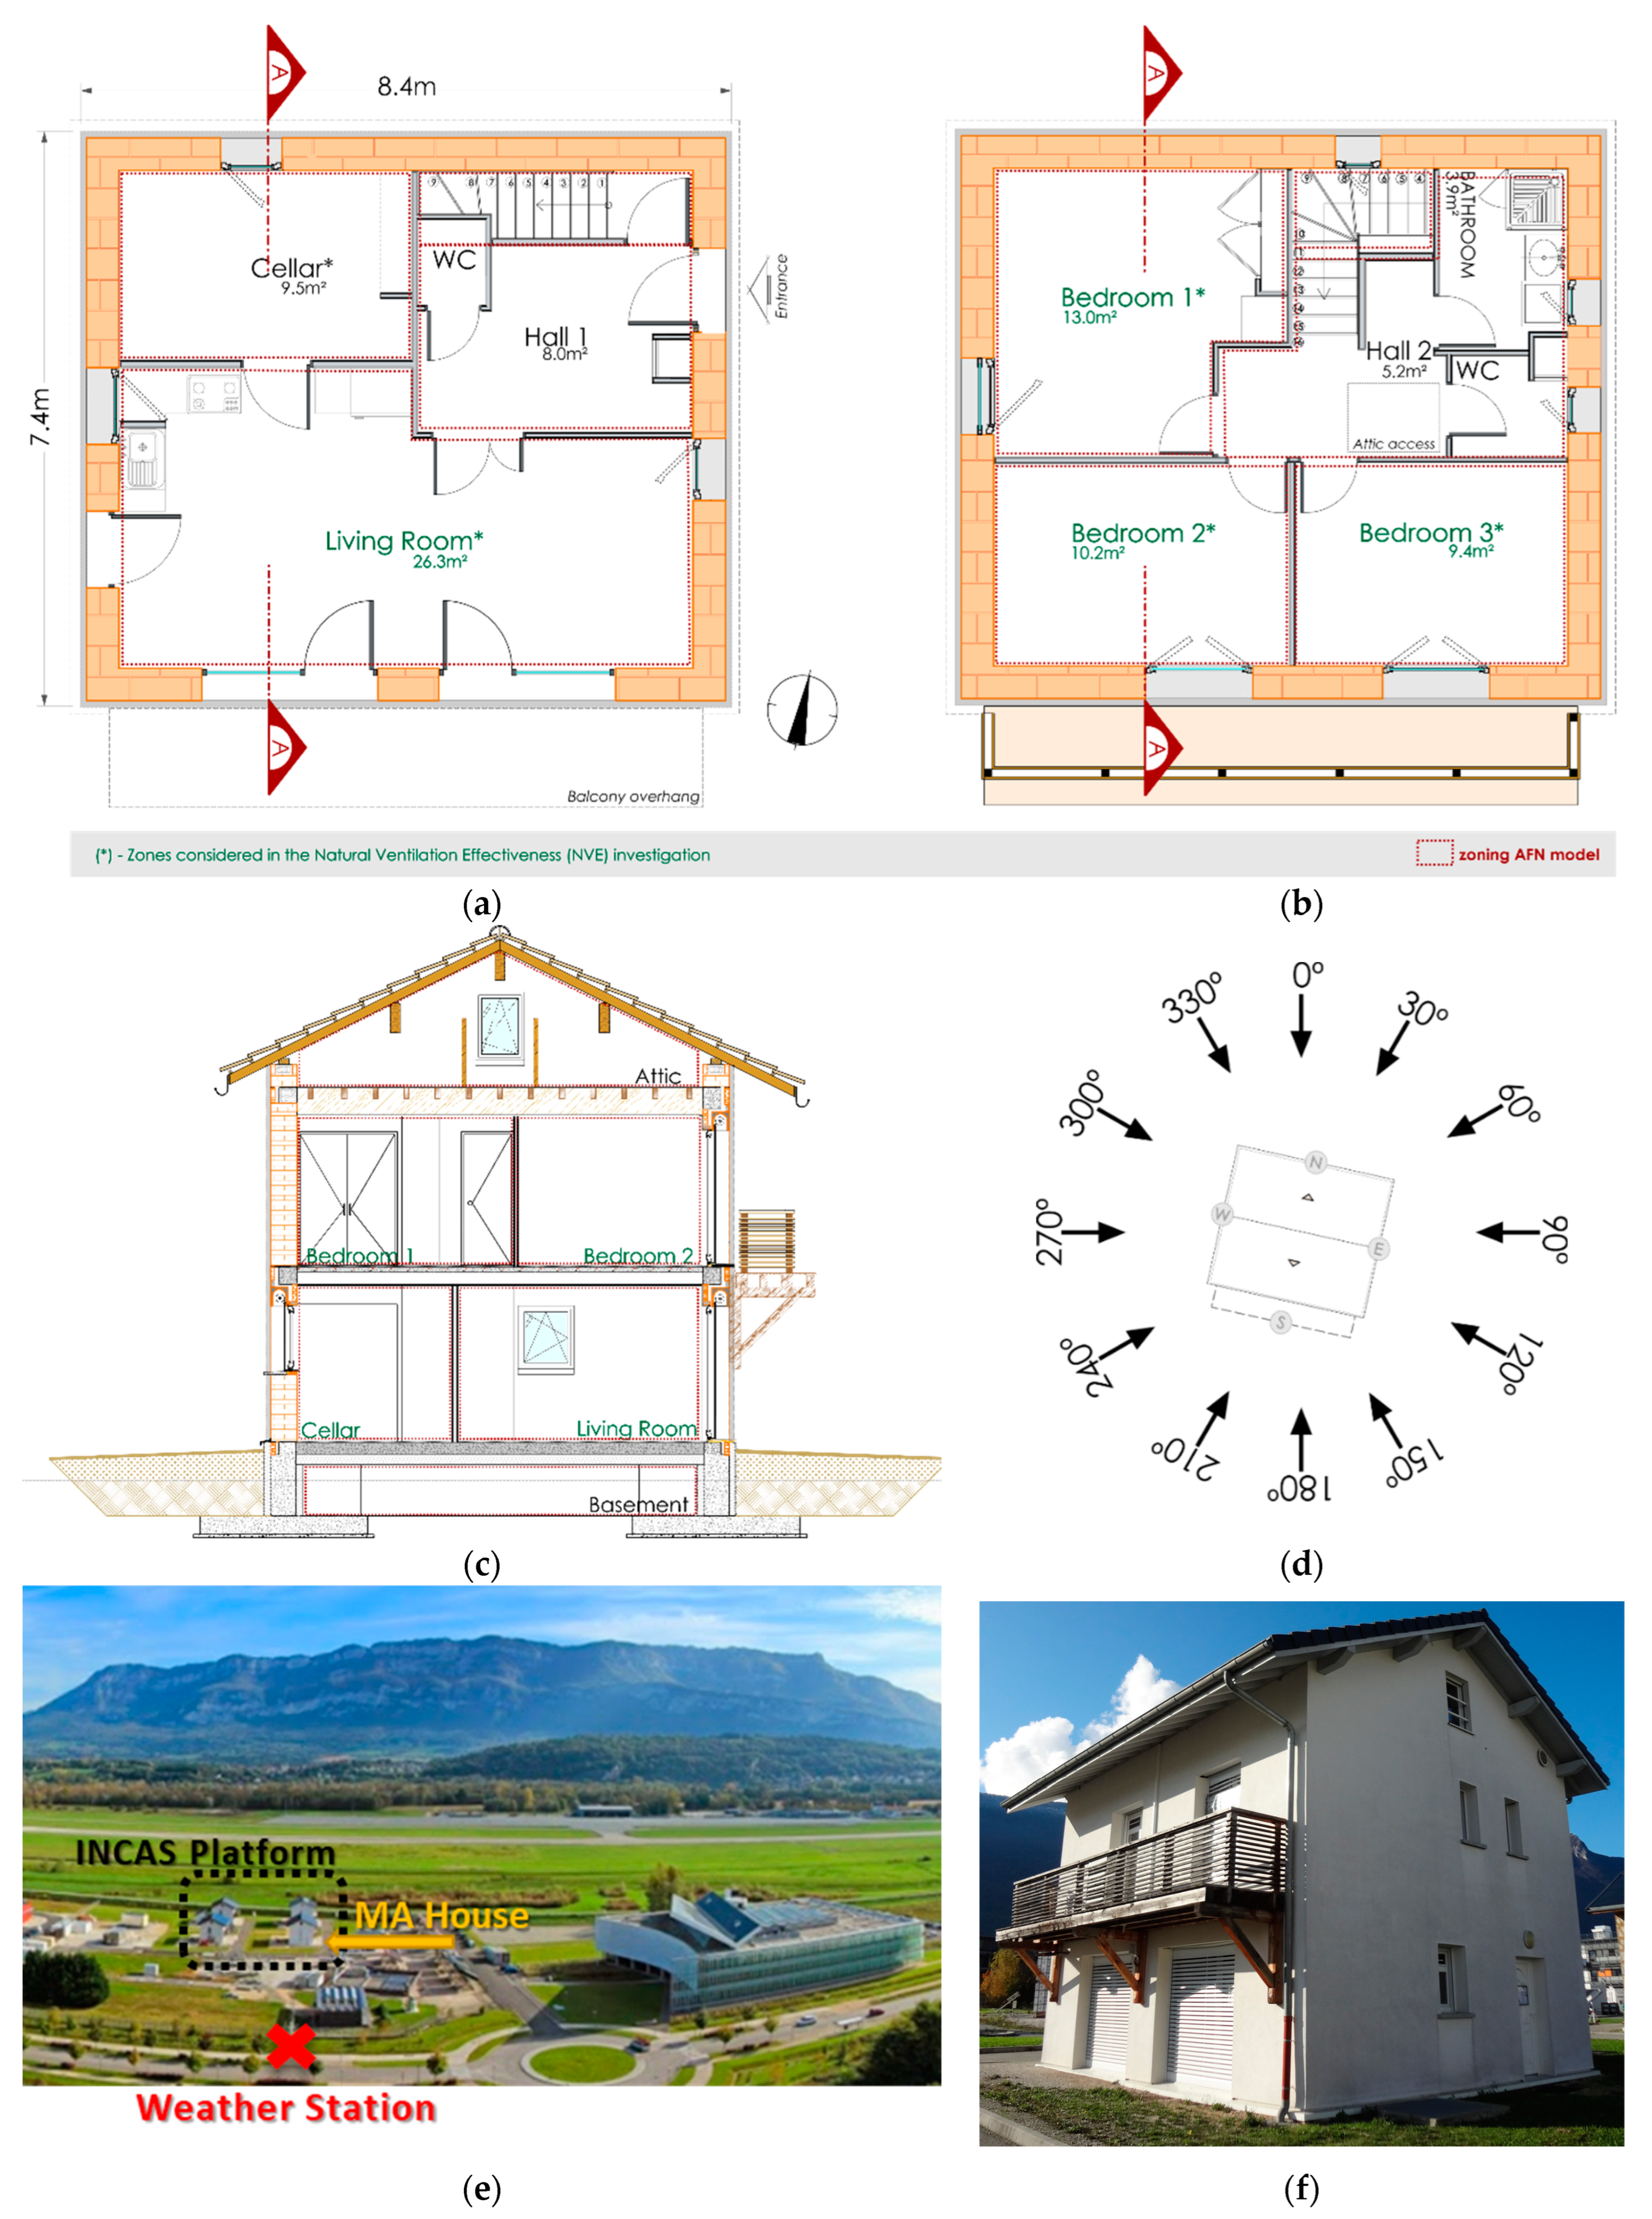
The real building used in the investigations (Figure 2) is a two-story rectangular cavity brick construction (7.5 m × 8.5 m), with the most significant openings facing south (34% glazed). Also known as I-MA, the building is one of the passive test houses from the INCAS experimental platform at the French National Institute for Solar Energy—INES facility, located near Chambéry, France (45°38′38.5″ N, 5°52′27.4″ E). One of the functions of these experimental houses is to validate numerical simulations. Therefore, they have a simple design that allows a straightforward numerical verification process, and host several measurement campaigns to record indoor and outdoor conditions. Thus, we chose the building as a reference for this study, and a one-week monitoring period (19-25.08.14) to develop the numerical model described in Section 4.2.
The measurements aimed to assess the building’s thermal inertia. In that light, the external shutters and internal doors remained open, and only one window in each orientation per floor was in a tilted-opened position during the night (09:00 PM–6:59 AM). Among other parameters, air temperatures were recorded with a one-minute sample rate at the centers of all rooms at the height of 1.1 m. A detailed description of the experimental protocol, measurement equipment, construction, and the climatic data recorded on-site and used in the study is provided in [90].

4.2. I-MA—Building Energy Simulation (BES) Model

A BES model of the I-MA building was created with the EnergyPlus (E+) software [91], version 9.1, using the Airflow Network (AFN) module [92]. Ten zones were considered at the AFN Multizone object: three on the ground, four on the first floor, one on the basement, one on the attic, and one on the staircase zone connecting both stories through a horizontal opening component. Following the development of an evidence-based BES model [93], the initial model was interactively improved and calibrated using the experimental campaign’s data and the indoor air temperatures recorded during this period as a performance reference. The correlation between predicted and measured data at each simulated zone involved the calculation of the CV RMSE and the NMBE, set out by the ASHRAE Guideline 14 [94]. According to the guideline, the simulation model is “calibrated” when NMBE values are up to 5%, and CV RMSE values are up to 15% for monthly measured data or between 10% and 30% for hourly measured data. Since simulation outputs were sampled in a 10 min time step, hourly criteria were used as a threshold. Concurrently, the measurements were interpolated to maintain compatibility between the data. After that, a parametric study using the jEPlus software, version 2.1 [95,96], ranked the best solution using the statistical criteria check Goodness-of-fit (GOF) analyses that rely on CV RMSE and NMBE weighting indices, called GOFTOTAL. The calibration process is described in [90]. At the same time, the E+ model’s complete settings and the EnergyPlus input data file (idf) are available in Data in Brief [89], an open-access, peer-reviewed journal.
At this stage, C p default values in the E+ AFN were used by selecting “Average Surface Calculation” in the field Wind Pressure Coefficient Type. For the calculations using low-rise buildings, the reference building (I-MA) E+ uses the analytical model developed by Swami and Chandra [68].
However, since a remaining problem in the effective use of AFN models is related to flow coefficients [23], one primary and two secondary C p sources are also considered in this study besides the default values (i) used in the E+ source code. Table 3 summarizes all the sources investigated, including C p values provided by the cloud-based platform [86] for three different terrain types regarding the wind velocity profile (iia,b,c), as well as secondary data from the AIVC database (iii) [64] and Tokyo Polytechnic University (TPU) database (iv) [67]. We chose these sources because they represent different alternatives applied in the BES-AFN investigations. They include both primary and secondary sources (CFD and database), consolidated over a longer timeframe (AIVC and TPU database) or released more recently (CpSimulator). Thus, it will be possible to observe the influence of these four C p sources when predicting NVE.
Table 3. C p sources considered in the BES-AFN model.
Cp SourcePrimary or DirectSecondary or Indirect
iE+ values (default values)
Swami and Chandra [68]
x

iia
iib
iic
Cloud-based platform— C p simulator [86]
Terrain type: Very flat (Vf) *
Terrain type: Open country (Oc) *
Terrain type: Suburban (Su) *

x
x
x
iiiAIVC database [64] x
ivTPU database [67] x
* see Table 4.
Table 4. Discrete terrain classification. Adapted from [86].
CaseConsidered OptionsZ0 [m]Zref [m]Uref [m/s]
1. Very flat terrainiia0.002525040
2. Open countryiib0.02535040
3. Suburbaniic0.2545040
4. Urban-2.555040

4.2.1. NVE—Required Airflow Rate (Cooling Loads— q )

Based on the calibrated model, a simplified E+ I-MA model was developed to output the variable Zone Ideal Loads: Zone Total Cooling Energy, which is the heat rate in KJ/s ( q ), used for the calculation of the required airflow rate, detailed in item 3. The goal is to determine how much heat natural ventilation should be removed to maintain the indoor environment within comfortable temperatures. Therefore, the Zone Airflow object was employed instead of the Airflow Network, where the French standard’s infiltration rate of 135 m3/h (Table 1) was used as a reference for the Design Flow Rate field. Additionally, an HVAC Template object was included to calculate the cooling loads.
The model setup adopts consolidated practices from studies involving INES’s experimental houses. However, a classic family occupancy schedule was established as the houses were originally vacant, representing an extreme/worst possible scenario. Figure 3 specifies when the living and bedrooms are occupied and the number of people. This schedule is the same as that employed in the annual investigations with hybrid ventilation, performed in [90].
Finally, the internal gains were set as 5 W/m2 for the lights and equipment in the investigated zones: Living room, and Bedrooms 1, 2 and 3 (Figure 2).

4.2.2. NVE—Available Airflow Rate ( A F / A C H a v a i )

The calibrated I-MA AFN model described in 4.2 is used to output AFN Zone Infiltration Air Change Rate, and the ventilation control mode is set as Temperature, meaning that the zone’s operable windows are opened if Tzone > Tout, Tzone > Tset, and the venting availability schedule allows it. Tzone stands for the previous time step’s zone air temperature, Tout is the outdoor air temperature, and Tset equals the ventilation setpoint temperature, defined at 19 °C.
The period in which natural ventilation can be employed at the investigated site has been identified from April to September [90] (initial—final month). Therefore, the simulations are restricted to this interval, resulting in 4392 h ( n ) considered in the NVE analyses (Equation (5)).

4.3. Cp Simulator

The calibrated E+ idf file used to estimate the available airflow rates (Section 4.2.2) was uploaded as input to the cloud-based platform. The inlet velocity profile chosen was the Terrain classification module, which provides four discrete options for configuring the atmospheric boundary layer (ABL) profile. The parameter values used for each choice are listed in Table 4, where the three options considered in this article are underlined (iia,b,c). Different terrain classifications were investigated to analyze the impacts of these variables when calculating the wind pressure coefficients and, consequently, when assessing NVE.
The main formats provided for the results are comma-separated values (CSV), Visualization Toolkit file (VTK), or E+ idf file, which is the same as that supplied as input data, but updated with the C p values calculated for 12 wind directions in the AFN model objects (Figure 2d). Detailed descriptions of the computational domain, the meshing procedure, the solution calculation, and the post-processing of the results generated by the platform are provided by Bre and Gimenez [86]. The authors used OpenFOAM to run the simulations of the atmospheric boundary layer, and provide a robust explanation of their workflow in the Electronic Supplementary Material of the online version of their paper. To validate the platform performance, they conducted mesh sensitivity analyses and validated different case studies with wind tunnel experimental data, including buildings with openings, balconies, irregular floorplans, and surrounding urban environments.

5. C p Values Considered in the E+ AFN Model

5.1. Primary Source—Cloud-Based Platform—Cp Simulator

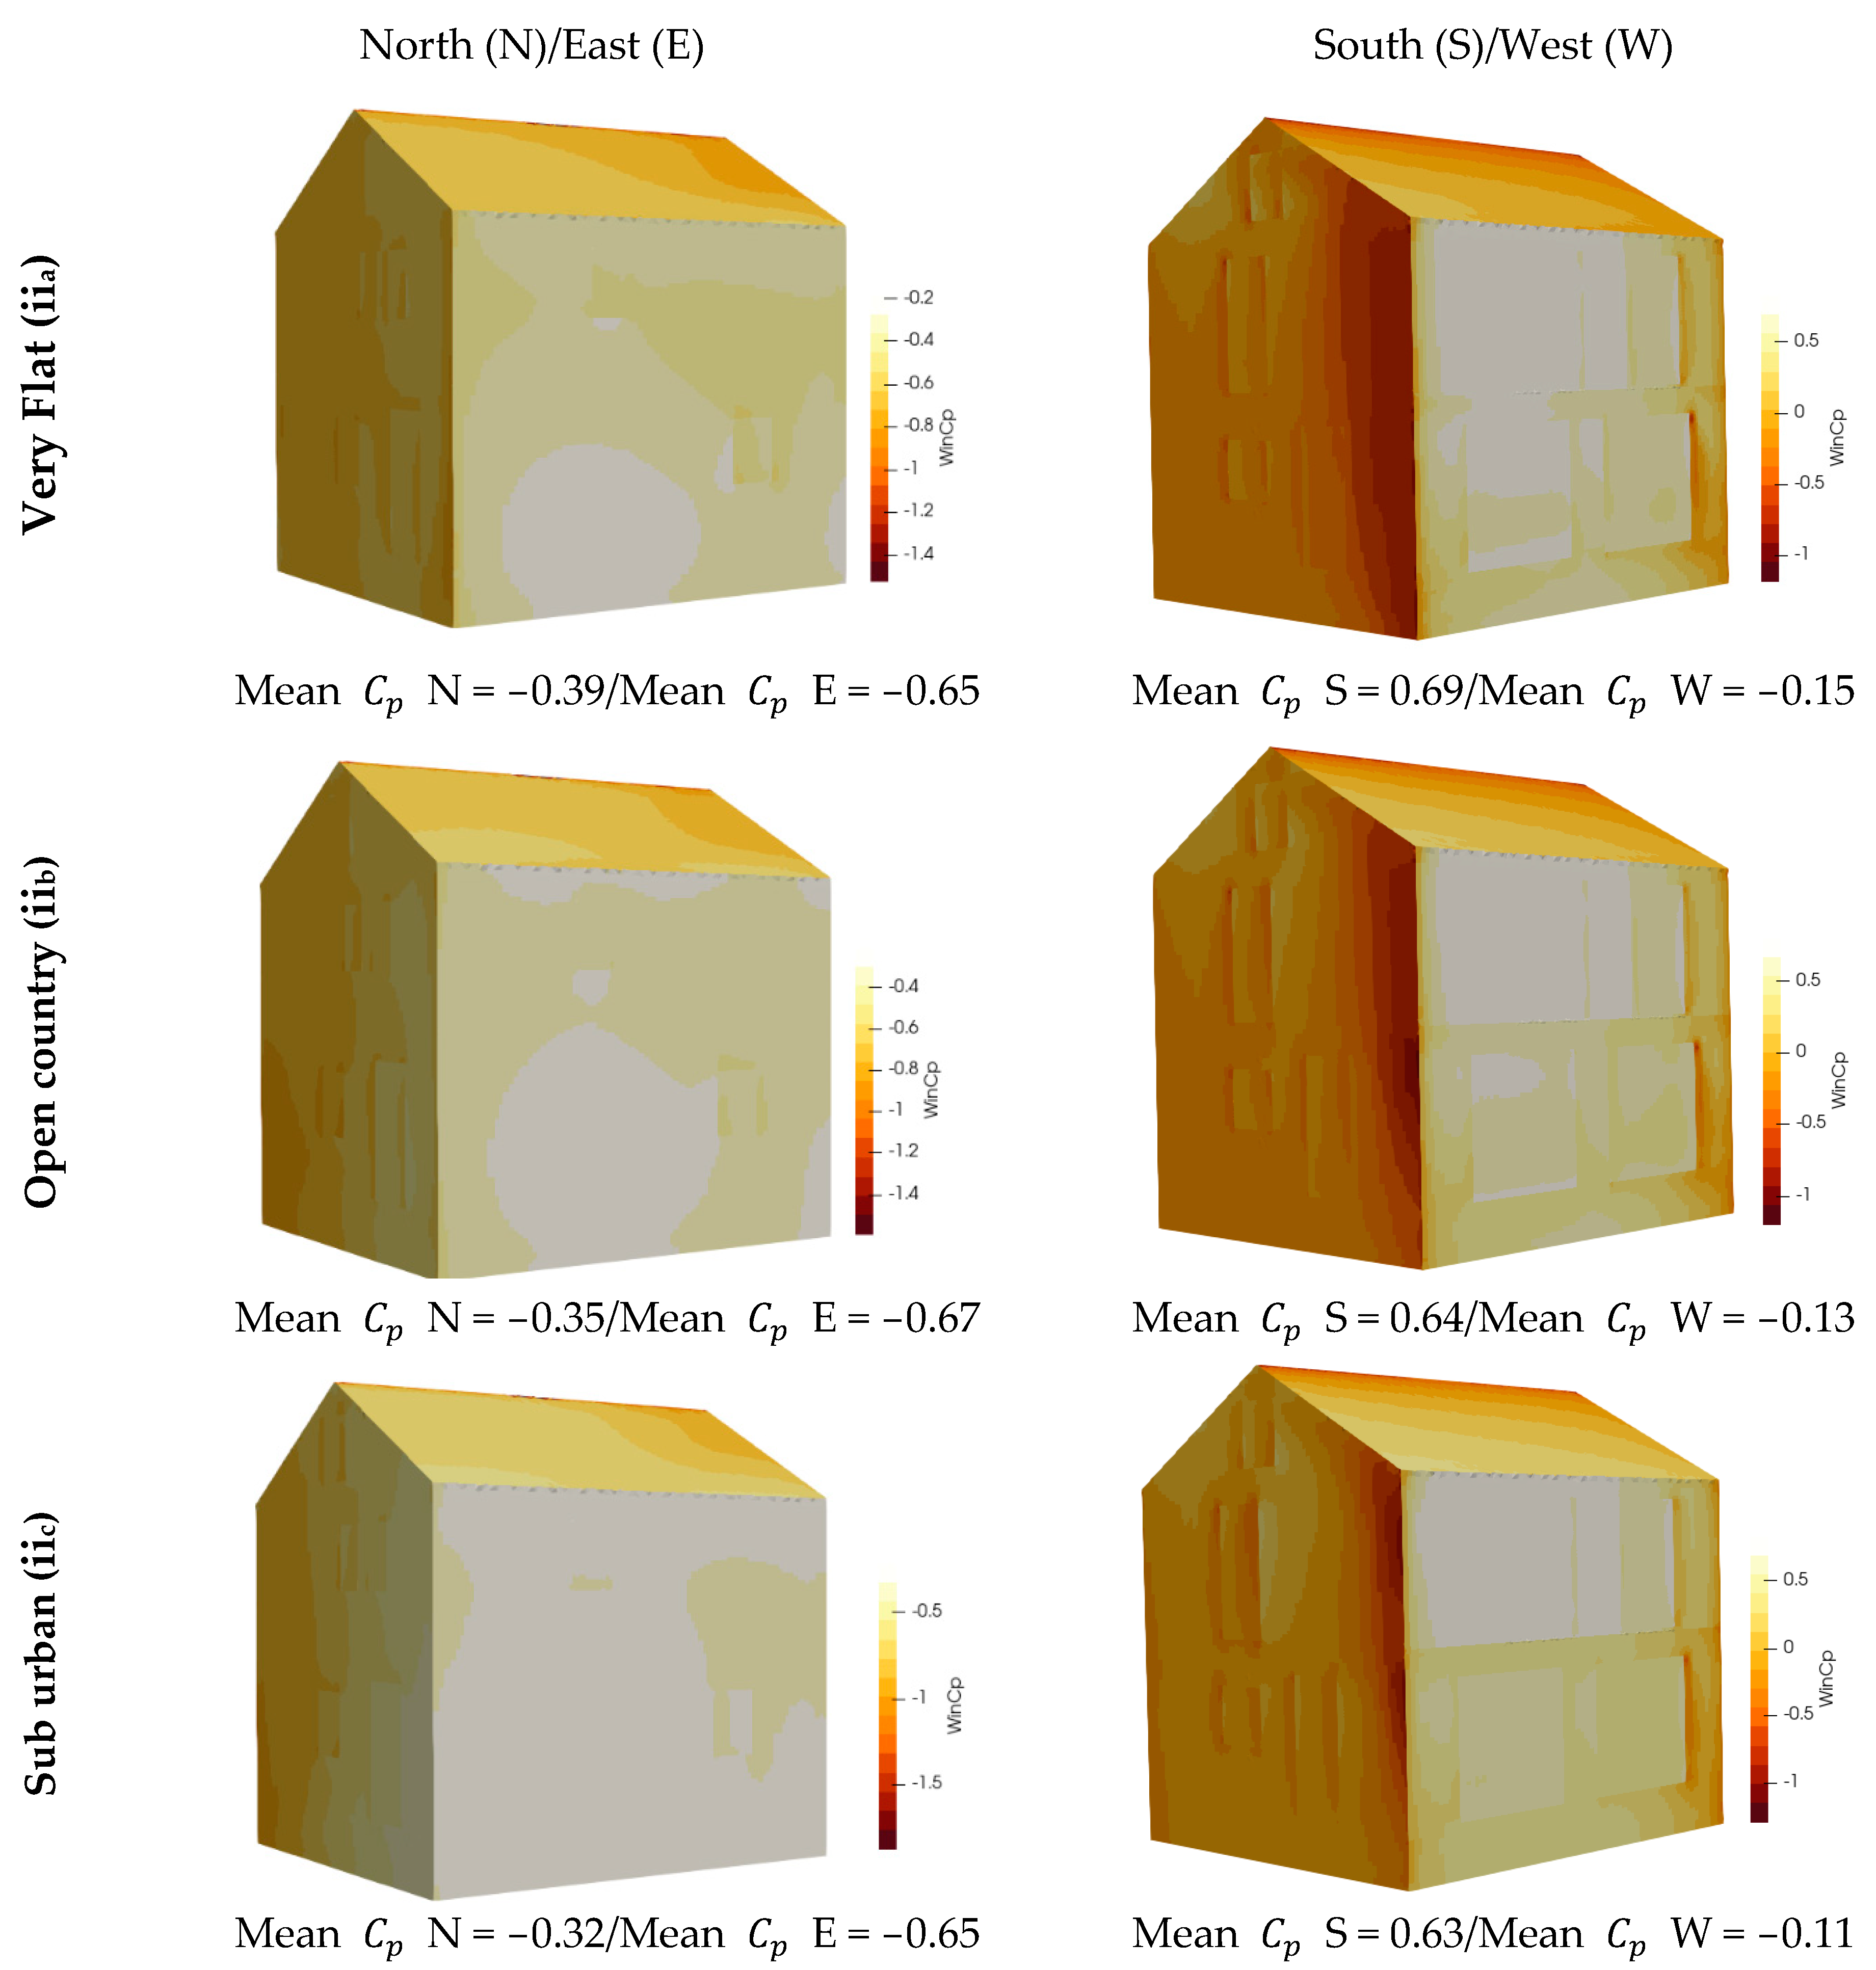
Figure 4 shows the VTK images of the I-MA C p values calculated by the Cp Simulator platform for the wind direction θ = 180°, considering the different terrain types (iia–c). The results are stored in a repository and can be accessed by a downloadable link, which will be sent to the e-mail address provided at the request stage in an average of two to three days.

5.2. Secondary Sources

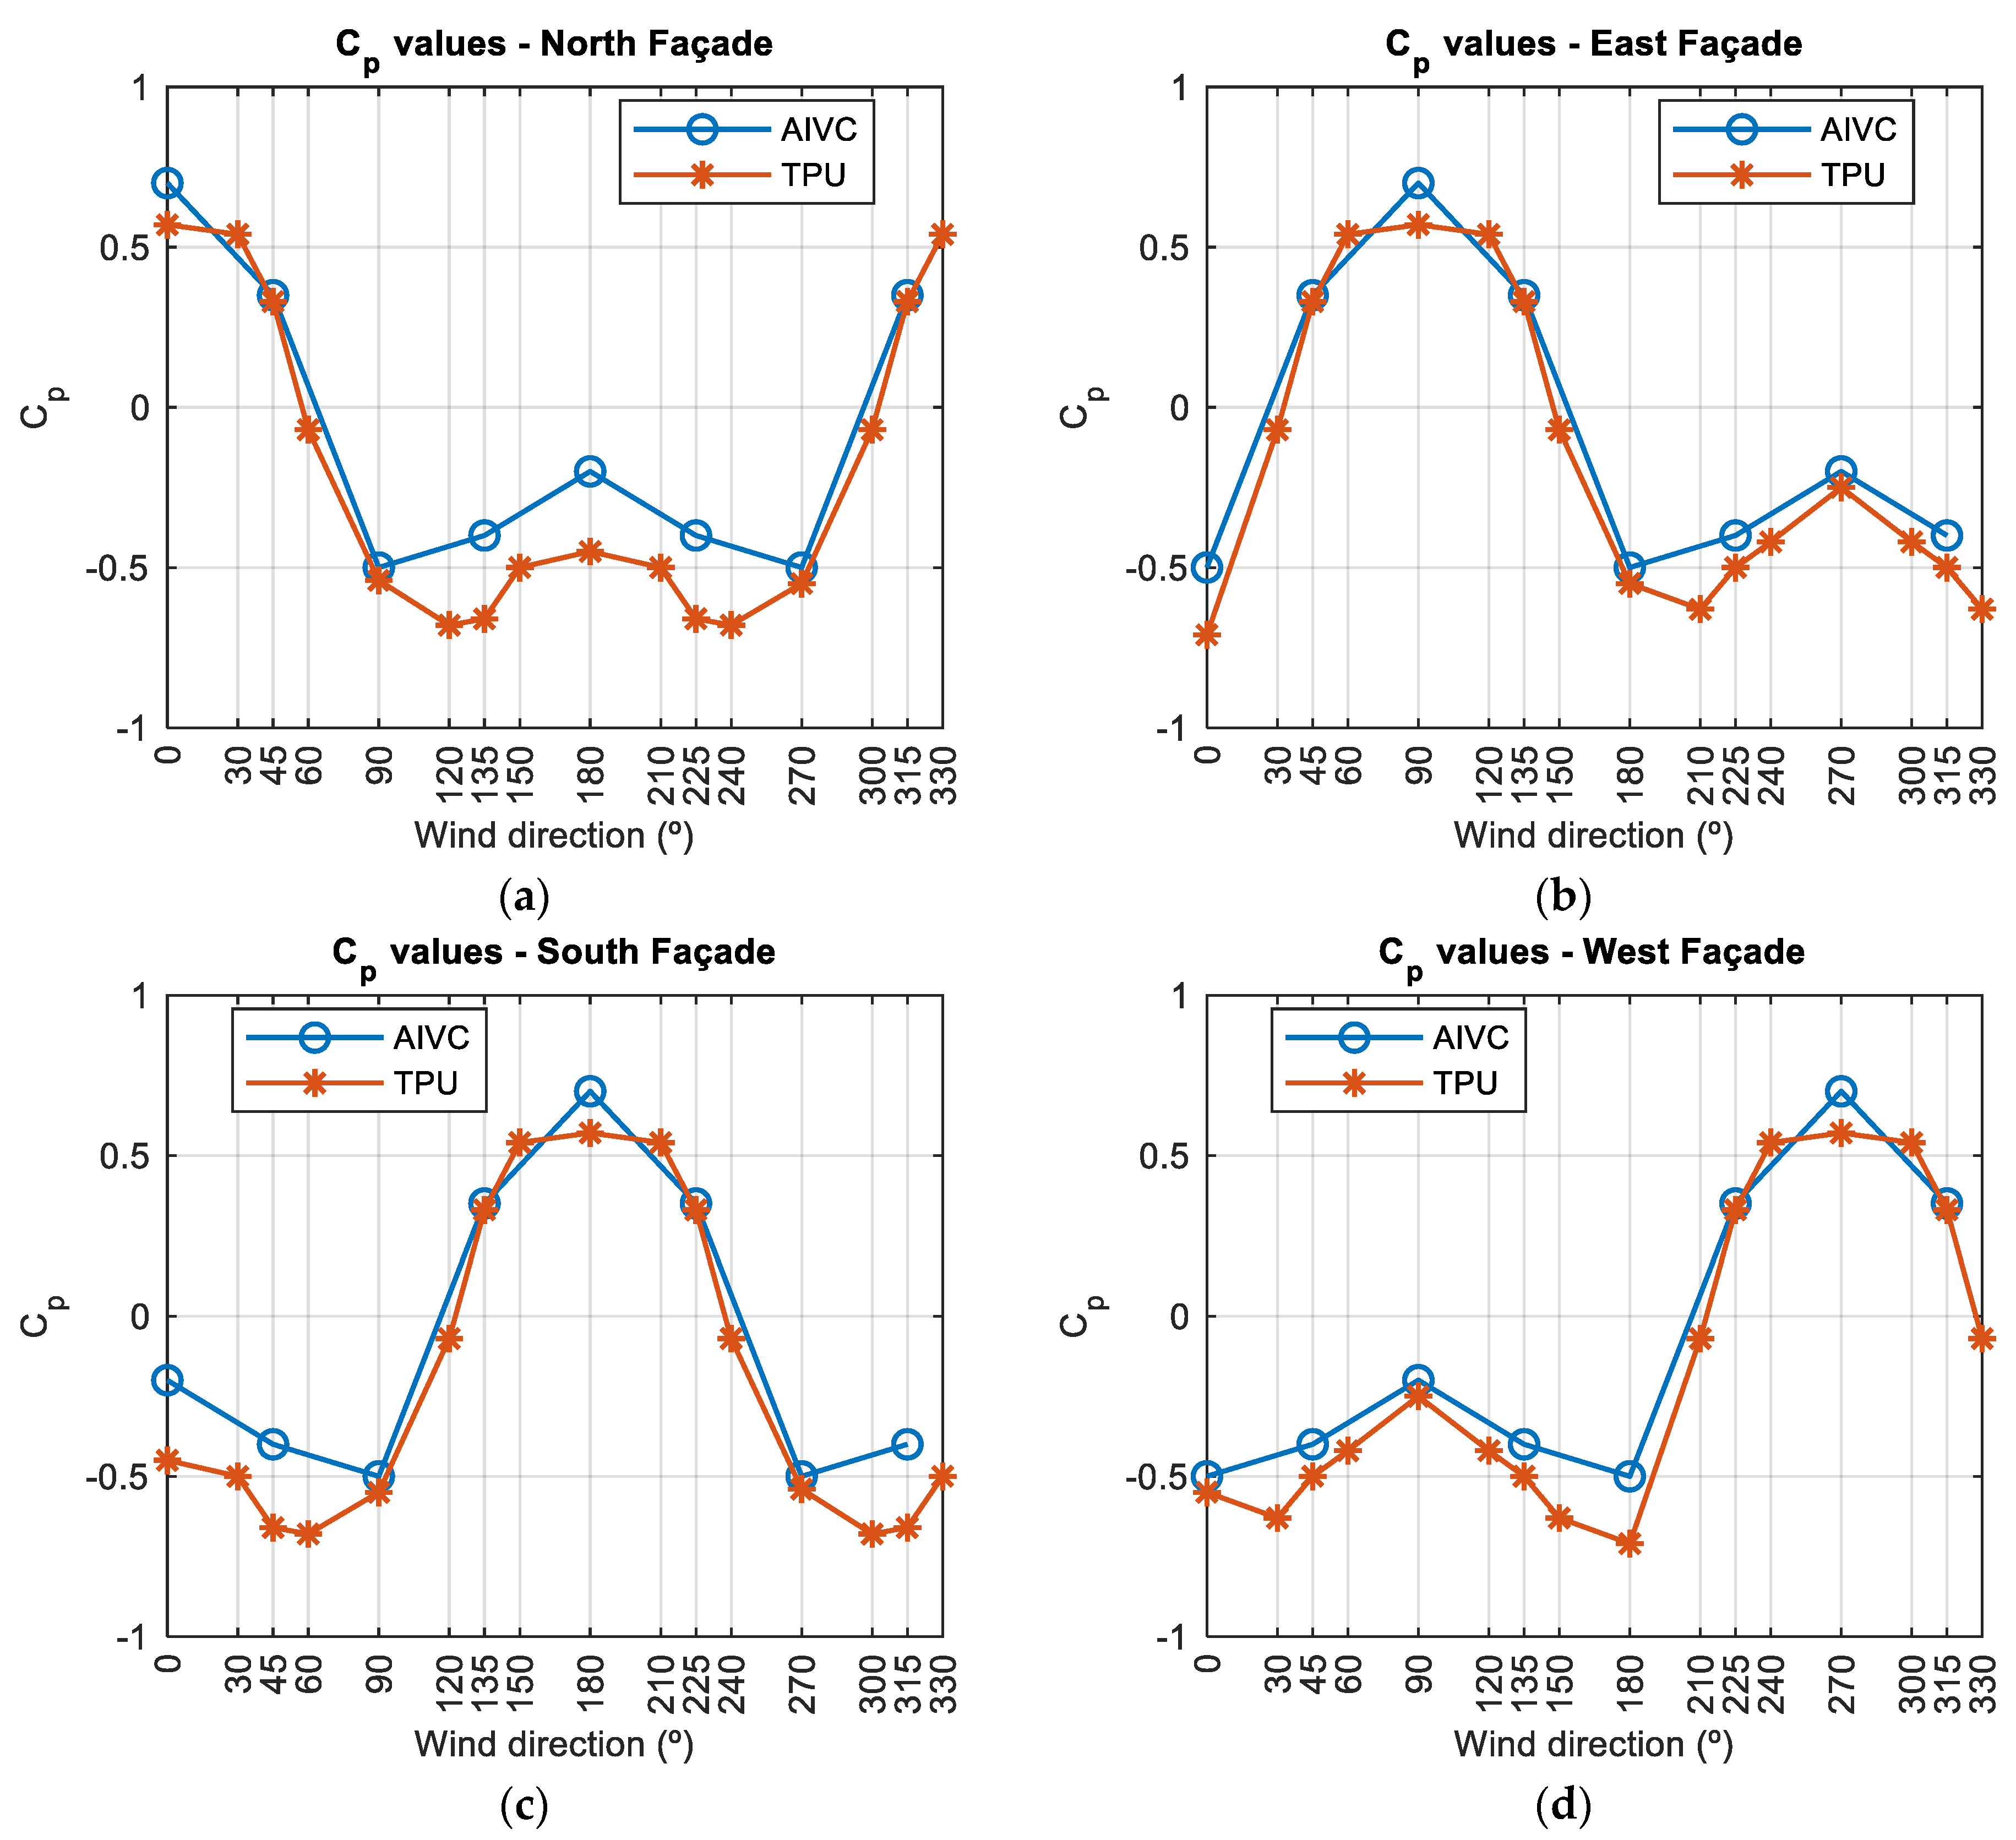
A comparison of the surface-average C p values investigated within the E+ AFN model, including the AIVC (iii) and TPU database (iv), is given in Figure 5. The values from AIVC are provided in a 45° range, from 0° to 315°. The reference used for the TPU database was Type C with side eaves. This model provides surface-average C p values in a 22°5′ interval, from 0° to 90°, so the values for other wind directions were extrapolated, considering a rectangular building. Also, the C p values for the considered wind directions in the study were adapted, accounting for the façade position and the incident wind used in the Tokyo Polytechnic University reference.
The surface-average C p values from the two secondary databases considered in the investigation show similar behaviors regarding wind incidence angle and façades, which is expected since they have a rectangular plan.

5.3. Cp Impact over Predicted Temperatures and ACH

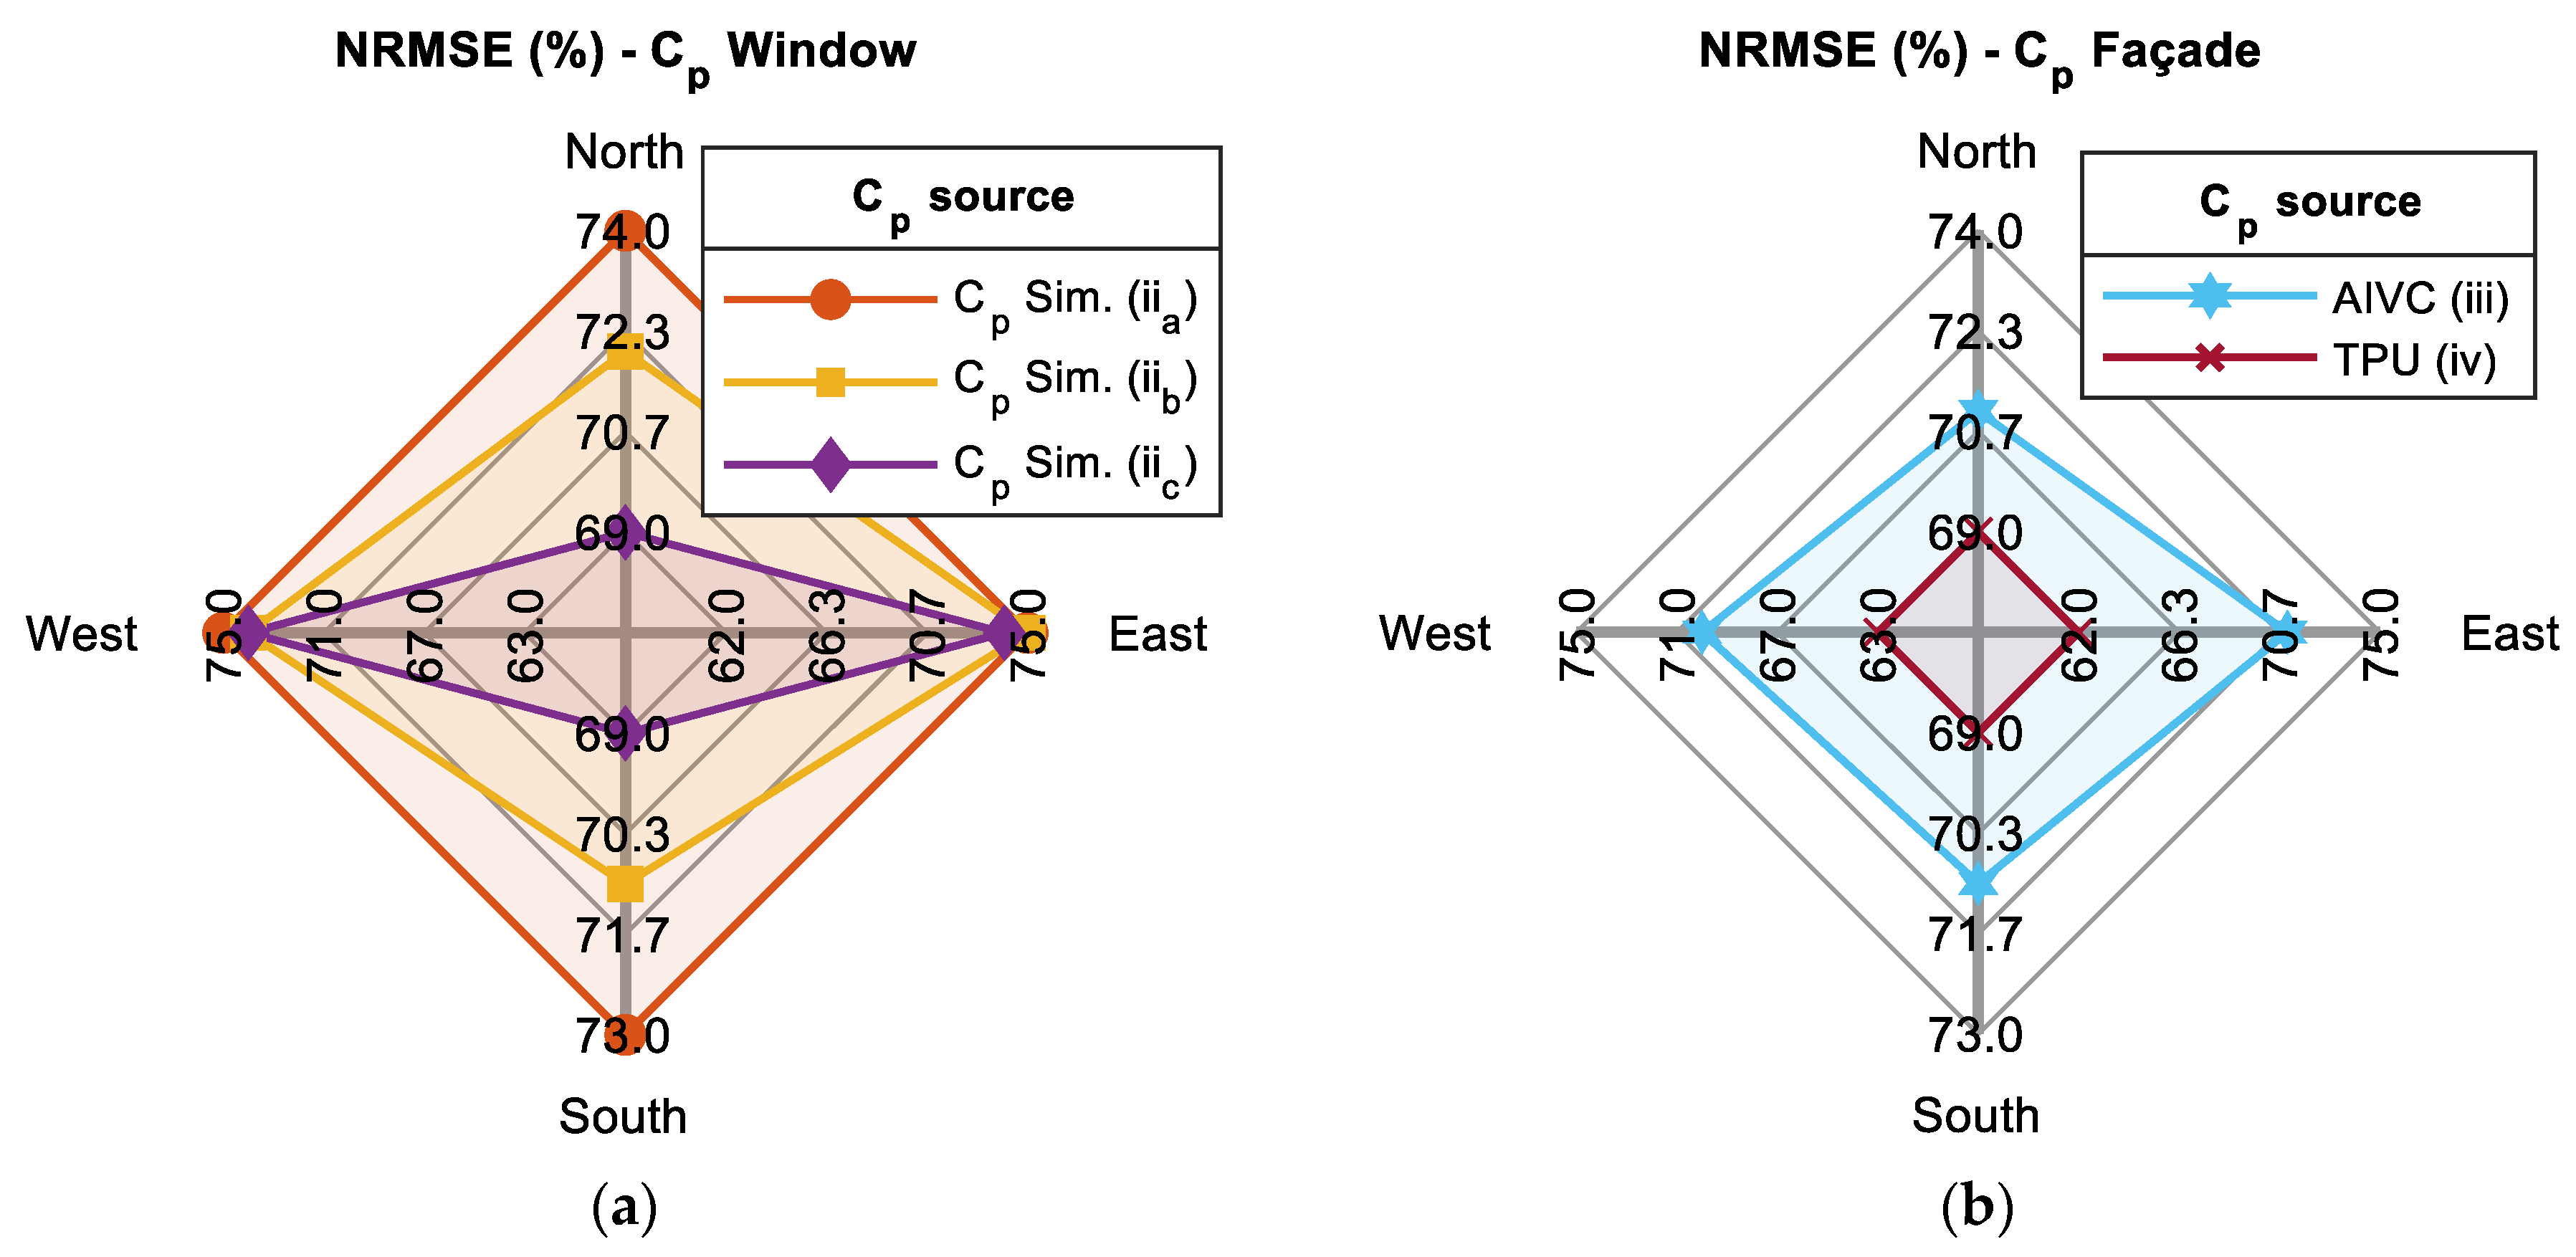
The NRMSE values of the three C p sources were estimated as a function of the C p default values (i), calculated within the E+ source code, to understand the output data’s sensitivity (Temperature and ACH) concerning the different C p s used in the investigation. For this task, only the wind directions whose data can be found in all sources were considered (θ = 0°, θ = 90°, θ = 180°, θ = 270°). Figure 6 shows the differences between the C p values for each façade, considering the different sources/calculation methods: C p values avareged over windows (6a) and façades (6b). Table 5 presents the NRMSE values for the temperature and ACH data from the E+ AFN simulations, which are grouped in zones according to their orientation.
The C p values obtained by the cloud-based platform (iia–c) differ between 68% and 75% from those estimated by the analytical model implemented in the E+ AFN. The suburban terrain type (iic), which has the highest aerodynamic surface roughness values, showed the greatest difference among the façades’ C p values. Meanwhile, the secondary sources’ values vary between 63% to 66% (TPU) and between 69% to 71% (AIVC); however, these variations do not appear to have the same magnitude in the temperatures and airflow rates calculated by the numerical models. Except for the Cellar’s ACH values estimated by the Cp simulator models, which were around 120%, all other rooms’ ACH values coincided with those obtained using secondary sources. Furthermore, the impact of the different terrain categories was also minimal.
Moreover, minor differences between the compared C p values do not necessarily mean a minor error when analyzing output data. This linear relation happens for the Living room (LV) for the south (wall with the biggest porosity) and west façades’ C p s. Nevertheless, this does not occur for the north façade and the Cellar, which is a smaller room with a small window, especially for the ACH. Therefore, when analyzing natural ventilation in multizone buildings, a closer relationship between the C p values and the predicted temperature and ACH in the rooms with cross ventilation can be noted, which is different from the single-sided ventilated spaces that present a more non-linear behaviou.

6. NVE Effectiveness

Figure 7 presents the percentage of time for which the investigated I-MA spaces could rely on outdoor airflow to maintain their comfortable temperatures, considering the four C p sources mentioned in Section 5 and the 4392 (April–September) hours ( n ), separated according to the source type (primary or secondary) and the area in which the pressure coefficients are computed (Figure 7a—window and Figure 7b—façade). The rooms on the first floor (Bedrooms 1–3) present more NVE hours than on the ground floor, regardless of the C p source. This is because the wind speed increases with the height, and therefore, the airflow on the upper floors is greater. The effect has been studied in high buildings [97], which benefit from wind cooling effectiveness and provide indoor comfort and energy savings. In this light, Bedroom 2 has the best wind-driven natural ventilation effectiveness. While the NV strategy can be used almost 80% of the investigated time in Bedroom 2 (more than 3400 h), this number drops to about 76% (≈3330 h), 70% (≈3050 h), and 60% (2600 h–2750 h) for Bedrooms 3 and 1 and the Living room, respectively.
In addition, the highest NVE values found, considering most of the zones analyzed, were calculated with the E+ model, which uses an analytical model to determine the C p s (i—default values). This indicates an airflow overestimation and, consequently, the effectiveness of natural ventilation under the method implemented in the E+ AFN, a phenomenon also observed by Dogan and Kastner in [79]. The correlated C p sources also showed a similar NVE result. The secondary sources, iii and iv (Figure 7b), estimated an NVE varying between 60 and 80% for the hours considered, depending on the zone. Moreover, the primaries iia–c (Figure 7a), which used the C p s calculated by the cloud-based platform, are similar to each other, with the difference between the NVEs of Bedroom 1 varying by less than 3%.
To analyze the impact on NVE performance, given the different C p indices considered, Figure 8a shows the NVE of each zone in relation to the total number of hours (absolute value), while Figure 8b plots these results in relation to the NVE default values estimated by the analytical model implemented in the E+ AFN (i).
The effects of the C p s on the NVE performance metric can thus be seen in absolute values (Figure 8a), and it is also possible to analyze which rooms yielded the most or least hours in which NV can be used in relation to the default values (i), for each of the C p s investigated. As in Figure 7, the best performances can be seen in the rooms on the first floor. However, when analyzing the differences in NVE found for the different C p s compared to the default values, there is a greater variation for the living room, which is the space with the largest window area.
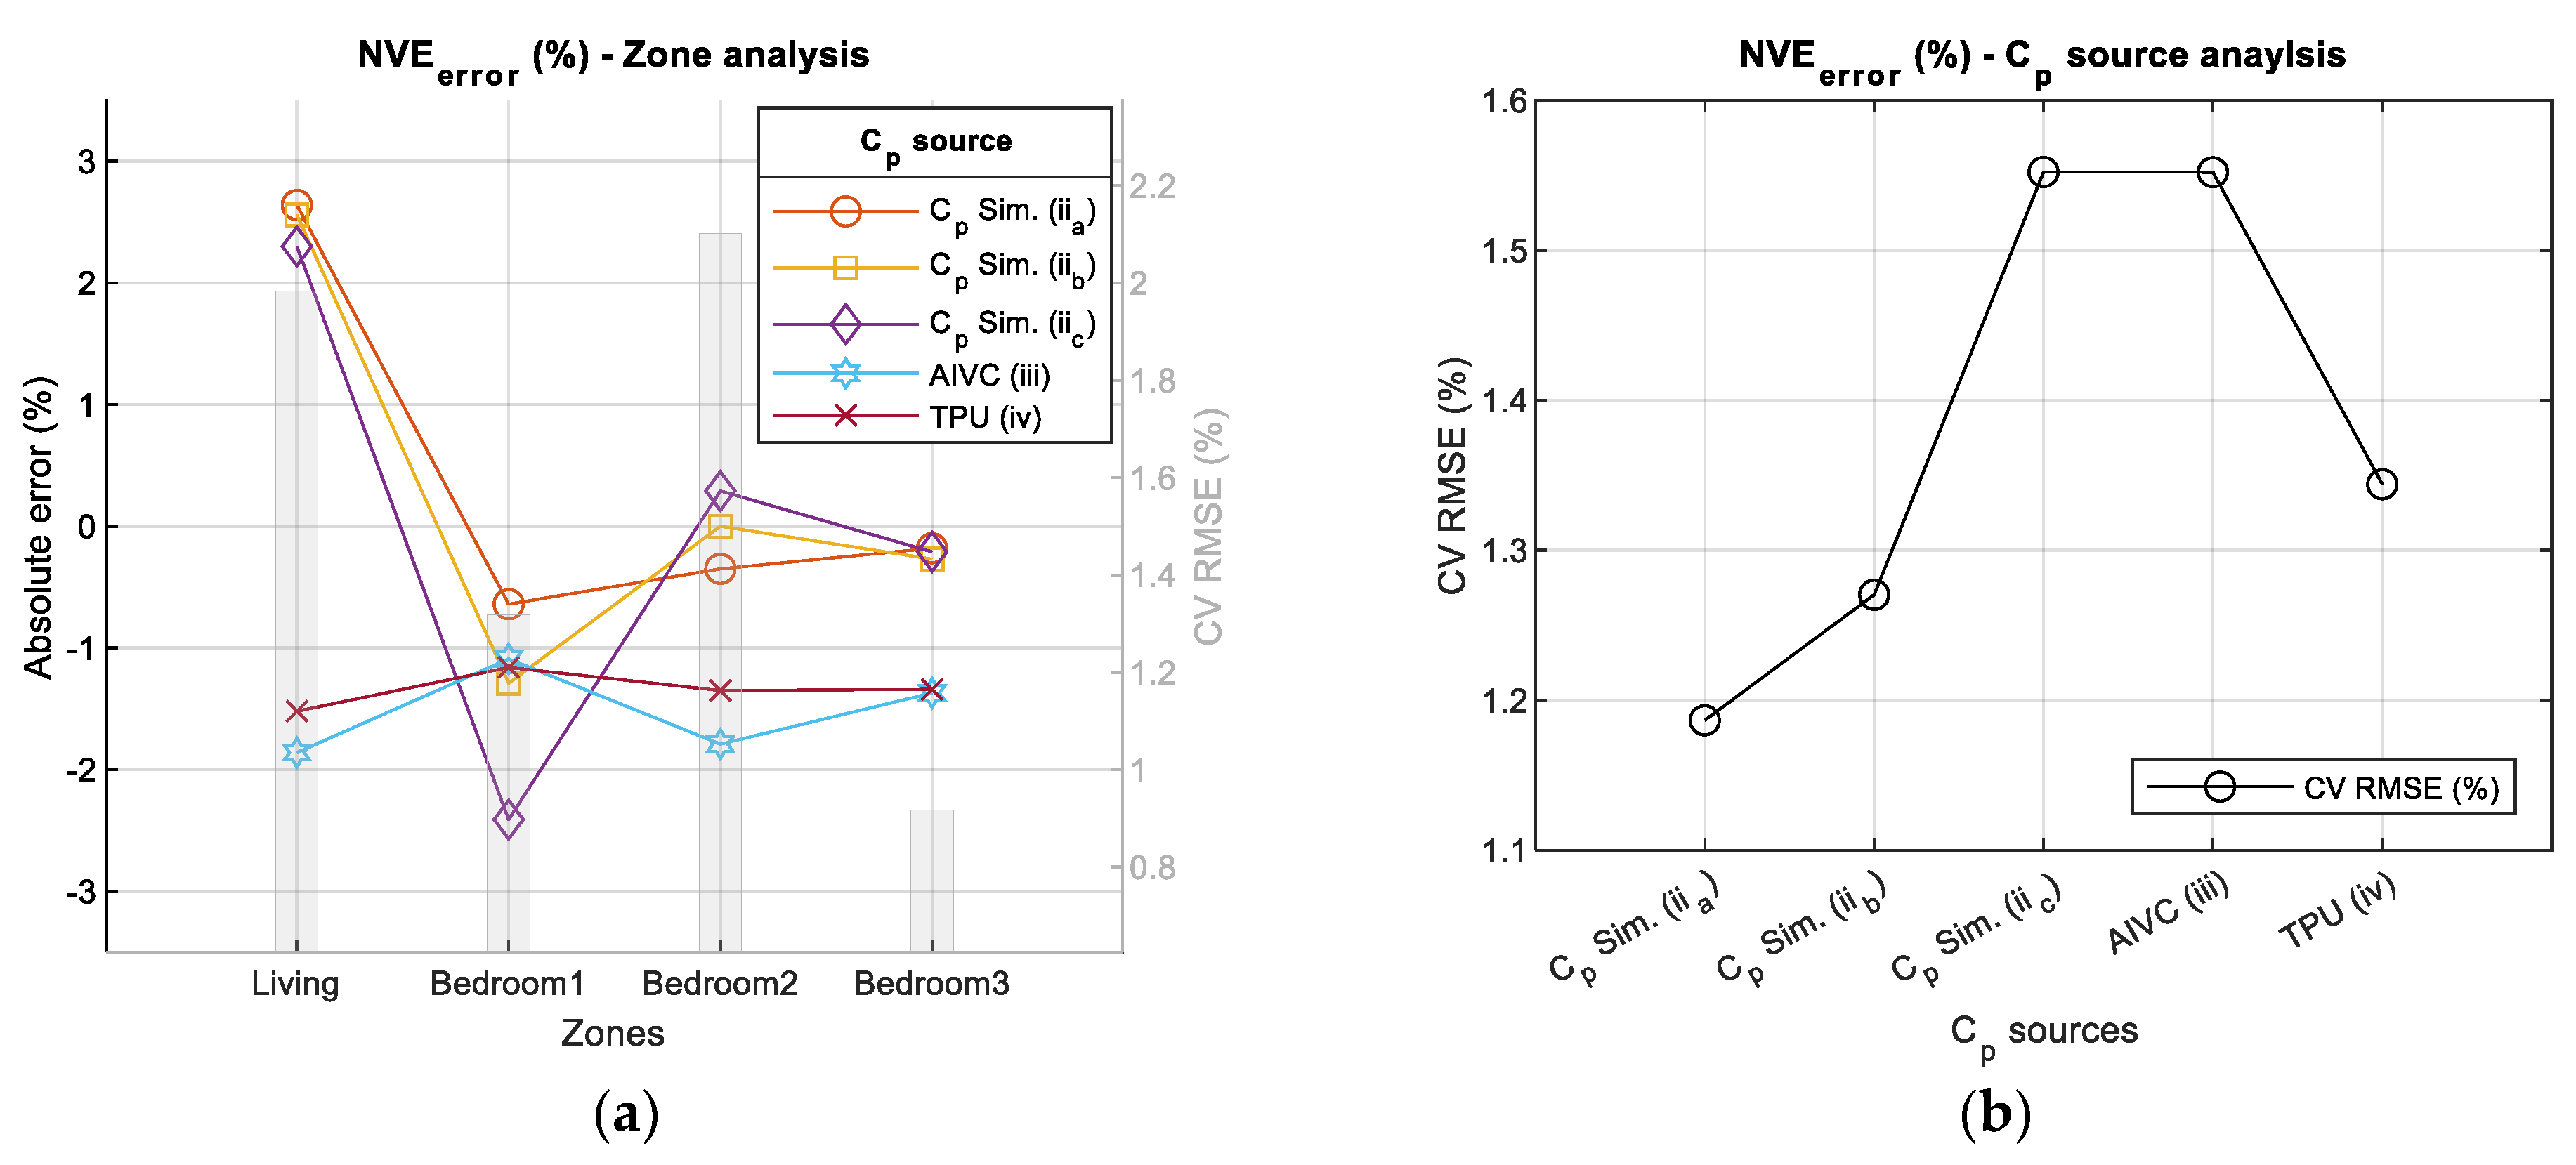
Furthermore, the influence of the C p sources used in the E+ AFN models on the NVE results can also be observed in Figure 9. Figure 9a shows the difference or error between the five NVE results (%) regarding the NVE values calculated with the E+ C p values (i—default) for each room and its respective CV (RMSE). Figure 9b shows the CV (RMSE) values of the five C p sources used to estimate NVE, in relation to i (default).
In general, the three primary C p sources considered (iia–c, iii and iv) show similar behaviors when compared to the NVE calculated with the E+ C p “auto-calculated” values (i)—Figure 9a. The error between NVEs and the reference is relatively low, with values close to +3% for the living room, with ACH values calculated from the CpSimulator cases (iia–c). Case iic (CpSimulator—suburban terrain type) and Case iii (secondary source—AIVC) show the biggest variations in relation to the NVE calculated using E+ AFN default values (Figure 9b).
This slight impact of the C p ’s on the metric is justified by the building’s characteristics under investigation: low–high, with a rectangular shape. Before the existence of platforms such as CpSimulator, it might have been thought that in cases like the I-MA building, it would be feasible to rely on the analytical model within E+ AFN for ACH calculations, considering the practicality and reliability of the resource, mainly because of the computational cost of CFD simulations. However, since the platform has been shown to be a reliable and practical C p source for NV modeling in real building design scenarios, providing results in a short time, non-CFD experts can be encouraged to include primary C p data in their E+ AFN models, improving the NVE investigations.

7. Research Constraints and Remarks

A variation between the C p sources used in the E+ AFN model was found, which directly impacts data output, especially airflow predictions. However, although the use of specific surface-averaged C p values means a more accurate airflow, its impact on the NVE performance metric was found to be insignificant in this study. This is because the reference case is a low and rectangular building. In the case of high-rise buildings and/or buildings with more complex geometries, NVE outcomes would have been more sensible to the different C p sources, as the C p values herein differ more significantly compared to the investigated building.
Moreover, some limiting factors can compromise natural ventilation use in buildings, such as high air pollution rates and noise, which were not considered in the investigations on NVE in this paper. As a relevant current issue, it has been the subject of other studies that explore the natural ventilation potential of particular regions [98,99,100,101,102,103]. The operation of this approach depends on climatic conditions and outside air quality.
Simultaneously, although air pollution is a critical factor nowadays, some policies and actions aim to change this reality [104]. Some examples include ways to filter/clean up the air within cities, or develop and implement clean energy usage with new technologies such as electric cars, which directly contribute to better air quality levels and, therefore, can support natural ventilation as a cooling strategy.
Finally, it is notable that although the reference model is in France, the American standard ASHRAE 62.1 was used to calculate the Minimum Airflow Rates (item 3.1) for the Natural Ventilation Effectiveness (NVE) metric, as this is the one adopted in the methodology on which this article is based. Therefore, in future studies using the I-MA building, a European standard will be used to assess the NVE and thus verify the impact of this threshold on the performance metric.

8. Conclusions

This paper presents the Natural Ventilation Effectiveness (NVE), a performance metric that verifies through AFN building energy simulations (BES) the circumstances in which wind-driven ventilation would be sufficient to provide the indoor environment within the target comfort. An experimental house and a measurement campaign were defined as references, following the minimum airflow rate thresholds recommended by the ventilation standard ASHRAE 62.1. The available airflow rates when predicting NVE were calculated by an AFN EnergyPlus model and four different C p sources, including CFD simulations, analytical models, and databases. The results related to the investigations on wind pressure coefficients and natural ventilation effectiveness lead to the following conclusions:
  • The method of applying the Natural Ventilation Effectiveness (NVE) as a performance metric supports the design of naturally ventilated buildings. It provides quantitative data on NV performance and offers interactive feedback during project development based on BES airflow networks;
  • The cloud-based platform (CpSimulator) appears to be a reliable C p source, representing a significant contribution to the BES community. It allows for the generation of primary wind pressure coefficient data for natural ventilation investigations (AFN E+) by employing external CFD resources. Thus, researchers and designers are better assisted when making preliminary design decisions for buildings with natural ventilation;
  • The impact of different C p values on NVE performance was only 3% for the small building used in this study. In such cases, using secondary sources, such as the one implemented in E+ AFN, seems to be more convenient. Primary sources may be required for more complex buildings, which can be more easily obtained through the CpSimulator platform, for example.

Author Contributions

Conceptualization, N.R.M.S. and H.G.; formal analysis, N.R.M.S. and F.I.H.S.; investigation, N.R.M.S. and J.C.C.; methodology, N.R.M.S. and N.A.; visualization, N.R.M.S. and F.I.H.S.; resources, N.R.M.S. and J.F.; supervision, J.C.C., J.F. and H.G.; writing—original draft, N.R.M.S.; writing—review and editing, J.C.C., F.I.H.S., N.A. and J.F.; project administration, J.F. All authors have read and agreed to the published version of the manuscript.

Funding

The authors are grateful for the financial support from the FAPEMIG—Minas Gerais State Agency for Research and Development (APQ-00872-22—Edital N° 001/2022—DEMANDA UNIVERSAL). The authors are grateful for the support in the framework of the Wall-ACE project, which has received funding from the European Union’s Horizon 2020 research and innovation programme: Project Wall-ACE, Grant Agreement No 723574. The APC was funded by the University of Stuttgart.

Data Availability Statement

The original contributions presented in the study are included in the article, further inquiries can be directed to the corresponding author.

Acknowledgments

This research was possible thanks to the contributions of the French National Institute for Solar Energy (INES, France), the Universidade Federal dos Vales do Jequitinhonha e Mucuri (UFVJM, Brazil), the Materialprüfungsanstalt Universität Stuttgart (MPA, Germany), and the Transsolar Energietechnik GmbH (Transsolar KlimaEngineering, Germany), which collectively supported this work.

Conflicts of Interest

Author Nadir Abdessemed was employed by the company Transsolar Energietechnik GmbH. The remaining authors declare that the research was conducted in the absence of any commercial or financial relationships that could be construed as a potential conflict of interest.

Abbreviations

NV, natural ventilation; BES, building energy simulation; AFN, airflow network; CFD, Computational Fluid Dynamic; C p , wind pressure coefficients; AIVC, Air Infiltration and Ventilation Centre; TPU, Tokyo Polytechnic University; ANN, artificial neural networks; NVE, Natural Ventilation Effectiveness; HVAC, heating, ventilation, and air conditioning; nZEBs, net-zero energy buildings; ACH, air change per hour; INES, French National Institute for Solar Energy; E+, EnergyPlus; NMBE, Normalized Mean Bias Error; CV RMSE, Coefficient of Variation of the Root Mean Square Error; GOF, Goodness-of-fit; ABL, atmospheric boundary layer; idf, input data file; CSV, comma-separated values; VTK, Visualization Toolkit file.

References

  1. de Bortoli, K.C.R.; de Paula Resende, V.F.; Carlo, J.C.; Villa, S.B. Thermal comfort and air renewal in social housing: A case study in Uberlândia, Brazil. Eng. Sci. 2023, 12, 1–24. [Google Scholar] [CrossRef]
  2. Yoon, N.; Piette, M.A.; Han, J.M.; Wu, W.; Malkawi, A. Optimization of Window Positions for Wind-Driven Natural Ventilation Performance. Energies 2020, 13, 2464. [Google Scholar] [CrossRef]
  3. Martins, N.R.; da Graça, G.C. Validation of numerical simulation tools for wind-driven natural ventilation design. Build. Simul. 2016, 9, 75–87. [Google Scholar] [CrossRef]
  4. Brambilla, A.; Bonvin, J.; Flourentzou, F.; Jusselme, T. On the Influence of Thermal Mass and Natural Ventilation on Overheating Risk in Offices. Buildings 2018, 8, 47. [Google Scholar] [CrossRef]
  5. Nomura, M.; Hiyama, K. A review: Natural ventilation performance of office buildings in Japan. Renew. Sustain. Energy Rev. 2017, 74, 746–754. [Google Scholar] [CrossRef]
  6. Chen, Q. Ventilation performance prediction for buildings: A method overview and recent applications. Build. Environ. 2009, 44, 848–858. [Google Scholar] [CrossRef]
  7. Yoon, N.; Norford, L.; Malkawi, A.; Samuelson, H.; Piette, M.A. Dynamic metrics of natural ventilation cooling effectiveness for interactive modeling. Build. Environ. 2020, 180, 106994. [Google Scholar] [CrossRef]
  8. Karava, P.; Stathopoulos, T.; Athienitis, A.K. Airflow assessment in cross-ventilated buildings with operable façade elements. Build. Environ. 2011, 46, 266–279. [Google Scholar] [CrossRef]
  9. Shen, X.; Zhang, G.; Bjerg, B. Comparison of different methods for estimating ventilation rates through wind driven ventilated buildings. Energy Build. 2012, 54, 297–306. [Google Scholar] [CrossRef]
  10. Tan, G.; Glicksman, L.R. Application of integrating multi-zone model with CFD simulation to natural ventilation prediction. Energy Build. 2005, 37, 1049–1057. [Google Scholar] [CrossRef]
  11. Asfour, O.S.; Gadi, M.B. A comparison between CFD and Network models for predicting wind-driven ventilation in buildings. Build. Environ. 2007, 42, 4079–4085. [Google Scholar] [CrossRef]
  12. Blocken, B. LES over RANS in building simulation for outdoor and indoor applications: A foregone conclusion? Build. Simul. 2018, 11, 821–870. [Google Scholar] [CrossRef]
  13. Sakiyama, N.; Carlo, J.C.; Frick, J.; Garrecht, H. Perspectives of naturally ventilated buildings: A review. Renew. Sustain. Energy Rev. 2020, 130, 109933. [Google Scholar] [CrossRef]
  14. Zhai, Z. Application of Computational Fluid Dynamics in Building Design: Aspects and Trends. Indoor Built Environ. 2006, 15, 305–313. [Google Scholar] [CrossRef]
  15. Singh, M.; Sharston, R. A literature review of building energy simulation and computational fluid dynamics co-simulation strategies and its implications on the accuracy of energy predictions. Build. Serv. Eng. Res. Technol. 2022, 43, 113–138. [Google Scholar] [CrossRef]
  16. Coakley, D.; Raftery, P.; Keane, M. A review of methods to match building energy simulation models to measured data. Renew. Sustain. Energy Rev. 2014, 37, 123–141. [Google Scholar] [CrossRef]
  17. Wang, H.; Zhai, Z. Advances in Building Simulation and Computational Techniques: A Review between 1987 and 2014. Energy Build. 2016, 128, 319–335. [Google Scholar] [CrossRef]
  18. Lee, B. Building Energy Simulation and the Design of Sustainable and Resilient Buildings. In Sustainable Real Estate: Multidisciplinary Approaches to an Evolving System; Springer: Berlin/Heidelberg, Germany, 2019. [Google Scholar]
  19. Cóstola, D.; Blocken, B.; Hensen, J. Overview of pressure coefficient data in building energy simulation and airflow network programs. Build. Environ. 2009, 44, 2027–2036. [Google Scholar] [CrossRef]
  20. Yoon, N.; Malkawi, A. Predicting the effectiveness of wind-driven natural ventilation strategy for interactive building design. In Proceedings of the 15th International Building Simulation Conference, San Francisco, CA, USA, 7–9 August 2017; pp. 2163–2170. [Google Scholar]
  21. Cóstola, D.; Blocken, B.; Ohba, M.; Hensen, J. Uncertainty in airflow rate calculations due to the use of surface-averaged pressure coefficients. Energy Build. 2010, 42, 881–888. [Google Scholar] [CrossRef]
  22. Ramponi, R.; Angelotti, A.; Blocken, B. Energy saving potential of night ventilation: Sensitivity to pressure coefficients for different European climates. Appl. Energy 2014, 123, 185–195. [Google Scholar] [CrossRef]
  23. Heijmans, N.; Wouters, P. Impact of the uncertainties on wind pressures on the prediction of thermal comfort performances. In Principles of Hybrid Ventilation (ed. P. Heiselberg); IEA ECBCS Annex: Paris, France, 2002. [Google Scholar]
  24. Clark, J.D.; Less, B.D.; Dutton, S.M.; Walker, I.S.; Sherman, M.H. Efficacy of occupancy-based smart ventilation control strategies in energy-efficient homes in the United States. Build. Environ. 2019, 156, 253–267. [Google Scholar] [CrossRef]
  25. Fernandes, M.S.; Rodrigues, E.; Gaspar, A.R.; Costa, J.J.; Gomes, Á. The contribution of ventilation on the energy performance of small residential buildings in the Mediterranean region. Energy 2020, 191, 116577. [Google Scholar] [CrossRef]
  26. Guillén-Lambea, S.; Rodríguez-Soria, B.; Marín, J.M. Review of European ventilation strategies to meet the cooling and heating demands of nearly zero energy buildings (nZEB)/Passivhaus. Comparison with the USA. Renew. Sustain. Energy Rev. 2016, 62, 561–574. [Google Scholar] [CrossRef]
  27. Clausen, G. Ventilation, Good Indoor Air Quality and Rational Use of Energy; European Collaborative Action Urban Air, Indoor Environment and Human Exposure EUR-20741-EN, Luxembourg, 2003. Available online: http://bookshop.europa.eu/en/-pbLBNA20741/ (accessed on 2 September 2024).
  28. ANVISA. Resolução RE/ANVISA nº 176 de 24 de Outubro de 2000 (176). Available online: https://www.saude.mg.gov.br/images/documentos/RES_176.pdf (accessed on 16 February 2021).
  29. DIN EN. 16798-1; Indoor Environmental Input Parameters for Design and Assessment of Energy Performance of Buildings—Addressing Indoor Air Quality, Thermal Environment, Lighting and Acoustics. Beuth Verlag GmbH: Berlin, Germany, 2019.
  30. D2 National Building Code of Finland Ministry of the Environment, Department of Built Environment. Indoor Climate and Ventilation for Buildings: Regulations and Guidelines 2012. Available online: http://www.puntofocal.gov.ar/notific_otros_miembros/fin41_t.pdf (accessed on 2 September 2024).
  31. Légifrance. Arrêté du 24 Mars 1982 Relatif à L’aération des Logements. Available online: https://www.legifrance.gouv.fr/loda/id/JORFTEXT000000862344/ (accessed on 16 February 2021).
  32. DIN. EN. 1946-6:2019-12; Ventilation and Air Conditioning—Part 6: Ventilation for Residential Buildings—General Requirements, Requirements for Design, Construction, Commissioning and Handover as well as Maintenance. Beuth Verlag GmbH: Berlin, Germany, 2019.
  33. Dimitroulopoulou, C. Ventilation in European dwellings: A review. Build. Environ. 2012, 47, 109–125. [Google Scholar] [CrossRef]
  34. Cook, M.; Shukla, Y.; Rawal, R.; Loveday, D.; Faria, L.C.; Angelopoulos, C. Low Energy Cooling and Ventilation for Indian Residences: Design Guide. 2020. Available online: https://carbse.org/low_energy_cooling_and_ventilation_for_indian_residences (accessed on 5 January 2021).
  35. Appolloni, L.; D’Amico, A.; Raffo, M.; Capasso, L. Hygienic and sanitary standards of housing in Europe: A comparative analysis of nine countries. Ann. Ig. 2020, 32, 52–65. [Google Scholar] [CrossRef] [PubMed]
  36. Norwegian Building Authorities. Report NO. HO-2/93. Indoor Climate and Energy Consumption; Norwegian Building Authorities: Oslo, Norway, 1993. [Google Scholar]
  37. Feist, W.; Pfluger, R.; Kaufmann, B.; Schnieders, J.; Kah, O. Passivhaus Projektierungs Paket 2007. 2007. Available online: https://passiv.de/de/04_phpp/04_phpp.htm (accessed on 2 September 2024).
  38. Moreno-Rangel, A.; Sharpe, T.; McGill, G.; Musau, F. Indoor Air Quality in Passivhaus Dwellings: A Literature Review. Int. J. Environ. Res. Public Health 2020, 17, 4749. [Google Scholar] [CrossRef]
  39. IPQ. NP 1037-1; Ventilação e Evacuação dos Produtos da Combustão dos Locais com Aparelhos a Gás Parte 1: Edifícios de Habitação. Ventilação Natural; Instituto Português da Qualidade, 2002 (1037-1). Available online: https://protecaocivil.sintra.pt/images/servico-municipal-de-protecao-civil/legislacao/gaz/NP_1037-1_Ventilacao_produtos_combustao_aparelhos_gas-Ventilacao_natural.pdf (accessed on 16 February 2021).
  40. Boverket—Swedish National Board of Housing, Building and Planning. Boverket’s Building Regulations—Mandatory Provisions and General Recommendations, BBR: BFS 2011:6 with Amendments up to BFS 2018:4; Sweden. Available online: https://www.boverket.se/globalassets/publikationer/dokument/2019/bbr-2011-6-tom-2018-4-english-2.pdf (accessed on 17 February 2021).
  41. HM Government, Approved Document F—Ventilation. 2010. Available online: https://www.gov.uk/government/publications/ventilation-approved-document-f (accessed on 17 February 2021).
  42. ASHRAE. 62.1 Ventilation for Acceptable Indoor Air Quality; ASHRAE: Peachtree Corners, GA, USA, 2019. [Google Scholar]
  43. Buonanno, G.; Ricolfi, L.; Morawska, L.; Stabile, L. Increasing ventilation reduces SARS-CoV-2 airborne transmission in schools: A retrospective cohort study in Italy’s Marche region. Front. Public Health 2022, 10, 1087087. [Google Scholar] [CrossRef] [PubMed]
  44. Morawska, L.; Tang, J.W.; Bahnfleth, W.; Bluyssen, P.M.; Boerstra, A.; Buonanno, G.; Cao, J.; Dancer, S.; Floto, A.; Franchimon, F.; et al. How can airborne transmission of COVID-19 indoors be minimised? Environ. Int. 2020, 142, 105832. [Google Scholar] [CrossRef]
  45. Sundell, J.; Levin, H.; Nazaroff, W.W.; Cain, W.S.; Fisk, W.J.; Grimsrud, D.T.; Gyntelberg, F.; Li, Y.; Persily, A.K.; Pickering, A.C.; et al. Ventilation rates and health: Multidisciplinary review of the scientific literature. Indoor Air 2011, 21, 191–204. [Google Scholar] [CrossRef]
  46. Chenari, B.; Dias Carrilho, J.; Gameiro da Silva, M. Towards sustainable, energy-efficient and healthy ventilation strategies in buildings: A review. Renew. Sustain. Energy Rev. 2016, 59, 1426–1447. [Google Scholar] [CrossRef]
  47. Carrer, P.; Wargocki, P.; Fanetti, A.; Bischof, W.; Oliveira Fernandes, E.d.; Hartmann, T.; Kephalopoulos, S.; Palkonen, S.; Seppänen, O. What does the scientific literature tell us about the ventilation–health relationship in public and residential buildings? Build. Environ. 2015, 94, 273–286. [Google Scholar] [CrossRef]
  48. Aynsley, R.; Shiel, J.J. Ventilation strategies for a warming world. Archit. Sci. Rev. 2017, 60, 249–254. [Google Scholar] [CrossRef]
  49. Schoen, L.J. Guidance for Building Operations during the COVID-19 Pandemic. Available online: https://www.ashrae.org/file%20library/technical%20resources/ashrae%20journal/2020journaldocuments/72-74_ieq_schoen.pdf (accessed on 2 September 2024).
  50. Chitaru, G.-M.; Istrate, A.; Catalina, T. Numerical analysis of the impact of natural ventilation on the Indoor Air Quality and Thermal Comfort in a classroom. E3S Web Conf. 2019, 111, 1023. [Google Scholar] [CrossRef]
  51. Aviv, D.; Chen, K.W.; Teitelbaum, E.; Sheppard, D.; Pantelic, J.; Rysanek, A.; Meggers, F. A fresh (air) look at ventilation for COVID-19: Estimating the global energy savings potential of coupling natural ventilation with novel radiant cooling strategies. Appl. Energy 2021, 292, 116848. [Google Scholar] [CrossRef]
  52. Persily, A. Challenges in Developing Ventilation and Indoor Air Quality Standards: The Story of ASHRAE Standard 62. Build. Environ. 2015, 91, 61–69. [Google Scholar] [CrossRef]
  53. ASHRAE. 62.1—Ventilation and Acceptable Indoor Air Quality; ASHRAE: Peachtree Corners, GA, USA, 2022. [Google Scholar]
  54. Zhai, Z.; Mankibi, M.E.; Zoubir, A. Review of Natural Ventilation Models. Energy Procedia 2015, 78, 2700–2705. [Google Scholar] [CrossRef]
  55. Walton, G.N. NISTIR 89-4072; AIRNET—A Computer Program for Building Airflow Network Modeling. National Institute of Standards and Technology: Gaithersburg, MD, USA, 1989.
  56. Chu, C.R.; Chiu, Y.-H.; Chen, Y.-J.; Wang, Y.-W.; Chou, C.-P. Turbulence effects on the discharge coefficient and mean flow rate of wind-driven cross-ventilation. Build. Environ. 2009, 44, 2064–2072. [Google Scholar] [CrossRef]
  57. Chu, C.-R.; Wang, Y.-W. The loss factors of building openings for wind-driven ventilation. Build. Environ. 2010, 45, 2273–2279. [Google Scholar] [CrossRef]
  58. Flourentzou, F.; van der Maas, J.; Roulet, C.-A. Natural ventilation for passive cooling: Measurement of discharge coefficients. Energy Build. 1998, 27, 283–292. [Google Scholar] [CrossRef]
  59. Karava, P.; Stathopoulos, T.; Athienitis, A.K. Wind driven flow through openings—A review of discharge coefficients. Int. J. Vent. 2004, 3, 255–266. [Google Scholar] [CrossRef]
  60. Costola, D.; Etheridge, D.W. Unsteady natural ventilation at model scale—Flow reversal and discharge coefficients of a short stack and an orifice. Build. Environ. 2008, 43, 1491–1506. [Google Scholar] [CrossRef]
  61. Fernandes, L.; Friedrich, M.; Cóstola, D.; Matsumoto, E.; Labaki, L.; Wellershoff, F. Evaluation of discharge coefficients of large openable windows using full-scale samples in wind tunnel tests//Evaluación de los coeficientes de descarga de grandes ventanas que se pueden abrir utilizando muestras a escala real en ensayos en túneles de viento. Rev. Ing. Construcción 2020, 35, 203–2014. [Google Scholar] [CrossRef]
  62. Cruz, H.; Viegas, J.C. On-site assessment of the discharge coefficient of open windows. Energy Build. 2016, 126, 463–476. [Google Scholar] [CrossRef]
  63. Shirzadi, M.; Mirzaei, P.A.; Naghashzadegan, M. Development of an adaptive discharge coefficient to improve the accuracy of cross-ventilation airflow calculation in building energy simulation tools. Build. Environ. 2018, 127, 277–290. [Google Scholar] [CrossRef]
  64. Martin, W. Liddament. Air Infiltration Calculation Techniques—An Application Guide; The Air Infiltration and Ventilation Centre: Ghent, Belgium, 1986. [Google Scholar]
  65. Charisi, S.; Thiis, T.; Aurlien, T. Full-Scale Measurements of Wind-Pressure Coefficients in Twin Medium-Rise Buildings. Buildings 2019, 9, 63. [Google Scholar] [CrossRef]
  66. ASHRAE. ASHRAE Handbook—Fundamentals: Airflow around Buildings; ASHRAE: Peachtree Corners, GA, USA, 2005. [Google Scholar]
  67. Tokyo Polytechnic University. Aerodynamic Database for Low-Rise Buildings. Available online: http://www.wind.arch.t-kougei.ac.jp/info_center/windpressure/lowrise/g080627%7F%7F.html (accessed on 22 December 2020).
  68. Swami, M.V.; Chandra, S. Procedures for Calculating Natural Ventilation Airflow Rates in Buildings; University of Central Florida: Orlando, FL, USA, 1987. [Google Scholar]
  69. Grosso, M. Modelling wind pressure distribution on buildings for passive cooling. In Proceedings of the International Conference Solar Energy in Architecture and Urban Planning, Florence, Italy, 17–21 May 1993. [Google Scholar]
  70. Grosso, M.; Mariano, D.; Parisi, E. Wind pressure distribution on flat and tilted roofs: A parametrical model. In Proceedings of the European Conference on Energy Performance and Indoor Climate in Buildings, Lyon, France, 24–26 November 1994; pp. 167–172. [Google Scholar]
  71. Grosso, M. Wind pressure distribution around buildings: A parametrical model. Energy Build. 1992, 1992, 101–131. [Google Scholar] [CrossRef]
  72. Feustel, H.E. COMIS—An international multizone air-flow and contaminant transport model. Energy Build. 1999, 3–18. [Google Scholar] [CrossRef]
  73. Knoll, B.; Phaff, J.C.; de Gids, W.F. Pressure simulation program. In Implementing the results of ventilation research. In Proceedings of the 16th AIVC Conference, Palm Springs, CA, USA, 19–22 September 1995. [Google Scholar]
  74. Muehleisen, R.T.; Patrizi, S. A new parametric equation for the wind pressure coefficient for low-rise buildings. Energy Build. 2013, 57, 245–249. [Google Scholar] [CrossRef]
  75. Bre, F.; Gimenez, J.M.; Fachinotti, V.D. Prediction of wind pressure coefficients on building surfaces using artificial neural networks. Energy Build. 2018, 158, 1429–1441. [Google Scholar] [CrossRef]
  76. Belleri, A.; Lollini, R.; Dutton, S.M. Natural ventilation design: An analysis of predicted and measured performance. Build. Environ. 2014, 81, 123–138. [Google Scholar] [CrossRef]
  77. Charisi, S.; Waszczuk, M.; Thiis, T.K. Determining building-specific wind pressure coefficients to account for the microclimate in the calculation of air infiltration in buildings. Adv. Build. Energy Res. 2019, 111, 1–22. [Google Scholar] [CrossRef]
  78. Charisi, S.; Waszczuk, M.; Thiis, T.K. Investigation of the pressure coefficient impact on the air infiltration in buildings with respect to microclimate. Energy Procedia 2017, 122, 637–642. [Google Scholar] [CrossRef]
  79. Dogan, T.; Kastner, P. Streamlined CFD Simulation Framework to Generate Wind-Pressure Coefficients on Building Facades for Airflow Network Simulations. Build. Simul. 2021, 14, 1189–1200. [Google Scholar] [CrossRef]
  80. Gimenez, J.M.; Bre, F.; Nigro, N.M.; Fachinotti, V. Computational modeling of natural ventilation in low-rise non-rectangular floor-plan buildings. Build. Simul. 2018, 11, 1255–1271. [Google Scholar] [CrossRef]
  81. King, M.-F.; Gough, H.L.; Halios, C.; Barlow, J.F.; Robertson, A.; Hoxey, R.; Noakes, C.J. Investigating the influence of neighbouring structures on natural ventilation potential of a full-scale cubical building using time-dependent CFD. J. Wind Eng. Ind. Aerodyn. 2017, 169, 265–279. [Google Scholar] [CrossRef]
  82. Kastner, P.; Dogan, T. A cylindrical meshing methodology for annual urban computational fluid dynamics simulations. J. Build. Perform. Simul. 2020, 13, 59–68. [Google Scholar] [CrossRef]
  83. Kastner, P.; Dogan, T. Eddy3D: A toolkit for decoupled outdoor thermal comfort simulations in urban areas. Build. Environ. 2022, 212, 108639. [Google Scholar] [CrossRef]
  84. Robert McNeel \& Associates, Seattle, WA. Rhinoceros 3D. Available online: https://www.rhino3d.com/ (accessed on 2 September 2024).
  85. Davidson, S. Grasshopper. Available online: https://www.rhino3d.com/learn/?query=kind:%20grasshopper&modal=null (accessed on 2 September 2024).
  86. Bre, F.; Gimenez, J.M. A cloud-based platform to predict wind pressure coefficients on buildings. Build. Simul. 2022, 15, 1507–1525. [Google Scholar] [CrossRef] [PubMed]
  87. Sakiyama, N.R.M.; Carlo, J.C.; Frick, J.; Garrecht, H. CFD-based wind pressure coefficients on building facades with Butterfly/OpenFOAM for airflow network models. In Proceedings of the IBPSA LATAM 2023—VII Congresso Latino-Americano de Simulação de Edifícios, Florianópolis, Brazil, 9–10 March 2023; pp. 195–199, ISBN 978-65-992964-4-4. [Google Scholar]
  88. OpenCFD Ltd. OpenFOAM; OpenCFD: London, UK, 2024. [Google Scholar]
  89. ASHRAE. Thermal Environmental Conditions for Human Occupancy; ASHRAE: Peachtree Corners, GA, USA, 2013; p. 55. [Google Scholar]
  90. Sakiyama, N.; Mazzaferro, L.; Carlo, J.C.; Bejat, T.; Garrecht, H. Natural ventilation potential from weather analyses and building simulation. Energy Build. 2020, 231, 110596. [Google Scholar] [CrossRef]
  91. U.S. Department of Energy. EnergyPlus; U.S. Department of Energy: Washington, DC, USA, 2019.
  92. Gu, L. Airflow network modeling in energyplus. In Proceedings of the Building Simulation 2007, 10th IBPSA Conference, Beijing, China, 3–6 September 2007; pp. 964–971. [Google Scholar]
  93. Coakley, D. Calibration of Detailed Building Energy Simulation Models using an Analytical Optimisation Approach. Ph.D. Thesis, University of Galway Theses, Galway, Ireland, 2013. [Google Scholar]
  94. ASHRAE. Guideline 14-2002: Measurement of Energy and Demand Savings; ASHRAE: Peachtree Corners, GA, USA, 2002. [Google Scholar]
  95. Zhang, Y. “Parallel” EnergyPlus and development of a parametric analysis tool. In Proceedings of the Building Simulation 2009; Eleventh International IBPSA Conference, Glasgow, Scotland, 27–30 July 2009; pp. 1382–1388. [Google Scholar]
  96. Zhang, Y.; Korolija, I. jEPlus—An EnergyPlus simulation manager for parametrics n.d. Available online: http://www.jeplus.org/wiki/doku.php (accessed on 2 September 2024).
  97. Loche, I.; Oliveira, K.d.; Oliveira, M.; Fracalanza, B.; Neves, L. Effects of balconies on the wind pressure coefficients of naturally ventilated high-rise office buildings. In Proceedings of the Symposium on Simulation for Architecture and Urban Design. SimAUD 2020: Symposum on Simulation in Architecture + Urban Design, online, 25–27 May 2020; pp. 365–372. [Google Scholar]
  98. Costanzo, V.; Yao, R.; Xu, T.; Xiong, J.; Zhang, Q.; Li, B. Natural ventilation potential for residential buildings in a densely built-up and highly polluted environment: A Case Study. Renew. Energy 2019, 138, 340–353. [Google Scholar] [CrossRef]
  99. Yang, F.; Kang, Y.; Gao, Y.; Zhong, K. Numerical simulations of the effect of outdoor pollutants on indoor air quality of buildings next to a street canyon. Build. Environ. 2015, 87, 10–22. [Google Scholar] [CrossRef]
  100. Tong, Z.; Chen, Y.; Malkawi, A.; Adamkiewicz, G.; Spengler, J.D. Quantifying the impact of traffic-related air pollution on the indoor air quality of a naturally ventilated building. Environ. Int. 2016, 89–90, 138–146. [Google Scholar] [CrossRef]
  101. Tong, Z.; Chen, Y.; Malkawi, A.; Liu, Z.; Freeman, R.B. Energy saving potential of natural ventilation in China: The impact of ambient air pollution. Appl. Energy 2016, 179, 660–668. [Google Scholar] [CrossRef]
  102. Nihar, K.; Nutkiewicz, A.; Jain, R.K. Natural ventilation versus air pollution: Assessing the impact of outdoor pollution on natural ventilation potential in informal settlements in India. Environ. Res. Infrastruct. Sustain. 2023, 3, 25002. [Google Scholar] [CrossRef]
  103. Chen, J.; Brager, G.S.; Augenbroe, G.; Song, X. Impact of outdoor air quality on the natural ventilation usage of commercial buildings in the US. Appl. Energy 2019, 235, 673–684. [Google Scholar] [CrossRef]
  104. Fudge, C.; Grant, M.; Wallbaum, H. Transforming cities and health: Policy, action, and meaning. Cities Health 2020, 4, 135–151. [Google Scholar] [CrossRef]
Figure 1. Flowchart to assess natural ventilation effectiveness.
Buildings 14 02803 g001
Figure 2. I-MA building. (a) Ground floor; (b) first floor; (c) section AA; (d) wind directions in 30° increments—Cp Simulator; (e) Reference building INCAS platform (weather station location); (f) I-MA experimental house.
Buildings 14 02803 g002
Figure 3. Occupancy schedule. (a) Weekdays; (b) weekends.
Buildings 14 02803 g003
Figure 4. Pressure coefficients from the Cp Simulator platform on the four exposed I-MA building façades for a southern wind direction (θ = 180°).
Buildings 14 02803 g004
Figure 5. Surface-averaged C p values for the I-MA facades given by AIVC (v) and Tokyo database (vi) and calculated through CFD simulations for the façades (ii). (a) North façade; (b) east façade; (c) south façade; (d) west façade.
Buildings 14 02803 g005
Figure 6. Comparison between the three C p sources (ii–iv) and the default values (i)—NRMSE (%). (a) Window C p values; (b) façade C p values.
Buildings 14 02803 g006
Figure 7. NVE (%) in the I-MA investigated spaces from April to September (4392 h) for each zone. (a) Window C p values; (b) façade C p values.
Buildings 14 02803 g007
Figure 8. NVE in the I-MA investigated spaces from April to September (4392 h) for each zone, considering the C p sources: (a) relative to the total hours; (b) relative to the default values (i).
Buildings 14 02803 g008
Figure 9. Differences from the NVE found within the different C p sources in relation to the NVE calculated with the AFN model, with C p values averaged over window areas: (a) Relative error r ; (b) CV (RMSE).
Buildings 14 02803 g009
Table 1. Recommended ventilation rate in different ventilation regulations.
Country/StateStandardWhole Building Ventilation Rates
BrazilANVISA—RE n° 176, de 24 de outubro de 2000 [28]The adequate air renewal rate for air conditioning environments (Workspaces):
(1) 27 m3/h person;
(2) 17 m3/h person for stores, shopping centers, and other places where the occupancy rate per m2 is critical.
EuropeEN 16798-1 [29]Continuous flow rate with occupancy:
(1) 0.42 L/s.m2;
(2) 7 L/s person in living and bedroom;
(3) 1 L/m2 for living and bedroom floor areas.
Without occupancy: 0.05 L/s.m2–0.1 L/s.m2
Finland NBC—D2 [30] >0.4 h−1
General rule: Outdoor airflow should be at least 0.35 L/s.m2
(1.26 m3/h.m2)
FranceArrêté du 24 Mars 1982. Modifié par arrêté du 28 octobre 1983 relatif à l’aération des logements [31]Continuous ventilation must be assured during winter
Total minimum flow assured for whole dwelling with regulation control device:
9.72 L/s (35 m3/h)–37.5 L/s (135 m3/h)—1- to 7-room house.
Total minimum flow assured for whole dwelling with mechanical ventilation and control device:
2.77 L/s (10 m3/h)–9.72 L/s (35 m3/h)—1- to 7-room house
GermanyDIN 1946-6 [32]Mechanical ventilation is required if the necessary air volume flow for moisture-proofing exceeds the infiltration air volume flow
Demand-controlled ventilation specifies four levels for fan air flow:
Pos 1, protection against humidity—
4.16 L/s (15 m3/h)–23.6 L/s (85 m3/h)—30 m2–210 m2;
Pos 2, reduced ventilation—
11.11 L/s (40 m3/h)–41.66 L/s (150 m3/h)—30 m2–210 m2;
Pos 3, nominal ventilation;
15.27 L/s (55 m3/h)–59.72 L/s (215 m3/h)—30 m2–210 m2;
Pos 4, intensive ventilation—
19.44 L/s (70 m3/h)–79.16 L/s (285 m3/h)—30 m2–210 m2
GreeceGreek Legislative Framework Document (as cited in [33])Detached houses, estimated five persons/100 m2 of floor area. Block of flats, estimated seven persons/100 m2 of floor area.
IndiaLow Energy Cooling and Ventilation [34] Design charts that correlate airflow rates from 0 to 1.2 (m3/s) and free area of openings from 0 to 8 (m2)
Application examples: desired ventilation rates (m3/s) for different room types (master bedroom—MB, small bedroom—SB, hall + open kitchen—HK) for eight cities (climates) and two case study apartments
MB: 0.09–0.35 (case 1), 0.13–0.53 (case 2)
SB: 0.08–0.32 (case 1), 0.09–0.36 (case 2)
HK: 0.48–1.06 (case 1), 0.51–1.14 (case 2)
ItalyMinisterial Decree 05.07.75 [35]Naturally ventilated dwelling 0.35–0.5 h−1
NetherlandsBuilding Decree (as cited in [33])300 m3/h
NorwayNorwegian Building Code [36]Not less than 0.5 h−1
PassivhausStandard Passivhaus [37,38]8.33 L/s–8.88 L/s (30–32 m3/h) per person
Controlled ventilation depending on the occupancy
PortugalNP 1037-1 Standard for natural ventilation [39]1.0–4.0 h−1: depending on the room type
SwedenSwedish Building Regulations BBR94 [40]Rooms shall have a continuous 0.35 L/s/m2 floor area (1.26 m3/h/m2) when in use. This corresponds to 0.5 h−1 in a room with a height of 2.5 m.
SwitzerlandSIA 180, 2014
SIA 382/2, 1992 (as cited in [33])
12–15 m3/h/person (non-smoking, max CO2 1500 ppm) 30–70 m3/h/person (smoking) 25–30 m3/h/person (non-smoking, max CO2 1000 ppm). Air change rate in unoccupied rooms more than 0.3 h−1.
UKApproved Doc. F Ventilation 2010 [41]13 L/s–29 L/s: 1- to 5-room house. The whole ventilation flow rate is always higher than 0.3 L/s m2. If dwelling permeability is 5 m3/(h m) to 50 Pa, it takes 0.15 ACH as the infiltration rate, which will be subtracted from the total ventilation rate.
USASHRAE Standard 62-1-2019 [42]2.5 L/s person, 0.3 L/s m2
Table 2. C p secondary sources: database and analytical models.
DatabaseAir Infiltration and Ventilation Centre (AIVC) [64]
Data are presented for wind attack angles from 0° to 315° (45° range) for low-rise and high-rise buildings

ASHRAE Handbook of fundamentals (Airflow around buildings) [66]
Data are presented for wind attack angles from 0° to 180° (45° range) for low-rise/high-rise buildings

Tokyo Polytechnic University (TPU) Aerodynamic database of low-rise buildings [67]
Data are presented for wind attack angles from 0° to 90° (15° range) for different buildings examples (web-based application tool)
Analytical modelsSwami and Chandra [68]
One equation for low-rise buildings (from eight different investigators) and another for high-rise buildings (one source)

CPCALC + [69,70]
This is a program developed within the PASCOOL program as an upgrade of the CpCalc [71], an integrated module of the multizone airflow and contaminant transport model (COMIS) [72]

Cp Generator [23,73]
Web-based program developed by the Dutch institution TNO based on fits of measured data to mathematical expressions.

New parametric equation [74]
Developed through curve fits of the low-rise data from the TPU database, and it is easier to calculate by hand or with a spreadsheet than the Swami and Chandra equations.

Artificial neural networks (ANN) [75]
ANN is used to obtain analytical models to accurately predict the surface-averaged wind pressure coefficients in walls and roofs of low-rise buildings.
Table 5. Comparison between the predicted ACH and temperatures with the three Cp sources (ii–vi) and the default values (i)—NRMSE.
C p DatabaseNorth FaçadeSouth FaçadeWest Façade
East Façade
Cellar
ACH
Cellar
Temp
LV ACHLV TempBR2 ACHBR2 TempBR3 ACHBR3 TempBR1 ACHBR1 Temp
iia
CpSimVf
142.7%5.6%12.1%1.6%7.7%2.1%4.7%1.9%7.9%1.6%
iib
CpSimOc
129.7%5.4%20.2%1.6%7.4%2.1%5.3%1.9%10.3%1.8%
iic
CpSimSb
120.3%5.2%17.2%1.6%7.4%2.0%5.1%1.7%11.8%1.9%
iii
AIVC
14.2%2.8%7.2%2.0%6.7%2.7%10.2%2.9%11.6%3.2%
iv
TPU
15.3%3.0%9.5%2.2%7.2%2.7%10.3%2.2%11.6%3.3%
LV—Living room; BR—Bedroom.
Disclaimer/Publisher’s Note: The statements, opinions and data contained in all publications are solely those of the individual author(s) and contributor(s) and not of MDPI and/or the editor(s). MDPI and/or the editor(s) disclaim responsibility for any injury to people or property resulting from any ideas, methods, instructions or products referred to in the content.