1. Introduction
Building Environmental Assessment Tools (BEATs) have been developing since the 1990s to provide an objective evaluation of resource use, ecological loadings, and indoor environmental quality. Some of the most recognized are BEATs include BEES 4.0, BREEAM, CASBEE, Code for Sustainable Homes, Green Star, LEED, SBTool, and Minergie. Much work has been made to develop tools that predict, calculate, estimate, and measure the impact of buildings on natural systems and communicate it to different stakeholders in a standardized way. Different tools are directed to different target groups (property owners, developers, architects, consultants, building users, policy makers
etc. [
1].
The BEATs play multiple roles; marketing “environmental” buildings, stimulating owners to improve building performance, delivering objective measurements of environmental impacts, informing decision makers and politicians, and acting as tools for environmental management in architectural projects. When in use, the tools might influence environmental building policies, consumer choices, designs and practices. Clients who are in the process of choosing among different BEATs, and the consultants using them, also want to know how to analyze and compare the different BEATs.
The assessment tools define criteria for “environmental” building performance differently and bring together a large number of environmental issues and aggregate them into overall judgments. They use a number of parameters and issues, and some also include life cycle assessment (LCA) methodology [
2]. Particularly important factors for the outcome of assessments using a specific method include the choice of issues assessed, the parameter scales, criteria and weights used to arrive at an overall summary rating. According to the European standard EN 15643-1:2010 [
3] the consideration of the building life cycle, the object of assessment and the functional equivalent are also important. The lack of a theoretical or systematic approach and the mix of different kinds of parameters make it difficult to compare the tools and to determine what a final award means in terms of environmental impact. Furthermore, there is no international consensus about terminology, tool content, and assessment procedures, nor any consensus regarding how to analyze, evaluate and compare assessment tools.
There are many examples of tool comparisons in the literature [
1,
4,
5,
6,
7,
8,
9,
10,
11,
12,
13,
14,
15,
16,
17,
18,
19,
20]. However, these comparisons are not consistent or detailed, as they primarily focus on general aspects (as cost, covered environmental categories, practical aspects, or number of assessed buildings), compare a specific aspect in the tools, or make a closer analysis of one tool at a time. Nguyen and Altan [
18] compare aspects like influence, availability, methodology, applicability, accuracy and user-friendliness. Comparisons of the result of assessed and certified buildings have also been made [
21]. The results show in what areas the buildings get the best and worst results, but tool details such as issues and parameters are not discussed. A case study where different tools have been tested on the same project [
22] shows that different tools give different results and propose different strategies to improve the building’s environmental performance. The case study also shows that it is necessary to study the issues assessed and assessment techniques used in order to understand the reasons behind the variation in the results. However, a way to analyze and compare tools to understand these differences without testing the tools is not presented.
The design of a BEAT includes a delicate balance between considering theoretical aspects (e.g., reliability and accuracy) and practical aspects (e.g., assessment time and assessment cost). However, the rich flora of options a tool designer faces is seldom discussed, and the arguments for decisions taken are seldom presented in tool descriptions [
23], nor in comparisons. A proposal of a framework for selecting environmental assessment tools have been formulated [
24] and the European committee for standardization has presented a general framework for making sustainability assessments for buildings [
3]. It presents the most important ingredients in an assessment tool and shows how important a common terminology is. A common terminology and system for making detailed analysis and comparisons of tools and their content, are, however, still largely lacking.
3. Methodology
The study is based on a literature review and a study of tool manuals and documents in distinctly different BEATs. A framework was developed and tested. To test if the framework was applicable to different kinds of tools it was necessary to select tools that were distinctly different. BEATs that differed in a number of ways, such as the environment in which they were developed, the purpose for which they were developed, and the way they are used, were particularly sought out. Three different types of tools were selected for comparison:
LEED
®-NC v3, Leadership in Energy and Environmental Design for New Construction, version 3 [
25,
26];
Code for Sustainable Homes [
27];
EcoEffect for New Designs 2006 [
2].
LEED-NC is market driven, Code for Sustainable Homes has recently become a building code, and EcoEffect is an academic tool used to study impacts and utilizes life cycle assessment methodology. Furthermore, they are accessible in English or in the Scandinavian languages, can be used for assessing multi-storey residential buildings, have been compared in a case study on an architectural project [
22], are well documented and have been presented, discussed and examined in scientific articles [
5,
6,
7,
17,
19,
22,
28,
29,
30]. The first two tools are also internationally well known. For more information see Fact Box.
Fact Box: History, Intent and Uniqueness of Three Beats
LEED was developed by the US Green Building Council committees (USGBC) to promote, define and measure “green buildings” and influence the building industry. “The intent is to promote healthful, durable, affordable, and environmentally sound practices in building design and construction.” [
25] The first version, LEED Version 1.0, was launched in August 1998 [
25]. LEED is described as “consensus-based, market-driven, based on accepted energy and environmental principles, balancing between established practices and emerging concepts.”
Code for Sustainable Homes (CSH) was the first tool to become a building code [
31] and was introduced in April 2007 [
32]. It is a further development of the Building Research Establishment (BRE) Global EcoHomes
© scheme [
33], the first version of which was released in 2006 [
34]. “Adoption of the Code is intended to encourage continuous improvement in sustainable home building.” The driving force behind establishing a code for sustainable building seems to be the desire of the British government to act on climate change.
EcoEffect is an assessment tool developed by a group of researchers in Sweden in 2005, with the aim of providing a holistic environmental evaluation method but not a national classification system. The formulated objectives were two-fold: (1) To quantitatively describe the environmental and health impact of real estate and the built environment; (2) to provide a basis for comparison and decision-making that can lead to reduced environmental impact. A large proportion of the tool is based on a Life Cycle Assessment (LCA) methodology combined with quantitative assessment methodology. [
2,
35].
4. Framework Outline
The framework for analysis of the BEATs consists of four steps: structure, content, aggregation, and scope (
Table 1). This layout is explained step by step below.
Table 1.
Framework layout.
Table 1.
Framework layout.
| Structure | Content | Aggregation | Scope |
|---|
| Hierarchical structure | Result | Method | Functional equivalent |
| Components | Labels | Weighting | Spatial boundary |
| Complexity | Scoring | - | Temporal boundary |
| - | Categories | - | Impacts |
| - | Issues | - | - |
| - | Parameters | - | - |
4.1. Structure
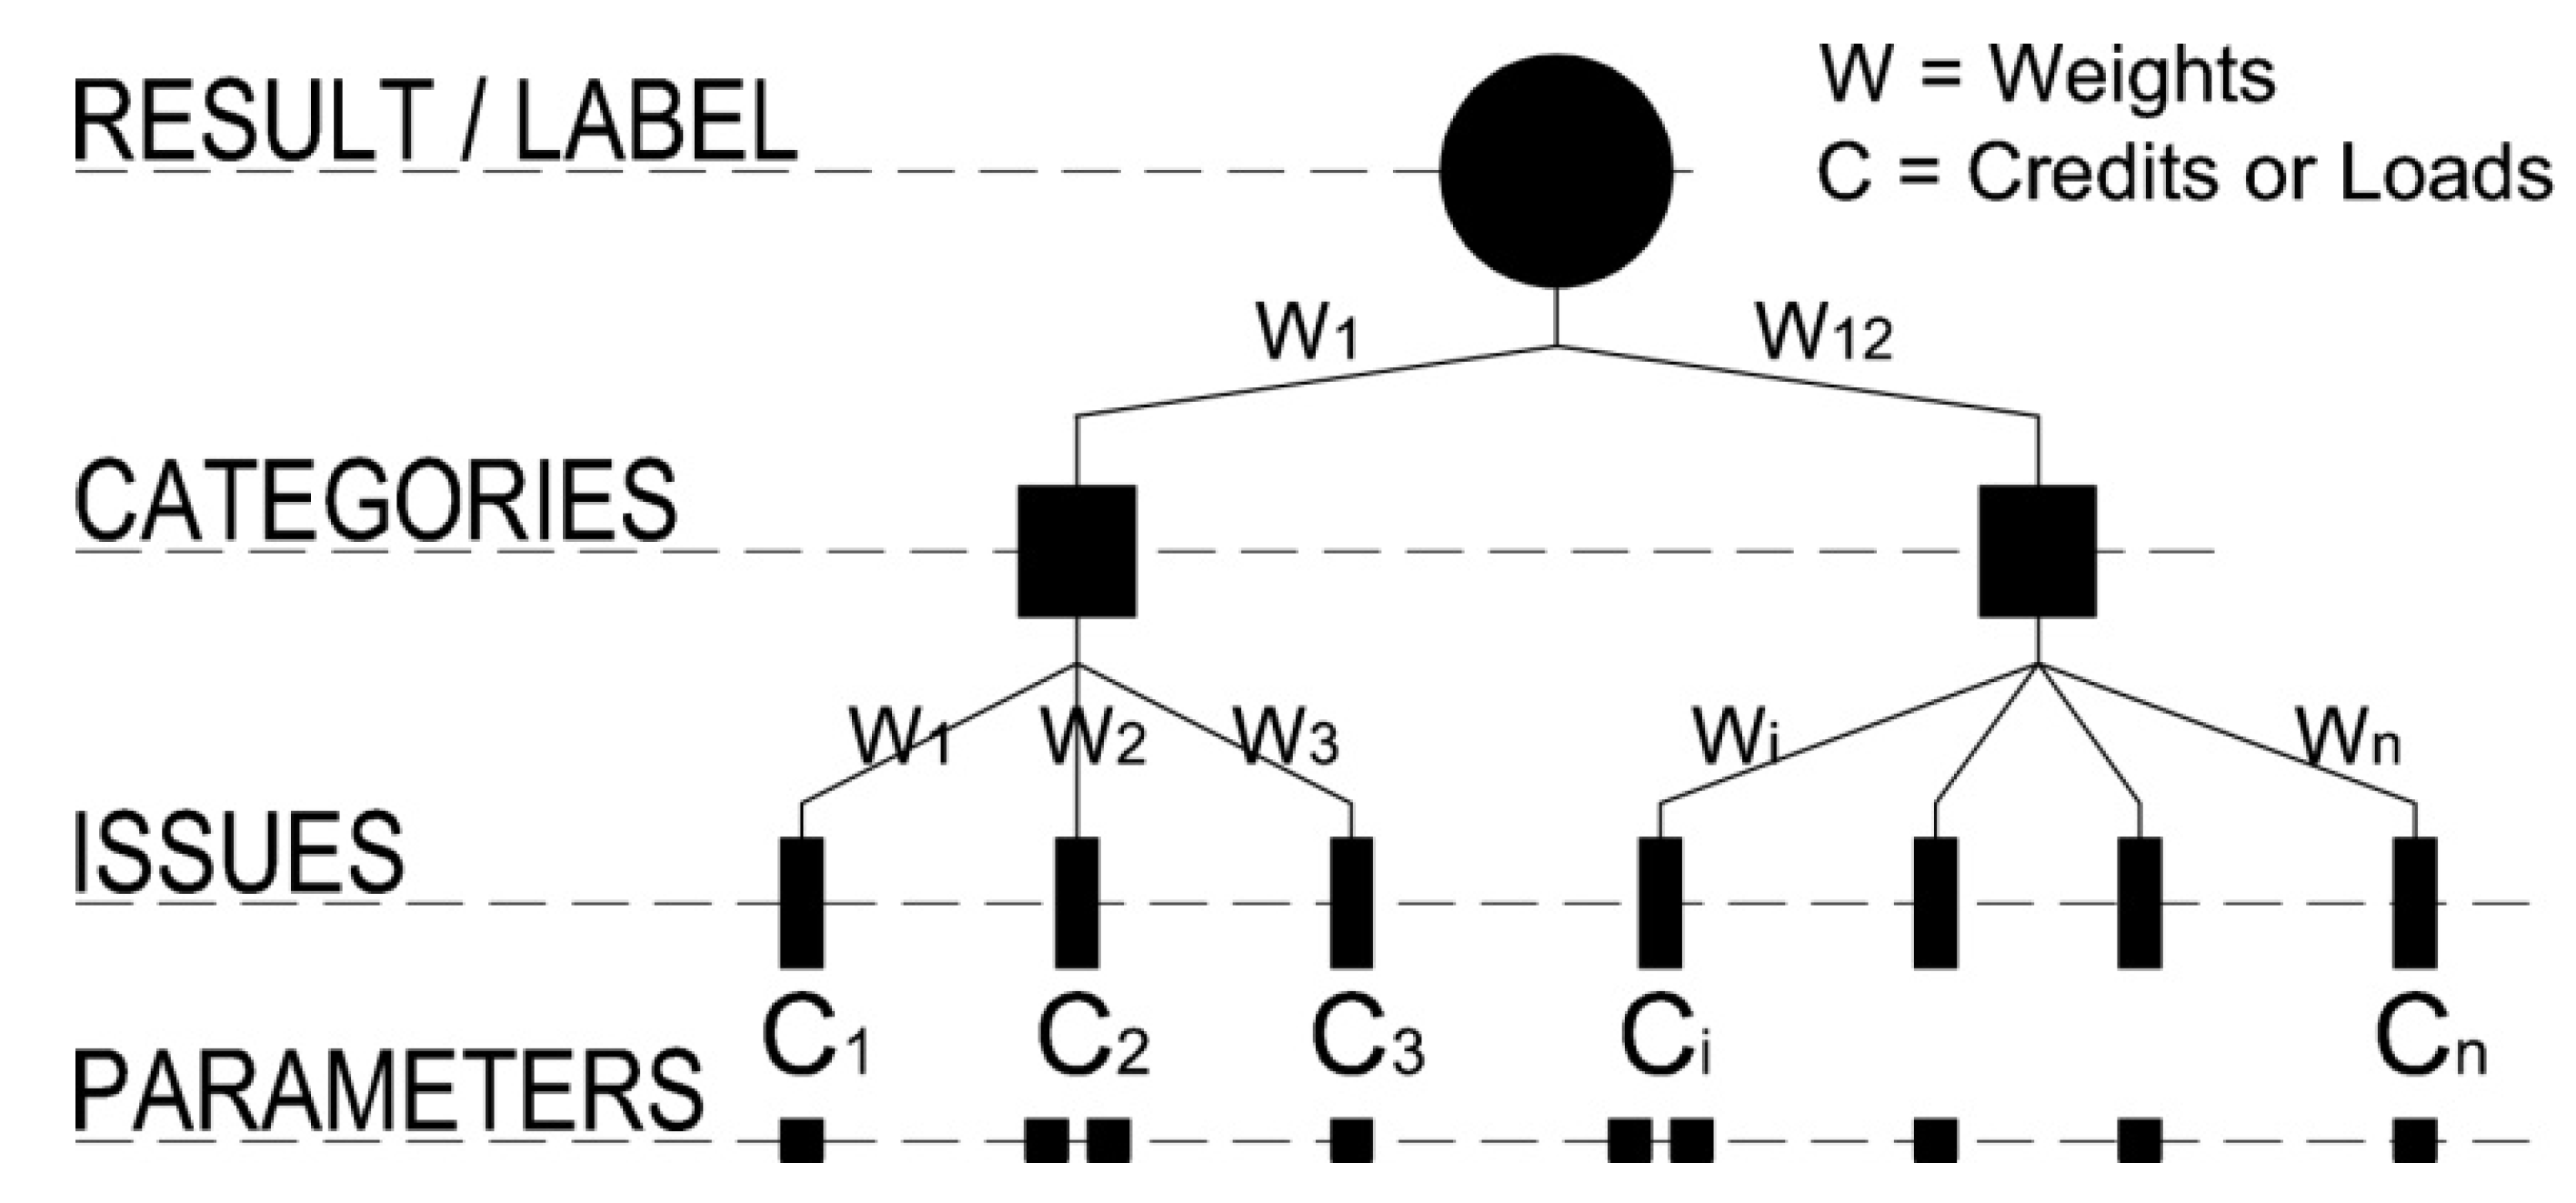
Tools are often presented with a table of contents where the different captions represent different hierarchical levels. Different tools use different number and naming of these levels, but at least four hierarchical levels can often be found. The names proposed in this framework (definitions and descriptions of these levels are found in
Section 4.2 Content) are:
Result and Label;
Categories;
Issues;
Parameters.
In order to communicate environmental information of various kinds, many assessment tools transform the complex information as presented above to a condensed result: as a final label or a few aggregated values. The prerequisite for aggregation is a
hierarchical structure (
Figure 1).
Figure 1.
Principle of the hierarchical structure of the Assessment Tool.
Figure 1.
Principle of the hierarchical structure of the Assessment Tool.
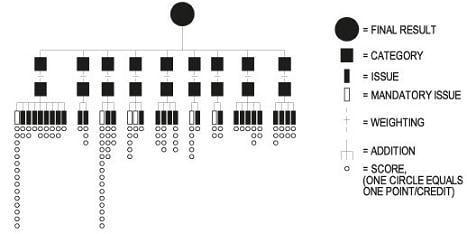
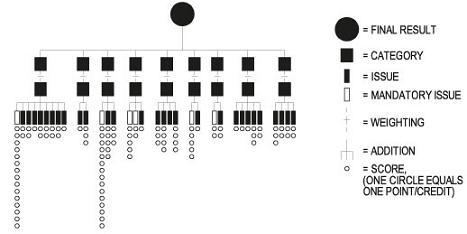
The graphical method is inspired by Sutrisna and Barrett [
36], who demonstrate how “Rich Picture Diagrams” can be applied to modeling case studies to capture the richness of the information in construction projects. The Rich Picture Diagrams are used to “improve presentation and enable thorough cross-case analysis by providing a holistic view” of the construction project storylines [
36]. In this framework, this type of hierarchical diagram (as in
Figure 1) provides an overview of the structure and its components, which improve the understanding of one or more BEATs (see
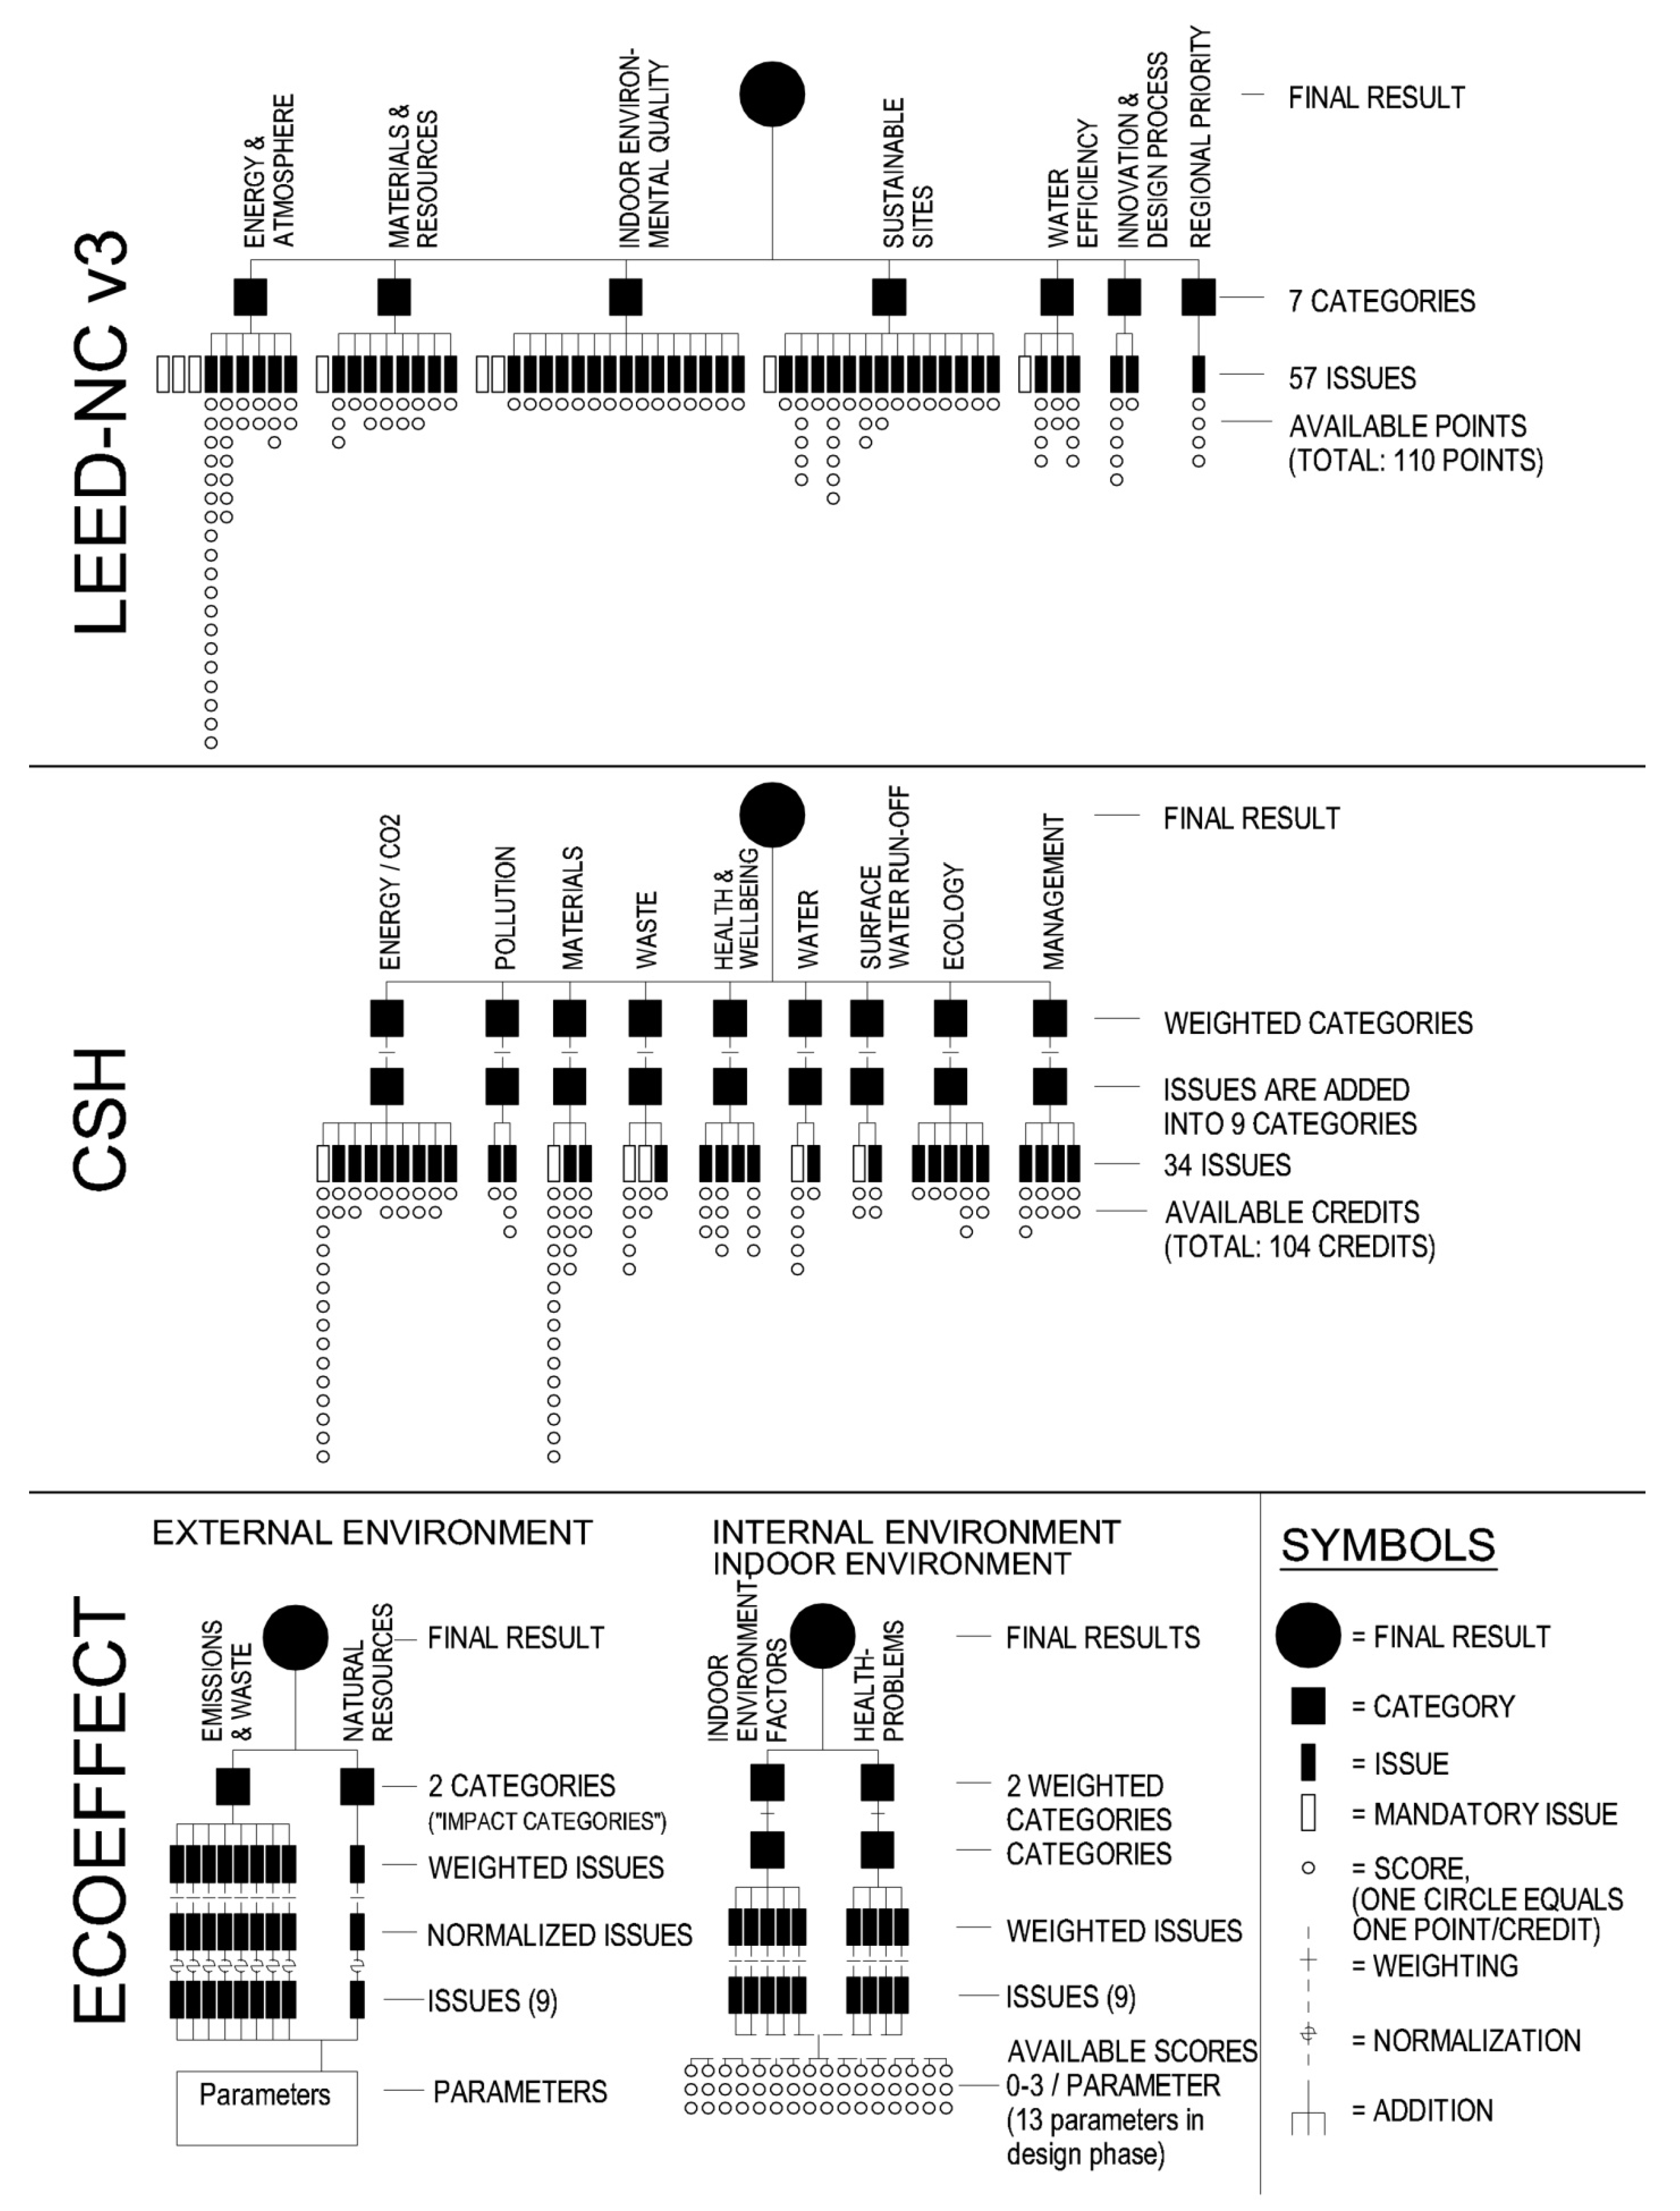
Figure 2). The diagrams in
Figure 2 illustrate how LEED, CSH and EcoEffect are structured, and how they aggregate the large number of building environmental issues addressed into one, two, or three final results. The outdoor environment in EcoEffect is not presented. Differences in hierarchy, aggregation and number of issues available are shown. However, each issue can contain a number of parameters, which are not included in the diagram.
Figure 2.
Structural diagrams of the three selected tools illustrating the hierarchical structure, components and complexity of BEATs
Figure 2.
Structural diagrams of the three selected tools illustrating the hierarchical structure, components and complexity of BEATs
4.2. Content
The next part of the framework explores the content of the tools in more detail. The framework proposes (
Table 1) that the comparison starts with the
results and continues with the
labels as the assessment result for a building is often presented as a label. The number of labels and the method of giving
scores, including the scoring intervals, are also of interest. This is followed by a closer study of the
categories (sometimes “areas” or “aspects”). From examination of several tools the following general set of categories has been chosen:
The great majority of assessed issues could easily be subsumed under the first six headlines, if not there is a possibility to use the last ‘Else’ caption. As the categories can overlap each other there is a risk that one issue can fit into two categories. When the issues have been categorised they are further compared and categorised depending on the kind of aspects they assess:
Procedures—Specific procedures, activities or processes are assessed (e.g., commissioning of ventilation system, use of accredited assessor, delivering a home user guide). They credit actions which are intended to improve environmental performance, such as environmental management, ISO 14001, or commissioning. Procedures in general may be denoted as preventive indicators [
37] and are in general qualitative.
Features—Specific means or measures are assessed such as a certain piece of equipment or technical solution (e.g., labelled white goods, low U-values, existence of solar panels, drying lines, bicycle parking). In the examples above the feature issues contribute to low energy use but the correlation to the overall energy use can vary. Features are quantitative and often easy to measure. Therefore it is easy to tell if the building lives up to the issues criteria or not.
Performance—The quantitative result of technical solutions or designs are assessed (e.g., lowered energy need, lowered CO2 emissions). The evaluation generally includes calculations or measurements. Calculation sometimes makes the relationship between input data and the results less transparent, especially when computer calculations are involved.
Organising the categories and issues as in
Table 2 presents a comprehensive overview. If an issue assess several aspects it can be categorised as several types of issues.
Table 2.
Content in terms of common categories and different types of issues.
Table 2.
Content in terms of common categories and different types of issues.
| LEED | CSH | EcoEffect |
|---|
| Energy and Pollution |
| Commissioning of Energy System | ○ | Dwelling Emission Rate | ■ | Global Warming Potential (GWP) | ■ |
| Optimized Energy Performance | ■ | Building Fabric | ■ | Acidation | ■ |
| Refrigerant (CFC) Management | ○ | Internal & External lighting | ▲ | Eutrification | ■ |
| On-site Renewable Energy | ■ | Drying Space | ▲ | Radioactive waste | ■ |
| Green Power energy contract | ○ | Energy Labeled White Goods | ▲ | Ozone Depletion | ■ |
| Energy Measurem. & Verific. Plan | ○ | Low or Zero Carbon Technologies | ■ | Ground Ozone Formation | ■ |
| - | - | Cycle Storage | ▲ | Toxicity | ■ |
| - | - | Home Office facilities | ▲ | Natural Resources Depletion | ■ |
| - | - | NOx Emissions (from heating) | ■ | - | - |
| Material & Waste |
| Storage and collect. of recyclables | ▲ | Env. Impact of Materials | ■ | Same as for Energy and Pollution | - |
| Building Reuse | ■ | Responsible Sourced Materials | ○ | - |
| Construction Waste Management | ■ | Storage of Household Waste | ▲ | - |
| Materials Reuse | ■ | Constr. Site Waste Managment | ○ | - |
| Recycled Content | ■ | Composting Facilities | ▲ | - |
| Regional materials | ■ | GWP of insulants | ■ | - |
| Rapidly Renewable materials | ■ | - | - | - |
| Certified wood | ■ | - | - | - |
| Indoor Environment/Health & Wellbeing |
| IAQ Performance | ■ | Daylighting | ■ | Joint Disorder | ■○ |
| Env. Tobacco Smoke (ETS) Control | ○ | Sound Insulation | ■ | Sleeping Disorder | ■○ |
| Outdoor Air Delivery Monitoring | ▲■ | Private Space (Outdoor) | ▲■ | Sick Building Syndrome | ■○ |
| Increased Ventilation | ▲■ | Lifetime Homes | ▲■ | Allergy | ■○ |
| Construction IAQ Management Pl | ○ | - | - | Indoor Air quality | ■○ |
| Low-Emitting Materials | ■ | - | - | Thermal Climate | ■○ |
| Indoor Chemical and Pollutant Source Control | ▲ | - | - | Sound Environment | ■○ |
| Controllability of Systems | ▲ | - | - | Electro Magnetic Environment | ■○ |
| Thermal Comfort | ▲○ | - | - | Radon and legionella | ■○ |
| Daylight and Views | ■ | - | - | - | - |
| Domestic Water |
| Water Use Reduction | ■ | Indoor Water Use | ■ | - | - |
| Water Efficient Landscaping | ■ | External Water Use | ■ | - | - |
| Innovative Waste Water Techn. | ■ | - | - | - | - |
| Site & Ecology |
| Storm Water design | ■○ | Managem. Surface Water Run-off | ■○ | Potable water use | ■ |
| Constr. Activity Pollution Prevent. | ○ | Flood risk | ■ | Stormwater quality & treatment | ■ |
| Site Selection | ■ | Ecologic Value of Site | ■○ | Biodiversity | ■ |
| Development Density and Community Activity | ■ | Ecological Enhancement | ■○ | Biological Production Capacity | ■ |
| Brownfield Redevelopment | ■ | Protection of Ecological Features | ■○ | Material Ecocycles | ■ |
| Alternative Transportation | ▲■ | Change in Ecological Value of Site | ■○ | Comfort (shade, wind, noise, smell) | ■ |
| Site Development | ■ | Building Footprint | ■ | Traffic Air Pollution | ■ |
| Heat Island Effect | ■ | - | - | Electro Magnetic Environment | ■ |
| Light Pollution Reduction | ■ | - | - | PCB, Impregnated Wood | ■ |
| Management/Procedures |
| - | - | Home User Guide | ○ | - | - |
| - | - | Considerate Constructors Scheme | ○ | - | - |
| - | - | Consstruction Site Impact Managm. | ○ | - | - |
| - | - | Security | ○ | - | - |
| Else |
| Innovation in design | ▲■ | - | - | LCC-Yearly operation cost | ■ |
| LEED accredited professional | ○ | - | - | LCC-Yearly maintenance cost | ■ |
| Regional Priority | ▲■ | - | - | LCC-Investment cost | ■ |
The last aspects of “content” to compare are the used parameters, demanded input data, and intrinsic data included in the BEAT. It is often difficult to measure issues and environmental impacts directly. For this reason, different kinds of approximations are sought out, which are often called “indicators.” To measure an indicator, one or several parameters are needed. A parameter is here being defined as a property or unit that can be measured or observed. Each issue therefore has one or several parameters to assess the building. Other data included in the tools that may influence the results are, for example, built-in background data, upstream data (data associated with the production of materials and products (e.g., production of raw, auxiliary and operating materials), downstream data (data associated with the disposal of materials and products (e.g., waste treatment)) and defined and/or calculated life expectancy. There is always a risk that different input data are used and interpreted in different ways, e.g., there are several ways of measuring the floor area of a building. It can be one of the reasons why the same building can be given different results by different assessors.
4.3. Aggregation
The methodology used for aggregation and weighting and what weights different issues and categories have, is analyzed separately in the framework to highlight the importance of these issues. How the BEAT aggregates and weights issues and categories influences the assessment result. To produce a conclusive result and an environmental label, aggregation is necessary. A way to compensate for varying significance between issues is to vary the number of scores that can be obtained. This indirectly means a weighting. A good result on an issue where 4 points are available will contribute twice as much to the final result as an issue where only 2 points are available. Another way to compensate for variations in significance is to assign different weights to issues and/or categories. The weighting can be based on e.g., opinions, cost or damage. Opinions can be taken from environmental experts, professionals or laymen, and the weighting figures can be calculated from many answers, for instance, mean values or consensus values reached through a discussion process. There are various multi-criteria decision-making tools used in Life Cycle Assessment [
38].
4.4. Scope
The final part of the framework covers the
functional, spatial, and
temporal boundaries, as well as assessed
impacts included. To make a precise comparison of buildings, they need to offer the same services and function. That is why assessment developers have devised specific versions of tools for different kinds of buildings, e.g., types of use such as houses, schools, offices,
etc. To improve comparability of building performance, the European working group on “Sustainability of Construction Work” has suggested that the term “functional equivalent” [
39,
40] should be used for stating functional properties of a building. This includes requirements on space, indoor climate, air quality, light, silence,
etc.
The spatial boundary specifying the part of the physical building that is included in the assessment has also to be defined. The boundary between the building and its surroundings is not always clear, as a building interacts with the infrastructure, e.g., grids of energy support, telecommunications, sewage, roads, etc., and the ecosystem. The spatial extension of the assessed objects may range from building elements to neighborhoods.
There are also temporal boundaries related to the life cycle stages of the building components and the life cycle phases of the building process which has to be examined. Finally, the framework for analysis of BEATs highlights which environmental impacts and other impacts a tool considers.
5. Testing the Framework
The generic framework presented in
Section 4 has been tested and evaluated for three different BEATs. In this chapter, the applicability of the framework on the three tools is presented.
5.1. Structure
Table 3.
Structural differences.
Table 3.
Structural differences.
| Levels of aggregation | LEED | CSH | EcoEffect |
|---|
| Final result | 1 | 1 | 3 |
| Categories | 7 | 9 | 4 |
| Issues | 57 | 34 | 18 |
| Issue score interval | 1–19 | 1–15 | 0–3* |
In LEED, the aggregation is an addition of the indirectly weighted scores (called points in the tool). In the Code for Sustainable Homes, the scores (called credits) are weighted into points. EcoEffect gives three final results: one for impacts on the external environment, one for impacts on the indoor internal environment, and one for the outdoor internal environment. A further analysis of the outdoor assessment is not included in this comparison. The external impacts include two categories (Emissions and Waste and Natural Resources), which are weighted. These categories together contain 9 issues, which are first normalized, then weighted. The 2 categories and 9 issues in the indoor environment are weighted on both category level and issue level.
The overview shows that LEED has a flat structure that is easy to understand, but the uneven distribution of scores needs explanation. CSH and especially EcoEffect look much more complex because of the weighting and normalization which adds several levels to the diagram.
The number of components (results, categories and issues) in the tools is fewer in CSH and EcoEffect than in LEED. Still CSH and EcoEffect look more complex. It was also more difficult to draw their diagrams.
5.2. Content
5.2.1. Result, Labels and Scoring
LEED uses 4 labels: certified, silver, gold and platinum, whereas CSH and EcoEffect use 1–6 stars, where six stars is the best. Both LEED and CSH offer checklists which give a good overview of the final result. EcoEffect presents diagrams delivered by the assessment program. LEED has a slightly progressive scale where the interval between the last two labels is larger than that between the first ones, so it becomes increasingly difficult to get a higher rating. In CSH the number of scores needed to reach a higher label varies. In EcoEffect each step means an equal reduction of Environmental Load Number (ELN), which represents damage to people based on environmental impact.
In both LEED and CSH, the assessment methodology is based on a certain number of obtainable points or credits for each issue assessed. This prepares the way for aggregation to a single summarized result. The final result then depends on the total amount of scores. In LEED-New Constructions version 3, a total of 110 points are available. With CSH, an assessment can give up to 100 points from weighted credits.
The labels in EcoEffect for internal environment, including outdoor and indoor environment, are given by scores representing the risk of building users becoming negatively affected by the outdoor and or indoor environment. For external impact, EcoEffect calculates contributions from the building to different environmental impact categories [Global Warming Potential, Depletion of the Stratospheric Ozone layer
etc. (
Table 2)], with each single assessment resulting in different units. The contributions are then normalized and weighted and then added to a single Environmental Load Number, which gives the label. The weight of each category is based on its potential impact on people [
41].
5.2.2. Categories
In LEED and CSH, the categorization is based on various environmental aspects related to the building processes or properties. These categories often overlap each other. In EcoEffect, the categorization is based on environmental impacts caused by the building. All three tools cover issues in the common new categories presented here: Energy and Pollution, Material and Waste, and Indoor Environment. In addition to these, LEED assesses and allocates credits to issues related to the categories Water, Design Innovation, Sustainable Site and Regional Priority. CSH also specifically assesses Water, Management and Ecology. EcoEffect includes Site Assessment and calculation of Life Cycle Costs [
42].
5.2.3. Issues
All assessed issues in the three tools have been distributed into the predefined categories and further a distinction was made between Feature, Performance and Procedure issues (
Table 1). It was relatively easy to subsume all issues in the tools into the new categories presented in the framework. In some cases, it was not obvious. For example, the issues of water-efficient landscaping and innovative waste water treatment could fit both in the category Domestic Water and in Site and Ecology. The issues that did not fit into any of the common categories were placed in the category Else. The tools seem similar at the category level (even if category names vary), but a closer look reveals that the issues included, parameters assessed and the organisation of these vary greatly. The original categories with similar names contain different issues and parameters (
Table 2). For example, a large variety of issues and parameters are used in the category Indoor Environment. The only common issue, Daylight, is not measured in the same way. LEED parameters are: daylight illuminance level in footcandles or total daylighting zone or distance to skylight and also direct line of sight to the outdoor. CSH parameters are: average daylight factor and direct light from the sky on working planes. EcoEffect parameters are: theoretical hours of sunshine indoors and on balconies/private patios, window-to-floor-area ratio, electrical lighting level lux, glare, visible flicker, color reproduction in Ra index for electric fittings, and the possibility to arrange individual extra lighting.
All three types of issues (Features, Procedures, Performance) are used in LEED and CSH (
Table 2). EcoEffect uses Procedures and Performance issues only. The focus in all three tools (counting the number of issues in each type) is on Performance issues. LEED uses Procedure issues in all categories except Water (
Table 2). CSH has a specific category for Management containing Procedure issues, but they are also found in the category Material and Waste. EcoEffect uses Procedure issues for indoor environmental issues in new designs, where real performance cannot be assessed or estimated by calculations. LEED and CSH use a number of Feature issues, especially in the Material and Waste category for LEED. In the Energy category in CSH, 12 out of 29 scores (41%) are based on scores assessing technical solutions.
LEED and CSH mainly assess Performance in the categories Energy, Material, and Water, EcoEffect, use Performance issues when assessing the External Environment and the Internal Environment. LEED also includes a special kind of issue, Innovation and Design. These are open measures intended to decrease the environmental impact of the project, and a central committee decides if the measures are given any scores.
5.2.4. Parameters
Parameters and input data give information about the scope of BEAT. The parameters measure Features, Procedures and Performance of the building. The data demanded varies greatly and different templates and software are often available.
Upstream impacts are considered in EcoEffect and also in CSH in the Material category. Life Cycle Assessment (LCA) is used for assessing materials and energy in the EcoEffect program and in CSH’s Green Guide to specification [
43], which contains information on the relative environmental performance of some materials and components. EcoEffect and CSH calculate downstream data, such as emission data (CO
2, NO
x etc.) from energy production.
In both LEED and CSH, the lifetime of the building is not specified. From a Life Cycle Assessment methodology perspective is the life expectancy of the building and its components is important. The impacts from material production are usually distributed over the whole lifetime of the building. The relative significance of the operation phase then declines with decreased life span of the building.
5.3. Aggregation
In LEED, indirect weighting is performed by assigning a different maximum amount of scores to each issue, and in some cases by having several issues dealing with the same environmental aspect (e.g., one issue for 10% reused material plus one issue for 20% reused material). This means that all points have the same “environmental” value regarding contribution to the final result. It also means that the points are tradable, with the exception of a few mandatory aspects that have emphasized importance. Often there are optional ways to obtain a point. Normally 1–4 points are available per issue, except for two Energy indicators and two Sustainable Site indicators, where more points can be gained (19 for Optimization of Energy Performance and 7 for On-Site Renewable Energy). This aggregation system is easily understood, but has been criticized because, in LEED v2.2, the basis for the scores assigned was not explained and the environmental meaning of the final score was hazy [
28]. Since then, the indirect weighting has been adjusted. The point value of the credit should now accurately reflect its potential to either mitigate the negative environmental impacts of a building, or promote positive impacts [
44]. The weighting is based on both US EPA’s (United States Environmental Protection Agency) TRACI (Tool for the Reduction and Assessment of Chemical and Other Environmental Impacts) environmental impact categories and weightings devised under the auspices of NIST (National Institute of Standards and Technology), which compare the impact categories to each other and assign a relative importance to each. A tool to analyze how each LEED credit interacts with the list of impacts has then been used by the LEED Steering Committee to distribute the points in LEED 2009 [
44].
In CSH, some credits are mandatory while most are tradable. Most issues assessed give a maximum of 4 credits, except the issues Dwelling Emission Rate and Environmental Impact of Materials, which can give up to 15 credits. Since the categories are weighted, every credit obtained in one category has a different value than a credit obtained in another category. The weighting factor is derived from a survey of international “experts” and a consultation with industry representatives. The CSH Technical Guide 2009 [
27] only states that the weights are set “relative to their importance.” The weightings and environmental ranking of the materials in the Green Guide to Specification [
43] “are based on Life Cycle Assessments (LCA), using BRE’s Environmental Profiles Methodology 2008” [
45].
The basis for the assessment and weighting in EcoEffect is a life cycle approach. Equivalents for the external environmental issues (called impact categories) are first calculated. They are then normalized,
i.e., divided by the corresponding value per capita in the country, in the end showing a percentage. For internal impact a scale with four steps (0–3, where low scores mean a good result) is applied, punishing ill health and discomfort. Recent standards or practices found in codes are used as reference values and given the same score. The scores for each issue are then weighted both on the issue level and on the category level. EcoEffect weights issues and categories according to their potential impact (damage) on people. The weighting system is based on a disability/discomfort scale developed as an extension of the DALY (Disability Adjusted Life Years) system [
23]. It considers both short intense impacts and long mild impacts on humans. For each issue and impact category, weights have been established by estimating the potential harm the endpoint problems within each category might cause people [
2]. For external impacts, the assessment is based on the environmental impact from the total amount of energy and materials used per square meter or per user,
i.e., the number of users for which the building is designed. This favors efficient use of space, which is interesting from an environmental point of view as the positive effect of improved environmental building performance is counteracted by constructing larger buildings [
46].
The significance of the weighting of different categories is one aspect of weighting that can be studied further. In many tools are the energy aspects considered most important [
21]. Approximately one-third of the assessment scores in LEED and CSH are devoted to energy, and approximately one-fifth in EcoEffect. Together, the two most important categories in the tools represent more than 50% of the total available scores. This means that the lowest label in LEED and CSH can be achieved by meeting mandatory requirements and scoring high in two categories; Energy and Sustainable Site. [To receive the lowest label, LEED v3. demands a total result of 36% (40 points) and CSH a total score of 35% (36 credits)].
5.4. Scope
5.4.1. Functional Equivalent
The exact functional equivalent for the assessed object is not very precisely specified in the three tools. They describe only what types of buildings that the tool is designed for and that general legal requirements have to be fulfilled. When studying the parameters, it is clear that the main focus for all three tools compared in this study are the functions of the building. This supports Conte and Monno’s [
47] idea that the BEATs have a “buildingcentric” approach. Functions related to the site (systems such as transport, waste, sewage systems,
etc.) are also included, but not to the same extent. CSH also includes functions such as home office and access for disabled people.
5.4.2. Spatial Boundaries
EcoEffect sets the spatial boundary for the object at the property boundary, but includes upstream impacts from use of energy and materials. In LEED, the boundaries are indirectly defined by input data asked for. LEED includes the property and also assesses some aspects related to the surroundings, such as access to services and public transportation, together with geological aspects and stormwater impacts. CSH also mainly deals with the building and is restricted to assessment of housing only. Protection of ecological value, flood risk, and management of surface water run-off on the property are also assessed.
5.4.3. Temporal Boundaries
Regarding the building components life cycle stages and the building process life cycle phases the assessment tools primarily deal with the design, construction and property management phases. The most assessed stages with performance issues are manufacturing, construction and use. The procedural issues used in the tools focus on the procedures during the detailed design, construction and management phases. The Performance issues focus on the occupancy/use stage, but issues concerning the production of materials, transportation and construction are also included. The production stage (including extraction and manufacturing) for materials is included in CSH “Green Guide to Specification” [
43] and in EcoEffect. LEED only includes transportation distance of materials before construction and certified wood.
The final stages (dismantling, reuse,
etc.) in the physical life cycle tend not to be included in the tools, although a complete environmental assessment of a building ought to consider the whole life cycle, as for other kinds of products or services [
48]. Issues regarding future refurbishment, demolition and waste disposal/recycling of material are hardly considered at all, except in EcoEffect, which makes an attempt to cover this by crediting a demolition plan containing information regarding dismantling and recycling declarations for building products. In LEED, waste disposal of the building materials is included indirectly through the promotion of reused and recycled materials. Recycled and salvaged construction waste material and storage and collection of recyclables are also included. CSH assesses waste at the construction phase and also household waste systems. The Green Guide to Specification in CSH also includes waste in the material and construction rating. The site conditions before a new construction are taken into account in LEED. In EcoEffect and CSH the ecological values of the site are evaluated before and after exploitation in order to optimize improvement.
5.4.4. Impacts
The three tools primarily assess environmental
impacts as environmental performance and hardly include social and economic performance of buildings even though they are required when measuring sustainability, according to EN 15643-1:2010 [
3]. Environmental impacts connected to the three categories, Energy and Pollution, Material and Waste, and Indoor Environment, are addressed in all tools, but in different ways. Impacts only assessed by LEED are: CFC, light pollution, heat island effect, open space, and use of brown field land. CSH alone assesses functionality aspects such as Home Office and Lifetime Homes (functionality for disabled people) and disturbance at the construction site. EcoEffect can calculate the economic aspect, Life Cycle Costs and environmental efficiency per user. In the category Ecosystems, which generally concern flora and fauna at the site, EcoEffect also assesses comfort issues at the site such as noise, dust, shade and windiness.
Besides environmental aspects in a few cases, quality aspects (such as Home Office in CSH), human health aspects (such as indoor environment issues), social aspects (such as adaptation for the disabled) and economic aspects (such as Life Cycle Cost in EcoEffect) have been included.
6. Discussion
6.1. Benefit of the Framework
The framework for analysis is a method to enable analysis, understanding and comparison of BEATs, and, to some extent, it is also a proposal for a uniform terminology. This will aid structured analyses of BEATs which increase the transparency and thereby also the understanding of the tools. This will facilitate a reflective and critical discussion regarding their content and structure.
Using different BEATs may influence building design, building process, environmental performance and, the bottom line, environmental impact. That is why it is important to have an ongoing discussion regarding BEATs and their applicability and environmental relevance. We believe that the framework can play a role in this respect.
The differences between BEATs are unclear and give users the possibility of selecting a system which favors their own building or construction and manufacturing methods. The differences continue to cause confusion in the sector and on the market. According to [
49], there seem to be strong incentives to make use of ambiguity rather than clarity in relation to “green building.” The interpretative flexibility of “green,” “environmental” or “sustainable” building with a plurality of meanings allows competing ideologies and special interests to gain rhetorical prominence and to influence decision makers’ views of what should be prioritized. This framework makes it easier to identify how BEATs are structured, what they contain, and where any differences are located.
The hierarchical diagram presents a new way to visualize the structure for a BEAT. It also increases the transparency of the tools which is important for the credibility of labeling systems. The assessment tool should “openly display how data are processed and the objectives ruling the processes,” according to [
50]. Making the diagram takes time if the tools are complex, but it also saves time as it clarifies the content of the tool manuals which often contain hundreds of pages. The layout of current BEATs is relatively constant over time, which means that the mapping process seldom has to be repeated.
The framework facilitates classification of tools by a deepened and more thorough analysis of the tools. Berardi [
21] presents three different types of assessment tools proposed by Hastings and Wall [
51]: cumulative energy demand systems, life cycle analysis systems, and total quality assessment systems. This comparison of tools shows that there are large differences even between tools belonging to the same group,
i.e., total quality assessment systems. This framework may therefore aid the work of further tool classification.
The framework identifies tool differences, not their consequences, when applied on certain buildings. If this is the question, it has to be investigated separately for these buildings. One reason why consequences of tool differences are difficult to assess is due to the use of tradable points. The tradable points make it possible for buildings with large differences to be assessed and get the same label.
6.2. Issues
From an environmental point of view, there is a risk that issues not included in a tool will not be considered at all. One such issue is
embedded hazardous substances, which is left out in the three tested tools. If that issue is not considered, the sector will probably not put the same emphasis on a decreased use of hazardous substances. The statement “We measure what we care about and we care about what we measure” [
52] highlights the importance of including all aspects that are important from an environmental point of view and also of not including impacts that are less important. Further investigations are needed in order to understand why certain issues are assessed in one system and not in another. Underlying conditions for including or excluding a certain issue are for example: the cost of the assessment, the context in which the tool is developed, local building code, perceived environmental issues, intelligibility, the possibility for clients to influence [
37]. Other reasons could be cultural differences, measurability [
53], available data, extensive documentation, specific/expensive equipment, time-consuming calculations, local climate and geographical conditions.
In a similar way, the significance of different environmental aspects can vary regionally. LEED has regional points as a way of emphasizing regional environmental aspects. Water saving is of higher priority in regions where water is a scarce resource. Regional aspects can always be added as extra criteria separated from the BEAT to highlight regional environmental aspects. Other features, such as regenerative design and resilience, as well as features apart from environmental aspects, can also be included in the tools. The inclusion of quality aspects and social aspects in CSH reflects this. However, it may blur what the final result represents.
In the framework, a new distinction is made between issues denoted as Procedures, Features and Performance. The different tools use these distinctive types to a varying extent. Many tools assess designed but not-yet-built buildings with demand for verification later on. At the design stage, the only available data that can be assessed are the results of design activities such as drawings, calculations, and descriptions, and they can be handled in different ways. Procedure issues can be used in this phase as one way to deal with this difficulty of assessing a building before it is built and to improve the likelihood of achieving a high environmental quality of the completed building. However, the assessment result also depends on how the procedure is evaluated and the result interpreted. Performance issues can represent the real environmental impact more direct. Aggregating a mixture of Procedures, Features and Performances can be questioned because it gives an ambiguous result. There is also a larger risk of double counting when issues are of more than one type and thereby overlap each other.
6.3. Aggregation
The weighting tends not to be something that is highlighted in the tools or in other comparisons of environmental assessment, even though the weighting dominates the final valuation of an assessed building. According to Ding [
15], there is at present neither a consensus-based approach nor a satisfactory method to guide the assignment of weightings. Finding a systematic and relevant way to weight and aggregate the assessment results is a major problem in all BEATs [
48]. Weighting can be made at different levels,
i.e., between categories, issues or parameters, reflecting their relative significance.
The framework addresses aggregation and weighting as important things to analyze when comparing BEATs. If e.g., impacts of material production (Materials and Waste) contribute significantly to the total environmental impact of a building, it should be taken into account to the same extent. The weighting of the category should therefore correspond to the environmental importance of the materials in some way. However, this is not the fact in the three assessed methods. A simplification for comparing environmental impact of building materials is to consider the materials embodied energy [
54] in relation to the energy use for operation. Research indicates that the embodied energy in materials represents 23–42% of the total energy use during a 50-year life cycle [
54,
55,
56,
57,
58,
59,
60]. Other studies show that the energy use during occupancy is larger than the embodied energy and accounts for approximately 80% of a building’s total energy use [
61,
62,
63]. In low-energy buildings, the relative impact from materials becomes larger [
64,
65,
66]. From these studies, it follows that the relative impact from “Material and Waste” increases with decreasing energy use and also with decreasing life span. However, in the tools, the Material and Waste category is weighted rather low in all three tools. It makes up to less than 15% of the scores in LEED and CSH. In EcoEffect this relationship depends on the environmental impact of the materials used. The fact that embodied energy and environmental impacts from materials are not always accurately represented in variations of parameters, issues and scores in BEATs has been demonstrated in another study [
67].
7. Conclusions
BEATs set the environmental targets that future environmental building should strive to achieve. Since they differ significantly, it is important to analyze, understand and compare the tools, their content and structure. The study shows that making a hierarchical diagram of the structure of the tools provides a clear picture of their complexity, differences and different weighting system (
Figure 2). Further analysis of the content in detail gives a deeper understanding of the tools’ components and how they assess the building. Three types of issues have also been identified to clarify the differences: Procedure, Features and Performance issues.
The test of the framework on three different BEATs (LEED, CSH and EcoEffect) shows similarities, but also differences, that may push the design of “environmental” buildings in different directions. However, all three tools highlight issues in the new common categories: Energy and Pollution, Material and Waste, and Indoor Environment, even though the main focus varies. Variations were found regarding assessment of the object, the content, weighting, structure of the tools, the assessment boundaries, in addition to the environmental impacts considered, issues regarded, and parameters used.
The advantage with assessment tools is that they allow for an important discussion about how to assess and measure environmental impacts when designing buildings. However, differences in content, aggregation, weighting and label intervals make tool comparisons and result interpretation more complicated. The proposed framework aims at improving analyses, discussions, comparisons, development and understanding of BEATs. It will hopefully contribute to the development of more transparent, reliable, systematic and environmentally relevant BEATs which can influence future buildings to be more “environmental,” “green,” “regenerative,” and “sustainable.”


