The Effect of Building Aspect Ratio on Energy Efficiency: A Case Study for Multi-Unit Residential Buildings in Canada

Abstract
:
1. Introduction

1.1. The Internal Environment
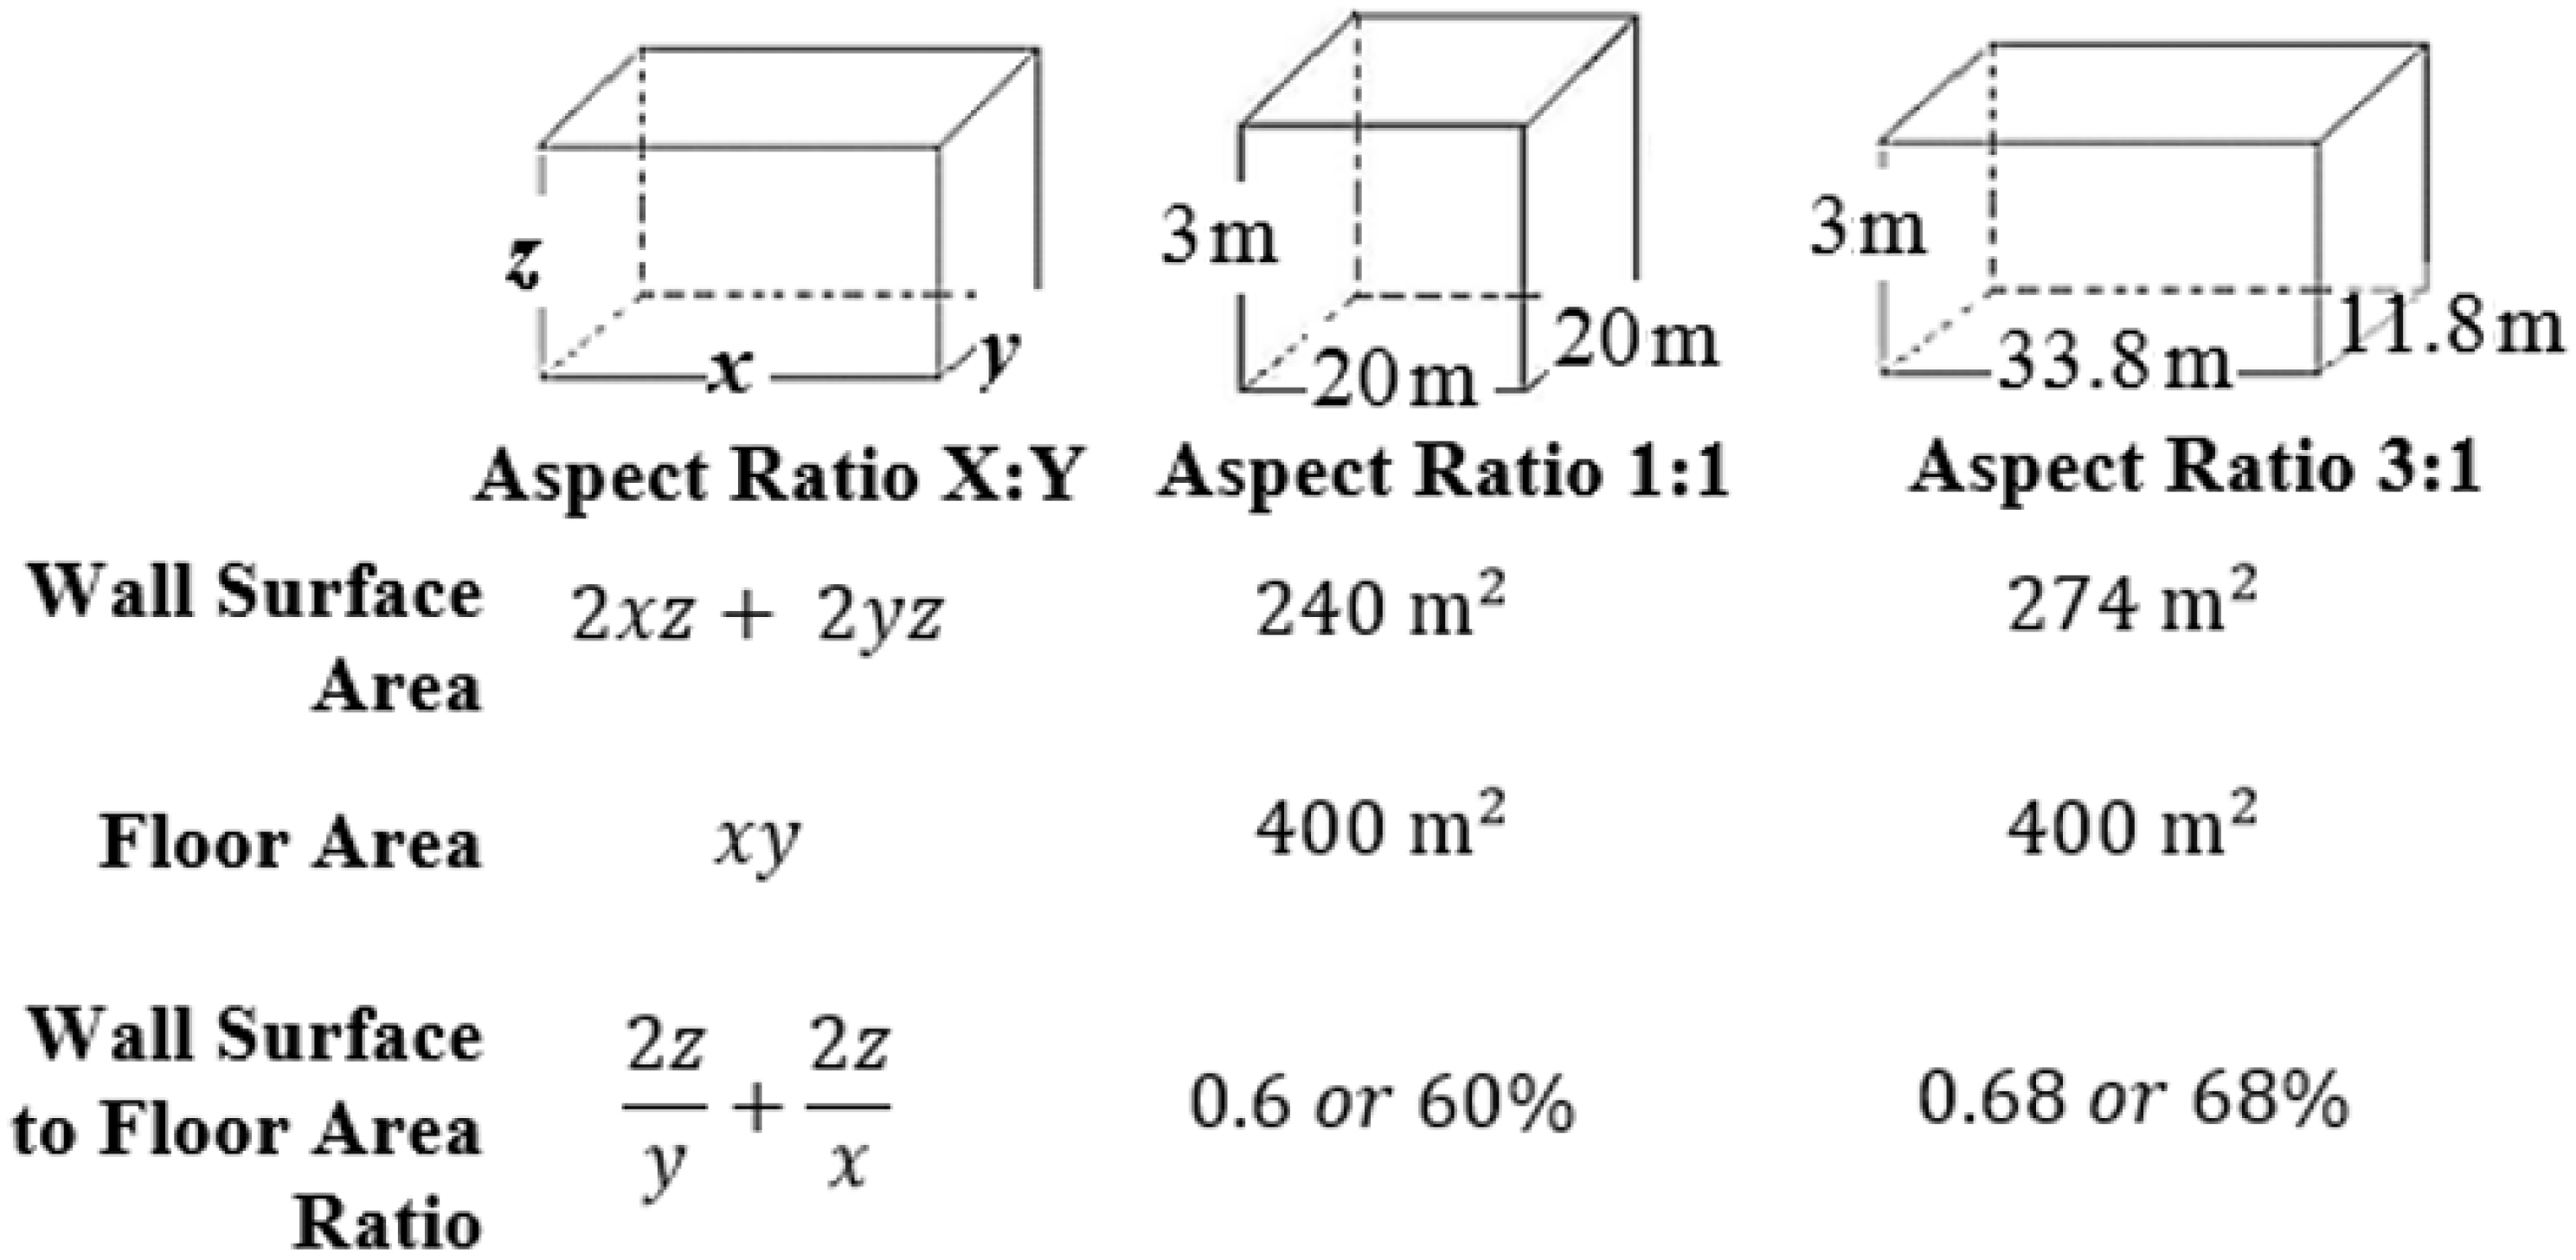
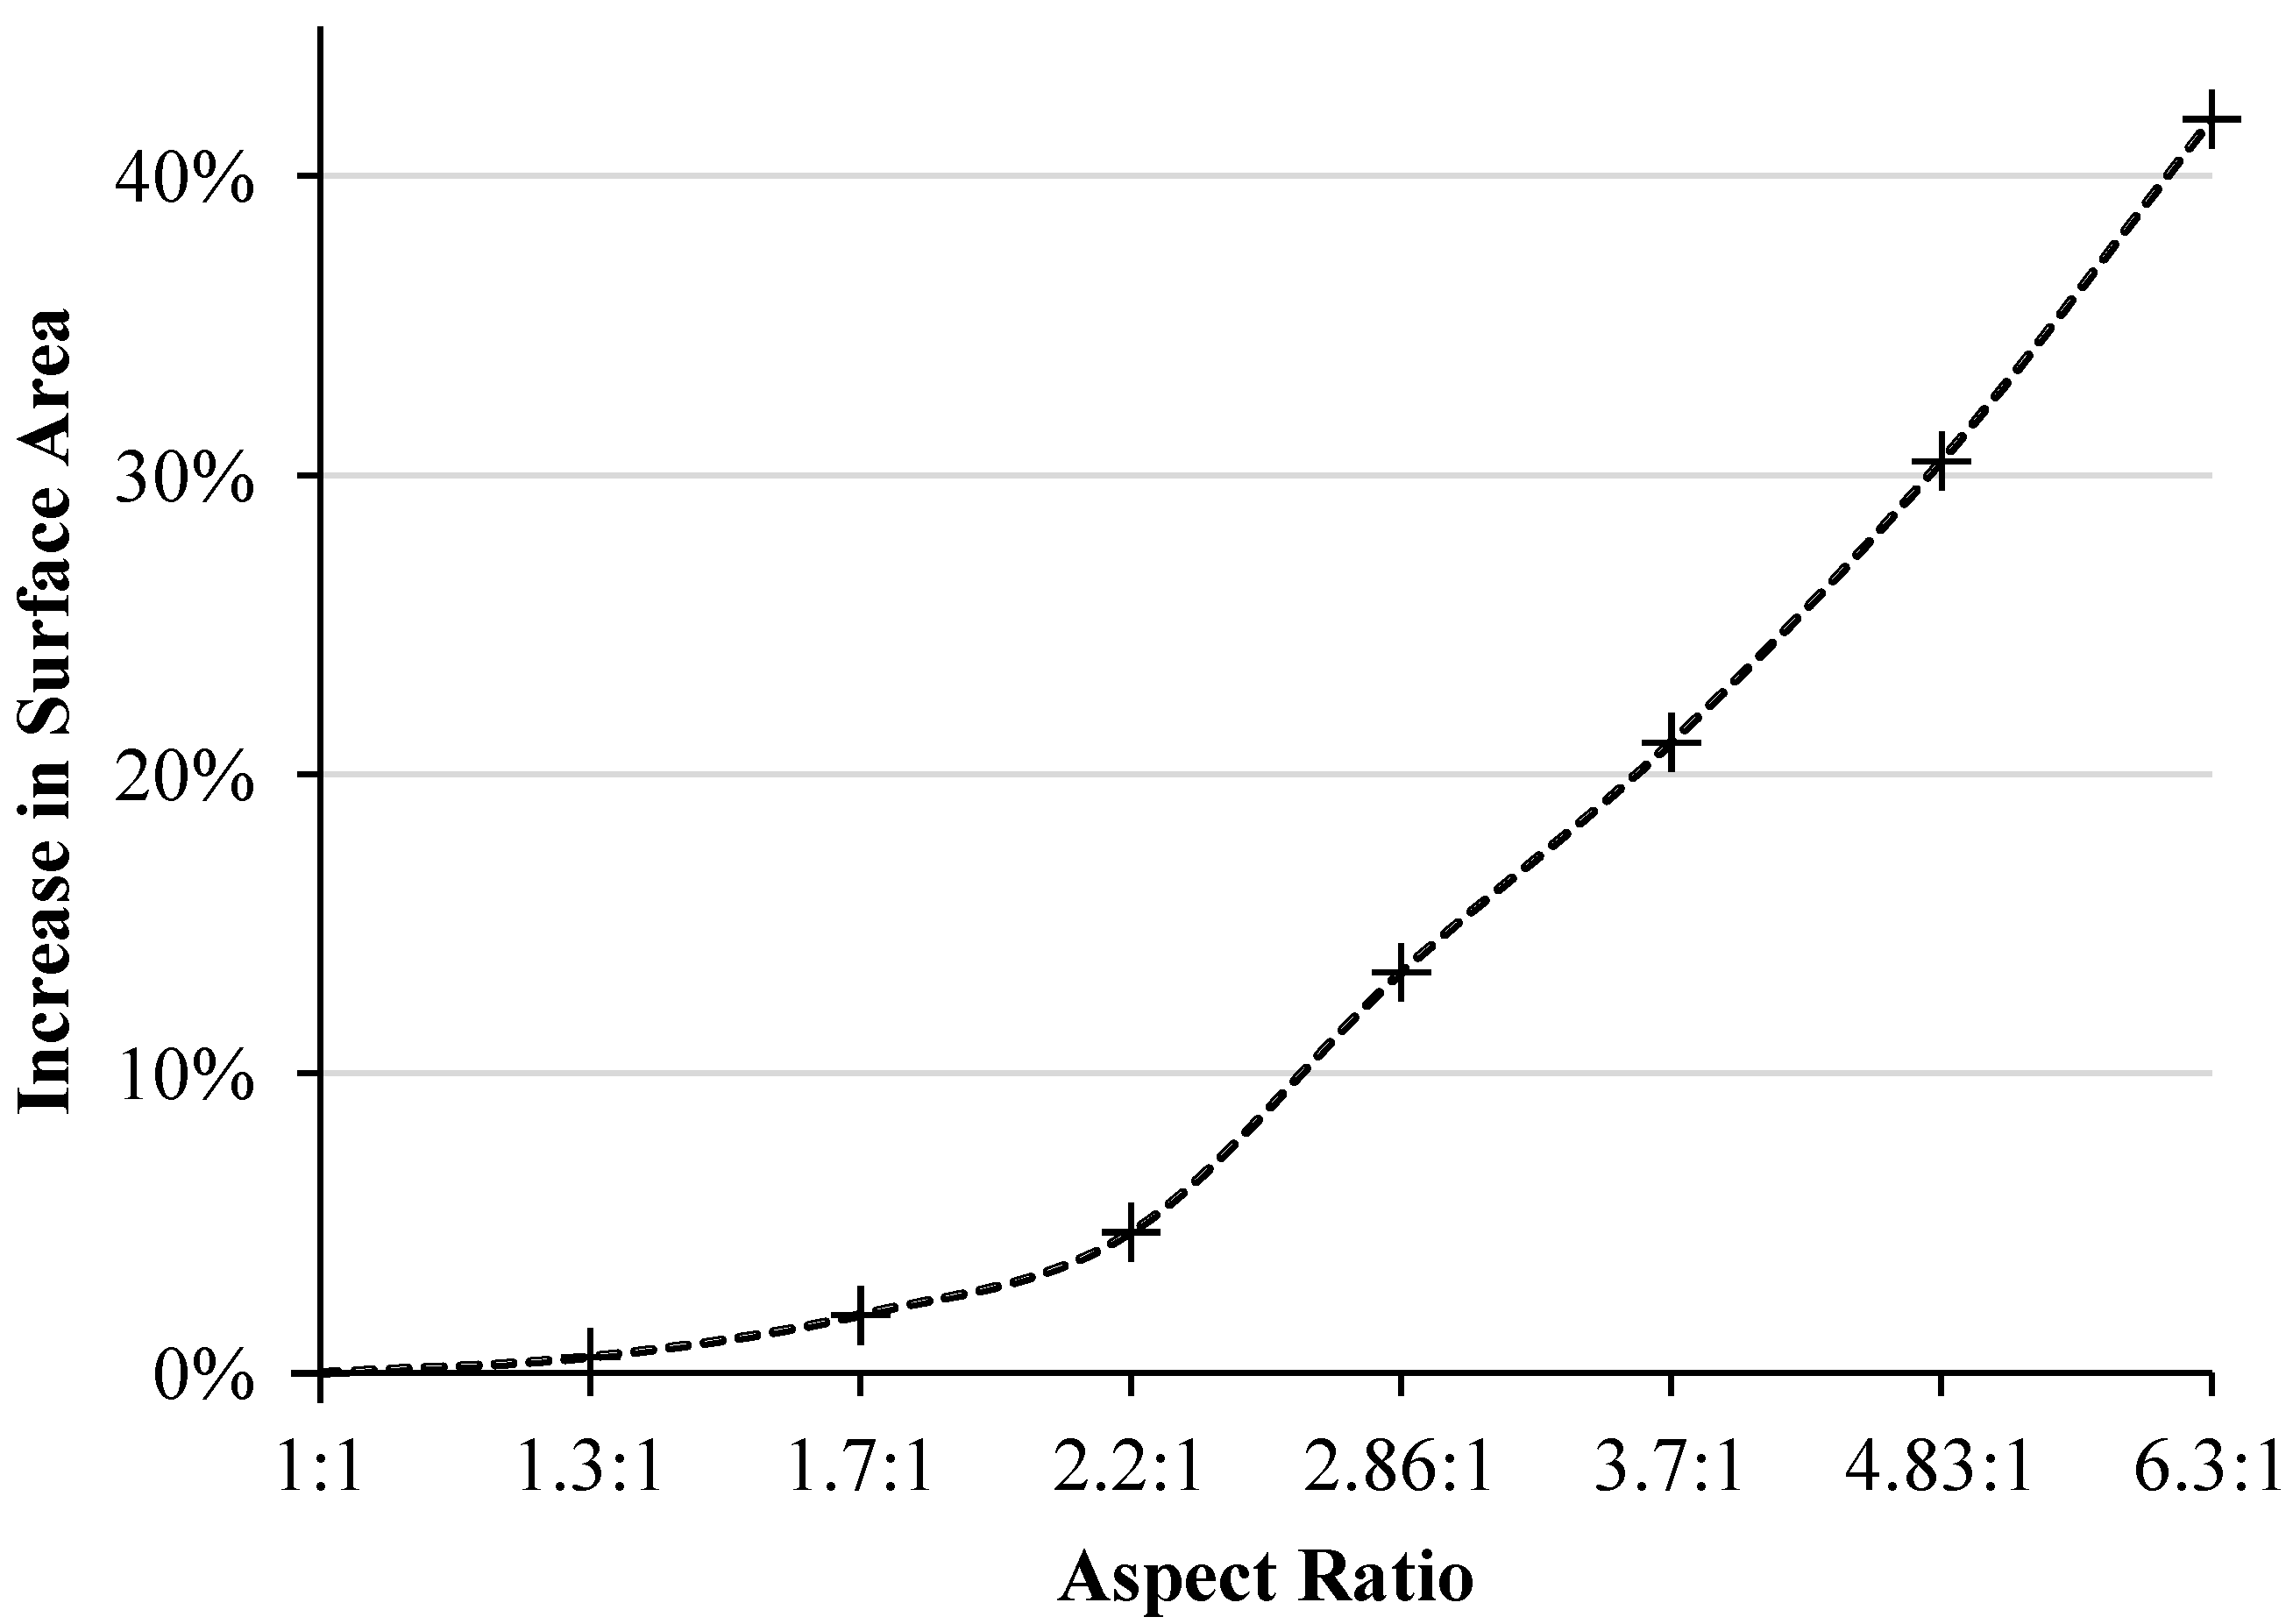
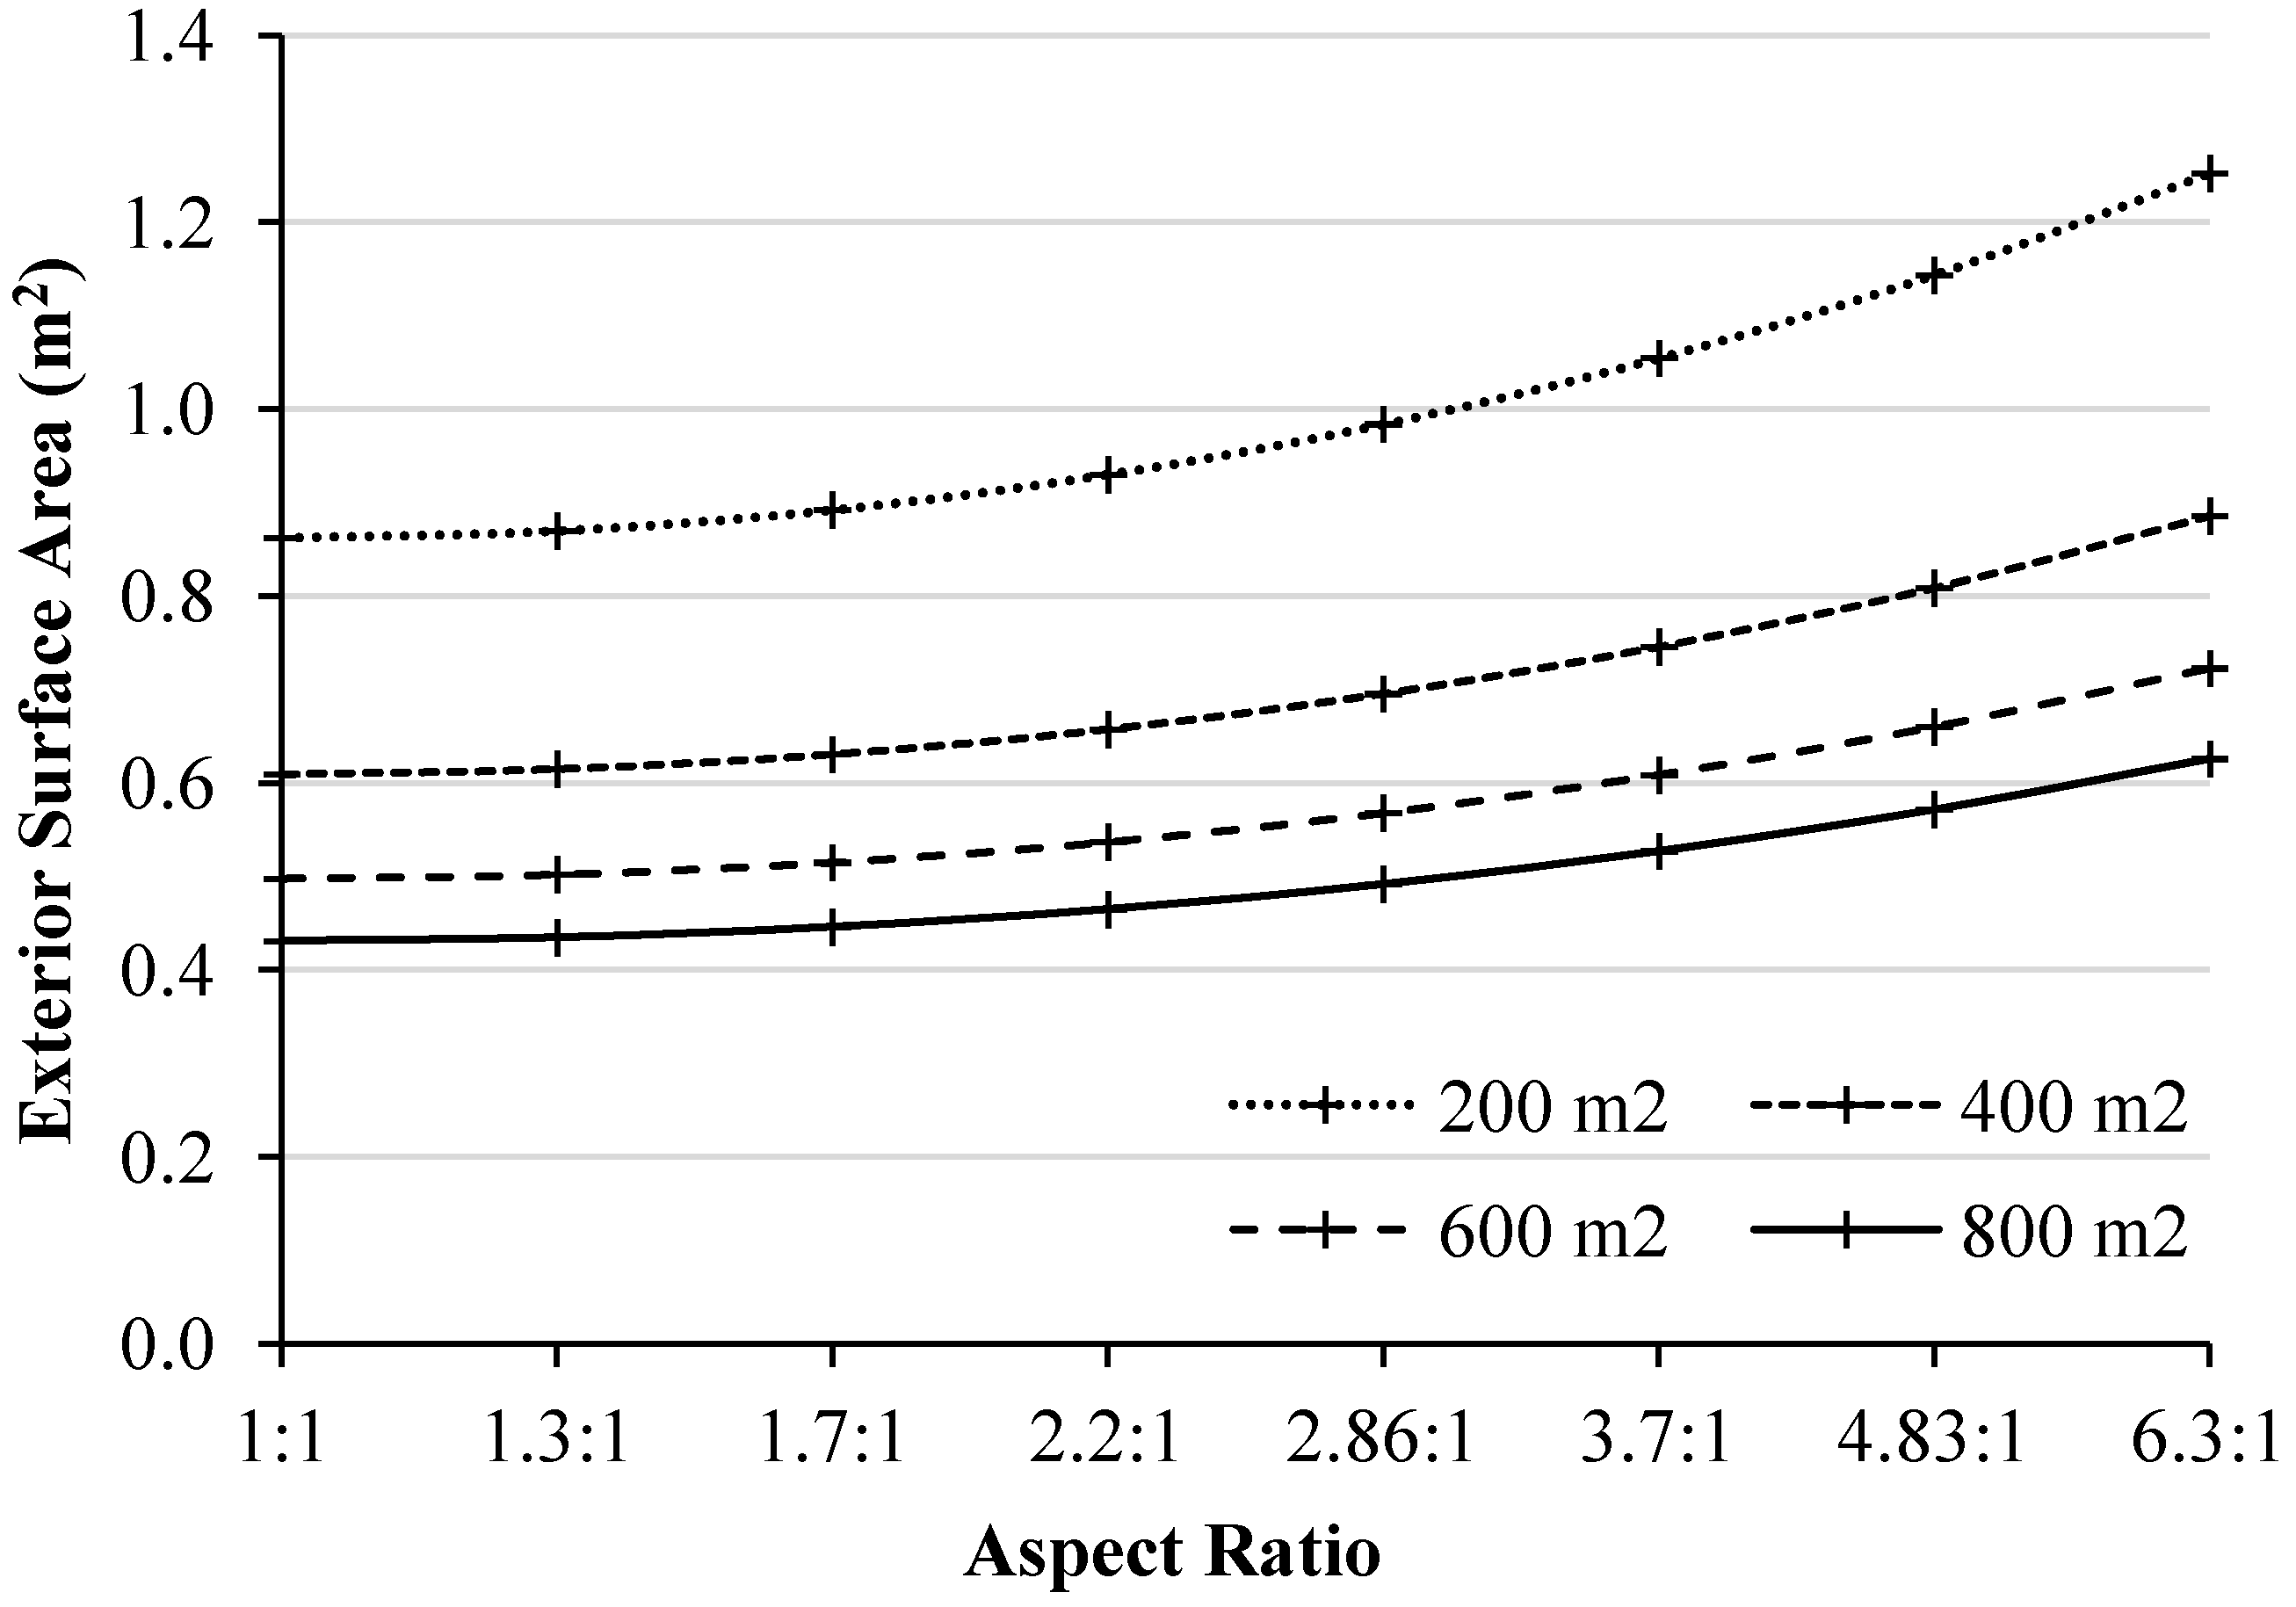
1.2. The Envelope: Thermal Transfer and Area


1.3. The Envelope: Conduction
1.4. The Envelope: Convection
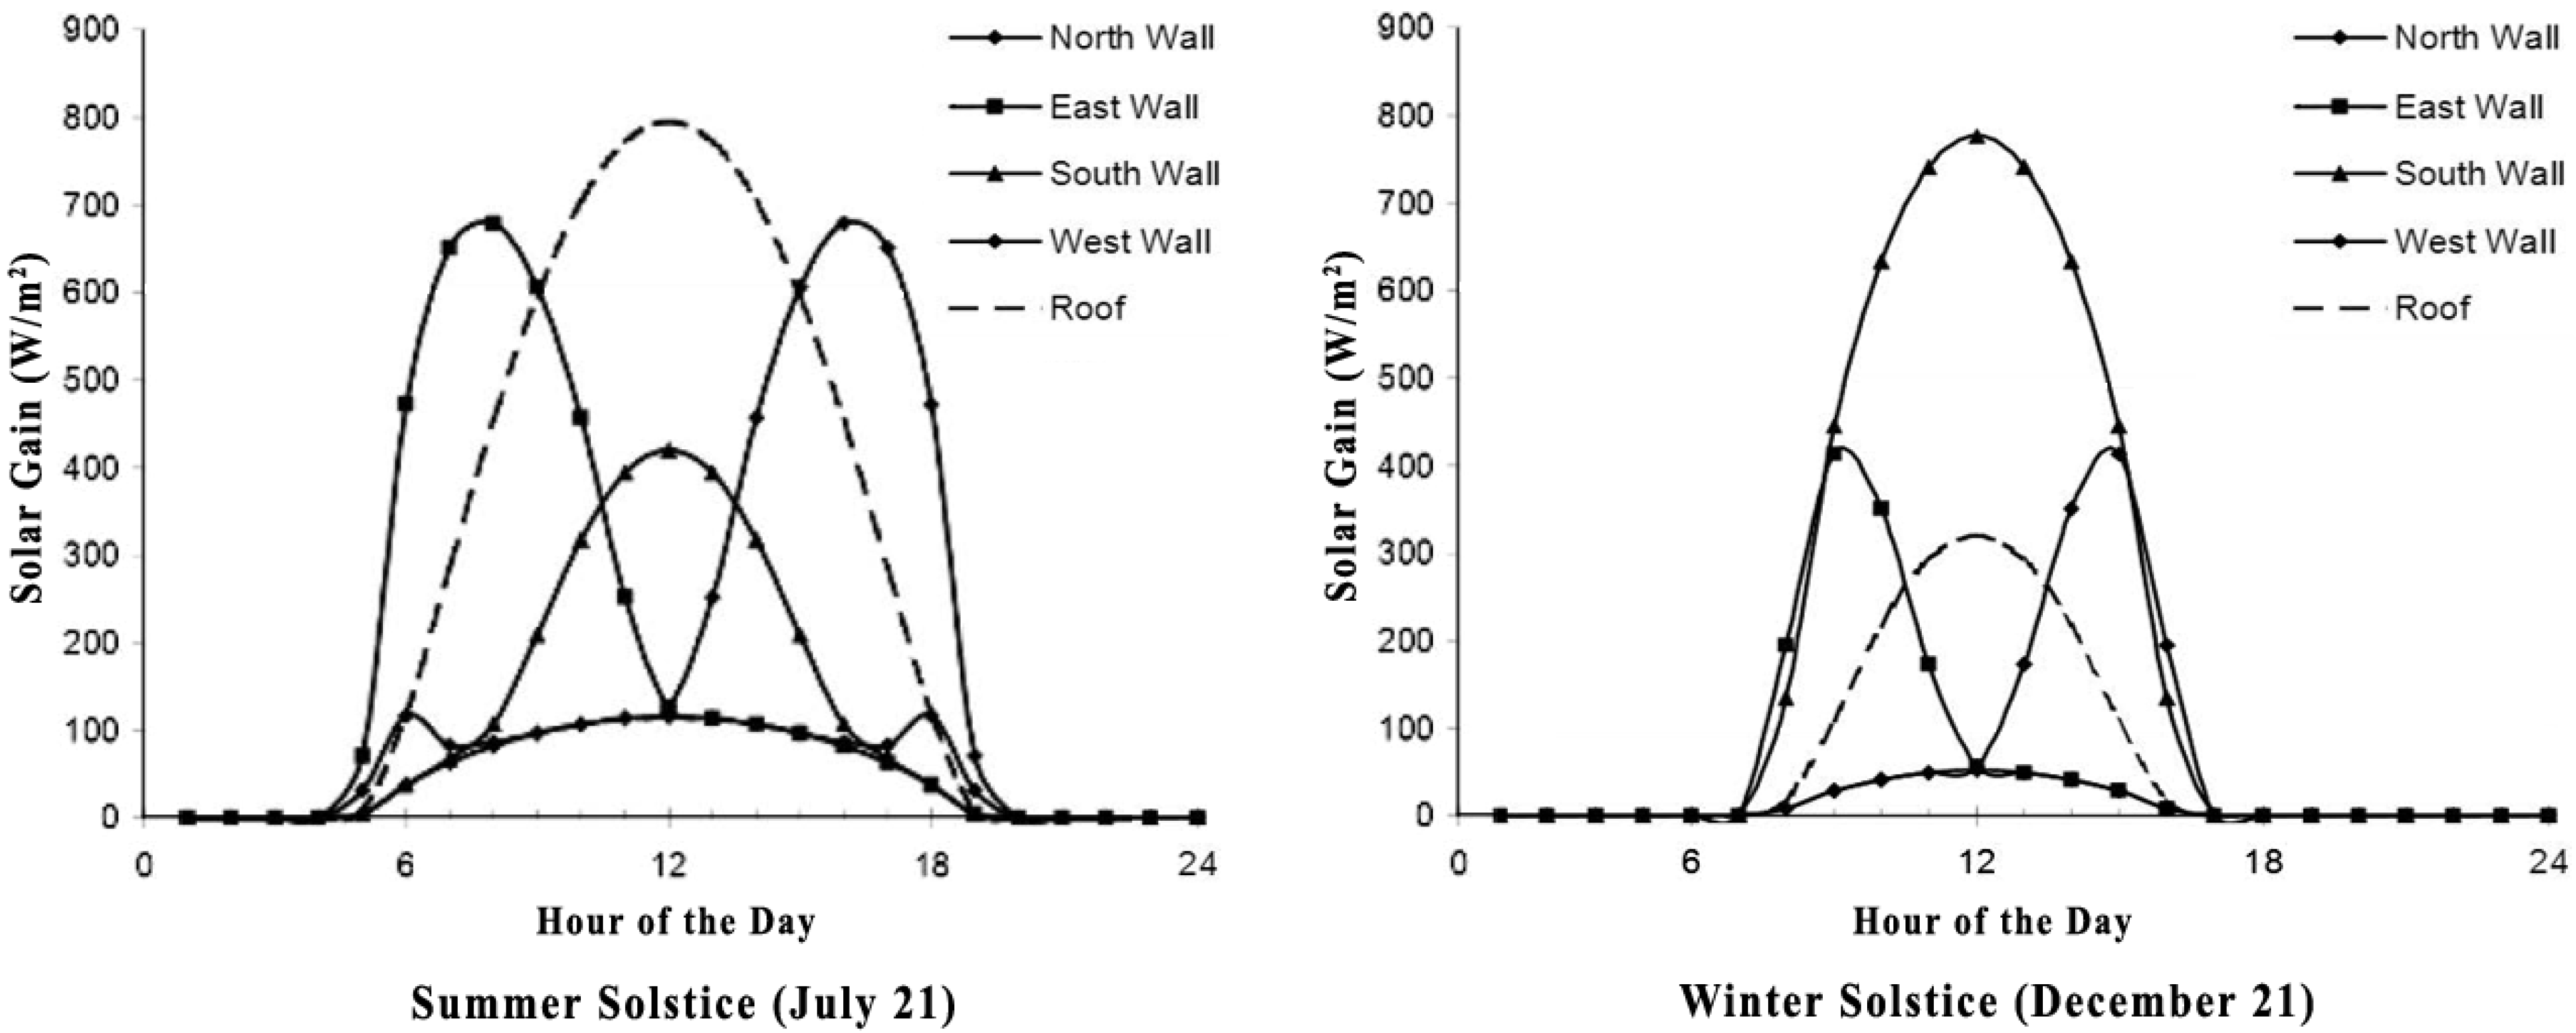
1.5. Solar Radiation

2. Methodology
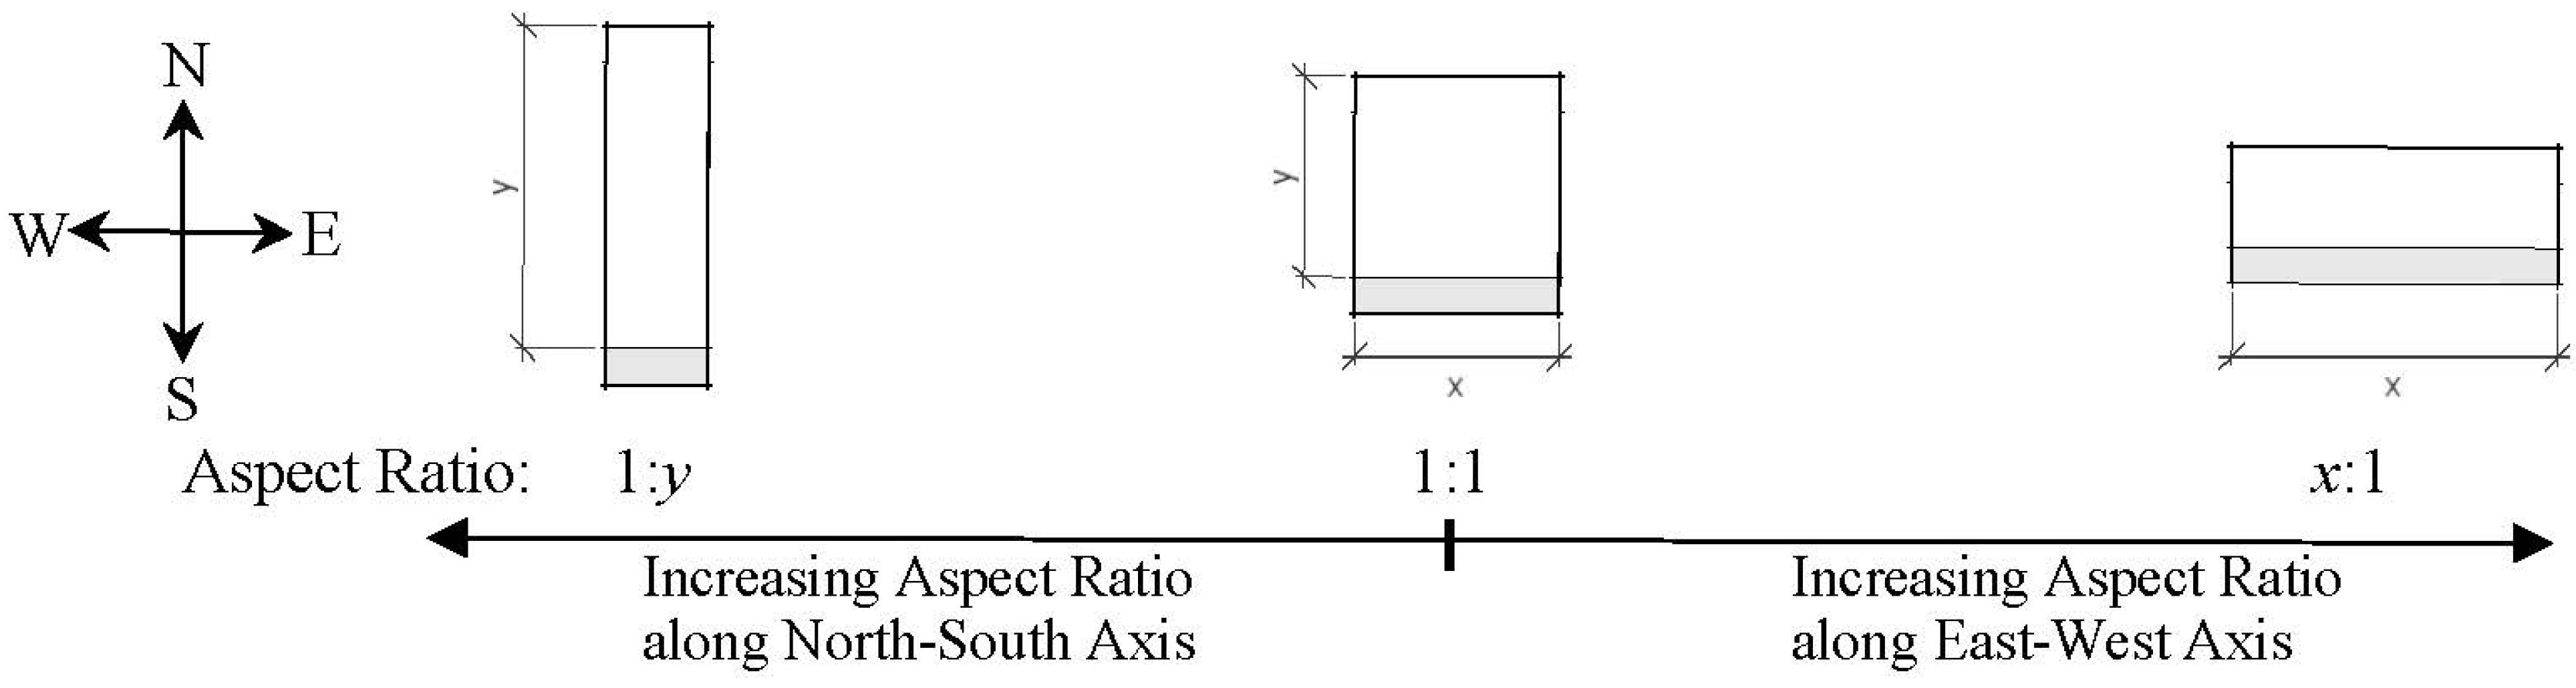
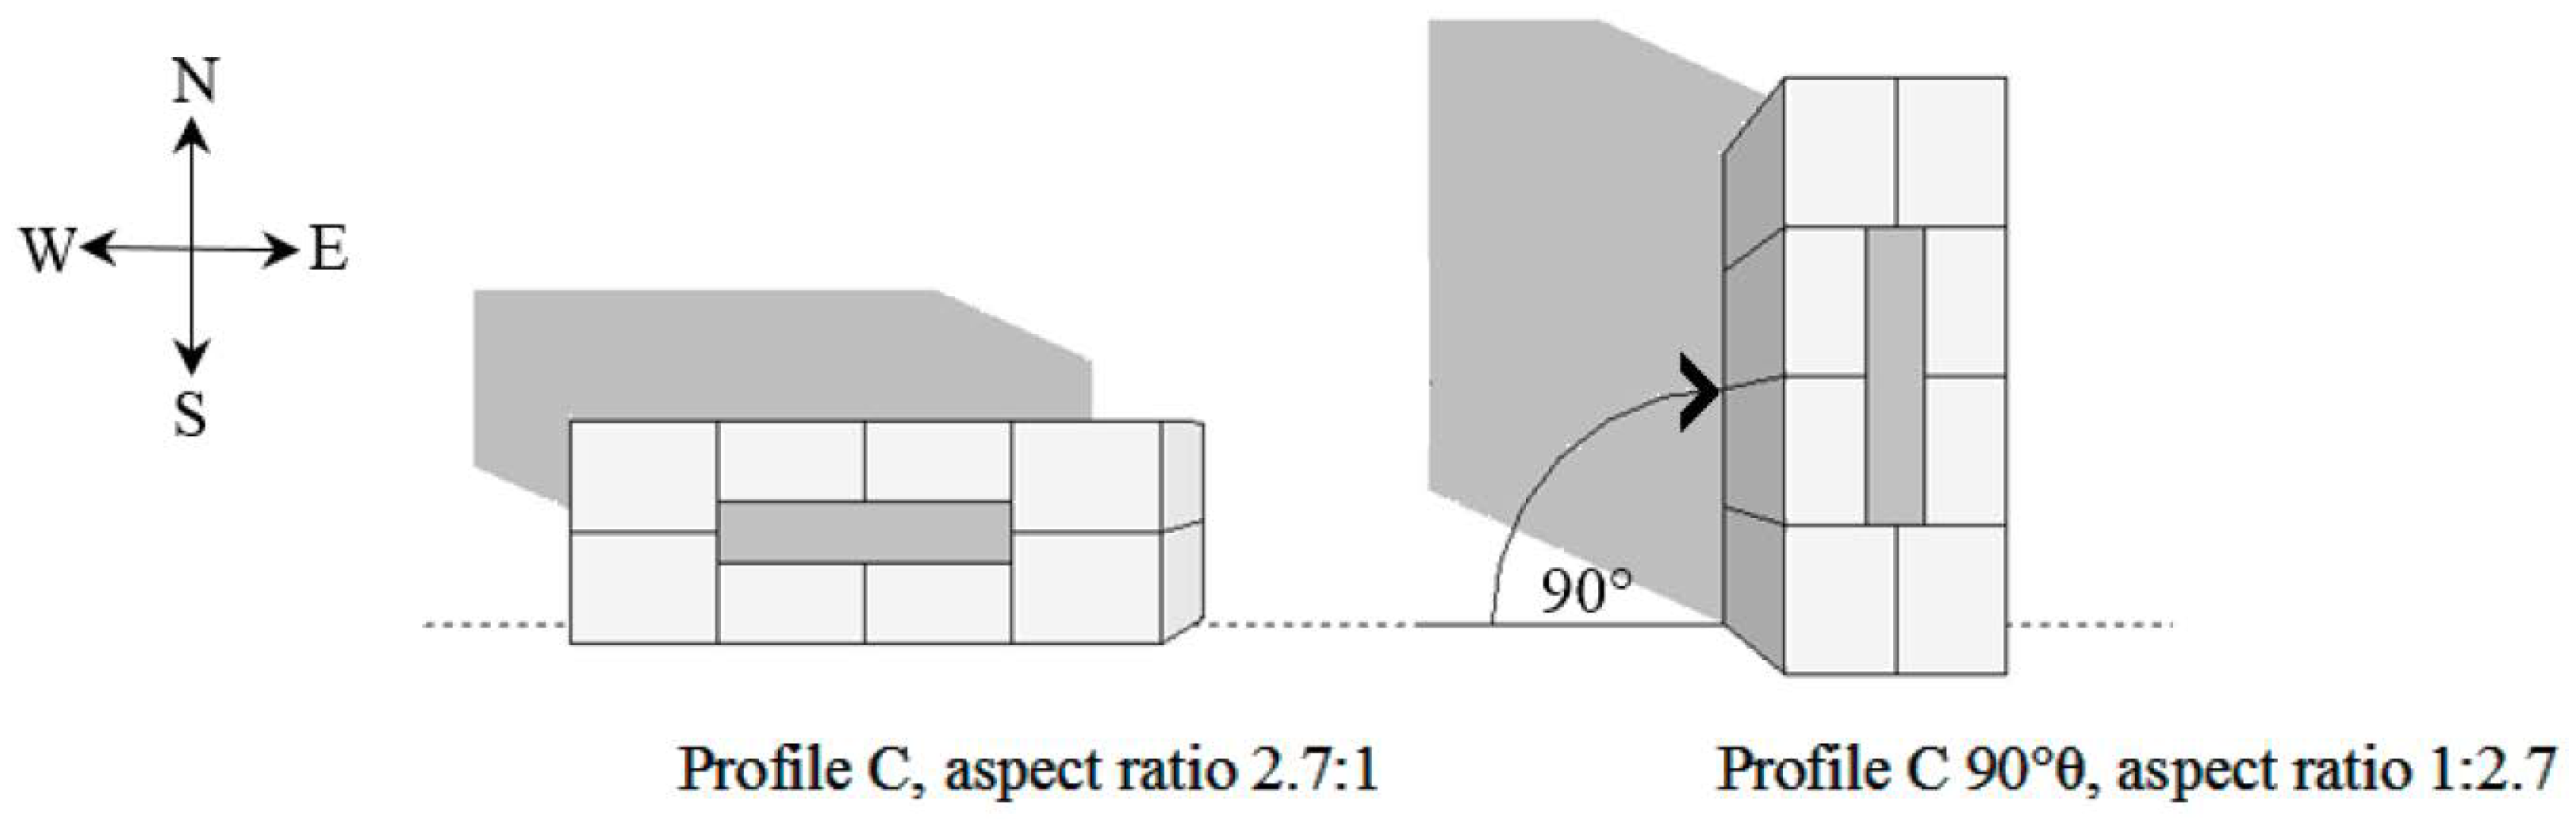
2.1. Building Design
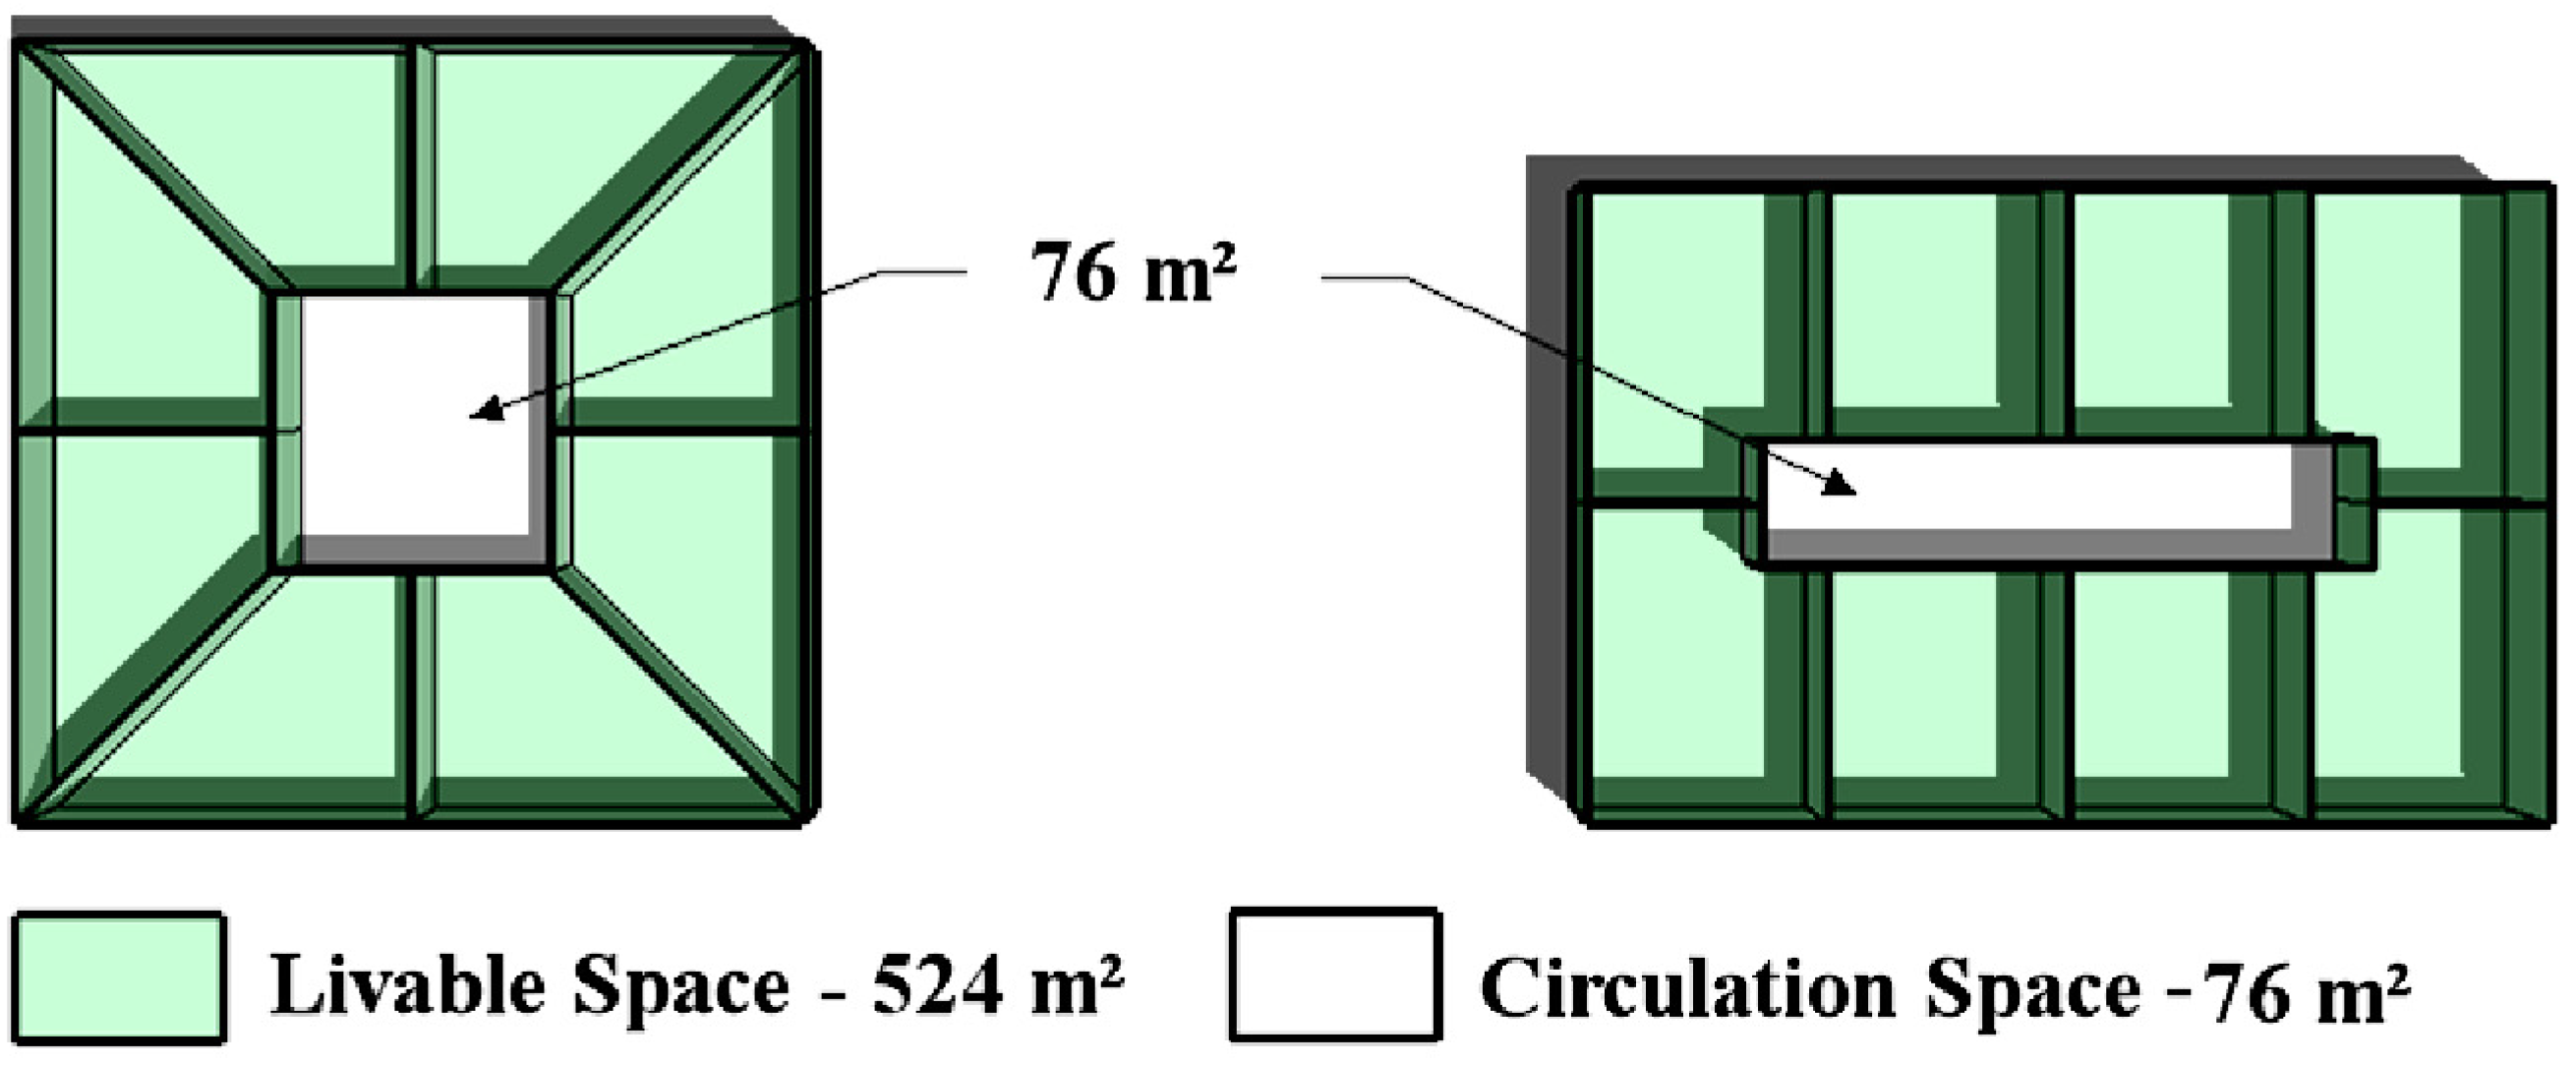
2.2. Plan Design


 | ||||||||||||||
|---|---|---|---|---|---|---|---|---|---|---|---|---|---|---|
| Building Profile: | A | B | B90°θ | C | C90°θ | D | D90°θ | E | E90°θ | F | F90°θ | G | G90°θ | |
| Aspect Ratio (X:Y) | 1:1 | 1.3:1 | 1:1.3 | 1.5:1 | 1.5:1 | 2:1 | 1:2 | 2.7:1 | 1:2.7 | 3.2:1 | 1:3.2 | 4.2:1 | 1:4.2 | |
| Dimensions X | 24.5 | 28.0 | 21.4 | 30.0 | 20.0 | 35.0 | 17.1 | 40.0 | 15.0 | 44.0 | 13.6 | 50.0 | 12.0 | (m) |
| Dimension Y | 24.5 | 21.4 | 28.0 | 20.0 | 30.0 | 17.1 | 35.0 | 15.0 | 40.0 | 13.6 | 44.0 | 12.0 | 50.0 | (m) |
| Wall Surface Area | 2987 | 3011 | 3048 | 3176 | 3353 | 3511 | 3780 | (m2) | ||||||
| Glazing Area (% of exterior surface) | 36% | 36% | 36% | 36% | 36% | 36% | 36% | - | ||||||
| Glazing Area | 1075 | 1084 | 1097 | 1143 | 1207 | 1264 | 1361 | (m2) | ||||||
| South Facing Surface Area | 747 | 853 | 652 | 914 | 610 | 1067 | 521 | 1219 | 457 | 1341 | 415 | 1524 | 366 | (m2) |
| South Facing Surface (% of exterior surface) | 25% | 28% | 22% | 30% | 20% | 34% | 16% | 36% | 14% | 38% | 12% | 40% | 10% | - |
2.3. Construction Parameters
| Envelope | |||
|---|---|---|---|
| Component | Description | U Value (W/m2K) | Emissivity |
| Exterior Wall: | Aluminum and Glass Spandrel with batt insulation, metal frame | 0.364 | 0.6 |
| Roof: | Built up roof, polyurethane insulation | 0.155 | 0.6 |
| Ground Floor: | Earth contact with insulated footings | ||
| Glazing: | Double pane, Low emissivity with argon gas (Glass Type Code: 2642) | 0.3 | 0.1 |
| Solar Heat Gain Coeff.: 0.75, Solar Transmittance: 0.54 | |||
| Floor: | Concrete slab (150 mm) | ||
| HVAC | |||
| Component | Description | ||
| Terminal: | Fan Coil Unit (four pipe) | ||
| Thermostat: | Heating Set Point: 20 °C | Cooling Set Point: 25.6 °C | |
| Cooling Plant: | Centrifugal Hermetic Chiller | Autosized between 150 and 299 tons | |
| Fuel Source: Electricity | Coefficient of performance: 4.6 | ||
| Heating Plant: | Boiler (natural draft) | Autosized | |
| Fuel Source: Natural Gas | Efficiency: 80% | ||
| Supply Ventilation: | 7.5 L/s per person (~0.4 L/s per m2) | ||
| Internal Load and Schedule | |||
| People Density: 200 m2/p | Lighting Load: 10.8 W/m2 | Equipment Load: 7.0 W/m2 | |
| Weekday Schedule: | Return at: 4 PM | ||
| Leave at: 9 AM | |||
2.4. Climatic Data
| Climatic Attributes | Vancouver | Calgary | Toronto | Montreal | Halifax |
|---|---|---|---|---|---|
| Heating Degree Days | 2926 | 4948 | 4066 | 4575 | 4367 |
| Cooling Degree Days | 44 | 44 | 252 | 235 | 104 |
| Climatic Region [16] | wet, cool | dry, very cold | moderately wet, cold | moderately wet, cold | wet and cold |
3. Results and Discussion
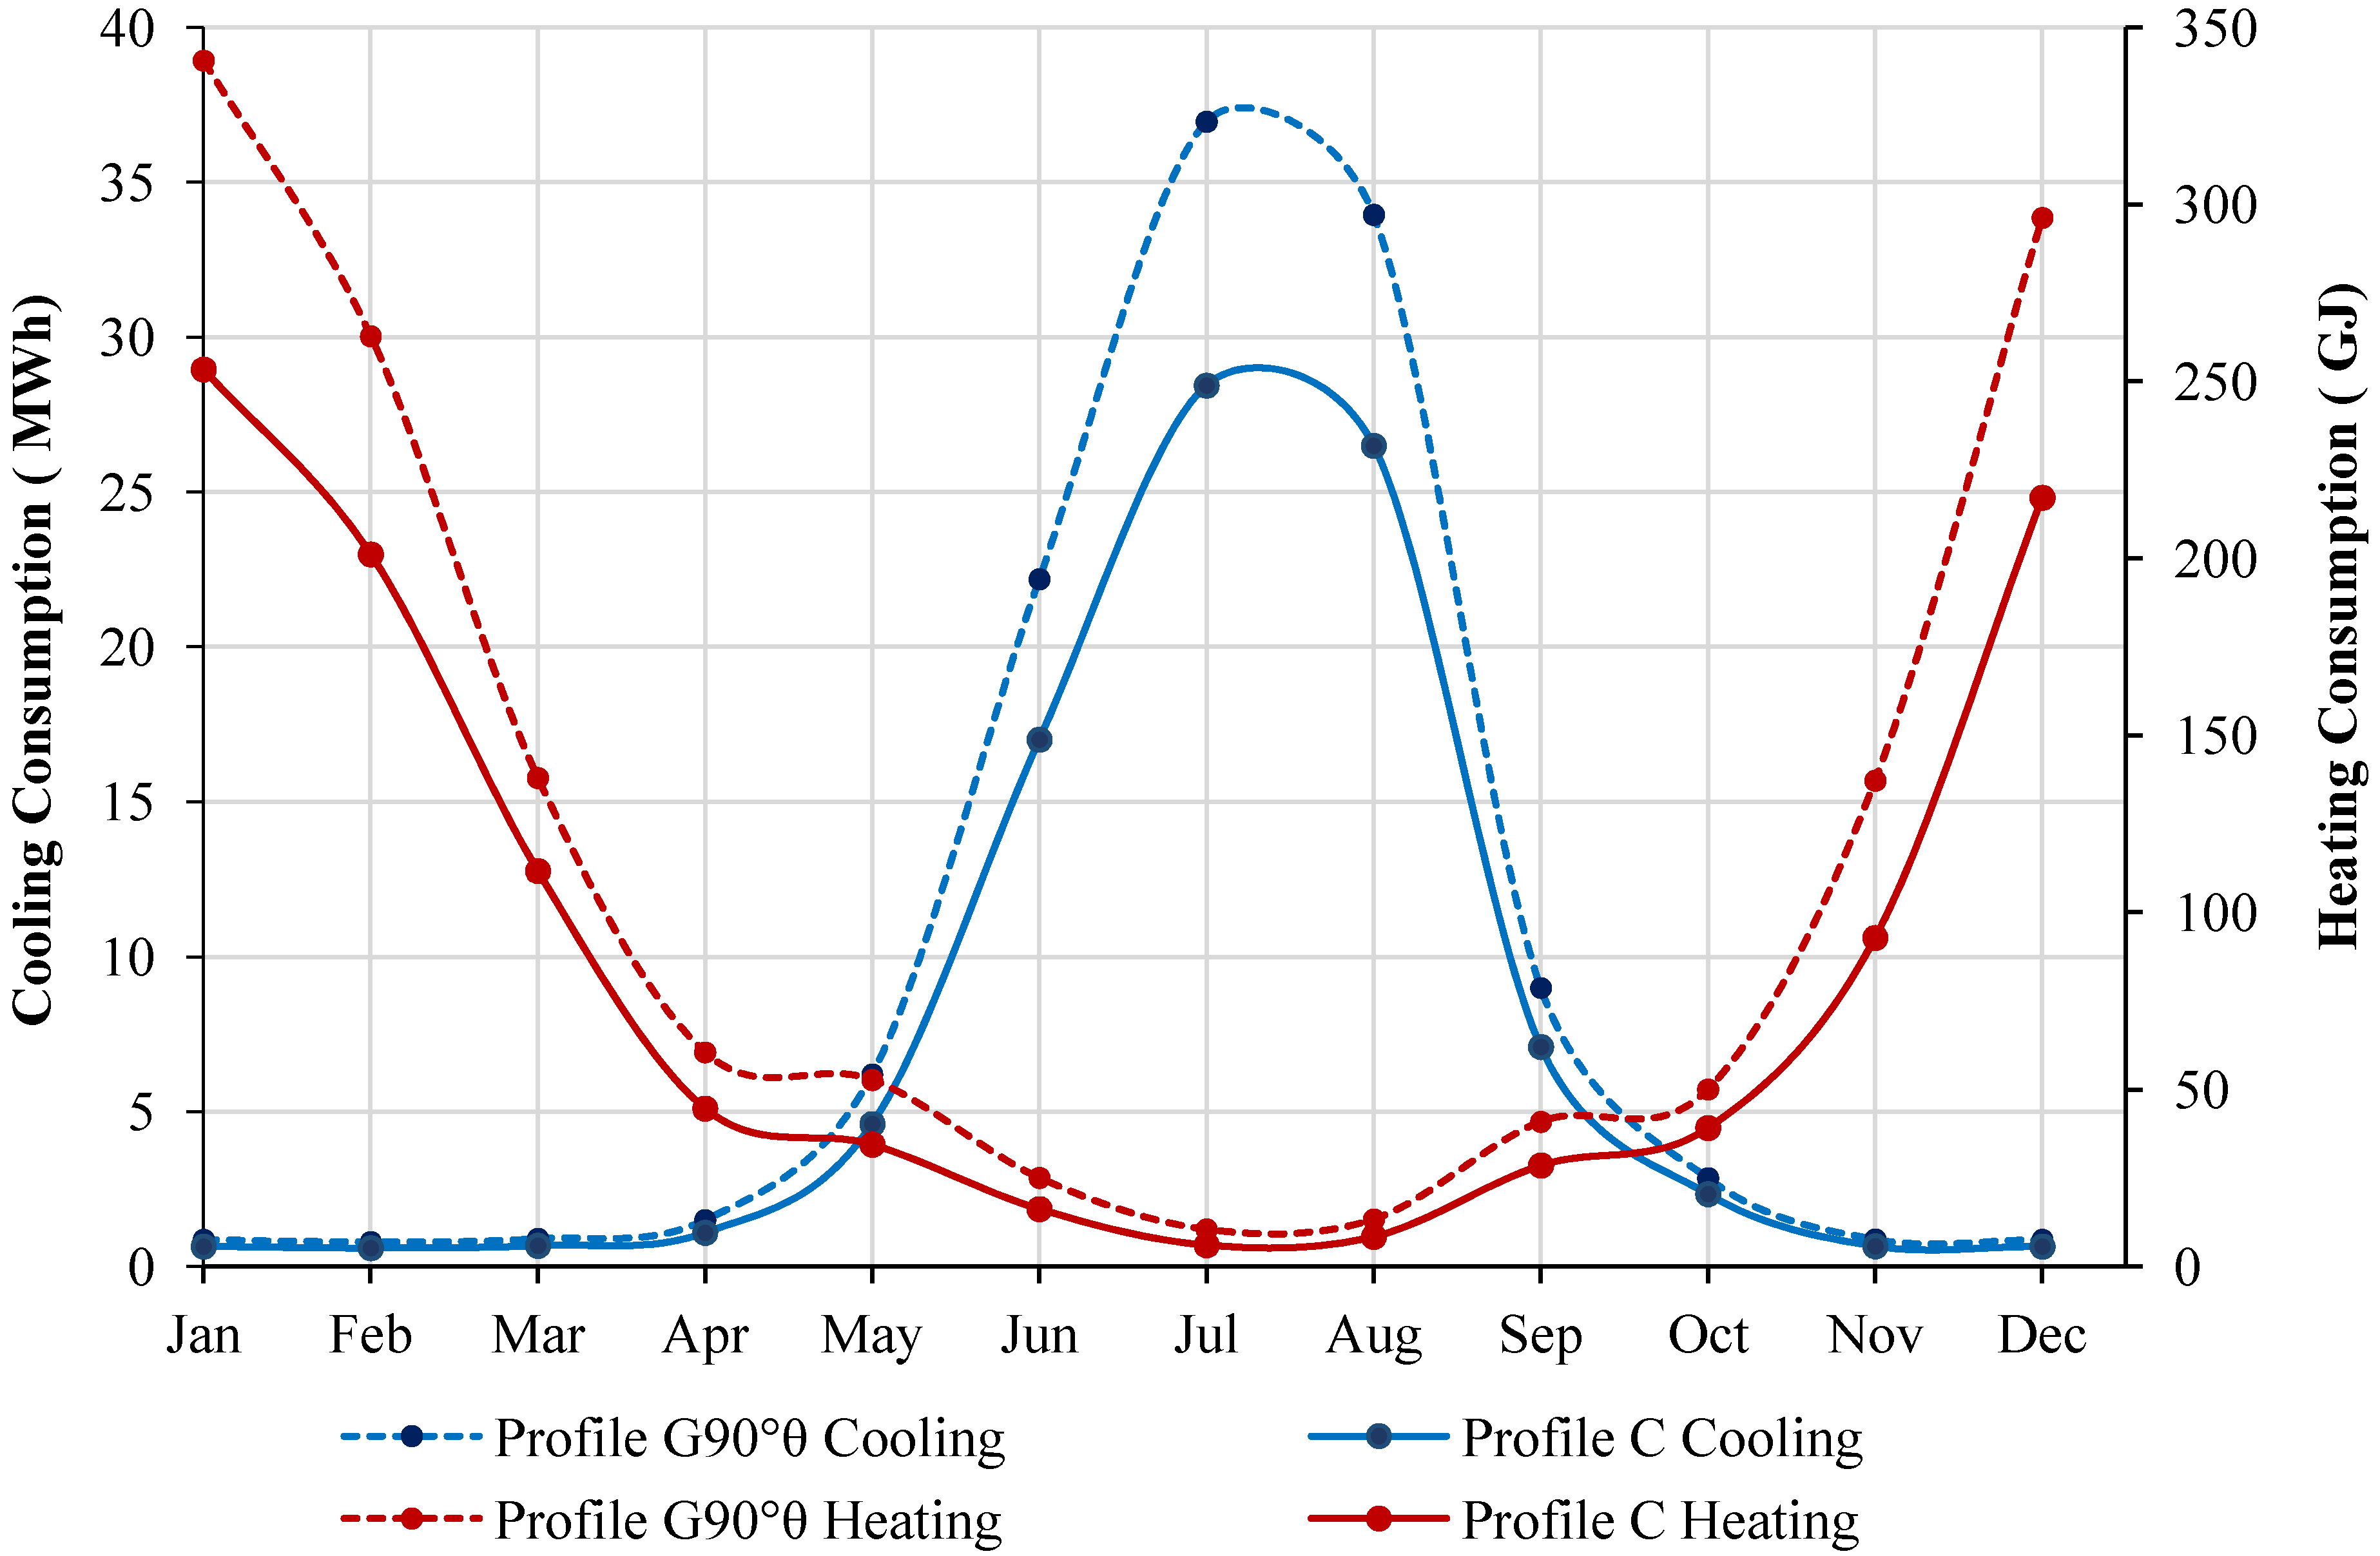
3.1. Detail Monthly Analysis of Toronto


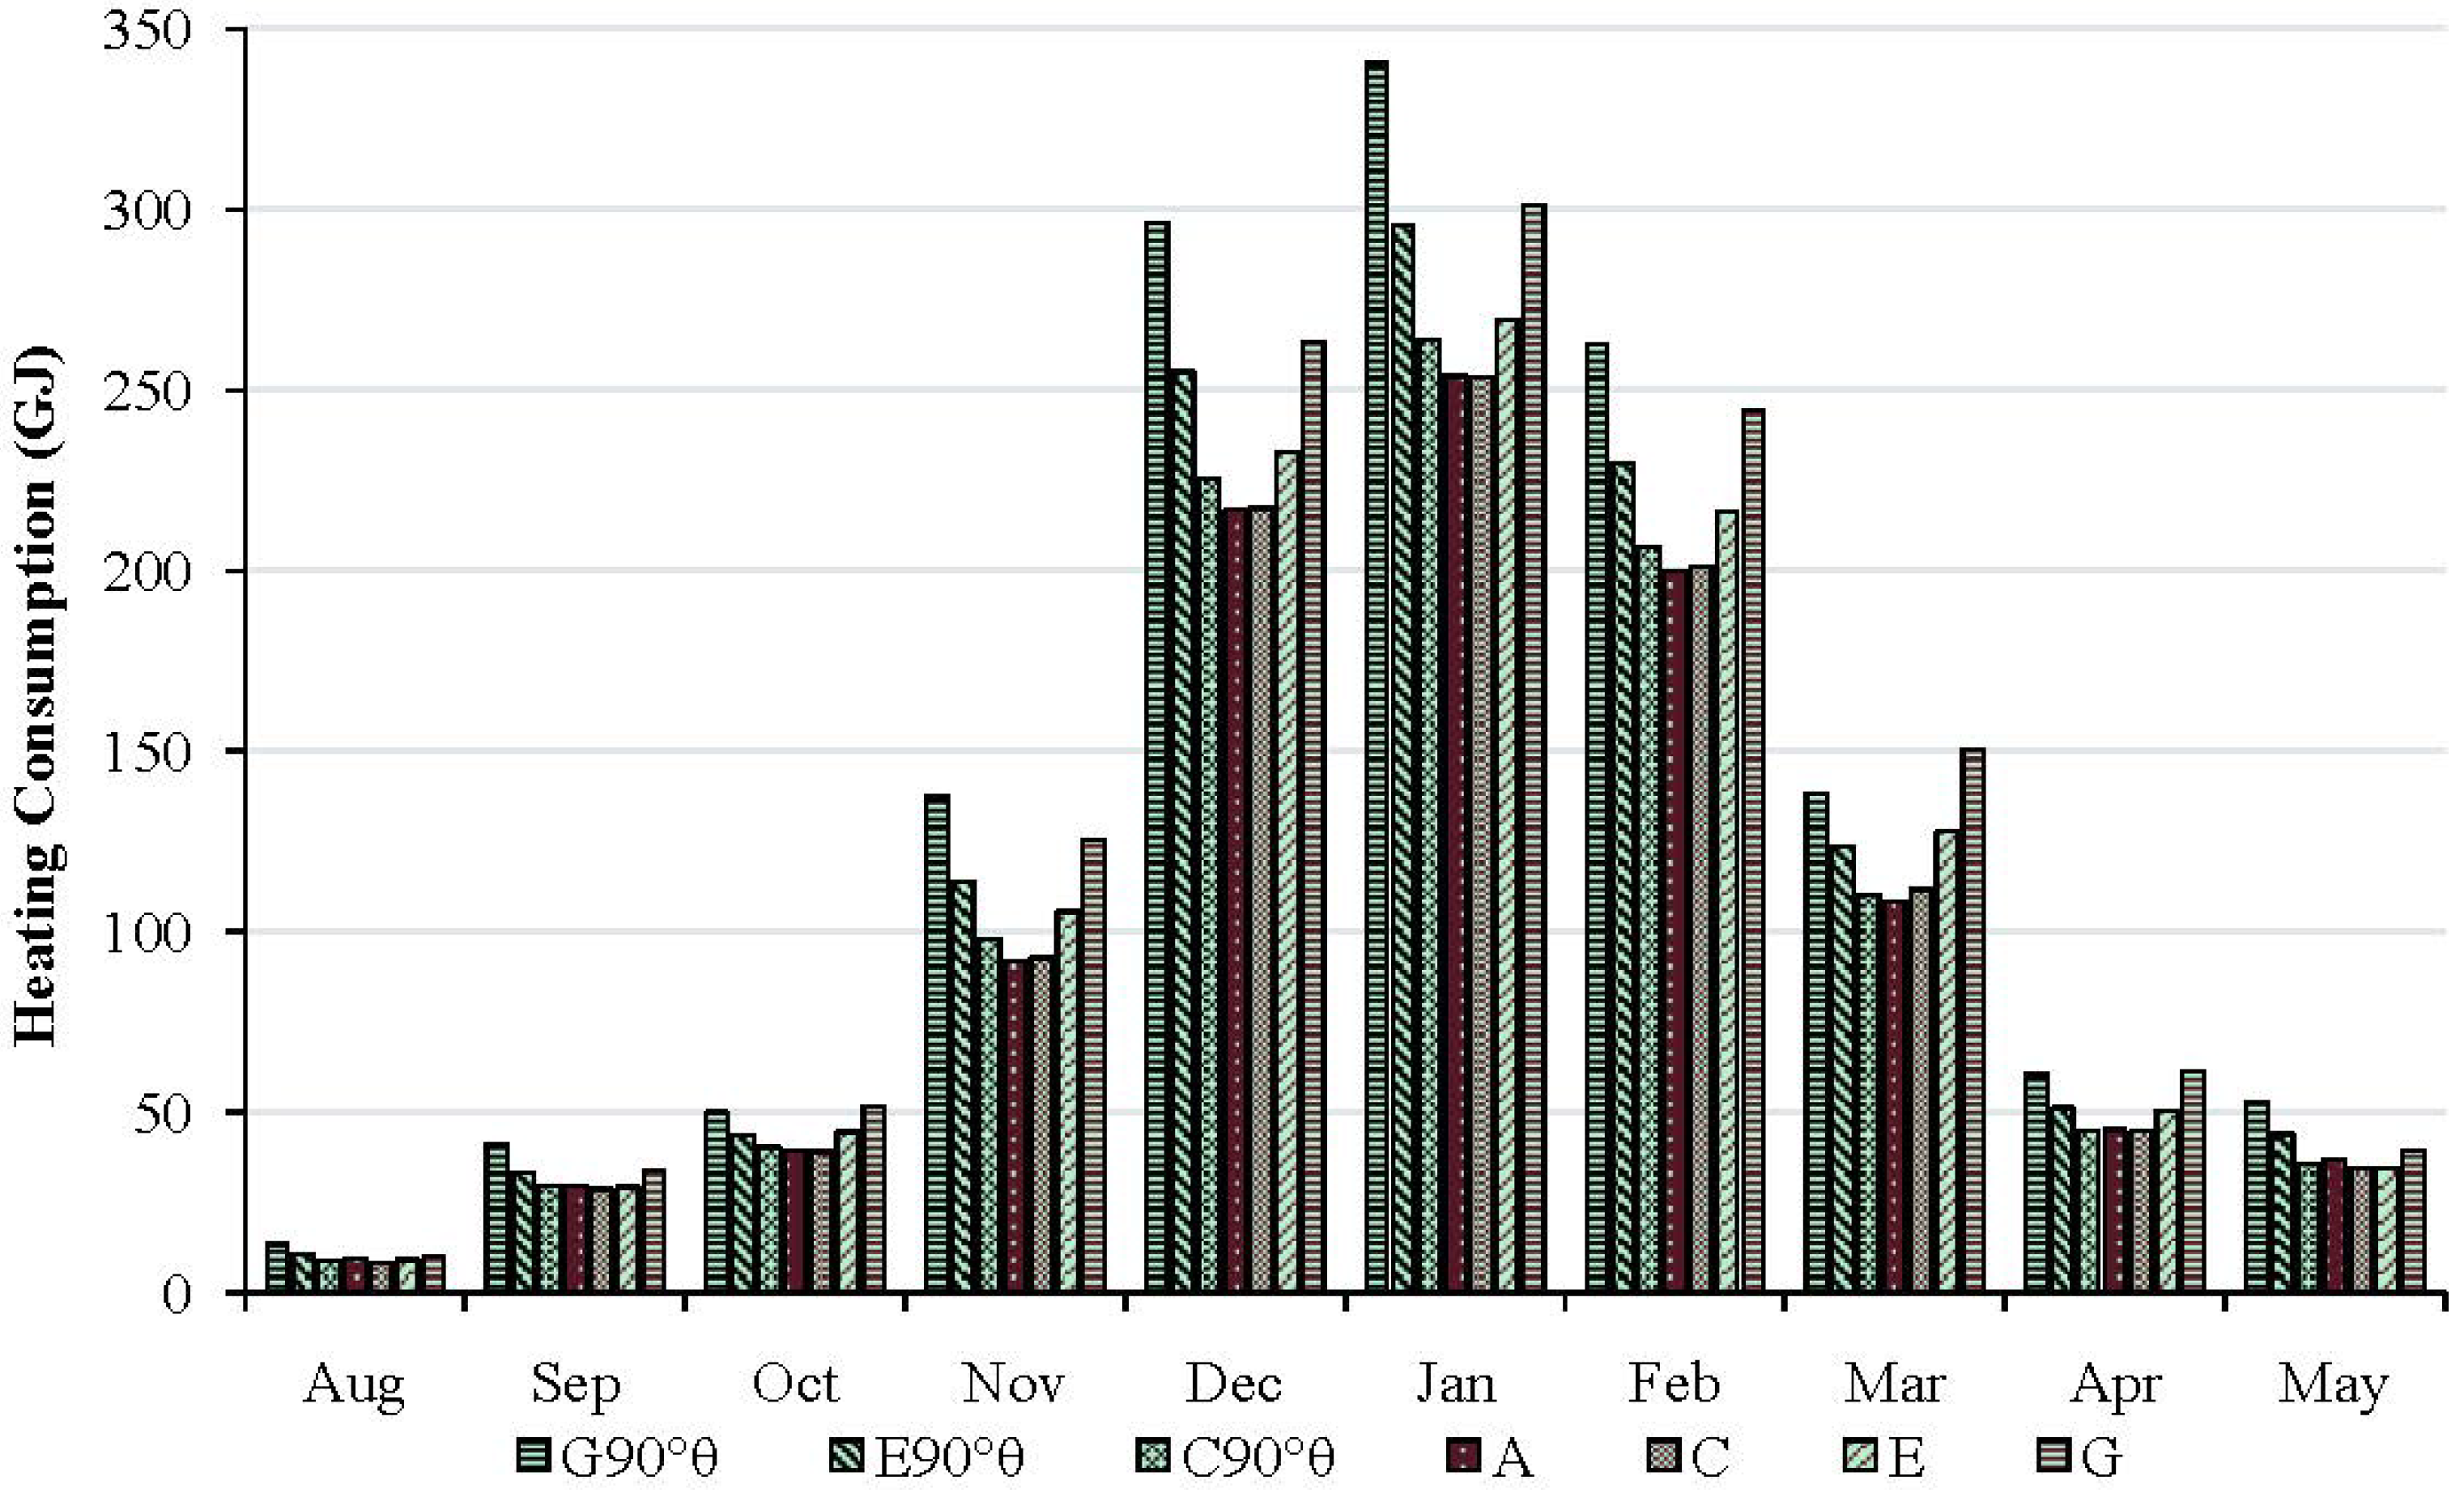
3.2. Detail Monthly Analysis of Toronto: Heating
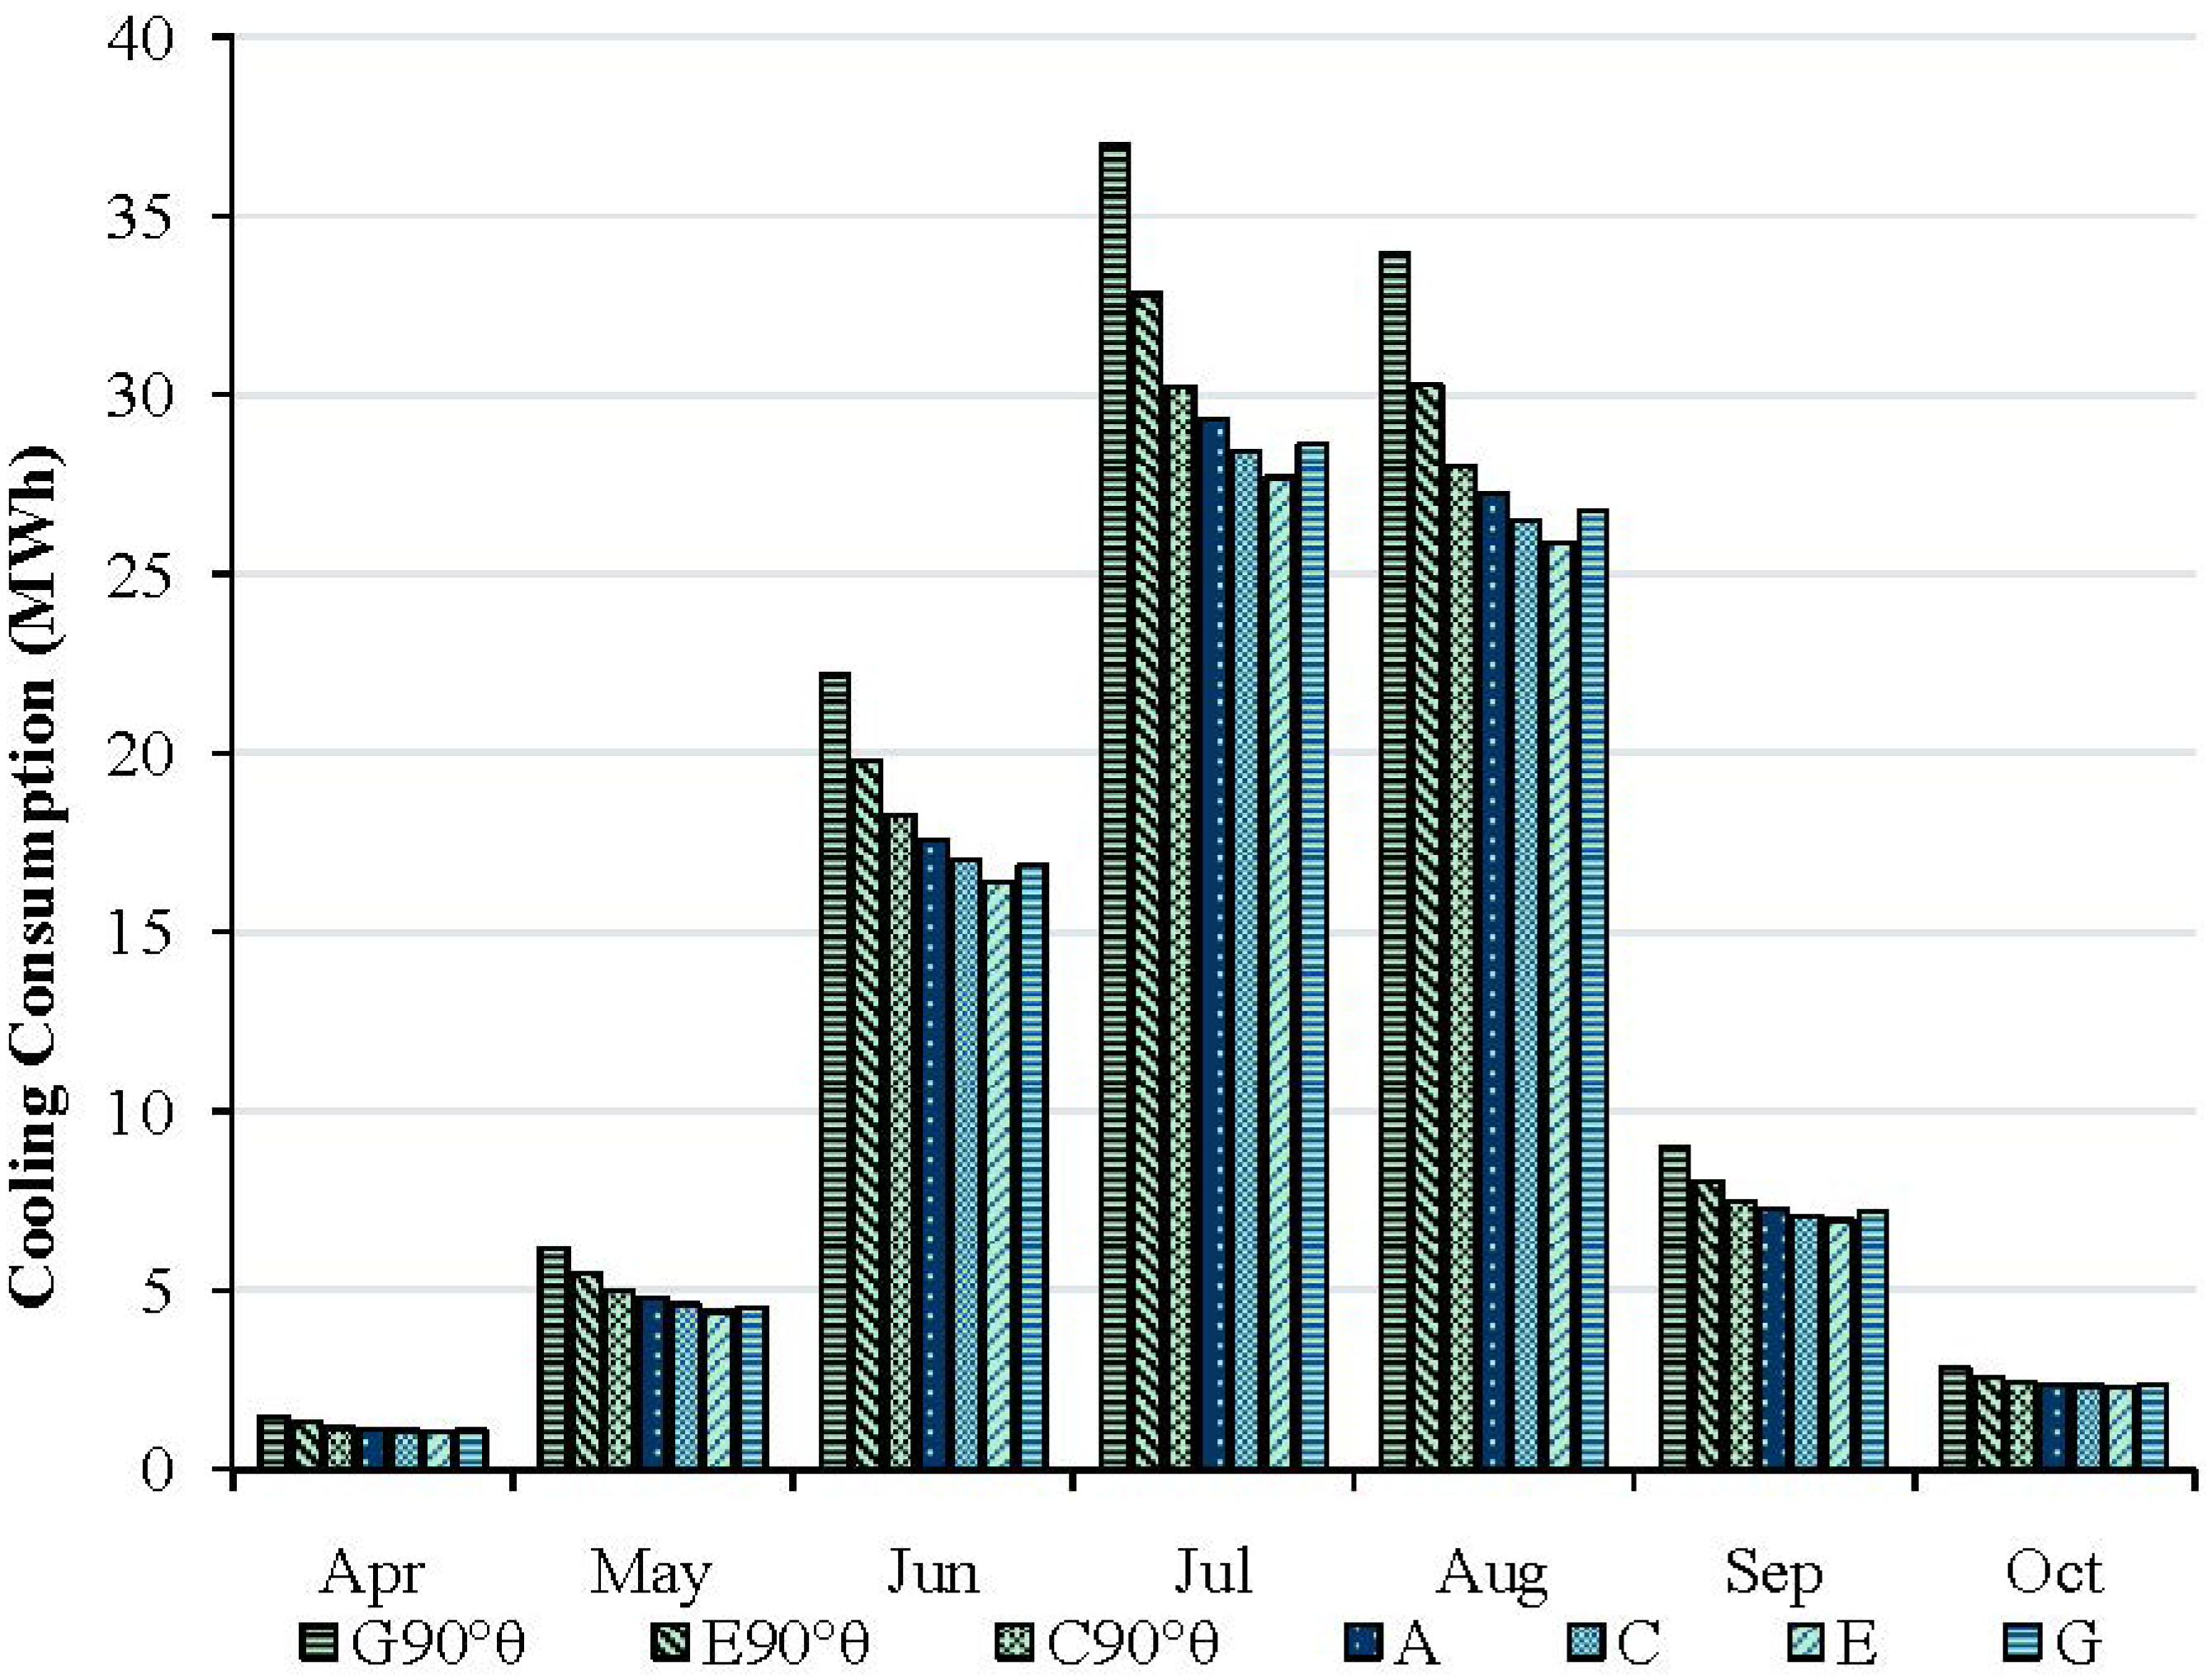
3.3. Monthly Analysis: Cooling
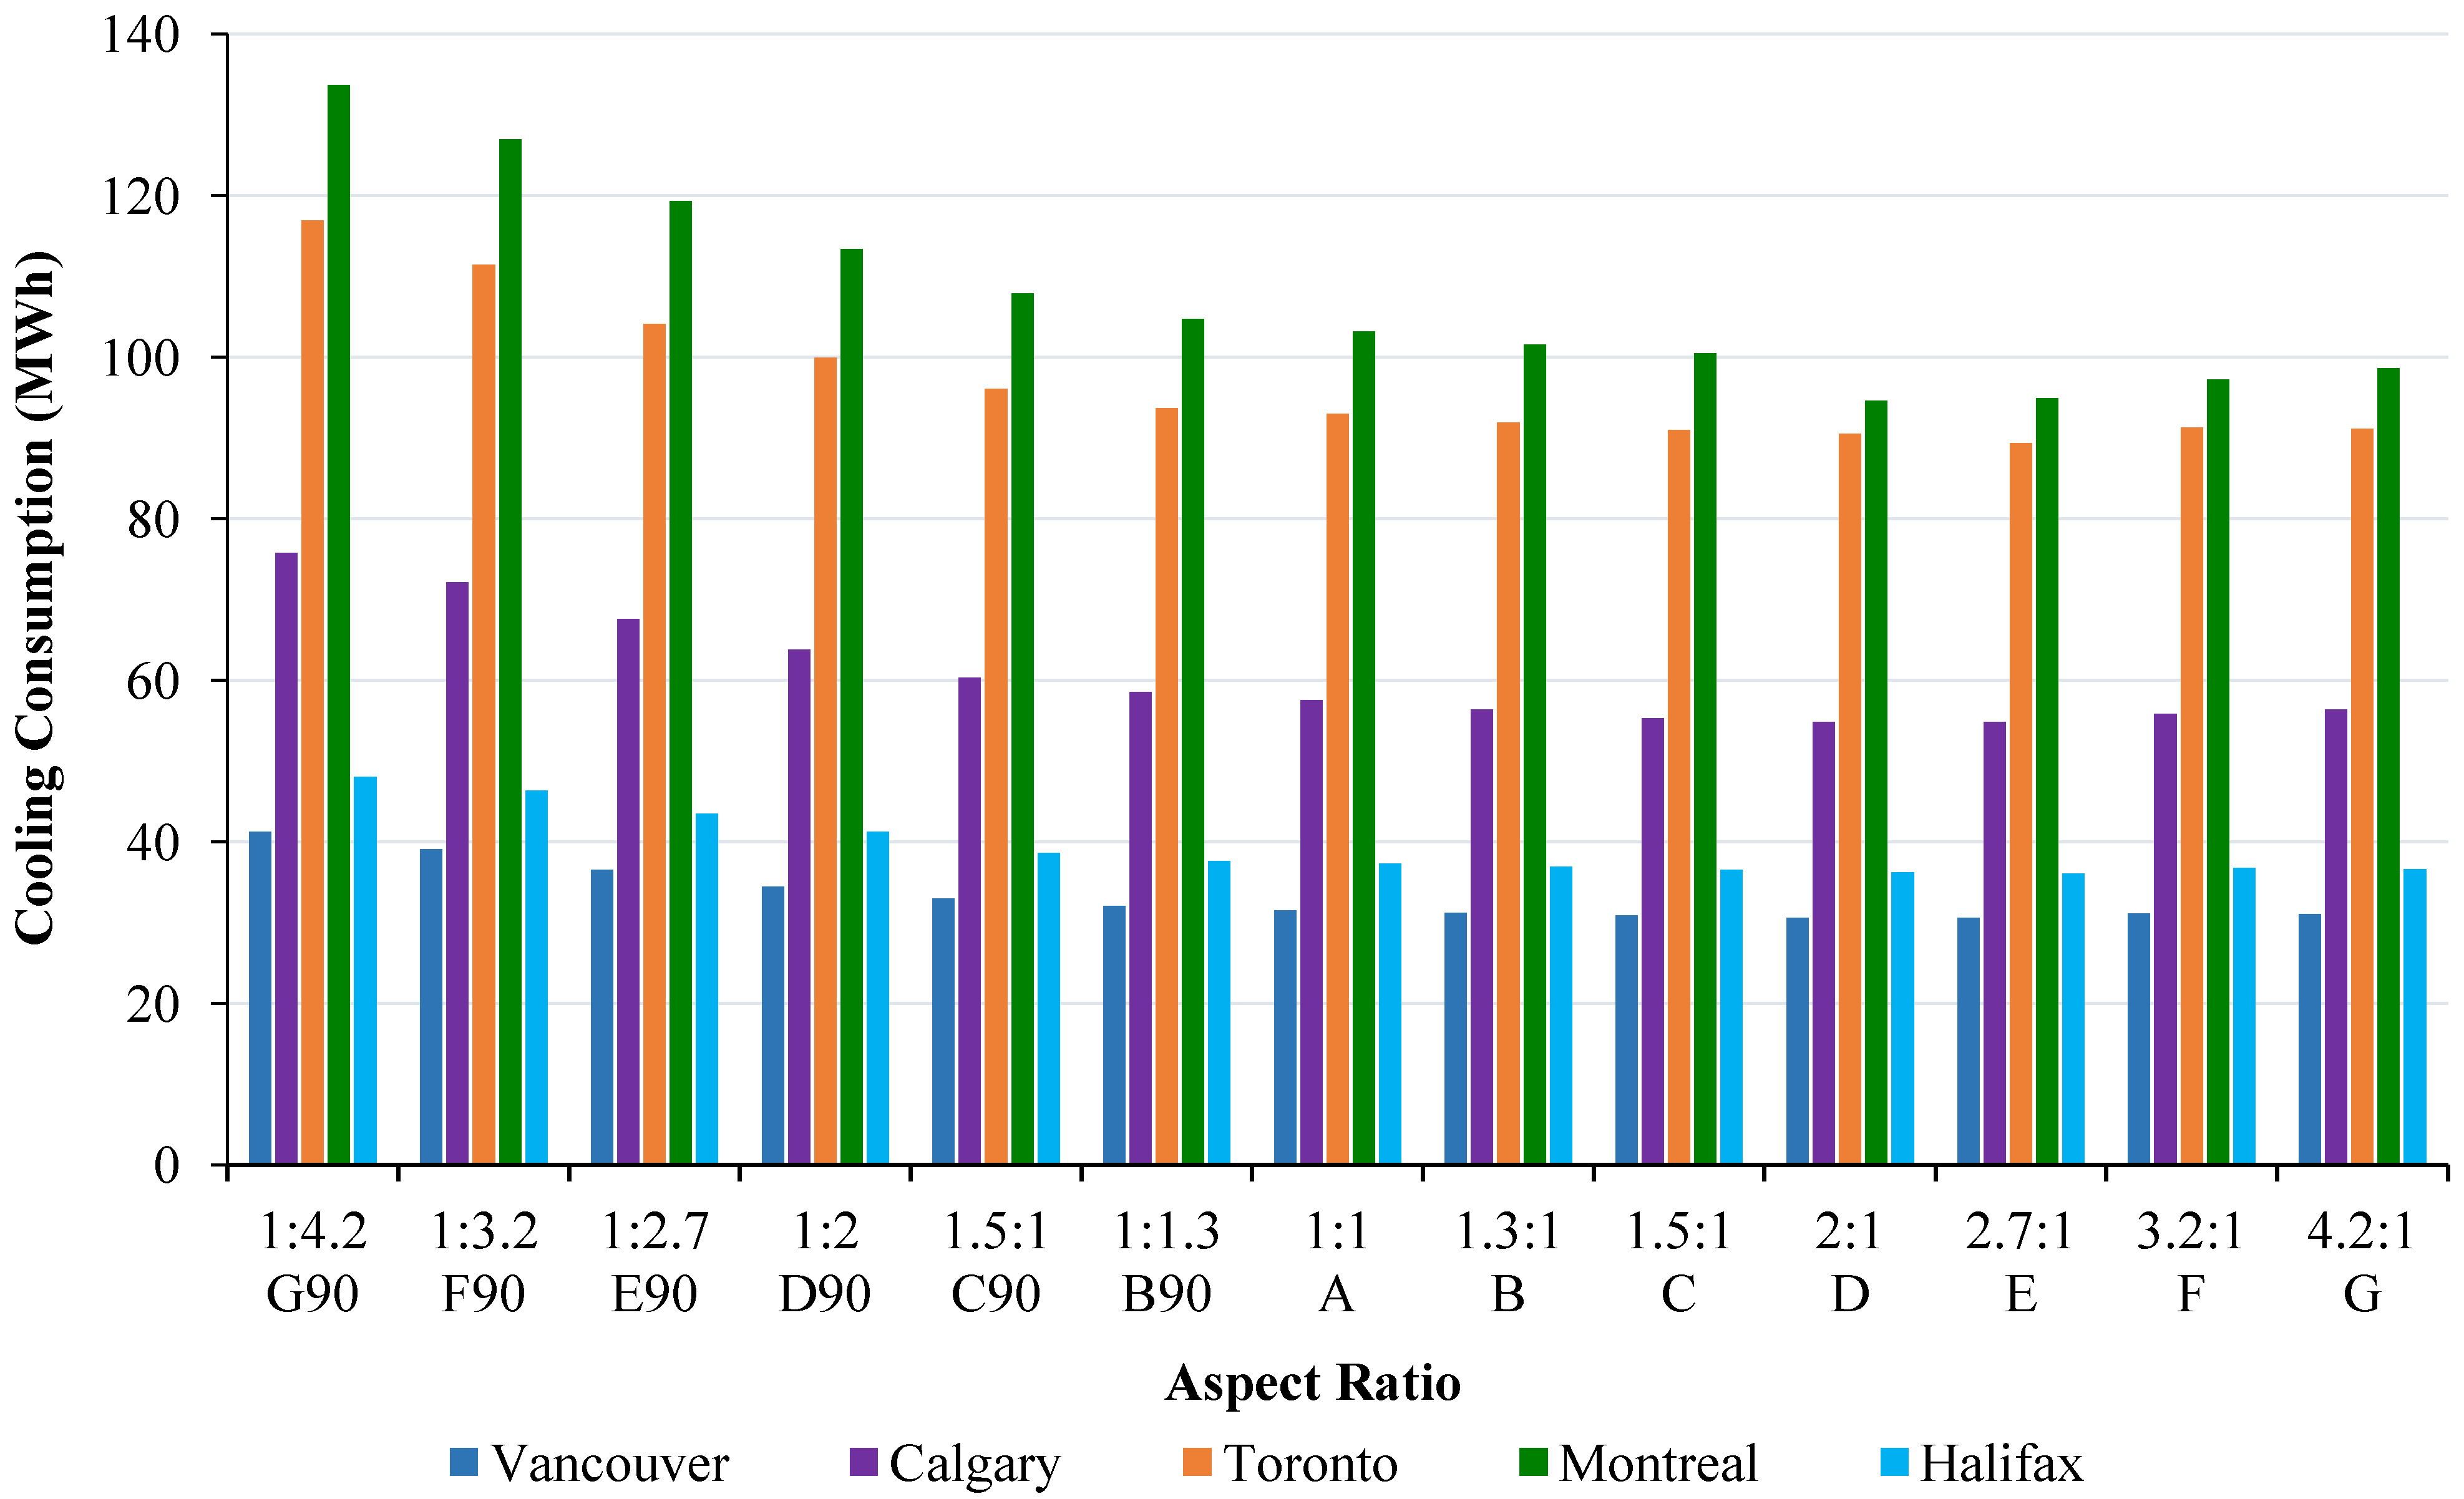
- Along the east-west axis, the increase of aspect ratio decreases energy consumption. Amongst these profiles, cooling consumption was highest for Profile A. The optimal aspect ratio was Profile E, which required 27.7 MWh of cooling during the peak month of July. This is a 5.5% decrease in cooling consumption compared to Profile A, at 29.3 MWh;
- The orientation of profiles 90° to the east-west axis had a large impact. In July, Profile G90°θ consumed 37.0 MWh. This marks a 29% increase in energy consumption from Profile G of 28.6 MWh. Whereas Profile A was the least efficient of the profiles oriented along the east-west axis, it was more efficient that all profiles oriented along the north-south axis.

3.4. Annual Energy Consumption Analysis
 | ||||||||||||||
|---|---|---|---|---|---|---|---|---|---|---|---|---|---|---|
| Aspect Ratio (x:y) | 1:4.2 | 1:3.2 | 1:2.7 | 1:2 | 1.5:1 | 1:1.3 | 1:1 | 1.3:1 | 1.5:1 | 2:1 | 2.7:1 | 3.2:1 | 4.2:1 | |
| Building Profile: | G90°θ | F90°θ | E90°θ | D90°θ | C90°θ | B90°θ | A | B | C | D | E | F | G | |
| Montreal | ||||||||||||||
| Cooling Consumption | 133.6 | 127.0 | 119.3 | 113.3 | 107.8 | 104.7 | 103.2 | 101.5 | 100.5 | 94.6 | 94.9 | 97.2 | 98.6 | (MWh) |
| 481.1 | 457.0 | 429.5 | 408.0 | 388.2 | 377.0 | 371.5 | 365.5 | 361.7 | 340.7 | 341.6 | 349.9 | 355.1 | (GJ) | |
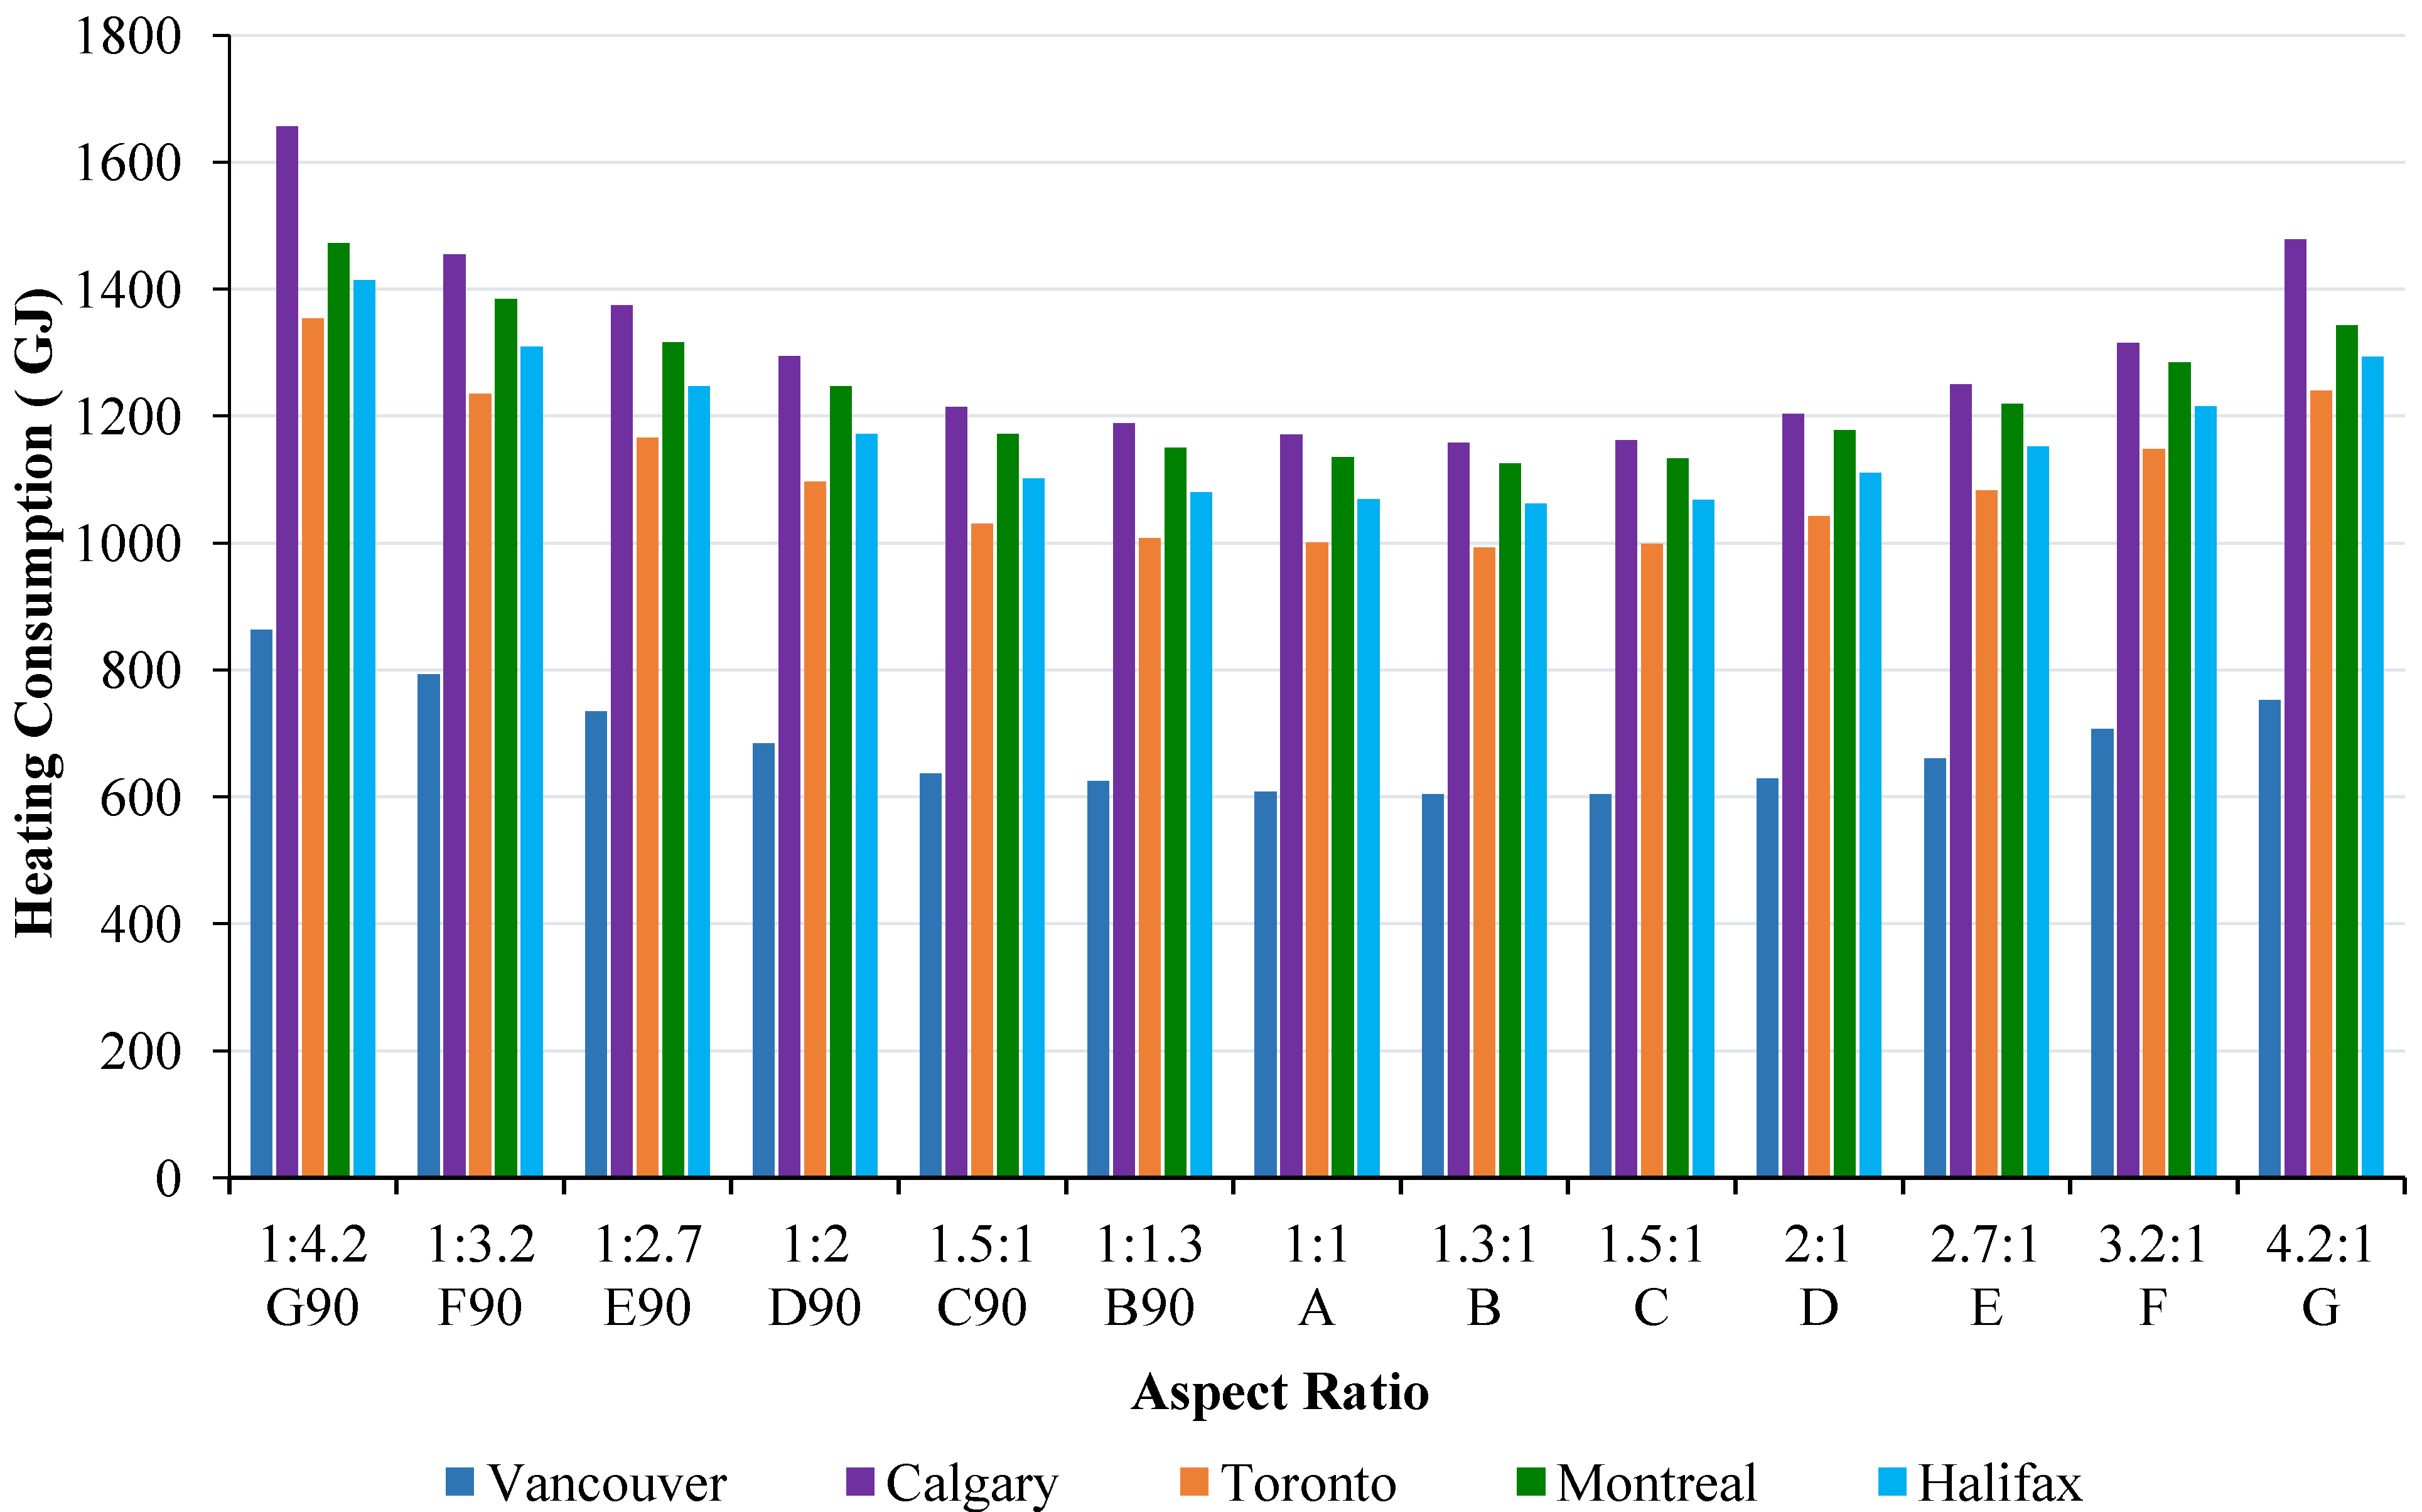
| Heating Consumption | 1554 | 1461 | 1389 | 1315 | 1236 | 1213 | 1198 | 1188 | 1195 | 1243 | 1286 | 1355 | 1416 | (GJ) |
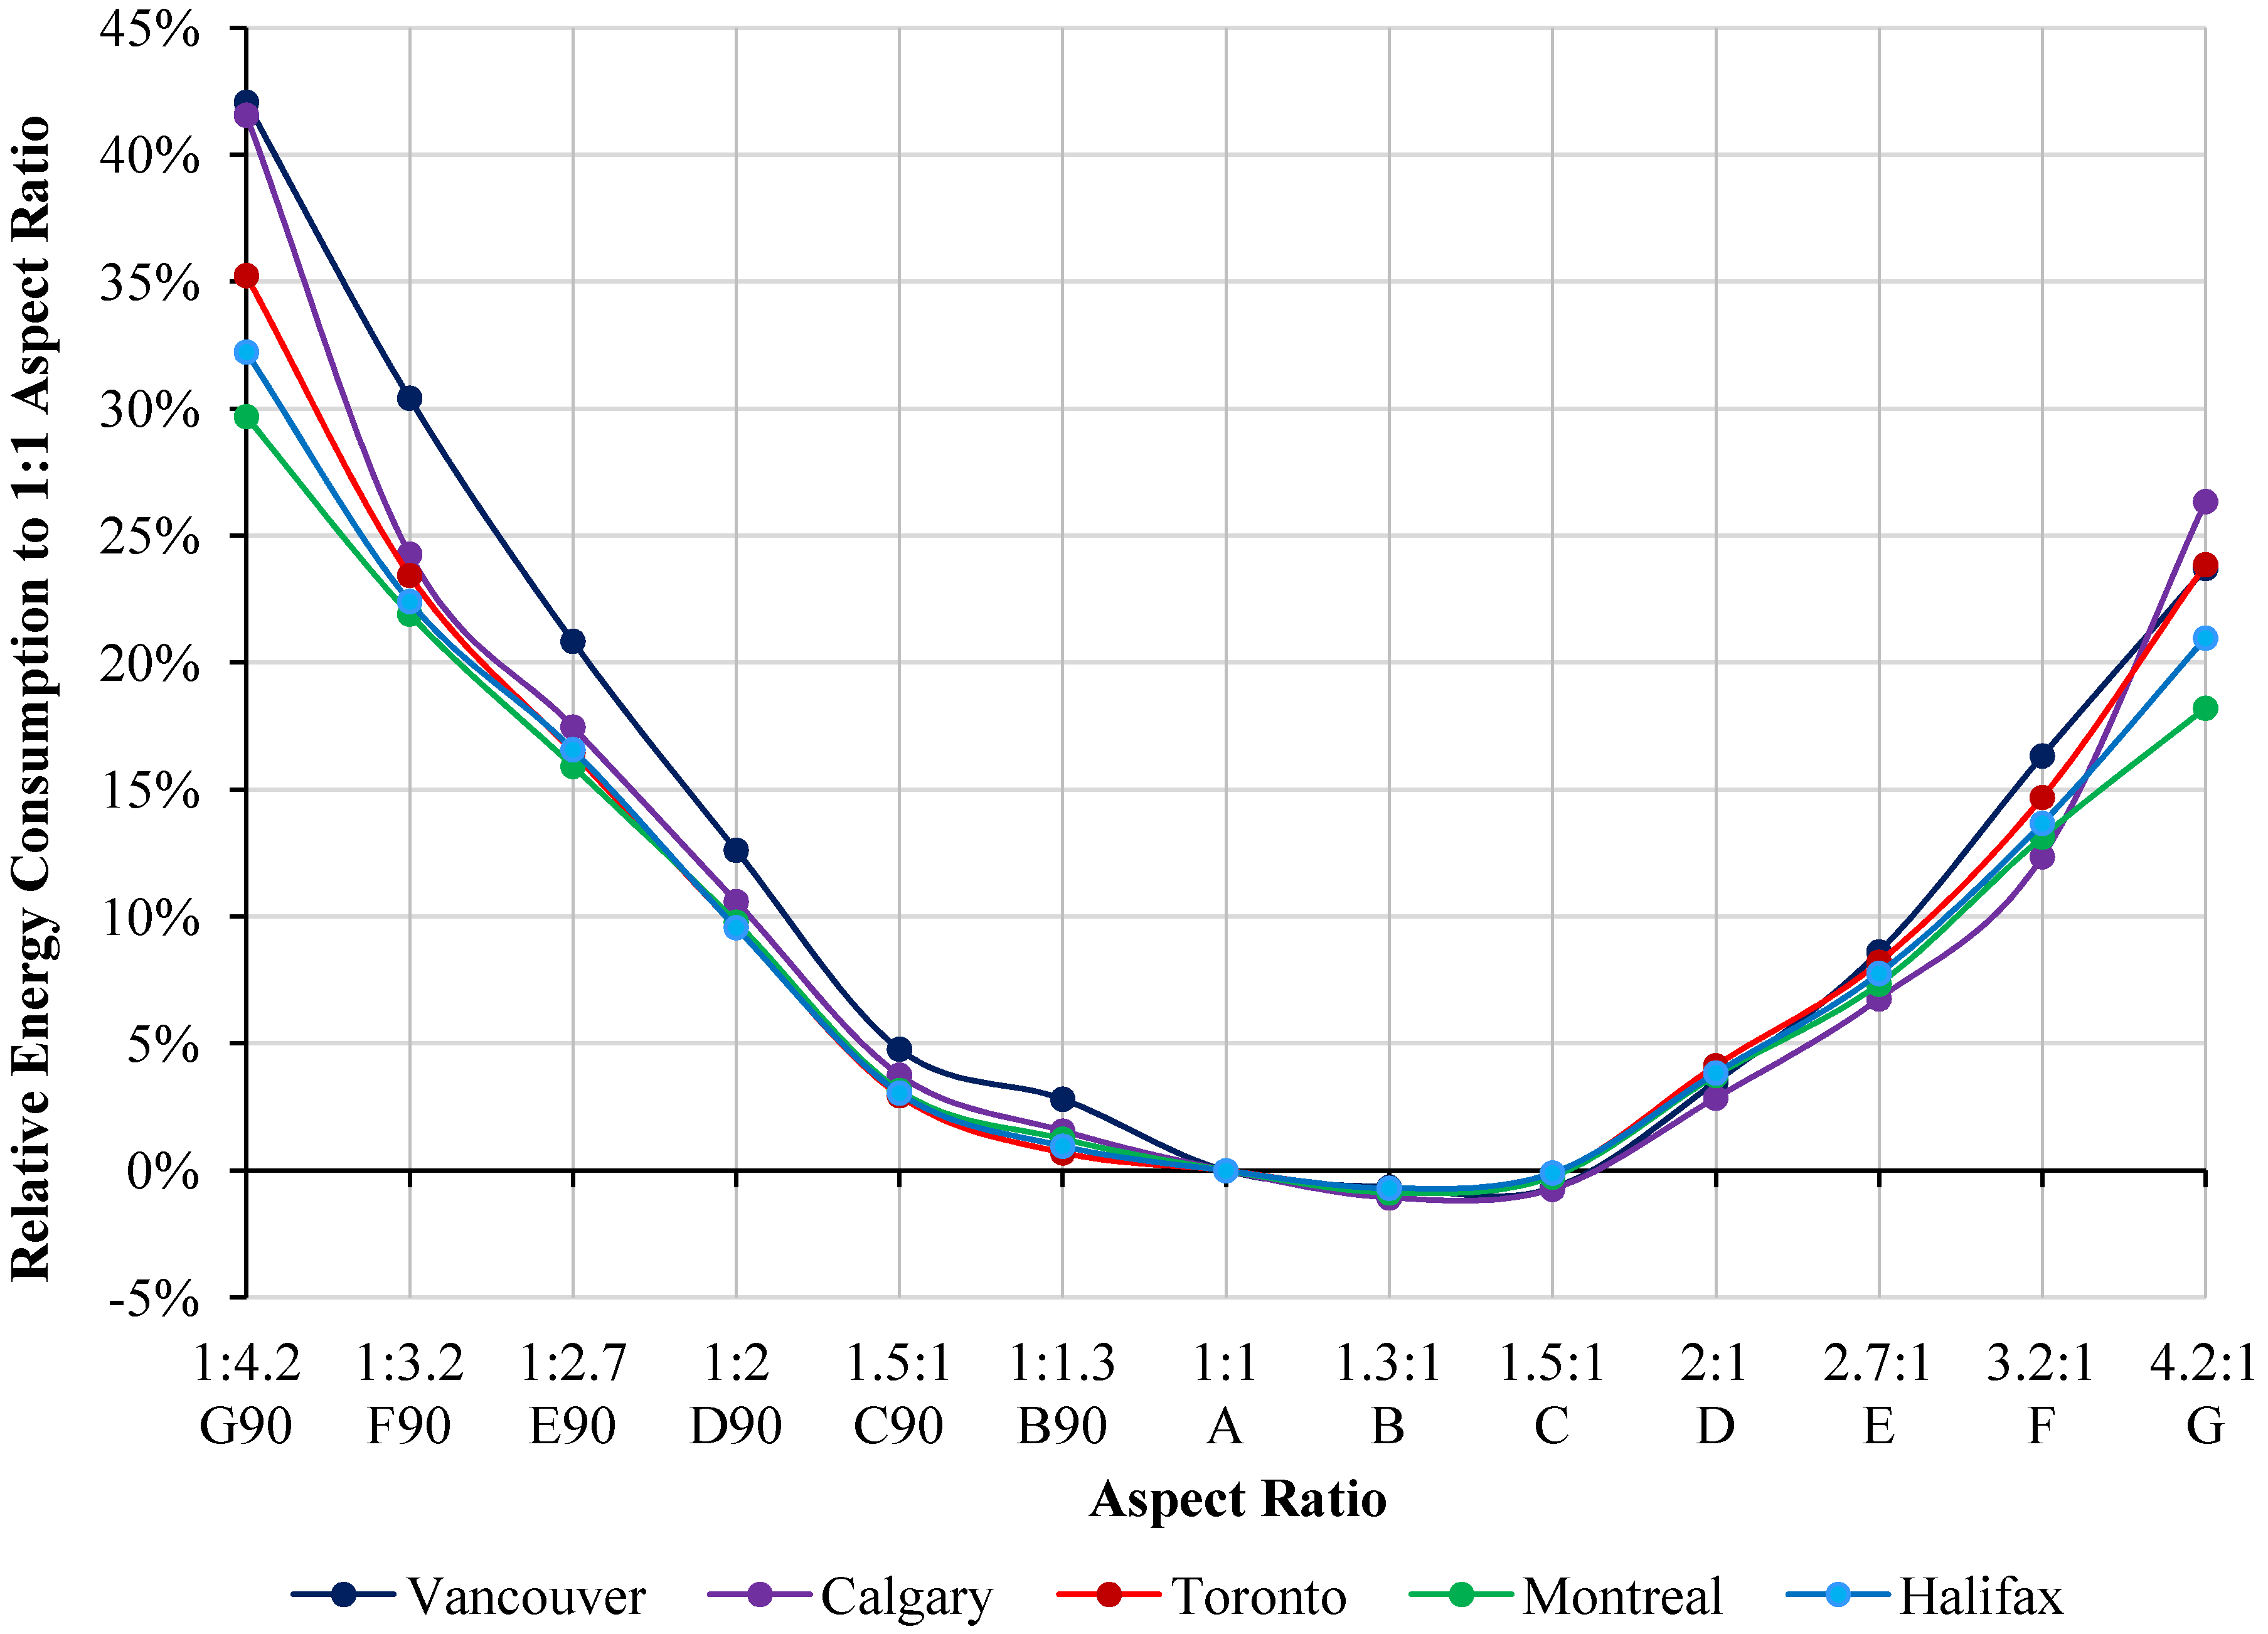
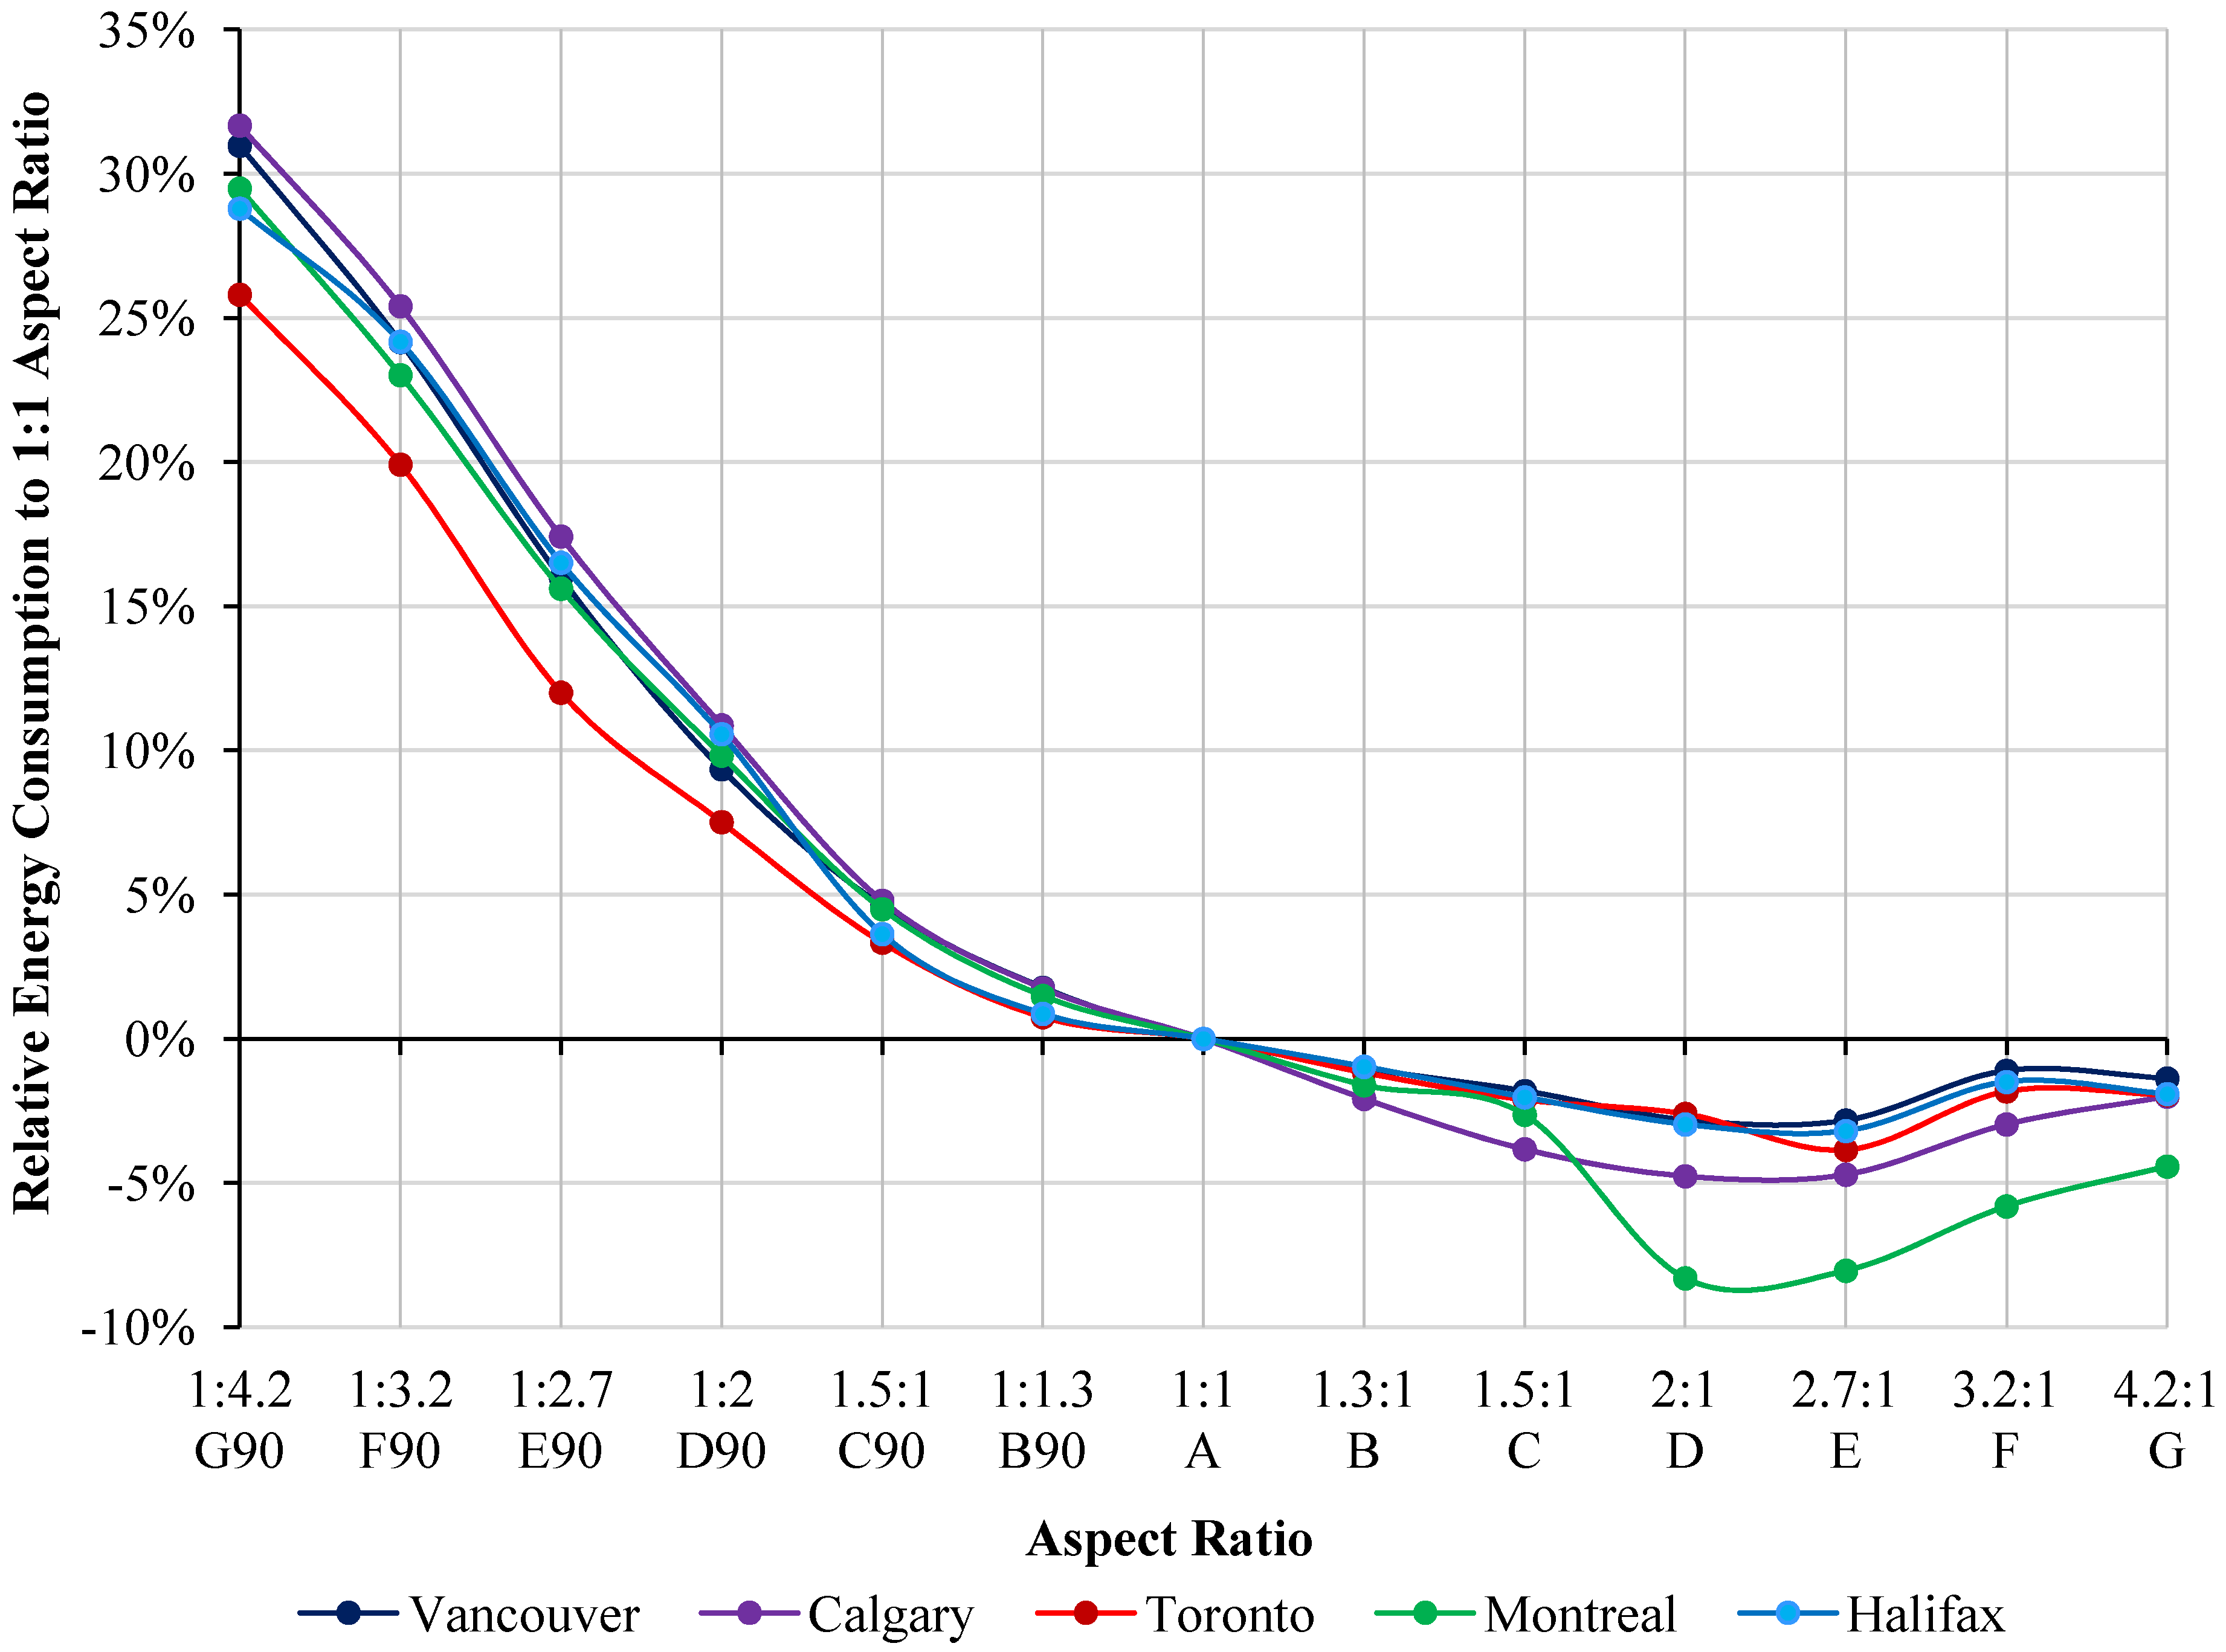
| REC | 29.7% | 21.9% | 15.9% | 9.8% | 3.2% | 1.2% | 0.0% | −0.9% | −0.2% | 3.7% | 7.3% | 13.1% | 18.2% | |
| Combined Energy Consumption | 2035 | 1918 | 1818 | 1723 | 1624 | 1590 | 1569 | 1553 | 1557 | 1584 | 1628 | 1705 | 1771 | (GJ) |
| REC | 29.6% | 22.2% | 15.8% | 9.8% | 3.5% | 1.3% | 0.0% | −1.0% | −0.8% | 0.9% | 3.7% | 8.7% | 12.9% | |
| Vancouver | ||||||||||||||
| Cooling Consumption | 41.2 | 39.1 | 36.5 | 34.4 | 32.9 | 32.0 | 31.5 | 31.2 | 30.9 | 30.6 | 30.6 | 31.1 | 31.1 | (MWh) |
| 148.5 | 140.8 | 131.5 | 124.0 | 118.6 | 115.4 | 113.4 | 112.2 | 111.3 | 110.2 | 110.2 | 112.1 | 111.8 | (GJ) | |
| Heating Consumption | 911 | 836 | 775 | 722 | 672 | 659 | 641 | 637 | 637 | 664 | 697 | 746 | 793 | (GJ) |
| REC | 42.1% | 30.4% | 20.8% | 12.6% | 4.8% | 2.8% | 0.0% | −0.7% | −0.7% | 3.5% | 8.6% | 16.3% | 23.7% | |
| Combined Energy Consumption | 1060 | 977 | 907 | 846 | 791 | 775 | 755 | 749 | 748 | 774 | 807 | 858 | 905 | (GJ) |
| REC | 40.4% | 29.5% | 20.1% | 12.1% | 4.8% | 2.7% | 0.0% | −0.7% | −0.9% | 2.5% | 6.9% | 13.7% | 19.9% | |
| Halifax | ||||||||||||||
| Cooling Consumption | 48.0 | 46.3 | 43.4 | 41.2 | 38.6 | 37.6 | 37.3 | 36.9 | 36.5 | 36.2 | 36.1 | 36.7 | 36.6 | (MWh) |
| 172.9 | 166.7 | 156.4 | 148.4 | 139.1 | 135.4 | 134.2 | 132.9 | 131.5 | 130.2 | 129.9 | 132.2 | 131.7 | (GJ) | |
| Heating Consumption | 1492 | 1381 | 1315 | 1236 | 1163 | 1139 | 1128 | 1120 | 1127 | 1171 | 1216 | 1282 | 1365 | (GJ) |
| REC | 32.2% | 22.4% | 16.6% | 9.6% | 3.1% | 1.0% | 0.0% | −0.7% | −0.1% | 3.8% | 7.8% | 13.7% | 21.0% | |
| Combined Energy Consumption | 1665 | 1547 | 1471 | 1384 | 1302 | 1274 | 1262 | 1253 | 1259 | 1302 | 1346 | 1415 | 1496 | (GJ) |
| REC | 31.9% | 22.6% | 16.6% | 9.7% | 3.1% | 1.0% | 0.0% | −0.7% | −0.3% | 3.1% | 6.6% | 12.1% | 18.5% | |
| Calgary | ||||||||||||||
| Cooling Consumption | 75.8 | 72.1 | 67.6 | 63.8 | 60.3 | 58.5 | 57.5 | 56.3 | 55.3 | 54.8 | 54.8 | 55.8 | 56.4 | (MWh) |
| 272.7 | 259.7 | 243.2 | 229.6 | 217.0 | 210.7 | 207.1 | 202.8 | 199.2 | 197.2 | 197.3 | 201.0 | 203.0 | (GJ) | |
| Heating Consumption | 1748 | 1534 | 1450 | 1366 | 1281 | 1254 | 1235 | 1221 | 1226 | 1270 | 1318 | 1387 | 1560 | (GJ) |
| REC | 41.6% | 24.3% | 17.5% | 10.6% | 3.8% | 1.6% | 0.0% | −1.1% | −0.7% | 2.9% | 6.8% | 12.4% | 26.3% | |
| Combined Energy Consumption | 2021 | 1794 | 1694 | 1595 | 1498 | 1465 | 1442 | 1424 | 1425 | 1467 | 1516 | 1588 | 1763 | (GJ) |
| REC | 40.1% | 24.4% | 17.5% | 10.6% | 3.9% | 1.6% | 0.0% | −1.2% | −1.2% | 1.8% | 5.1% | 10.2% | 22.3% | |
| Toronto | ||||||||||||||
| Cooling Consumption | 116.9 | 111.5 | 104.1 | 99.9 | 96.0 | 93.6 | 92.9 | 91.9 | 91.0 | 90.5 | 89.4 | 91.3 | 91.1 | (MWh) |
| 421.0 | 401.2 | 374.8 | 359.8 | 345.8 | 337.1 | 334.6 | 330.7 | 327.5 | 325.9 | 321.7 | 328.5 | 328.1 | (GJ) | |
| Heating Consumption | 1428 | 1303 | 1230 | 1157 | 1087 | 1063 | 1056 | 1048 | 1054 | 1100 | 1143 | 1211 | 1308 | (GJ) |
| REC | 35.2% | 23.4% | 16.5% | 9.6% | 3.0% | 0.7% | 0.0% | −0.8% | −0.2% | 4.1% | 8.2% | 14.7% | 23.9% | |
| Combined Energy Consumption | 1849 | 1705 | 1604 | 1517 | 1433 | 1400 | 1391 | 1378 | 1381 | 1425 | 1464 | 1540 | 1636 | (GJ) |
| REC | 33.0% | 22.6% | 15.4% | 9.1% | 3.0% | 0.7% | 0.0% | −0.9% | −0.6% | 2.5% | 5.3% | 10.7% | 17.6% | |
3.5. Annual Energy Consumption Analysis: Heating


3.6. Annual Energy Consumption Analysis: Cooling
- REC decreases as the aspect ratio is increased from 1:1 along the east-west axis. The optimal aspect ratio was determined to be 2.7:1 for Profile D. This aspect ratio yielded an REC of −2.6% to 8% for different locations;
- The slope of the REC increases significantly towards the larger profiles and indicates increased heat transfer for buildings with larger aspect ratios. This is expected, considering the large increase of surface area for each aspect ratio increment. The significance of solar shading is thus apparent when comparing the buildings oriented perpendicularly.


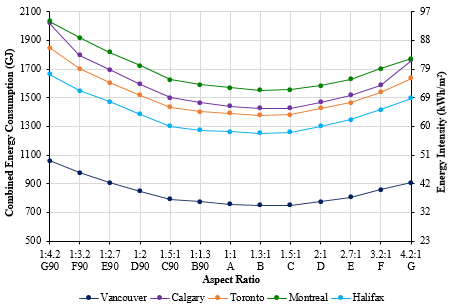
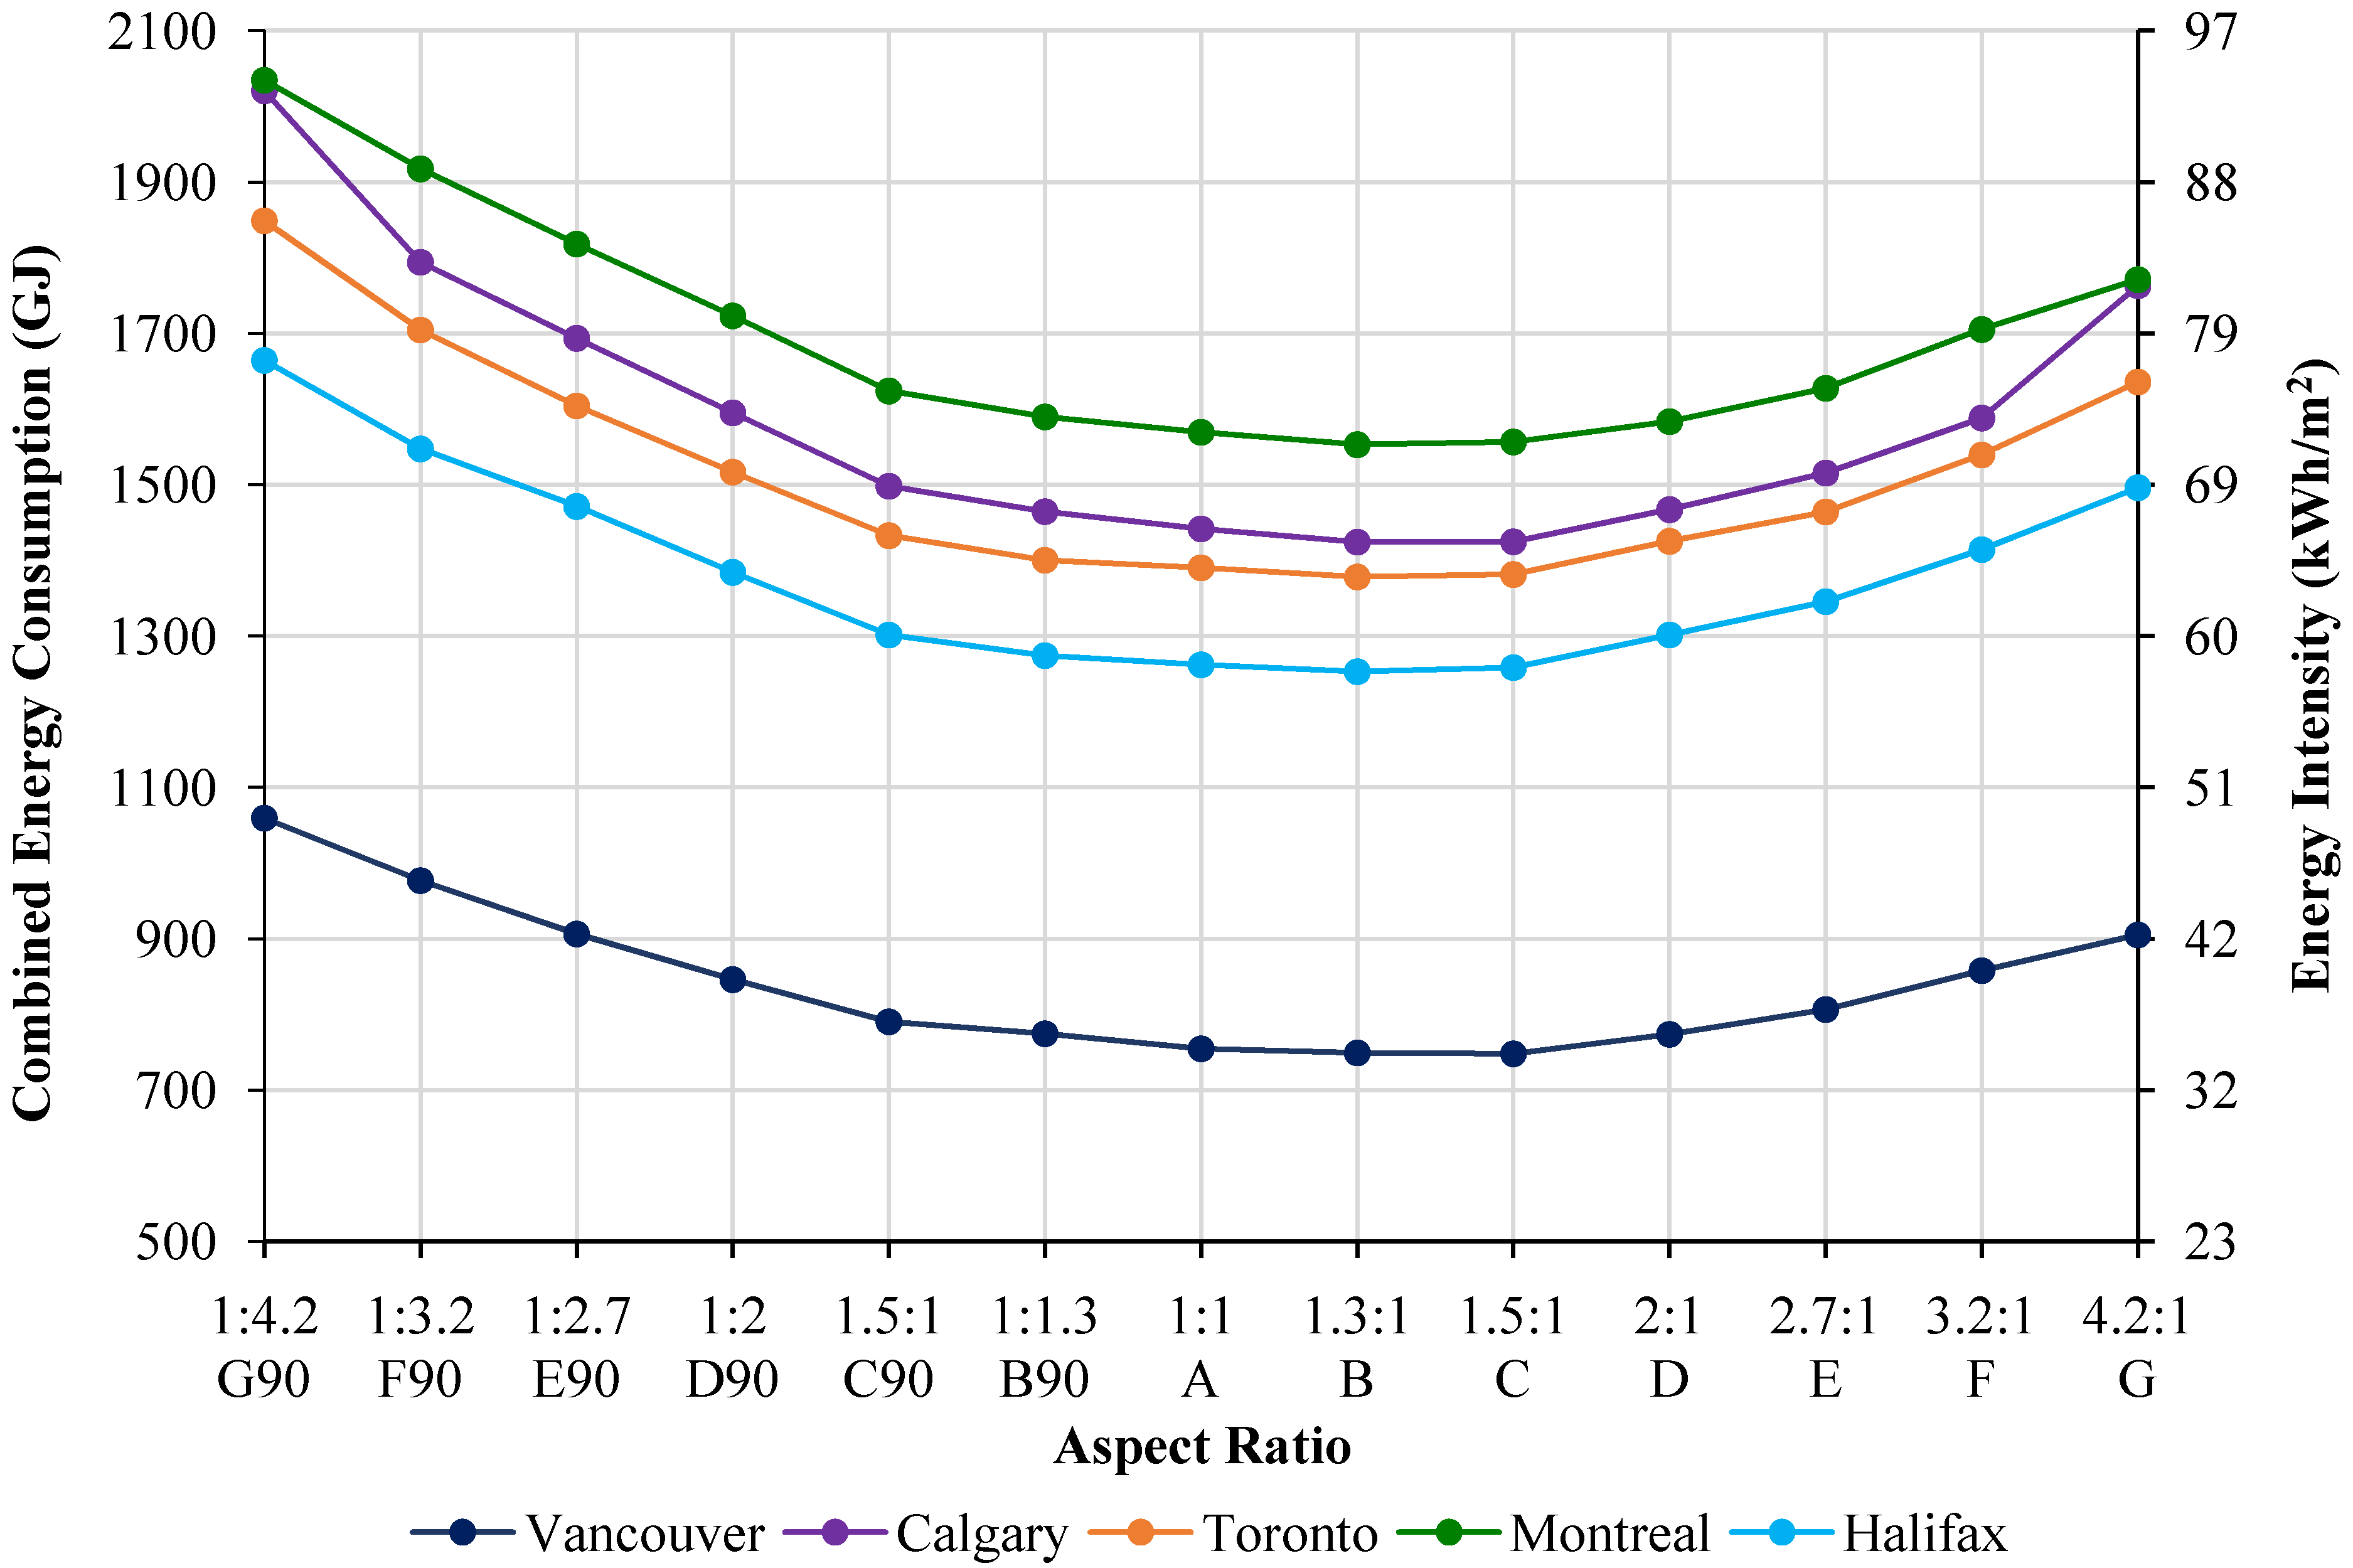
3.7. Annual Energy Consumption Analysis: Combined Energy Consumption

| Location | Aspect Ratio 1:1 (GJ) | Most Efficient (GJ) | Least Efficient (GJ) | Energy Consumption Range (GJ) | Proportional Energy Consumption Range |
|---|---|---|---|---|---|
| Vancouver | 755 | 748 | 1060 | 311 | 41.3% |
| Calgary | 1442 | 1424 | 2021 | 596 | 41.4% |
| Toronto | 1391 | 1378 | 1849 | 471 | 33.8% |
| Montreal | 1569 | 1553 | 2035 | 482 | 30.7% |
| Halifax | 1262 | 1253 | 1665 | 411 | 32.6% |
4. Conclusions
Nomenclature
| Notations | ||
| A | Area | (m2) |
| E | Energy | (MWh, GJ) |
| k | Conductivity | (W/m2) |
| L | Wall thickness | (m) |
| Q | Quantity of heat | (J) |
| C | Specific heat | (J/kg-K) |
| T | Temperature | (K) |
| Ventilation rate | (m3/s) | |
| V | Volume | (m3) |
| Greek Symbols | ||
| θ | Rotation angle of building footprint | |
| ρ | Density | (kg/m3) |
| Abbreviations | ||
| CEC | Combined energy consumption | (GJ) |
| EI | Energy intensity | (kWh/m2) |
| REC | Relative energy consumption | (%) |
Author Contributions
Conflicts of Interest
References
- Chiras, D. The Solar House: Passive Heating and Cooling; Chelsea Green Publishing: White River Junction, VT, USA, 2002; pp. 19–24. [Google Scholar]
- Binkley, C.; Touchie, M.; Presnail, K. Energy consumption trends of multi-unit residential buildings in the city of Toronto. 2013, p. 12. Available online: http://www.towerwise.ca/wp-content/uploads/2013/07/TAF-MURB-Energy-Performance-Report-Phase-II.pdf (accessed on 2 July 2014).
- Natural Resources Canada (NRCan). Survey of Household Energy Use 2007—Detailed Statistical Report; NRCan, Office of Energy Efficiency: Ottawa, Canada, 2008; pp. 164–185.
- Straube, J.; Burnett, E. Building Science for Building Enclosures; Building Science Press, Pennsylvania State University: State College, PA, USA, 2005; pp. 30–745. [Google Scholar]
- RDH Building Engineering Limited. Energy Consumption and Conservation in Mid and High-Rise Residential Buildings in British Columbia, Canadian Mortgage and Housing Corporation Research Report. 2012. Available online: http://www.hpo.bc.ca/sites/www.hpo.bc.ca/files/download/Report/MURB-EnergyStudy-Report.pdf (accessed on 10 January 2014).
- Danielski, I.; Fröling, M.; Joelsson, A. The Impact of the Shape Factor on Final Energy Demand in Residential Buildings in Nordic Climates. Mid Sweden University: Östersund, Sweden, 2012. Available online: http://www.diva-portal.org/smash/get/diva2:532979/FULLTEXT01.pdf (accessed on 10 January 2014).
- Fennell, H.; Haehnel, J. Setting Air Tightness Standards. ASHRAE J. 2005, 47, pp. 26–31. Available online: http://www.ashrae.org/File%20Library/docLib/Public/200583084452_886.pdf (accessed on 22 January 2014).
- Hachem, C.; Athienitis, A.; Fazio, P. Parametric investigation of geometric form effects on solar potential of housing units. Sol. Energy 2011, 85, 1864–1877. [Google Scholar] [CrossRef]
- Hirsch, J.J. eQUEST: The QUick Energy Simulation Tool, Version 3.65; Available online: http://www.doe2.com/eQuest/ (accessed on 20 March 2014).
- Canadian Home Builders’ Association (CHBA). The CHBA Poll. 2012. Available online: http://www.chba.ca/uploads/pulse%20survey%20results/main%20report2012.pdf (accessed on 22 January 2014).
- American Society of Heating, Refrigerating and Air Conditioning Engineers (ASHRAE). ASHRAE Standard 90.1—2007 Energy Standard for Buildings Except Low-Rise Residential Buildings; ASHRAE: Atlanta, GA, USA, 2007. [Google Scholar]
- Hill, D. Ventilation Systems for Multi-Unit Residential Buildings: Performance Requirements and Alternative Approaches; Technical Series 03-121; Research Highlights Canadian Mortgage and Housing Corporation: Ottawa, Canada, 2003; Volume 2. Available online: http://www.cmhc-schl.gc.ca/odpub/pdf/63280.pdf (accessed on 24 May 2014).
- RDH Building Engineering Limited. Air Leakage Control in Multi-Unit Residential Buildings, Canadian Mortgage and Housing Corporation Research Report. Available online: http://rdh.com/wp-content/uploads/2014/04/Air-Leakage-Control-in-Multi-Unit-Residential-Buildings.pdf (accessed on 10 January 2014).
- American Society of Heating, Refrigerating and Air Conditioning Engineers (ASHRAE). ASHRAE Handbook—Fundamentals; ASHRAE: Atlanta, GA, USA, 2009. [Google Scholar]
- Environment Canada, Canadian Climate Normals 1971–2000. Vancouver Toronto, National Climate Data and Information Archive. 2013. Available online: http://climate.weather.gc.ca/climateData/ (accessed on 10 January 2014).
- Hutcheon, N.; Handegord, G. Building Science for a Cold Climate; National Research Council of Canada: Toronto, Canada, 1983; p. 407. [Google Scholar]
- Townsend, A.; Ueno, K. Effects of Air Conditioner Sizing on Energy Consumption and Peak Demand in a Hot-Dry Climate; 2008 ACEEE Summer Study on Energy Efficiency in Building; American Council for an Energy Efficient Economy: Washington, DC, USA, 2008; pp. 1–291. [Google Scholar]
© 2014 by the authors; licensee MDPI, Basel, Switzerland. This article is an open access article distributed under the terms and conditions of the Creative Commons Attribution license (http://creativecommons.org/licenses/by/3.0/).
Share and Cite
McKeen, P.; Fung, A.S. The Effect of Building Aspect Ratio on Energy Efficiency: A Case Study for Multi-Unit Residential Buildings in Canada. Buildings 2014, 4, 336-354. https://doi.org/10.3390/buildings4030336
McKeen P, Fung AS. The Effect of Building Aspect Ratio on Energy Efficiency: A Case Study for Multi-Unit Residential Buildings in Canada. Buildings. 2014; 4(3):336-354. https://doi.org/10.3390/buildings4030336
Chicago/Turabian StyleMcKeen, Philip, and Alan S. Fung. 2014. "The Effect of Building Aspect Ratio on Energy Efficiency: A Case Study for Multi-Unit Residential Buildings in Canada" Buildings 4, no. 3: 336-354. https://doi.org/10.3390/buildings4030336